- XEL Dashboard
- Financials
- Filings
-
Holdings
- Transcripts
- ETFs
- Insider
- Institutional
- Shorts
-
8-K Filing
Xcel Energy (XEL) 8-KFinancial statements and exhibits
Filed: 16 Jun 04, 12:00am
EXHIBIT 99.01
| Deutsche Bank Electric Power Conference June 14 - 16, 2004 |

| This material includes forward-looking statements that are subject to certain risks, uncertainties and assumptions. Such forward-looking statements include projected earnings, cash flows, capital expenditures and other statements and are identified in this document by the words "anticipate," "estimate," "expect," "projected," "objective," "outlook," "possible," "potential" and similar expressions. Actual results may vary materially. Factors that could cause actual results to differ materially include, but are not limited to: general economic conditions, including the availability of credit, actions of rating agencies and their impact on capital expenditures; business conditions in the energy industry; competitive factors; unusual weather; effects of geopolitical events, including war and acts of terrorism, changes in federal or state legislation; regulation; risks associated with the California power market; the higher degree of risk associated with Xcel Energy's nonregulated businesses compared with Xcel Energy's regulated business; and the other risk factors listed from time to time by Xcel Energy in reports filed with the SEC, including Exhibit 99.01 to Xcel Energy's report on Form 10-K for year 2003. Safe Harbor |
| Wayne Brunetti Chairman and CEO |

| Customers: 3.3 Million Electric 1.8 Million Gas NSPM $193 10.7% NSPW 57 13.6% PSCo 228 11.1% SPS 82 10.0% Nonregulated Subsidiaries (12) Holding Co. (41) Xcel Energy $507 10.3% Net 2003 Income ROE Southwestern Public Service Public Service of Colorado NSP Minnesota NSP Wisconsin 4th largest US electric and gas utility - * Continuing Operations - Reclassified See pages 33-35 Dollars in millions * |

| Xcel Objectives Invest additional capital in utility business with assurance of regulatory recovery Provide competitive total returns to shareholders - - Average of 7 - 9% per year Strengthen credit ratings |
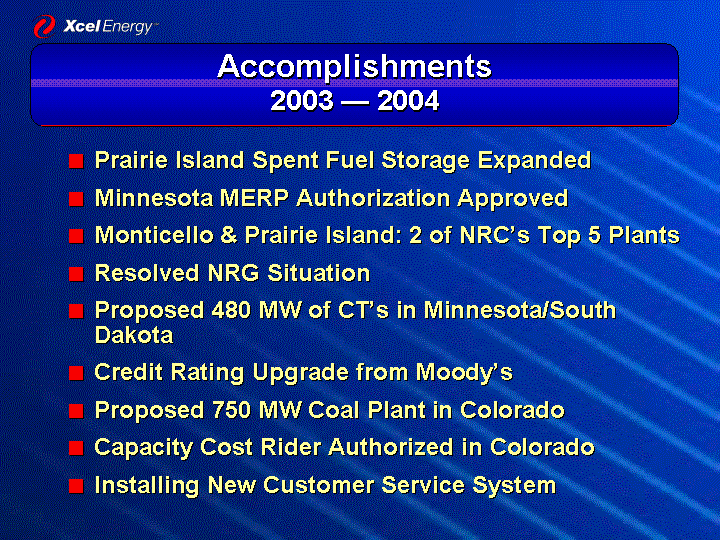
| Accomplishments 2003 - 2004 Prairie Island Spent Fuel Storage Expanded Minnesota MERP Authorization Approved Monticello & Prairie Island: 2 of NRC's Top 5 Plants Resolved NRG Situation Proposed 480 MW of CT's in Minnesota/South Dakota Credit Rating Upgrade from Moody's Proposed 750 MW Coal Plant in Colorado Capacity Cost Rider Authorized in Colorado Installing New Customer Service System |
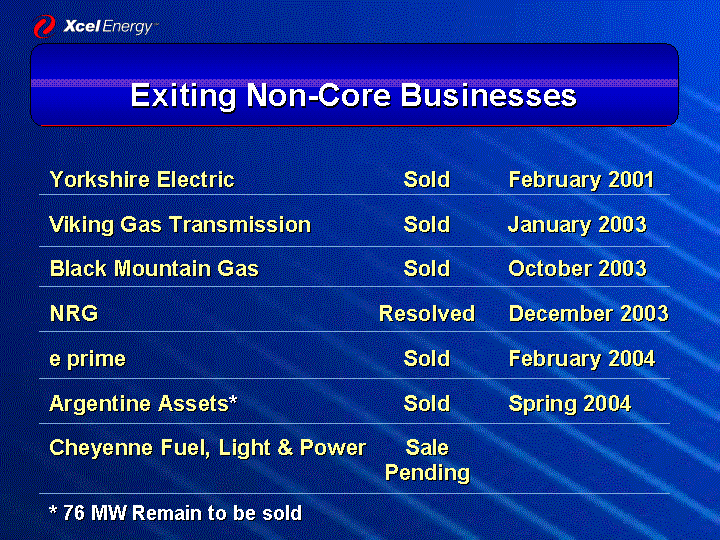
| Exiting Non-Core Businesses Yorkshire Electric Sold February 2001 Viking Gas Transmission Sold January 2003 Black Mountain Gas Sold October 2003 NRG Resolved December 2003 e prime Sold February 2004 Argentine Assets* Sold Spring 2004 Cheyenne Fuel, Light & Power Sale Pending * 76 MW Remain to be sold |
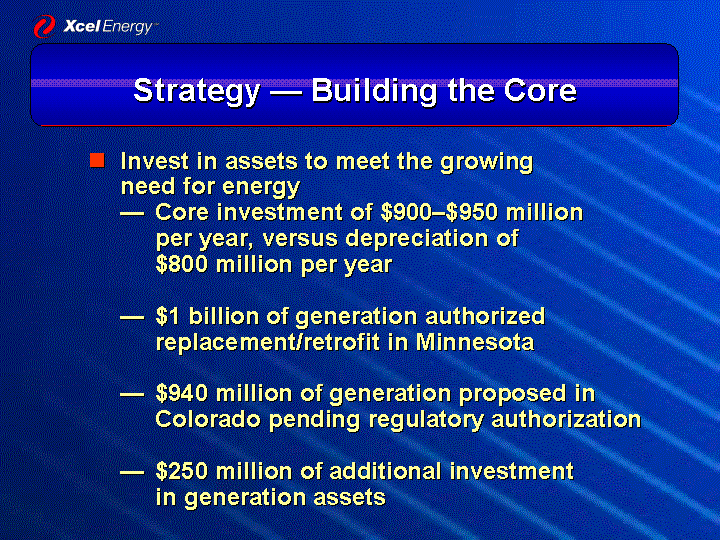
| Strategy - Building the Core Invest in assets to meet the growing need for energy - - Core investment of $900-$950 million per year, versus depreciation of $800 million per year - - $1 billion of generation authorized replacement/retrofit in Minnesota - - $940 million of generation proposed in Colorado pending regulatory authorization - - $250 million of additional investment in generation assets |
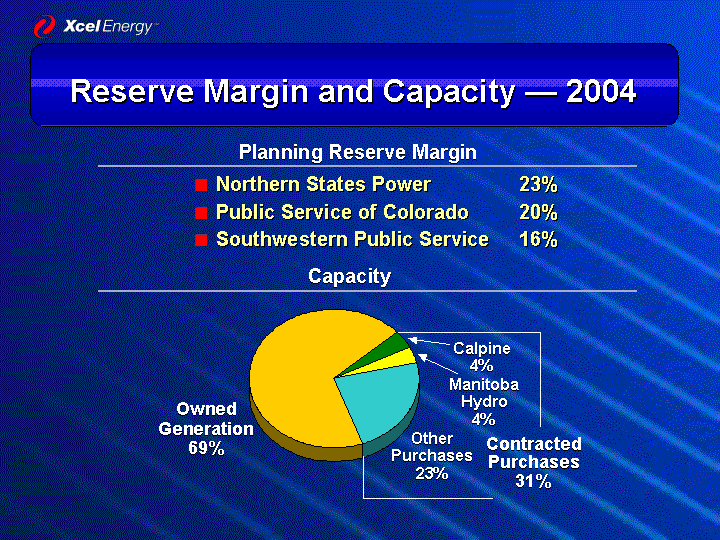
| Reserve Margin and Capacity - 2004 Contracted Purchases 31% Owned 69 Calpine 4 Manitoba Hydro 4 Other 23 Manitoba Hydro 4% Other Purchases 23% Calpine 4% Owned Generation 69% Northern States Power 23% Public Service of Colorado 20% Southwestern Public Service 16% Capacity Planning Reserve Margin |
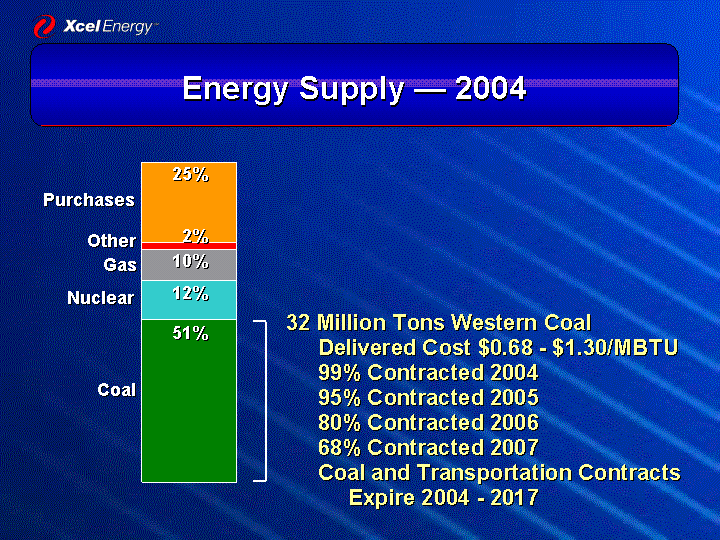
| Percent 2004 51 12 10 2 25 Energy Supply - 2004 32 Million Tons Western Coal Delivered Cost $0.68 - $1.30/MBTU 99% Contracted 2004 95% Contracted 2005 80% Contracted 2006 68% Contracted 2007 Coal and Transportation Contracts Expire 2004 - 2017 51% 12% 10% 2% 25% Purchases Other Gas Nuclear Coal |
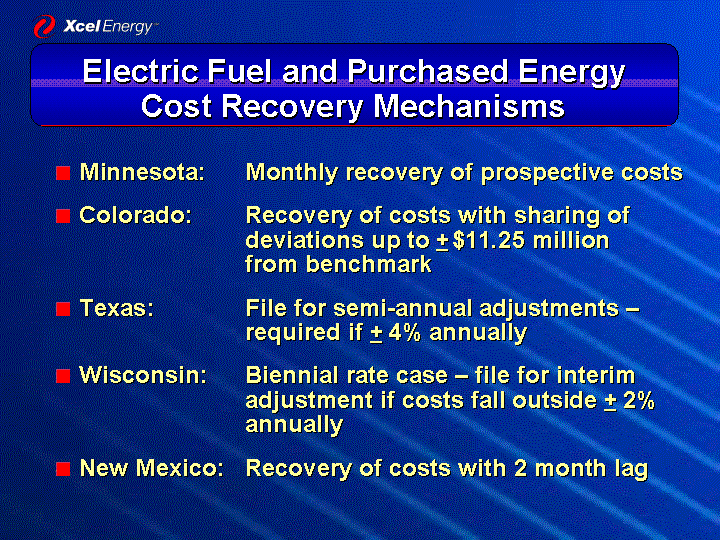
| Electric Fuel and Purchased Energy Cost Recovery Mechanisms Minnesota: Monthly recovery of prospective costs Colorado: Recovery of costs with sharing of deviations up to + $11.25 million from benchmark Texas: File for semi-annual adjustments - required if + 4% annually Wisconsin: Biennial rate case - file for interim adjustment if costs fall outside + 2% annually New Mexico: Recovery of costs with 2 month lag |
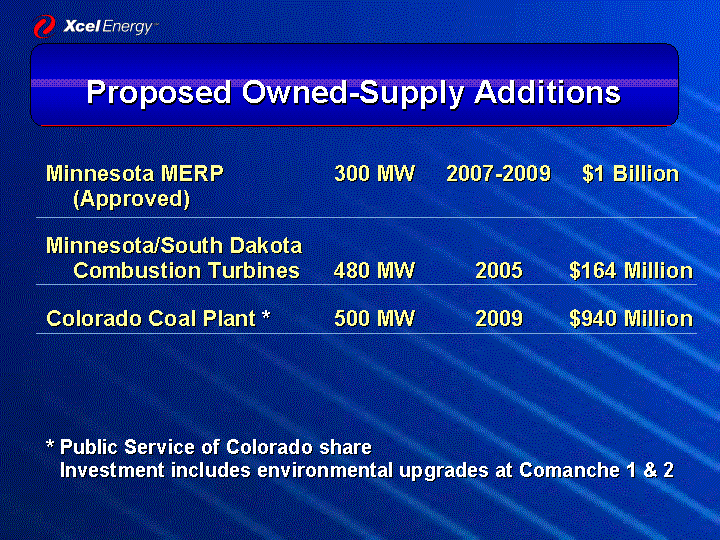
| Proposed Owned-Supply Additions Minnesota MERP 300 MW 2007-2009 $1 Billion (Approved) Minnesota/South Dakota Combustion Turbines 480 MW 2005 $164 Million Colorado Coal Plant * 500 MW 2009 $940 Million * Public Service of Colorado share Investment includes environmental upgrades at Comanche 1 & 2 |
| Ben Fowke Vice President and Chief Financial Officer Financial Overview |

| Metro Emissions Reduction Program (MERP) Reduce emissions 300 MW incremental capacity at time of system peak Budget approximately $1 billion Cash return on investment begins January 2006 Target ROE 10.86% with sliding scale Equity ratio 48.5% |
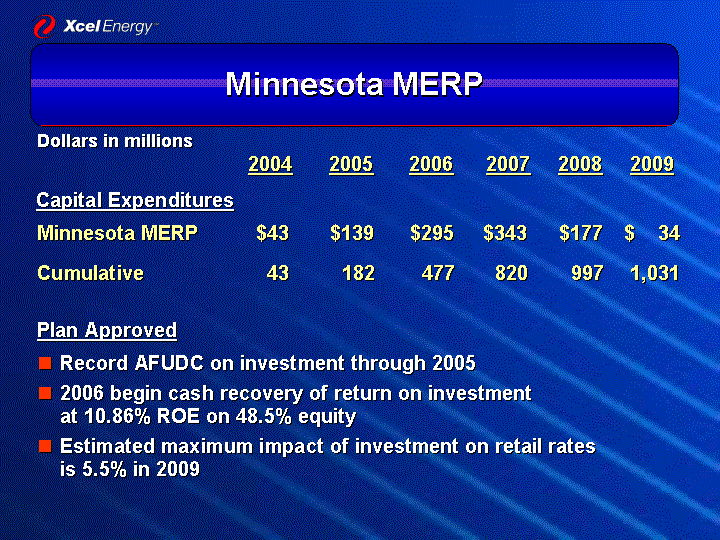
| Minnesota MERP Dollars in millions Minnesota MERP $43 $139 $295 $343 $177 $ 34 Cumulative 43 182 477 820 997 1,031 2004 2005 2006 2007 2008 2009 Capital Expenditures Record AFUDC on investment through 2005 2006 begin cash recovery of return on investment at 10.86% ROE on 48.5% equity Estimated maximum impact of investment on retail rates is 5.5% in 2009 Plan Approved |
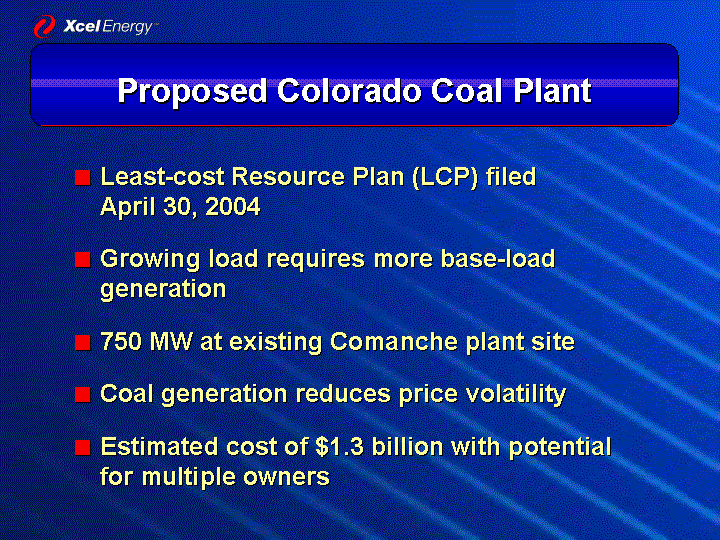
| Proposed Colorado Coal Plant Least-cost Resource Plan (LCP) filed April 30, 2004 Growing load requires more base-load generation 750 MW at existing Comanche plant site Coal generation reduces price volatility Estimated cost of $1.3 billion with potential for multiple owners |
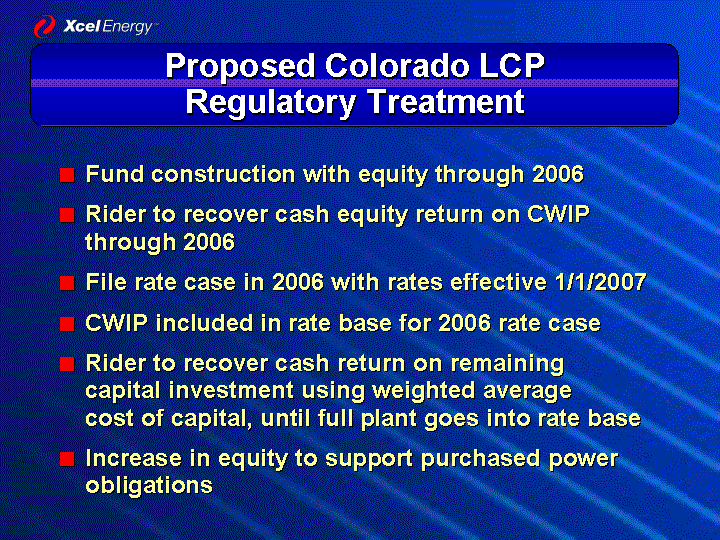
| Proposed Colorado LCP Regulatory Treatment Fund construction with equity through 2006 Rider to recover cash equity return on CWIP through 2006 File rate case in 2006 with rates effective 1/1/2007 CWIP included in rate base for 2006 rate case Rider to recover cash return on remaining capital investment using weighted average cost of capital, until full plant goes into rate base Increase in equity to support purchased power obligations |
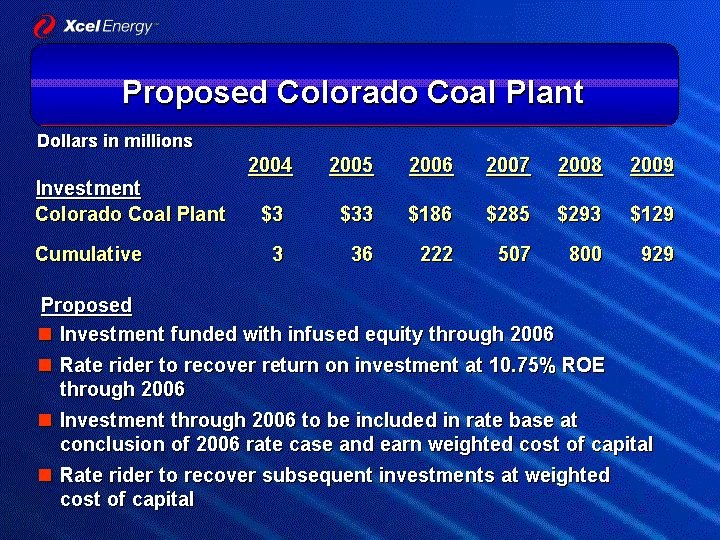
| Proposed Colorado Coal Plant Dollars in millions Colorado Coal Plant $3 $33 $186 $285 $293 $129 Cumulative 3 36 222 507 800 929 2004 2005 2006 2007 2008 2009 Investment Investment funded with infused equity through 2006 Rate rider to recover return on investment at 10.75% ROE through 2006 Investment through 2006 to be included in rate base at conclusion of 2006 rate case and earn weighted cost of capital Rate rider to recover subsequent investments at weighted cost of capital Proposed |
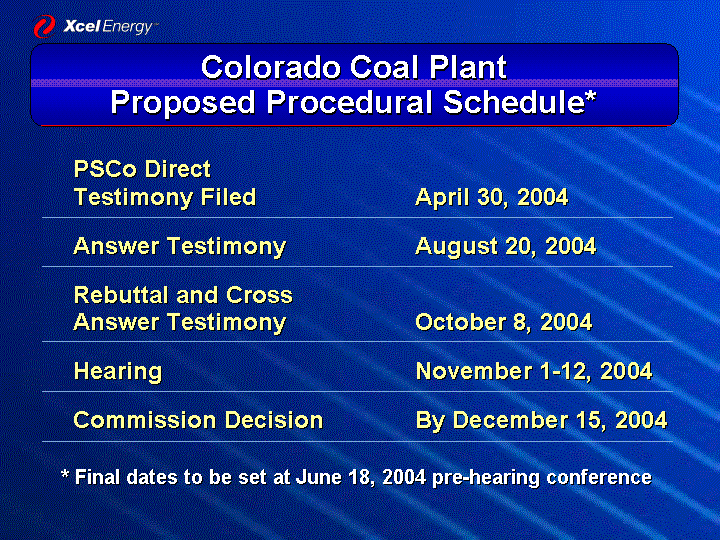
| Colorado Coal Plant Proposed Procedural Schedule* PSCo Direct Testimony Filed April 30, 2004 Answer Testimony August 20, 2004 Rebuttal and Cross Answer Testimony October 8, 2004 Hearing November 1-12, 2004 Commission Decision By December 15, 2004 * Final dates to be set at June 18, 2004 pre-hearing conference |

| Retail Electric Rate* Comparison Central US *EEI typical bills - Winter 2003 Companies $ per MWH Amarillo 4.59 Salt Lake City 5.03 St Louis 5.7 Denver 5.96 Minneapolis/St Paul 6.04 Des Moines 6.18 Kansas City 6.39 Milwaukee 6.99 Chicago 7.63 Phoenix 7.81 Cents per Kwh Amarillo Kansas City Denver Mpls/St. Paul St. Louis Des Moines Chicago Milwaukee Phoenix Salt Lake City 4.59 5.96 6.04 |
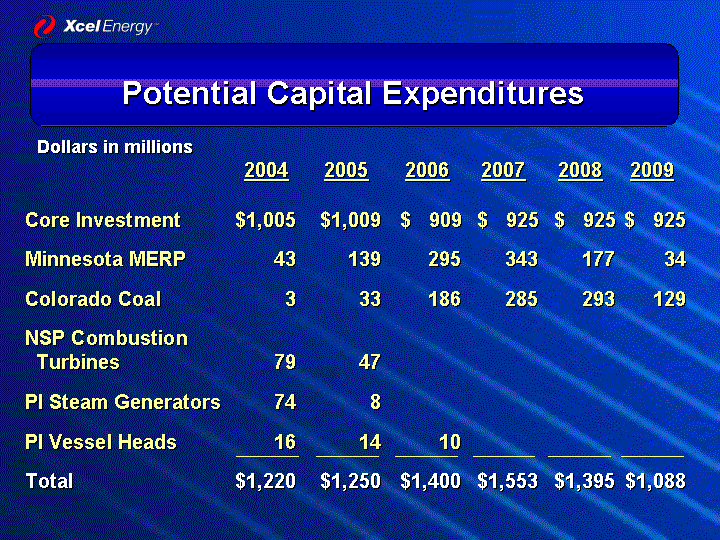
| Potential Capital Expenditures Dollars in millions Core Investment $1,005 $1,009 $ 909 $ 925 $ 925 $ 925 Minnesota MERP 43 139 295 343 177 34 Colorado Coal 3 33 186 285 293 129 NSP Combustion Turbines 79 47 PI Steam Generators 74 8 PI Vessel Heads 16 14 10 Total $1,220 $1,250 $1,400 $1,553 $1,395 $1,088 2004 2005 2006 2007 2008 2009 |

| Dollars in billions Building the Core Potential Gross Plant 2003 2004 2005 2006 2007 2008 2009 $22.3 $30.2 2009 Year-End |
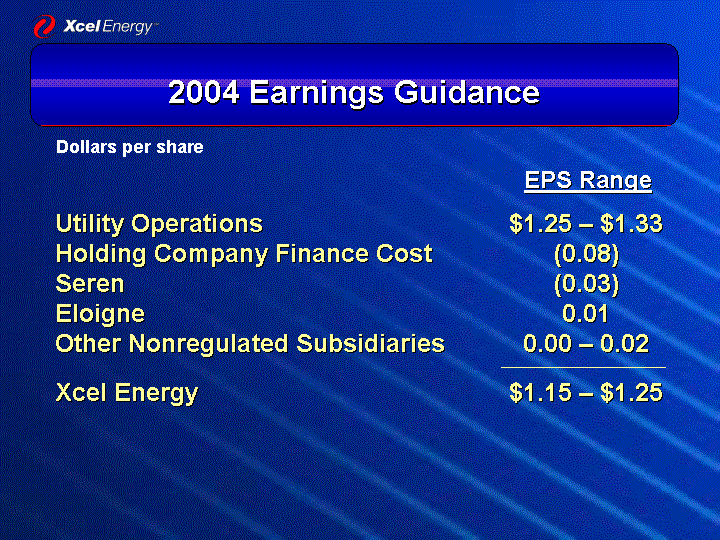
| 2004 Earnings Guidance Utility Operations $1.25 - $1.33 Holding Company Finance Cost (0.08) Seren (0.03) Eloigne 0.01 Other Nonregulated Subsidiaries 0.00 - 0.02 Xcel Energy $1.15 - $1.25 EPS Range Dollars per share |
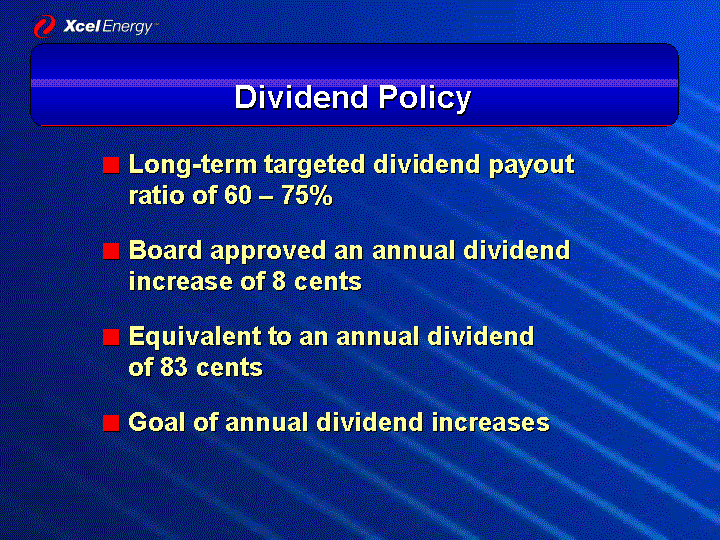
| Dividend Policy Long-term targeted dividend payout ratio of 60 - 75% Board approved an annual dividend increase of 8 cents Equivalent to an annual dividend of 83 cents Goal of annual dividend increases |
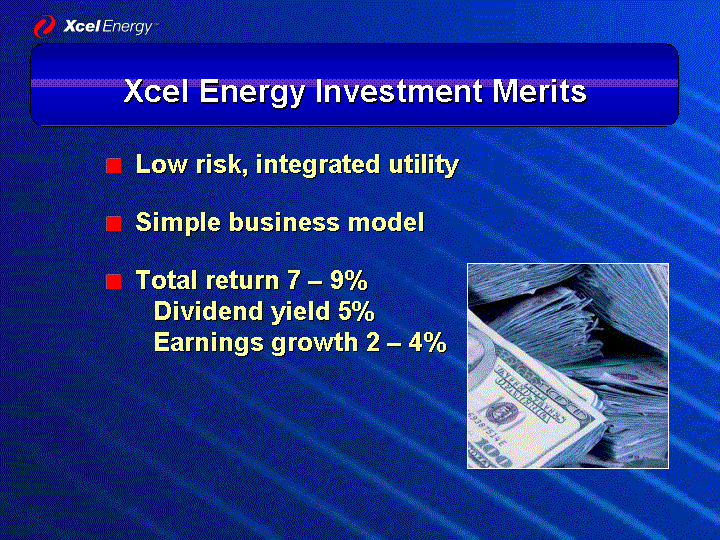
| Xcel Energy Investment Merits Low risk, integrated utility Simple business model Total return 7 - 9% Dividend yield 5% Earnings growth 2 - 4% |

| Appendix |

| Customer Additions 35 Replacement/Refurbishment 31 Upgrades 11 Other 23 Capital Expenditures Base Level: $900 to $950 Million Customer Additions 35% Replacement / Refurbishment 31% Upgrades 11% Other 23% |

| Equity 43 Preferred Equity 1 Debt 56 Capital Structure Year-End 2003 Xcel Energy Consolidated Equity 43% Preferred Equity 1% Debt 56% |
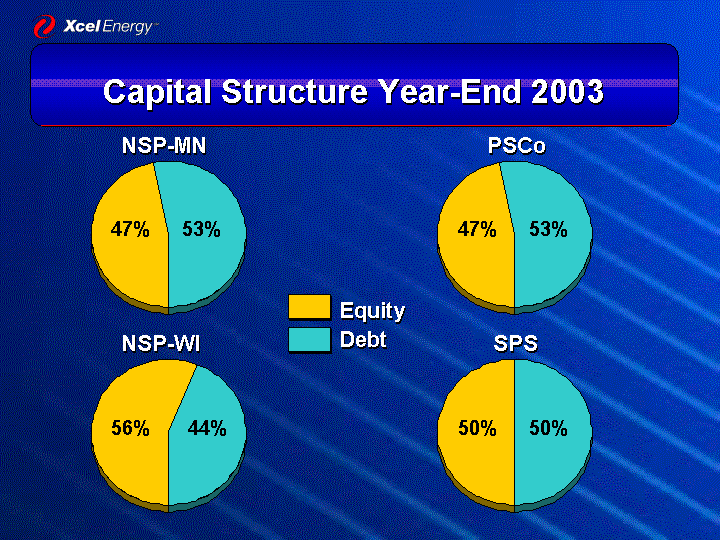
| Equity 47 Debt 53 Capital Structure Year-End 2003 47% PSCo 53% Equity 50 Debt 50 50% SPS 50% Equity 47 Debt 53 47% NSP-MN 53% Equity 56 Debt 44 56% NSP-WI 44% Equity Debt |

| Long-Term Debt Maturities Dollars in millions 2004 2005 2006 2007 2008 NSP-MN 4.5 74.7 204.8 2.5 2.7 NSP-WI 0 0 0 0 80 PSCo 147 137 127 102 320 SPS 0 0 500 0 0 Other Subs 9 13 6 6 6 Hold Co. 0 0 0 230 246 |
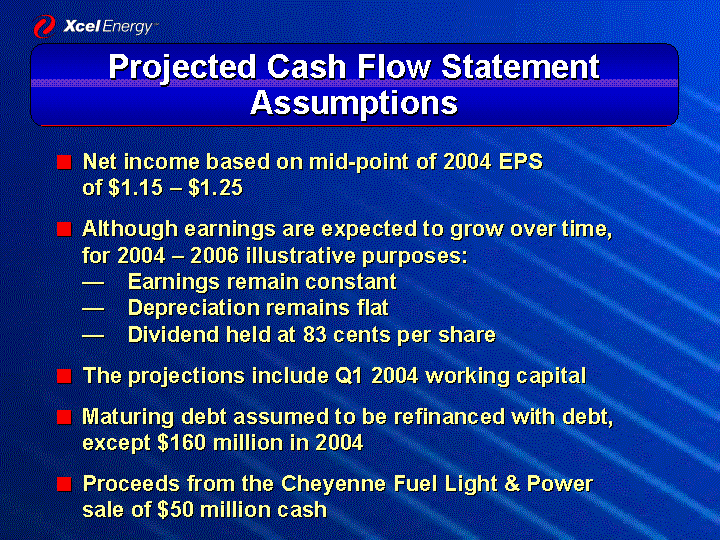
| Projected Cash Flow Statement Assumptions Net income based on mid-point of 2004 EPS of $1.15 - $1.25 Although earnings are expected to grow over time, for 2004 - 2006 illustrative purposes: - - Earnings remain constant - - Depreciation remains flat - - Dividend held at 83 cents per share The projections include Q1 2004 working capital Maturing debt assumed to be refinanced with debt, except $160 million in 2004 Proceeds from the Cheyenne Fuel Light & Power sale of $50 million cash |
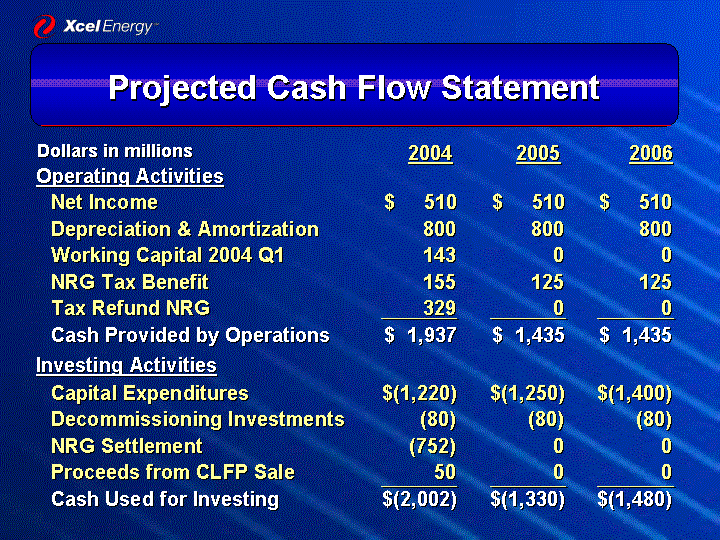
| Projected Cash Flow Statement Dollars in millions Net Income $ 510 $ 510 $ 510 Depreciation & Amortization 800 800 800 Working Capital 2004 Q1 143 0 0 NRG Tax Benefit 155 125 125 Tax Refund NRG 329 0 0 Cash Provided by Operations $ 1,937 $ 1,435 $ 1,435 2004 2005 2006 Operating Activities Capital Expenditures $(1,220) $(1,250) $(1,400) Decommissioning Investments (80) (80) (80) NRG Settlement (752) 0 0 Proceeds from CLFP Sale 50 0 0 Cash Used for Investing $(2,002) $(1,330) $(1,480) Investing Activities |
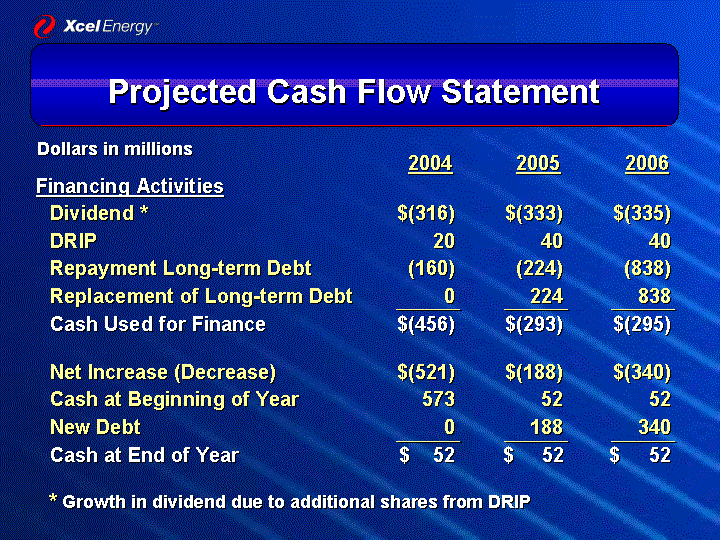
| Projected Cash Flow Statement Dividend * $(316) $(333) $(335) DRIP 20 40 40 Repayment Long-term Debt (160) (224) (838) Replacement of Long-term Debt 0 224 838 Cash Used for Finance $(456) $(293) $(295) Net Increase (Decrease) $(521) $(188) $(340) Cash at Beginning of Year 573 52 52 New Debt 0 188 340 Cash at End of Year $ 52 $ 52 $ 52 * Growth in dividend due to additional shares from DRIP Financing Activities Dollars in millions 2004 2005 2006 |
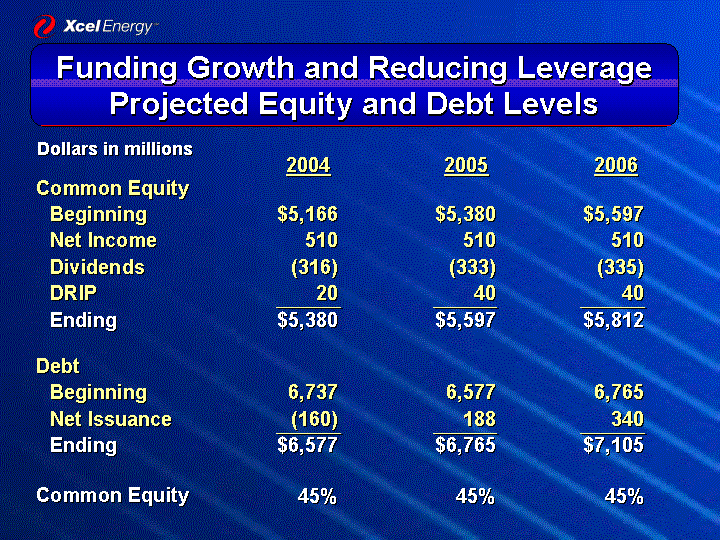
| Debt 2004 2005 2006 Funding Growth and Reducing Leverage Projected Equity and Debt Levels Beginning $5,166 $5,380 $5,597 Net Income 510 510 510 Dividends (316) (333) (335) DRIP 20 40 40 Ending $5,380 $5,597 $5,812 Beginning 6,737 6,577 6,765 Net Issuance (160) 188 340 Ending $6,577 $6,765 $7,105 45% 45% 45% Dollars in millions Common Equity Common Equity |
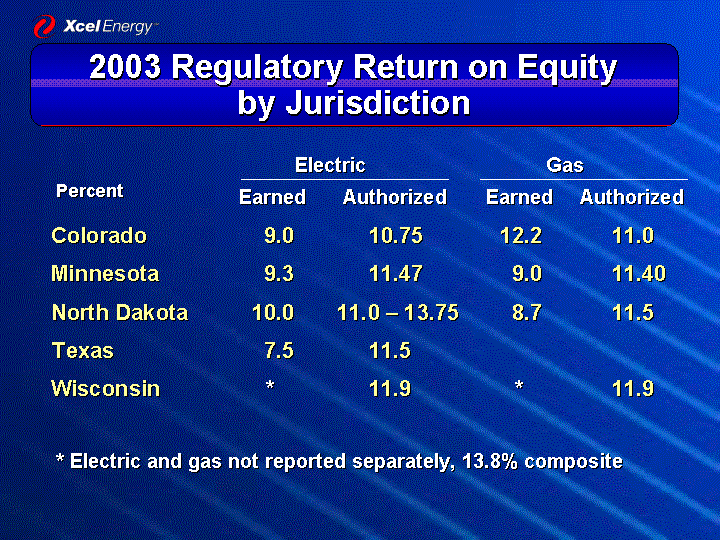
| Electric Gas Earned Authorized Earned Authorized 2003 Regulatory Return on Equity by Jurisdiction Percent Colorado 9.0 10.75 12.2 11.0 Minnesota 9.3 11.47 9.0 11.40 North Dakota 10.0 11.0 - 13.75 8.7 11.5 Texas 7.5 11.5 Wisconsin * 11.9 * 11.9 * Electric and gas not reported separately, 13.8% composite |
| Generally accepted accounting principles require the results of operations of discontinued operations to be reported for all periods presented on a net basis as discontinued operations. The following 2003 quarterly financial statements reflect the required reclassification of operations designated as discontinued operations during 2003 and 2004 and are consistent with the presentation of 2003 results of operations for 2004 reporting. |
| 12-31-2003 | 09-30-2003 | 06-30-2003 | 03-31-2003 | Total | ||||||||||||||||||
| QTD | QTD | QTD | QTD | YTD | ||||||||||||||||||
Operating Revenues | ||||||||||||||||||||||
| Electric utility | 1,440,468 | 1,754,514 | 1,374,327 | 1,365,378 | 5,934,687 | |||||||||||||||||
| Natural gas utility | 585,602 | 178,731 | 266,741 | 654,272 | 1,685,346 | |||||||||||||||||
| Electric trading margin | 1,714 | 10,837 | 5,648 | (1,034 | ) | 17,165 | ||||||||||||||||
| Nonregulated and other | 68,324 | 66,879 | 65,743 | 56,941 | 257,887 | |||||||||||||||||
| Total operating revenues | 2,096,108 | 2,010,961 | 1,712,459 | 2,075,557 | 7,895,085 | |||||||||||||||||
Operating Expenses | ||||||||||||||||||||||
| Electric fuel and purchased power — utility | 659,900 | 814,446 | 639,342 | 592,151 | 2,705,839 | |||||||||||||||||
| Cost of natural gas sold and transported — utility | 445,028 | 100,763 | 170,994 | 474,211 | 1,190,996 | |||||||||||||||||
| Cost of sales — nonregulated and other | 37,370 | 44,933 | 39,952 | 34,370 | 156,625 | |||||||||||||||||
| Other operating and maintenance expenses — utility | 431,218 | 383,252 | 378,520 | 377,502 | 1,570,492 | |||||||||||||||||
| Other operating and maintenance expenses — nonregulated | 25,006 | 30,027 | 23,130 | 23,560 | 101,723 | |||||||||||||||||
| Depreciation and amortization | 161,832 | 192,732 | 206,201 | 191,153 | 751,918 | |||||||||||||||||
| Taxes (other than income taxes) | 71,572 | 84,251 | 81,355 | 80,700 | 317,878 | |||||||||||||||||
| Special charges | 5,623 | 2,980 | 10,436 | — | 19,039 | |||||||||||||||||
| Total operating expenses | 1,837,549 | 1,653,384 | 1,549,930 | 1,773,647 | 6,814,510 | |||||||||||||||||
Operating Income | 258,559 | 357,577 | 162,529 | 301,910 | 1,080,575 | |||||||||||||||||
| Interest and other income, net of nonoperating expenses | 5,554 | 20,677 | 10,001 | (805 | ) | 35,427 | ||||||||||||||||
Interest Charges and Financing Costs | ||||||||||||||||||||||
| Interest charges — net of amounts capitalized | 109,609 | 104,318 | 109,477 | 105,076 | 428,480 | |||||||||||||||||
| Distributions on redeemable preferred securities of subsidiary trusts | 958 | 2,621 | 9,566 | 9,586 | 22,731 | |||||||||||||||||
| Total interest charges and financing costs | 110,567 | 106,939 | 119,043 | 114,662 | 451,211 | |||||||||||||||||
Income from continuing operations before income taxes | 153,546 | 271,315 | 53,487 | 186,443 | 664,791 | |||||||||||||||||
| Income taxes | 6,214 | 91,811 | (1,172 | ) | 60,477 | 157,330 | ||||||||||||||||
Income from continuing operations | 147,332 | 179,504 | 54,659 | 125,966 | 507,461 | |||||||||||||||||
| Income (loss) from discontinued operations — net of tax | 330,115 | 107,991 | (337,221 | ) | 14,046 | 114,931 | ||||||||||||||||
Net income (loss) | 477,447 | 287,495 | (282,562 | ) | 140,012 | 622,392 | ||||||||||||||||
| Dividend requirements on preferred stock | 1,061 | 1,060 | 1,060 | 1,060 | 4,241 | |||||||||||||||||
Earnings (loss) available to common shareholders | 476,386 | 286,435 | (283,622 | ) | 138,952 | 618,151 | ||||||||||||||||
| Basic Shares | 398,874 | 398,751 | 398,717 | 398,714 | ||||||||||||||||||
| Diluted Shares | 422,086 | 418,128 | 399,410 | 417,368 | ||||||||||||||||||
| Basic EPS | 1.20 | 0.72 | (0.71 | ) | 0.35 | |||||||||||||||||
| Diluted EPS | 1.14 | 0.69 | (0.71 | ) | 0.34 | |||||||||||||||||
34
| 12-31-2003 | 09-30-2003 | 06-30-2003 | 03-31-2003 | |||||||||||||||
| YTD | YTD | YTD | YTD | |||||||||||||||
Operating Revenues: | ||||||||||||||||||
| Electric utility | 5,934,687 | 4,494,219 | 2,739,705 | 1,365,378 | ||||||||||||||
| Natural gas utility | 1,685,346 | 1,099,744 | 921,013 | 654,272 | ||||||||||||||
| Electric trading margin | 17,165 | 15,451 | 4,614 | (1,034 | ) | |||||||||||||
| Nonregulated and other | 257,887 | 189,563 | 122,684 | 56,941 | ||||||||||||||
| Total operating revenues | 7,895,085 | 5,798,977 | 3,788,016 | 2,075,557 | ||||||||||||||
Operating Expenses | ||||||||||||||||||
| Electric fuel and purchased power — utility | 2,705,839 | 2,045,939 | 1,231,493 | 592,151 | ||||||||||||||
| Cost of natural gas sold and transported — utility | 1,190,996 | 745,968 | 645,205 | 474,211 | ||||||||||||||
| Cost of sales — nonregulated and other | 156,625 | 119,255 | 74,322 | 34,370 | ||||||||||||||
| Other operating and maintenance expenses — utility | 1,570,492 | 1,139,274 | 756,022 | 377,502 | ||||||||||||||
| Other operating and maintenance expenses — nonregulated | 101,723 | 76,717 | 46,690 | 23,560 | ||||||||||||||
| Depreciation and amortization | 751,918 | 590,086 | 397,354 | 191,153 | ||||||||||||||
| Taxes (other than income taxes) | 317,878 | 246,306 | 162,055 | 80,700 | ||||||||||||||
| Special charges | 19,039 | 13,416 | 10,436 | — | ||||||||||||||
| Total operating expenses | 6,814,510 | 4,976,961 | 3,323,577 | 1,773,647 | ||||||||||||||
Operating Income | 1,080,575 | 822,016 | 464,439 | 301,910 | ||||||||||||||
| Interest and other income, net of nonoperating expenses | 35,427 | 29,873 | 9,196 | (805 | ) | |||||||||||||
Interest Charges and Financing Costs | ||||||||||||||||||
| Interest charges — net of amounts capitalized | 428,480 | 318,871 | 214,553 | 105,076 | ||||||||||||||
| Distributions on redeemable preferred securities of subsidiary trusts | 22,731 | 21,773 | 19,152 | 9,586 | ||||||||||||||
| Total interest charges and financing costs | 451,211 | 340,644 | 233,705 | 114,662 | ||||||||||||||
Income from continuing operations before income taxes | 664,791 | 511,245 | 239,930 | 186,443 | ||||||||||||||
| Income taxes | 157,330 | 151,116 | 59,305 | 60,477 | ||||||||||||||
Income from continuing operations | 507,461 | 360,129 | 180,625 | 125,966 | ||||||||||||||
| Income (loss) from discontinued operations — net of tax | 114,931 | (215,184 | ) | (323,175 | ) | 14,046 | ||||||||||||
Net income (loss) | 622,392 | 144,945 | (142,550 | ) | 140,012 | |||||||||||||
| Dividend requirements on preferred stock | 4,241 | 3,180 | 2,120 | 1,060 | ||||||||||||||
Earnings (loss) available to common shareholders | 618,151 | 141,765 | (144,670 | ) | 138,952 | |||||||||||||
35