Searchable text section of graphics shown above
[LOGO]
[GRAPHIC] | | |
| | [GRAPHIC] |
Edison Electric Institute
Financial Conference | | |
October 26, 2004 | | [GRAPHIC] |
Safe Harbor
This material includes forward-looking statements that are subject to certain risks, uncertainties and assumptions. Such forward-looking statements include projected earnings, cash flows, capital expenditures and other statements and are identified in this document by the words “anticipate,” “estimate,” “expect,” “projected,” “objective,” “outlook,” “possible,” “potential” and similar expressions. Actual results may vary materially. Factors that could cause actual results to differ materially include, but are not limited to: general economic conditions, including the availability of credit, actions of rating agencies and their impact on capital expenditures; business conditions in the energy industry; competitive factors; unusual weather; effects of geopolitical events, including war and acts of terrorism, changes in federal or state legislation; regulation; risks associated with the California power market; the higher degree of risk associated with Xcel Energy’s nonregulated businesses compared with Xcel Energy’s regulated business; and the other risk factors listed from time to time by Xcel Energy in reports filed with the SEC, including Exhibit 99.01 to Xcel Energy’s report on Form 10-K for year 2003.
[LOGO]
[GRAPHIC] | | |
| | [GRAPHIC] |
Dick Kelly
President and
Chief Operating Officer | | |
| [GRAPHIC] |
Xcel Energy Investment Merits
[GRAPHIC]
• Low risk, integrated, regulated utility
• Four value drivers
• Total return 7 – 9%
• Dividend yield 5%
• Earnings growth 2 – 4%
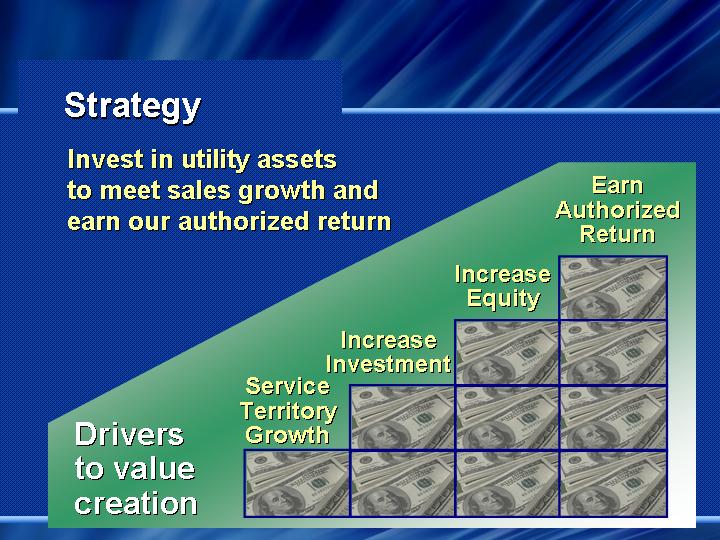
Strategy
Invest in utility assets to meet sales growth and earn our authorized return
Drivers to value creation
Service Territory Growth
[GRAPHIC]
Increase Investment
[GRAPHIC]
Increase Equity
[GRAPHIC]
Earn Authorized Return
[GRAPHIC]
[LOGO]
4th largest US electric and gas utility – Customers:
3.3 Million Electric
1.8 Million Gas
Unemployment Rate*
[CHART]
* August 2004 Bureau of Labor Statistics
Northern States Power Minnesota
[GRAPHIC]
Northern States Power Wisconsin
Public Service Company of Colorado
[GRAPHIC]
Southwestern Public Service
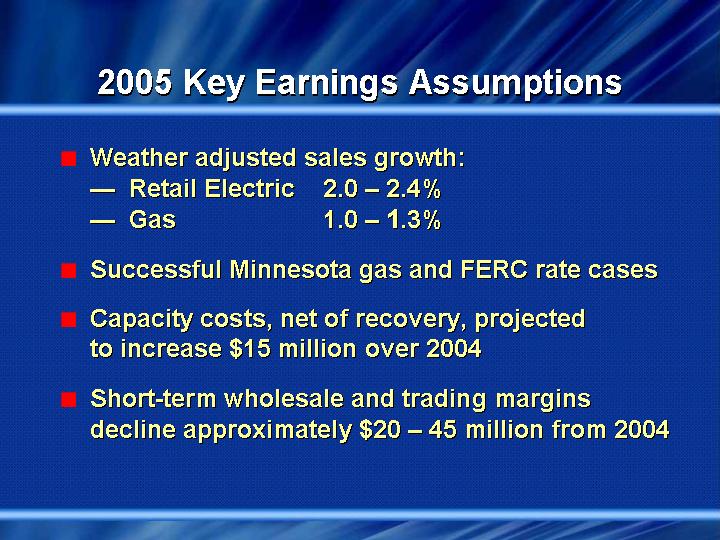
2005 Key Earnings Assumptions
• Weather adjusted sales growth:
• | Retail Electric | 2.0 – 2.4% |
• | Gas | 1.0 – 1.3% |
• Successful Minnesota gas and FERC rate cases
• Capacity costs, net of recovery, projected to increase $15 million over 2004
• Short-term wholesale and trading margins decline approximately $20 – 45 million from 2004
Short-term Wholesale Margins
[CHART]
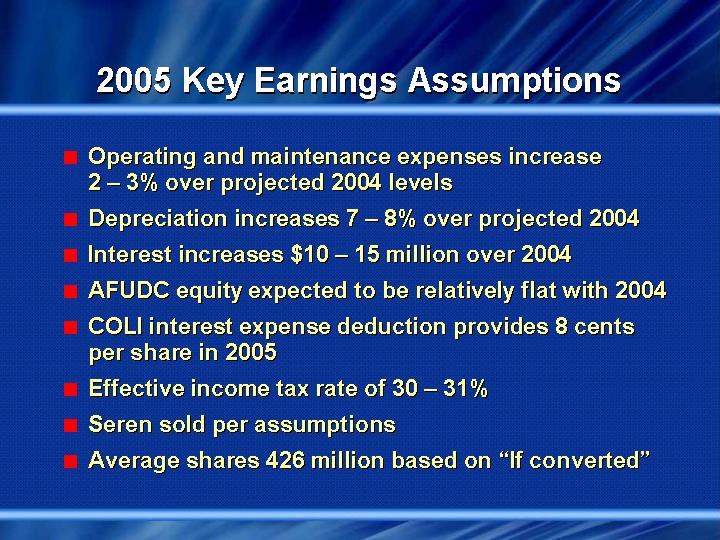
2005 Key Earnings Assumptions
• Operating and maintenance expenses increase 2 – 3% over projected 2004 levels
• Depreciation increases 7 – 8% over projected 2004
• Interest increases $10 – 15 million over 2004
• AFUDC equity expected to be relatively flat with 2004
• COLI interest expense deduction provides 8 cents per share in 2005
• Effective income tax rate of 30 – 31%
• Seren sold per assumptions
• Average shares 426 million based on “If converted”
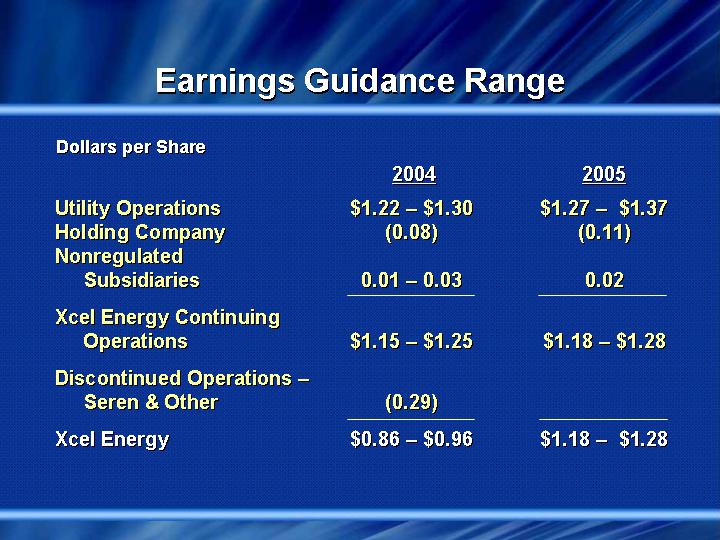
Earnings Guidance Range
Dollars per Share
| | 2004 | | 2005 | |
| | | | | |
Utility Operations | | $1.22 – $1.30 | | $1.27 – $1.37 | |
Holding Company | | (0.08) | | (0.11) | |
Nonregulated Subsidiaries | | 0.01 – 0.03 | | 0.02 | |
| | | | | |
Xcel Energy Continuing Operations | | $1.15 – $1.25 | | $1.18 – $1.28 | |
| | | | | |
Discontinued Operations – Seren & Other | | (0.29) | | | |
Xcel Energy | | $0.86 – $0.96 | | $1.18 – $1.28 | |
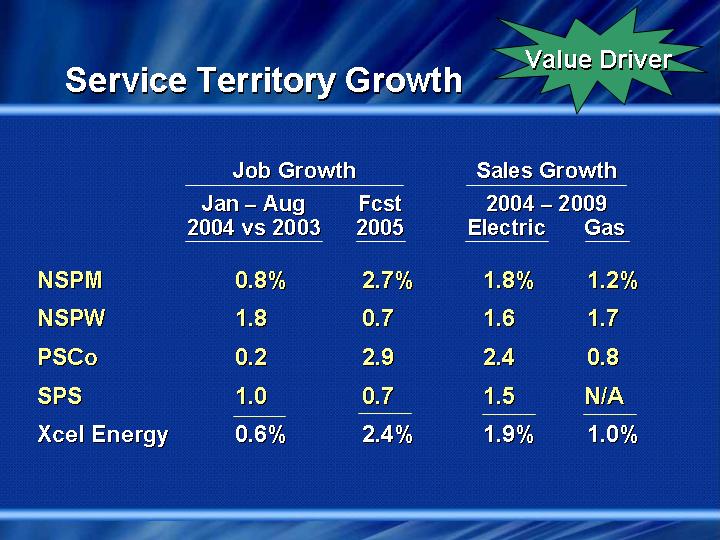
Value Driver
Service Territory Growth
| | Job Growth | | Sales Growth | |
| | Jan – Aug | | Fcst | | 2004 – 2009 | |
| | 2004 vs 2003 | | 2005 | | Electric | | Gas | |
| | | | | | | | | |
NSPM | | 0.8 | % | 2.7 | % | 1.8 | % | 1.2 | % |
NSPW | | 1.8 | | 0.7 | | 1.6 | | 1.7 | |
PSCo | | 0.2 | | 2.9 | | 2.4 | | 0.8 | |
SPS | | 1.0 | | 0.7 | | 1.5 | | N/A | |
Xcel Energy | | 0.6 | % | 2.4 | % | 1.9 | % | 1.0 | % |
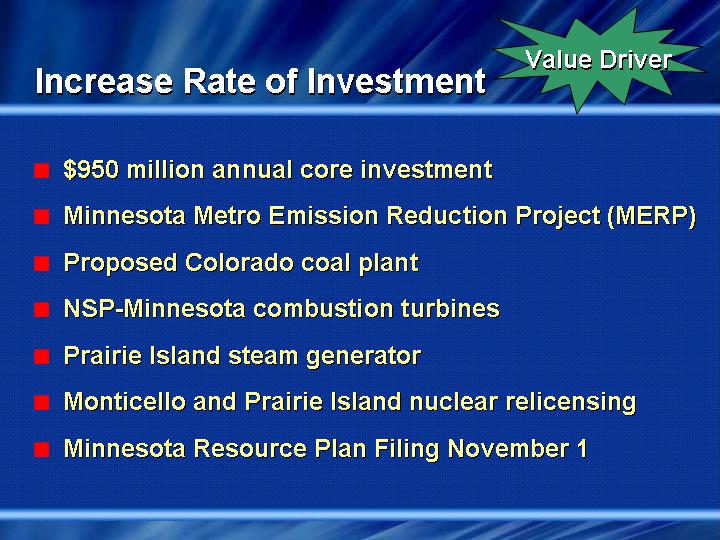
Increase Rate of Investment
• $950 million annual core investment
• Minnesota Metro Emission Reduction Project (MERP)
• Proposed Colorado coal plant
• NSP-Minnesota combustion turbines
• Prairie Island steam generator
• Monticello and Prairie Island nuclear relicensing
• Minnesota Resource Plan Filing November 1
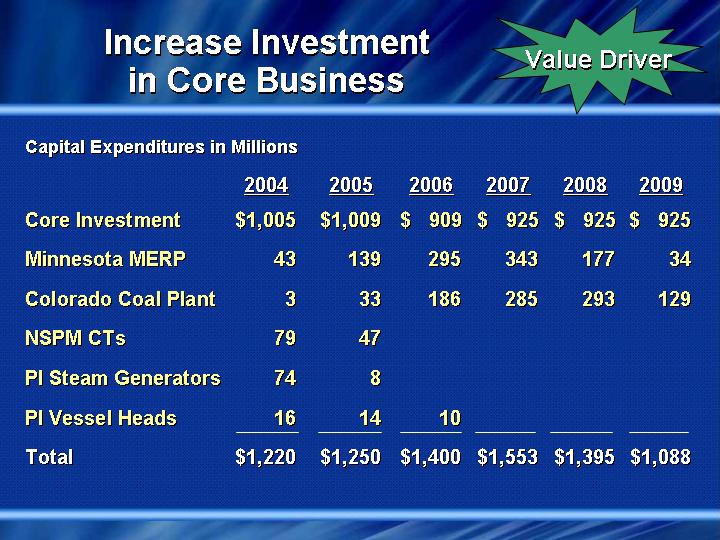
Increase Investment in Core Business
Capital Expenditures in Millions
| | 2004 | | 2005 | | 2006 | | 2007 | | 2008 | | 2009 | |
| | | | | | | | | | | | | |
Core Investment | | $ | 1,005 | | $ | 1,009 | | $ | 909 | | $ | 925 | | $ | 925 | | $ | 925 | |
Minnesota MERP | | 43 | | 139 | | 295 | | 343 | | 177 | | 34 | |
Colorado Coal Plant | | 3 | | 33 | | 186 | | 285 | | 293 | | 129 | |
NSPM CTs | | 79 | | 47 | | | | | | | | | |
PI Steam Generators | | 74 | | 8 | | | | | | | | | |
PI Vessel Heads | | 16 | | 14 | | 10 | | | | | | | |
Total | | $ | 1,220 | | $ | 1,250 | | $ | 1,400 | | $ | 1,553 | | $ | 1,395 | | $ | 1,088 | |
Minnesota MERP Potential Earnings
Dollars in Millions
| | 2004 | | 2005 | | 2006 | | 2007 | | 2008 | | 2009 | |
| | | | | | | | | | | | | |
Expenditures: | | | | | | | | | | | | | |
Minnesota MERP | | $ | 43 | | $ | 139 | | $ | 295 | | $ | 343 | | $ | 177 | | $ | 34 | |
Cumulative | | $ | 43 | | $ | 182 | | $ | 477 | | $ | 820 | | $ | 997 | | $ | 1,031 | |
| | | | | | | | | | | | | | | | | | | |
Equity Ratio | | 48.5 | % | 48.5 | % | 48.5 | % | 48.5 | % | 48.5 | % | 48.5 | % |
| | | | | | | | | | | | | |
ROE | | 10.86 | % | 10.86 | % | 10.86 | % | 10.86 | % | 10.86 | % | 10.86 | % |
| | | | | | | | | | | | | |
Equity Return * | | $ | 1 | | $ | 6 | | $ | 18 | | $ | 35 | | $ | 48 | | $ | 55 | |
* Simplified calculation – NSP-Minnesota regulatory jurisdiction earns cash return on 75% of average cumulative investment after 2005. Other northern jurisdictions earn AFUDC on 25% of average cumulative investment.
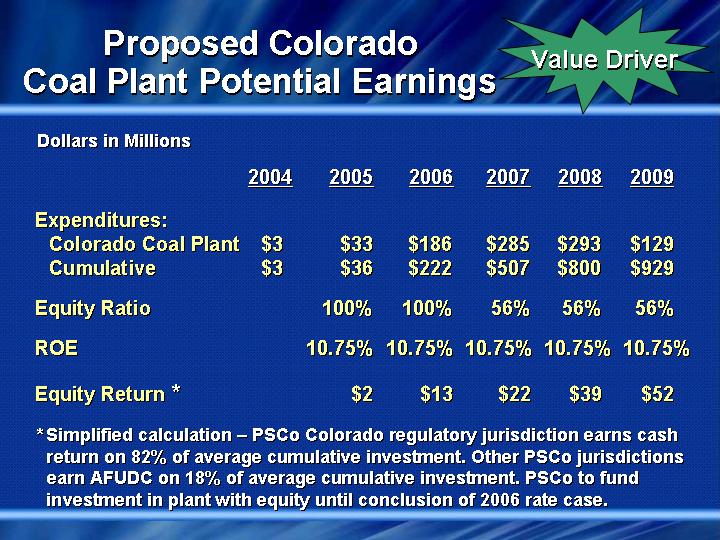
Proposed Colorado Coal Plant Potential Earnings
Dollars in Millions
| | 2004 | | 2005 | | 2006 | | 2007 | | 2008 | | 2009 | |
| | | | | | | | | | | | | |
Expenditures: | | | | | | | | | | | | | |
Colorado Coal Plant | | $ | 3 | | $ | 33 | | $ | 186 | | $ | 285 | | $ | 293 | | $ | 129 | |
Cumulative | | $ | 3 | | $ | 36 | | $ | 222 | | $ | 507 | | $ | 800 | | $ | 929 | |
| | | | | | | | | | | | | |
Equity Ratio | | | | 100 | % | 100 | % | 56 | % | 56 | % | 56 | % |
| | | | | | | | | | | | | |
ROE | | | | 10.75 | % | 10.75 | % | 10.75 | % | 10.75 | % | 10.75 | % |
| | | | | | | | | | | | | |
Equity Return * | | | | $ | 2 | | $ | 13 | | $ | 22 | | $ | 39 | | $ | 52 | |
* Simplified calculation – PSCo Colorado regulatory jurisdiction earns cash return on 82% of average cumulative investment. Other PSCo jurisdictions earn AFUDC on 18% of average cumulative investment. PSCo to fund investment in plant with equity until conclusion of 2006 rate case.
Increase Equity in Operating Companies
Percent
Company | | June 30, 2004
Equity
Ratio | | Target
Equity | |
| | | | | |
NSPM | | 49 | | 49-51 | |
NSPW | | 57 | | 54-56 | |
PSCo | | 48 | | 55-56 | |
SPS | | 48 | | 48-50 | |
Xcel Consolidated | | 44 | | 44-46 | |
Xcel Energy consolidated equity of $5.2 billion at September 30, 2004
Earn Authorized Return
| | Earned 2003 | | | |
| | Regulatory ROE | | 2003 | |
| | Electric | | Gas | | Ratebase | |
| | | | | | | |
Colorado | | 9.0 | % | 12.2 | %* | $ | 3.9 Billion | |
Minnesota | | 9.3 | % | 9.0 | % | $ | 3.3 Billion | |
* Effective July 1, 2003 Public Service of Colorado implemented a $33 million reduction in gas base rates
Earn Authorized Return Regulatory Strategy
• MERP Rider approved
• Rate increase requested at FERC with rates effective mid-December, 2004 approximately $5 million
• Gas rate increase requested in Minnesota with rates effective December 1, 2004, approximately $10 million
• Proposed Colorado Coal Plant Rider with rates effective 2005
• File required Wisconsin rate case in 2005
• SPS annual merger credits of $10 million expire YE 2005
• File Minnesota electric case with rates effective 2006
• File Colorado rate case in 2006 with rates effective 2007
Financing Strategy Fund Investment Strategy
• Internal cash generation
• NRG tax benefit
• Asset sales
• Dividend Reinvestment Program
• Regulatory recovery
• Modest debt issuances
• Equity
Dividend Objectives
• Annual dividend rate of 83 cents
• Review dividend — Spring 2005
• Annual dividend increases consistent with long-term earnings growth
[LOGO]
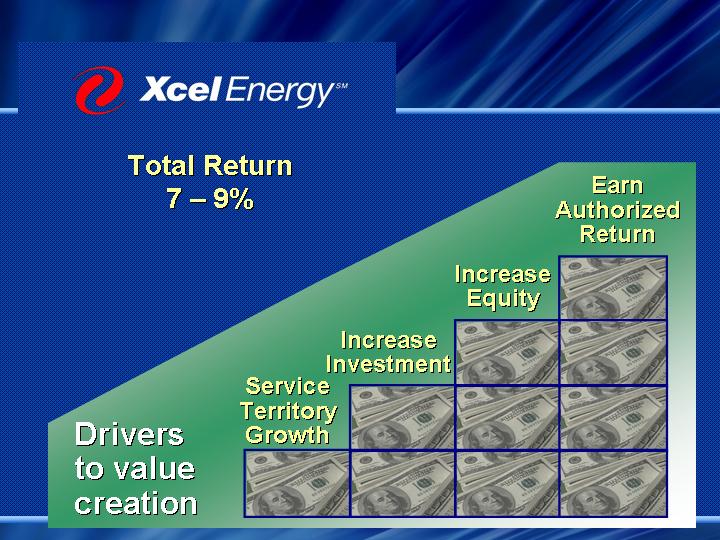
Total Return
7 – 9%
Drivers to value creation
Service Territory Growth
[GRAPHIC]
Increase Investment
[GRAPHIC]
Increase Equity
[GRAPHIC]
Earn Authorized Return
[GRAPHIC]
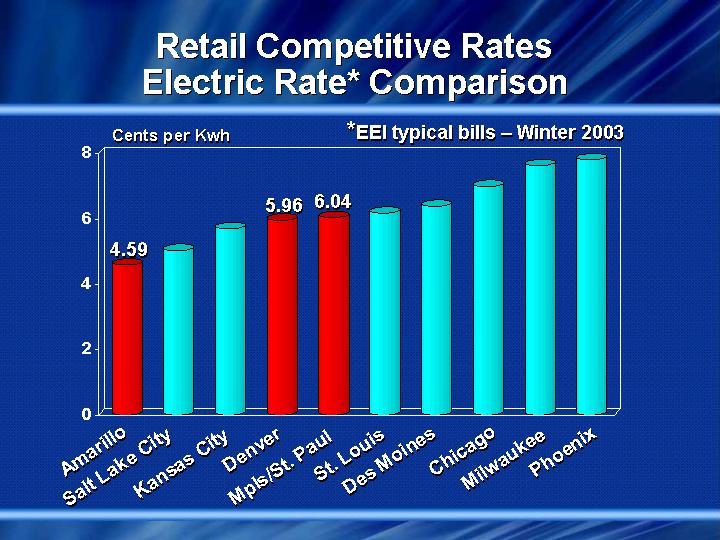
Retail Competitive Rates Electric Rate* Comparison
*EEI typical bills – Winter 2003
[CHART]
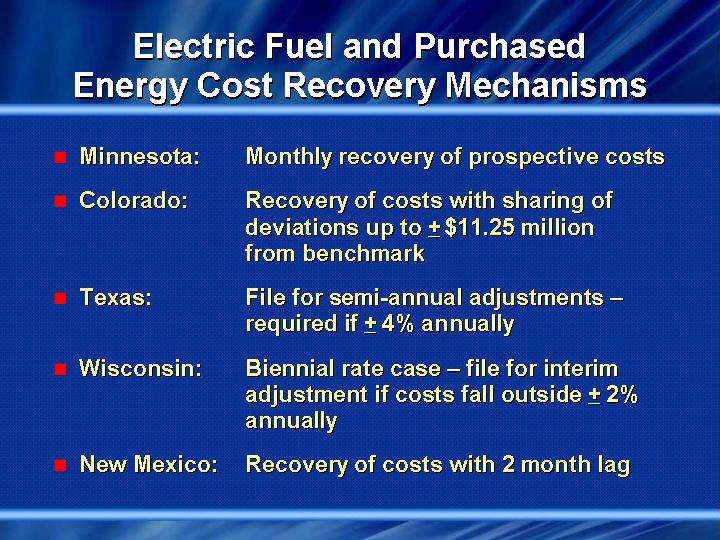
Electric Fuel and Purchased
Energy Cost Recovery Mechanisms
• | Minnesota: | Monthly recovery of prospective costs |
| | |
• | Colorado: | Recovery of costs with sharing of deviations up to + $11.25 million from benchmark |
| | |
• | Texas: | File for semi-annual adjustments – required if + 4% annually |
| | |
• | Wisconsin: | Biennial rate case – file for interim adjustment if costs fall outside + 2% annually |
| | |
• | New Mexico: | Recovery of costs with 2 month lag |
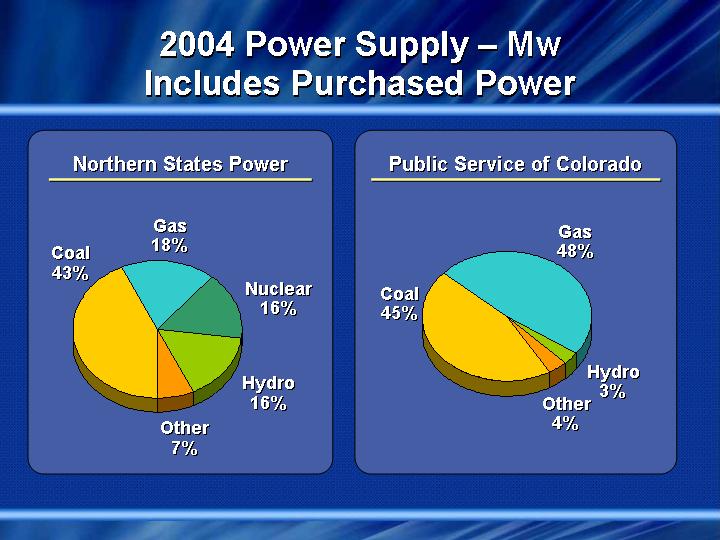
2004 Power Supply – Mw
Includes Purchased Power
Northern States Power
[CHART]
Public Service of Colorado
[CHART]
Capital Expenditures
Base Level: $900 to $950 Million
[CHART]
Long-Term Debt Maturities
[CHART]