Safe Harbor
This material includes forward-looking statements that are subject to certain risks, uncertainties and assumptions. Such forward-looking statements include projected earnings, cash flows, capital expenditures and other statements and are identified in this document by the words “anticipate,” “estimate,” “expect,” “projected,” “objective,” “outlook,” “possible,” “potential” and similar expressions. Actual results may vary materially. Factors that could cause actual results to differ materially include, but are not limited to: general economic conditions, including the availability of credit, actions of rating agencies and their impact on capital expenditures; business conditions in the energy industry; competitive factors; unusual weather; effects of geopolitical events, including war and acts of terrorism; changes in federal or state legislation; regulation; final approval and implementation of the pending settlement of the securities, ERISA and derivative litigation; costs and other effects of legal administrative proceedings, settlements, investigations and claims; actions of accounting regulatory bodies; risks associated with the California power market; the higher degree of risk associated with Xcel Energy’s nonregulated businesses compared with Xcel Energy’s regulated business; and other risk factors listed from time to time by Xcel Energy in reports filed with the SEC, including Exhibit 99.01 to Xcel Energy’s report on Form 10-K for year 2003.
[GRAPHIC]
Wayne Brunetti
Chairman and Chief Executive Officer
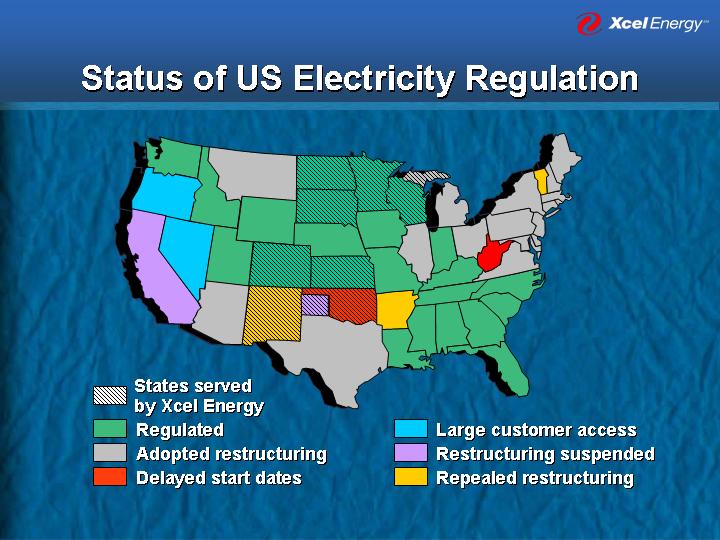
Status of US Electricity Regulation
[GRAPHIC]
[GRAPHIC]
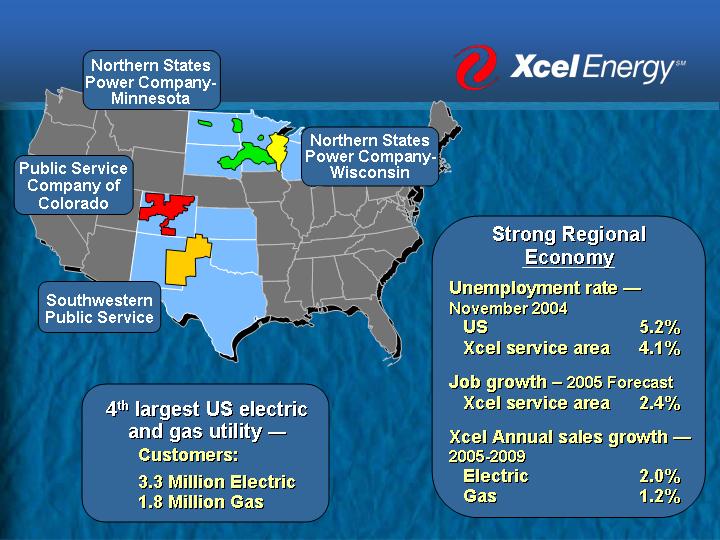
4th largest US electric and gas utility — Customers:
3.3 Million Electric
1.8 Million Gas
Strong Regional Economy |
| | | |
Unemployment rate — November 2004 | | | |
US | | 5.2 | % |
Xcel service area | | 4.1 | % |
| | | |
Job growth – 2005 Forecast | | | |
Xcel service area | | 2.4 | % |
| | | |
Xcel Annual sales growth — 2005-2009 | | | |
Electric | | 2.0 | % |
Gas | | 1.2 | % |
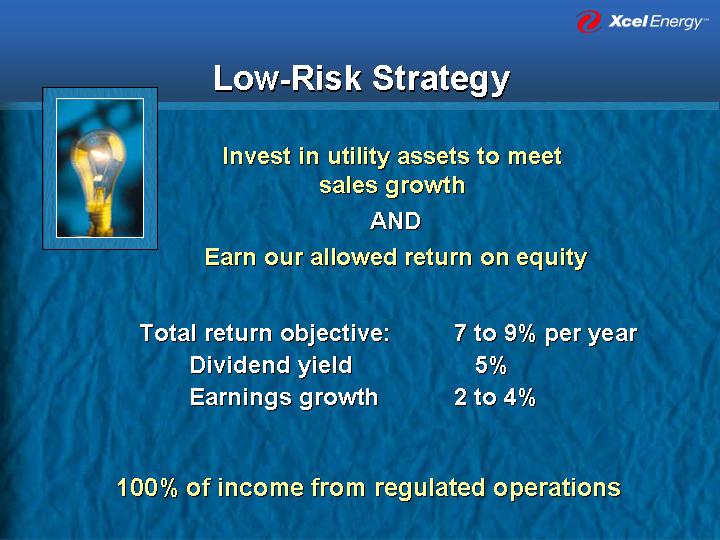
Low-Risk Strategy
[GRAPHIC]
Invest in utility assets to meet sales growth
AND
Earn our allowed return on equity
Total return objective: | | 7 to 9% per year | |
Dividend yield | | 5% | |
Earnings growth | | 2 to 4% | |
100% of income from regulated operations
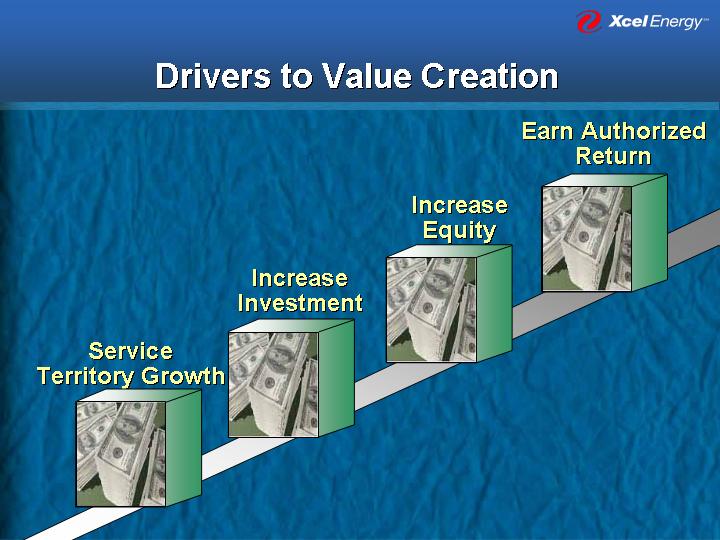
Drivers to Value Creation
Service Territory Growth
[GRAPHIC]
Increase Investment
[GRAPHIC]
Increase Equity
[GRAPHIC]
Earn Authorized Return
[GRAPHIC]
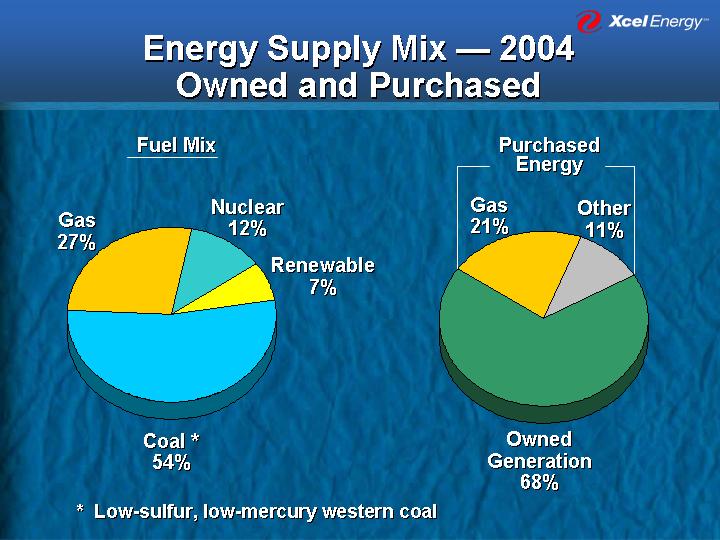
Energy Supply Mix — 2004
Owned and Purchased
Fuel Mix
[CHART]
Purchased Energy
[CHART]
* Low-sulfur, low-mercury western coal
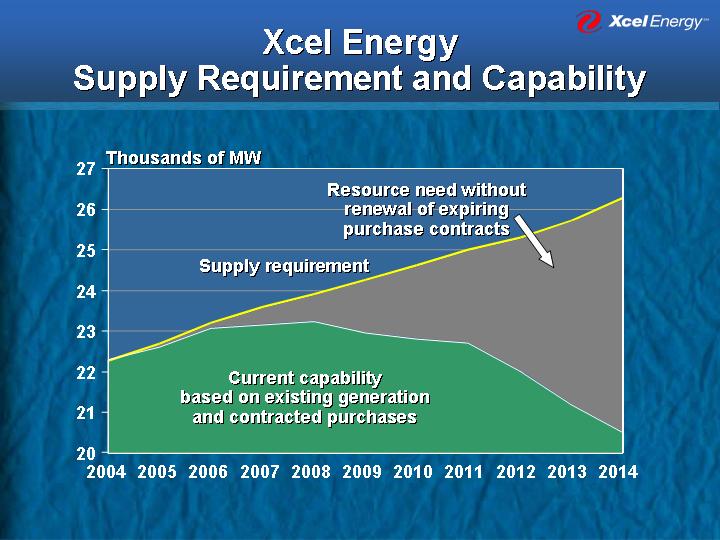
Xcel Energy
Supply Requirement and Capability
[CHART]
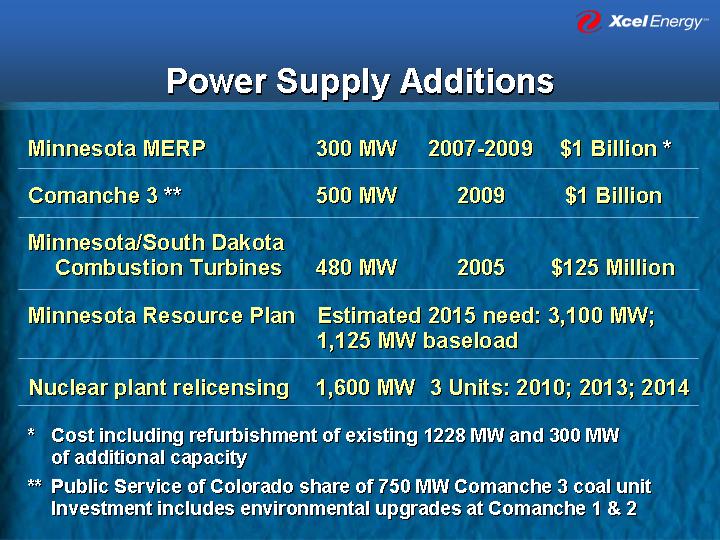
Power Supply Additions
Minnesota MERP | | 300 MW | | 2007-2009 | | $ | 1 Billion * | |
| | | | | | | |
Comanche 3 ** | | 500 MW | | 2009 | | $ | 1 Billion | |
| | | | | | | |
Minnesota/South Dakota Combustion Turbines | | 480 MW | | 2005 | | $ | 125 Million | |
Minnesota Resource Plan | | Estimated 2015 need: 3,100 MW; 1,125 MW baseload | |
| | | | | | | |
Nuclear plant relicensing | | 1,600 MW 3 Units: 2010; 2013; 2014 | |
| | | | | | | |
* Cost including refurbishment of existing 1228 MW and 300 MW of additional capacity
** Public Service of Colorado share of 750 MW Comanche 3 coal unit Investment includes environmental upgrades at Comanche 1 & 2
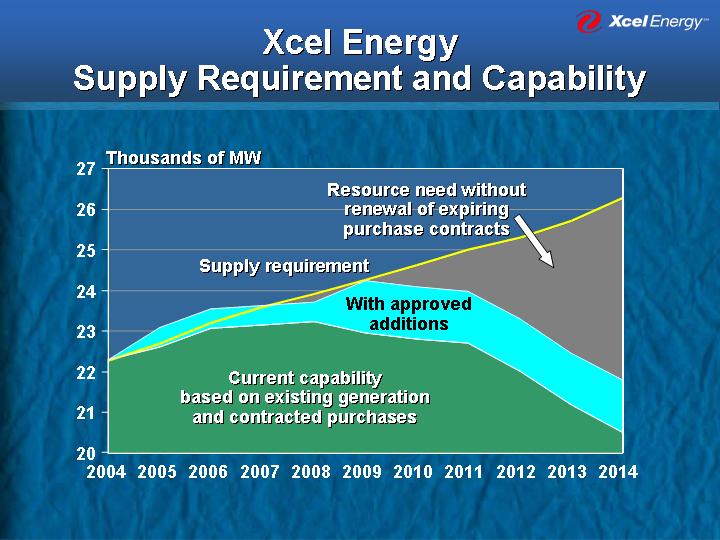
Xcel Energy
Supply Requirement and Capability
[CHART]
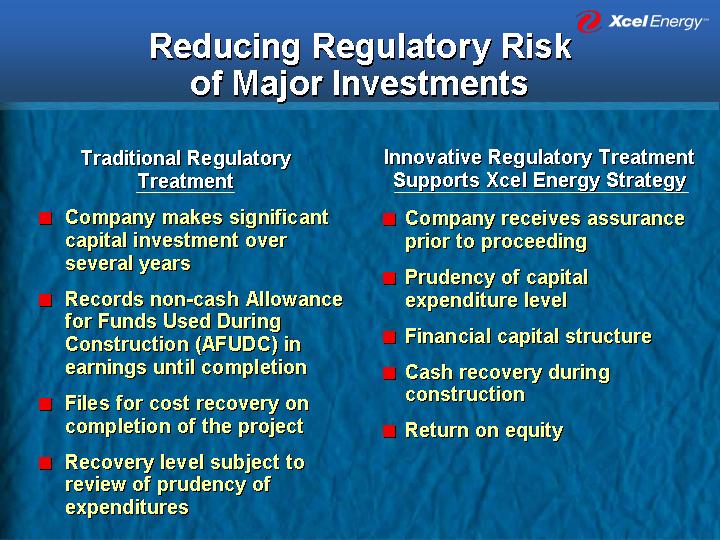
Reducing Regulatory Risk
of Major Investments
Traditional Regulatory
Treatment | | Innovative Regulatory Treatment
Supports Xcel Energy Strategy | |
| | | |
• | Company makes significant capital investment over | | • | Company receives assurance prior to proceeding | |
| several years | | | | |
| | | • | Prudency of capital expenditure level | |
• | Records non-cash Allowance for Funds Used During | | | | |
| Construction (AFUDC) in earnings until completion | | • | Financial capital structure | |
| | | | | |
• | Files for cost recovery on completion of the project | | • | Cash recovery during construction | |
| | | | | |
• | Recovery level subject to review of prudency of | | • | Return on equity | |
| Expenditures | | | | |
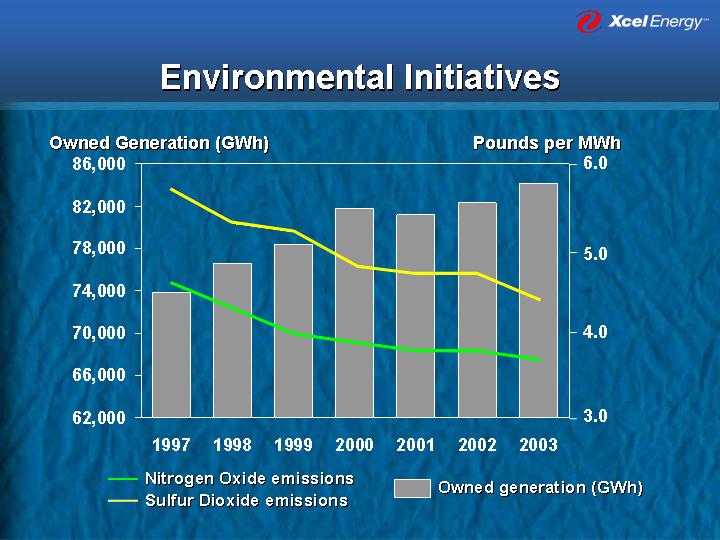
Environmental Initiatives
[CHART]
Commitment to Wind Power
[CHART]
** Timing dependent on renewal of Production Tax Credit
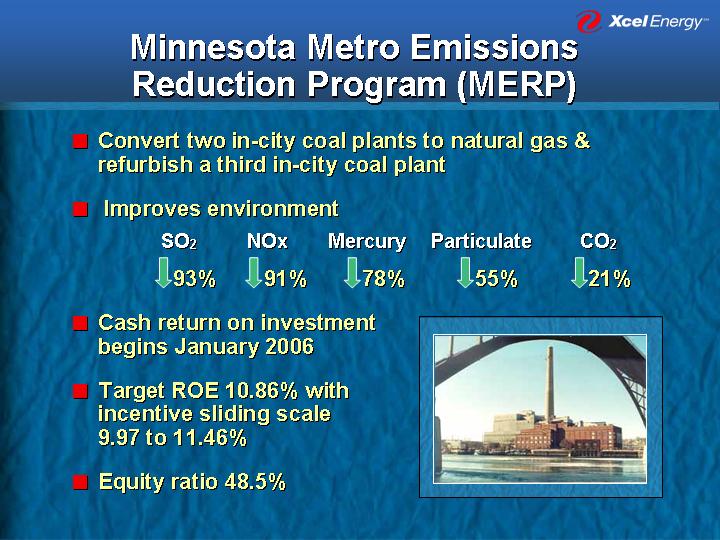
Minnesota Metro Emissions
Reduction Program (MERP)
• Convert two in-city coal plants to natural gas & refurbish a third in-city coal plant
• Improves environment
SO2 | | NOx | | Mercury | | Particulate | | CO2 | |
ß93 | % | ß91 | % | ß78 | % | ß55 | % | ß21 | % |
• Cash return on investment begins January 2006
• Target ROE 10.86% with incentive sliding scale 9.97 to 11.46%
• Equity ratio 48.5%
[GRAPHIC]
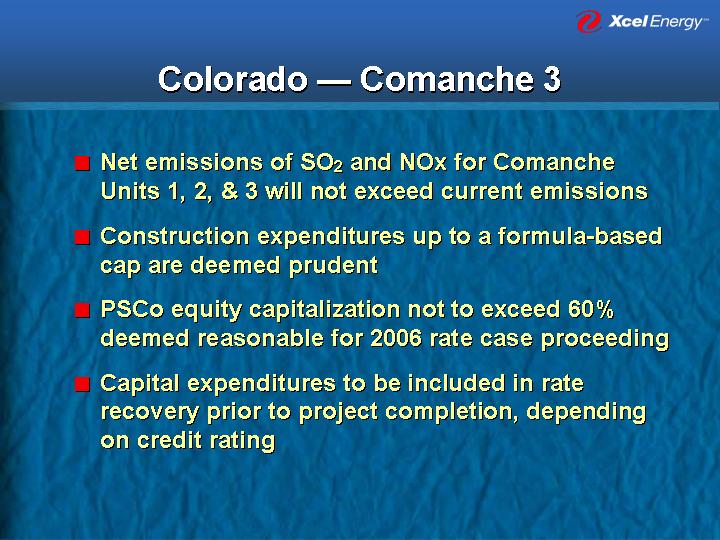
Colorado — Comanche 3
• Net emissions of SO2 and NOx for Comanche Units 1, 2, & 3 will not exceed current emissions
• Construction expenditures up to a formula-based cap are deemed prudent
• PSCo equity capitalization not to exceed 60% deemed reasonable for 2006 rate case proceeding
• Capital expenditures to be included in rate recovery prior to project completion, depending on credit rating
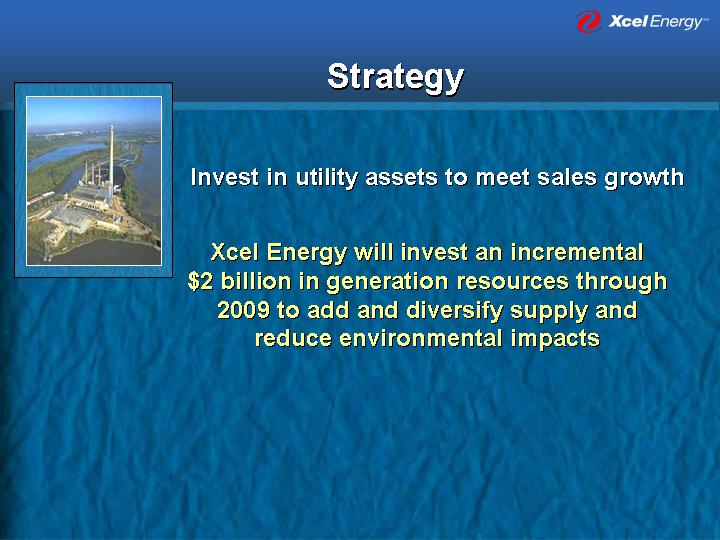
Strategy
[GRAPHIC]
Invest in utility assets to meet sales growth
Xcel Energy will invest an incremental
$2 billion in generation resources through
2009 to add and diversify supply and
reduce environmental impacts
Financial Overview
[GRAPHIC]
Ben Fowke
Vice President and Chief Financial Officer
Business Objectives
Deliver good value to our customers
AND
Deliver low-risk 7 to 9%
total return to shareholders
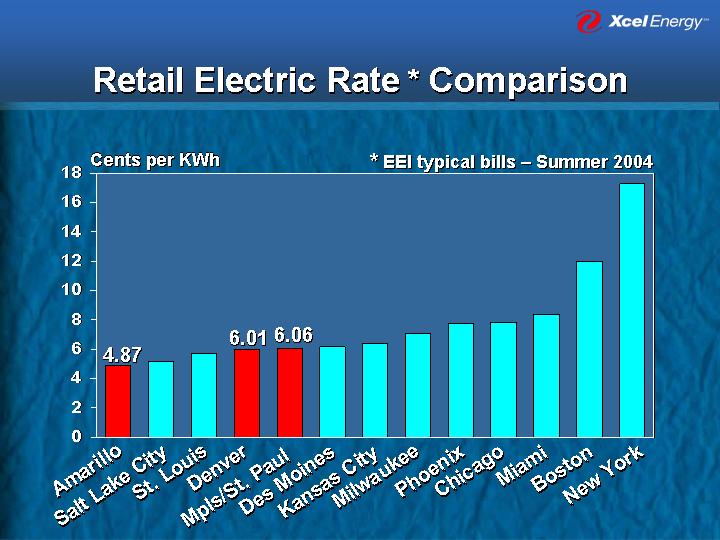
Retail Electric Rate * Comparison
[CHART]
* EEI typical bills – Summer 2004
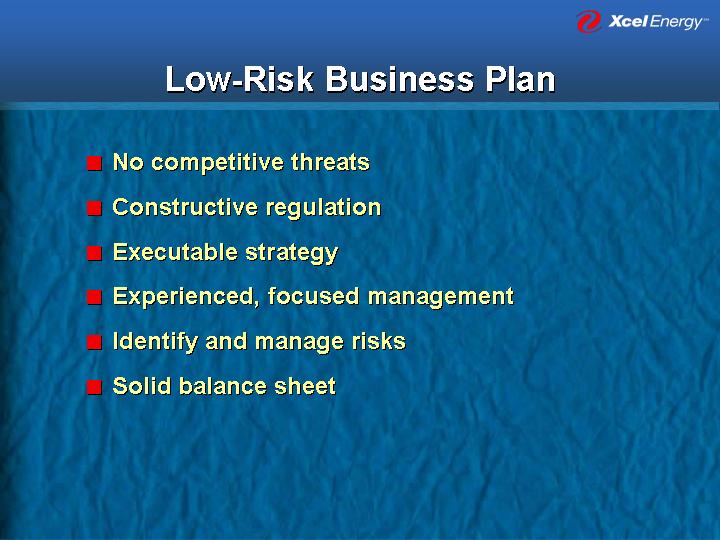
Low-Risk Business Plan
• No competitive threats
• Constructive regulation
• Executable strategy
• Experienced, focused management
• Identify and manage risks
• Solid balance sheet
Total Return Objective
5% Dividend yield
+
| 2 to 4% Earnings per share growth | |
| 7 to 9% Total return | |
Objective: Annual dividend increases consistent with long-term earnings growth
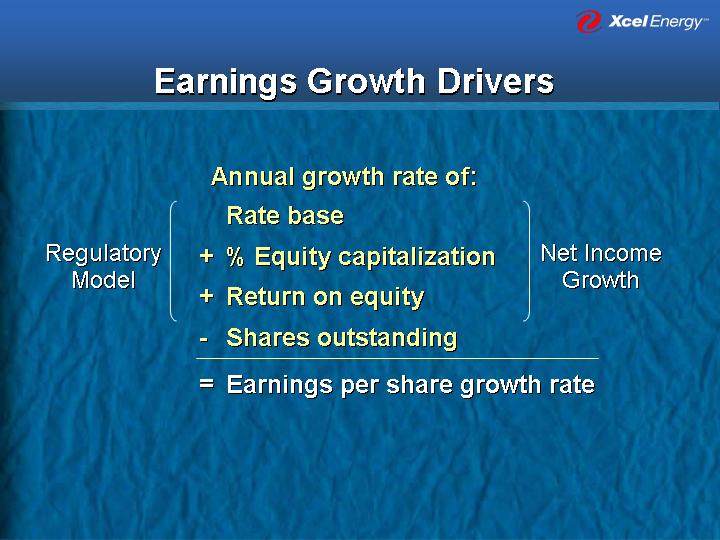
Earnings Growth Drivers
Annual growth rate of:
| Regulatory
Model | Rate base | Net Income
Growth | | |
+ % Equity capitalization |
+ Return on equity |
- Shares outstanding |
= Earnings per share growth rate |
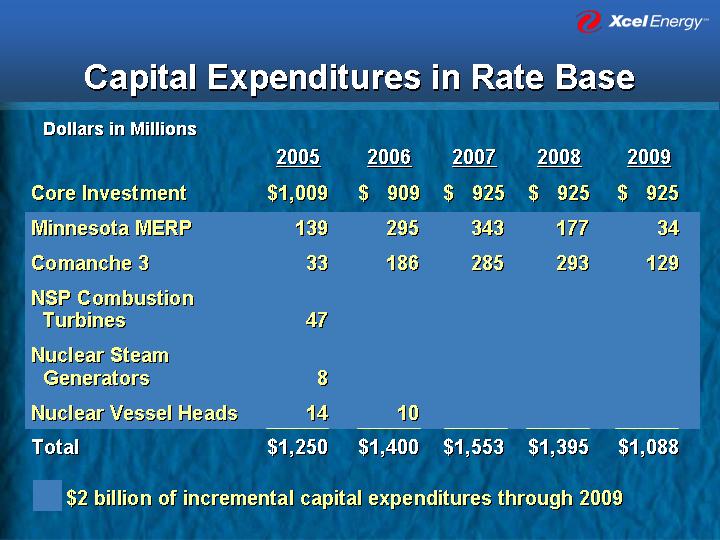
Capital Expenditures in Rate Base
Dollars in Millions
| | 2005 | | 2006 | | 2007 | | 2008 | | 2009 | |
| | | | | | | | | | | |
Core Investment | | $ | 1,009 | | $ | 909 | | $ | 925 | | $ | 925 | | $ | 925 | |
| | | | | | | | | | | |
Minnesota MERP | | 139 | | 295 | | 343 | | 177 | | 34 | |
| | | | | | | | | | | |
Comanche 3 | | 33 | | 186 | | 285 | | 293 | | 129 | |
| | | | | | | | | | | |
NSP Combustion Turbines | | 47 | | | | | | | | | |
| | | | | | | | | | | |
Nuclear Steam Generators | | 8 | | | | | | | | | |
| | | | | | | | | | | |
Nuclear Vessel Heads | | 14 | | 10 | | | | | | | |
| | | | | | | | | | | |
Total | | $ | 1,250 | | $ | 1,400 | | $ | 1,553 | | $ | 1,395 | | $ | 1,088 | |
• $2 billion of incremental capital expenditures through 2009
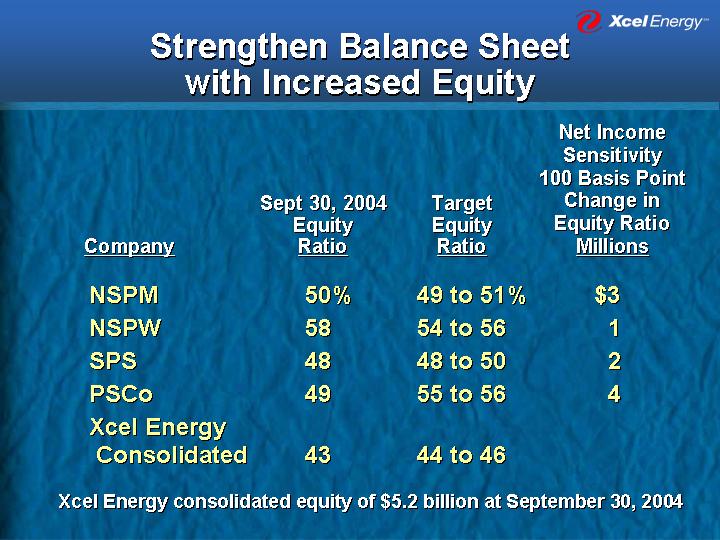
Strengthen Balance Sheet
with Increased Equity
Company | | Sept 30, 2004
Equity
Ratio | | Target
Equity
Ratio | | Net Income
Sensitivity
100 Basis Point
Change in
Equity Ratio | |
| | | | | | Millions | |
| | | | | | | |
NSPM | | 50 | % | 49 to 51% | | $ | 3 | |
| | | | | | | |
NSPW | | 58 | | 54 to 56 | | 1 | |
| | | | | | | |
SPS | | 48 | | 48 to 50 | | 2 | |
| | | | | | | |
PSCo | | 49 | | 55 to 56 | | 4 | |
| | | | | | | |
Xcel Energy Consolidated | | 43 | | 44 to 46 | | | |
| | | | | | | | |
Xcel Energy consolidated equity of $5.2 billion at September 30, 2004
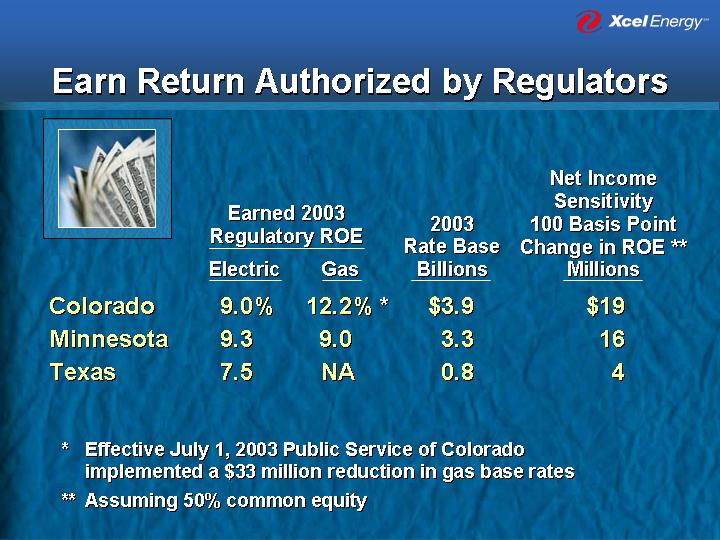
Earn Return Authorized by Regulators
[GRAPHIC]
| | Earned 2003
Regulatory ROE | | 2003 | | Net Income
Sensitivity
100 Basis Point | |
| | Electric | | Gas | | Rate Base | | Change in ROE ** | |
| | | | | | Billions | | Millions | |
| | | | | | | | | |
Colorado | | 9.0 | % | 12.2 | %* | $ | 3.9 | | $ | 19 | |
Minnesota | | 9.3 | | 9.0 | | 3.3 | | 16 | |
Texas | | 7.5 | | NA | | 0.8 | | 4 | |
| | | | | | | | | | | |
* Effective July 1, 2003 Public Service of Colorado implemented a $33 million reduction in gas base rates
** Assuming 50% common equity
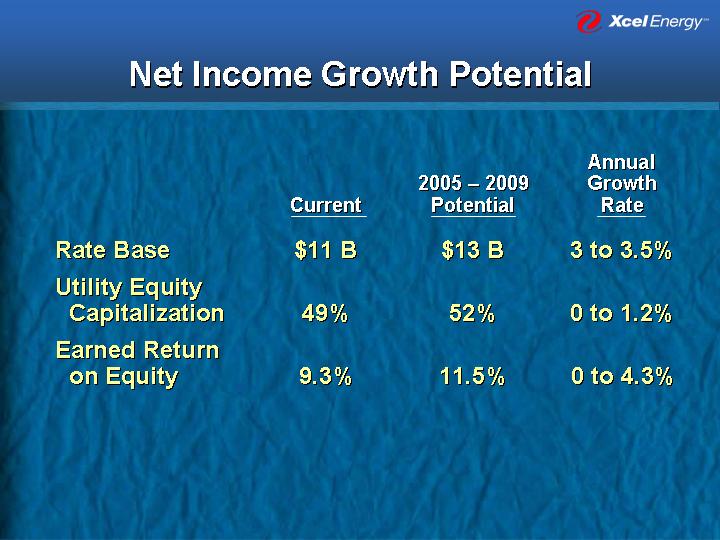
Net Income Growth Potential
| | Current | | 2005 – 2009
Potential | | Annual
Growth
Rate | |
| | | | | | | |
Rate Base | | $ | 11B | | $ | 13B | | 3 to 3.5% | |
| | | | | | | |
Utility Equity Capitalization | | 49 | % | 52 | % | 0 to 1.2% | |
| | | | | | | |
Earned Return on Equity | | 9.3 | % | 11.5 | % | 0 to 4.3% | |
| | | | | | | | | |
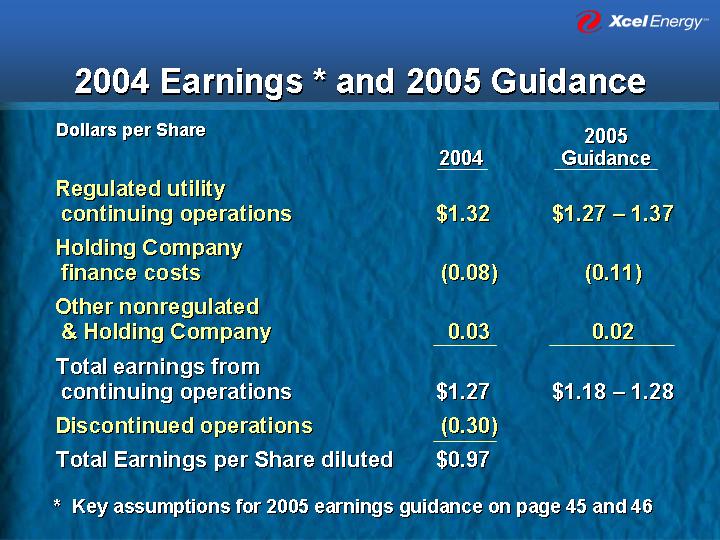
2004 Earnings * and 2005 Guidance
Dollars per Share
| | 2004 | | 2005
Guidance | |
| | | | | |
Regulated utility continuing operations | | $ | 1.32 | | $1.27 – 1.37 | |
Holding Company finance costs | | (0.08 | ) | (0.11) | |
Other nonregulated & Holding Company | | 0.03 | | 0.02 | |
Total earnings from continuing operations | | $ | 1.27 | | $1.18 – 1.28 | |
Discontinued operations | | (0.30 | ) | | |
Total Earnings per Share diluted | | $ | 0.97 | | | |
* Key assumptions for 2005 earnings guidance on page 45 and 46
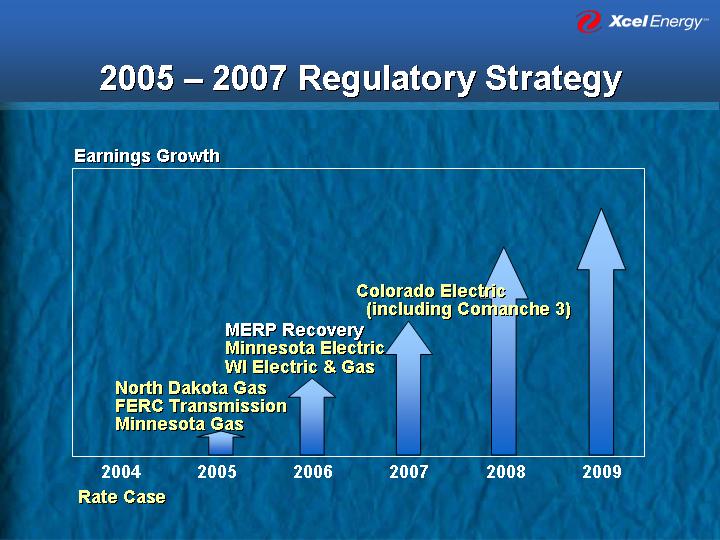
2005 – 2007 Regulatory Strategy
[CHART]
Dividend Objective
• Annual dividend rate of 83 cents
• Review dividend — Spring 2005
• Annual dividend increases consistent with long-term earnings growth
[GRAPHIC]
Regulatory Accomplishments
• Minnesota MERP approved
• Comanche 3 approved
• Monthly gas cost adjustment approved in Colorado
• Capacity cost adjustment approved in Colorado
• Increased equity approved to bolster PSCo credit rating
[GRAPHIC]
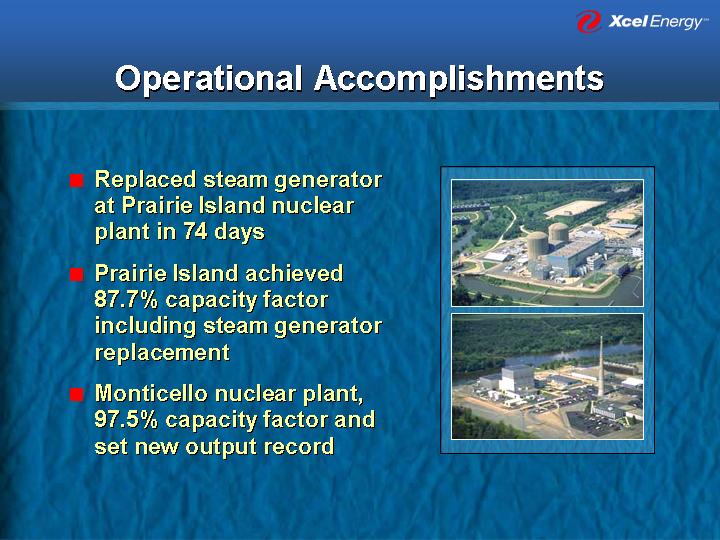
Operational Accomplishments
• Replaced steam generator at Prairie Island nuclear plant in 74 days
• Prairie Island achieved 87.7% capacity factor including steam generator replacement
• Monticello nuclear plant, 97.5% capacity factor and set new output record
[GRAPHIC]
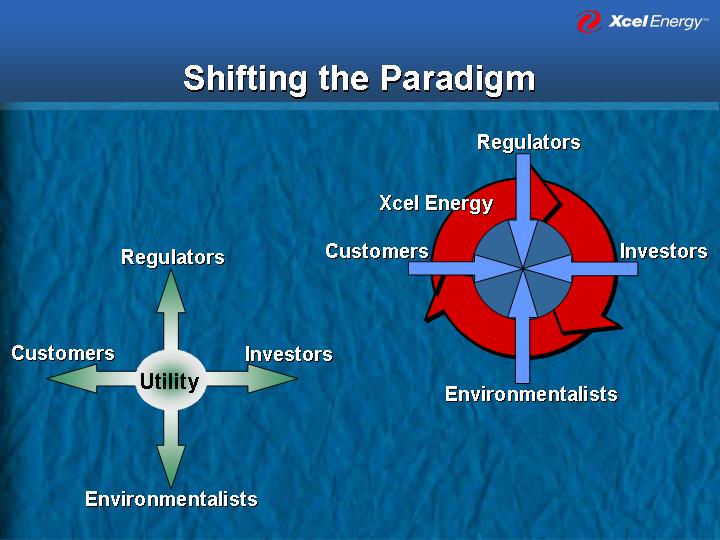
Shifting the Paradigm
[GRAPHIC]
[GRAPHIC]
Appendix
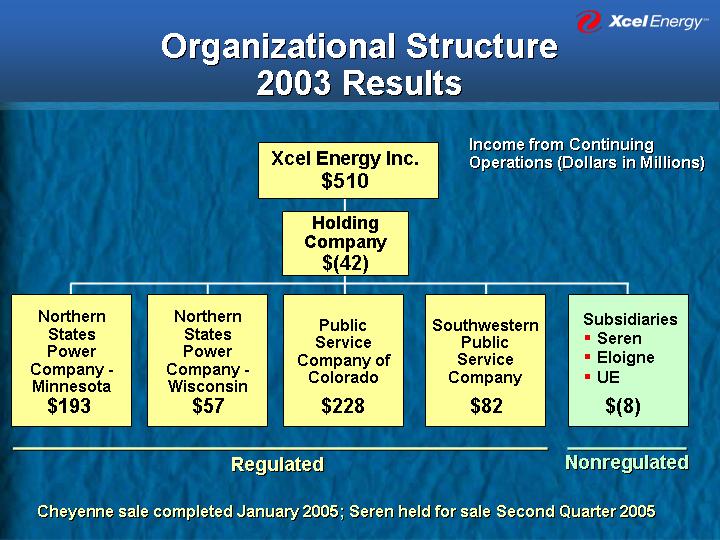
Organizational Structure
2003 Results
| | | | | | Income from Continuing
Operations (Dollars in Millions) |
| | | | | | | | |
| | | | Xcel Energy Inc.
$510 | | | | |
| | | | | | | | |
| | | | Holding
Company
$(42) | | | | |
| | | | | | | | |
Northern
States
Power
Company -
Minnesota
$193 | | Northern
States
Power
Company -
Wisconsin
$57 | | Public
Service
Company of
Colorado
$228 | | Southwestern
Public Service
Company
$82 | | Subsidiaries • Seren • Eloigne • UE $(8) |
| | | | | | | | |
Regulated | | Nonregulated |
Cheyenne sale completed January 2005; Seren held for sale Second Quarter 2005
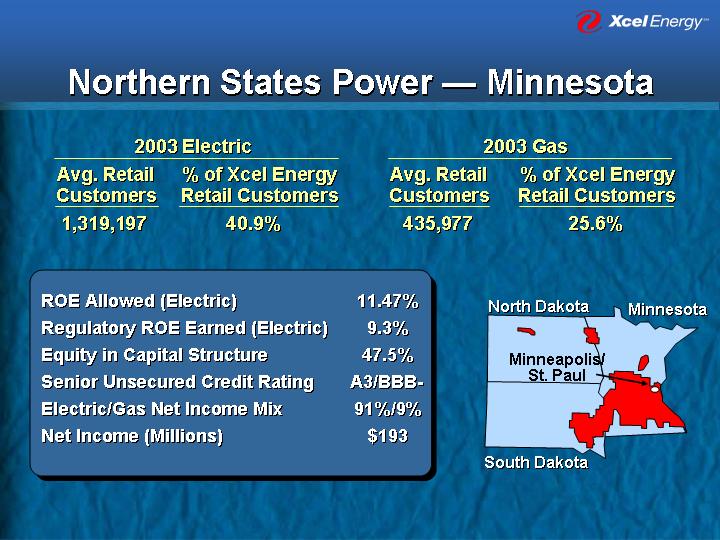
Northern States Power — Minnesota
2003 Electric | | 2003 Gas | |
Avg. Retail
Customers | | % of Xcel Energy
Retail Customers | | Avg. Retail
Customers | | % of Xcel Energy
Retail Customers | |
1,319,197 | | 40.9 | % | 435,977 | | 25.6 | % |
ROE Allowed (Electric) | | 11.47 | % |
Regulatory ROE Earned (Electric) | | 9.3 | % |
Equity in Capital Structure | | 47.5 | % |
Senior Unsecured Credit Rating | | A3/BBB- | |
Electric/Gas Net Income Mix | | 91%/9 | % |
Net Income (Millions) | | $ | 193 | |
| | | | |
[GRAPHIC]
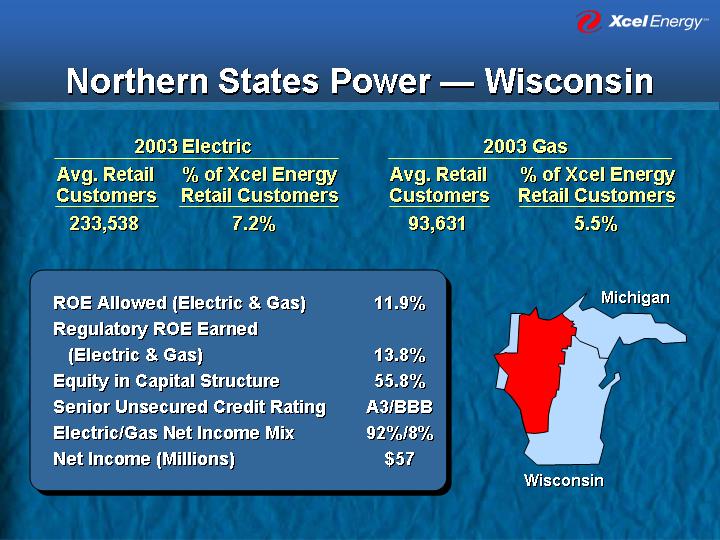
Northern States Power — Wisconsin
2003 Electric | | 2003 Gas | |
Avg. Retail
Customers | | % of Xcel Energy
Retail Customers | | Avg. Retail
Customers | | % of Xcel Energy
Retail Customers | |
233,538 | | 7.2 | % | 93,631 | | 5.5 | % |
ROE Allowed (Electric & Gas) | | 11.9 | % |
Regulatory ROE Earned (Electric & Gas) | | 13.8 | % |
Equity in Capital Structure | | 55.8 | % |
Senior Unsecured Credit Rating | | A3/BBB | |
Electric/Gas Net Income Mix | | 92%/8 | % |
Net Income (Millions) | | $ | 57 | |
| | | | |
[GRAPHIC]
Public Service Company of Colorado
2003 Electric | | 2003 Gas | |
Avg. Retail
Customers | | % of Xcel Energy
Retail Customers | | Avg. Retail
Customers | | % of Xcel Energy
Retail Customers | |
1,279,047 | | 39.7 | % | 1,174,036 | | 68.9 | % |
ROE Allowed (Electric) | | 10.75 | % |
Regulatory ROE Earned (Electric) | | 9.0 | % |
Equity in Capital Structure | | 46.5 | % |
Senior Unsecured Credit Rating | | Baa1/BBB- | |
Electric/Gas Net Income Mix | | 68%/32 | % |
Net Income (Millions) | | $ | 228 | |
| | | | |
[GRAPHIC]
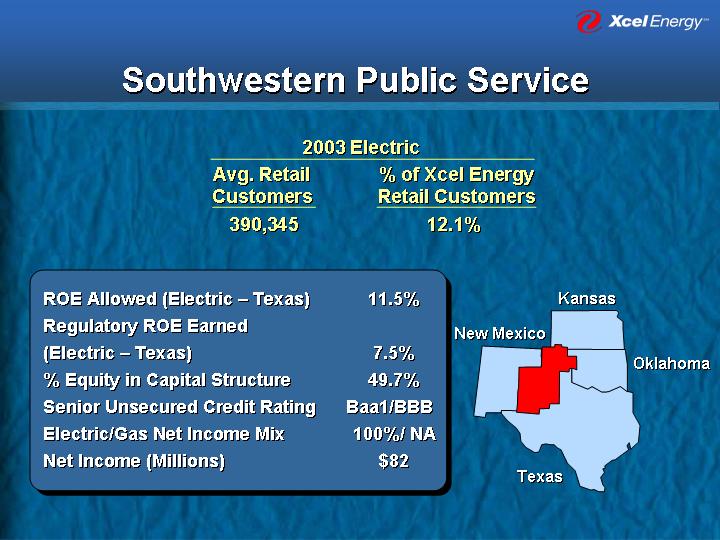
Southwestern Public Service
2003 Electric | |
Avg. Retail
Customers | | % of Xcel Energy
Retail Customers | |
390,345 | | 12.1 | % |
ROE Allowed (Electric – Texas) | | 11.5 | % |
Regulatory ROE Earned (Electric – Texas) | | 7.5 | % |
% Equity in Capital Structure | | 49.7 | % |
Senior Unsecured Credit Rating | | Baa1/BBB | |
Electric/Gas Net Income Mix | | 100%/ NA | |
Net Income (Millions) | | $ | 82 | |
| | | | |
[GRAPHIC]
Corporate Governance
Board of Directors
• 10 independent directors plus 2 management
• Rotating lead directors each quarter
• Required to own Xcel Energy stock or equivalents equal to 7 times retainer
• Repealed classified board in 2004 following shareholder proposal
Xcel Energy
• Code of conduct encompasses 23 topic areas and is applicable to all employees and directors of Xcel Energy and subsidiaries
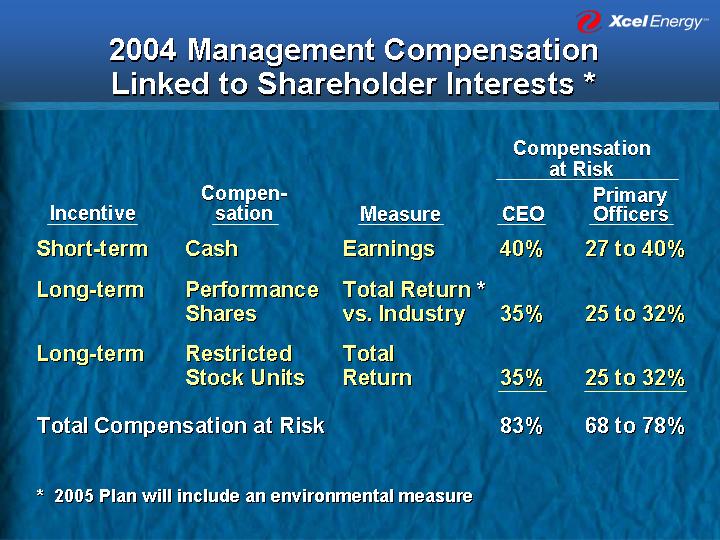
2004 Management Compensation
Linked to Shareholder Interests *
| | | | | | Compensation
at Risk | |
Incentive | | Compensation | | Measure | | CEO | | Primary
Officers | |
Short-term | | Cash | | Earnings | | 40 | % | 27 to 40 | % |
Long-term | | Performance Shares | | Total Return * vs. Industry | | 35 | % | 25 to 32 | % |
Long-term | | Restricted Stock Units | | Total Return | | 35 | % | 25 to 32 | % |
Total Compensation at Risk | | | | | | 83 | % | 68 to 78 | % |
* 2005 Plan will include an environmental measure
Environmental Initiatives
• Reduce and manage energy consumption
• Reduce our environmental impact
• Increase use of renewable energies
• Advocate public policies that achieve environmental improvement, regulatory certainty and cost effective energy
• Protect wildlife
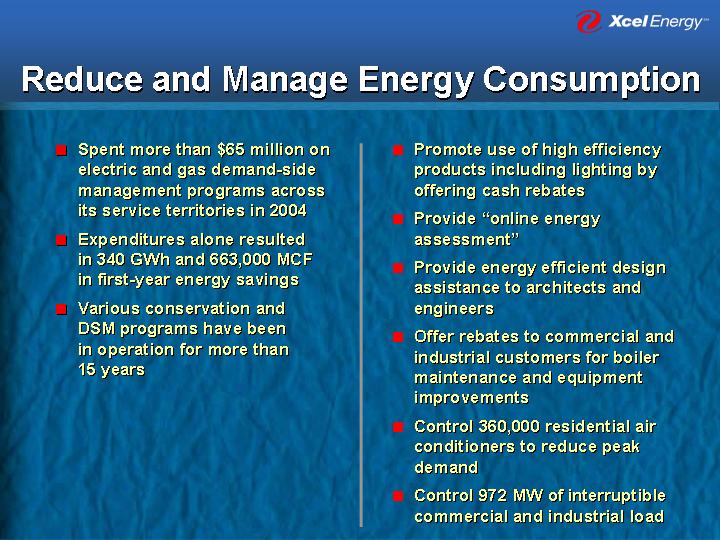
Reduce and Manage Energy Consumption
• | Spent more than $65 million on electric and gas demand-side management programs across its service territories in 2004 | | • | Promote use of high efficiency products including lighting by offering cash rebates |
| | | | |
• | Expenditures alone resulted in 340 GWh and 663,000 MCF in first-year energy savings | | • | Provide “online energy assessment” |
| | | | |
• | Various conservation and DSM programs have been in operation for more than 15 years | | • | Provide energy efficient design assistance to architects and engineers |
| | | | |
| | | • | Offer rebates to commercial and industrial customers for boiler maintenance and equipment improvements |
| | | | |
| | | • | Control 360,000 residential air conditioners to reduce peak demand |
| | | | |
| | | • | Control 972 MW of interruptible commercial and industrial load |
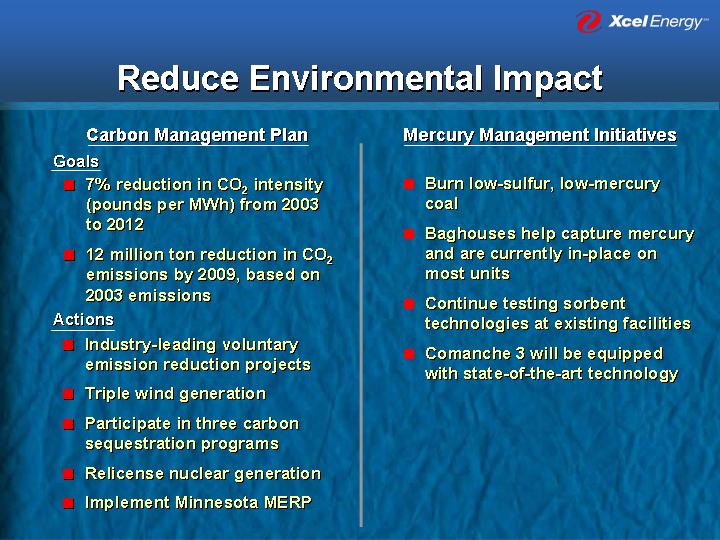
Reduce Environmental Impact
| Carbon Management Plan | | | Mercury Management Initiatives |
| | | | |
Goals | | | |
| | | | |
• | 7% reduction in CO2 intensity (pounds per MWh) from 2003 to 2012 | | • | Burn low-sulfur, low-mercury coal |
| | | | |
• | 12 million ton reduction in CO2 emissions by 2009, based on 2003 emissions | | • | Baghouses help capture mercury and are currently in-place on most units |
| | | | |
Actions | | • | Continue testing sorbent technologies at existing facilities |
| | | | |
• | Industry-leading voluntary emission reduction projects | | • | Comanche 3 will be equipped with state-of-the-art technology |
| | | | |
• | Triple wind generation | | | |
| | | | |
• | Participate in three carbon sequestration programs | | | |
| | | | |
• | Relicense nuclear generation | | | |
| | | | |
• | Implement Minnesota MERP | | | |
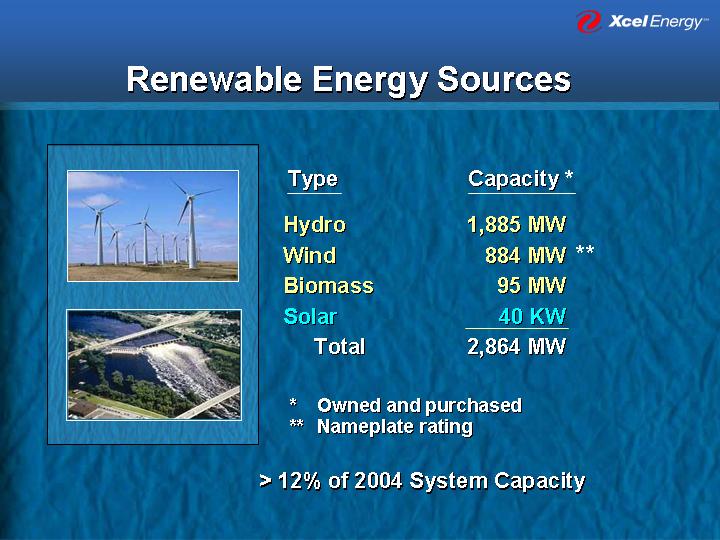
Renewable Energy Sources
[GRAPHIC]
Type | | Capacity * | |
| | | |
Hydro | | 1,885 MW | |
Wind | | 884 MW | ** |
Biomass | | 95 MW | |
Solar | | 40 KW | |
Total | | 2,864 MW | |
* Owned and purchased
** Nameplate rating
> 12% of 2004 System Capacity
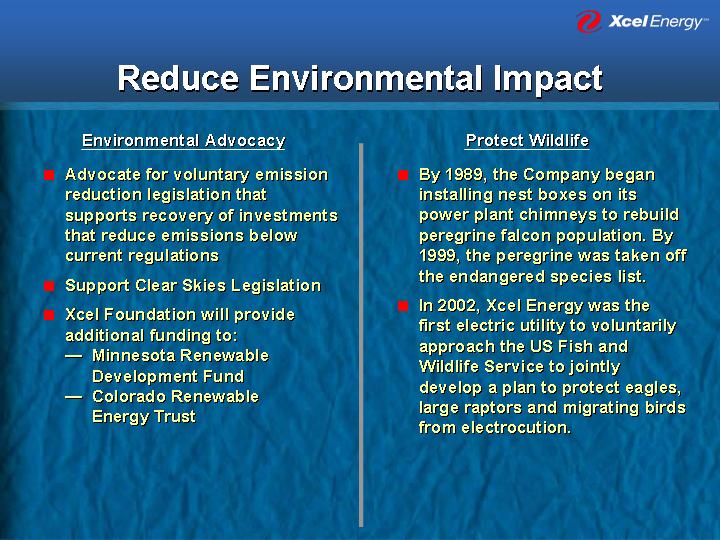
Reduce Environmental Impact
| Environmental Advocacy | | | Protect Wildlife |
| | | | |
• | Advocate for voluntary emission reduction legislation that supports recovery of investments that reduce emissions below current regulations | | • | By 1989, the Company began installing nest boxes on its power plant chimneys to rebuild peregrine falcon population. By 1999, the peregrine was taken off the endangered species list. |
| | | | |
• | Support Clear Skies Legislation | | | |
| | | | |
• | Xcel Foundation will provide additional funding to: | | • | In 2002, Xcel Energy was the first electric utility to voluntarily approach the US Fish and Wildlife Service to jointly develop a plan to protect eagles, large raptors and migrating birds from electrocution. |
| • | Minnesota Renewable Development Fund |
| • | Colorado Renewable Energy Trust |
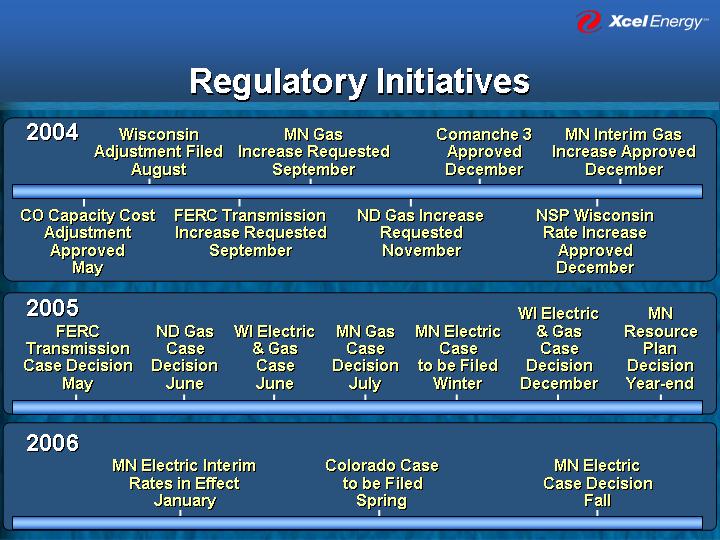
Regulatory Initiatives
2004
Wisconsin | | MN Gas | | Comanche 3 | | MN Interim Gas |
Adjustment Filed | | Increase Requested | | Approved | | Increase Approved |
August | | September | | December | | December |
| | | | | | |
CO Capacity Cost | | FERC Transmission | | ND Gas Increase | | NSP Wisconsin |
Adjustment | | Increase Requested | | Requested | | Rate Increase |
Approved | | September | | November | | Approved |
May | | | | | | December |
2005
| | | | | | | | | | WI Electric | | MN |
FERC | | ND Gas | | WI Electric | | MN Gas | | MN Electric | | & Gas | | Resource |
Transmission | | Case | | & Gas | | Case | | Case | | Case | | Plan |
Case Decision | | Decision | | Case | | Decision | | to be Filed | | Decision | | Decision |
May | | June | | June | | July | | Winter | | December | | Year-end |
2006
MN Electric Interim | | Colorado Case | | MN Electric |
Rates in Effect | | to be Filed | | Case Decision |
January | | Spring | | Fall |
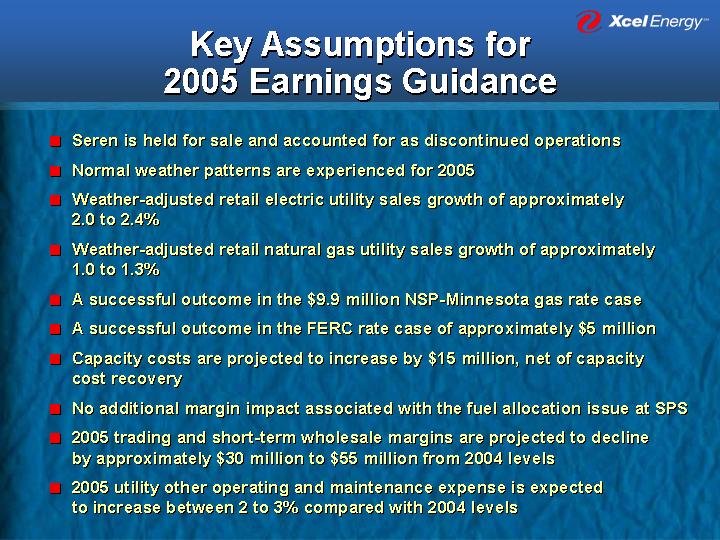
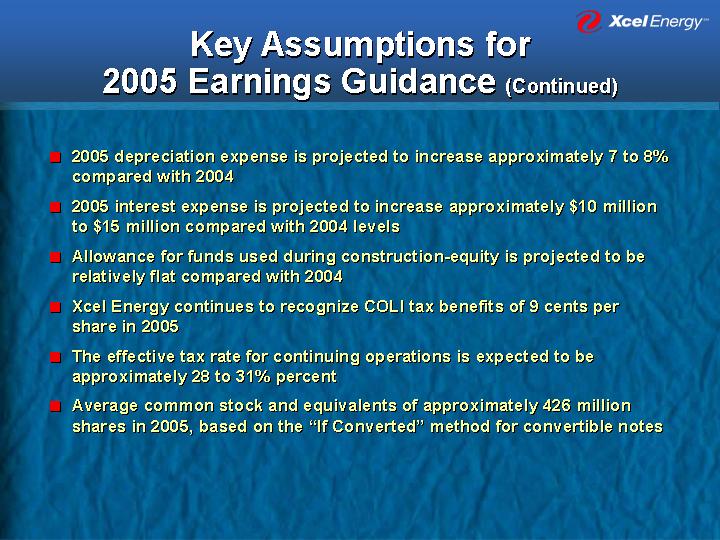
Key Assumptions for
2005 Earnings Guidance
• Seren is held for sale and accounted for as discontinued operations
• Normal weather patterns are experienced for 2005
• Weather-adjusted retail electric utility sales growth of approximately 2.0 to 2.4%
• Weather-adjusted retail natural gas utility sales growth of approximately 1.0 to 1.3%
• A successful outcome in the $9.9 million NSP-Minnesota gas rate case
• A successful outcome in the FERC rate case of approximately $5 million
• Capacity costs are projected to increase by $15 million, net of capacity cost recovery
• No additional margin impact associated with the fuel allocation issue at SPS
• 2005 trading and short-term wholesale margins are projected to decline by approximately $30 million to $55 million from 2004 levels
• 2005 utility other operating and maintenance expense is expected to increase between 2 to 3% compared with 2004 levels
• 2005 depreciation expense is projected to increase approximately 7 to 8% compared with 2004
• 2005 interest expense is projected to increase approximately $10 million to $15 million compared with 2004 levels
• Allowance for funds used during construction-equity is projected to be relatively flat compared with 2004
• Xcel Energy continues to recognize COLI tax benefits of 9 cents per share in 2005
• The effective tax rate for continuing operations is expected to be approximately 28 to 31% percent
• Average common stock and equivalents of approximately 426 million shares in 2005, based on the “If Converted” method for convertible notes
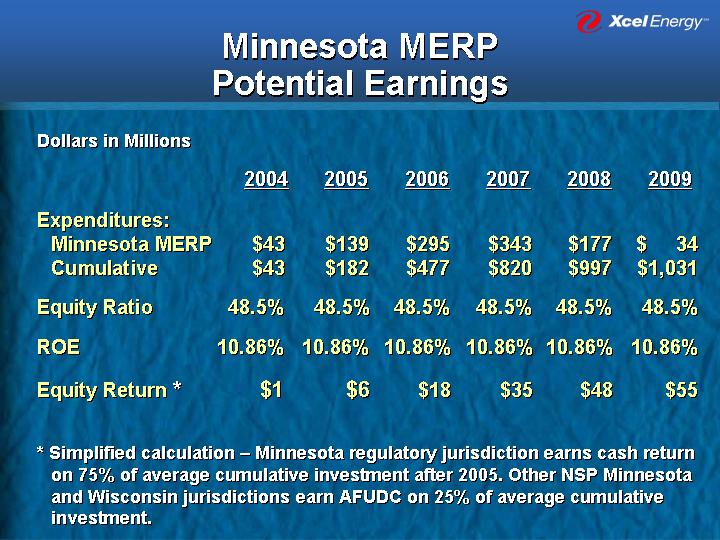
Minnesota MERP
Potential Earnings
Dollars in Millions
| | 2004 | | 2005 | | 2006 | | 2007 | | 2008 | | 2009 | |
| | | | | | | | | | | | | |
Expenditures: | | | | | | | | | | | | | |
Minnesota MERP | | $ | 43 | | $ | 139 | | $ | 295 | | $ | 343 | | $ | 177 | | $ | 34 | |
Cumulative | | $ | 43 | | $ | 182 | | $ | 477 | | $ | 820 | | $ | 997 | | $ | 1,031 | |
| | | | | | | | | | | | | |
Equity Ratio | | 48.5 | % | 48.5 | % | 48.5 | % | 48.5 | % | 48.5 | % | 48.5 | % |
| | | | | | | | | | | | | |
ROE | | 10.86 | % | 10.86 | % | 10.86 | % | 10.86 | % | 10.86 | % | 10.86 | % |
| | | | | | | | | | | | | |
Equity Return * | | $ | 1 | | $ | 6 | | $ | 18 | | $ | 35 | | $ | 48 | | $ | 55 | |
| | | | | | | | | | | | | | | | | | | | |
* Simplified calculation – Minnesota regulatory jurisdiction earns cash return on 75% of average cumulative investment after 2005. Other NSP Minnesota and Wisconsin jurisdictions earn AFUDC on 25% of average cumulative investment.
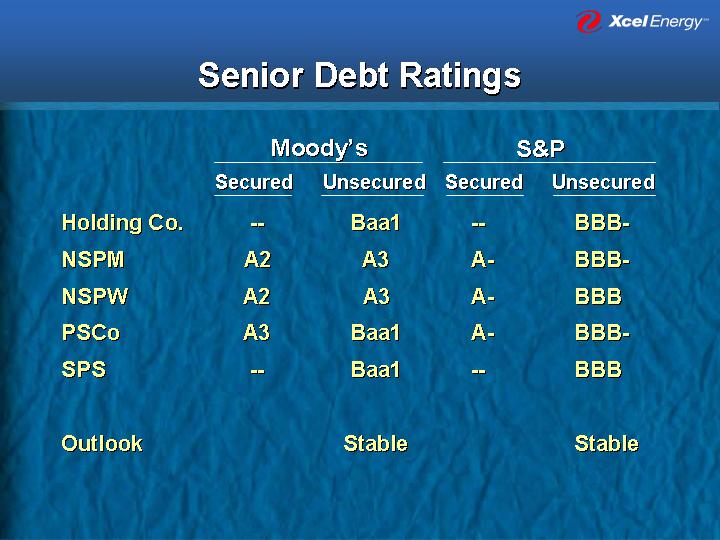
Senior Debt Ratings
| | Moody’s | | S&P | |
| | Secured | | Unsecured | | Secured | | Unsecured | |
| | | | | | | | | |
Holding Co. | | — | | Baa1 | | — | | BBB- | |
| | | | | | | | | |
NSPM | | A2 | | A3 | | A- | | BBB- | |
| | | | | | | | | |
NSPW | | A2 | | A3 | | A- | | BBB | |
| | | | | | | | | |
PSCo | | A3 | | Baa1 | | A- | | BBB- | |
| | | | | | | | | |
SPS | | — | | Baa1 | | — | | BBB | |
| | | | | | | | | |
Outlook | | | | Stable | | | | Stable | |
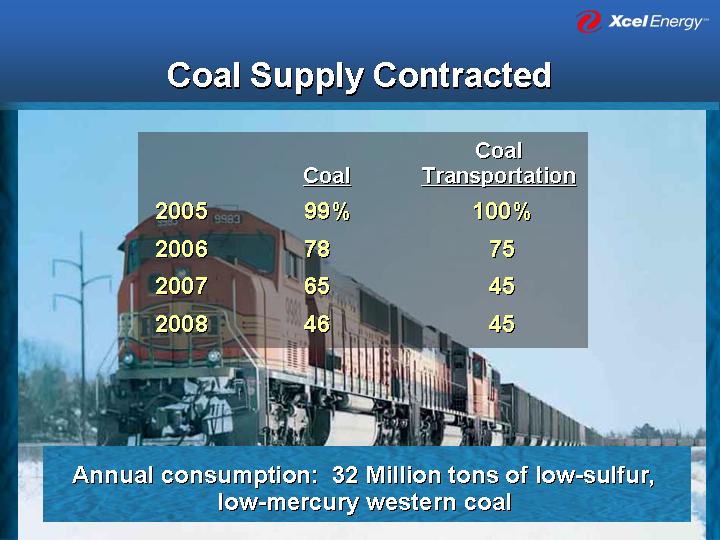
Coal Supply Contracted
[GRAPHIC]
| | Coal | | Coal
Transportation | |
| | | | | |
2005 | | 99 | % | 100 | % |
| | | | | |
2006 | | 78 | | 75 | |
| | | | | |
2007 | | 65 | | 45 | |
| | | | | |
2008 | | 46 | | 45 | |
Annual consumption: 32 Million tons of low-sulfur, low-mercury western coal
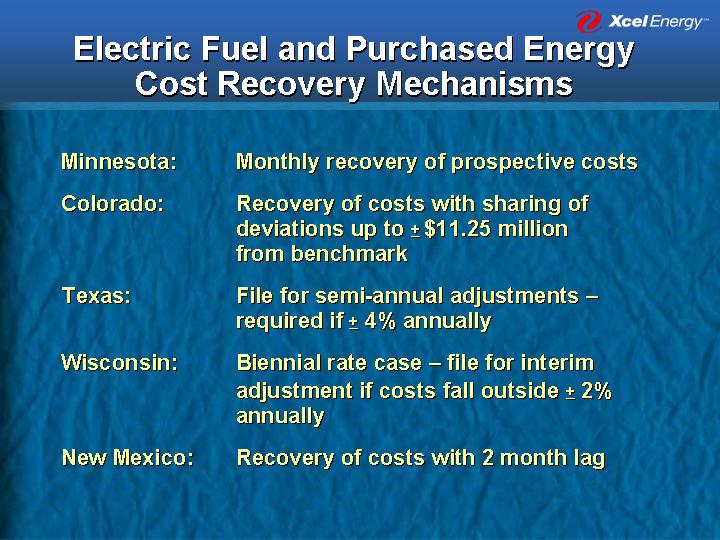
Electric Fuel and Purchased Energy
Cost Recovery Mechanisms
Minnesota: | | Monthly recovery of prospective costs |
| | |
Colorado: | | Recovery of costs with sharing of deviations up to + $11.25 million from benchmark |
| | |
Texas: | | File for semi-annual adjustments – required if + 4% annually |
| | |
Wisconsin: | | Biennial rate case – file for interim adjustment if costs fall outside + 2% annually |
| | |
New Mexico: | | Recovery of costs with 2 month lag |