Searchable text section of graphics shown above
[GRAPHIC]
Boston Investor Meetings
August 30 – September 1, 2005
Safe Harbor
This material includes forward-looking statements that are subject to certain risks, uncertainties and assumptions. Such forward-looking statements include projected earnings, cash flows, capital expenditures and other statements and are identified in this document by the words “anticipate,” “estimate,” “expect,” “projected,” “objective,” “outlook,” “possible,” “potential” and similar expressions. Actual results may vary materially. Factors that could cause actual results to differ materially include, but are not limited to: general economic conditions, including the availability of credit, actions of rating agencies and their impact on capital expenditures; business conditions in the energy industry; competitive factors; unusual weather; effects of geopolitical events, including war and acts of terrorism; changes in federal or state legislation; regulation; final approval and implementation of the pending settlement of the securities, ERISA and derivative litigation; costs and other effects of legal administrative proceedings, settlements, investigations and claims; actions of accounting regulatory bodies; risks associated with the California power market; the higher degree of risk associated with Xcel Energy’s nonregulated businesses compared with Xcel Energy’s regulated business; and other risk factors listed from time to time by Xcel Energy in reports filed with the SEC, including Exhibit 99.01 to Xcel Energy’s report on Form 10-K for year 2004.
Strategy — Building the Core
Invest in utility assets
AND
Earn our allowed return on equity
[GRAPHIC]
Drivers to Value Creation
| | | Earn Authorized |
| | | Return |
| | | [GRAPHIC] |
| | Increase | |
| | Equity | |
| | [GRAPHIC] | |
| Increase | | |
| Investment | | |
| [GRAPHIC] | | |
Service | | | |
Territory Growth | | | |
[GRAPHIC] | | | |
Capital Expenditure Plan
• Prudent
• Have regulatory, legislative and environmental support
• Manageable
• Add to earnings growth
• Deliver stronger credit metrics
Regulatory, Legislative and Environmental Support
• Minnesota MERP rider
• Comanche 3 decision — Forward CWIP and higher equity
• Minnesota and Texas transmission investment legislation
Capital Expenditure Forecast
Dollar in Millions
| | 2005 | | 2006 | | 2007 | | 2008 | | 2009 | |
Minnesota MERP | | $ | 191 | | $ | 404 | | $ | 197 | | $ | 125 | | $ | 56 | |
Comanche 3 | | 59 | | 179 | | 287 | | 298 | | 125 | |
Base level capital expenditures | | 991 | | 917 | | 1,021 | | 929 | | 1,085 | |
Total | | $ | 1,241 | | $ | 1,500 | | $ | 1,505 | | $ | 1,352 | | $ | 1,266 | |
Dollars in millions
| | 2005 | | 2006 | | 2007 | | 2008 | | 2009 | | Total | |
Total | | $ | 1,241 | | $ | 1,500 | | $ | 1,505 | | $ | 1,352 | | $ | 1,266 | | $ | 6,864 | |
| | | | | | | | | | | | | | | | | | | |
| | Anticipated Annual Growth in Average Rate Base | |
| | 2005 | | 2006 | | 2007 | | 2008 | | 2009 | | Average
Annual | |
2004 Rate base $10.5 billion | | 4 | % | 4 | % | 7 | % | 5 | % | 2 | % | 4.4 | % |
Sources of Funding
• Growing cash from operations
• Tax loss carry-forward
• Proceeds from asset sales
• Financing:
• Dividend reinvestment program
• Modest debt issuance
• No equity issuance necessary through 2006
• Uncertain whether there is a need for public equity issuance in 2007 or 2008
NSP — Minnesota Rate Cases
North Dakota Gas | | Approved June | | $0.7 million increase |
| | | | |
Minnesota Gas | | Approved July
10.4% ROE | | $5.8 million increase |
| | | | |
Minnesota Electric | | To be filed Winter 2005 2006 test year | | |
| | Interim rates early 2006 | | |
| | Decision Summer 2006 | | |
| | | | |
North Dakota Electric | | To be filed Winter 2005 | | |
| | Interim rates early 2006 | | |
| | Decision Summer 2006 | | |
| | | | |
South Dakota Electric | | To be filed mid-2006 | | |
| | Decision 2007 | | |
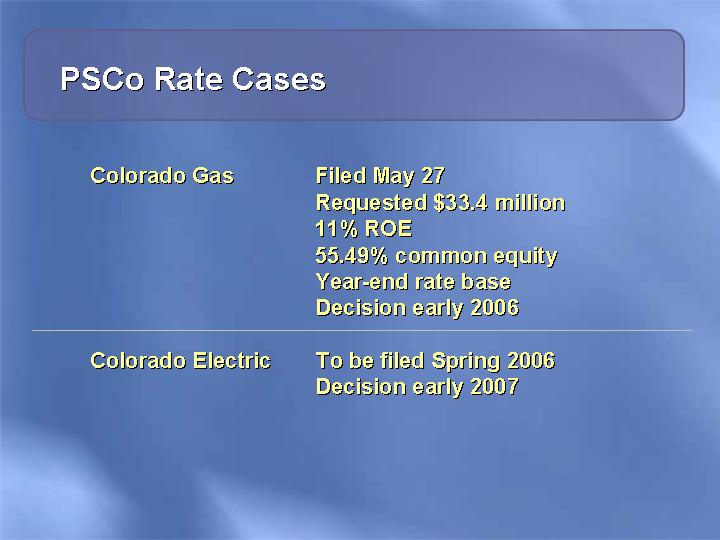
PSCo Rate Cases
Colorado Gas | | Filed May 27 |
| | Requested $33.4 million |
| | 11% ROE |
| | 55.49% common equity |
| | Year-end rate base |
| | Decision early 2006 |
| | |
Colorado Electric | | To be filed Spring 2006 |
| | Decision early 2007 |
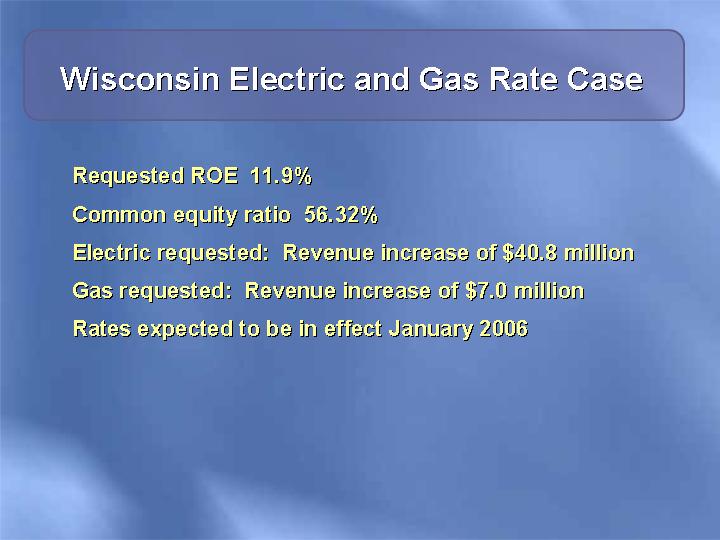
Wisconsin Electric and Gas Rate Case
Requested ROE 11.9%
Common equity ratio 56.32%
Electric requested: Revenue increase of $40.8 million
Gas requested: Revenue increase of $7.0 million
Rates expected to be in effect January 2006
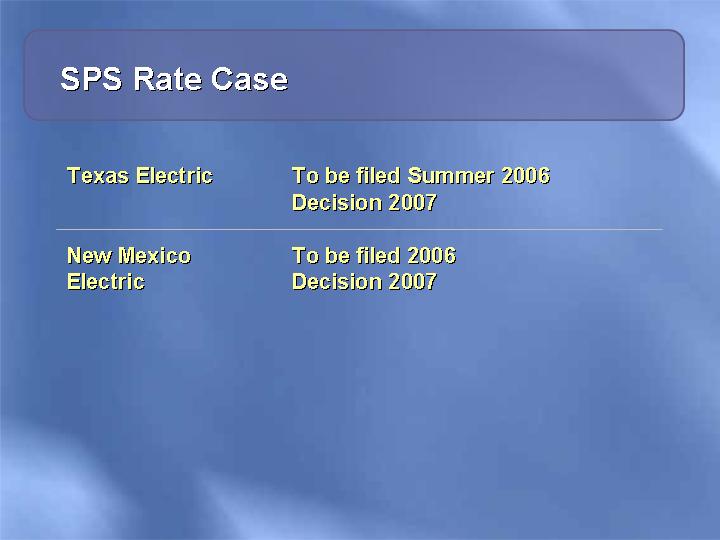
SPS Rate Case
Texas Electric | | To be filed Summer 2006 |
| | Decision 2007 |
| | |
New Mexico Electric | | To be filed 2006 |
| | Decision 2007 |
Potential Regulatory Income and Depreciation*
| | 2004 | | Potential Result
2009 | |
| | | | | |
Average rate base | | $ | 10.5 | B | $13 B | |
Regulatory equity ratio | | 50.4 | % | 50 – 52% | |
Equity rate base | | $ | 5.3 | B | $6.5 – 6.76 B | |
Regulatory return on equity | | 9.6 | % | 10 – 11% | |
Regulatory net income | | $ | 506 | M | $650 – $744 M** | |
Depreciation – Cash flow | | $ | 735 | M | $910 M*** | |
Potential regulatory net income and depreciation from regulated operations | | $ | 1,241 | M | $1,560 – $1,654 M | |
* All figures except 2004 depreciation are on an estimated regulatory basis, which differs from GAAP reporting. A reconciliation from GAAP reporting is shown in the appendix.
** Calculated by multiplying equity rate base by regulatory return on equity.
*** Assumes depreciation grows at the same rate as rate base.
Regulatory Net Income Growth Potential
| | 2004 | | 2005 – 2009
Potential | | Annual
Growth
Rate | |
| | | | | | | |
Rate base | | $ | 10.5 | B | $13 B | | 4.4% | |
Utility equity capitalization | | 50 | % | 50 – 52% | | 0 to 0.8% | |
Earned return on utility rate base equity | | 9.7 | % | 10 – 11% | | 0 to 2.6% | |
Total potential growth | | | | | | 4.4 to 7.8% | |
| | | | | | | | |
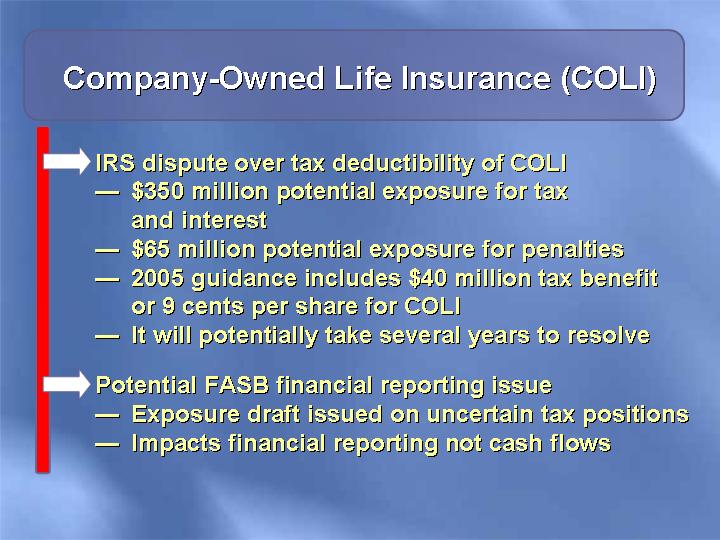
Company-Owned Life Insurance (COLI)
• IRS dispute over tax deductibility of COLI
• $350 million potential exposure for tax and interest
• $65 million potential exposure for penalties
• 2005 guidance includes $40 million tax benefit or 9 cents per share for COLI
• It will potentially take several years to resolve
• Potential FASB financial reporting issue
• Exposure draft issued on uncertain tax positions
• Impacts financial reporting not cash flows
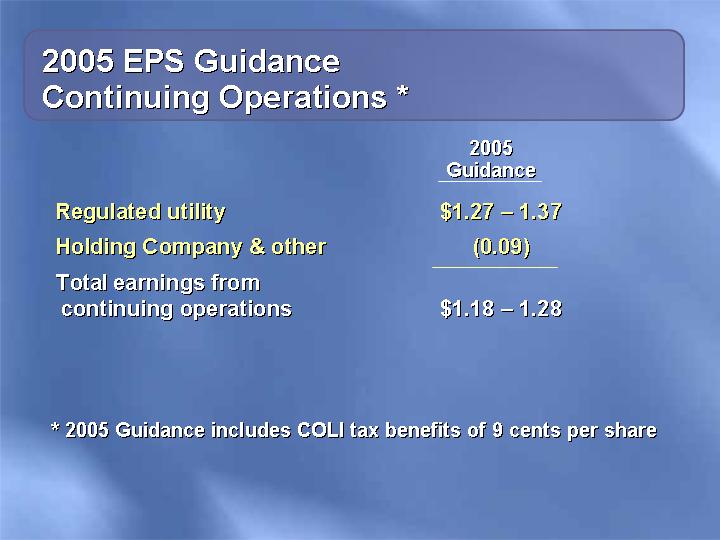
2005 EPS Guidance Continuing Operations *
| | 2005
Guidance | |
| | | |
Regulated utility | | $1.27 – 1.37 | |
Holding Company & other | | (0.09) | |
Total earnings from continuing operations | | $1.18 – 1.28 | |
* 2005 Guidance includes COLI tax benefits of 9 cents per share
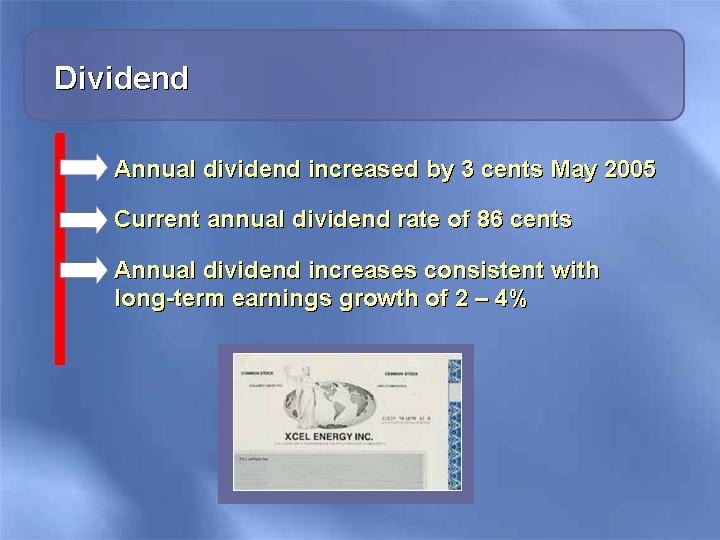
Dividend
• Annual dividend increased by 3 cents May 2005
• Current annual dividend rate of 86 cents
• Annual dividend increases consistent with long-term earnings growth of 2 – 4%
[GRAPHIC]
Transparent Low-Risk Strategy
• Constructive legislative & regulatory climate
• Strategy delivers:
• Competitive total return to shareholders
• Improving credit metrics
[LOGO]
[GRAPHIC]
4th largest US electric and gas utility — Customers:
3.3 Million Electric
1.8 Million Gas
Strong Regional
Economy
Unemployment rate — February 2005 | | | |
US | | 5.8 | % |
Xcel service area | | 4.7 | % |
| | | |
Job growth – 2005 Forecast | | | |
Xcel service area | | 2.4 | % |
| | | |
Xcel Annual sales growth — 2005-2009 | | | |
Electric | | 2.0 | % |
Gas | | 1.2 | % |
Organizational Structure 2004 Results
| Xcel Energy Inc. | Income from Continuing |
| $527 | Operations (Dollars in Millions) |
| | |
| Holding | |
| Company | |
| $(43) | |
| | |
Northern
States
Power
Company -
Minnesota | Northern
States
Power
Company -
Wisconsin | Public
Service
Company of
Colorado | Southwestern
Public
Service
Company | Subsidiaries • Eloigne • Quixx |
$230 | $54 | $218 | $55 | $13 |
| | | | |
Regulated | Nonregulated |
| | | | | | |
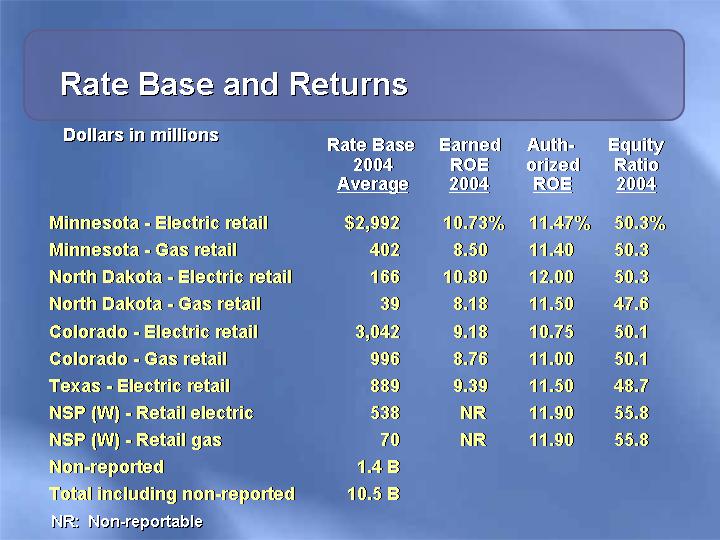
Rate Base and Returns
Dollars in millions
| | Rate Base
2004
Average | | Earned
ROE
2004 | | Authorized
ROE | | Equity
Ratio
2004 | |
| | | | | | | | | |
Minnesota - Electric retail | | $ | 2,992 | | 10.73 | % | 11.47 | % | 50.3 | % |
Minnesota - Gas retail | | 402 | | 8.50 | | 11.40 | | 50.3 | |
North Dakota - Electric retail | | 166 | | 10.80 | | 12.00 | | 50.3 | |
North Dakota - Gas retail | | 39 | | 8.18 | | 11.50 | | 47.6 | |
Colorado - Electric retail | | 3,042 | | 9.18 | | 10.75 | | 50.1 | |
Colorado - Gas retail | | 996 | | 8.76 | | 11.00 | | 50.1 | |
Texas - Electric retail | | 889 | | 9.39 | | 11.50 | | 48.7 | |
NSP (W) - Retail electric | | 538 | | NR | | 11.90 | | 55.8 | |
NSP (W) - Retail gas | | 70 | | NR | | 11.90 | | 55.8 | |
Non-reported | | 1.4 | B | | | | | | |
Total including non-reported | | 10.5 | B | | | | | | |
| | | | | | | | | | |
NR: Non-reportable
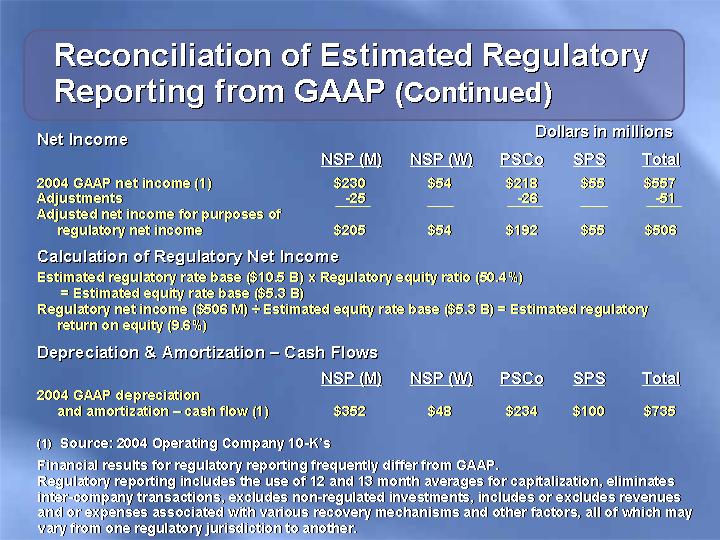
Reconciliation of Estimated Regulatory Reporting from GAAP
Common Equity
| | NSP (M) | | NSP (W) | | PSCo | | SPS | | Total | |
2004 GAAP common stockholder’s equity (1) | | $ | 2,007 | | $ | 433 | | $ | 2,287 | | $ | 781 | | $ | 5,507 | |
2003 GAAP common stockholder’s equity (1) | | 1,809 | | 425 | | 2,140 | | 814 | | 5,188 | |
Average GAAP common stockholder’s equity | | 1,908 | | 429 | | 2,213 | | 798 | | 5,348 | |
Adjustments | | -5 | | -5 | | 64 | | -11 | | 43 | |
Adjusted average equity for purposes of regulatory equity ratio | | $ | 1,903 | | $ | 424 | | $ | 2,277 | | $ | 787 | | $ | 5,391 | |
Debt
Source: 2004 Operating Company 10-K’s
| | NSP (M) | | NSP (W) | | PSCo | | SPS | | Total | |
2004 GAAP total debt (1) (2) | | $ | 2,032 | | $ | 348 | | $ | 2,502 | | $ | 861 | | $ | 5,743 | |
2003 GAAP total debt (1) (2) | | 2,003 | | 337 | | 1,845 | | 825 | | 5,010 | |
Average GAAP total debt | | 2,018 | | 342 | | 2,173 | | 843 | | 5,376 | |
Adjustments | | -140 | | -6 | | 94 | | -16 | | -68 | |
Adjusted average debt for purposes of regulatory equity ratio | | $ | 1,878 | | $ | 336 | | $ | 2,267 | | $ | 827 | | $ | 5,308 | |
| | | | | | | | | | | |
Regulatory equity ratio | | | | | | | | | | 50.4 | % |
(1) Source: 2004 Operating Company 10-K’s
(2) Consists of long-term debt, current portion of long-term debt and short-term debt
See note on the bottom of the following page for additional information
Net Income | Dollars in millions |
| | NSP (M) | | NSP (W) | | PSCo | | SPS | | Total | |
2004 GAAP net income (1) | | $ | 230 | | $ | 54 | | $ | 218 | | $ | 55 | | $ | 557 | |
Adjustments | | -25 | | | | -26 | | | | -51 | |
Adjusted net income for purposes of regulatory net income | | $ | 205 | | $ | 54 | | $ | 192 | | $ | 55 | | $ | 506 | |
Calculation of Regulatory Net Income
Estimated regulatory rate base ($10.5 B) x Regulatory equity ratio (50.4%) = Estimated equity rate base ($5.3 B)
Regulatory net income ($506 M) ÷ Estimated equity rate base ($5.3 B) = Estimated regulatory return on equity (9.6%)
Depreciation & Amortization – Cash Flows
| | NSP (M) | | NSP (W) | | PSCo | | SPS | | Total | |
2004 GAAP depreciation and
amortization – cash flow (1) | | $ | 352 | | $ | 48 | | $ | 234 | | $ | 100 | | $ | 735 | |
| | | | | | | | | | | | | | | | |
(1) Source: 2004 Operating Company 10-K’s
Financial results for regulatory reporting frequently differ from GAAP.
Regulatory reporting includes the use of 12 and 13 month averages for capitalization, eliminates inter-company transactions, excludes non-regulated investments, includes or excludes revenues and or expenses associated with various recovery mechanisms and other factors, all of which may vary from one regulatory jurisdiction to another.
Capital Expenditures $6.9 Billion 2005 – 2009
[CHART]
Capital Expenditure Forecast by Operating Company
Dollars in Millions
| | 2005 | | 2006 | | 2007 | | 2008 | | 2009 | |
| | | | | | | | | | | |
NSP-Minnesota | | $ | 645 | | $ | 832 | | $ | 713 | | $ | 571 | | $ | 605 | |
| | | | | | | | | | | | | | | | |
NSP-Wisconsin | | 60 | | 79 | | 75 | | 74 | | 68 | |
| | | | | | | | | | | |
PSCo | | 425 | | 499 | | 593 | | 591 | | 488 | |
| | | | | | | | | | | |
SPS | | 111 | | 90 | | 124 | | 116 | | 105 | |
| | | | | | | | | | | |
Total | | $ | 1,241 | | $ | 1,500 | | $ | 1,505 | | $ | 1,352 | | $ | 1,266 | |
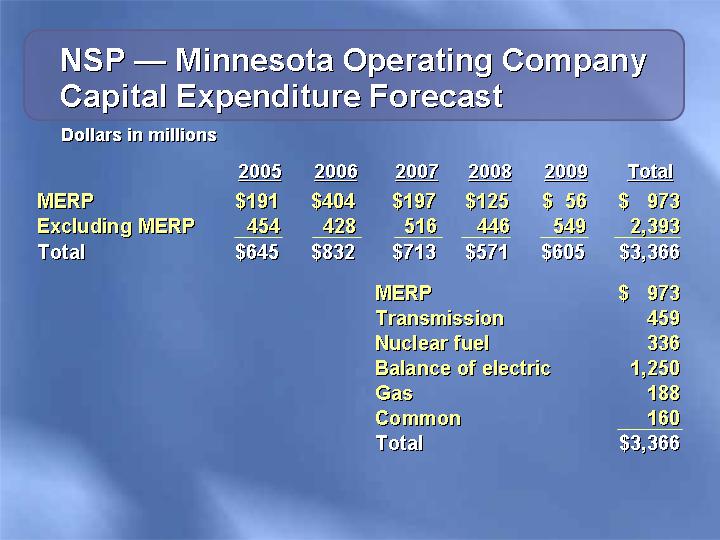
NSP — Minnesota Operating Company
Capital Expenditure Forecast
Dollars in millions
| | 2005 | | 2006 | | 2007 | | 2008 | | 2009 | | Total | |
| | | | | | | | | | | | | |
MERP | | $ | 191 | | $ | 404 | | $ | 197 | | $ | 125 | | $ | 56 | | $ | 973 | |
Excluding MERP | | 454 | | 428 | | 516 | | 446 | | 549 | | 2,393 | |
Total | | $ | 645 | | $ | 832 | | $ | 713 | | $ | 571 | | $ | 605 | | $ | 3,366 | |
MERP | | $ | 973 | |
Transmission | | 459 | |
Nuclear fuel | | 336 | |
Balance of electric | | 1,250 | |
Gas | | 188 | |
Common | | 160 | |
Total | | $ | 3,366 | |
PSCo Operating Company
Capital Expenditure Forecast
Dollars in millions
| | 2005 | | 2006 | | 2007 | | 2008 | | 2009 | | Total | |
| | | | | | | | | | | | | |
Comanche 3 | | $ | 59 | | $ | 179 | | $ | 287 | | $ | 298 | | $ | 125 | | $ | 948 | |
Excl. Comanche 3 | | 366 | | 320 | | 306 | | 293 | | 363 | | 1,648 | |
Total | | $ | 425 | | $ | 499 | | $ | 593 | | $ | 591 | | $ | 488 | | $ | 2,596 | |
Comanche 3 | | $ | 948 | |
Transmission | | 280 | |
Balance of electric | | 809 | |
Gas | | 438 | |
Common | | 98 | |
Thermal | | 16 | |
Non-utility | | 7 | |
Total | | $ | 2,596 | |
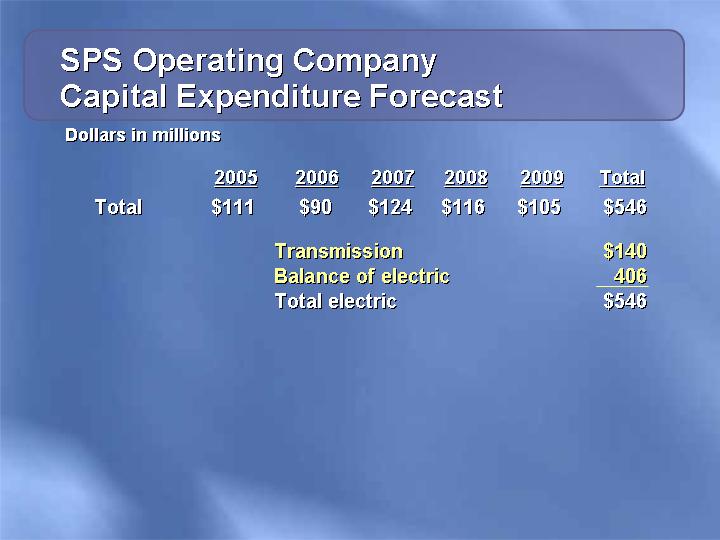
SPS Operating Company
Capital Expenditure Forecast
Dollars in millions
| | 2005 | | 2006 | | 2007 | | 2008 | | 2009 | | Total | |
| | | | | | | | | | | | | |
Total | | $ | 111 | | $ | 90 | | $ | 124 | | $ | 116 | | $ | 105 | | $ | 546 | |
| | | | | | | | | | | | | | | | | | | |
Transmission | | $ | 140 | |
Balance of electric | | 406 | |
Total electric | | $ | 546 | |
NSP — Wisconsin Operating Company
Capital Expenditure Forecast
Dollars in millions
| | 2005 | | 2006 | | 2007 | | 2008 | | 2009 | | Total | |
| | | | | | | | | | | | | |
Total | | $ | 60 | | $ | 79 | | $ | 75 | | $ | 74 | | $ | 68 | | $ | 356 | |
| | | | | | | | | | | | | | | | | | | |
Transmission | | $ | 73 | |
Balance of electric | | 200 | |
Gas | | 45 | |
Common | | 38 | |
Total | | $ | 356 | |
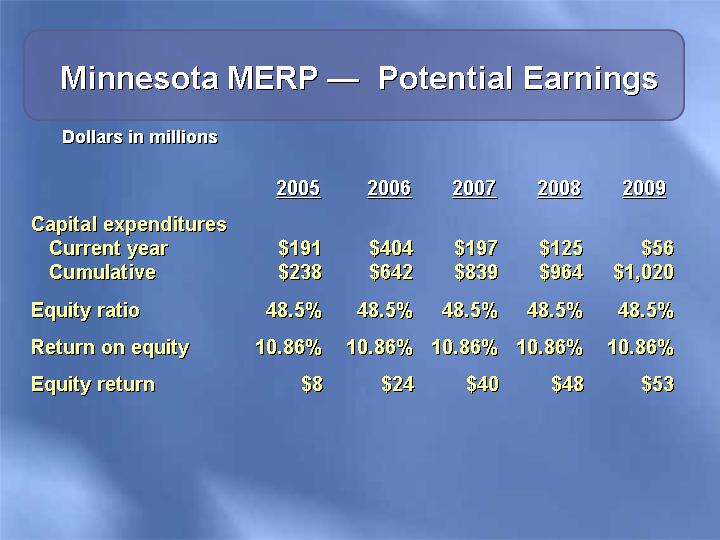
Minnesota MERP — Potential Earnings
Dollars in millions
| | 2005 | | 2006 | | 2007 | | 2008 | | 2009 | |
| | | | | | | | | | | |
Capital expenditures | | | | | | | | | | | |
Current year | | $ | 191 | | $ | 404 | | $ | 197 | | $ | 125 | | $ | 56 | |
Cumulative | | $ | 238 | | $ | 642 | | $ | 839 | | $ | 964 | | $ | 1,020 | |
| | | | | | | | | | | | | | | | |
Equity ratio | | 48.5 | % | 48.5 | % | 48.5 | % | 48.5 | % | 48.5 | % |
| | | | | | | | | | | |
Return on equity | | 10.86 | % | 10.86 | % | 10.86 | % | 10.86 | % | 10.86 | % |
| | | | | | | | | | | |
Equity return | | $ | 8 | | $ | 24 | | $ | 40 | | $ | 48 | | $ | 53 | |
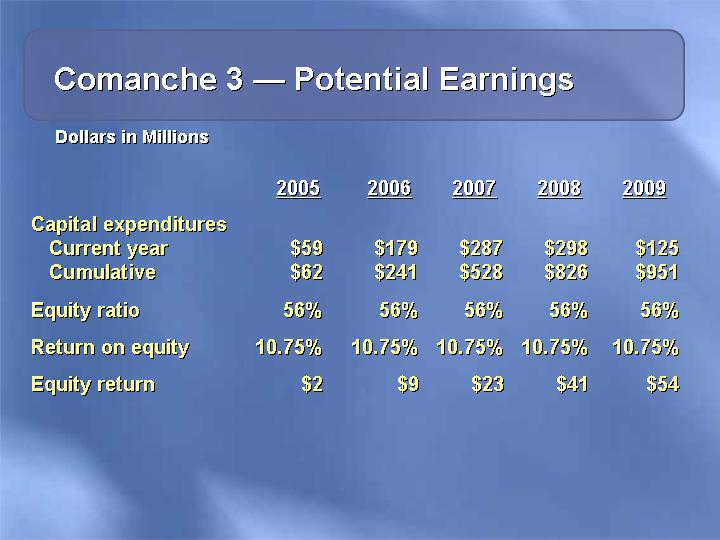
Comanche 3 — Potential Earnings
Dollars in Millions
| | 2005 | | 2006 | | 2007 | | 2008 | | 2009 | |
| | | | | | | | | | | |
Capital expenditures | | | | | | | | | | | |
Current year | | $ | 59 | | $ | 179 | | $ | 287 | | $ | 298 | | $ | 125 | |
Cumulative | | $ | 62 | | $ | 241 | | $ | 528 | | $ | 826 | | $ | 951 | |
| | | | | | | | | | | | | | | | |
Equity ratio | | 56 | % | 56 | % | 56 | % | 56 | % | 56 | % |
| | | | | | | | | | | |
Return on equity | | 10.75 | % | 10.75 | % | 10.75 | % | 10.75 | % | 10.75 | % |
| | | | | | | | | | | |
Equity return | | $ | 2 | | $ | 9 | | $ | 23 | | $ | 41 | | $ | 54 | |
Energy Supply Mix — 2004
Owned and Purchased
Fuel Mix | Purchased Energy |
| |
[CHART] | [CHART] |
* Low-sulfur, low-mercury western coal
Coal Supply Contracted
[GRAPHIC]
| | Coal | | Coal
Transportation | |
2005 | | 99 | % | 100 | % |
2006 | | 78 | | 75 | |
2007 | | 65 | | 45 | |
2008 | | 46 | | 45 | |
Annual consumption: 32 Million tons of low-sulfur, low-mercury western coal
Electric Fuel and Purchased Energy
Cost Recovery Mechanisms
Minnesota: | | Monthly recovery of prospective costs |
| | |
Colorado: | | Recovery of costs with sharing of deviations up to + $11.25 million from benchmark |
| | |
Texas: | | File for semi-annual adjustments – required if + 4% annually |
| | |
Wisconsin: | | Biennial rate case – file for interim adjustment if costs fall outside + 2% annually |
| | |
New Mexico: | | Recovery of costs with 2 month lag |
Retail Electric Rate * Comparison
[CHART]
* EEI typical bills – Summer 2004
Senior Debt Ratings
| | Moody’s | | S&P | |
| | Secured | | Unsecured | | Secured | | Unsecured | |
| | | | | | | | | |
Holding Co. | | — | | Baa1 | | — | | BBB- | |
NSPM | | A2 | | A3 | | A- | | BBB- | |
NSPW | | A2 | | A3 | | A- | | BBB | |
PSCo | | A3 | | Baa1 | | A- | | BBB- | |
SPS | | — | | Baa1 | | — | | BBB | |
| | | | | | | | | |
Outlook | | | | Stable | | | | Stable | |