Searchable text section of graphics shown above
[LOGO]
[GRAPHIC]
Edison Electric Institute
Financial Conference
November 8, 2005
[LOGO]
Safe Harbor
This material includes forward-looking statements that are subject to certain risks, uncertainties and assumptions. Such forward-looking statements include projected earnings, cash flows, capital expenditures and other statements and are identified in this document by the words “anticipate,” “estimate,” “expect,” “projected,” “objective,” “outlook,” “possible,” “potential” and similar expressions. Actual results may vary materially. Factors that could cause actual results to differ materially include, but are not limited to: general economic conditions, including the availability of credit, actions of rating agencies and their impact on capital expenditures; business conditions in the energy industry; competitive factors; unusual weather; effects of geopolitical events, including war and acts of terrorism; changes in federal or state legislation; regulation; final approval and implementation of the pending settlement of the securities, ERISA and derivative litigation; costs and other effects of legal administrative proceedings, settlements, investigations and claims including litigation related to company-owned life insurance (COLI); actions of accounting regulatory bodies; risks associated with the California power market; the higher degree of risk associated with Xcel Energy’s nonregulated businesses compared with Xcel Energy’s regulated business; and other risk factors listed from time to time by Xcel Energy in reports filed with the SEC, including Exhibit 99.01 to Xcel Energy’s report on Form 10-K for year 2004.
[GRAPHIC]
Dick Kelly
President and Chief Executive Officer
Financial Performance Objectives
• EPS growth rate 2005 - 2009
• Target 5 – 7% per year*
• Annual dividend increases
• Consistent with dividend growth objective of 2 – 4% per year
• Credit rating
• Senior unsecured debt A to BBB+
* Excluding any impact from COLI
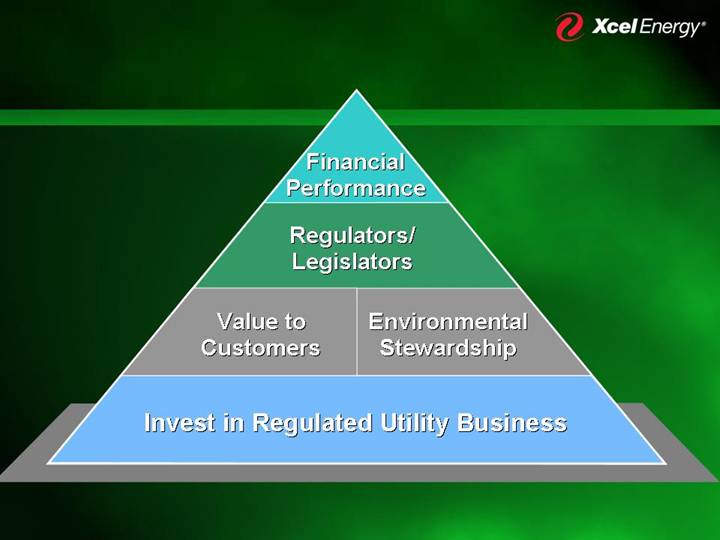
Financial
Performance |
|
Regulators/
Legislators |
|
| Value to
Customers | Environmental
Stewardship | |
| |
Invest in Regulated Utility Business |
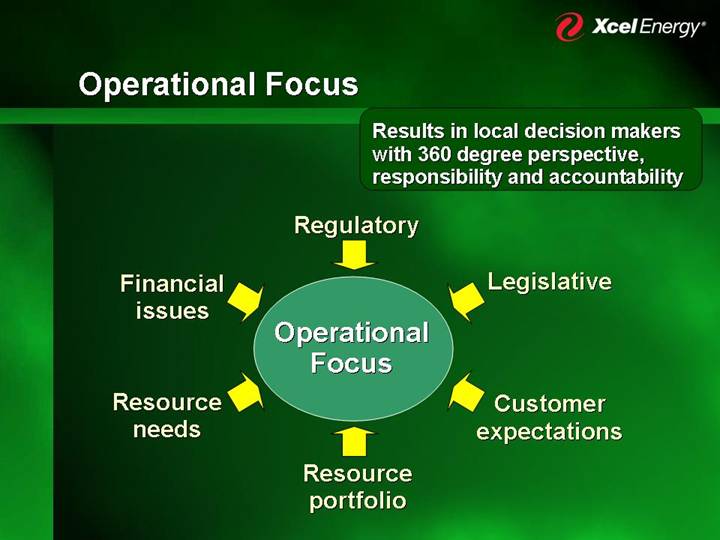
Operational Focus
Results in local decision makers with 360 degree perspective, responsibility and accountability
| | Regulatory | | | |
| | | | | |
Financial | | | | Legislative | |
issues | | | | | |
| | Operational
Focus | | | |
Resource | | | | Customer | |
needs | | | | expectations | |
| | | | | |
| | Resource | | | |
| | portfolio | | | |
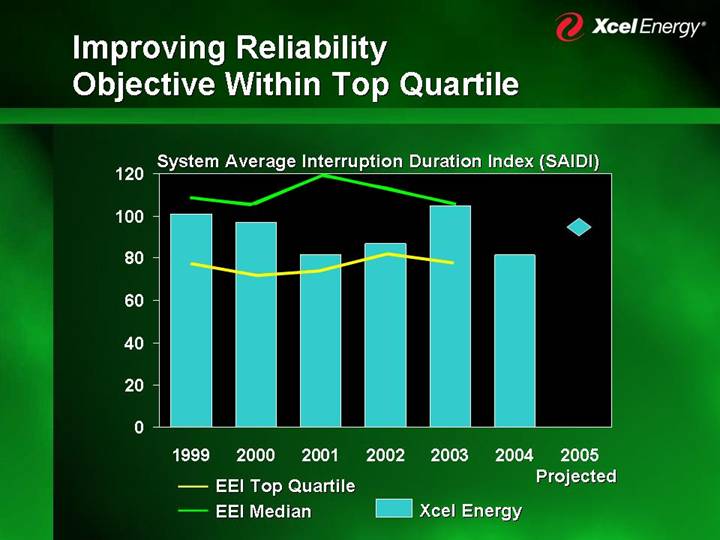
Improving Reliability
Objective Within Top Quartile
System Average Interruption Duration Index (SAIDI)
[CHART]
PSCo Quality Service Plan (QSP) Settlement
• Invest $11 million of incremental capital targeted at specific outage causes
• QSP excludes SAIDI
• Investment will be included in rate base after 2006 rate case
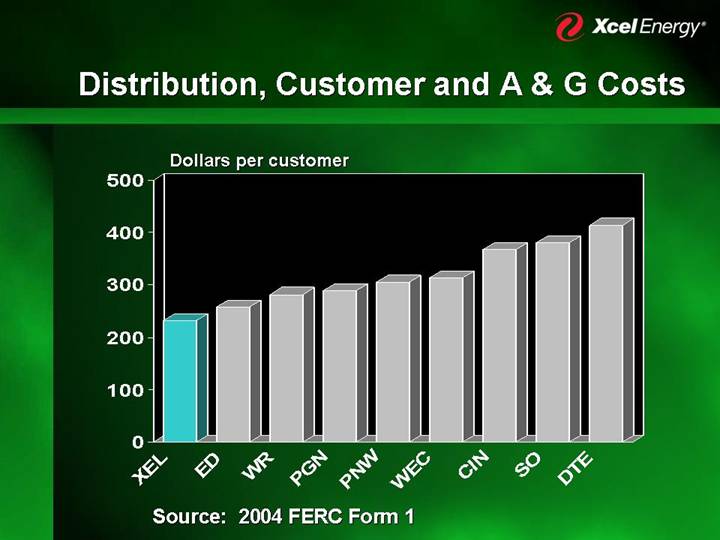
Distribution, Customer and A & G Costs
Dollars per customer
[CHART]
Source: 2004 FERC Form 1
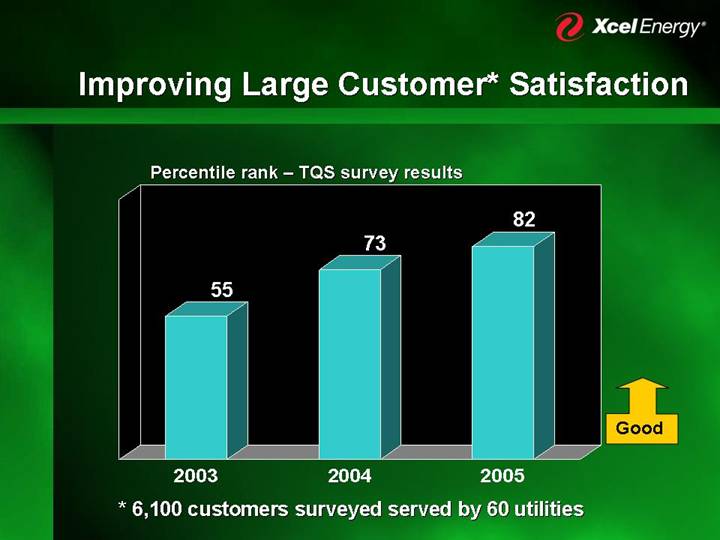
Improving Large Customer* Satisfaction
Percentile rank – TQS survey results
[CHART]
Good
* 6,100 customers surveyed served by 60 utilities
Working with Customers
• $5 million contribution to energy assistance providers
• Increased conservation and energy-saving programs promotion
• Pro-actively work with “at-risk” customers regarding community resources and offer financial assistance
• Work with community leaders, local companies and organizations to develop additional support
• Communicate extensively to provide customers with resources and information
Environmental Stewardship
• 7% of energy from renewables – 2004
• Wind generation:
• Current | | 953 | MW | |
• In-service by 2008 | | 730 | | |
• Negotiating | | 850 | | |
Total | | 2,533 | MW | |
• Partner with EPRI on high-altitude, Powder River Basin coal IGCC demonstration
• Partner with the National Renewable Energy Laboratory on wind-hydrogen demonstration
• 8 MW solar farm to be built in Colorado
CAIR and Mercury Compliance Plan
• Colorado is exempt from CAIR
• Filed suit contesting inclusion of West Texas in CAIR
• NSP SO2 credits to last through 2020
• SPS to purchase SO2 allowances
• Investment of $50 – 60 million to meet NOX standards at NSP and SPS
• PSCo expected to meet mercury reduction requirements with Comanche 3 and Comanche 1 & 2 modifications
• Testing and evaluating approaches to address mercury reduction at NSP and SPS
MERP Project Status
King | | |
• 571 MW super-critical coal retrofit and upgrade | | |
• Broke ground April 2006 | | [GRAPHIC] |
• 90% of contracts placed | | |
• Shut-down fall 2006; on-line spring 2007 | | |
| | |
High Bridge | | |
• 267 MW coal to 575 MW CCGT | | |
• All major permits received | | [GRAPHIC] |
• Site work under way | | |
• On-line late spring 2008 | | |
| | |
Riverside | | |
• 386 MW coal to 520 MW CCGT | | |
• Permitting and equipment design underway | | [GRAPHIC] |
• On-line late spring 2009 | | |
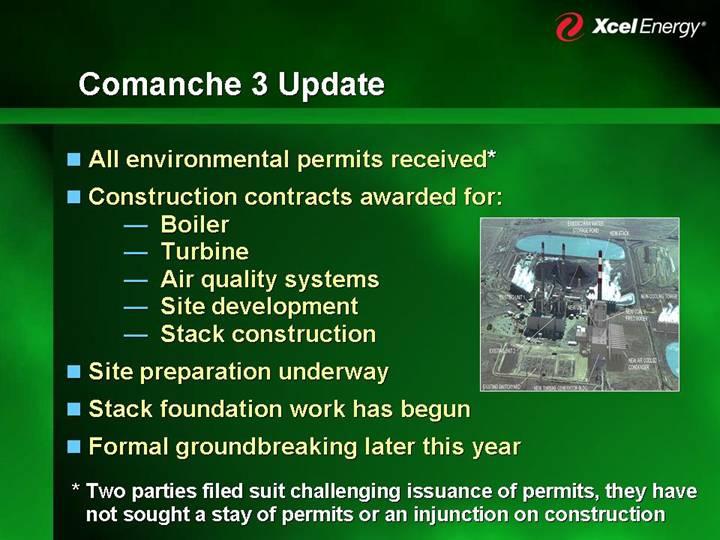
Comanche 3 Update
• All environmental permits received*
• Construction contracts awarded for:
• Boiler | | |
• Turbine | | |
• Air quality systems | | [GRAPHIC] |
• Site development | | |
• Stack construction | | |
• Site preparation underway
• Stack foundation work has begun
• Formal groundbreaking later this year
* Two parties filed suit challenging issuance of permits, they have not sought a stay of permits or an injunction on construction
Earn a Fair Return on Equity
• File rate cases
• Receive a fair return on equity
• Manage to allowed cost
• Invest in jurisdictions which provide a fair return
• File rate cases as often as necessary
Financial Overview
[GRAPHIC]
Ben Fowke
Vice President and Chief Financial Officer
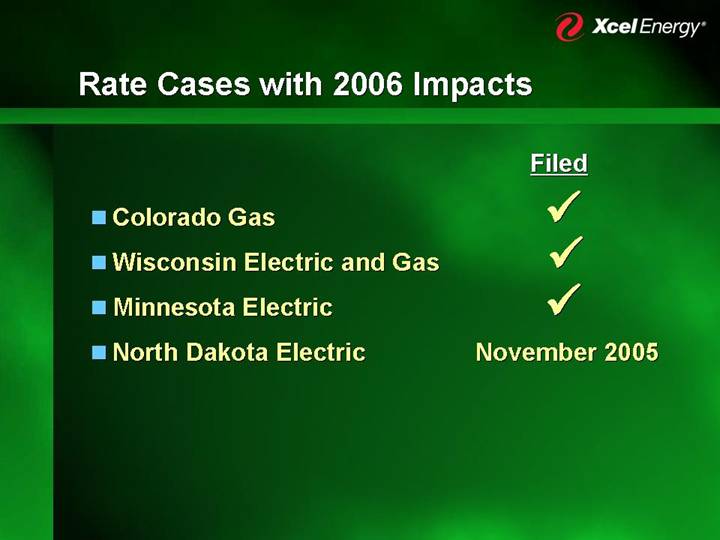
Rate Cases with 2006 Impacts
| | Filed | |
| | | |
• Colorado Gas | | ý | |
| | | |
• Wisconsin Electric and Gas | | ý | |
| | | |
• Minnesota Electric | | ý | |
| | | |
• North Dakota Electric | | November 2005 | |
PSCo Gas Rate Case
Dollars in millions
| | Case | | | | Percent | | Rate | |
| | Amount | | ROE | | Equity | | Base | |
PSCo | | $ | 34.5 | | 11.00 | % | 55.49 | % | $ | 1,030 | (1) |
| | | | | | | | | |
CPUC Staff | | $ | 8.5 | | 9.50 | % | 52.53 | % | $ | 996 | (2) |
| | | | | | | | | |
OCC | | $ | (0.2 | ) | 8.50 | % | 50.10 | % | $ | 1,003 | (2) |
(1) Historic year-end
(2) Average
Revenue requirement impact of 100 basis point change
ROE = $9 million
Percent equity = $2 million
NSP – Wisconsin Electric Rate Case
Dollars in millions
| | Case | | | | Percent | | Rate | |
| | Amount | | ROE | | Equity | | Base | |
NSP (W) | | $ | 53.1 | | 11.90 | % | 56.32 | % | $ | 553.2 | (1) |
| | | | | | | | | |
PSCW Staff | | $ | 45.4 | | 11.00 | % | 56.43 | % | $ | 551.1 | (1) |
| | | | | | | | �� | |
Industrial Group | | NP | | 10.50 | % | 51.00 | % | NP | |
| | | | | | | | | |
Department of Defense | | $ | 20.2 | | 10.25 | % | 56.32 | % | $ | 553.2 | |
(1) Forecast average
NP – No proposal
Revenue requirement impact of 100 basis point change
ROE = $5 million
Percent equity = $1 million
NSP – Wisconsin Gas Rate Case
Dollars in millions
| | Case | | | | Percent | | Rate | |
| | Amount | | ROE | | Equity | | Base | |
NSP (W) | | $ | 7.7 | | 11.90 | % | 56.32 | % | $ | 81.4 | (1) |
| | | | | | | | | |
PSCW Staff | | $ | 5.8 | | 11.00 | % | 56.43 | % | $ | 81.1 | (1) |
| | | | | | | | | |
Industrial Group | | NP | | 10.50 | % | 51.00 | % | NP | |
| | | | | | | | | |
Department of Defense | | $ | 3.3 | | 10.25 | % | 56.32 | % | $ | 77.0 | (1) |
(1) Forecast average
NP – No proposal
Revenue requirement impact of 100 basis point change
ROE = $0.7 million
Percent equity = $0.2 million
NSP – Minnesota Electric Rate Case
• Request increase of $168 million; 8.05% increase
• Rate base of $3.2 billion
• Request ROE of 11%; 51.7% equity
• Based on 2006 forecast test year
• Interim rates set at $141 million in effect January 2006, subject to refund; 6.9% increase
• Decommissioning accrual
Revenue requirement impact of 100 basis point change
ROE = $29 million
Percent equity = $4 million
Minnesota Electric Rate Case Drivers
1992 – 2004 | | | |
| | | |
Customer Growth | | 180,000 | |
| | | |
Load Growth | | 3,000 | MW |
| | | |
Added Capacity | | 580 | MW |
| | | |
Rate Reductions | | $ | 23.5 | million |
| | | | |
Residential Rate | @ | 675 KWh/month |
| | |
1993 | | 7.25 cents/KWh |
| | |
2005 | | 8.47 cents/KWh |
| | |
| | 1.3%/year increase |
Minnesota Regulatory Process
| November 2006 |
| |
Rates Implemented | |
November 2006 | |
| |
Briefs | Decision |
~July 2006 | August 2006 |
| |
Public Hearings | Technical Hearings |
~March 2006 | ~June 2006 |
| |
Interveners File | Rebuttal Testimony |
~February 2006 | ~March 2006 |
| |
Discovery | Interventions |
| |
Company Files Case | Interim Rates Effective |
November 2, 2005 | January 1, 2006 |
| |
November 2005 | |
Rate Cases with Expected 2007 Impacts
• Colorado Electric
• Texas Electric
• New Mexico Electric
• South Dakota Electric
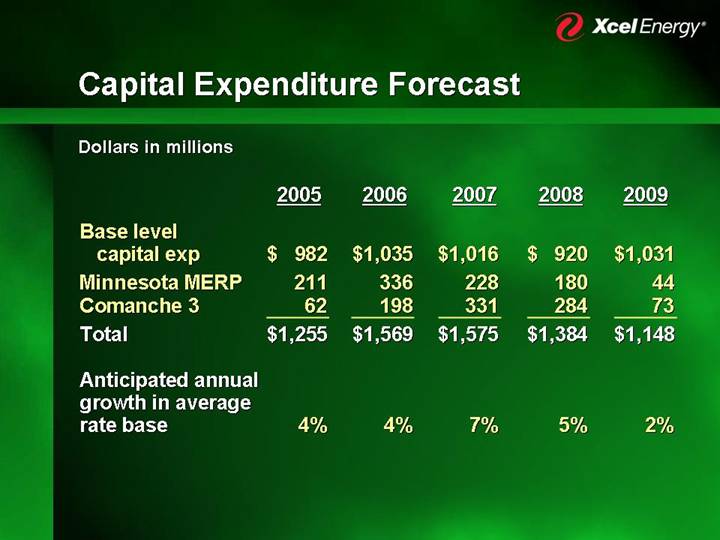
Capital Expenditure Forecast
Dollars in millions
| | 2005 | | 2006 | | 2007 | | 2008 | | 2009 | |
| | | | | | | | | | | |
Base level capital exp | | $ | 982 | | $ | 1,035 | | $ | 1,016 | | $ | 920 | | $ | 1,031 | |
Minnesota MERP | | 211 | | 336 | | 228 | | 180 | | 44 | |
Comanche (3) | | 62 | | 198 | | 331 | | 284 | | 73 | |
Total | | $ | 1,255 | | $ | 1,569 | | $ | 1,575 | | $ | 1,384 | | $ | 1,148 | |
| | | | | | | | | | | |
Anticipated annual growth in average rate base | | 4 | % | 4 | % | 7 | % | 5 | % | 2 | % |
Potential Regulatory Net Income
Dollars in millions
| | 2004 | | 2005 | | 2006 | | 2007 | | 2008 | | 2009 | |
| | | | | | | | | | | | | |
Average rate base | | $ | 10,500 | | | | | | | | | | | |
| | | | | | | | | | | | | |
Projected rate base growth | | | | 4 | % | 4 | % | 7 | % | 5 | % | 2 | % |
| | | | | | | | | | | | | |
Projected average rate base | | | | $ | 10,920 | | $ | 11,357 | | $ | 12,152 | | $ | 12,759 | | $ | 13,015 | |
| | | | | | | | | | | | | | | | | | |
Equity ratio | | | | 51 | % | 51 | % | 51 | % | 51 | % | 51 | % |
| | | | | | | | | | | | | |
Average equity rate base | | | | $ | 5,570 | | $ | 5,790 | | $ | 6,200 | | $ | 6,510 | | $ | 6,640 | |
| | | | | | | | | | | | | | | | | | | |
Dollars in millions
| | | | | | | | | | | | Annual | |
| | | | | | | | | | | | Growth | |
| | | | | | | | | | | | Rate from | |
| | 2005 | | 2006 | | 2007 | | 2008 | | 2009 | | 2005 | |
Equity Rate | | | | | | | | | | | | | |
Base | | $ | 5,570 | | $ | 5,790 | | $ | 6,200 | | $ | 6,510 | | $ | 6,640 | | | |
| | | | | | | | | | | | | |
ROE | | | | | | | | | | | | | |
9.2% | | $ | 515 | *+ | $ | 530 | | $ | 570 | | $ | 600 | | $ | 610 | | 4.3 | % |
9.5% | | | | $ | 550 | + | $ | 590 | | $ | 620 | | $ | 630 | | 5.2 | % |
10.0% | | | | $ | 580 | + | $ | 620 | + | $ | 650 | | $ | 660 | | 6.4 | % |
10.5% | | | | | | $ | 650 | + | $ | 680 | + | $ | 700 | | 8.0 | % |
11.0% | | | | | | $ | 680 | | $ | 720 | + | $ | 730 | + | 9.1 | % |
* Represents approximately mid-point of lower half of 2005 guidance range
+ Potential trajectory
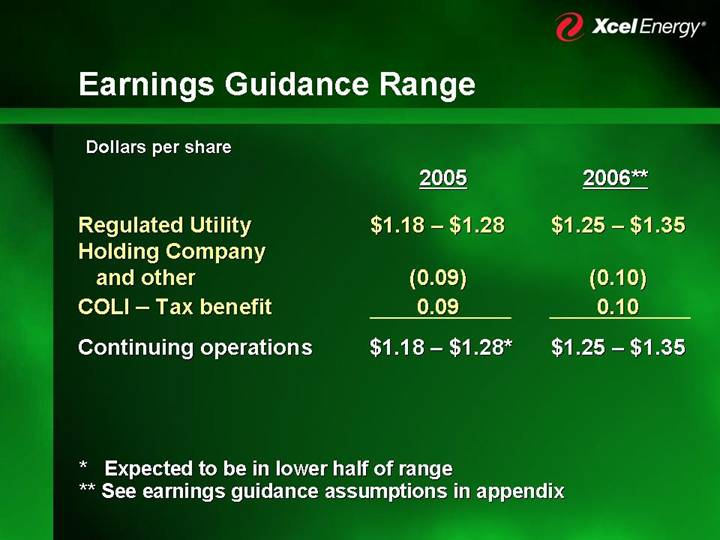
Earnings Guidance Range
Dollars per share
| | 2005 | | 2006** | |
| | | | | |
Regulated Utility | | $1.18 – $1.28 | | $1.25 – $1.35 | |
Holding Company and other | | (0.09 | ) | (0.10 | ) |
COLI – Tax benefit | | 0.09 | | 0.10 | |
Continuing operations | | $1.18 – $1.28 | * | $1.25 – $1.35 | |
* Expected to be in lower half of range
** See earnings guidance assumptions in appendix
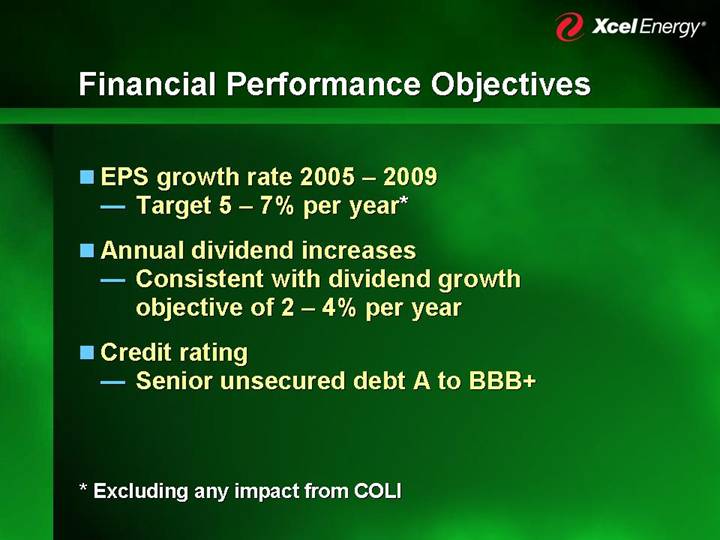
Financial Performance Objectives
• EPS growth rate 2005 – 2009
• Target 5 – 7% per year*
• Annual dividend increases
• Consistent with dividend growth objective of 2 – 4% per year
• Credit rating
• Senior unsecured debt A to BBB+
* Excluding any impact from COLI
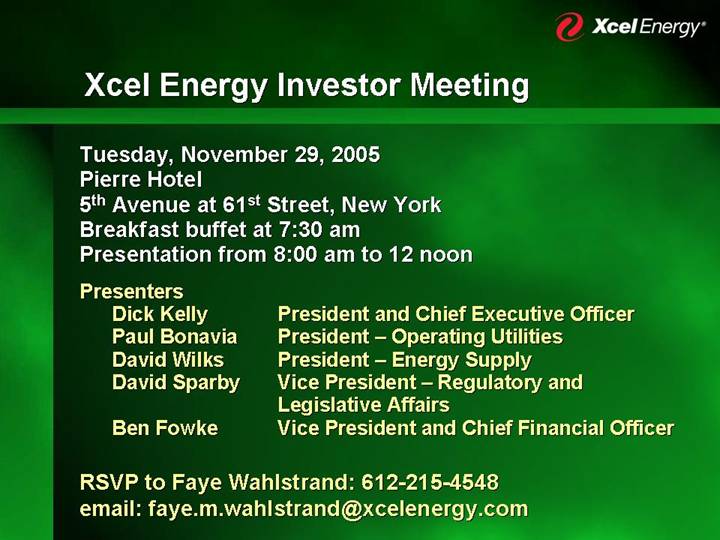
Xcel Energy Investor Meeting
Tuesday, November 29, 2005
Pierre Hotel
5th Avenue at 61st Street, New York
Breakfast buffet at 7:30 am
Presentation from 8:00 am to 12 noon
Presenters | | |
Dick Kelly | | President and Chief Executive Officer |
Paul Bonavia | | President – Operating Utilities |
David Wilks | | President – Energy Supply |
David Sparby | | Vice President – Regulatory and Legislative Affairs |
Ben Fowke | | Vice President and Chief Financial Officer |
RSVP to Faye Wahlstrand: 612-215-4548
email: faye.m.wahlstrand@xcelenergy.com
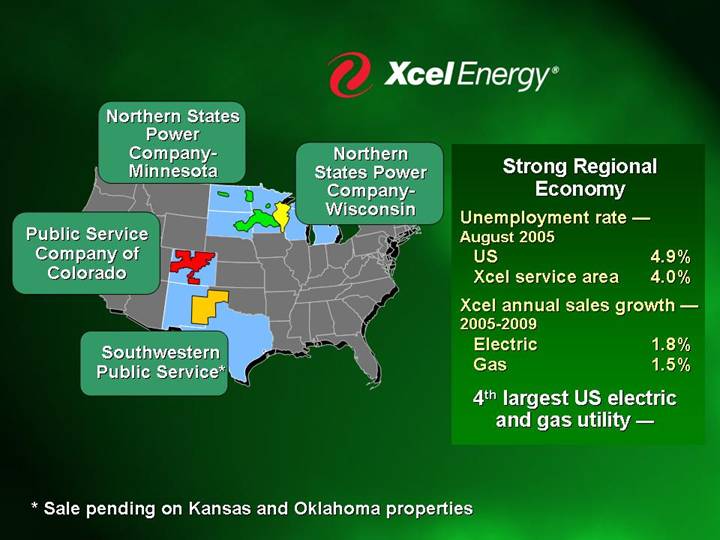
[GRAPHIC]
Strong Regional Economy
Unemployment rate — August 2005 | | | |
US | | 4.9 | % |
Xcel service area | | 4.0 | % |
| | | |
Xcel annual sales growth — 2005-2009 | | | |
Electric | | 1.8 | % |
Gas | | 1.5 | % |
| | | |
4th largest US electric and gas utility — | | | |
* Sale pending on Kansas and Oklahoma properties
Organizational Structure 2004 Results
| | | | Xcel Energy Inc. | | Income from Continuing |
| | | | $527 | | Operations (Dollars in millions) |
| | | | | | | | |
| | | | Holding | | | | |
| | | | Company | | | | |
| | | | $(43) | | | | |
| | | | | | | | |
Northern | | Northern | | | | | | |
States | | States | | Public | | Southwestern | | Subsidiaries |
Power | | Power | | Service | | Public | | • Eloigne |
Company - | | Company - | | Company of | | Service | | • Quixx |
Minnesota | | Wisconsin | | Colorado | | Company | | |
$230 | | $54 | | $218 | | $55 | | $13 |
| | | | | | | | |
Regulated | | Nonregulated |
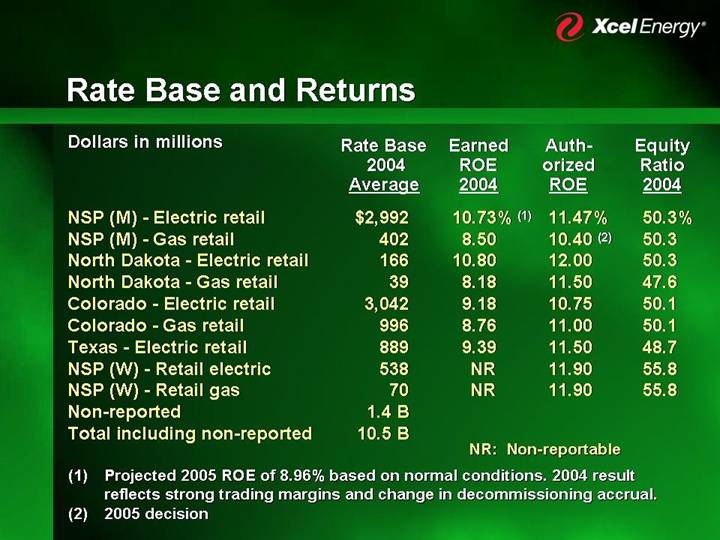
Rate Base and Returns
Dollars in millions
| | Rate Base | | Earned | | | | Equity | |
| | 2004 | | ROE | | Authorized | | Ratio | |
| | Average | | 2004 | | ROE | | 2004 | |
| | | | | | | | | |
NSP (M) - Electric retail | | $ | 2,992 | | 10.73 | %(1) | 11.47 | % | 50.3 | % |
NSP (M) - Gas retail | | 402 | | 8.50 | | 10.40 | (2) | 50.3 | |
North Dakota - Electric retail | | 166 | | 10.80 | | 12.00 | | 50.3 | |
North Dakota - Gas retail | | 39 | | 8.18 | | 11.50 | | 47.6 | |
Colorado -Electric retail | | 3,042 | | 9.18 | | 10.75 | | 50.1 | |
Colorado - Gas retail | | 996 | | 8.76 | | 11.00 | | 50.1 | |
Texas -Electric retail | | 889 | | 9.39 | | 11.50 | | 48.7 | |
NSP (W) - Retail electric | | 538 | | NR | | 11.90 | | 55.8 | |
NSP (W) - Retail gas | | 70 | | NR | | 11.90 | | 55.8 | |
Non-reported | | 1.4 | B | | | | | | |
Total including non-reported | | 10.5 | B | | | | |
| | | | | | | | | | |
NR: Non-reportable
(1) Projected 2005 ROE of 8.96% based on normal conditions. 2004 result reflects strong trading margins and change in decommissioning accrual.
(2) 2005 decision
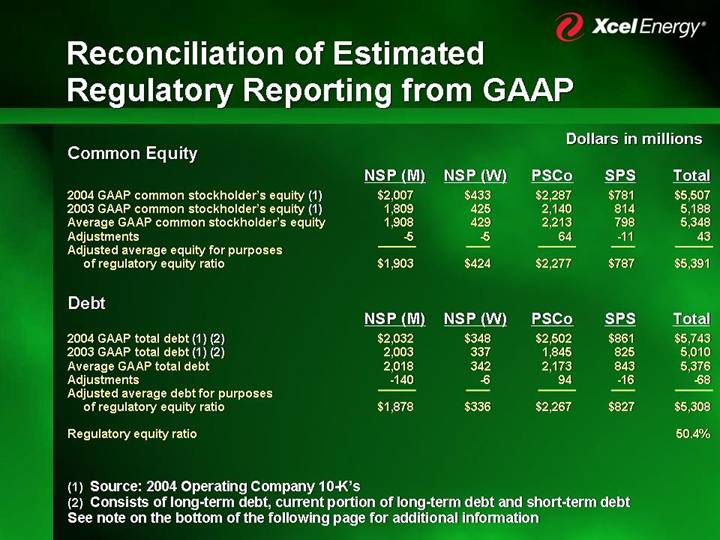
Reconciliation of Estimated
Regulatory Reporting from GAAP
Dollars in millions
Common Equity | | NSP (M) | | NSP (W) | | PSCo | | SPS | | Total | |
2004 GAAP common stockholder’s equity (1) | | $ | 2,007 | | $ | 433 | | $ | 2,287 | | $ | 781 | | $ | 5,507 | |
2003 GAAP common stockholder’s equity (1) | | 1,809 | | 425 | | 2,140 | | 814 | | 5,188 | |
Average GAAP common stockholder’s equity | | 1,908 | | 429 | | 2,213 | | 798 | | 5,348 | |
Adjustments | | -5 | | -5 | | 64 | | -11 | | 43 | |
Adjusted average equity for purposes of regulatory equity ratio | | $ | 1,903 | | $ | 424 | | $ | 2,277 | | $ | 787 | | $ | 5,391 | |
Debt | | NSP (M) | | NSP (W) | | PSCo | | SPS | | Total | |
2004 GAAP total debt (1) (2) | | $ | 2,032 | | $ | 348 | | $ | 2,502 | | $ | 861 | | $ | 5,743 | |
2003 GAAP total debt (1) (2) | | 2,003 | | 337 | | 1,845 | | 825 | | 5,010 | |
Average GAAP total debt | | 2,018 | | 342 | | 2,173 | | 843 | | 5,376 | |
Adjustments | | -140 | | -6 | | 94 | | -16 | | -68 | |
Adjusted average debt for purposes of regulatory equity ratio | | $ | 1,878 | | $ | 336 | | $ | 2,267 | | $ | 827 | | $ | 5,308 | |
| | | | | | | | | | | |
Regulatory equity ratio | | | | | | | | | | 50.4 | % |
(1) Source: 2004 Operating Company 10-K’s
(2) Consists of long-term debt, current portion of long-term debt and short-term debt
See note on the bottom of the following page for additional information
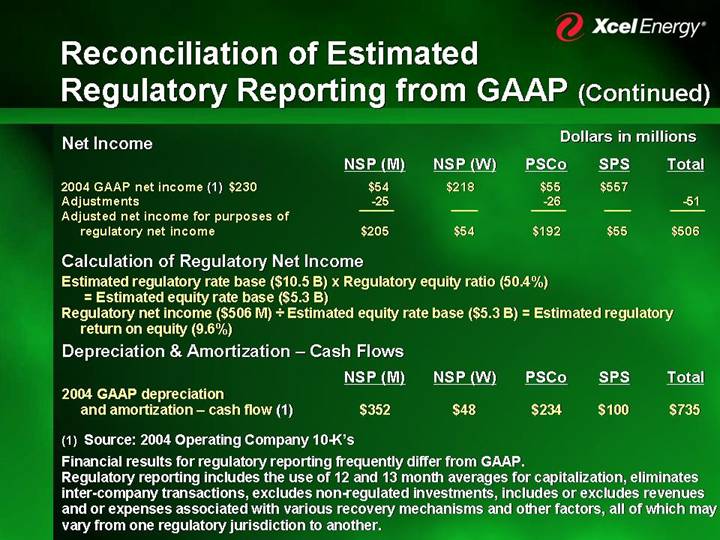
Dollars in millions
| | | |
| | NSP (M) | | NSP (W) | | PSCo | | SPS | | Total | |
Net Income | | | | | | | | | | | |
2004 GAAP net income (1) $230 | | $ | 54 | | $ | 218 | | $ | 55 | | $ | 557 | | | |
Adjustments | | -25 | | | | -26 | | | | -51 | |
Adjusted net income for purposes of regulatory net income | | $ | 205 | | $ | 54 | | $ | 192 | | $ | 55 | | $ | 506 | |
| | | | | | | | | | | |
Calculation of Regulatory Net Income |
Estimated regulatory rate base ($10.5 B) x Regulatory equity ratio (50.4%) |
= Estimated equity rate base ($5.3 B) |
Regulatory net income ($506 M) ÷ Estimated equity rate base ($5.3 B) = Estimated regulatory return on equity (9.6%) |
| | | | | | | | | | | | | | | | |
Depreciation & Amortization – Cash Flows | | NSP (M) | | NSP (W) | | PSCo | | SPS | | Total | |
2004 GAAP depreciation and amortization – cash flow (1) | | $ | 352 | | $ | 48 | | $ | 234 | | $ | 100 | | $ | 735 | |
| | | | | | | | | | | | | | | | |
(1) Source: 2004 Operating Company 10-K’s
Financial results for regulatory reporting frequently differ from GAAP.
Regulatory reporting includes the use of 12 and 13 month averages for capitalization, eliminates inter-company transactions, excludes non-regulated investments, includes or excludes revenues and or expenses associated with various recovery mechanisms and other factors, all of which may vary from one regulatory jurisdiction to another.
2006 Key Earnings Guidance Assumptions
• Successful rate cases
• Minnesota electric request $168 million
• Wisconsin electric & gas request $61 million
• Colorado gas request $34 million
• North Dakota electric request
• Weather adjusted sales growth:
• Retail Electric 1.3 – 1.7%
• Gas 0 – 1.0%
2006 Key Earnings Assumptions
Change from 2005:
• Short-term wholesale margins decline approximately $15 – 30 million
• O&M expenses increase 3 – 4%
• �� Depreciation increases $100 – 110 million, including $60 million increase in decommissioning
• Interest increases $10 – 15 million
• AFUDC equity expected to increase $10 – 15 million
• Continue to recognize COLI tax deduction
• Effective income tax rate of 27 – 29%
• Average shares 428 million based on “If converted”
Coal Supply Contracted
[GRAPHIC]
| | | | Coal | |
| | Coal | | Transportation | |
2005 | | 99 | % | 100 | % |
2006 | | 94 | | 75 | |
2007 | | 65 | | 45 | |
2008 | | 46 | | 45 | |
Annual consumption: 32 million tons of low-sulfur,
low-mercury western coal
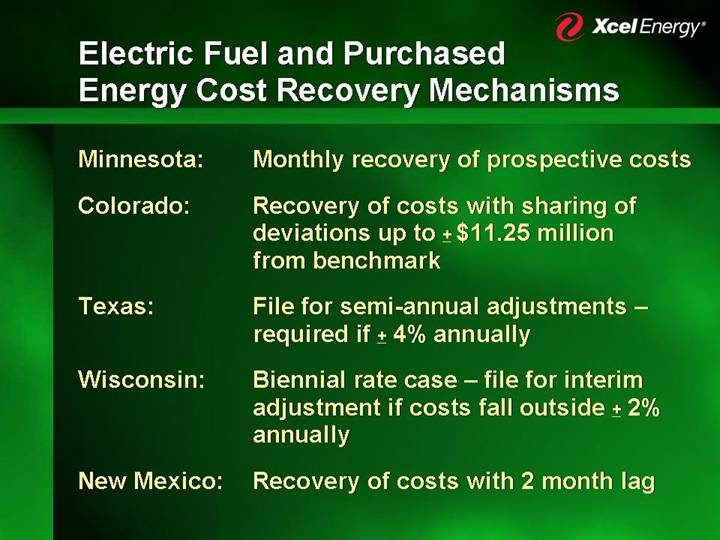
Electric Fuel and Purchased
Energy Cost Recovery Mechanisms
Minnesota: | Monthly recovery of prospective costs |
| |
Colorado: | Recovery of costs with sharing of deviations up to + $11.25 million from benchmark |
| |
Texas: | File for semi-annual adjustments – required if + 4% annually |
| |
Wisconsin: | Biennial rate case – file for interim adjustment if costs fall outside + 2% annually |
| |
New Mexico: | Recovery of costs with 2 month lag |
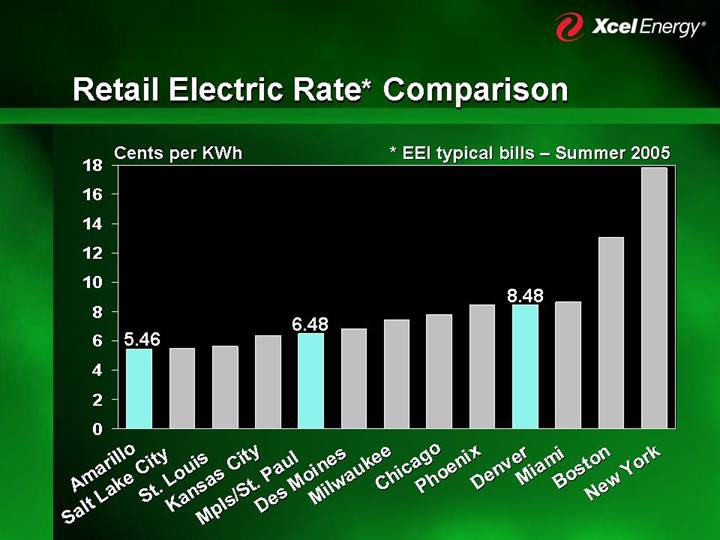
Retail Electric Rate* Comparison
[CHART]
* EEI typical bills – Summer 2005 |
Senior Debt Ratings
| | Moody’s | | S&P | |
| | Secured | | Unsecured | | Secured | | Unsecured | |
| | | | | | | | | |
Holding Co. | | — | | Baa1 | | — | | BBB- | |
| | | | | | | | | |
NSP (M) | | A2 | | A3 | | A- | | BBB- | |
| | | | | | | | | |
NSP (W) | | A2 | | A3 | | A- | | BBB | |
| | | | | | | | | |
PSCo | | A3 | | Baa1 | | A- | | BBB- | |
| | | | | | | | | |
SPS | | — | | Baa1 | | — | | BBB | |
| | | | | | | | | |
Outlook | | | | Stable | | | | Stable | |
Capital Expenditure Forecast by Operating Company
Dollars in millions
| | 2005 | | 2006 | | 2007 | | 2008 | | 2009 | |
| | | | | | | | | | | |
NSP (M) | | $ | 673 | | $ | 879 | | $ | 697 | | $ | 564 | | $ | 517 | |
| | | | | | | | | | | |
NSP (W) | | 58 | | 66 | | 67 | | 95 | | 63 | |
| | | | | | | | | | | |
PSCo | | 414 | | 525 | | 684 | | 604 | | 457 | |
| | | | | | | | | | | |
SPS | | 110 | | 99 | | 127 | | 121 | | 111 | |
| | | | | | | | | | | |
Total | | $ | 1,255 | | $ | 1,569 | | $ | 1,575 | | $ | 1,384 | | $ | 1,148 | |
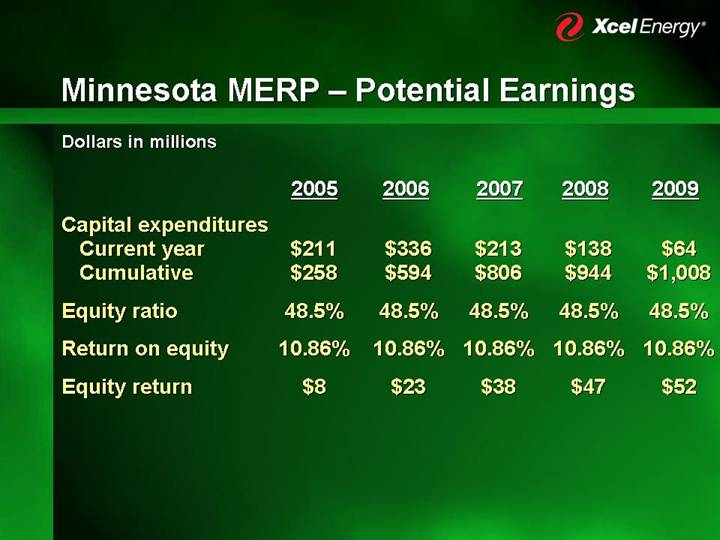
Minnesota MERP – Potential Earnings
Dollars in millions
| | 2005 | | 2006 | | 2007 | | 2008 | | 2009 | |
| | | | | | | | | | | |
Capital expenditures | | | | | | | | | | | |
Current year | | $ | 211 | | $ | 336 | | $ | 213 | | $ | 138 | | $ | 64 | |
Cumulative | | $ | 258 | | $ | 594 | | $ | 806 | | $ | 944 | | $ | 1,008 | |
| | | | | | | | | | | |
Equity ratio | | 48.5 | % | 48.5 | % | 48.5 | % | 48.5 | % | 48.5 | % |
| | | | | | | | | | | |
Return on equity | | 10.86 | % | 10.86 | % | 10.86 | % | 10.86 | % | 10.86 | % |
| | | | | | | | | | | |
Equity return | | $ | 8 | | $ | 23 | | $ | 38 | | $ | 47 | | $ | 52 | |
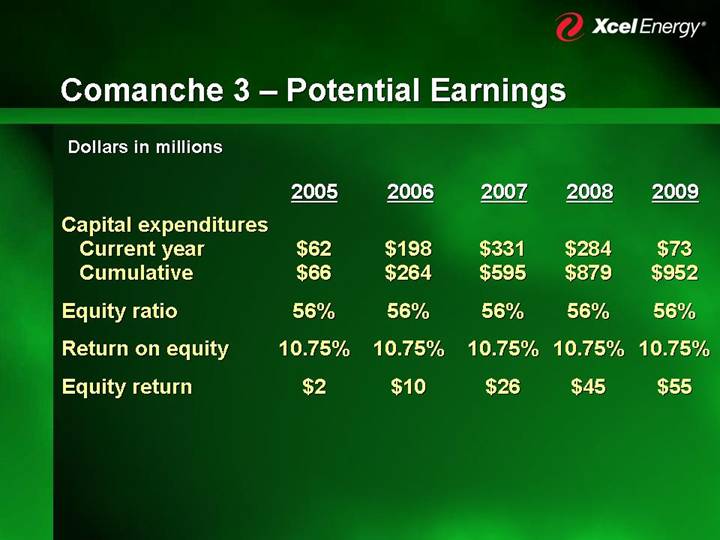
Comanche 3 – Potential Earnings
Dollars in millions
| | 2005 | | 2006 | | 2007 | | 2008 | | 2009 | |
| | | | | | | | | | | |
Capital expenditures | | | | | | | | | | | |
Current year | | $ | 62 | | $ | 198 | | $ | 331 | | $ | 284 | | $ | 73 | |
Cumulative | | $ | 66 | | $ | 264 | | $ | 595 | | $ | 879 | | $ | 952 | |
| | | | | | | | | | | |
Equity ratio | | 56 | % | 56 | % | 56 | % | 56 | % | 56 | % |
| | | | | | | | | | | |
Return on equity | | 10.75 | % | 10.75 | % | 10.75 | % | 10.75 | % | 10.75 | % |
| | | | | | | | | | | |
Equity return | | $ | 2 | | $ | 10 | | $ | 26 | | $ | 45 | | $ | 55 | |
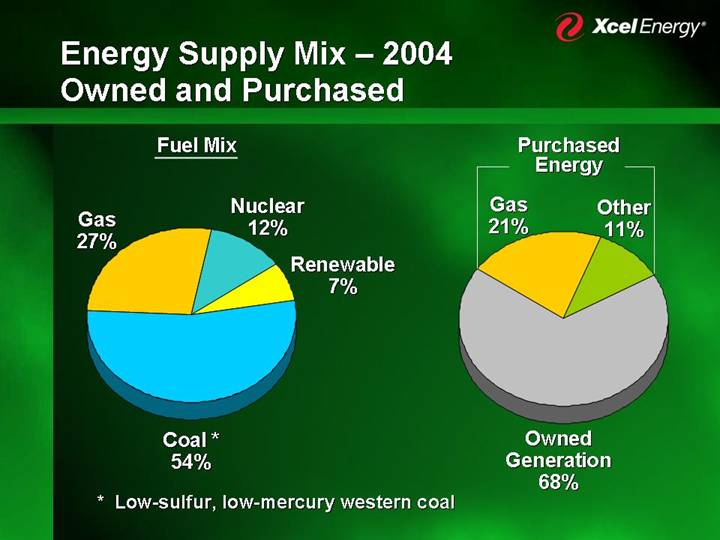
Energy Supply Mix – 2004
Owned and Purchased
Fuel Mix | | Purchased Energy |
| | |
[CHART] | | [CHART] |
* Low-sulfur, low-mercury western coal