Searchable text section of graphics shown above
[LOGO]
[GRAPHIC]
Implementing the Strategy
New York City Investor Meetings |
March 14, 2006 | Xcel Energy Inc. |
| 800 Nicollet Mall |
| Minneapolis, Minnesota 55402 |
| www.xcelenergy.com |
[LOGO]
This material includes forward-looking statements that are subject to certain risks, uncertainties and assumptions. Such forward-looking statements include projected earnings, cash flows, capital expenditures and other statements and are identified in this document by the words “anticipate,” “estimate,” “expect,” “projected,” “objective,” “outlook,” “possible,” “potential” and similar expressions. Actual results may vary materially. Factors that could cause actual results to differ materially include, but are not limited to: general economic conditions, including the availability of credit, actions of rating agencies and their impact on capital expenditures; business conditions in the energy industry; competitive factors; unusual weather; effects of geopolitical events, including war and acts of terrorism; changes in federal or state legislation; regulation; costs and other effects of legal administrative proceedings, settlements, investigations and claims including litigation related to company-owned life insurance (COLI); actions of accounting regulatory bodies; the higher degree of risk associated with Xcel Energy’s nonregulated businesses compared with Xcel Energy’s regulated business; and other risk factors listed from time to time by Xcel Energy in reports filed with the SEC, including Exhibit 99.01 to Xcel Energy’s report on Form 10-K for year 2005.
For more information, contact:
R J Kolkmann | Managing Director, Investor Relations | 612.215.4559 |
| | |
P A Johnson | Director, Investor Relations | 612.215.4535 |
www.xcelenergy.com
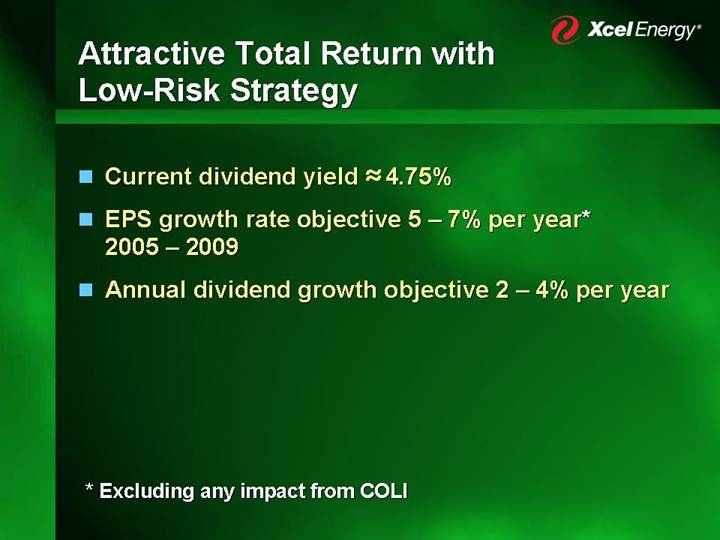
Attractive Total Return with Low-Risk Strategy
• Current dividend yield » 4.75%
• EPS growth rate objective 5 – 7% per year* 2005 – 2009
• Annual dividend growth objective 2 – 4% per year
* Excluding any impact from COLI
Strategy — Building the Core
Invest in rate base assets
AND
Increase our earned return on equity
[GRAPHIC]
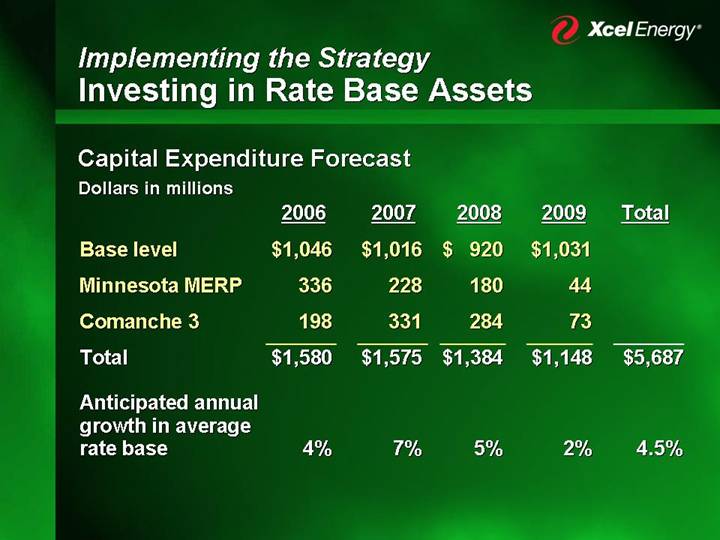
Implementing the Strategy
Investing in Rate Base Assets
Capital Expenditure Forecast
Dollars in millions
| | 2006 | | 2007 | | 2008 | | 2009 | | Total | |
| | | | | | | | | | | |
Base level | | $ | 1,046 | | $ | 1,016 | | $ | 920 | | $ | 1,031 | | | |
| | | | | | | | | | | |
Minnesota MERP | | 336 | | 228 | | 180 | | 44 | | | |
| | | | | | | | | | | |
Comanche 3 | | 198 | | 331 | | 284 | | 73 | | | |
| | | | | | | | | | | |
Total | | $ | 1,580 | | $ | 1,575 | | $ | 1,384 | | $ | 1,148 | | $ | 5,687 | |
| | | | | | | | | | | |
Anticipated annual growth in average rate base | | 4 | % | 7 | % | 5 | % | 2 | % | 4.5 | % |
| | | | | | | | | | | | | | | | |
Implementing the Strategy
Increasing our Earned Return on Equity
• Pre-established recovery mechanisms
• MERP rider
• Comanche 3
• Transmission riders
• File rate cases
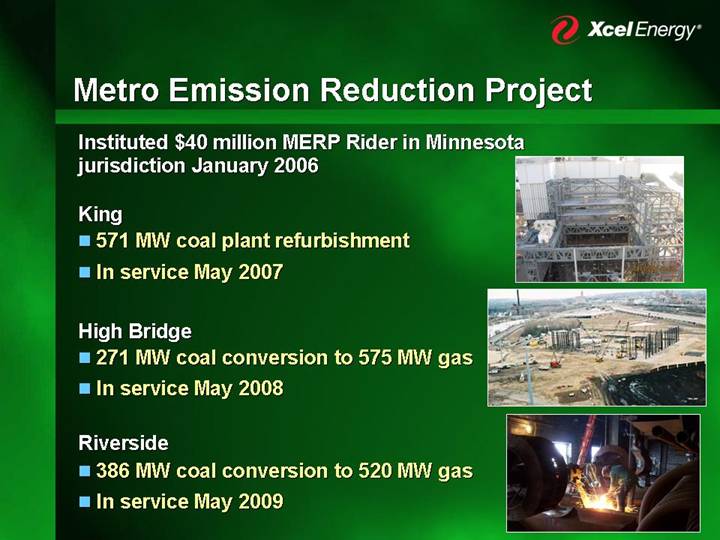
Metro Emission Reduction Project
Instituted $40 million MERP Rider in Minnesota jurisdiction January 2006
King | [GRAPHIC] |
• 571 MW coal plant refurbishment | |
• In service May 2007 | |
| |
High Bridge | [GRAPHIC] |
• 271 MW coal conversion to 575 MW gas | |
• In service May 2008 | |
| |
Riverside | [GRAPHIC] |
• 386 MW coal conversion to 520 MW gas | |
• In service May 2009 | |
Comanche Unit 3
• 750 MW super-critical coal plant in Colorado
• 18 months from application to beginning construction
• On schedule
• On budget
[GRAPHIC]
Investing in Transmission
[GRAPHIC]
Capital Expenditure Forecast
Dollars in millions
| | 2006 | | 2007 | | 2008 | | 2009 | | 2010 | | Total | |
| | | | | | | | | | | | | |
NSPM* | | $ | 148 | | $ | 103 | | $ | 53 | | $ | 59 | | $ | 59 | | $ | 422 | |
| | | | | | | | | | | | | |
PSCo | | 31 | | 63 | | 98 | | 57 | | 102 | | 351 | |
| | | | | | | | | | | | | |
SPS* | | 18 | | 40 | | 38 | | 27 | | 27 | | 150 | |
| | | | | | | | | | | | | |
NSPW | | 17 | | 16 | | 12 | | 12 | | 12 | | 69 | |
| | | | | | | | | | | | | |
Total | | $ | 214 | | $ | 222 | | $ | 201 | | $ | 155 | | $ | 200 | | $ | 992 | |
* Recovery of qualifying investments through a rider. Texas rulemaking to be initiated.
Implementing the Strategy
Increasing our Earned Return on Equity
Rate Cases with 2006 Impacts
| | Status |
| | |
• | Colorado Gas | Completed |
| | |
• | Wisconsin Electric and Gas | Completed |
| | |
• | Minnesota Electric | Decision 2006 Q3 |
Colorado Gas Rate Case Highlights
Xcel Energy Request
• $34.5 million request
• 11.0% return on equity
Commission Decision
• $22 million granted
• 10.5% return on equity
Rates effective February 2006
Wisconsin Rate Cases Highlights
Xcel Energy Request
• $53.1 million electric
• $7.8 million gas
• 11.9% ROE
• 56.32% common equity
Commission Decision
• $43.4 million electric
• $3.9 million gas
• 11.0% ROE
• 54% common equity
Rates effective January 2006
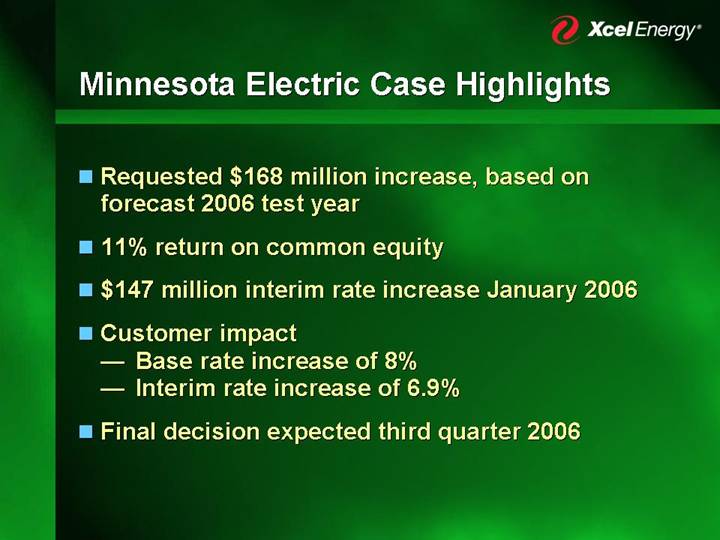
Minnesota Electric Case Highlights
• Requested $168 million increase, based on forecast 2006 test year
• 11% return on common equity
• $147 million interim rate increase January 2006
• Customer impact
• Base rate increase of 8%
• Interim rate increase of 6.9%
• Final decision expected third quarter 2006
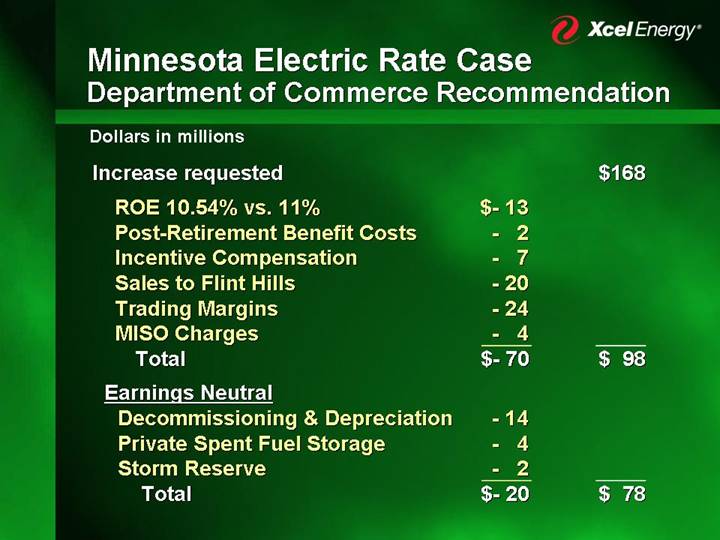
Minnesota Electric Rate Case
Department of Commerce Recommendation
Dollars in millions
Increase requested | | | | $ | 168 | |
| | | | | |
ROE 10.54% vs. 11% | | $ | - 13 | | | |
Post-Retirement Benefit Costs | | - 2 | | | |
Incentive Compensation | | - 7 | | | |
Sales to Flint Hills | | - 20 | | | |
Trading Margins | | - 24 | | | |
MISO Charges | | - 4 | | | |
Total | | $ | - 70 | | $ | 98 | |
| | | | | |
Earnings Neutral | | | | | |
Decommissioning & Depreciation | | - 14 | | | |
Private Spent Fuel Storage | | - 4 | | | |
Storm Reserve | | - 2 | | | |
Total | | $ | - 20 | | $ | 78 | |
Minnesota Electric Rate Case
Other Intervenors
• Treatment of short-term wholesale
• Purchased capacity equity rider
• MISO cost
• Office of the Attorney General — Minnesota income tax based on consolidated return
Minnesota Electric Rate Case Schedule
• Intervenor Testimony – March 2
• Rebuttle Testimony – March 30
• Surrebuttle Testimony – April 13
• Evidentiary Hearings – April 20 – 28
• Initial Briefs – May 24
• Reply Briefs – June 6
• ALJ Report – July 6
• MPUC Decision – September 5
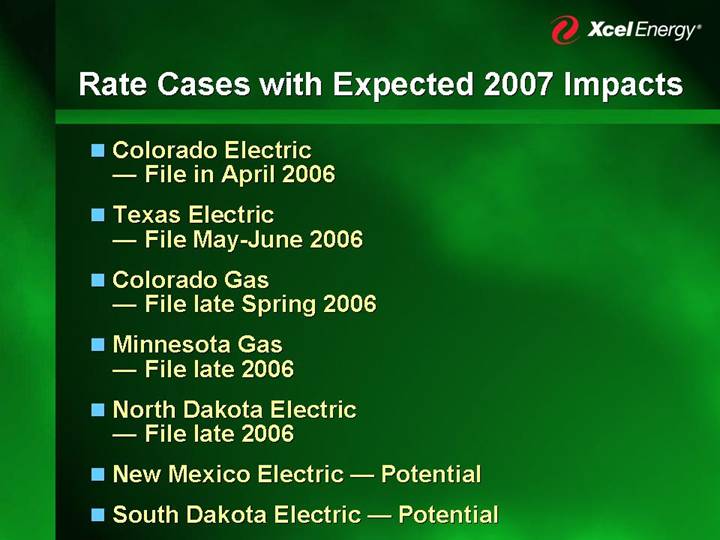
Rate Cases with Expected 2007 Impacts
• Colorado Electric
• File in April 2006
• Texas Electric
• File May-June 2006
• Colorado Gas
• File late Spring 2006
• Minnesota Gas
• File late 2006
• North Dakota Electric
• File late 2006
• New Mexico Electric — Potential
• South Dakota Electric — Potential
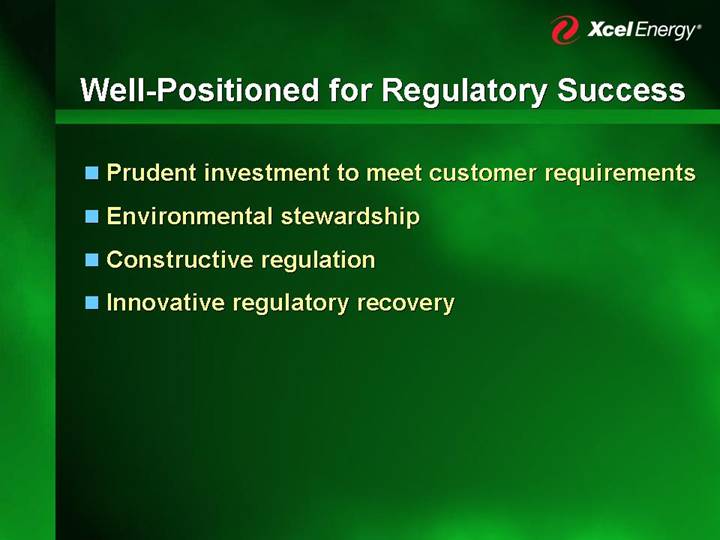
Well-Positioned for Regulatory Success
• Prudent investment to meet customer requirements
• Environmental stewardship
• Constructive regulation
• Innovative regulatory recovery
Earnings Guidance Range
Dollars per share
| | 2006 | |
| | | |
Regulated utility | | $1.25 – $1.35 | |
Holding company and other | | (0.10) | |
COLI – Tax benefit | | 0.10 | |
| | | |
Continuing operations | | $1.25 – $1.35 | |
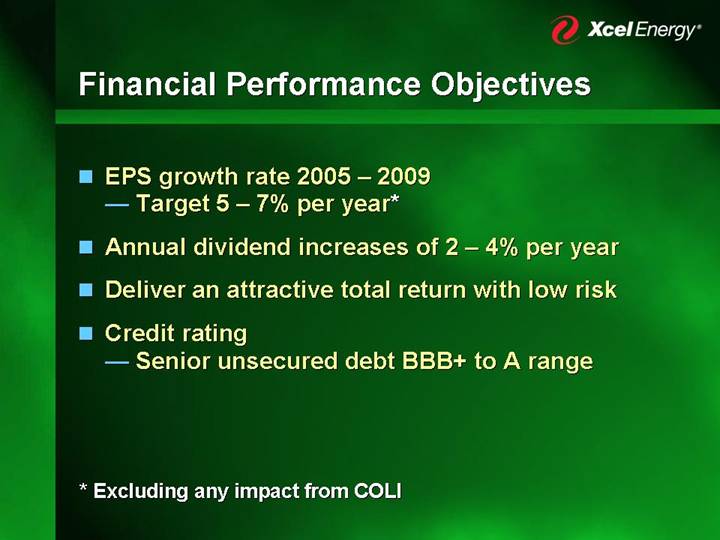
Financial Performance Objectives
• EPS growth rate 2005 – 2009
• Target 5 – 7% per year*
• Annual dividend increases of 2 – 4% per year
• Deliver an attractive total return with low risk
• Credit rating
• Senior unsecured debt BBB+ to A range
* Excluding any impact from COLI
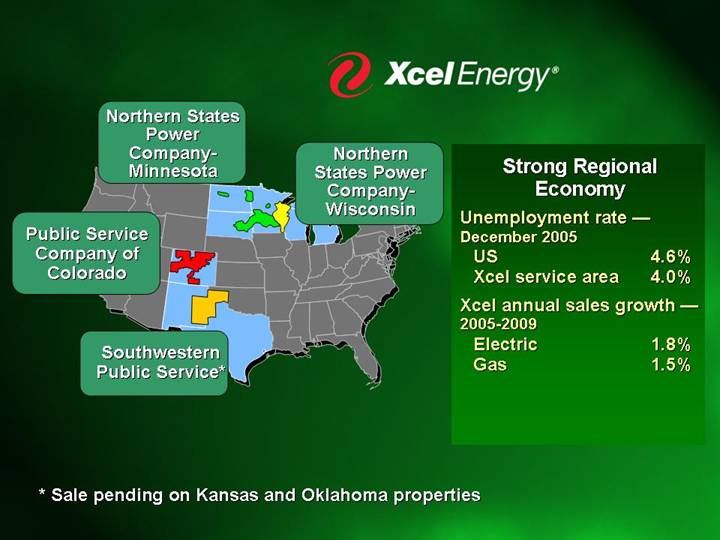
Northern States Power Company-Minnesota
Northern States Power Company-Wisconsin
Public Service Company of Colorado
Southwestern Public Service*
[GRAPHIC]
Strong Regional Economy
Unemployment rate — December 2005 | | | |
US | | 4.6 | % |
Xcel service area | | 4.0 | % |
| | | |
Xcel annual sales growth — 2005-2009 | | | |
Electric | | 1.8 | % |
Gas | | 1.5 | % |
* Sale pending on Kansas and Oklahoma properties
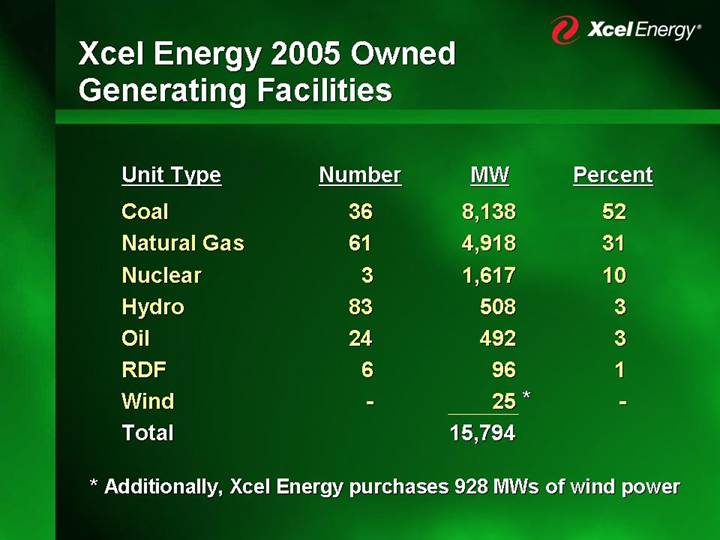
Xcel Energy 2005 Owned
Generating Facilities
Unit Type | | Number | | MW | | Percent | |
| | | | | | | |
Coal | | 36 | | 8,138 | | 52 | |
| | | | | | | |
Natural Gas | | 61 | | 4,918 | | 31 | |
| | | | | | | |
Nuclear | | 3 | | 1,617 | | 10 | |
| | | | | | | |
Hydro | | 83 | | 508 | | 3 | |
| | | | | | | |
Oil | | 24 | | 492 | | 3 | |
| | | | | | | |
RDF | | 6 | | 96 | | 1 | |
| | | | | | | |
Wind | | — | | 25 | * | — | |
| | | | | | | |
Total | | | | 15,794 | | | |
* Additionally, Xcel Energy purchases 928 MWs of wind power
Senior Debt Ratings
| | Moody’s | | S&P | |
| | Secured | | Unsecured | | Secured | | Unsecured | |
| | | | | | | | | |
Holding Co. | | — | | Baa1 | | — | | BBB- | |
| | | | | | | | | |
NSPM | | A2 | | A3 | | A- | | BBB- | |
| | | | | | | | | |
NSPW | | A2 | | A3 | | A- | | BBB | |
| | | | | | | | | |
PSCo | | A3 | | Baa1 | | A- | | BBB- | |
| | | | | | | | | |
SPS | | — | | Baa1 | | — | | BBB | |
| | | | | | | | | |
Outlook | | | | Stable | | | | Stable | |
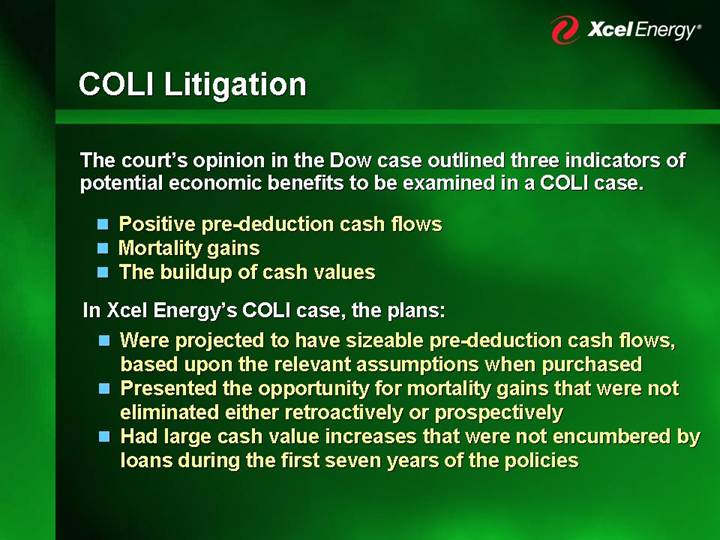
COLI Litigation
The court’s opinion in the Dow case outlined three indicators of potential economic benefits to be examined in a COLI case.
• Positive pre-deduction cash flows
• Mortality gains
• The buildup of cash values
In Xcel Energy’s COLI case, the plans:
• Were projected to have sizeable pre-deduction cash flows, based upon the relevant assumptions when purchased
• Presented the opportunity for mortality gains that were not eliminated either retroactively or prospectively
• Had large cash value increases that were not encumbered by loans during the first seven years of the policies