Exhibit 99.01

Link to searchable text of slide shown above

Link to searchable text of slide shown above

Link to searchable text of slide shown above

Link to searchable text of slide shown above

Link to searchable text of slide shown above

Link to searchable text of slide shown above

Link to searchable text of slide shown above

Link to searchable text of slide shown above
Link to searchable text of slide shown above

Link to searchable text of slide shown above

Link to searchable text of slide shown above

Link to searchable text of slide shown above
Link to searchable text of slide shown above

Link to searchable text of slide shown above

Link to searchable text of slide shown above

Link to searchable text of slide shown above

Link to searchable text of slide shown above

Link to searchable text of slide shown above
Link to searchable text of slide shown above
Link to searchable text of slide shown above

Link to searchable text of slide shown above
Link to searchable text of slide shown above

Link to searchable text of slide shown above
Link to searchable text of slide shown above

Link to searchable text of slide shown above

Link to searchable text of slide shown above

Link to searchable text of slide shown above

Link to searchable text of slide shown above

Link to searchable text of slide shown above

Link to searchable text of slide shown above

Link to searchable text of slide shown above

Link to searchable text of slide shown above

Link to searchable text of slide shown above

Link to searchable text of slide shown above
Link to searchable text of slide shown above
Link to searchable text of slide shown above

Link to searchable text of slide shown above
Link to searchable text of slide shown above

Link to searchable text of slide shown above

Link to searchable text of slide shown above
Link to searchable text of slide shown above

Link to searchable text of slide shown above
Link to searchable text of slide shown above
Link to searchable text of slide shown above
Link to searchable text of slide shown above
Searchable text section of graphics shown above
[LOGO]
Building the Core
Executing the Strategy
[GRAPHIC]
| European Investor Meetings |
|
| May 24 – 26, 2006 | Xcel Energy Inc. |
|
| 414 Nicollet Mall |
|
| Minneapolis, Minnesota 55401 |
|
| www.xcelenergy.com |
[LOGO]
Safe Harbor
This material includes forward-looking statements that are subject to certain risks, uncertainties and assumptions. Such forward-looking statements include projected earnings, cash flows, capital expenditures and other statements and are identified in this document by the words “anticipate,” “estimate,” “expect,” “projected,” “objective,” “outlook,” “possible,” “potential” and similar expressions. Actual results may vary materially. Factors that could cause actual results to differ materially include, but are not limited to: general economic conditions, including the availability of credit, actions of rating agencies and their impact on capital expenditures; business conditions in the energy industry; competitive factors; unusual weather; effects of geopolitical events, including war and acts of terrorism; changes in federal or state legislation; regulation; costs and other effects of legal administrative proceedings, settlements, investigations and claims including litigation related to company-owned life insurance (COLI); actions of accounting regulatory bodies; the higher degree of risk associated with Xcel Energy’s nonregulated businesses compared with Xcel Energy’s regulated business; and other risk factors listed from time to time by Xcel Energy in reports filed with the SEC, including Exhibit 99.01 to Xcel Energy’s report on Form 10-K for year 2005.
Table of Contents
1. |
| Xcel Energy Service Area |
|
2. |
| Strategy: Building the Core |
|
3. |
| Attractive Total Return with Low-Risk Strategy |
|
4. |
| Status of US Electricity Regulation |
|
5. |
| 2005 Average Retail Electric Rate Comparison |
|
6. |
| Xcel Energy Supply Sources |
|
7. |
| Renewable Energy Sources |
|
8. |
| Effective Demand-Side Management (DSM) |
|
9. |
| Xcel Energy Resource Need |
|
10. |
| Getting the Rules Right — Achieved |
|
11. |
| Getting the Rules Right — In Process |
|
12. |
| Getting the Rules Right — In Process (continued) |
|
13. |
| Capital Expenditures 2006 — 2009 |
|
14. |
| Minnesota Metro Emissions Reduction Program (MERP) $1 Billion |
|
15. |
| Comanche 3 — 750 MW Coal Station |
|
16. |
| Comanche Environmental Improvements |
|
17. |
| NSP Nuclear Relicensing Status |
|
18. |
| New Initiatives |
|
19. |
| Xcel Energy — An Environmental Leader |
|
20. |
| Increasing Our Earned Return on Equity |
|
21. |
| Colorado Electric Rate Case Highlights |
|
22. |
| Rate Cases with Expected 2007 Impacts |
|
23. |
| Earnings Guidance Range |
|
24. |
| Earnings Growth Drivers |
|
25. |
| Financial Performance Objectives |
|
26. |
| Appendix |
|
27. |
| Dick Kelly — Chairman, President and CEO |
|
28. |
| Ben Fowke — Vice President and CFO |
|
29. |
| Senior Debt Ratings |
|
30. |
| Xcel Energy Regulatory Team |
|
31. |
| Minnesota Commission |
|
32. |
| Minnesota Commission Staff |
|
33. |
| Minnesota Department of Commerce |
|
34. |
| Minnesota Cost Recovery Mechanisms |
|
35. |
| Minnesota Electric Rate Case Schedule |
|
36. |
| Minnesota Electric Case — Partial Settlement of Trading Margin |
|
37. |
| Colorado Commission |
|
38. |
| Colorado Commission Staff |
|
39. |
| Colorado Cost Recovery Mechanisms |
|
40. |
| PSCo Electric Rate Case Details |
|
41. |
| 2005 Jurisdictional Returns |
|
42. |
| Corporate Owned Life Insurance (COLI) Litigation |
|
[LOGO]
Northern States Power Company- Minnesota 44% Net Income
Public Service Company of Colorado 39% Net Income
Southwestern Public Service 12% Net Income
Northern States Power Company- Wisconsin 5% Net Income
[GRAPHIC]
5th |
| Largest Gas Distribution |
|
|
|
4th |
| Largest Combination Utility |
|
|
|
3rd |
| Largest Electric Transmission |
|
|
|
|
| Largest US Wind Provider |
Gas Customers | 1.8 million |
|
|
Electric Customers | 3.3 million |
2005 Earnings Available: $509 Million
Strategy: Building the Core
Invest in fully regulated utility assets
AND
Increase our earned return on equity
Regulatory and Legislative Policy
Investing in the Core
Regulatory Recovery
Financial Results
Attractive Total Return with Low-Risk Strategy
• EPS growth rate objective 5 – 7% per year* 2005 – 2009
• Annual dividend growth objective 2 – 4% per year
• Dividend yield ![]() 4.7%
4.7%
* Excluding any impact from Corporate Owned Life Insurance
Status of US Electricity Regulation
[GRAPHIC]
2005 Average Retail
Electric Rate Comparison
[CHART]
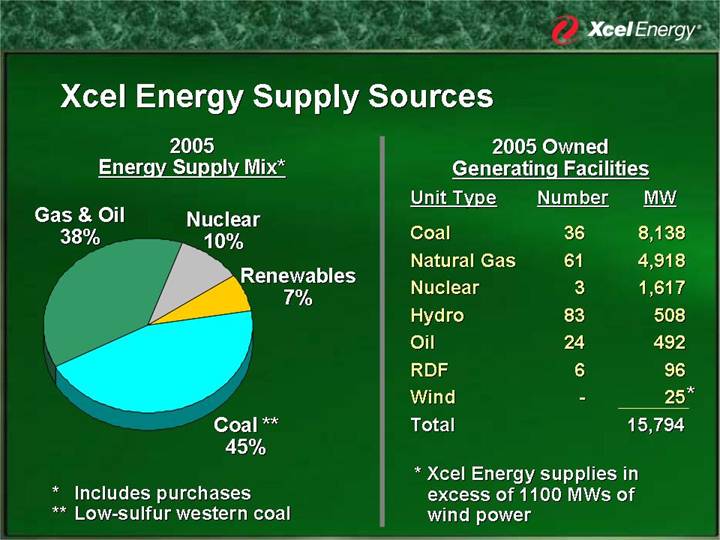
Xcel Energy Supply Sources
2005
Energy Supply Mix*
[CHART]
* Includes purchases
** Low-sulfur western coal
2005 Owned |
Unit Type |
| Number |
| MW |
|
Coal |
| 36 |
| 8,138 |
|
Natural Gas |
| 61 |
| 4,918 |
|
Nuclear |
| 3 |
| 1,617 |
|
Hydro |
| 83 |
| 508 |
|
Oil |
| 24 |
| 492 |
|
RDF |
| 6 |
| 96 |
|
Wind |
| — |
| 25 | * |
Total |
|
|
| 15,794 |
|
* Xcel Energy supplies in excess of 1100 MWs of wind power
Renewable Energy Sources*
[GRAPHIC]
Type |
| Capacity |
|
Wind |
| 1,183 MW |
|
Hydro |
| 1,652 MW |
|
Biomass & RDF |
| 146 MW |
|
Solar |
| 40 KW |
|
Total In Service |
| 2,981 MW |
|
|
|
|
|
Wind |
| 1,203 MW |
|
Biomass & RDF |
| 85 MW |
|
Solar |
| 8 MW |
|
In Progress |
| 1,296 MW |
|
* Owned and purchased
Effective Demand-Side Management (DSM)
MWs Avoided through Conservation and Load Management
[CHART]
Xcel Energy Resource Need
[CHART]
|
|
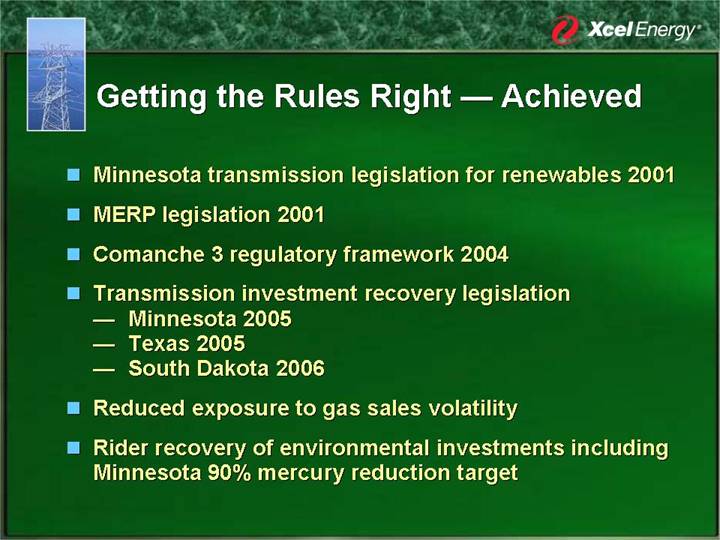
Getting the Rules Right — Achieved
• Minnesota transmission legislation for renewables 2001
• MERP legislation 2001
• Comanche 3 regulatory framework 2004
• Transmission investment recovery legislation
• Minnesota 2005
• Texas 2005
• South Dakota 2006
• Reduced exposure to gas sales volatility
• Rider recovery of environmental investments including Minnesota 90% mercury reduction target
|
|
Getting the Rules Right — In Process
• Monthly Colorado ECA adjustment – proposed
• Rider recovery of Colorado capacity costs – proposed
• Flow through recovery of SPS Texas capacity costs – rule making proceeding
• Reduce NSP-Minnesota exposure to trading and marketing margin volatility – Minnesota electric case
• Increase cost recovery through customer charge
• Rider recover of investment in Colorado IGCC –legislation pending
Future Initiative
• Forward test year in all jurisdictions
Capital Expenditures 2006 — 2009
[CHART]
Minnesota Metro Emissions
Reduction Program (MERP) $1 Billion
• Convert two in-city coal plants to natural gas & refurbish a third in-city coal plant
• Improves environment
SO2 |
| NOx |
| Mercury |
| Particulate |
| CO2 |
|
93 | % | 91 | % | 78 | % | 55 | % | 21 | % |
• Cash return on investment began January 2006
• Target ROE 10.86% with incentive sliding scale 9.97 to 11.46%
• Equity ratio 48.5%
[GRAPHIC]
Comanche 3 — 750 MW Coal Station
[GRAPHIC]
Artist Rendering
• 18 Months – application to construction
• Major contracts signed for turbine generator, boiler and air quality control system – within budget
• Began construction in October 2005. Major contractors start May 2006
• Construction completed fall 2009
• New unit |
| $ | 1.1 | B |
• Transmission |
| $ | 150 | M |
• Retrofit 1 & 2 |
| $ | 127 | M |
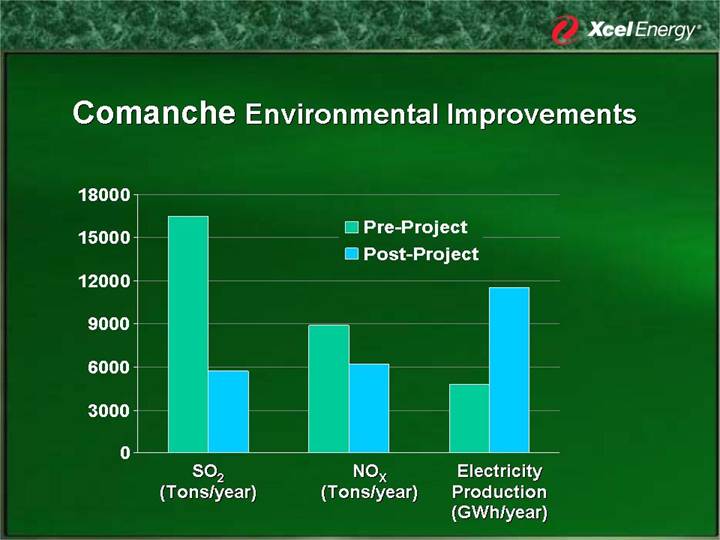
Comanche Environmental Improvements
[CHART]
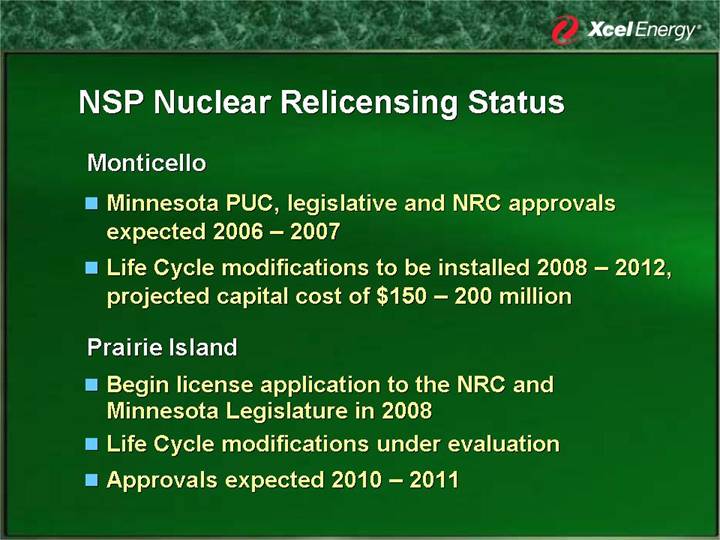
NSP Nuclear Relicensing Status
Monticello
• Minnesota PUC, legislative and NRC approvals expected 2006 – 2007
• Life Cycle modifications to be installed 2008 – 2012, projected capital cost of $150 – 200 million
Prairie Island
• Begin license application to the NRC and Minnesota Legislature in 2008
• Life Cycle modifications under evaluation
• Approvals expected 2010 – 2011
| [GRAPHIC] |
• Minnesota mercury reduction program
• Integrated gasification combined cycle (IGCC)
• 8 MW photovoltaic installation planned
• Wind ![]() Electricity
Electricity ![]() Hydrogen
Hydrogen ![]() Energy
Energy
• CapEx 2020
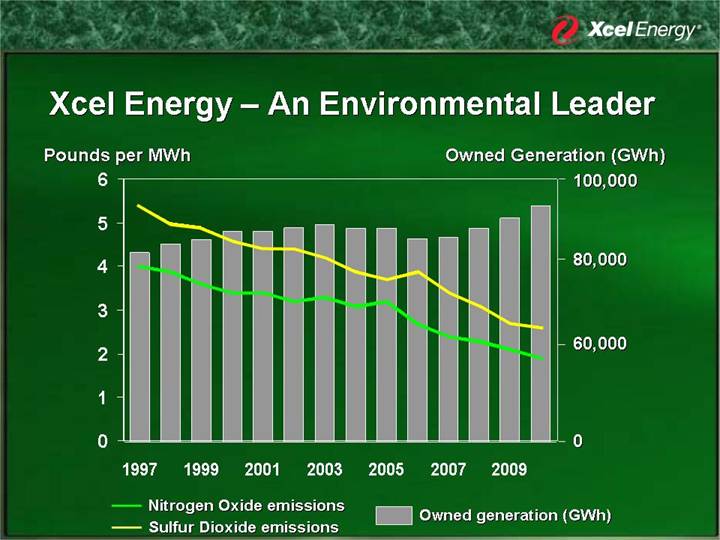
Xcel Energy – An Environmental Leader
[CHART]
Increasing Our Earned Return on Equity
Rate Cases with 2006 Impacts
Dollars in millions
|
| Dollar Increase |
| Return on Equity |
| ||||||
|
| Requested |
| Granted |
| Requested |
| Granted |
| ||
|
|
|
|
|
|
|
|
|
| ||
Colorado Gas |
| $ | 34.5 |
| $ | 22.0 |
| 11.0 | % | 10.5 | % |
Wisconsin Electric |
| 53.1 |
| 43.4 |
| 11.9 |
| 11.0 |
| ||
Wisconsin Gas |
| 7.8 |
| 3.9 |
| 11.9 |
| 11.0 |
| ||
Minnesota Electric |
| 156 | * |
|
| 11.0 |
|
|
| ||
* Revised from $168 for change in decommissioning accrual
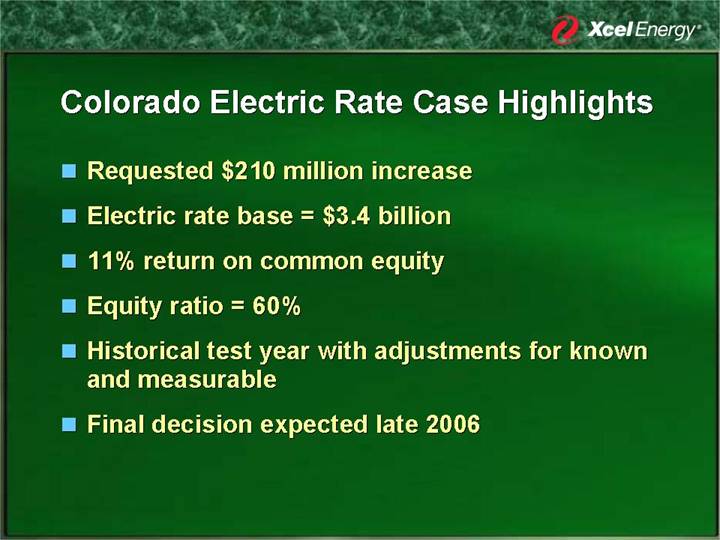
Colorado Electric Rate Case Highlights
• Requested $210 million increase
• Electric rate base = $3.4 billion
• 11% return on common equity
• Equity ratio = 60%
• Historical test year with adjustments for known and measurable
• Final decision expected late 2006
Rate Cases with Expected 2007 Impacts
Texas Electric |
| File May 31, 2006 |
|
|
|
Colorado Gas |
| File 2006 |
|
|
|
Minnesota Gas |
| File 2006 |
|
|
|
North Dakota Electric |
| Potential |
|
|
|
New Mexico Electric |
| Potential |
|
|
|
South Dakota Electric |
| Potential |
Earnings Guidance Range
Dollars per share
|
| 2006 |
|
|
|
|
|
Regulated utility |
| $1.25 – $1.35 |
|
Holding company and other |
| (0.10) |
|
COLI – tax benefit |
| 0.10 |
|
|
|
|
|
Continuing operations |
| $1.25 – $1.35 |
|
Earnings Growth Drivers
|
|
|
|
|
| Annual |
| ||
|
|
|
| 2009 |
| Growth |
| ||
|
| 2005* |
| Potential |
| Rate |
| ||
|
|
|
|
|
|
|
| ||
Rate Base |
| $ | 10.9 | B | $ | 13 | B | 4.5 | % |
|
|
|
|
|
|
|
| ||
Regulatory Equity Capitalization |
| 52 | % | 52 – 54 | % | 0 to 1 | % | ||
|
|
|
|
|
|
|
| ||
Earned Return on Utility Rate Base Equity |
| 9.5 | % | 10.5 to 11 | % | 2.5 to 3.5 | % | ||
* Estimated regulatory results
Financial Performance Objectives
• EPS growth rate 2005 – 2009
• Target 5 – 7% per year*
• Annual dividend increases of 2 – 4% per year
• Deliver an attractive total return with low risk
• Credit rating
• Senior unsecured debt BBB+ to A range
* Excluding any impact from COLI
Appendix
Dick Kelly
Chairman, President and CEO
[GRAPHIC]
Richard (Dick) Kelly is chairman of the board, president and chief executive officer of Xcel Energy. From June to mid-December 2005 he served as president and chief executive officer; from October 2003 until June 2005, he was Xcel Energy’s chief operating officer, and previous to that he served as chief financial officer.
Prior to the 2000 merger of New Century Energies (NCE) and Northern States Power Company to form Xcel Energy, Kelly served as NCE’s chief financial officer, having held a variety of finance-related positions at Public Service Company of Colorado before it merged with Southwestern Public Service Company to form NCE.
He is a member of the Board of Trustees of the Science Museum of Minnesota and a board member of the Capital City Partnership, the Minnesota Orchestra and Regis University. Kelly is a member of Colorado Concern and Colorado Forum, past president of the Arvada Optimist Club, and a past director of the Ronald McDonald House and the Denver Metro Chamber of Commerce.
Kelly earned both a master’s degree in business administration and a bachelor’s degree in accounting from Regis University. He attended the University of Colorado’s Executive Education Conference and the University of Michigan’s Public Utility Executive Program.
Ben Fowke
Vice President and Chief Financial Officer
[GRAPHIC]
Benjamin (Ben) Fowke is vice president and chief financial officer (CFO) of Xcel Energy. Previously he served as vice president and treasurer.
Before being named vice president and treasurer in 2002, Fowke was vice president and CFO of Energy Markets, where he was responsible for financial operations of the company’s commodities trading and marketing business unit. Before the 2000 merger between Northern States Power Co. and New Century Energies (NCE) to form Xcel Energy, he was a vice president in the NCE Retail business unit.
He came to NCE from FP&L Group, where he held various finance positions. Before joining FP&L Group, he was a manager of Financial Reporting with DWG Corp., supervisor of Internal Audits with the Dart Group and an auditor with KPMG.
He is a board member of the Milestone Growth Fund.
Fowke earned a bachelor of science degree in finance/accounting from Towson University. He obtained his CPA in 1982.
Senior Debt Ratings
|
| Secured |
| Unsecured |
| ||||||||
|
| Fitch |
| Moody’s |
| S&P |
| Fitch |
| Moody’s |
| S&P |
|
|
|
|
|
|
|
|
|
|
|
|
|
|
|
Holding Co. |
|
|
|
|
|
|
| BBB+ |
| Baa1 |
| BBB- |
|
|
|
|
|
|
|
|
|
|
|
|
|
|
|
NSPM |
| A+ |
| A2 |
| A- |
| A |
| A3 |
| BBB- |
|
|
|
|
|
|
|
|
|
|
|
|
|
|
|
NSPW |
| A+ |
| A2 |
| A- |
| A |
| A3 |
| BBB |
|
|
|
|
|
|
|
|
|
|
|
|
|
|
|
PSCo |
| A- |
| A3 |
| A- |
| BBB+ |
| Baa1 |
| BBB- |
|
|
|
|
|
|
|
|
|
|
|
|
|
|
|
SPS |
|
|
|
|
|
|
| A- |
| Baa1 |
| BBB |
|
Xcel Energy Regulatory Team
Dave Sparby: Vice President, Government and Regulatory Affairs. 25 years experience; oversees all regulatory and legislative initiatives of Xcel Energy.
Minnesota
Judy Poferl: Director, Regulatory Administration North. 20 years experience; directs all Minnesota regulatory filings.
Scott Wilensky: Executive Director, Government Affairs. 20 years experience; leads rate case initiatives.
Colorado
Fred Stoffel: Vice President, Policy Development. 26 years experience; oversees Colorado regulatory filings including rates, tariffs, certification of new projects and revenue recovery mechanisms.
Texas
David Hudson: Director, Regulatory Administration South. 20 years experience; directs all state regulatory filings for Texas and New Mexico, and leads the Company’s filings before the federal Energy Regulatory Commission.
Wisconsin
Don Reck: Director, Government and Regulatory Affairs. 15 years experience; responsible for all regulatory and governmental affairs activities in support of the NSP-Wisconsin operating company.
Cross Functional Teams
• Debbie Blair: Director, Revenue Analysis. 23 years experience; directs cost-of-service analysis in support of rate filings.
• Ron Darnel: Director, Pricing and Planning. 22 years experience; directs all class cost allocations and pricing analysis in support of rate filings.
• Roy Palmer: Director, Regional Government Affairs; directs all state legislative initiatives
• John O’Donnell: Director, Federal Government Affairs; directs all federal legislative initiatives
Minnesota Commission
Commissions appointed by the governor for 6-year term
|
|
|
| Years on |
|
Name |
| Party |
| Commission |
|
|
|
|
|
|
|
Leroy Koppendrayer, Chair |
| Republican |
| 8 |
|
|
|
|
|
|
|
Kenneth Nickolai |
| No Affiliation |
| 2.5 |
|
|
|
|
|
|
|
Marshall Johnson |
| Independent |
| 13 |
|
|
|
|
|
|
|
Thomas Pugh |
| Democrat |
| 6 |
|
|
|
|
|
|
|
Phyllis Reha |
| Democrat |
| 5 |
|
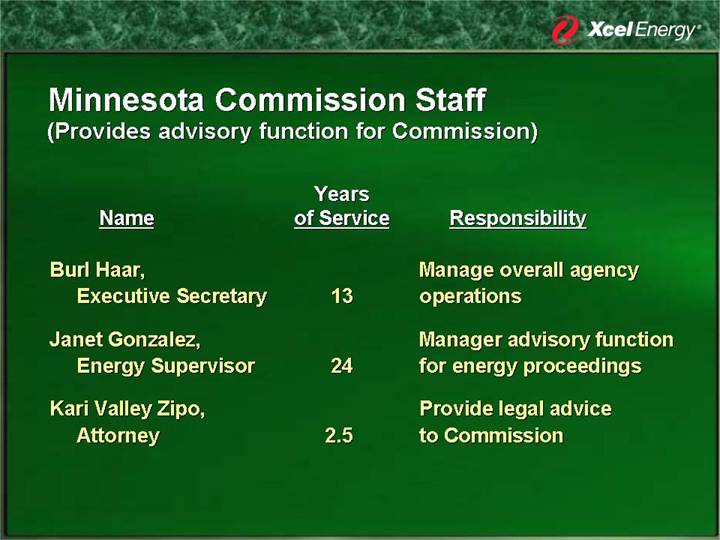
Minnesota Commission Staff
(Provides advisory function for Commission)
|
| Years |
|
|
Name |
| of Service |
| Responsibility |
|
|
|
|
|
Burl Haar, Executive Secretary |
| 13 |
| Manage overall agency operations |
|
|
|
|
|
Janet Gonzalez, Energy Supervisor |
| 24 |
| Manager advisory function for energy proceedings |
|
|
|
|
|
Kari Valley Zipo, Attorney |
| 2.5 |
| Provide legal advice to Commission |
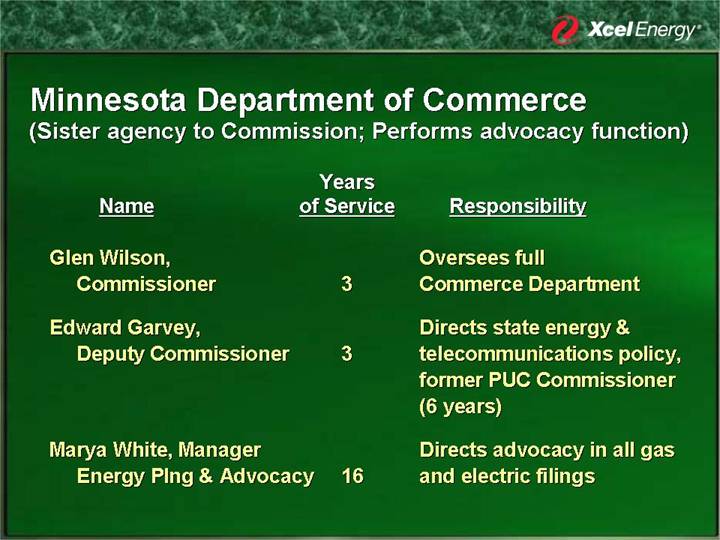
Minnesota Department of Commerce
(Sister agency to Commission; Performs advocacy function)
|
| Years |
|
|
Name |
| of Service |
| Responsibility |
|
|
|
|
|
Glen Wilson, Commissioner |
| 3 |
| Oversees full Commerce Department |
|
|
|
|
|
Edward Garvey, Deputy Commissioner |
| 3 |
| Directs state energy & telecommunications policy, former PUC Commissioner (6 years) |
|
|
|
|
|
Marya White, Manager Energy Plng & Advocacy |
| 16 |
| Directs advocacy in all gas and electric filings |
Minnesota Cost Recovery Mechanisms
• Projected electric fuel and purchased energy costs billed for the current month with subsequent true-up; MISO costs recovered through FCA on interim basis, with final recovery mechanism being developed by stakeholders
• Projected purchased gas cost billed for the current month with subsequent true-up
• Conservation Improvement Program rider which provides recovery of program costs plus incentives
• Emission Reduction Program, Renewable Development Fund, and State Energy Policy rider in place,
• Renewable Transmission rider in place; general transmission rider authorized by law
• Mercury reduction and environmental improvement rider authorized by law
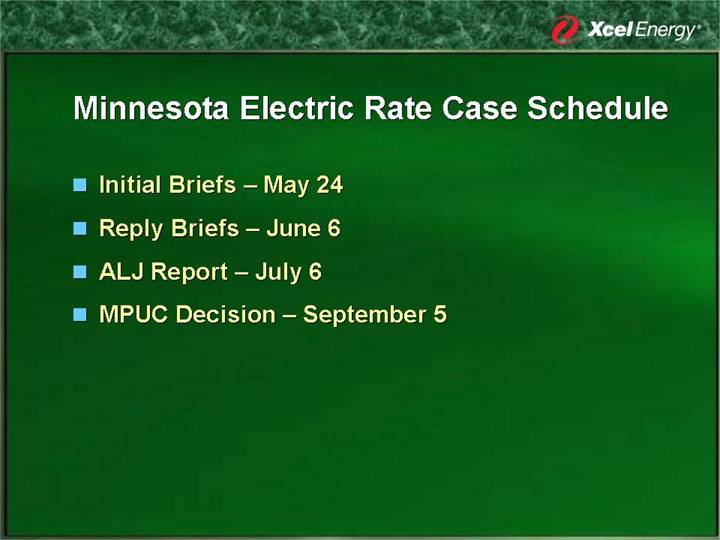
Minnesota Electric Rate Case Schedule
• Initial Briefs – May 24
• Reply Briefs – June 6
• ALJ Report – July 6
• MPUC Decision – September 5
Minnesota Electric Case — Partial Settlement of Trading Margin
• No credit to base rates for wholesale electric margins
• Margins to be flowed through fuel clause include:
• 100% wholesale electric margins from excess generation capacity
• 80% of wholesale margins from ancillary services sales
• 25% of margins not arising from use of NSP-Minnesota generating assets
Colorado Commission
Commissions appointed by the governor for a five-year term
|
|
|
| Years on |
|
Name |
| Party |
| Commission |
|
|
|
|
|
|
|
Greg Sopkin, Chair |
| Republican |
| 3 |
|
|
|
|
|
|
|
Carl Miller |
| Democrat |
| 1 |
|
|
|
|
|
|
|
Polly Page |
| Republican |
| 5 |
|
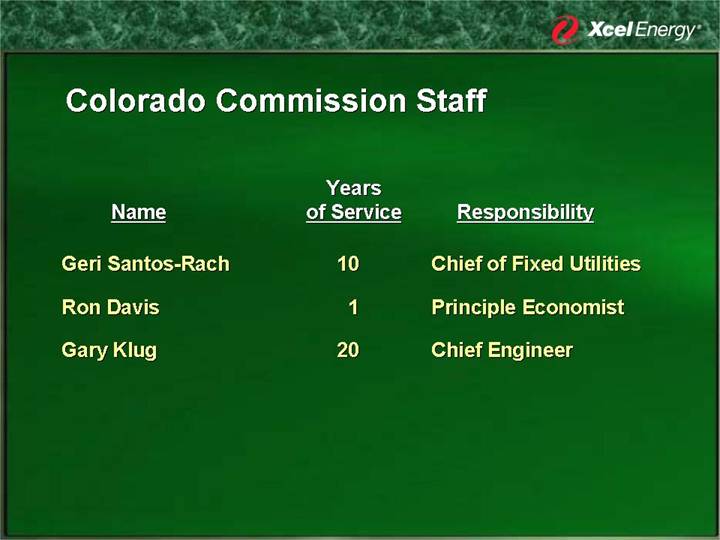
Colorado Commission Staff
|
| Years |
|
|
|
Name |
| of Service |
| Responsibility |
|
|
|
|
|
|
|
Geri Santos-Rach |
| 10 |
| Chief of Fixed Utilities |
|
|
|
|
|
|
|
Ron Davis |
| 1 |
| Principle Economist |
|
|
|
|
|
|
|
Gary Klug |
| 20 |
| Chief Engineer |
|
Colorado Cost Recovery Mechanisms
• Energy Cost Adjustment recovers electric fuel and purchased energy costs for retail load with a maximum gain or loss of $11.25 million
• Monthly Gas Cost Adjustment recovers the cost of the natural gas commodity, interstate pipeline and storage costs on a dollar-for-dollar basis
• Purchased Capacity Adjustment recovers the demand component of purchased power contracts (through 2006)
• Fuel Cost Adjustment recovers 100% of electric fuel and purchased energy costs for wholesale customers
• Demand-side Management Cost Adjustment rider (gas and electric) Air Quality Improvement rider (to recover cost of emissions controls on several Denver metro generation facilities)
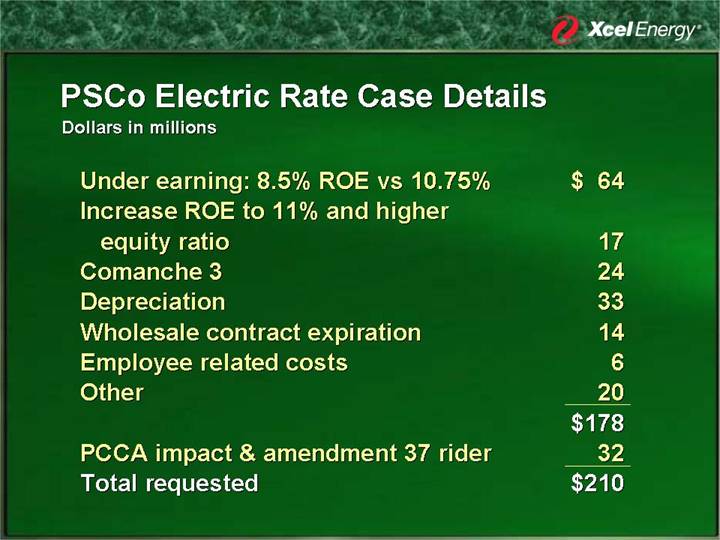
PSCo Electric Rate Case Details
Dollars in millions
Under earning: 8.5% ROE vs 10.75% |
| $ | 64 |
|
Increase ROE to 11% and higher equity ratio |
| 17 |
| |
Comanche 3 |
| 24 |
| |
Depreciation |
| 33 |
| |
Wholesale contract expiration |
| 14 |
| |
Employee related costs |
| 6 |
| |
Other |
| 20 |
| |
|
| $ | 178 |
|
PCCA impact & amendment 37 rider |
| 32 |
| |
Total requested |
| $ | 210 |
|
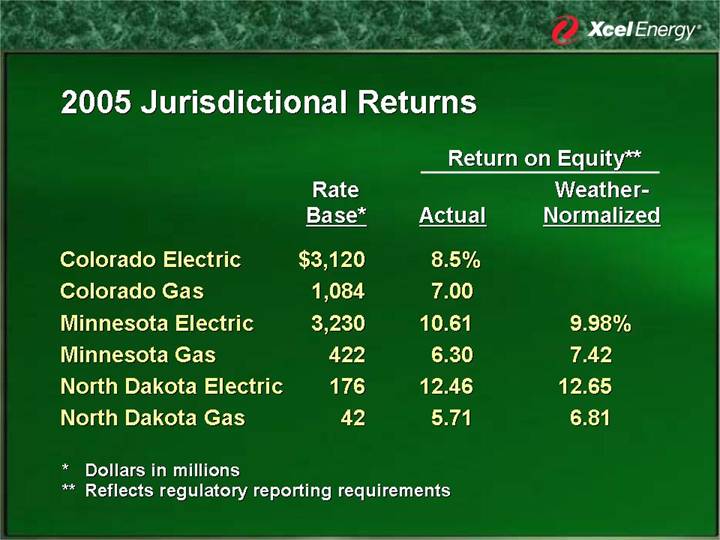
2005 Jurisdictional Returns
|
|
|
| Return on Equity** |
| |||
|
| Rate |
|
|
| Weather- |
| |
|
| Base* |
| Actual |
| Normalized |
| |
|
|
|
|
|
|
|
| |
Colorado Electric |
| $ | 3,120 |
| 8.5 | % |
|
|
Colorado Gas |
| 1,084 |
| 7.00 |
|
|
| |
Minnesota Electric |
| 3,230 |
| 10.61 |
| 9.98 | % | |
Minnesota Gas |
| 422 |
| 6.30 |
| 7.42 |
| |
North Dakota Electric |
| 176 |
| 12.46 |
| 12.65 |
| |
North Dakota Gas |
| 42 |
| 5.71 |
| 6.81 |
| |
* Dollars in millions
** Reflects regulatory reporting requirements
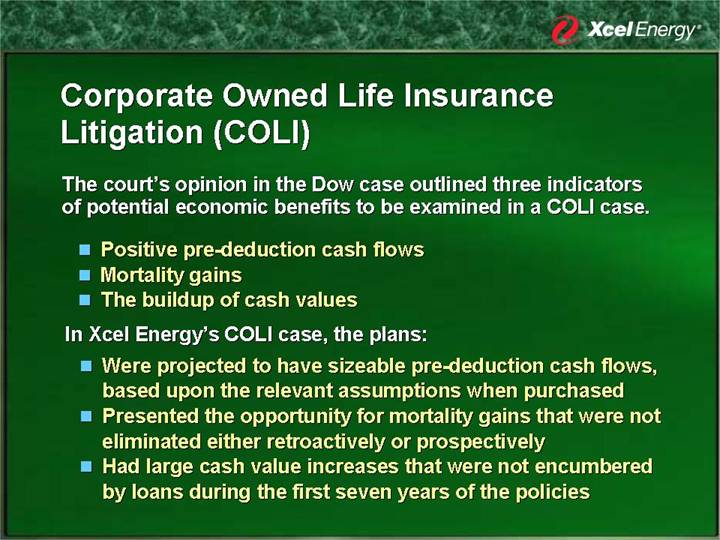
Corporate Owned Life Insurance
Litigation (COLI)
The court’s opinion in the Dow case outlined three indicators of potential economic benefits to be examined in a COLI case.
• Positive pre-deduction cash flows
• Mortality gains
• The buildup of cash values
In Xcel Energy’s COLI case, the plans:
• Were projected to have sizeable pre-deduction cash flows, based upon the relevant assumptions when purchased
• Presented the opportunity for mortality gains that were not eliminated either retroactively or prospectively
• Had large cash value increases that were not encumbered by loans during the first seven years of the policies