
NSPM $1,130 $1,390 $1,150 $1,040 $1,200
PSCo 900 1,020 920 730 720
SPS 460 730 430 320 340
NSPW 160 160 200 210 190
Total $2,650 $3,300 $2,700 $2,300 $2,450
2012 2013 2014 2015 2016
Dollars in millions
Exhibit 99.01
Capital Expenditures by Company

2012 2013 2014 2015 2016
Base & Other $1,850 $1,815 $1,690 $1,670 $2,030
Clean Air Clean Jobs Act 200 410 260 95 10
CapX2020 175 350 285 145 0
Nuclear Fuel 145 95 160 105 245
Nuclear Uprate/Life Ext 145 295 105 95 0
CSAPR 75 255 115 25 0
RES & Infrastructure 60 80 85 165 165
Total $2,650 $3,300 $2,700 $2,300 $2,450
Dollars in millions
Capital Expenditures by Major Project

Capital Expenditures by Function
Transmission $ 710 $ 945 $ 740 $ 660 $ 710
Generation 860 1,305 870 640 615
Distribution 455 465 455 460 465
Natural Gas 245 275 275 225 245
Nuclear Fuel 145 95 160 105 245
Other 235 215 200 210 170
Total $2,650 $3,300 $2,700 $2,300 $2,450
Dollars in millions
2012 2013 2014 2015 2016
* Cash from operations, net of dividend and pension funding
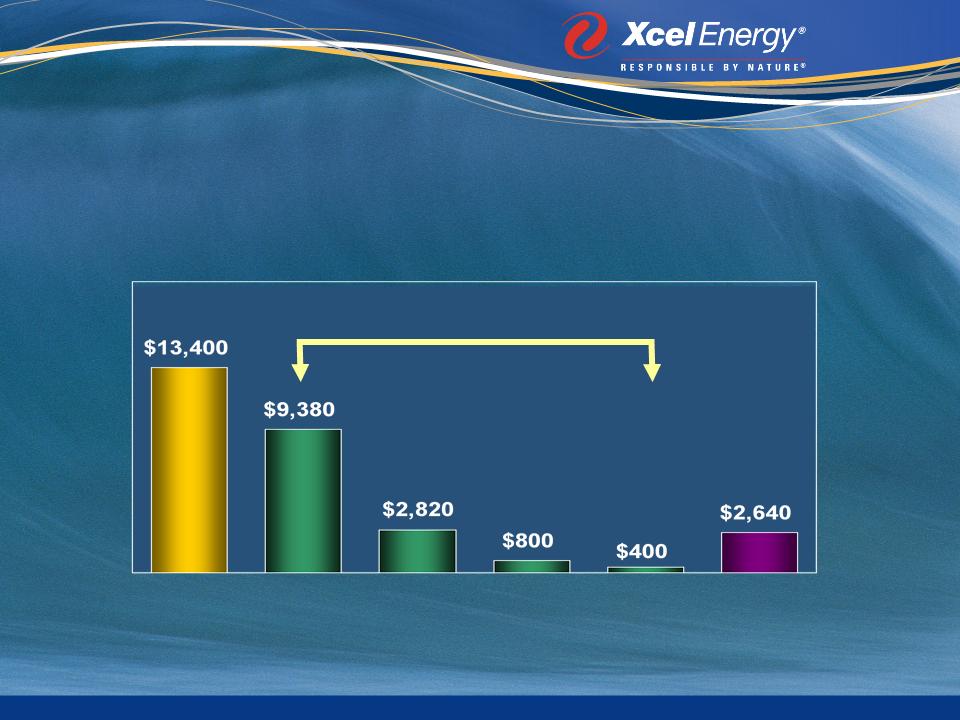
Dollars in millions
Cap
Ex
Ex
CFO *
New
Debt
Debt
DRIP
Equity
Funding capital expenditures
Refinanced
Debt
Debt
Modest Financing Plan
Projected 2012 - 2016
Projected 2012 - 2016