UNITED STATES
SECURITIES AND EXCHANGE COMMISSION
Washington, D.C. 20549
FORM N-CSR
CERTIFIED SHAREHOLDER REPORT OF REGISTERED
MANAGEMENT INVESTMENT COMPANIES
Investment Company Act file number 811- 3855
Fidelity Advisor Series VIII
(Exact name of registrant as specified in charter)
82 Devonshire St., Boston, Massachusetts 02109
(Address of principal executive offices) (Zip code)
Eric D. Roiter, Secretary
82 Devonshire St.
Boston, Massachusetts 02109
(Name and address of agent for service)
Registrant's telephone number, including area code: 617-563-7000
Date of fiscal year end: | October 31 |
| |
Date of reporting period: | October 31, 2003 |
Item 1. Reports to Stockholders
Fidelity® Advisor
Diversified International
Fund - Class A, Class T, Class B
and Class C
Annual Report
October 31, 2003
(2_fidelity_logos) (Registered_Trademark)
Contents
Chairman's Message | <Click Here> | Ned Johnson's message to shareholders. |
Performance | <Click Here> | How the fund has done over time. |
Management's Discussion | <Click Here> | The manager's review of fund performance, strategy and outlook. |
Investment Changes | <Click Here> | A summary of major shifts in the fund's investments over the past six months. |
Investments | <Click Here> | A complete list of the fund's investments with their market values. |
Financial Statements | <Click Here> | Statements of assets and liabilities, operations, and changes in net assets,
as well as financial highlights. |
Notes | <Click Here> | Notes to the financial statements. |
Auditors' Opinion | <Click Here> | |
Trustees and Officers | <Click Here> | |
Distributions | <Click Here> | |
For a free copy of the fund's proxy voting guidelines call 1-877-208-0098 or visit the Securities and Exchange Commission (SEC)'s web site at www.sec.gov.
Standard and Poor's, S&P and S&P 500 are registered service marks of The McGraw-Hill Companies Inc. and have been licensed for use by Fidelity Distributors Corporation.
Other third party marks appearing herein are the property of their respective owners.
All other marks appearing herein are registered or unregistered trademarks or service marks of FMR Corp. or an affiliated company.
(Recycle graphic) This report is printed on recycled paper using soy-based inks.
This report and the financial statements contained herein are submitted for the general information of the shareholders of the fund. This report is not authorized for distribution to prospective investors in the fund unless preceded or accompanied by an effective prospectus.
Mutual fund shares are not deposits or obligations of, or guaranteed by, any depository institution. Shares are not insured by the FDIC, Federal Reserve Board or any other agency, and are subject to investment risks, including possible loss of principal amount invested.
Neither the fund nor Fidelity Distributors Corporation is a bank.
For more information on any Fidelity Advisor fund, including charges and expenses, contact your investment professional for a free prospectus. Read it carefully before you invest or send money.
Annual Report
Chairman's Message
(photo_of_Edward_C_Johnson_3d)
Dear Shareholder:
Many of you have read or heard news stories recently that were critical of mutual funds and made allegations that the mutual fund industry has been less than forthright. I find these reports unsettling and not necessarily an accurate picture of the overall industry, and I would like you to know where we at Fidelity stand.
With specific regard to allegations that certain mutual fund companies were violating the Securities and Exchange Commission's forward pricing rules or were involved in so-called "market timing" activities, I want to say two things:
First, Fidelity does not have agreements that permit customers who buy fund shares after 4 p.m. to obtain the 4 p.m. price. This is not to say that someone could not deceive the company through fraudulent acts. But I underscore that we have no so-called "agreements" which would permit this illegal practice.
Second, Fidelity has been on record for years opposing predatory short-term trading which adversely affects other shareholders in a mutual fund. In fact, in the 1980s, we began charging a fee - which is returned to the fund and, therefore, to investors - to discourage this activity. What's more, several years ago we took the industry lead in developing a Fair Value Pricing Policy to prevent market timing on foreign securities in our funds. It is reasonable to assume that another structure can be developed that would alter the system to make it much more difficult for predatory traders to operate. This, however, will only be achieved through close cooperation among regulators, legislators and the industry.
Certainly no industry is perfect, and there have been instances of unethical and illegal activity from time to time within the mutual fund industry. When this occurs, confessed or convicted offenders should be dealt with appropriately. Clearly, every system can be improved. We applaud well thought out improvements by regulators, legislators and industry representatives that achieve the common goal of building and protecting the value of investors' holdings. But we remain concerned about the risk of over-regulation and the quick application of simplistic solutions to intricate problems.
For more than 57 years, Fidelity Investments has worked very hard to improve its products and service to justify your trust. When our family founded this company in 1946, we had only a few hundred customers. Many of them were family and friends. Today, we serve more than 18 million customers including individual investors and participants in retirement plans across America.
Let me close by saying that we do not take your trust in us for granted, and we realize that we must always work to improve all aspects of our service to you. In turn, we urge you to continue your active participation with your financial matters, so that your interests can be well served.
Annual Report
Best regards,
/s/Edward C. Johnson 3d
Edward C. Johnson 3d
Annual Report
Performance: The Bottom Line
Average annual total return reflects the change in the value of an investment, assuming reinvestment of the class' dividend income and capital gains (the profits earned upon the sale of securities that have grown in value) and assuming a constant rate of performance each year. During periods of reimbursement by Fidelity, a fund's total return will be greater than it would be had the reimbursement not occurred. The $10,000 table and the fund's returns do not reflect the deduction of taxes that a shareholder would pay on fund distributions or the redemption of fund shares. How a fund did yesterday is no guarantee of how it will do tomorrow. Returns reflect the conversion of Class B shares to Class A shares after a maximum of seven years after their commencement of operations.
Average Annual Total Returns
Periods ended October 31, 2003 | | Past 1
year | Life of
fund A |
Class A (incl. 5.75% sales
charge) | | 24.40% | 7.67% |
Class T (incl. 3.50% sales
charge) | | 27.05% | 7.87% |
Class B (incl. contingent
deferred sales charge) B | | 25.90% | 7.78% |
Class C (incl. contingent
deferred sales charge)C | | 29.94% | 8.13% |
A From December 17, 1998.
B Class B shares' contingent deferred sales charges included in the past one year and life of fund total return figures are 5% and 1%, respectively.
C Class C shares' contingent deferred sales charges included in the past one year and life of fund total return figures are 1% and 0%, respectively.
Annual Report
$10,000 Over Life of Fund
Let's say hypothetically that $10,000 was invested in Fidelity® Advisor Diversified International Fund - Class T on December 17, 1998, when the fund started, and the current 3.50% sales charge was paid. The chart shows how the value of your investment would have grown, and also shows how the MSCI® EAFE® Index did over the same period.
Annual Report
Management's Discussion of Fund Performance
Comments from Bill Bower, Portfolio Manager of Fidelity® Advisor Diversified International Fund
Mirroring the U.S. rally, most international stock markets rebounded sharply during the 12-month period ending October 31, 2003. Encouraged by improved corporate earnings, favorable interest rates and the easing of geopolitical tensions, the Morgan Stanley Capital InternationalSM Europe, Australasia, Far East (MSCI® EAFE®) Index - - a proxy for stock markets outside the United States and Canada - gained 27.39% during the past year. From a regional perspective, all 16 countries in the MSCI Europe index - which gained 24.56% - had double-digit advances. Spain, Denmark and Sweden were among the region's best performers. In Japan, increased capital spending, exports and machinery orders helped the Tokyo Stock Exchange Stock Price Index (TOPIX) advance 36.39%. Following the SARS epidemic, other Asian markets also rebounded. For instance, the Hong Kong market, as measured by the Hang Seng Index, gained 34.51%. Emerging markets also fared well, particularly Latin America. The MSCI Emerging Markets Free-Latin America Index rose 59.75%. Canadian equities, as measured by the S&P®/TSX Composite Index, also posted an impressive annual gain, advancing 50.66%.
For the 12 months ending October 31, 2003, Fidelity Advisor Diversified International Fund's Class A, Class T, Class B and Class C shares were up 31.99%, 31.66%, 30.90% and 30.94%, respectively, topping the LipperSM International Funds Average, which rose 24.51%, as well as the MSCI EAFE index. The fund's holdings outperformed those of the index in eight of the 10 major market sectors. Our biggest advantage came in the energy industry, where an emphasis on energy services stocks proved quite helpful. Elsewhere, Japanese brokerage stocks - including Nomura and Nikko Cordial - were beneficiaries of the rising equity markets. Increasing the fund's emerging-markets exposure early in the period also worked out well, as several of these stocks rallied sharply. Keeping a low exposure to European technology companies was disappointing, however, given that the market's willingness to pay for their only modestly better earnings growth was much greater than I expected, and these stocks rose. Looking at individual detractors, Anglo/Dutch consumer staples giant Unilever was hurt by disappointing third-quarter 2003 sales, and Swiss pharmaceutical firm Novartis declined due to lower-than-expected third-quarter profits.
The views expressed in this statement reflect those of the portfolio manager only through the end of the period of the report as stated on the cover and do not necessarily represent the views of Fidelity or any other person in the Fidelity organization. Any such views are subject to change at any time based upon market or other conditions and Fidelity disclaims any responsibility to update such views. These views may not be relied on as investment advice and, because investment decisions for a Fidelity fund are based on numerous factors, may not be relied on as an indication of trading intent on behalf of any Fidelity fund.
Annual Report
Investment Changes
Top Five Stocks as of October 31, 2003 |
| % of fund's
net assets | % of fund's net assets
6 months ago |
Novartis AG (Switzerland, Pharmaceuticals) | 2.0 | 2.5 |
Unilever NV (NY Shares) (Netherlands, Food Products) | 1.7 | 2.0 |
Vodafone Group PLC sponsored ADR (United Kingdom, Wireless Telecommunication Services) | 1.3 | 0.9 |
HSBC Holdings PLC (United Kingdom, Commercial Banks) | 1.2 | 1.2 |
GlaxoSmithKline PLC sponsored ADR (United Kingdom, Pharmaceuticals) | 1.2 | 1.6 |
| 7.4 | |
Top Five Market Sectors as of October 31, 2003 |
| % of fund's
net assets | % of fund's net assets
6 months ago |
Financials | 21.6 | 22.1 |
Health Care | 13.2 | 14.3 |
Consumer Discretionary | 11.8 | 12.4 |
Information Technology | 10.7 | 9.6 |
Consumer Staples | 9.0 | 11.1 |
Top Five Countries as of October 31, 2003 |
(excluding cash equivalents) | % of fund's
net assets | % of fund's net assets
6 months ago |
United Kingdom | 16.5 | 15.0 |
Japan | 15.2 | 11.3 |
Switzerland | 6.6 | 7.4 |
France | 5.4 | 7.2 |
Canada | 5.4 | 5.7 |
Percentages are adjusted for the effect of open futures contracts, if applicable. |
Asset Allocation (% of fund's net assets) |
As of October 31, 2003 | As of April 30, 2003 |
 | Stocks and Investment Companies 91.6% | | | Stocks and Investment Companies 94.0% | |
 | Bonds 1.0% | | | Bonds 1.0% | |
 | Short-Term
Investments and
Net Other Assets 7.4% | | | Short-Term
Investments and
Net Other Assets 5.0% | |

Annual Report
Investments October 31, 2003
Showing Percentage of Net Assets
Common Stocks - 90.8% |
| Shares | | Value (Note 1) (000s) |
Australia - 2.6% |
Australia & New Zealand Banking Group Ltd. | 319,800 | | $ 4,029 |
Australia & New Zealand Banking Group Ltd. rights 11/24/03 (a) | 58,145 | | 177 |
Australian Gas Light Co. | 308,407 | | 2,336 |
Billabong International Ltd. | 190,900 | | 989 |
CSL Ltd. | 410,923 | | 4,944 |
Fosters Group Ltd. | 556,242 | | 1,799 |
Macquarie Bank Ltd. | 164,147 | | 4,048 |
National Australia Bank Ltd. | 121,600 | | 2,633 |
News Corp. Ltd.: | | | |
ADR | 54,700 | | 1,950 |
sponsored ADR | 23,300 | | 687 |
Promina Group Ltd. | 586,555 | | 1,378 |
QBE Insurance Group Ltd. | 901,525 | | 6,572 |
Sons of Gwalia Ltd. | 41,800 | | 102 |
Suncorp-Metway Ltd. | 265,400 | | 2,436 |
Westfield Holdings Ltd. | 198,900 | | 2,000 |
TOTAL AUSTRALIA | | 36,080 |
Belgium - 0.4% |
Agfa-Gevaert NV | 102,909 | | 2,545 |
Groupe Bruxelles Lambert SA (GBL) | 22,310 | | 1,074 |
Melexis NV | 159,750 | | 1,745 |
TOTAL BELGIUM | | 5,364 |
Bermuda - 0.3% |
Aquarius Platinum Ltd. (Australia) | 373,455 | | 2,075 |
Clear Media Ltd. (a) | 3,064,100 | | 2,012 |
TOTAL BERMUDA | | 4,087 |
Brazil - 0.8% |
Companhia Vale do Rio Doce sponsored ADR | 174,400 | | 7,979 |
Embraer - Empresa Brasileira de Aeronautica SA sponsored ADR | 25,000 | | 649 |
Petroleo Brasileiro SA Petrobras sponsored ADR | 116,100 | | 2,728 |
TOTAL BRAZIL | | 11,356 |
Canada - 5.4% |
Aber Diamond Corp. (a) | 55,500 | | 1,753 |
Alcan, Inc. | 64,800 | | 2,585 |
Astral Media, Inc. Class A (non-vtg.) | 61,200 | | 1,216 |
Barrick Gold Corp. | 89,100 | | 1,733 |
Common Stocks - continued |
| Shares | | Value (Note 1) (000s) |
Canada - continued |
BCE, Inc. | 80,300 | | $ 1,818 |
Bombardier, Inc. Class B (sub. vtg.) | 407,100 | | 1,828 |
Canadian Natural Resources Ltd. | 55,900 | | 2,374 |
Canadian Western Bank, Edmonton | 23,600 | | 715 |
EnCana Corp. | 243,344 | | 8,355 |
Falconbridge Ltd. | 79,800 | | 1,555 |
ITF Optical Technologies, Inc. Series A (g) | 1,792 | | 2 |
Kinross Gold Corp. (a)(e) | 96,700 | | 793 |
Kinross Gold Corp. (a) | 63,433 | | 520 |
Loblaw Companies Ltd. | 23,800 | | 1,153 |
Mega Bloks, Inc. (a) | 67,900 | | 1,293 |
Mega Bloks, Inc. (a)(e) | 23,400 | | 445 |
Meridian Gold, Inc. (a) | 54,500 | | 691 |
Metro, Inc. Class A (sub. vtg.) | 24,000 | | 361 |
National Bank of Canada | 124,400 | | 3,860 |
OZ Optics Ltd. unit (g) | 5,400 | | 80 |
Petro-Canada | 231,200 | | 9,316 |
PetroKazakhstan, Inc. Class A (a) | 127,200 | | 2,894 |
Power Corp. of Canada (sub. vtg.) | 118,100 | | 3,879 |
Precision Drilling Corp. (a) | 173,400 | | 6,822 |
Saputo, Inc. | 89,000 | | 1,769 |
Sun Life Financial, Inc. | 175,418 | | 4,336 |
Talisman Energy, Inc. | 112,000 | | 5,470 |
TELUS Corp. (non-vtg.) | 61,600 | | 1,079 |
Thunder Energy, Inc. (a) | 81,300 | | 438 |
TimberWest Forest Corp. unit | 242,300 | | 2,128 |
TransCanada Corp. | 125,600 | | 2,562 |
Trican Well Service Ltd. (a) | 52,400 | | 914 |
Wheaton River Minerals Ltd. (a) | 369,500 | | 858 |
TOTAL CANADA | | 75,595 |
Cayman Islands - 0.2% |
Apex Silver Mines Ltd. (a) | 173,800 | | 2,336 |
China - 1.0% |
Byd Co. Ltd. (H Shares) | 925,000 | | 2,412 |
China Oilfield Services Ltd. (H Shares) | 1,090,000 | | 316 |
China Shipping Development Co. Ltd. (H Shares) | 1,082,000 | | 711 |
China Telecom Corp. Ltd. sponsored ADR | 159,100 | | 5,169 |
Lianhua Supermarket Holdings Co. (H Shares) | 669,000 | | 655 |
Peoples Food Holdings Ltd. | 2,779,000 | | 1,773 |
PetroChina Co. Ltd. sponsored ADR | 21,800 | | 794 |
Common Stocks - continued |
| Shares | | Value (Note 1) (000s) |
China - continued |
PICC Property & Casualty Co. Ltd. (H Shares) | 308,000 | | $ 72 |
Tsingtao Brewery Co. Ltd. (H Shares) | 918,000 | | 1,194 |
Zhenhai Refining & Chemical Co. (H Shares) | 1,064,000 | | 651 |
TOTAL CHINA | | 13,747 |
Denmark - 2.6% |
A.P. Moller - Maersk AS: | | | |
Series A | 78 | | 591 |
Series B | 410 | | 3,207 |
Coloplast AS Series B | 38,750 | | 3,249 |
Danske Bank AS | 367,775 | | 7,393 |
Group 4 Falck AS | 312,385 | | 6,986 |
Novo Nordisk AS Series B | 251,543 | | 9,016 |
Novozymes AS Series B | 176,000 | | 5,650 |
TOTAL DENMARK | | 36,092 |
Finland - 0.6% |
Nokia Corp. sponsored ADR | 453,400 | | 7,703 |
TietoEnator Oyj | 10,800 | | 285 |
TOTAL FINLAND | | 7,988 |
France - 5.4% |
AXA SA sponsored ADR | 309,500 | | 5,881 |
Bacou Dalloz | 24,013 | | 1,869 |
BNP Paribas SA | 163,000 | | 8,535 |
CNP Assurances | 86,093 | | 3,913 |
Credit Agricole SA | 91,800 | | 1,943 |
Credit Agricole SA rights 11/7/03 (a) | 91,800 | | 21 |
Dassault Aviation SA | 3,688 | | 1,339 |
Essilor International SA | 82,578 | | 3,959 |
Financiere Marc de Lacharriere SA (Fimalac) | 57,957 | | 1,651 |
Financiere Marc de Lacharriere SA (Fimalac) warrants 12/31/06 (a) | 5,532 | | 16 |
Ipsos SA | 25,585 | | 2,152 |
L'Oreal SA | 73,350 | | 5,404 |
Lagardere S.C.A. (Reg.) | 10,700 | | 536 |
Louis Vuitton Moet Hennessy (LVMH) | 7,100 | | 489 |
Neopost SA | 99,546 | | 4,925 |
NRJ Group | 84,320 | | 1,646 |
Pernod-Ricard | 45,703 | | 4,394 |
Suez SA (France) | 65,400 | | 1,046 |
Technip-Coflexip SA | 58,527 | | 5,763 |
Common Stocks - continued |
| Shares | | Value (Note 1) (000s) |
France - continued |
Television Francaise 1 SA | 90,733 | | $ 2,712 |
Total SA sponsored ADR | 169,100 | | 13,202 |
Vinci SA | 25,100 | | 1,813 |
Vivendi Universal SA sponsored ADR (a) | 136,300 | | 2,866 |
TOTAL FRANCE | | 76,075 |
Germany - 3.5% |
Allianz AG sponsored ADR | 795,070 | | 8,579 |
Altana AG sponsored ADR | 98,750 | | 6,202 |
AWD Holding AG | 19,973 | | 555 |
Bayerische Hypo Und Verein AG (a) | 53,000 | | 1,163 |
Celanese AG (Reg.) | 72,458 | | 2,512 |
Celesio AG | 48,327 | | 2,015 |
Deutsche Boerse AG | 151,076 | | 8,369 |
Deutsche Telekom AG sponsored ADR (a) | 298,100 | | 4,653 |
Epcos AG (a) | 31,300 | | 643 |
Fresenius Medical Care AG sponsored ADR | 246,700 | | 4,680 |
GFK AG | 56,213 | | 1,403 |
Metro AG | 62,000 | | 2,527 |
Muenchener Rueckversicherungs-Gesellschaft AG: | | | |
rights 11/10/03 (a) | 21,634 | | 178 |
(Reg.) | 27,723 | | 3,295 |
Stada Arzneimittel AG | 49,084 | | 2,535 |
TOTAL GERMANY | | 49,309 |
Greece - 0.8% |
Coca-Cola Hellenic Bottling Co. SA (Bearer) | 112,120 | | 2,164 |
Cosmote Mobile Telecommunications SA | 109,100 | | 1,249 |
Greek Organization of Football Prognostics SA | 195,510 | | 2,401 |
Hellenic Technodomiki Tev SA | 88,440 | | 465 |
Public Power Corp. of Greece | 167,830 | | 3,605 |
Technical Olympic SA (Reg.) | 143,800 | | 706 |
TOTAL GREECE | | 10,590 |
Hong Kong - 1.9% |
Aeon Credit Service (Asia) Co. Ltd. | 716,000 | | 445 |
CNOOC Ltd. sponsored ADR | 116,900 | | 4,401 |
Esprit Holdings Ltd. | 189,500 | | 595 |
Global Bio-Chem Technology Group Co. Ltd. | 2,652,000 | | 1,349 |
Hutchison Whampoa Ltd. | 528,000 | | 4,097 |
Kingboard Chemical Holdings Ltd. | 702,000 | | 940 |
Li & Fung Ltd. | 1,248,000 | | 2,097 |
Common Stocks - continued |
| Shares | | Value (Note 1) (000s) |
Hong Kong - continued |
Techtronic Industries Co. | 2,828,000 | | $ 7,793 |
Television Broadcasts Ltd. | 441,000 | | 2,090 |
Yue Yuen Industrial Holdings Ltd. | 867,061 | | 2,456 |
TOTAL HONG KONG | | 26,263 |
India - 2.6% |
Bajaj Auto Ltd. | 92,600 | | 1,870 |
Dr. Reddy's Laboratories Ltd. | 203,740 | | 5,373 |
HDFC Bank Ltd. | 250,672 | | 1,750 |
Housing Development Finance Corp. Ltd. | 578,750 | | 6,639 |
I-Flex Solutions Ltd. | 123,332 | | 1,869 |
Infosys Technologies Ltd. | 48,776 | | 5,103 |
Ranbaxy Laboratories Ltd. | 260,821 | | 5,658 |
Satyam Computer Services Ltd. | 575,400 | | 3,886 |
State Bank of India | 386,077 | | 4,125 |
TOTAL INDIA | | 36,273 |
Indonesia - 0.1% |
PT Bank Rakyat Indonesia (a)(f) | 7,993,000 | | 823 |
Ireland - 1.1% |
Allied Irish Banks PLC | 147,600 | | 2,154 |
Bank of Ireland | 299,677 | | 3,711 |
CRH PLC | 122,100 | | 2,185 |
IAWS Group PLC (Ireland) | 319,300 | | 3,403 |
Independent News & Media PLC (Ireland) | 1,281,457 | | 2,791 |
Kerry Group PLC Class A | 107,500 | | 1,868 |
TOTAL IRELAND | | 16,112 |
Israel - 0.3% |
Teva Pharmaceutical Industries Ltd. sponsored ADR | 79,600 | | 4,528 |
Italy - 1.3% |
Banca Intesa Spa | 1,248,431 | | 4,203 |
Banco Popolare di Verona e Novara | 174,813 | | 2,692 |
Cassa Di Risparmio Di Firenze | 502,025 | | 776 |
ENI Spa sponsored ADR | 44,400 | | 3,530 |
Telecom Italia Spa ADR (a) | 259,462 | | 6,720 |
TOTAL ITALY | | 17,921 |
Japan - 14.8% |
Access Co. Ltd. (a) | 10 | | 576 |
Aeon Credit Service Ltd. | 29,500 | | 1,366 |
Asahi Glass Co. Ltd. | 196,000 | | 1,547 |
Common Stocks - continued |
| Shares | | Value (Note 1) (000s) |
Japan - continued |
Avex, Inc. | 15,700 | | $ 313 |
Canon, Inc. ADR | 232,200 | | 11,366 |
Credit Saison Co. Ltd. | 152,000 | | 3,180 |
Daicel Chemical Industries Ltd. | 107,000 | | 454 |
Daito Trust Construction Co. | 74,800 | | 2,313 |
Daiwa Securities Group, Inc. | 1,521,000 | | 11,123 |
Dwango Co. Ltd. | 31 | | 451 |
Enplas Corp. | 34,800 | | 1,155 |
Fuji Soft ABC, Inc. | 10,400 | | 315 |
Fuji Television Network, Inc. | 157 | | 835 |
Gigno System Japan, Inc. | 104 | | 283 |
Hoya Corp. | 62,200 | | 5,629 |
Index Corp. | 52 | | 350 |
Ito Yokado Ltd. | 94,000 | | 3,454 |
JAFCO Co. Ltd. | 34,700 | | 2,967 |
Kadokawa Shoten Publishing Co. Ltd. | 10,500 | | 304 |
Keyence Corp. | 15,100 | | 3,321 |
Konica Minolta Holdings, Inc. | 486,500 | | 6,394 |
Kyocera Corp. | 62,100 | | 3,739 |
Kyocera Corp. sponsored ADR | 10,200 | | 626 |
Kyorin Pharmaceutical Co. Ltd. | 52,000 | | 783 |
Millea Holdings, Inc. | 208 | | 2,478 |
Mitsubishi Securities Co. Ltd. | 103,000 | | 1,171 |
Murata Manufacturing Co. Ltd. | 52,200 | | 2,968 |
Nikko Cordial Corp. | 2,802,000 | | 15,114 |
Nikon Corp. (a) | 186,000 | | 2,824 |
Nissan Motor Co. Ltd. | 563,100 | | 6,366 |
Nitori Co. Ltd. | 8,550 | | 545 |
Nitto Denko Corp. | 80,700 | | 4,235 |
NOK Corp. | 11,000 | | 433 |
Nomura Holdings, Inc. | 929,000 | | 15,954 |
Olympus Corp. | 97,000 | | 2,126 |
ORIX Corp. | 88,300 | | 7,429 |
Ricoh Co. Ltd. | 107,000 | | 2,029 |
Rohm Co. Ltd. | 45,400 | | 6,120 |
Seiyu Ltd. (a) | 770,000 | | 2,486 |
Shin-Etsu Chemical Co. Ltd. | 173,900 | | 6,469 |
Shinko Electric Industries Co.Ltd. | 49,000 | | 1,203 |
Sony Corp. sponsored ADR | 354,000 | | 12,461 |
Stanley Electric Co. Ltd. | 97,000 | | 2,065 |
Sumitomo Mitsui Financial Group, Inc. | 2,323 | | 11,685 |
TDK Corp. | 55,500 | | 3,635 |
Common Stocks - continued |
| Shares | | Value (Note 1) (000s) |
Japan - continued |
Terumo Corp. | 113,900 | | $ 2,165 |
Tokyo Electron Ltd. | 148,600 | | 10,651 |
Toshiba Corp. | 1,250,000 | | 5,014 |
Toyota Industries Corp. | 94,500 | | 1,745 |
Toyota Motor Corp. | 32,600 | | 946 |
Toyota Motor Corp. ADR | 154,800 | | 8,981 |
UFJ Holdings, Inc. (a) | 611 | | 2,612 |
USS Co. Ltd. | 10,660 | | 757 |
Yamada Denki Co. Ltd. | 35,300 | | 1,124 |
TOTAL JAPAN | | 206,635 |
Korea (South) - 1.6% |
Amorepacific Corp. | 13,550 | | 1,860 |
Honam Petrochemical Corp. | 21,210 | | 849 |
Kookmin Bank | 1,260 | | 46 |
Kookmin Bank sponsord ADR | 113,210 | | 4,160 |
KT&G Corp. | 84,650 | | 1,631 |
LG Card Co. Ltd. | 140,810 | | 1,434 |
LG Electronics, Inc. | 27,370 | | 1,418 |
Samsung Electronics Co. Ltd. | 28,900 | | 11,477 |
TOTAL KOREA (SOUTH) | | 22,875 |
Luxembourg - 0.1% |
SES Global Fiduciary Depositary Receipts | 178,405 | | 1,583 |
Mexico - 0.7% |
Coca-Cola Femsa SA de CV sponsored ADR (a) | 152,800 | | 3,087 |
Fomento Economico Mexicano SA de CV sponsored ADR | 66,000 | | 2,358 |
Grupo Radio Centro SA de CV sponsored ADR | 130,900 | | 795 |
TV Azteca SA de CV sponsored ADR | 415,800 | | 3,364 |
TOTAL MEXICO | | 9,604 |
Netherlands - 5.1% |
ASML Holding NV (NY Shares) (a) | 534,500 | | 9,380 |
EADS NV | 99,108 | | 2,009 |
Euronext NV | 159,347 | | 3,886 |
Fugro NV (Certificaten Van Aandelen) | 62,700 | | 3,141 |
ING Groep NV sponsored ADR | 315,541 | | 6,576 |
Koninklijke Numico NV (Certificaten Van Aandelen) (a) | 105,000 | | 2,361 |
Koninklijke Philips Electronics NV (NY Shares) | 120,300 | | 3,229 |
Nutreco Holding NV | 42,200 | | 1,124 |
OPG Groep NV (A Shares) | 35,100 | | 1,256 |
Royal Dutch Petroleum Co. (NY Shares) | 149,500 | | 6,635 |
Common Stocks - continued |
| Shares | | Value (Note 1) (000s) |
Netherlands - continued |
Unilever NV (NY Shares) | 396,600 | | $ 23,261 |
Van der Moolen Holding NV sponsored ADR | 73,200 | | 632 |
Vedior NV (Certificaten Van Aandelen) | 202,992 | | 2,916 |
VNU NV | 158,049 | | 4,797 |
TOTAL NETHERLANDS | | 71,203 |
Netherlands Antilles - 0.3% |
Schlumberger Ltd. (NY Shares) | 96,200 | | 4,519 |
Norway - 1.1% |
DnB Holding ASA | 841,100 | | 4,886 |
Gjensidige NOR ASA | 49,900 | | 2,035 |
Orkla ASA (A Shares) | 43,650 | | 910 |
ProSafe ASA | 60,350 | | 1,076 |
Schibsted AS (B Shares) | 113,750 | | 1,992 |
Storebrand ASA (A Shares) (a) | 760,300 | | 4,213 |
TOTAL NORWAY | | 15,112 |
Panama - 0.2% |
Banco Latin Americano de Exporaciones SA (BLADEX)
Series E (a) | 180,328 | | 2,705 |
Portugal - 0.3% |
Brisa Auto-Estradas de Portugal SA | 296,921 | | 1,851 |
Portugal Telecom SGPS SA sponsored ADR | 209,600 | | 1,771 |
TOTAL PORTUGAL | | 3,622 |
Russia - 1.3% |
JSC MMC 'Norilsk Nickel' sponsored ADR | 54,400 | | 2,788 |
Lukoil Oil Co. sponsored ADR | 43,100 | | 3,504 |
Mobile TeleSystems OJSC sponsored ADR | 30,300 | | 2,348 |
OAO Gazprom sponsored ADR | 99,500 | | 2,388 |
Sibneft sponsored ADR | 65,900 | | 1,433 |
Surgutneftegaz JSC sponsored ADR | 31,900 | | 792 |
YUKOS Corp. sponsored ADR | 116,957 | | 5,403 |
TOTAL RUSSIA | | 18,656 |
Singapore - 0.2% |
Datacraft Asia Ltd. (a) | 532,000 | | 665 |
Fraser & Neave Ltd. | 101,620 | | 719 |
Want Want Holdings Ltd. | 1,493,000 | | 1,262 |
TOTAL SINGAPORE | | 2,646 |
Common Stocks - continued |
| Shares | | Value (Note 1) (000s) |
South Africa - 0.4% |
Anglo American Platinum Corp. Ltd. | 25,100 | | $ 1,075 |
Gold Fields Ltd. sponsored ADR | 91,600 | | 1,312 |
Harmony Gold Mining Co. Ltd. sponsored ADR | 193,600 | | 2,927 |
MTN Group Ltd. (a) | 108,000 | | 387 |
TOTAL SOUTH AFRICA | | 5,701 |
Spain - 4.1% |
Actividades de Construccion y Servicios SA (ACS) | 136,771 | | 5,739 |
Altadis SA (Spain) | 470,969 | | 11,381 |
Banco Bilbao Vizcaya Argentaria SA sponsored ADR | 456,100 | | 5,209 |
Banco Espanol de Credito SA (Reg.) | 52,600 | | 526 |
Banco Popular Espanol SA (Reg.) | 94,876 | | 4,916 |
Banco Santander Central Hispano SA ADR | 788,400 | | 7,513 |
Compania de Distribucion Integral Logista SA | 76,480 | | 2,051 |
Fomento Construcciones y Contratas SA (FOCSA) | 100,734 | | 3,274 |
Grupo Auxiliar Metalurgico SA (Gamesa) | 40,600 | | 1,095 |
Grupo Ferrovial SA | 111,471 | | 3,172 |
Inditex SA | 189,456 | | 3,900 |
Prosegur Comp Securidad SA (Reg.) | 65,200 | | 1,057 |
Repsol YPF SA sponsored ADR | 84,300 | | 1,464 |
Telefonica SA sponsored ADR | 145,900 | | 5,457 |
Union Fenosa SA | 54,400 | | 876 |
TOTAL SPAIN | | 57,630 |
Sweden - 2.1% |
Eniro AB | 268,000 | | 2,138 |
Getinge AB (B Shares) | 72,800 | | 2,654 |
Hennes & Mauritz AB (H&M) (B Shares) | 173,400 | | 3,664 |
Nordea AB | 241,100 | | 1,490 |
OMHEX AB | 161,500 | | 1,649 |
Securitas AB (B Shares) | 560,000 | | 6,863 |
Svenska Cellulosa AB (SCA) (B Shares) | 93,850 | | 3,529 |
Swedish Match Co. | 352,300 | | 2,856 |
Tele2 AB (B Shares) (a) | 32,500 | | 1,629 |
Telefonaktiebolaget LM Ericsson ADR (a) | 197,500 | | 3,373 |
TV 4 AB (A Shares) | 12,500 | | 244 |
TOTAL SWEDEN | | 30,089 |
Switzerland - 6.6% |
Actelion Ltd. (Reg.) (a) | 39,490 | | 3,741 |
Alcon, Inc. | 88,400 | | 4,872 |
Compagnie Financiere Richemont unit | 101,226 | | 2,269 |
Common Stocks - continued |
| Shares | | Value (Note 1) (000s) |
Switzerland - continued |
Converium Holding AG | 54,318 | | $ 2,666 |
Credit Suisse Group sponsored ADR | 330,500 | | 11,660 |
INFICON Holding AG (a) | 23,156 | | 1,727 |
Nestle SA (Reg.) | 30,138 | | 6,609 |
Nobel Biocare Holding AG (Switzerland) | 83,267 | | 7,360 |
Novartis AG sponsored ADR | 717,432 | | 27,534 |
Roche Holding AG (participation certificate) | 127,964 | | 10,548 |
Schindler Holding AG (Reg'd.) (a) | 9,961 | | 2,504 |
SIG Holding AG | 12,046 | | 1,611 |
Swiss Life Holding (a) | 6,903 | | 1,166 |
Tecan Group AG | 46,549 | | 1,667 |
The Swatch Group AG (Reg.) | 188,286 | | 4,003 |
UBS AG (NY Shares) | 45,647 | | 2,800 |
TOTAL SWITZERLAND | | 92,737 |
Taiwan - 1.0% |
Chinatrust Financial Holding Co. | 1,418,650 | | 1,476 |
Fubon Financial Holding Co. Ltd. | 1,603,787 | | 1,692 |
Hon Hai Precision Industries Co. Ltd. | 967,000 | | 4,332 |
Taiwan Semiconductor Manufacturing Co. Ltd. (a) | 2,563,160 | | 5,061 |
United Microelectronics Corp. (a) | 664,000 | | 609 |
Yuanta Core Pacific Securities Co. Ltd. | 1,115,789 | | 694 |
TOTAL TAIWAN | | 13,864 |
Thailand - 0.0% |
BEC World PCL (For. Reg.) | 54,500 | | 330 |
United Kingdom - 16.1% |
Amdocs Ltd. (a) | 109,800 | | 2,356 |
Amersham PLC | 104,400 | | 1,298 |
Anglo American PLC: | | | |
ADR | 32,205 | | 658 |
(United Kingdom) | 70,800 | | 1,447 |
ARM Holdings PLC sponsored ADR (a) | 258,400 | | 1,496 |
AstraZeneca PLC sponsored ADR | 311,100 | | 14,833 |
Astro All Asia Networks PLC (a) | 166,000 | | 206 |
BAE Systems PLC | 1,005,600 | | 3,118 |
BBA Group PLC | 336,800 | | 1,482 |
BOC Group PLC | 264,227 | | 3,597 |
BP PLC sponsored ADR | 232,000 | | 9,832 |
British American Tobacco PLC sponsored ADR | 267,400 | | 6,436 |
Capita Group PLC | 1,058,600 | | 4,435 |
Capital Radio PLC | 141,792 | | 1,129 |
Common Stocks - continued |
| Shares | | Value (Note 1) (000s) |
United Kingdom - continued |
Celltech Group PLC (a) | 252,012 | | $ 1,960 |
Centrica PLC | 1,508,900 | | 4,717 |
Danka Business Systems PLC sponsored ADR (a) | 324,900 | | 997 |
Enterprise Inns PLC | 232,313 | | 3,328 |
French Connection Group PLC | 45,350 | | 1,516 |
Gallaher Group PLC sponsored ADR | 86,500 | | 3,456 |
GlaxoSmithKline PLC sponsored ADR | 383,180 | | 16,588 |
Hays PLC | 860,800 | | 1,779 |
HSBC Holdings PLC: | | | |
(United Kingdom) (Reg.) | 3,300 | | 50 |
sponsored ADR | 221,500 | | 16,628 |
Icap PLC | 32,600 | | 764 |
Inchcape PLC | 160,460 | | 3,714 |
Intertek Group PLC | 314,600 | | 2,737 |
Johnston Press PLC | 215,570 | | 1,698 |
Kesa Electricals PLC | 475,912 | | 1,968 |
Kingfisher PLC | 895,374 | | 4,286 |
London Stock Exchange PLC | 299,023 | | 1,938 |
Maiden Group PLC | 187,100 | | 808 |
Man Group PLC | 112,600 | | 2,765 |
National Grid Transco PLC | 201,400 | | 1,284 |
Next PLC | 285,800 | | 5,714 |
Northern Rock PLC | 243,800 | | 2,927 |
Pennon Group PLC | 106,601 | | 1,153 |
PHS Group PLC | 677,708 | | 993 |
Prudential PLC | 837,000 | | 6,485 |
Punch Taverns Ltd. | 341,700 | | 1,964 |
Reckitt Benckiser PLC | 442,100 | | 9,289 |
Rentokil Initial PLC | 641,300 | | 2,426 |
Rio Tinto PLC (Reg.) | 166,700 | | 4,128 |
Royal Bank of Scotland Group PLC | 101,800 | | 2,724 |
Shire Pharmaceuticals Group PLC sponsored ADR (a) | 122,100 | | 2,796 |
Signet Group PLC | 213,200 | | 374 |
SMG PLC | 813,557 | | 1,392 |
Smith & Nephew PLC | 1,008,200 | | 7,999 |
Standard Chartered PLC | 154,100 | | 2,461 |
Taylor Nelson Sofres PLC | 958,520 | | 3,500 |
Tesco PLC | 2,792,700 | | 11,179 |
Trinity Mirror PLC | 259,695 | | 2,381 |
United Business Media PLC | 160,509 | | 1,262 |
Vodafone Group PLC sponsored ADR | 871,800 | | 18,439 |
William Hill PLC | 577,000 | | 3,314 |
Common Stocks - continued |
| Shares | | Value (Note 1) (000s) |
United Kingdom - continued |
Wolfson Microelectronics PLC (a) | 39,100 | | $ 157 |
Xstrata PLC | 454,781 | | 4,662 |
Yell Group PLC (a) | 401,000 | | 1,950 |
TOTAL UNITED KINGDOM | | 224,973 |
United States of America - 3.9% |
Affiliated Computer Services, Inc. Class A (a) | 24,200 | | 1,184 |
AFLAC, Inc. | 86,600 | | 3,159 |
Baxter International, Inc. | 58,900 | | 1,566 |
Central European Distribution Corp. (a) | 48,700 | | 1,831 |
Forest Laboratories, Inc. (a) | 59,700 | | 2,986 |
Fox Entertainment Group, Inc. Class A (a) | 60,000 | | 1,662 |
Freeport-McMoRan Copper & Gold, Inc. Class B | 122,200 | | 4,735 |
Golden Telecom, Inc. (a) | 10,800 | | 280 |
Merck & Co., Inc. | 52,800 | | 2,336 |
Mettler-Toledo International, Inc. (a) | 105,700 | | 4,053 |
Motorola, Inc. | 635,900 | | 8,604 |
Newmont Mining Corp. Holding Co. | 89,420 | | 3,915 |
NTL, Inc. (a) | 125,590 | | 7,753 |
Orthofix International NV (a) | 70,400 | | 2,570 |
Phelps Dodge Corp. (a) | 39,500 | | 2,439 |
Synthes-Stratec, Inc. | 6,544 | | 5,985 |
TOTAL UNITED STATES OF AMERICA | | 55,058 |
TOTAL COMMON STOCKS (Cost $1,080,343) | 1,270,081 |
Preferred Stocks - 0.4% |
| | | |
Convertible Preferred Stocks - 0.0% |
Canada - 0.0% |
Metrophotonics, Inc. Series 2 (g) | 8,500 | | 85 |
Nonconvertible Preferred Stocks - 0.4% |
Germany - 0.4% |
Fresenius Medical Care AG | 63,600 | | 2,601 |
Porsche AG (non-vtg.) | 5,400 | | 2,643 |
TOTAL GERMANY | | 5,244 |
TOTAL PREFERRED STOCKS (Cost $4,941) | 5,329 |
Investment Companies - 0.4% |
| Shares | | Value (Note 1) (000s) |
China - 0.1% |
China Fund, Inc. | 35,400 | | $ 1,230 |
Templeton China World Fund, Inc. | 54,100 | | 837 |
TOTAL CHINA | | 2,067 |
India - 0.1% |
The India Fund, Inc. | 55,645 | | 1,056 |
Multi-National - 0.2% |
Templeton Dragon Fund, Inc. | 181,200 | | 2,838 |
TOTAL INVESTMENT COMPANIES (Cost $3,915) | 5,961 |
Nonconvertible Bonds - 0.6% |
| Principal Amount (000s) | | |
United Kingdom - 0.4% |
Telewest Communications PLC yankee: | | | | |
0% 4/15/09 (c)(d) | | $ 810 | | 358 |
0% 2/1/10 (c)(d) | | 1,805 | | 727 |
9.875% 2/1/10 (c) | | 2,305 | | 1,187 |
11.25% 11/1/08 (c) | | 210 | | 113 |
Telewest PLC: | | | | |
11% 10/1/07 (c) | | 5,550 | | 2,997 |
yankee 9.625% 10/1/06 (c) | | 835 | | 443 |
TOTAL UNITED KINGDOM | | 5,825 |
United States of America - 0.2% |
NTL, Inc. 19% 1/1/10 | | 2,333 | | 2,275 |
TOTAL NONCONVERTIBLE BONDS (Cost $6,771) | 8,100 |
Government Obligations - 0.4% |
|
Japan - 0.4% |
Japan Government 0.2% 9/20/05
(Cost $4,941) | JPY | 544,400 | | 4,960 |
Money Market Funds - 10.5% |
| Shares | Value (Note 1) (000s) |
Fidelity Cash Central Fund, 1.07% (b)
(Cost $146,280) | 146,280,436 | $ 146,280 |
TOTAL INVESTMENT PORTFOLIO - 103.1% (Cost $1,247,191) | 1,440,711 |
NET OTHER ASSETS - (3.1)% | (42,782) |
NET ASSETS - 100% | $ 1,397,929 |
Currency Abbreviations |
JPY | - | Japanese yen |
Legend |
(a) Non-income producing |
(b) The rate quoted is the annualized seven-day yield of the fund at period end. A complete listing of the fund's holdings as of its most recent fiscal year end is available upon request. |
(c) Non-income producing - issuer filed for bankruptcy or is in default of interest payments. |
(d) Debt obligation initially issued in zero coupon form which converts to coupon form at a specified rate and date. The rate shown is the rate at period end. |
(e) Security exempt from registration under Rule 144A of the Securities Act of 1933. These securities may be resold in transactions exempt from registration, normally to qualified institutional buyers. At the period end, the value of these securities amounted to $1,238,000 or 0.1% of net assets. |
(f) Security or a portion of the security purchased on a delayed delivery or when-issued basis. |
(g) Restricted securities - Investment in securities not registered under the Securities Act of 1933. |
Additional information on each holding is as follows: |
Security | Acquisition Date | Acquisition Cost (000s) |
ITF Optical Technologies, Inc. Series A | 10/11/00 | $ 90 |
Metrophotonics, Inc. Series 2 | 9/29/00 | $ 85 |
OZ Optics Ltd. unit | 8/18/00 | $ 80 |
Other Information |
Purchases and sales of securities, other than short-term securities, aggregated $993,935,000 and $336,180,000, respectively, of which long-term U.S. government and government agency obligations aggregated $0 and $6,424,000, respectively. |
The fund placed a portion of its portfolio transactions with brokerage firms which are affiliates of the investment adviser. The commissions paid to these affiliated firms were $15,000 for the period. |
The fund invested in securities that are not registered under the Securities Act of 1933. At the end of the period, the value of restricted securities (excluding 144A issues) amounted to $167,000 or 0% of net assets. |
Income Tax Information |
At October 31, 2003, the fund had a capital loss carryforward of approximately $62,647,000 of which $30,705,000 and $31,942,000 will expire on October 31, 2009 and 2010, respectively. |
See accompanying notes which are an integral part of the financial statements.
Annual Report
Financial Statements
Statement of Assets and Liabilities
Amounts in thousands (except per-share amounts) | October 31, 2003 |
| | |
Assets | | |
Investment in securities, at value (including securities loaned of $43,117) (cost $1,247,191) - See accompanying schedule | | $ 1,440,711 |
Cash | | 197 |
Foreign currency held at value (cost $ 1,025) | | 1,029 |
Receivable for investments sold | | 7,841 |
Receivable for fund shares sold | | 18,274 |
Dividends receivable | | 2,382 |
Interest receivable | | 103 |
Prepaid expenses | | 4 |
Other receivables | | 6 |
Total assets | | 1,470,547 |
| | |
Liabilities | | |
Payable for investments purchased
Regular delivery | $ 22,339 | |
Delayed delivery | 831 | |
Payable for fund shares redeemed | 1,081 | |
Accrued management fee | 796 | |
Distribution fees payable | 436 | |
Other payables and accrued expenses | 2,346 | |
Collateral on securities loaned, at value | 44,789 | |
Total liabilities | | 72,618 |
| | |
Net Assets | | $ 1,397,929 |
Net Assets consist of: | | |
Paid in capital | | $ 1,265,301 |
Undistributed net investment income | | 6,506 |
Accumulated undistributed net realized gain (loss) on investments and foreign currency transactions | | (65,469) |
Net unrealized appreciation (depreciation) on investments and assets and liabilities in foreign currencies | | 191,591 |
Net Assets | | $ 1,397,929 |
See accompanying notes which are an integral part of the financial statements.
Annual Report
Financial Statements - continued
Statement of Assets and Liabilities - continued
Amounts in thousands (except per-share amounts) | October 31, 2003 |
| | |
Calculation of Maximum Offering Price
Class A:
Net Asset Value and redemption price per share ($240,719 ÷ 16,489 shares) | | $ 14.60 |
| | |
Maximum offering price per share (100/94.25 of $14.60) | | $ 15.49 |
Class T:
Net Asset Value and redemption price per share ($552,442 ÷ 38,191 shares) | | $ 14.47 |
| | |
Maximum offering price per share (100/96.50 of $14.47) | | $ 14.99 |
Class B:
Net Asset Value and offering price per share
($89,290 ÷ 6,294 shares) A | | $ 14.19 |
| | |
Class C:
Net Asset Value and offering price per share
($124,003 ÷ 8,722 shares) A | | $ 14.22 |
| | |
| | |
Institutional Class:
Net Asset Value, offering price and redemption price per share ($391,475 ÷ 26,551 shares) | | $ 14.74 |
A Redemption price per share is equal to net asset value less any applicable contingent deferred sales charge.
See accompanying notes which are an integral part of the financial statements.
Annual Report
Statement of Operations
Amounts in thousands | Year ended October 31, 2003 |
| | |
Investment Income | | |
Dividends | | $ 15,593 |
Interest | | 1,320 |
Security lending | | 340 |
| | 17,253 |
Less foreign taxes withheld | | (1,498) |
Total income | | 15,755 |
| | |
Expenses | | |
Management fee | $ 5,424 | |
Transfer agent fees | 2,286 | |
Distribution fees | 3,343 | |
Accounting and security lending fees | 431 | |
Non-interested trustees' compensation | 3 | |
Custodian fees and expenses | 629 | |
Registration fees | 175 | |
Audit | 59 | |
Legal | 17 | |
Miscellaneous | 15 | |
Total expenses before reductions | 12,382 | |
Expense reductions | (196) | 12,186 |
Net investment income (loss) | | 3,569 |
Realized and Unrealized Gain (Loss) Net realized gain (loss) on: | | |
Investment securities | 14,691 | |
Foreign currency transactions | 132 | |
Total net realized gain (loss) | | 14,823 |
Change in net unrealized appreciation (depreciation) on: Investment securities (net of deferred foreign taxes of $1,978) | 218,069 | |
Assets and liabilities in foreign currencies | (1) | |
Total change in net unrealized appreciation (depreciation) | | 218,068 |
Net gain (loss) | | 232,891 |
Net increase (decrease) in net assets resulting from operations | | $ 236,460 |
See accompanying notes which are an integral part of the financial statements.
Annual Report
Financial Statements - continued
Statement of Changes in Net Assets
Amounts in thousands | Year ended
October 31,
2003 | Year ended
October 31,
2002 |
Increase (Decrease) in Net Assets | | |
Operations | | |
Net investment income (loss) | $ 3,569 | $ 1,013 |
Net realized gain (loss) | 14,823 | (33,236) |
Change in net unrealized appreciation (depreciation) | 218,068 | (2,842) |
Net increase (decrease) in net assets resulting
from operations | 236,460 | (35,065) |
Distributions to shareholders from net investment income | (1,439) | - |
Share transactions - net increase (decrease) | 716,381 | 160,808 |
Total increase (decrease) in net assets | 951,402 | 125,743 |
| | |
Net Assets | | |
Beginning of period | 446,527 | 320,784 |
End of period (including undistributed net investment income of $6,506 and undistributed net investment income of $1,106, respectively) | $ 1,397,929 | $ 446,527 |
See accompanying notes which are an integral part of the financial statements.
Annual Report
Financial Highlights - Class A
Years ended October 31, | 2003 | 2002 | 2001 | 2000 | 1999 G |
Selected Per-Share Data | | | | | |
Net asset value, beginning of period | $ 11.12 | $ 11.87 | $ 14.54 | $ 13.05 | $ 10.00 |
Income from Investment Operations | | | | | |
Net investment income (loss)E | .09 | .07 | .10 | .22F | .01 |
Net realized and unrealized gain (loss) | 3.45 | (.82) | (2.48) | 1.49 | 3.04 |
Total from investment operations | 3.54 | (.75) | (2.38) | 1.71 | 3.05 |
Distributions from net investment income | (.06) | - | (.29) | (.03) | - |
Distributions from net realized gain | - | - | - | (.17) | - |
Distributions in excess of net realized gain | - | - | - | (.02) | - |
Total distributions | (.06) | - | (.29) | (.22) | - |
Net asset value, end of period | $ 14.60 | $ 11.12 | $ 11.87 | $ 14.54 | $ 13.05 |
Total ReturnB,C,D | 31.99% | (6.32)% | (16.69)% | 13.13% | 30.50% |
Ratios to Average Net AssetsH | | | | | |
Expenses before expense
reductions | 1.42% | 1.46% | 1.50% | 1.52% | 2.60%A |
Expenses net of voluntary
waivers, if any | 1.42% | 1.46% | 1.50% | 1.52% | 2.00%A |
Expenses net of all reductions | 1.39% | 1.43% | 1.46% | 1.50% | 1.97%A |
Net investment income (loss) | .71% | .54% | .77% | 1.44% | .05%A |
Supplemental Data | | | | | |
Net assets, end of period
(in millions) | $ 241 | $ 52 | $ 38 | $ 27 | $ 4 |
Portfolio turnover rate | 49% | 53% | 84% | 87% | 78%A |
A Annualized
B Total returns for periods of less than one year are not annualized.
C Total returns would have been lower had certain expenses not been reduced during the periods shown.
D Total returns do not include the effect of the sales charges.
E Calculated based on average shares outstanding during the period.
F Investment income per share reflects a special dividend which amounted to $.13 per share.
G For the period December 17, 1998 (commencement of operations) to October 31, 1999.
H Expense ratios reflect operating expenses of the class. Expenses before reductions do not reflect amounts reimbursed by the investment adviser or reductions from brokerage service arrangements or other expense offset arrangements and do not represent the amount paid by the class during periods when reimbursements or reductions occur. Expense ratios before start-up periods may not be representative of longer-term operating periods. Expenses net of any voluntary waivers reflect expenses after reimbursement by the investment adviser but prior to reductions from brokerage service arrangements or other expense offset arrangements. Expenses net of all reductions represent the net expenses paid by the class.
See accompanying notes which are an integral part of the financial statements.
Annual Report
Financial Highlights - Class T
Years ended October 31, | 2003 | 2002 | 2001 | 2000 | 1999 G |
Selected Per-Share Data | | | | | |
Net asset value, beginning of period | $ 11.01 | $ 11.80 | $ 14.46 | $ 13.02 | $ 10.00 |
Income from Investment Operations | | | | | |
Net investment income (loss) E | .05 | .02 | .06 | .17 F | (.02) |
Net realized and unrealized gain (loss) | 3.43 | (.81) | (2.46) | 1.49 | 3.04 |
Total from investment operations | 3.48 | (.79) | (2.40) | 1.66 | 3.02 |
Distributions from net investment income | (.02) | - | (.26) | (.03) | - |
Distributions from net realized gain | - | - | - | (.17) | - |
Distributions in excess of net realized gain | - | - | - | (.02) | - |
Total distributions | (.02) | - | (.26) | (.22) | - |
Net asset value, end of period | $ 14.47 | $ 11.01 | $ 11.80 | $ 14.46 | $ 13.02 |
Total Return B,C,D | 31.66% | (6.69)% | (16.90)% | 12.78% | 30.20% |
Ratios to Average Net Assets H | | | | | |
Expenses before expense reductions | 1.75% | 1.79% | 1.81% | 1.82% | 2.84% A |
Expenses net of voluntary waivers, if any | 1.75% | 1.79% | 1.81% | 1.82% | 2.25% A |
Expenses net of all reductions | 1.72% | 1.76% | 1.76% | 1.80% | 2.22% A |
Net investment income (loss) | .38% | .21% | .47% | 1.15% | (.20)%A |
Supplemental Data | | | | | |
Net assets, end of period
(in millions) | $ 552 | $ 204 | $ 153 | $ 139 | $ 32 |
Portfolio turnover rate | 49% | 53% | 84% | 87% | 78% A |
A Annualized
B Total returns for periods of less than one year are not annualized.
C Total returns would have been lower had certain expenses not been reduced during the periods shown.
D Total returns do not include the effect of the sales charges.
E Calculated based on average shares outstanding during the period.
F Investment income per share reflects a special dividend which amounted to $.13 per share.
G For the period December 17, 1998 (commencement of operations) to October 31, 1999.
H Expense ratios reflect operating expenses of the class. Expenses before reductions do not reflect amounts reimbursed by the investment adviser or reductions from brokerage service arrangements or other expense offset arrangements and do not represent the amount paid by the class during periods when reimbursements or reductions occur. Expense ratios before start-up periods may not be representative of longer-term operating periods. Expenses net of any voluntary waivers reflect expenses after reimbursement by the investment adviser but prior to reductions from brokerage service arrangements or other expense offset arrangements. Expenses net of all reductions represent the net expenses paid by the class.
See accompanying notes which are an integral part of the financial statements.
Annual Report
Financial Highlights - Class B
Years ended October 31, | 2003 | 2002 | 2001 | 2000 | 1999 G |
Selected Per-Share Data | | | | | |
Net asset value, beginning of period | $ 10.84 | $ 11.68 | $ 14.33 | $ 12.96 | $ 10.00 |
Income from Investment Operations | | | | | |
Net investment income (loss)E | (.02) | (.04) | (.01) | .09F | (.07) |
Net realized and unrealized gain (loss) | 3.37 | (.80) | (2.44) | 1.49 | 3.03 |
Total from investment operations | 3.35 | (.84) | (2.45) | 1.58 | 2.96 |
Distributions from net investment income | - | - | (.20) | (.02) | - |
Distributions from net realized gain | - | - | - | (.17) | - |
Distributions in excess of net realized gain | - | - | - | (.02) | - |
Total distributions | - | - | (.20) | (.21) | - |
Net asset value, end of period | $ 14.19 | $ 10.84 | $ 11.68 | $ 14.33 | $ 12.96 |
Total ReturnB,C,D | 30.90% | (7.19)% | (17.33)% | 12.21% | 29.60% |
Ratios to Average Net AssetsH | | | | | |
Expenses before expense
reductions | 2.32% | 2.32% | 2.35% | 2.36% | 3.38%A |
Expenses net of voluntary
waivers, if any | 2.32% | 2.32% | 2.35% | 2.36% | 2.75%A |
Expenses net of all reductions | 2.29% | 2.29% | 2.30% | 2.34% | 2.72%A |
Net investment income (loss) | (.19)% | (.32)% | (.07)% | .60% | (.70)%A |
Supplemental Data | | | | | |
Net assets, end of period
(in millions) | $ 89 | $ 49 | $ 42 | $ 44 | $ 11 |
Portfolio turnover rate | 49% | 53% | 84% | 87% | 78%A |
A Annualized
B Total returns for periods of less than one year are not annualized.
C Total returns would have been lower had certain expenses not been reduced during the periods shown.
D Total returns do not include the effect of the contingent deferred sales charge.
E Calculated based on average shares outstanding during the period.
F Investment income per share reflects a special dividend which amounted to $.13 per share.
G For the period December 17, 1998 (commencement of operations) to October 31, 1999.
H Expense ratios reflect operating expenses of the class. Expenses before reductions do not reflect amounts reimbursed by the investment adviser or reductions from brokerage service arrangements or other expense offset arrangements and do not represent the amount paid by the class during periods when reimbursements or reductions occur. Expense ratios before start-up periods may not be representative of longer-term operating periods. Expenses net of any voluntary waivers reflect expenses after reimbursement by the investment adviser but prior to reductions from brokerage service arrangements or other expense offset arrangements. Expenses net of all reductions represent the net expenses paid by the class.
See accompanying notes which are an integral part of the financial statements.
Annual Report
Financial Highlights - Class C
Years ended October 31, | 2003 | 2002 | 2001 | 2000 | 1999 G |
Selected Per-Share Data | | | | | |
Net asset value, beginning of period | $ 10.86 | $ 11.68 | $ 14.34 | $ 12.96 | $ 10.00 |
Income from Investment Operations | | | | | |
Net investment income (loss) E | (.01) | (.03) | -I | .10 F | (.07) |
Net realized and unrealized gain (loss) | 3.37 | (.79) | (2.45) | 1.48 | 3.03 |
Total from investment operations | 3.36 | (.82) | (2.45) | 1.58 | 2.96 |
Distributions from net investment income | - | - | (.21) | (.01) | - |
Distributions from net realized gain | - | - | - | (.17) | - |
Distributions in excess of net realized gain | - | - | - | (.02) | - |
Total distributions | - | - | (.21) | (.20) | - |
Net asset value, end of period | $ 14.22 | $ 10.86 | $ 11.68 | $ 14.34 | $ 12.96 |
Total Return B,C,D | 30.94% | (7.02)% | (17.33)% | 12.21% | 29.60% |
Ratios to Average Net Assets H | | | | | |
Expenses before expense
reductions | 2.23% | 2.25% | 2.28% | 2.32% | 3.36% A |
Expenses net of voluntary
waivers, if any | 2.23% | 2.25% | 2.28% | 2.32% | 2.75% A |
Expenses net of all reductions | 2.20% | 2.22% | 2.24% | 2.30% | 2.72% A |
Net investment income (loss) | (.10)% | (.25)% | (.01)% | .65% | (.70)%A |
Supplemental Data | | | | | |
Net assets, end of period
(in millions) | $ 124 | $ 54 | $ 44 | $ 38 | $ 8 |
Portfolio turnover rate | 49% | 53% | 84% | 87% | 78% A |
A Annualized
B Total returns for periods of less than one year are not annualized.
C Total returns would have been lower had certain expenses not been reduced during the periods shown.
D Total returns do not include the effect of the contingent deferred sales charge.
E Calculated based on average shares outstanding during the period.
F Investment income per share reflects a special dividend which amounted to $.13 per share.
G For the period December 17, 1998 (commencement of operations) to October 31, 1999.
H Expense ratios reflect operating expenses of the class. Expenses before reductions do not reflect amounts reimbursed by the investment adviser or reductions from brokerage service arrangements or other expense offset arrangements and do not represent the amount paid by the class during periods when reimbursements or reductions occur. Expense ratios before start-up periods may not be representative of longer-term operating periods. Expenses net of any voluntary waivers reflect expenses after reimbursement by the investment adviser but prior to reductions from brokerage service arrangements or other expense offset arrangements. Expenses net of all reductions represent the net expenses paid by the class.
I Amount represents less than .01 per-share.
See accompanying notes which are an integral part of the financial statements.
Annual Report
Financial Highlights - Institutional Class
Years ended October 31, | 2003 | 2002 | 2001 | 2000 | 1999 F |
Selected Per-Share Data | | | | | |
Net asset value, beginning of period | $ 11.22 | $ 11.94 | $ 14.60 | $ 13.08 | $ 10.00 |
Income from Investment Operations | | | | | |
Net investment income (loss)D | .13 | .11 | .14 | .26E | .03 |
Net realized and unrealized gain (loss) | 3.48 | (.83) | (2.48) | 1.49 | 3.05 |
Total from investment operations | 3.61 | (.72) | (2.34) | 1.75 | 3.08 |
Distributions from net investment income | (.09) | - | (.32) | (.04) | - |
Distributions from net realized gain | - | - | - | (.17) | - |
Distributions in excess of net realized gain | - | - | - | (.02) | - |
Total distributions | (.09) | - | (.32) | (.23) | - |
Net asset value, end of period | $ 14.74 | $ 11.22 | $ 11.94 | $ 14.60 | $ 13.08 |
Total ReturnB,C | 32.41% | (6.03)% | (16.38)% | 13.42% | 30.80% |
Ratios to Average Net AssetsG | | | | | |
Expenses before expense
reductions | 1.09% | 1.11% | 1.17% | 1.24% | 2.34%A |
Expenses net of voluntary
waivers, if any | 1.09% | 1.11% | 1.17% | 1.24% | 1.75%A |
Expenses net of all reductions | 1.06% | 1.07% | 1.12% | 1.22% | 1.72%A |
Net investment income (loss) | 1.04% | .89% | 1.11% | 1.73% | .30%A |
Supplemental Data | | | | | |
Net assets, end of period
(in millions) | $ 391 | $ 88 | $ 43 | $ 20 | $ 4 |
Portfolio turnover rate | 49% | 53% | 84% | 87% | 78%A |
A Annualized
B Total returns for periods of less than one year are not annualized.
C Total returns would have been lower had certain expenses not been reduced during the periods shown.
D Calculated based on average shares outstanding during the period.
E Investment income per share reflects a special dividend which amounted to $.13 per share.
F For the period December 17, 1998 (commencement of operations) to October 31, 1999.
G Expense ratios reflect operating expenses of the class. Expenses before reductions do not reflect amounts reimbursed by the investment adviser or reductions from brokerage service arrangements or other expense offset arrangements and do not represent the amount paid by the class during periods when reimbursements or reductions occur. Expense ratios before start-up periods may not be representative of longer-term operating periods. Expenses net of any voluntary waivers reflect expenses after reimbursement by the investment adviser but prior to reductions from brokerage service arrangements or other expense offset arrangements. Expenses net of all reductions represent the net expenses paid by the class.
See accompanying notes which are an integral part of the financial statements.
Annual Report
Notes to Financial Statements
For the period ended October 31, 2003
(Amounts in thousands except ratios)
1. Significant Accounting Policies.
Fidelity Advisor Diversified International Fund (the fund) is a fund of Fidelity Advisor Series VIII (the trust) and is authorized to issue an unlimited number of shares. The trust is registered under the Investment Company Act of 1940, as amended (the 1940 Act), as an open-end management investment company organized as a Massachusetts business trust.
The fund offers Class A, Class T, Class B, Class C and Institutional Class shares, each of which has equal rights as to assets and voting privileges. Each class has exclusive voting rights with respect to matters that affect that class. Class B shares will automatically convert to Class A shares after a holding period of seven years from the initial date of purchase. Investment income, realized and unrealized capital gains and losses, the common expenses of the fund, and certain fund-level expense reductions, if any, are allocated on a pro rata basis to each class based on the relative net assets of each class to the total net assets of the fund. Each class differs with respect to transfer agent and distribution and service plan fees incurred. Certain expense reductions also differ by class.
The fund's investments in emerging markets can be subject to social, economic, regula-tory, and political uncertainties and can be extremely volatile. The financial statements have been prepared in conformity with accounting principles generally accepted in the United States of America, which require management to make certain estimates and assumptions at the date of the financial statements. The following summarizes the significant accounting policies of the fund:
Security Valuation. Net asset value per share (NAV calculation) is calculated as of the close of business of the New York Stock Exchange, normally 4:00 p.m. Eastern time. Equity securities for which market quotations are available are valued at the last sale price or official closing price (closing bid price or last evaluated quote if no sale has occurred) on the primary market or exchange on which they trade. Debt securities for which quotations are readily available are valued at their most recent bid prices (sales prices if the principal market is an exchange) in the principal market in which such securities are normally traded, as determined by recognized dealers in such securities, or securities are valued on the basis of information provided by a pricing service. Pricing services use valuation matrices that incorporate both dealer-supplied valuations and valuation models. If an event that is expected to materially affect the value of a security occurs after the close of an exchange or market on which that security trades, but prior to the NAV calculation, then that security will be fair valued taking the event into account. Securities (including restricted securities) for which market quotations are not readily available are valued at their fair value as determined in good faith under consistently applied procedures under the general supervision of the Board of Trustees. Price movements in futures contracts and ADRs, market and trading trends, the bid/ask quotes
Annual Report
Notes to Financial Statements - continued
(Amounts in thousands except ratios)
1. Significant Accounting Policies - continued
Annual Report
Security Valuation - continued
of brokers and off-exchange institutional trading may be reviewed in the course of making a good faith determination of a security's fair value. Short-term securities with remaining maturities of sixty days or less for which quotations are not readily available are valued on the basis of amortized cost. Investments in open-end investment companies are valued at their net asset value each business day.
Foreign Currency. The fund uses foreign currency contracts to facilitate transactions in foreign-denominated securities. Losses from these transactions may arise from changes in the value of the foreign currency or if the counterparties do not perform under the contracts' terms.
Foreign denominated assets, including investment securities, and liabilities are translated into U.S. dollars at the exchange rate at period end. Purchases and sales of investment securities, income and dividends received and expenses denominated in foreign currencies are translated into U.S. dollars at the exchange rate in effect on the transaction date.
The effects of exchange rate fluctuations on investments are included with the net realized and unrealized gain (loss) on investment securities. Other foreign currency transactions resulting in realized and unrealized gain (loss) are disclosed separately.
Investment Transactions and Income. Security transactions are accounted for as of trade date. Gains and losses on securities sold are determined on the basis of identified cost. Dividend income is recorded on the ex-dividend date, except for certain dividends from foreign securities where the ex-dividend date may have passed, which are recorded as soon as the fund is informed of the ex-dividend date. Non-cash dividends included in dividend income, if any, are recorded at the fair market value of the securities received. Interest income is accrued as earned. Interest income includes coupon interest and amortization of premium and accretion of discount on debt securities which is accrued using the interest method. Investment income is recorded net of foreign taxes withheld where recovery of such taxes is uncertain. Debt obligations may be placed on non-accrual status and related interest income may be reduced by ceasing current accruals and writing off interest receivables when the collection of all or a portion of interest has become doubtful based on consistently applied procedures. A debt obligation is removed from non-accrual status when the issuer resumes interest payments or when collectibility of interest is reasonably assured.
Expenses. Most expenses of the trust can be directly attributed to a fund. Expenses which cannot be directly attributed are apportioned among the funds in the trust.
Income Tax Information and Distributions to Shareholders. Each year the fund intends to qualify as a regulated investment company by distributing all of its taxable
Annual Report
Notes to Financial Statements - continued
(Amounts in thousands except ratios)
1. Significant Accounting Policies - continued
Income Tax Information and Distributions to Shareholders - continued
income and realized gains under Subchapter M of the Internal Revenue Code. As a result, no provision for income taxes is required in the accompanying financial statements. Foreign taxes are provided for based on each fund's understanding of the tax rules and rates that exist in the foreign markets in which it invests. Income dividends and capital gain distributions are declared separately for each class. Distributions are recorded on the ex-dividend date.
Income and capital gain distributions are determined in accordance with income tax regulations, which may differ from generally accepted accounting principles. Capital accounts within the financial statements are adjusted for permanent and temporary book and tax differences. These adjustments have no impact on net assets or the results of operations. Temporary differences will reverse in a subsequent period. These differences are primarily due to foreign currency transactions, passive foreign investment companies (PFIC), prior period premium and discount on debt securities, market discount, non-taxable dividends, capital loss carryforwards and losses deferred due to wash sales.
The tax-basis components of distributable earnings and the federal tax cost as of period end were as follows:
Unrealized appreciation | $ 208,639 | | |
Unrealized depreciation | (23,720) | |
Net unrealized appreciation (depreciation) | 184,919 | |
Undistributed ordinary income | 10,355 | |
Capital loss carryforward | (62,647) | |
Cost for federal income tax purposes | $ 1,255,792 | |
The tax character of distributions paid was as follows:
| October 31,
2003 | October 31,
2002 |
Ordinary Income | $ 1,439 | $ - |
Short-Term Trading (Redemption) Fees. Shares purchased after March 31, 2004 and held in the fund less than 30 days will be subject to a short-term trading fee equal to 1.00% of the proceeds of the redeemed shares. The fee, which will be retained by the fund, is accounted for as an addition to paid in capital.
2. Operating Policies.
Repurchase Agreements. Fidelity Management & Research Company (FMR) has received an Exemptive Order from the Securities and Exchange Commission (the SEC) which permits the fund and other affiliated entities of FMR to transfer uninvested cash
Annual Report
2. Operating Policies - continued
Annual Report
Repurchase Agreements - continued
balances into joint trading accounts. These accounts are then invested in repurchase agreements that are collateralized by U.S. Treasury or Government obligations. The fund may also invest directly with institutions, in repurchase agreements that are collateralized by commercial paper obligations and corporate obligations. Collateral is held in segregated accounts with custodian banks and may be obtained in the event of a default of the counterparty. Collateral is marked-to-market daily and maintained at a value at least equal to the principal amount of the repurchase agreement (including accrued interest).
Delayed Delivery Transactions and When-Issued Securities. The fund may purchase or sell securities on a delayed delivery or when-issued basis. Payment and delivery may take place after the customary settlement period for that security. The price of the underlying securities and the date when the securities will be delivered and paid for are fixed at the time the transaction is negotiated. During the time a delayed delivery sell is outstanding, the contract is marked-to-market daily and equivalent deliverable securities are held for the transaction. The value of the securities purchased on a delayed delivery or when-issued basis are identified as such in the fund's Schedule of Investments. The fund may receive compensation for interest forgone in the purchase of a delayed delivery or when-issued security. With respect to purchase commitments, the fund identifies securities as segregated in its records with a value at least equal to the amount of the commitment. Losses may arise due to changes in the value of the underlying securities or if the counterparty does not perform under the contract, or if the issuer does not issue the securities due to political, economic, or other factors.
Restricted Securities. The fund may invest in securities that are subject to legal or contractual restrictions on resale. These securities generally may be resold in transactions exempt from registration or to the public if the securities are registered. Disposal of these securities may involve time-consuming negotiations and expense, and prompt sale at an acceptable price may be difficult. Information regarding restricted securities is included at the end of the fund's Schedule of Investments.
3. Purchases and Sales of Investments.
Information regarding purchases and sales of securities is included under the caption "Other Information" at the end of the fund's Schedule of Investments.
Notes to Financial Statements - continued
(Amounts in thousands except ratios)
4. Fees and Other Transactions with Affiliates.
Annual Report
Management Fee. FMR and its affiliates provide the fund with investment management related services for which the fund pays a monthly management fee. The management fee is the sum of an individual fund fee rate that is based on an annual rate of .45%
Annual Report
Notes to Financial Statements - continued
(Amounts in thousands except ratios)
4. Fees and Other Transactions with Affiliates - continued
Management Fee - continued
of the fund's average net assets and a group fee rate that averaged .28% during the period. The group fee rate is based upon the average net assets of all the mutual funds advised by FMR. The group fee rate decreases as assets under management increase and increases as assets under management decrease. For the period, the total annual management fee rate was .72% of the fund's average net assets.
Distribution and Service Plan. In accordance with Rule 12b-1 of the 1940 Act, the Fund has adopted separate Distribution and Service Plans for each class of shares. Certain classes pay Fidelity Distributors Corporation (FDC), an affiliate of FMR, separate Distribution and Service Fees, each of which is based on an annual percentage of each class' average net assets. Class A and Class T Plans also authorize the use of brokerage commissions to pay distribution expenses. This practice has been discontinued and no commissions incurred after June 30, 2003 have been used to pay distribution expenses. In addition, FDC may pay financial intermediaries for selling shares of the fund and providing shareholder support services. For the period, the Distribution and Service Fee rates, the total amounts paid to and retained by FDC and the amount of distribution expenses paid with brokerage commissions were as follows:
| Distribution
Fee | Service
Fee | Paid to
FDC | Retained
by FDC | Paid with
Commissions |
Class A | -% | .25% | $ 247 | $ 2 | $ 1 |
Class T | .25% | .25% | 1,710 | 11 | 6 |
Class B | .75% | .25% | 624 | 468 | - |
Class C | .75% | .25% | 762 | 217 | - |
| | | $ 3,343 | $ 698 | $ 7 |
Sales Load. FDC receives a front-end sales charge of up to 5.75% for selling Class A shares, and 3.50% for selling Class T shares of the fund. FDC receives the proceeds of contingent deferred sales charges levied on Class A, Class T, Class B, and Class C redemptions. These charges depend on the holding period. The deferred sales charges range from 5% to 1% for Class B, 1% for Class C, and .25% for certain purchases of Class A and Class T shares.
Annual Report
4. Fees and Other Transactions with Affiliates - continued
Sales Load - continued
For the period, sales charge amounts retained by FDC were as follows:
| Retained
by FDC |
Class A | $ 144 |
Class T | 59 |
Class B* | 154 |
Class C* | 24 |
| $ 381 |
* When Class B and Class C shares are initially sold, FDC pays commissions from its own resources to financial intermediaries through which the sales are made.
Transfer Agent Fees. Fidelity Investments Institutional Operations Company, Inc. (FIIOC), an affiliate of FMR, is the transfer, dividend disbursing and shareholder servicing agent (collectively referred to as the transfer agent) for each class of the fund. FIIOC receives account fees and asset-based fees that vary according to the account size and type of account of the shareholders of the respective classes of the fund. FIIOC pays for typesetting, printing and mailing of all shareholder reports, except proxy statements. For the period, the following amounts were paid to FIIOC:
| Amount | % of
Average
Net Assets |
Class A | $ 267 | .27 |
Class T | 1,190 | .35 |
Class B | 265 | .42 |
Class C | 255 | .33 |
Institutional Class | 309 | .19 |
| $ 2,286 | |
Accounting and Security Lending Fees. Fidelity Service Company, Inc. (FSC), an affiliate of FMR, maintains the fund's accounting records and administers the security lending program. The security lending fee is based on the number and duration of lending transactions. The accounting fee is based on the level of average net assets for the month plus out-of-pocket expenses.
Central Funds. The fund may invest in affiliated Central Funds managed by Fidelity Investments Money Management, Inc. (FIMM), an affiliate of FMR. The Central Funds are open-end investment companies available only to investment companies and other accounts managed by FMR and its affiliates. The Central Funds seek preservation of capital and current income and do not pay a management fee. Income distributions earned by the fund are recorded as income in the accompanying financial statements and totaled $888 for the period.
Annual Report
Notes to Financial Statements - continued
(Amounts in thousands except ratios)
4. Fees and Other Transactions with Affiliates - continued
Brokerage Commissions. The fund placed a portion of its portfolio transactions with brokerage firms which are affiliates of the investment adviser. The commissions paid to these affiliated firms are shown under the caption "Other Information" at the end of the fund's Schedule of Investments.
5. Committed Line of Credit.
The fund participates with other funds managed by FMR in a $3.5 billion credit facility (the "line of credit") to be utilized for temporary or emergency purposes to fund shareholder redemptions or for other short-term liquidity purposes. The fund has agreed to pay commitment fees on its pro rata portion of the line of credit. During the period, there were no borrowings on this line of credit.
6. Security Lending.
The fund lends portfolio securities from time to time in order to earn additional income. The fund receives collateral (in the form of U.S. Treasury obligations, letters of credit and/or cash) against the loaned securities and maintains collateral in an amount not less than 100% of the market value of the loaned securities during the period of the loan. The market value of the loaned securities is determined at the close of business of the fund and any additional required collateral is delivered to the fund on the next business day. If the borrower defaults on its obligation to return the securities loaned because of insolvency or other reasons, a fund could experience delays and costs in recovering the securities loaned or in gaining access to the collateral. Cash collateral is invested in cash equivalents. The value of loaned securities and cash collateral at period end are disclosed on the fund's Statement of Assets and Liabilities.
Annual Report
7. Expense Reductions.
Many of the brokers with whom FMR places trades on behalf of the fund provided services to the fund in addition to trade execution. These services may include payments of expenses on behalf of the fund to support distribution of fund shares for Class A and Class T ("Distribution Expense Reduction") and to pay other fund expenses, such as transfer agent fees ("Other Expense Reduction") collectively referred to as "Brokerage Service Arrangements" in the accompanying table. Brokerage service arrangements generally benefits all shareholders of each class by reducing fund expenses. Each of Class A and Class T shareholders' Other Expense Reduction benefit is reduced by the amount of any Distribution Expense Reduction. In addition, through arrangements with the fund's custodian, credits realized as a result of uninvested cash balances were used to reduce the fund's expenses. All of the applicable expense reductions are noted in the table below.
| Brokerage Service
Arrangements | |
| Distribution
expense
reduction | Other
expense
reduction | Custody
expense
reduction |
| | | |
Fund Level | $ - | $ 186 | $ 3 |
Class A | 1 | - | - |
Class T | 6 | - | - |
| $ 7 | $ 186 | $ 3 |
8. Other Information.
At the end of the period, one unaffiliated shareholder was the owner of record of 15% of the total outstanding shares of the fund.
9. Distributions to Shareholders.
Distributions to shareholders of each class were as follows:
| Years ended
October 31,
2003 | Years ended
October 31,
2002 |
From net investment income | | |
Class A | $ 292 | $ - |
Class T | 397 | - |
Institutional Class | 750 | - |
Total | $ 1,439 | $ - |
Annual Report
Notes to Financial Statements - continued
(Amounts in thousands except ratios)
10. Share Transactions.
Transactions for each class of shares were as follows:
| Shares | Dollars |
Years ended October 31, | 2003 | 2002 | 2003 | 2002 |
Class A | | | | |
Shares sold | 16,942 | 4,966 | $ 218,725 | $ 60,391 |
Reinvestment of distributions | 24 | - | 271 | - |
Shares redeemed | (5,120) | (3,525) | (63,239) | (43,045) |
Net increase (decrease) | 11,846 | 1,441 | $ 155,757 | $ 17,346 |
Class T | | | | |
Shares sold | 29,220 | 11,344 | $ 358,219 | $ 137,199 |
Reinvestment of distributions | 33 | - | 370 | - |
Shares redeemed | (9,624) | (5,761) | (117,763) | (69,065) |
Net increase (decrease) | 19,629 | 5,583 | $ 240,826 | $ 68,134 |
Class B | | | | |
Shares sold | 2,720 | 1,844 | $ 32,792 | $ 21,855 |
Shares redeemed | (917) | (959) | (10,619) | (11,319) |
Net increase (decrease) | 1,803 | 885 | $ 22,173 | $ 10,536 |
Class C | | | | |
Shares sold | 5,286 | 2,496 | $ 64,958 | $ 29,291 |
Shares redeemed | (1,527) | (1,316) | (17,673) | (15,655) |
Net increase (decrease) | 3,759 | 1,180 | $ 47,285 | $ 13,636 |
Institutional Class | | | | |
Shares sold | 26,478 | 8,596 | $ 351,243 | $ 105,185 |
Reinvestment of distributions | 29 | - | 326 | - |
Shares redeemed | (7,794) | (4,386) | (101,229) | (54,029) |
Net increase (decrease) | 18,713 | 4,210 | $ 250,340 | $ 51,156 |
Annual Report
Report of Independent Auditors
To the Trustees of Fidelity Advisor Series VIII and the Shareholders of Fidelity Advisor Diversified International Fund.
In our opinion, the accompanying statement of assets and liabilities, including the schedule of investments, and the related statements of operations and of changes in net assets and the financial highlights present fairly, in all material respects, the financial position of Fidelity Advisor Diversified International Fund (a fund of Fidelity Advisor Series VIII) at October 31, 2003 and the results of its operations, the changes in its net assets and the financial highlights for the periods indicated, in conformity with accounting principles generally accepted in the United States of America. These financial statements and financial highlights (hereafter referred to as "financial statements") are the responsibility of the Fidelity Advisor Diversified International Fund's management; our responsibility is to express an opinion on these financial statements based on our audits. We conducted our audits of these financial statements in accordance with auditing standards generally accepted in the United States of America which require that we plan and perform the audit to obtain reasonable assurance about whether the financial statements are free of material misstatement. An audit includes examining, on a test basis, evidence supporting the amounts and disclosures in the financial statements, assessing the accounting principles used and significant estimates made by management, and evaluating the overall financial statement presentation. We believe that our audits, which included confirmation of securities at October 31, 2003 by correspondence with the custodian and brokers, provide a reasonable basis for our opinion.
/s/PricewaterhouseCoopers LLP
PricewaterhouseCoopers LLP
Boston, Massachusetts
December 12, 2003
Annual Report
Trustees and Officers
The Trustees, Members of the Advisory Board, and executive officers of the trust and fund, as applicable, are listed below. The Board of Trustees governs the fund and is responsible for protecting the interests of shareholders. The Trustees are experienced executives who meet periodically throughout the year to oversee the fund's activities, review contractual arrangements with companies that provide services to the fund, and review the fund's performance. Except for William O. McCoy, each of the Trustees oversees 289 funds advised by FMR or an affiliate. Mr. McCoy oversees 291 funds advised by FMR or an affiliate.
The Trustees hold office without limit in time except that (a) any Trustee may resign; (b) any Trustee may be removed by written instrument, signed by at least two-thirds of the number of Trustees prior to such removal; (c) any Trustee who requests to be retired or who has become incapacitated by illness or injury may be retired by written instrument signed by a majority of the other Trustees; and (d) any Trustee may be removed at any special meeting of shareholders by a two-thirds vote of the outstanding voting securities of the trust. In any event, each non-interested Trustee shall retire not later than the last day of the calendar year in which his or her 72nd birthday occurs. The executive officers and Advisory Board Members hold office without limit in time, except that any officer and Advisory Board Member may resign or may be removed by a vote of a majority of the Trustees at any regular meeting or any special meeting of the Trustees. Except as indicated, each individual has held the office shown or other offices in the same company for the past five years.
The fund's Statement of Additional Information (SAI) includes more information about the Trustees. To request a free copy, call Fidelity at 1-877-208-0098.
Interested Trustees*:
Correspondence intended for each Trustee who is an "interested person" (as defined in the 1940 Act) may be sent to 82 Devonshire Street, Boston, Massachusetts 02109.
Name, Age; Principal Occupation |
Edward C. Johnson 3d (73)** |
| Year of Election or Appointment: 1983 Mr. Johnson is Chairman of the Board of Trustees. Mr. Johnson serves as Chief Executive Officer, Chairman, and a Director of FMR Corp.; a Director and Chairman of the Board and of the Executive Committee of FMR; Chairman and a Director of Fidelity Management & Research (Far East) Inc.; Chairman (1998) and a Director of Fidelity Investments Money Management, Inc.; and Chairman (2001) and a Director (2000) of FMR Co., Inc. |
Abigail P. Johnson (41)** |
| Year of Election or Appointment: 2001 Senior Vice President of Advisor Diversified International (2001). Ms. Johnson also serves as Senior Vice President of other Fidelity funds (2001). She is President and a Director of FMR (2001), Fidelity Investments Money Management, Inc. (2001), FMR Co., Inc. (2001), and a Director of FMR Corp. Previously, Ms. Johnson managed a number of Fidelity funds. |
Laura B. Cronin (49) |
| Year of Election or Appointment: 2003 Ms. Cronin is an Executive Vice President (2002) and Chief Financial Officer (2002) of FMR Corp. and is a member of the Fidelity Management Committee (2003). Previously, Ms. Cronin served as Vice President of Finance of FMR (1997-1999), and Chief Financial Officer of FMR (1999-2001), Fidelity Personal Investments (2001), and Fidelity Brokerage Company (2001-2002). |
Robert L. Reynolds (51) |
| Year of Election or Appointment: 2003 Mr. Reynolds is a Director (2003) and Chief Operating Officer (2002) of FMR Corp. and is the head of the Fidelity Management Committee (2003). He also serves on the Board at Fidelity Investments Canada, Ltd. (2000). Previously, Mr. Reynolds served as President of Fidelity Investments Institutional Retirement Group (1996-2000). |
* Trustees have been determined to be "Interested Trustees" by virtue of, among other things, their affiliation with the trust or various entities under common control with FMR.
** Edward C. Johnson 3d, Trustee, is Abigail P. Johnson's father.
Annual Report
Non-Interested Trustees:
Correspondence intended for each non-interested Trustee (that is, the Trustees other than the Interested Trustees) may be sent to Fidelity Investments, P.O. Box 55235, Boston, Massachusetts 02205-5235.
Name, Age; Principal Occupation |
J. Michael Cook (61) |
| Year of Election or Appointment: 2001 Prior to Mr. Cook's retirement in May 1999, he served as Chairman and Chief Executive Officer of Deloitte & Touche LLP (accounting/consulting), Chairman of the Deloitte & Touche Foundation, and a member of the Board of Deloitte Touche Tohmatsu. He currently serves as a Director of Comcast (telecommunications, 2002), International Flavors & Fragrances, Inc. (2000), Rockwell Automation (2000) and The Dow Chemical Company (2000). He is a Member of the Diversity Advisory Council of Marakon (2003) and the Advisory Board of the Directorship Search Group, Chairman Emeritus of the Board of Catalyst (a leading organization for the advancement of women in business), and is Chairman of the Accountability Advisory Council to the Comptroller General of the United States. He also serves as a Member of the Advisory Board of the Graduate School of Business of the University of Florida, his alma mater. |
Ralph F. Cox (71) |
| Year of Election or Appointment: 1991 Mr. Cox is President of RABAR Enterprises (management consulting for the petroleum industry). Prior to February 1994, he was President of Greenhill Petroleum Corporation (petroleum exploration and production). Until March 1990, Mr. Cox was President and Chief Operating Officer of Union Pacific Resources Company (exploration and production). He is a Director of CH2M Hill Companies (engineering), and Abraxas Petroleum (petroleum exploration and production, 1999). In addition, he is a member of advisory boards of Texas A&M University and the University of Texas at Austin. |
Phyllis Burke Davis (71) |
| Year of Election or Appointment: 1992 Mrs. Davis is retired from Avon Products, Inc. (consumer products) where she held various positions including Senior Vice President of Corporate Affairs and Group Vice President of U.S. product marketing, sales, distribution, and manufacturing. Mrs. Davis is a member of the Board of Directors of the Southampton Hospital in Southampton, N.Y. (1998). Previously, she served as a Director of BellSouth Corporation (telecommunications), Eaton Corporation (diversified industrial), the TJX Companies, Inc. (retail stores), Hallmark Cards, Inc., and Nabisco Brands, Inc. |
Robert M. Gates (60) |
| Year of Election or Appointment: 1997 Dr. Gates is President of Texas A&M University (2002). He was Director of the Central Intelligence Agency (CIA) from 1991 to 1993. From 1989 to 1991, Dr. Gates served as Assistant to the President of the United States and Deputy National Security Advisor. Dr. Gates is a Director of NACCO Industries, Inc. (mining and manufacturing), and Parker Drilling Co., Inc. (drilling and rental tools for the energy industry, 2001). He also serves as a member of the Advisory Board of VoteHere.net (secure internet voting, 2001). Previously, Dr. Gates served as a Director of LucasVarity PLC (automotive components and diesel engines), a Director of TRW Inc. (automotive, space, defense, and information technology), and Dean of the George Bush School of Government and Public Service at Texas A&M University (1999-2001). Dr. Gates also is a Trustee of the Forum for International Policy. |
Donald J. Kirk (70) |
| Year of Election or Appointment: 1987 Mr. Kirk is a Governor of the American Stock Exchange (2001), a Trustee and former Chairman of the Board of Trustees of the Greenwich Hospital Association, a Director of the Yale-New Haven Health Services Corp. (1998), and a Director Emeritus and former Chairman of the Board of Directors of National Arts Strategies Inc. Mr. Kirk was an Executive-in-Residence (1995-2000) and a Professor (1987-1995) at Columbia University Graduate School of Business. Prior to 1987, he was Chairman of the Financial Accounting Standards Board. Previously, Mr. Kirk served as a Governor of the National Association of Securities Dealers, Inc. (1996-2002), a member and Vice Chairman of the Public Oversight Board of the American Institute of Certified Public Accountants' SEC Practice Section (1995-2002), a Director of General Re Corporation (reinsurance, 1987-1998) and as a Director of Valuation Research Corp. (appraisals and valuations). |
Marie L. Knowles (57) |
| Year of Election or Appointment: 2001 Prior to Ms. Knowles' retirement in June 2000, she served as Executive Vice President and Chief Financial Officer of Atlantic Richfield Company (ARCO) (diversified energy, 1996-2000). From 1993 to 1996, she was a Senior Vice President of ARCO and President of ARCO Transportation Company. She served as a Director of ARCO from 1996 to 1998. She currently serves as a Director of Phelps Dodge Corporation (copper mining and manufacturing), URS Corporation (multidisciplinary engineering, 1999), and McKesson Corporation (healthcare service, 2002). Ms. Knowles is a Trustee of the Brookings Institution and the Catalina Island Conservancy and also serves as a member of the Advisory Board for the School of Engineering of the University of Southern California. |
Ned C. Lautenbach (59) |
| Year of Election or Appointment: 2000 Mr. Lautenbach has been a partner of Clayton, Dubilier & Rice, Inc. (private equity investment firm) since September 1998. Previously, Mr. Lautenbach was with the International Business Machines Corporation (IBM) from 1968 until his retirement in 1998. He was most recently Senior Vice President and Group Executive of Worldwide Sales and Services. From 1993 to 1995, he was Chairman of IBM World Trade Corporation, and from 1994 to 1998 was a member of IBM's Corporate Executive Committee. Mr. Lautenbach serves as Chairman and as a Director (1998) of Acterna Corporation (communications test equipment). He is also Co-Chairman of Covansys, Inc. (global provider of business and technology solutions, 2000). In addition, he is a Director of Eaton Corporation (diversified industrial) and the Philharmonic Center for the Arts in Naples, Florida (1999). He also is a member of the Council on Foreign Relations. |
Marvin L. Mann (70) |
| Year of Election or Appointment: 1993 Mr. Mann is Chairman of the non-interested Trustees (2001). He is Chairman Emeritus of Lexmark International, Inc. (computer peripherals) where he served as CEO until April 1998 and retired as Chairman May 1999, and remains a member of the Board. Prior to 1991, he held the positions of Vice President of International Business Machines Corporation (IBM) and President and General Manager of various IBM divisions and subsidiaries. Mr. Mann is a Board member of Imation Corp. (imaging and information storage) and Acterna Corporation (communications test equipment, 1999). He is also a member of the Director Services Committee of the Investment Company Institute. In addition, Mr. Mann is a member of the President's Cabinet at the University of Alabama and the Board of Visitors of the Culverhouse College of Commerce and Business Administration at the University of Alabama. |
William O. McCoy (70) |
| Year of Election or Appointment: 1997 Prior to his retirement in December 1994, Mr. McCoy was Vice Chairman of the Board of BellSouth Corporation (telecommunications) and President of BellSouth Enterprises. He is currently a Director of Liberty Corporation (holding company), Duke Realty Corporation (real estate), Progress Energy, Inc. (electric utility), and Acterna Corporation (communications test equipment, 1999). He is also a partner of Franklin Street Partners (private investment management firm) and a member of the Research Triangle Foundation Board. In addition, Mr. McCoy served as the Interim Chancellor (1999-2000) and a member of the Board of Visitors (1994-1998) for the University of North Carolina at Chapel Hill and currently serves on the Board of Directors of the University of North Carolina Health Care System and the Board of Visitors of the Kenan-Flagler Business School (University of North Carolina at Chapel Hill). He also served as Vice President of Finance for the University of North Carolina (16-school system, 1995-1998). |
William S. Stavropoulos (64) |
| Year of Election or Appointment: 2001 Mr. Stavropoulos is Chairman of the Board, President and CEO (2002), and Chairman of the Executive Committee (2000) and a Director of The Dow Chemical Company. Since joining The Dow Chemical Company in 1967, Mr. Stavropoulos served in numerous senior management positions, including President (1993-2000) and Chief Executive Officer (1995-2000). Currently, he is a Director of NCR Corporation (data warehousing and technology solutions), BellSouth Corporation (telecommunications), Chemical Financial Corporation, and Maersk Inc. (industrial conglomerate, 2002). He also serves as a member of the Board of Trustees of the American Enterprise Institute for Public Policy Research. In addition, Mr. Stavropoulos is a member of The Business Council, J.P. Morgan International Council, World Business Council for Sustainable Development, and the University of Notre Dame Advisory Council for the College of Science. |
Annual Report
Trustees and Officers - continued
Advisory Board Members and Executive Officers:
Correspondence intended for Dr. Heilmeier may be sent to Fidelity Investments, P.O. Box 55235, Boston, Massachusetts 02205-5235. Correspondence intended for each executive officer and Mr. Lynch may be sent to 82 Devonshire Street, Boston, Massachusetts 02109.
Name, Age; Principal Occupation |
George H. Heilmeier (67) |
| Year of Election or Appointment: 2003 Member of the Advisory Board of Fidelity Advisor Series VIII. Dr. Heilmeier is Chairman Emeritus of Telcordia Technologies (communication software and systems), where prior to his retirement, he served as company Chairman and Chief Executive Officer. He currently serves on the Boards of Directors of The Mitre Corporation (systems engineering and information technology support for the government), INET Technologies Inc. (telecommunications network surveillance, 2001) and Teletech Holdings (customer management services, 1998). He is Chairman of the General Motors Technology Advisory Committee and a Life Fellow of the IEEE (2000). Dr. Heilmeier is a member of the Defense Science Board and the National Security Agency Advisory Board. He is also a member of the National Academy of Engineering, the American Academy of Arts and Sciences and The Board of Overseers of the School of Engineering and Applied Science of the University of Pennsylvania. Previously, Dr. Heilmeier served as a Director of TRW Inc. (automotive, space, defense, and information technology, 1992-2002) and Compaq (1994-2002). |
Peter S. Lynch (60) |
| Year of Election or Appointment: 2003 Member of the Advisory Board of Fidelity Advisor Series VIII. Vice Chairman and a Director of FMR, and Vice Chairman (2001) and a Director (2000) of FMR Co., Inc. Previously, Mr. Lynch served as a Trustee of the Fidelity funds (1990-2003). Prior to May 31, 1990, he was a Director of FMR and Executive Vice President of FMR (a position he held until March 31, 1991), Vice President of Fidelity Magellan Fund and FMR Growth Group Leader, and Managing Director of FMR Corp. Mr. Lynch was also Vice President of Fidelity Investments Corporate Services. In addition, he serves as a Trustee of Boston College, Massachusetts Eye & Ear Infirmary, Historic Deerfield, John F. Kennedy Library, and the Museum of Fine Arts of Boston. |
Philip L. Bullen (44) |
| Year of Election or Appointment: 2001 Vice President of Advisor Diversified International. Mr. Bullen also serves as Vice President of certain Equity Funds (2001) and certain High Income Funds (2001). He is Senior Vice President of FMR (2001) and FMR Co., Inc. (2001), President and a Director of Fidelity Management & Research (Far East) Inc. (2001), President and a Director of Fidelity Management & Research (U.K.) Inc. (2002), and a Director of Strategic Advisers, Inc. (2002). Before joining Fidelity Investments, Mr. Bullen was President and Chief Investment Officer of Santander Global Advisors (1997-2000) and President and Chief Executive Officer of Boston's Baring Asset Management Inc. (1994-1997). |
William Bower (36) |
| Year of Election or Appointment: 2001 Vice President of Advisor Diversified International. Mr. Bower is also Vice President of another fund advised by FMR. Prior to assuming his current responsibilities, Mr. Bower managed a variety of Fidelity funds. |
Eric D. Roiter (54) |
| Year of Election or Appointment: 1998 Secretary of Advisor Diversified International. He also serves as Secretary of other Fidelity funds (1998); Vice President, General Counsel, and Clerk of FMR Co., Inc. (2001) and FMR (1998); Vice President and Clerk of FDC (1998); Assistant Clerk of Fidelity Management & Research (U.K.) Inc. (2001) and Fidelity Management & Research (Far East) Inc. (2001); and Assistant Secretary of Fidelity Investments Money Management Inc. (2001). Prior to joining Fidelity, Mr. Roiter was with the law firm of Debevoise & Plimpton, as an associate (1981-1984) and as a partner (1985-1997), and served as an Assistant General Counsel of the U.S. Securities and Exchange Commission (1979-1981). Mr. Roiter is an Adjunct Member, Faculty of Law, at Boston College Law School (2003). |
Stuart Fross (44) |
| Year of Election or Appointment: 2003 Assistant Secretary of Advisor Diversified International. Mr. Fross also serves as Assistant Secretary of other Fidelity funds (2003) and is an employee of FMR. |
Maria F. Dwyer (44) |
| Year of Election or Appointment: 2002 President and Treasurer of Advisor Diversified International. Ms. Dwyer also serves as President and Treasurer of other Fidelity funds (2002) and is a Vice President (1999) and an employee (1996) of FMR. Prior to joining Fidelity, Ms. Dwyer served as Director of Compliance for MFS Investment Management. |
Timothy F. Hayes (52) |
| Year of Election or Appointment: 2002 Chief Financial Officer of Advisor Diversified International. Mr. Hayes also serves as Chief Financial Officer of other Fidelity funds (2002). Recently he was appointed President of Fidelity Service Company (2003) where he also serves as a Director. Mr. Hayes also serves as President of Fidelity Investments Operations Group (FIOG, 2002), which includes Fidelity Pricing and Cash Management Services Group (FPCMS), where he was appointed President in 1998. Previously, Mr. Hayes served as Chief Financial Officer of Fidelity Investments Corporate Systems and Service Group (1998) and Fidelity Systems Company (1997-1998). |
John R. Hebble (45) |
| Year of Election or Appointment: 2003 Deputy Treasurer of Advisor Diversified International. Mr. Hebble also serves as Deputy Treasurer of other Fidelity funds (2003), and is an employee of FMR. Before joining Fidelity Investments, Mr. Hebble worked at Deutsche Asset Management where he served as Director of Fund Accounting (2002-2003) and Assistant Treasurer of the Scudder Funds (1998-2003). |
John H. Costello (57) |
| Year of Election or Appointment: 1998 Assistant Treasurer of Advisor Diversified International. Mr. Costello also serves as Assistant Treasurer of other Fidelity funds and is an employee of FMR. |
Francis V. Knox, Jr. (56) |
| Year of Election or Appointment: 2002 Assistant Treasurer of Advisor Diversified International. Mr. Knox also serves as Assistant Treasurer of other Fidelity funds (2002), and is a Vice President and an employee of FMR. Previously, Mr. Knox served as Vice President of Investment & Advisor Compliance (1990-2001), and Compliance Officer of Fidelity Management & Research (U.K.) Inc. (1992-2002), Fidelity Management & Research (Far East) Inc. (1991-2002), and FMR Corp. (1995-2002). |
Mark Osterheld (48) |
| Year of Election or Appointment: 2002 Assistant Treasurer of Advisor Diversified International. Mr. Osterheld also serves as Assistant Treasurer of other Fidelity funds (2002) and is an employee of FMR. |
Thomas J. Simpson (45) |
| Year of Election or Appointment: 2000 Assistant Treasurer of Advisor Diversified International. Mr. Simpson is Assistant Treasurer of other Fidelity funds (2000) and an employee of FMR (1996). Prior to joining FMR, Mr. Simpson was Vice President and Fund Controller of Liberty Investment Services (1987-1995). |
Annual Report
Distributions
The amounts per share which represent income derived from sources within, and taxes paid to, foreign countries or possessions of the United States are as follows:
| Pay Date | Income | Taxes |
Class A | 12/9/02 | $.074 | $.014 |
Class T | 12/9/02 | $.034 | $.014 |
Annual Report
Investment Adviser
Fidelity Management & Research Company
Boston, MA
Investment Sub-Advisers
FMR Co., Inc.
Fidelity Management & Research
(U.K.) Inc.
Fidelity Management & Research
(Far East) Inc.
Fidelity International
Investment Advisors
Fidelity Investments Japan Limited
Fidelity International Investment Advisors (U.K.) Limited
General Distributor
Fidelity Distributors Corporation
Boston, MA
Transfer and Shareholder
Servicing Agents
Fidelity Investments Institutional Operations Company, Inc.
Boston, MA
Custodian
State Street Bank and Trust Company
Quincy, MA
Annual Report
Fidelity Advisor Aggressive Growth Fund |
Fidelity Advisor Asset Allocation Fund |
Fidelity Advisor Balanced Fund |
Fidelity Advisor Biotechnology Fund |
Fidelity Advisor California Municipal Income Fund |
Fidelity Advisor Consumer Industries Fund |
Fidelity Advisor Cyclical Industries Fund |
Fidelity Advisor Developing Communications Fund |
Fidelity Advisor Diversified International Fund |
Fidelity Advisor Dividend Growth Fund |
Fidelity Advisor Dynamic Capital Appreciation Fund |
Fidelity Advisor Electronics Fund |
Fidelity Advisor Emerging Asia Fund |
Fidelity Advisor Emerging Markets Income Fund |
Fidelity Advisor Equity Growth Fund |
Fidelity Advisor Equity Income Fund |
Fidelity Advisor Equity Value Fund |
Fidelity Advisor Europe Capital Appreciation Fund |
Fidelity Advisor Fifty Fund |
Fidelity Advisor Financial Services Fund |
Fidelity Advisor Floating Rate High Income Fund |
Fidelity Advisor Freedom Income FundSM |
Fidelity Advisor Freedom 2010 FundSM |
Fidelity Advisor Freedom 2020 FundSM |
Fidelity Advisor Freedom 2030 FundSM |
Fidelity Advisor Freedom 2040 FundSM |
Fidelity Advisor Global Equity Fund |
Fidelity Advisor Government Investment Fund |
Fidelity Advisor Growth & Income Fund |
Fidelity Advisor Growth Opportunities |
Fidelity Advisor Health Care Fund |
Fidelity Advisor High Income Advantage Fund |
Fidelity Advisor High Income Fund |
Fidelity Advisor Inflation-Protected Bond Fund |
Fidelity Advisor Intermediate Bond Fund |
Fidelity Advisor International Capital Appreciation Fund |
Fidelity Advisor International Small Cap Fund |
Fidelity Advisor Investment Grade Bond Fund |
Fidelity Advisor Japan Fund |
Fidelity Advisor Korea Fund |
Fidelity Advisor Large Cap Fund |
Fidelity Advisor Latin America Fund |
Fidelity Advisor Leveraged Company Stock Fund |
Fidelity Advisor Mid Cap Fund |
Fidelity Advisor Mortgage Securities Fund |
Fidelity Advisor Municipal Income Fund |
Fidelity Advisor Natural Resources Fund |
Fidelity Advisor New Insights Fund |
Fidelity Advisor New York
Municipal Income Fund |
Fidelity Advisor Overseas Fund |
Fidelity Advisor Real Estate Fund |
Fidelity Advisor Short Fixed-Income Fund |
Fidelity Advisor Short Intermediate Municipal Income Fund |
Fidelity Advisor Small Cap Fund |
Fidelity Advisor Strategic Growth Fund |
Fidelity Advisor Strategic Income Fund |
Fidelity Advisor Tax Managed
Stock Fund |
Fidelity Advisor Technology Fund |
Fidelity Advisor Telecommunications & Utilities Growth Fund |
Fidelity Advisor Value Leaders Fund |
Fidelity Advisor Value Strategies Fund |
Prime Fund |
Tax-Exempt Fund |
Treasury Fund |
(Fidelity Investment logo)(registered trademark)
Corporate Headquarters
82 Devonshire St., Boston, MA 02109
www.fidelity.com
ADIF-UANN-1203
1.784735.100
Fidelity® Advisor
Diversified International
Fund - Institutional Class
Annual Report
October 31, 2003
(2_fidelity_logos) (Registered_Trademark)
Contents
Chairman's Message | <Click Here> | Ned Johnson's message to shareholders. |
Performance | <Click Here> | How the fund has done over time. |
Management's Discussion | <Click Here> | The manager's review of fund performance, strategy and outlook. |
Investment Changes | <Click Here> | A summary of major shifts in the fund's investments over the past six months. |
Investments | <Click Here> | A complete list of the fund's investments with their market values. |
Financial Statements | <Click Here> | Statements of assets and liabilities, operations, and changes in net assets,
as well as financial highlights. |
Notes | <Click Here> | Notes to the financial statements. |
Auditors' Opinion | <Click Here> | |
Trustees and Officers | <Click Here> | |
Distributions | <Click Here> | |
For a free copy of the fund's proxy voting guidelines call 1-877-208-0098 or visit the Securities and Exchange Commission (SEC)'s web site at www.sec.gov.
Standard and Poor's, S&P and S&P 500 are registered service marks of The McGraw-Hill Companies Inc. and have been licensed for use by Fidelity Distributors Corporation.
Other third party marks appearing herein are the property of their respective owners.
All other marks appearing herein are registered or unregistered trademarks or service marks of FMR Corp. or an affiliated company.
(Recycle graphic) This report is printed on recycled paper using soy-based inks.
This report and the financial statements contained herein are submitted for the general information of the shareholders of the fund. This report is not authorized for distribution to prospective investors in the fund unless preceded or accompanied by an effective prospectus.
Mutual fund shares are not deposits or obligations of, or guaranteed by, any depository institution. Shares are not insured by the FDIC, Federal Reserve Board or any other agency, and are subject to investment risks, including possible loss of principal amount invested.
Neither the fund nor Fidelity Distributors Corporation is a bank.
For more information on any Fidelity Advisor fund, including charges and expenses, contact your investment professional for a free prospectus. Read it carefully before you invest or send money.
Annual Report
Chairman's Message
(photo_of_Edward_C_Johnson_3d)
Dear Shareholder:
Many of you have read or heard news stories recently that were critical of mutual funds and made allegations that the mutual fund industry has been less than forthright. I find these reports unsettling and not necessarily an accurate picture of the overall industry, and I would like you to know where we at Fidelity stand.
With specific regard to allegations that certain mutual fund companies were violating the Securities and Exchange Commission's forward pricing rules or were involved in so-called "market timing" activities, I want to say two things:
First, Fidelity does not have agreements that permit customers who buy fund shares after 4 p.m. to obtain the 4 p.m. price. This is not to say that someone could not deceive the company through fraudulent acts. But I underscore that we have no so-called "agreements" which would permit this illegal practice.
Second, Fidelity has been on record for years opposing predatory short-term trading which adversely affects other shareholders in a mutual fund. In fact, in the 1980s, we began charging a fee - which is returned to the fund and, therefore, to investors - to discourage this activity. What's more, several years ago we took the industry lead in developing a Fair Value Pricing Policy to prevent market timing on foreign securities in our funds. It is reasonable to assume that another structure can be developed that would alter the system to make it much more difficult for predatory traders to operate. This, however, will only be achieved through close cooperation among regulators, legislators and the industry.
Certainly no industry is perfect, and there have been instances of unethical and illegal activity from time to time within the mutual fund industry. When this occurs, confessed or convicted offenders should be dealt with appropriately. Clearly, every system can be improved. We applaud well thought out improvements by regulators, legislators and industry representatives that achieve the common goal of building and protecting the value of investors' holdings. But we remain concerned about the risk of over-regulation and the quick application of simplistic solutions to intricate problems.
For more than 57 years, Fidelity Investments has worked very hard to improve its products and service to justify your trust. When our family founded this company in 1946, we had only a few hundred customers. Many of them were family and friends. Today, we serve more than 18 million customers including individual investors and participants in retirement plans across America.
Let me close by saying that we do not take your trust in us for granted, and we realize that we must always work to improve all aspects of our service to you. In turn, we urge you to continue your active participation with your financial matters, so that your interests can be well served.
Annual Report
Best regards,
/s/Edward C. Johnson 3d
Edward C. Johnson 3d
Annual Report
Performance: The Bottom Line
Average annual total return reflects the change in the value of an investment, assuming reinvestment of the class' dividend income and capital gains (the profits earned upon the sale of securities that have grown in value) and assuming a constant rate of performance each year. During periods of reimbursement by Fidelity, a fund's total return will be greater than it would be had the reimbursement not occurred. The $10,000 table and the fund's returns do not reflect the deduction of taxes that a shareholder would pay on fund distributions or the redemption of fund shares. How a fund did yesterday is no guarantee of how it will do tomorrow.
Average Annual Total Returns
Periods ended October 31, 2003 | Past 1
year | Life of
fundA |
Institutional Class | 32.41% | 9.31% |
A From December 17, 1998.
$10,000 Over Life of Fund
Let's say hypothetically that $10,000 was invested in Fidelity® Advisor Diversified International Fund - Institutional Class on December 17, 1998, when the fund started. The chart shows how the value of your investment would have grown, and also shows how the MSCI® EAFE® Index did over the same period.

Annual Report
Management's Discussion of Fund Performance
Comments from Bill Bower, Portfolio Manager of Fidelity® Advisor Diversified International Fund
Mirroring the U.S. rally, most international stock markets rebounded sharply during the 12-month period ending October 31, 2003. Encouraged by improved corporate earnings, favorable interest rates and the easing of geopolitical tensions, the Morgan Stanley Capital InternationalSM Europe, Australasia, Far East (MSCI® EAFE®) Index - a proxy for stock markets outside the United States and Canada - gained 27.39% during the past year. From a regional perspective, all 16 countries in the MSCI Europe index - which gained 24.56% - -- had double-digit advances. Spain, Denmark and Sweden were among the region's best performers. In Japan, increased capital spending, exports and machinery orders helped the Tokyo Stock Exchange Stock Price Index (TOPIX) advance 36.39%. Following the SARS epidemic, other Asian markets also rebounded. For instance, the Hong Kong market, as measured by the Hang Seng Index, gained 34.51%. Emerging markets also fared well, particularly Latin America. The MSCI Emerging Markets Free-Latin America Index rose 59.75%. Canadian equities, as measured by the S&P®/TSX Composite Index, also posted an impressive annual gain, advancing 50.66%.
For the 12 months ending October 31, 2003, Fidelity Advisor Diversified International Fund's Institutional Class shares were up 32.41%, topping the LipperSM International Funds Average, which rose 24.51%, as well as the MSCI EAFE index. Superior stock selection was the main reason for the fund's outperformance, with the fund beating the index's holdings in eight of the 10 major market sectors The portfolio's biggest advantage came in the energy industry, where an emphasis on energy services stocks, as well as companies with little exposure to the Middle East, proved quite helpful. Elsewhere, Japanese brokerage stocks were beneficiaries of the rising equity markets, and our holdings of Nomura and Nikko Cordial were top performers. Additionally, increasing the fund's emerging-markets exposure early in the period worked out well, as several of these stocks were among the fund's top contributors. Keeping a low exposure to European technology companies was disappointing, however, given that the market's willingness to pay for their only modestly better earnings growth was much greater than I expected, and these stocks rose. Looking at individual detractors, Anglo/Dutch consumer staples giant Unilever was hurt by disappointing third-quarter 2003 sales, and Swiss pharmaceutical firm Novartis declined due to lower-than-expected third-quarter profits.
The views expressed in this statement reflect those of the portfolio manager only through the end of the period of the report as stated on the cover and do not necessarily represent the views of Fidelity or any other person in the Fidelity organization. Any such views are subject to change at any time based upon market or other conditions and Fidelity disclaims any responsibility to update such views. These views may not be relied on as investment advice and, because investment decisions for a Fidelity fund are based on numerous factors, may not be relied on as an indication of trading intent on behalf of any Fidelity fund.
Annual Report
Investment Changes
Top Five Stocks as of October 31, 2003 |
| % of fund's
net assets | % of fund's net assets
6 months ago |
Novartis AG (Switzerland, Pharmaceuticals) | 2.0 | 2.5 |
Unilever NV (NY Shares) (Netherlands, Food Products) | 1.7 | 2.0 |
Vodafone Group PLC sponsored ADR (United Kingdom, Wireless Telecommunication Services) | 1.3 | 0.9 |
HSBC Holdings PLC (United Kingdom, Commercial Banks) | 1.2 | 1.2 |
GlaxoSmithKline PLC sponsored ADR (United Kingdom, Pharmaceuticals) | 1.2 | 1.6 |
| 7.4 | |
Top Five Market Sectors as of October 31, 2003 |
| % of fund's
net assets | % of fund's net assets
6 months ago |
Financials | 21.6 | 22.1 |
Health Care | 13.2 | 14.3 |
Consumer Discretionary | 11.8 | 12.4 |
Information Technology | 10.7 | 9.6 |
Consumer Staples | 9.0 | 11.1 |
Top Five Countries as of October 31, 2003 |
(excluding cash equivalents) | % of fund's
net assets | % of fund's net assets
6 months ago |
United Kingdom | 16.5 | 15.0 |
Japan | 15.2 | 11.3 |
Switzerland | 6.6 | 7.4 |
France | 5.4 | 7.2 |
Canada | 5.4 | 5.7 |
Percentages are adjusted for the effect of open futures contracts, if applicable. |
Asset Allocation (% of fund's net assets) |
As of October 31, 2003 | As of April 30, 2003 |
| Stocks and Investment Companies 91.6% | | | Stocks and Investment Companies 94.0% | |
| Bonds 1.0% | | | Bonds 1.0% | |
| Short-Term
Investments and
Net Other Assets 7.4% | | | Short-Term
Investments and
Net Other Assets 5.0% | |

Annual Report
Investments October 31, 2003
Showing Percentage of Net Assets
Common Stocks - 90.8% |
| Shares | | Value (Note 1) (000s) |
Australia - 2.6% |
Australia & New Zealand Banking Group Ltd. | 319,800 | | $ 4,029 |
Australia & New Zealand Banking Group Ltd. rights 11/24/03 (a) | 58,145 | | 177 |
Australian Gas Light Co. | 308,407 | | 2,336 |
Billabong International Ltd. | 190,900 | | 989 |
CSL Ltd. | 410,923 | | 4,944 |
Fosters Group Ltd. | 556,242 | | 1,799 |
Macquarie Bank Ltd. | 164,147 | | 4,048 |
National Australia Bank Ltd. | 121,600 | | 2,633 |
News Corp. Ltd.: | | | |
ADR | 54,700 | | 1,950 |
sponsored ADR | 23,300 | | 687 |
Promina Group Ltd. | 586,555 | | 1,378 |
QBE Insurance Group Ltd. | 901,525 | | 6,572 |
Sons of Gwalia Ltd. | 41,800 | | 102 |
Suncorp-Metway Ltd. | 265,400 | | 2,436 |
Westfield Holdings Ltd. | 198,900 | | 2,000 |
TOTAL AUSTRALIA | | 36,080 |
Belgium - 0.4% |
Agfa-Gevaert NV | 102,909 | | 2,545 |
Groupe Bruxelles Lambert SA (GBL) | 22,310 | | 1,074 |
Melexis NV | 159,750 | | 1,745 |
TOTAL BELGIUM | | 5,364 |
Bermuda - 0.3% |
Aquarius Platinum Ltd. (Australia) | 373,455 | | 2,075 |
Clear Media Ltd. (a) | 3,064,100 | | 2,012 |
TOTAL BERMUDA | | 4,087 |
Brazil - 0.8% |
Companhia Vale do Rio Doce sponsored ADR | 174,400 | | 7,979 |
Embraer - Empresa Brasileira de Aeronautica SA sponsored ADR | 25,000 | | 649 |
Petroleo Brasileiro SA Petrobras sponsored ADR | 116,100 | | 2,728 |
TOTAL BRAZIL | | 11,356 |
Canada - 5.4% |
Aber Diamond Corp. (a) | 55,500 | | 1,753 |
Alcan, Inc. | 64,800 | | 2,585 |
Astral Media, Inc. Class A (non-vtg.) | 61,200 | | 1,216 |
Barrick Gold Corp. | 89,100 | | 1,733 |
Common Stocks - continued |
| Shares | | Value (Note 1) (000s) |
Canada - continued |
BCE, Inc. | 80,300 | | $ 1,818 |
Bombardier, Inc. Class B (sub. vtg.) | 407,100 | | 1,828 |
Canadian Natural Resources Ltd. | 55,900 | | 2,374 |
Canadian Western Bank, Edmonton | 23,600 | | 715 |
EnCana Corp. | 243,344 | | 8,355 |
Falconbridge Ltd. | 79,800 | | 1,555 |
ITF Optical Technologies, Inc. Series A (g) | 1,792 | | 2 |
Kinross Gold Corp. (a)(e) | 96,700 | | 793 |
Kinross Gold Corp. (a) | 63,433 | | 520 |
Loblaw Companies Ltd. | 23,800 | | 1,153 |
Mega Bloks, Inc. (a) | 67,900 | | 1,293 |
Mega Bloks, Inc. (a)(e) | 23,400 | | 445 |
Meridian Gold, Inc. (a) | 54,500 | | 691 |
Metro, Inc. Class A (sub. vtg.) | 24,000 | | 361 |
National Bank of Canada | 124,400 | | 3,860 |
OZ Optics Ltd. unit (g) | 5,400 | | 80 |
Petro-Canada | 231,200 | | 9,316 |
PetroKazakhstan, Inc. Class A (a) | 127,200 | | 2,894 |
Power Corp. of Canada (sub. vtg.) | 118,100 | | 3,879 |
Precision Drilling Corp. (a) | 173,400 | | 6,822 |
Saputo, Inc. | 89,000 | | 1,769 |
Sun Life Financial, Inc. | 175,418 | | 4,336 |
Talisman Energy, Inc. | 112,000 | | 5,470 |
TELUS Corp. (non-vtg.) | 61,600 | | 1,079 |
Thunder Energy, Inc. (a) | 81,300 | | 438 |
TimberWest Forest Corp. unit | 242,300 | | 2,128 |
TransCanada Corp. | 125,600 | | 2,562 |
Trican Well Service Ltd. (a) | 52,400 | | 914 |
Wheaton River Minerals Ltd. (a) | 369,500 | | 858 |
TOTAL CANADA | | 75,595 |
Cayman Islands - 0.2% |
Apex Silver Mines Ltd. (a) | 173,800 | | 2,336 |
China - 1.0% |
Byd Co. Ltd. (H Shares) | 925,000 | | 2,412 |
China Oilfield Services Ltd. (H Shares) | 1,090,000 | | 316 |
China Shipping Development Co. Ltd. (H Shares) | 1,082,000 | | 711 |
China Telecom Corp. Ltd. sponsored ADR | 159,100 | | 5,169 |
Lianhua Supermarket Holdings Co. (H Shares) | 669,000 | | 655 |
Peoples Food Holdings Ltd. | 2,779,000 | | 1,773 |
PetroChina Co. Ltd. sponsored ADR | 21,800 | | 794 |
Common Stocks - continued |
| Shares | | Value (Note 1) (000s) |
China - continued |
PICC Property & Casualty Co. Ltd. (H Shares) | 308,000 | | $ 72 |
Tsingtao Brewery Co. Ltd. (H Shares) | 918,000 | | 1,194 |
Zhenhai Refining & Chemical Co. (H Shares) | 1,064,000 | | 651 |
TOTAL CHINA | | 13,747 |
Denmark - 2.6% |
A.P. Moller - Maersk AS: | | | |
Series A | 78 | | 591 |
Series B | 410 | | 3,207 |
Coloplast AS Series B | 38,750 | | 3,249 |
Danske Bank AS | 367,775 | | 7,393 |
Group 4 Falck AS | 312,385 | | 6,986 |
Novo Nordisk AS Series B | 251,543 | | 9,016 |
Novozymes AS Series B | 176,000 | | 5,650 |
TOTAL DENMARK | | 36,092 |
Finland - 0.6% |
Nokia Corp. sponsored ADR | 453,400 | | 7,703 |
TietoEnator Oyj | 10,800 | | 285 |
TOTAL FINLAND | | 7,988 |
France - 5.4% |
AXA SA sponsored ADR | 309,500 | | 5,881 |
Bacou Dalloz | 24,013 | | 1,869 |
BNP Paribas SA | 163,000 | | 8,535 |
CNP Assurances | 86,093 | | 3,913 |
Credit Agricole SA | 91,800 | | 1,943 |
Credit Agricole SA rights 11/7/03 (a) | 91,800 | | 21 |
Dassault Aviation SA | 3,688 | | 1,339 |
Essilor International SA | 82,578 | | 3,959 |
Financiere Marc de Lacharriere SA (Fimalac) | 57,957 | | 1,651 |
Financiere Marc de Lacharriere SA (Fimalac) warrants 12/31/06 (a) | 5,532 | | 16 |
Ipsos SA | 25,585 | | 2,152 |
L'Oreal SA | 73,350 | | 5,404 |
Lagardere S.C.A. (Reg.) | 10,700 | | 536 |
Louis Vuitton Moet Hennessy (LVMH) | 7,100 | | 489 |
Neopost SA | 99,546 | | 4,925 |
NRJ Group | 84,320 | | 1,646 |
Pernod-Ricard | 45,703 | | 4,394 |
Suez SA (France) | 65,400 | | 1,046 |
Technip-Coflexip SA | 58,527 | | 5,763 |
Common Stocks - continued |
| Shares | | Value (Note 1) (000s) |
France - continued |
Television Francaise 1 SA | 90,733 | | $ 2,712 |
Total SA sponsored ADR | 169,100 | | 13,202 |
Vinci SA | 25,100 | | 1,813 |
Vivendi Universal SA sponsored ADR (a) | 136,300 | | 2,866 |
TOTAL FRANCE | | 76,075 |
Germany - 3.5% |
Allianz AG sponsored ADR | 795,070 | | 8,579 |
Altana AG sponsored ADR | 98,750 | | 6,202 |
AWD Holding AG | 19,973 | | 555 |
Bayerische Hypo Und Verein AG (a) | 53,000 | | 1,163 |
Celanese AG (Reg.) | 72,458 | | 2,512 |
Celesio AG | 48,327 | | 2,015 |
Deutsche Boerse AG | 151,076 | | 8,369 |
Deutsche Telekom AG sponsored ADR (a) | 298,100 | | 4,653 |
Epcos AG (a) | 31,300 | | 643 |
Fresenius Medical Care AG sponsored ADR | 246,700 | | 4,680 |
GFK AG | 56,213 | | 1,403 |
Metro AG | 62,000 | | 2,527 |
Muenchener Rueckversicherungs-Gesellschaft AG: | | | |
rights 11/10/03 (a) | 21,634 | | 178 |
(Reg.) | 27,723 | | 3,295 |
Stada Arzneimittel AG | 49,084 | | 2,535 |
TOTAL GERMANY | | 49,309 |
Greece - 0.8% |
Coca-Cola Hellenic Bottling Co. SA (Bearer) | 112,120 | | 2,164 |
Cosmote Mobile Telecommunications SA | 109,100 | | 1,249 |
Greek Organization of Football Prognostics SA | 195,510 | | 2,401 |
Hellenic Technodomiki Tev SA | 88,440 | | 465 |
Public Power Corp. of Greece | 167,830 | | 3,605 |
Technical Olympic SA (Reg.) | 143,800 | | 706 |
TOTAL GREECE | | 10,590 |
Hong Kong - 1.9% |
Aeon Credit Service (Asia) Co. Ltd. | 716,000 | | 445 |
CNOOC Ltd. sponsored ADR | 116,900 | | 4,401 |
Esprit Holdings Ltd. | 189,500 | | 595 |
Global Bio-Chem Technology Group Co. Ltd. | 2,652,000 | | 1,349 |
Hutchison Whampoa Ltd. | 528,000 | | 4,097 |
Kingboard Chemical Holdings Ltd. | 702,000 | | 940 |
Li & Fung Ltd. | 1,248,000 | | 2,097 |
Common Stocks - continued |
| Shares | | Value (Note 1) (000s) |
Hong Kong - continued |
Techtronic Industries Co. | 2,828,000 | | $ 7,793 |
Television Broadcasts Ltd. | 441,000 | | 2,090 |
Yue Yuen Industrial Holdings Ltd. | 867,061 | | 2,456 |
TOTAL HONG KONG | | 26,263 |
India - 2.6% |
Bajaj Auto Ltd. | 92,600 | | 1,870 |
Dr. Reddy's Laboratories Ltd. | 203,740 | | 5,373 |
HDFC Bank Ltd. | 250,672 | | 1,750 |
Housing Development Finance Corp. Ltd. | 578,750 | | 6,639 |
I-Flex Solutions Ltd. | 123,332 | | 1,869 |
Infosys Technologies Ltd. | 48,776 | | 5,103 |
Ranbaxy Laboratories Ltd. | 260,821 | | 5,658 |
Satyam Computer Services Ltd. | 575,400 | | 3,886 |
State Bank of India | 386,077 | | 4,125 |
TOTAL INDIA | | 36,273 |
Indonesia - 0.1% |
PT Bank Rakyat Indonesia (a)(f) | 7,993,000 | | 823 |
Ireland - 1.1% |
Allied Irish Banks PLC | 147,600 | | 2,154 |
Bank of Ireland | 299,677 | | 3,711 |
CRH PLC | 122,100 | | 2,185 |
IAWS Group PLC (Ireland) | 319,300 | | 3,403 |
Independent News & Media PLC (Ireland) | 1,281,457 | | 2,791 |
Kerry Group PLC Class A | 107,500 | | 1,868 |
TOTAL IRELAND | | 16,112 |
Israel - 0.3% |
Teva Pharmaceutical Industries Ltd. sponsored ADR | 79,600 | | 4,528 |
Italy - 1.3% |
Banca Intesa Spa | 1,248,431 | | 4,203 |
Banco Popolare di Verona e Novara | 174,813 | | 2,692 |
Cassa Di Risparmio Di Firenze | 502,025 | | 776 |
ENI Spa sponsored ADR | 44,400 | | 3,530 |
Telecom Italia Spa ADR (a) | 259,462 | | 6,720 |
TOTAL ITALY | | 17,921 |
Japan - 14.8% |
Access Co. Ltd. (a) | 10 | | 576 |
Aeon Credit Service Ltd. | 29,500 | | 1,366 |
Asahi Glass Co. Ltd. | 196,000 | | 1,547 |
Common Stocks - continued |
| Shares | | Value (Note 1) (000s) |
Japan - continued |
Avex, Inc. | 15,700 | | $ 313 |
Canon, Inc. ADR | 232,200 | | 11,366 |
Credit Saison Co. Ltd. | 152,000 | | 3,180 |
Daicel Chemical Industries Ltd. | 107,000 | | 454 |
Daito Trust Construction Co. | 74,800 | | 2,313 |
Daiwa Securities Group, Inc. | 1,521,000 | | 11,123 |
Dwango Co. Ltd. | 31 | | 451 |
Enplas Corp. | 34,800 | | 1,155 |
Fuji Soft ABC, Inc. | 10,400 | | 315 |
Fuji Television Network, Inc. | 157 | | 835 |
Gigno System Japan, Inc. | 104 | | 283 |
Hoya Corp. | 62,200 | | 5,629 |
Index Corp. | 52 | | 350 |
Ito Yokado Ltd. | 94,000 | | 3,454 |
JAFCO Co. Ltd. | 34,700 | | 2,967 |
Kadokawa Shoten Publishing Co. Ltd. | 10,500 | | 304 |
Keyence Corp. | 15,100 | | 3,321 |
Konica Minolta Holdings, Inc. | 486,500 | | 6,394 |
Kyocera Corp. | 62,100 | | 3,739 |
Kyocera Corp. sponsored ADR | 10,200 | | 626 |
Kyorin Pharmaceutical Co. Ltd. | 52,000 | | 783 |
Millea Holdings, Inc. | 208 | | 2,478 |
Mitsubishi Securities Co. Ltd. | 103,000 | | 1,171 |
Murata Manufacturing Co. Ltd. | 52,200 | | 2,968 |
Nikko Cordial Corp. | 2,802,000 | | 15,114 |
Nikon Corp. (a) | 186,000 | | 2,824 |
Nissan Motor Co. Ltd. | 563,100 | | 6,366 |
Nitori Co. Ltd. | 8,550 | | 545 |
Nitto Denko Corp. | 80,700 | | 4,235 |
NOK Corp. | 11,000 | | 433 |
Nomura Holdings, Inc. | 929,000 | | 15,954 |
Olympus Corp. | 97,000 | | 2,126 |
ORIX Corp. | 88,300 | | 7,429 |
Ricoh Co. Ltd. | 107,000 | | 2,029 |
Rohm Co. Ltd. | 45,400 | | 6,120 |
Seiyu Ltd. (a) | 770,000 | | 2,486 |
Shin-Etsu Chemical Co. Ltd. | 173,900 | | 6,469 |
Shinko Electric Industries Co.Ltd. | 49,000 | | 1,203 |
Sony Corp. sponsored ADR | 354,000 | | 12,461 |
Stanley Electric Co. Ltd. | 97,000 | | 2,065 |
Sumitomo Mitsui Financial Group, Inc. | 2,323 | | 11,685 |
TDK Corp. | 55,500 | | 3,635 |
Common Stocks - continued |
| Shares | | Value (Note 1) (000s) |
Japan - continued |
Terumo Corp. | 113,900 | | $ 2,165 |
Tokyo Electron Ltd. | 148,600 | | 10,651 |
Toshiba Corp. | 1,250,000 | | 5,014 |
Toyota Industries Corp. | 94,500 | | 1,745 |
Toyota Motor Corp. | 32,600 | | 946 |
Toyota Motor Corp. ADR | 154,800 | | 8,981 |
UFJ Holdings, Inc. (a) | 611 | | 2,612 |
USS Co. Ltd. | 10,660 | | 757 |
Yamada Denki Co. Ltd. | 35,300 | | 1,124 |
TOTAL JAPAN | | 206,635 |
Korea (South) - 1.6% |
Amorepacific Corp. | 13,550 | | 1,860 |
Honam Petrochemical Corp. | 21,210 | | 849 |
Kookmin Bank | 1,260 | | 46 |
Kookmin Bank sponsord ADR | 113,210 | | 4,160 |
KT&G Corp. | 84,650 | | 1,631 |
LG Card Co. Ltd. | 140,810 | | 1,434 |
LG Electronics, Inc. | 27,370 | | 1,418 |
Samsung Electronics Co. Ltd. | 28,900 | | 11,477 |
TOTAL KOREA (SOUTH) | | 22,875 |
Luxembourg - 0.1% |
SES Global Fiduciary Depositary Receipts | 178,405 | | 1,583 |
Mexico - 0.7% |
Coca-Cola Femsa SA de CV sponsored ADR (a) | 152,800 | | 3,087 |
Fomento Economico Mexicano SA de CV sponsored ADR | 66,000 | | 2,358 |
Grupo Radio Centro SA de CV sponsored ADR | 130,900 | | 795 |
TV Azteca SA de CV sponsored ADR | 415,800 | | 3,364 |
TOTAL MEXICO | | 9,604 |
Netherlands - 5.1% |
ASML Holding NV (NY Shares) (a) | 534,500 | | 9,380 |
EADS NV | 99,108 | | 2,009 |
Euronext NV | 159,347 | | 3,886 |
Fugro NV (Certificaten Van Aandelen) | 62,700 | | 3,141 |
ING Groep NV sponsored ADR | 315,541 | | 6,576 |
Koninklijke Numico NV (Certificaten Van Aandelen) (a) | 105,000 | | 2,361 |
Koninklijke Philips Electronics NV (NY Shares) | 120,300 | | 3,229 |
Nutreco Holding NV | 42,200 | | 1,124 |
OPG Groep NV (A Shares) | 35,100 | | 1,256 |
Royal Dutch Petroleum Co. (NY Shares) | 149,500 | | 6,635 |
Common Stocks - continued |
| Shares | | Value (Note 1) (000s) |
Netherlands - continued |
Unilever NV (NY Shares) | 396,600 | | $ 23,261 |
Van der Moolen Holding NV sponsored ADR | 73,200 | | 632 |
Vedior NV (Certificaten Van Aandelen) | 202,992 | | 2,916 |
VNU NV | 158,049 | | 4,797 |
TOTAL NETHERLANDS | | 71,203 |
Netherlands Antilles - 0.3% |
Schlumberger Ltd. (NY Shares) | 96,200 | | 4,519 |
Norway - 1.1% |
DnB Holding ASA | 841,100 | | 4,886 |
Gjensidige NOR ASA | 49,900 | | 2,035 |
Orkla ASA (A Shares) | 43,650 | | 910 |
ProSafe ASA | 60,350 | | 1,076 |
Schibsted AS (B Shares) | 113,750 | | 1,992 |
Storebrand ASA (A Shares) (a) | 760,300 | | 4,213 |
TOTAL NORWAY | | 15,112 |
Panama - 0.2% |
Banco Latin Americano de Exporaciones SA (BLADEX)
Series E (a) | 180,328 | | 2,705 |
Portugal - 0.3% |
Brisa Auto-Estradas de Portugal SA | 296,921 | | 1,851 |
Portugal Telecom SGPS SA sponsored ADR | 209,600 | | 1,771 |
TOTAL PORTUGAL | | 3,622 |
Russia - 1.3% |
JSC MMC 'Norilsk Nickel' sponsored ADR | 54,400 | | 2,788 |
Lukoil Oil Co. sponsored ADR | 43,100 | | 3,504 |
Mobile TeleSystems OJSC sponsored ADR | 30,300 | | 2,348 |
OAO Gazprom sponsored ADR | 99,500 | | 2,388 |
Sibneft sponsored ADR | 65,900 | | 1,433 |
Surgutneftegaz JSC sponsored ADR | 31,900 | | 792 |
YUKOS Corp. sponsored ADR | 116,957 | | 5,403 |
TOTAL RUSSIA | | 18,656 |
Singapore - 0.2% |
Datacraft Asia Ltd. (a) | 532,000 | | 665 |
Fraser & Neave Ltd. | 101,620 | | 719 |
Want Want Holdings Ltd. | 1,493,000 | | 1,262 |
TOTAL SINGAPORE | | 2,646 |
Common Stocks - continued |
| Shares | | Value (Note 1) (000s) |
South Africa - 0.4% |
Anglo American Platinum Corp. Ltd. | 25,100 | | $ 1,075 |
Gold Fields Ltd. sponsored ADR | 91,600 | | 1,312 |
Harmony Gold Mining Co. Ltd. sponsored ADR | 193,600 | | 2,927 |
MTN Group Ltd. (a) | 108,000 | | 387 |
TOTAL SOUTH AFRICA | | 5,701 |
Spain - 4.1% |
Actividades de Construccion y Servicios SA (ACS) | 136,771 | | 5,739 |
Altadis SA (Spain) | 470,969 | | 11,381 |
Banco Bilbao Vizcaya Argentaria SA sponsored ADR | 456,100 | | 5,209 |
Banco Espanol de Credito SA (Reg.) | 52,600 | | 526 |
Banco Popular Espanol SA (Reg.) | 94,876 | | 4,916 |
Banco Santander Central Hispano SA ADR | 788,400 | | 7,513 |
Compania de Distribucion Integral Logista SA | 76,480 | | 2,051 |
Fomento Construcciones y Contratas SA (FOCSA) | 100,734 | | 3,274 |
Grupo Auxiliar Metalurgico SA (Gamesa) | 40,600 | | 1,095 |
Grupo Ferrovial SA | 111,471 | | 3,172 |
Inditex SA | 189,456 | | 3,900 |
Prosegur Comp Securidad SA (Reg.) | 65,200 | | 1,057 |
Repsol YPF SA sponsored ADR | 84,300 | | 1,464 |
Telefonica SA sponsored ADR | 145,900 | | 5,457 |
Union Fenosa SA | 54,400 | | 876 |
TOTAL SPAIN | | 57,630 |
Sweden - 2.1% |
Eniro AB | 268,000 | | 2,138 |
Getinge AB (B Shares) | 72,800 | | 2,654 |
Hennes & Mauritz AB (H&M) (B Shares) | 173,400 | | 3,664 |
Nordea AB | 241,100 | | 1,490 |
OMHEX AB | 161,500 | | 1,649 |
Securitas AB (B Shares) | 560,000 | | 6,863 |
Svenska Cellulosa AB (SCA) (B Shares) | 93,850 | | 3,529 |
Swedish Match Co. | 352,300 | | 2,856 |
Tele2 AB (B Shares) (a) | 32,500 | | 1,629 |
Telefonaktiebolaget LM Ericsson ADR (a) | 197,500 | | 3,373 |
TV 4 AB (A Shares) | 12,500 | | 244 |
TOTAL SWEDEN | | 30,089 |
Switzerland - 6.6% |
Actelion Ltd. (Reg.) (a) | 39,490 | | 3,741 |
Alcon, Inc. | 88,400 | | 4,872 |
Compagnie Financiere Richemont unit | 101,226 | | 2,269 |
Common Stocks - continued |
| Shares | | Value (Note 1) (000s) |
Switzerland - continued |
Converium Holding AG | 54,318 | | $ 2,666 |
Credit Suisse Group sponsored ADR | 330,500 | | 11,660 |
INFICON Holding AG (a) | 23,156 | | 1,727 |
Nestle SA (Reg.) | 30,138 | | 6,609 |
Nobel Biocare Holding AG (Switzerland) | 83,267 | | 7,360 |
Novartis AG sponsored ADR | 717,432 | | 27,534 |
Roche Holding AG (participation certificate) | 127,964 | | 10,548 |
Schindler Holding AG (Reg'd.) (a) | 9,961 | | 2,504 |
SIG Holding AG | 12,046 | | 1,611 |
Swiss Life Holding (a) | 6,903 | | 1,166 |
Tecan Group AG | 46,549 | | 1,667 |
The Swatch Group AG (Reg.) | 188,286 | | 4,003 |
UBS AG (NY Shares) | 45,647 | | 2,800 |
TOTAL SWITZERLAND | | 92,737 |
Taiwan - 1.0% |
Chinatrust Financial Holding Co. | 1,418,650 | | 1,476 |
Fubon Financial Holding Co. Ltd. | 1,603,787 | | 1,692 |
Hon Hai Precision Industries Co. Ltd. | 967,000 | | 4,332 |
Taiwan Semiconductor Manufacturing Co. Ltd. (a) | 2,563,160 | | 5,061 |
United Microelectronics Corp. (a) | 664,000 | | 609 |
Yuanta Core Pacific Securities Co. Ltd. | 1,115,789 | | 694 |
TOTAL TAIWAN | | 13,864 |
Thailand - 0.0% |
BEC World PCL (For. Reg.) | 54,500 | | 330 |
United Kingdom - 16.1% |
Amdocs Ltd. (a) | 109,800 | | 2,356 |
Amersham PLC | 104,400 | | 1,298 |
Anglo American PLC: | | | |
ADR | 32,205 | | 658 |
(United Kingdom) | 70,800 | | 1,447 |
ARM Holdings PLC sponsored ADR (a) | 258,400 | | 1,496 |
AstraZeneca PLC sponsored ADR | 311,100 | | 14,833 |
Astro All Asia Networks PLC (a) | 166,000 | | 206 |
BAE Systems PLC | 1,005,600 | | 3,118 |
BBA Group PLC | 336,800 | | 1,482 |
BOC Group PLC | 264,227 | | 3,597 |
BP PLC sponsored ADR | 232,000 | | 9,832 |
British American Tobacco PLC sponsored ADR | 267,400 | | 6,436 |
Capita Group PLC | 1,058,600 | | 4,435 |
Capital Radio PLC | 141,792 | | 1,129 |
Common Stocks - continued |
| Shares | | Value (Note 1) (000s) |
United Kingdom - continued |
Celltech Group PLC (a) | 252,012 | | $ 1,960 |
Centrica PLC | 1,508,900 | | 4,717 |
Danka Business Systems PLC sponsored ADR (a) | 324,900 | | 997 |
Enterprise Inns PLC | 232,313 | | 3,328 |
French Connection Group PLC | 45,350 | | 1,516 |
Gallaher Group PLC sponsored ADR | 86,500 | | 3,456 |
GlaxoSmithKline PLC sponsored ADR | 383,180 | | 16,588 |
Hays PLC | 860,800 | | 1,779 |
HSBC Holdings PLC: | | | |
(United Kingdom) (Reg.) | 3,300 | | 50 |
sponsored ADR | 221,500 | | 16,628 |
Icap PLC | 32,600 | | 764 |
Inchcape PLC | 160,460 | | 3,714 |
Intertek Group PLC | 314,600 | | 2,737 |
Johnston Press PLC | 215,570 | | 1,698 |
Kesa Electricals PLC | 475,912 | | 1,968 |
Kingfisher PLC | 895,374 | | 4,286 |
London Stock Exchange PLC | 299,023 | | 1,938 |
Maiden Group PLC | 187,100 | | 808 |
Man Group PLC | 112,600 | | 2,765 |
National Grid Transco PLC | 201,400 | | 1,284 |
Next PLC | 285,800 | | 5,714 |
Northern Rock PLC | 243,800 | | 2,927 |
Pennon Group PLC | 106,601 | | 1,153 |
PHS Group PLC | 677,708 | | 993 |
Prudential PLC | 837,000 | | 6,485 |
Punch Taverns Ltd. | 341,700 | | 1,964 |
Reckitt Benckiser PLC | 442,100 | | 9,289 |
Rentokil Initial PLC | 641,300 | | 2,426 |
Rio Tinto PLC (Reg.) | 166,700 | | 4,128 |
Royal Bank of Scotland Group PLC | 101,800 | | 2,724 |
Shire Pharmaceuticals Group PLC sponsored ADR (a) | 122,100 | | 2,796 |
Signet Group PLC | 213,200 | | 374 |
SMG PLC | 813,557 | | 1,392 |
Smith & Nephew PLC | 1,008,200 | | 7,999 |
Standard Chartered PLC | 154,100 | | 2,461 |
Taylor Nelson Sofres PLC | 958,520 | | 3,500 |
Tesco PLC | 2,792,700 | | 11,179 |
Trinity Mirror PLC | 259,695 | | 2,381 |
United Business Media PLC | 160,509 | | 1,262 |
Vodafone Group PLC sponsored ADR | 871,800 | | 18,439 |
William Hill PLC | 577,000 | | 3,314 |
Common Stocks - continued |
| Shares | | Value (Note 1) (000s) |
United Kingdom - continued |
Wolfson Microelectronics PLC (a) | 39,100 | | $ 157 |
Xstrata PLC | 454,781 | | 4,662 |
Yell Group PLC (a) | 401,000 | | 1,950 |
TOTAL UNITED KINGDOM | | 224,973 |
United States of America - 3.9% |
Affiliated Computer Services, Inc. Class A (a) | 24,200 | | 1,184 |
AFLAC, Inc. | 86,600 | | 3,159 |
Baxter International, Inc. | 58,900 | | 1,566 |
Central European Distribution Corp. (a) | 48,700 | | 1,831 |
Forest Laboratories, Inc. (a) | 59,700 | | 2,986 |
Fox Entertainment Group, Inc. Class A (a) | 60,000 | | 1,662 |
Freeport-McMoRan Copper & Gold, Inc. Class B | 122,200 | | 4,735 |
Golden Telecom, Inc. (a) | 10,800 | | 280 |
Merck & Co., Inc. | 52,800 | | 2,336 |
Mettler-Toledo International, Inc. (a) | 105,700 | | 4,053 |
Motorola, Inc. | 635,900 | | 8,604 |
Newmont Mining Corp. Holding Co. | 89,420 | | 3,915 |
NTL, Inc. (a) | 125,590 | | 7,753 |
Orthofix International NV (a) | 70,400 | | 2,570 |
Phelps Dodge Corp. (a) | 39,500 | | 2,439 |
Synthes-Stratec, Inc. | 6,544 | | 5,985 |
TOTAL UNITED STATES OF AMERICA | | 55,058 |
TOTAL COMMON STOCKS (Cost $1,080,343) | 1,270,081 |
Preferred Stocks - 0.4% |
| | | |
Convertible Preferred Stocks - 0.0% |
Canada - 0.0% |
Metrophotonics, Inc. Series 2 (g) | 8,500 | | 85 |
Nonconvertible Preferred Stocks - 0.4% |
Germany - 0.4% |
Fresenius Medical Care AG | 63,600 | | 2,601 |
Porsche AG (non-vtg.) | 5,400 | | 2,643 |
TOTAL GERMANY | | 5,244 |
TOTAL PREFERRED STOCKS (Cost $4,941) | 5,329 |
Investment Companies - 0.4% |
| Shares | | Value (Note 1) (000s) |
China - 0.1% |
China Fund, Inc. | 35,400 | | $ 1,230 |
Templeton China World Fund, Inc. | 54,100 | | 837 |
TOTAL CHINA | | 2,067 |
India - 0.1% |
The India Fund, Inc. | 55,645 | | 1,056 |
Multi-National - 0.2% |
Templeton Dragon Fund, Inc. | 181,200 | | 2,838 |
TOTAL INVESTMENT COMPANIES (Cost $3,915) | 5,961 |
Nonconvertible Bonds - 0.6% |
| Principal Amount (000s) | | |
United Kingdom - 0.4% |
Telewest Communications PLC yankee: | | | | |
0% 4/15/09 (c)(d) | | $ 810 | | 358 |
0% 2/1/10 (c)(d) | | 1,805 | | 727 |
9.875% 2/1/10 (c) | | 2,305 | | 1,187 |
11.25% 11/1/08 (c) | | 210 | | 113 |
Telewest PLC: | | | | |
11% 10/1/07 (c) | | 5,550 | | 2,997 |
yankee 9.625% 10/1/06 (c) | | 835 | | 443 |
TOTAL UNITED KINGDOM | | 5,825 |
United States of America - 0.2% |
NTL, Inc. 19% 1/1/10 | | 2,333 | | 2,275 |
TOTAL NONCONVERTIBLE BONDS (Cost $6,771) | 8,100 |
Government Obligations - 0.4% |
|
Japan - 0.4% |
Japan Government 0.2% 9/20/05
(Cost $4,941) | JPY | 544,400 | | 4,960 |
Money Market Funds - 10.5% |
| Shares | Value (Note 1) (000s) |
Fidelity Cash Central Fund, 1.07% (b)
(Cost $146,280) | 146,280,436 | $ 146,280 |
TOTAL INVESTMENT PORTFOLIO - 103.1% (Cost $1,247,191) | 1,440,711 |
NET OTHER ASSETS - (3.1)% | (42,782) |
NET ASSETS - 100% | $ 1,397,929 |
Currency Abbreviations |
JPY | - | Japanese yen |
Legend |
(a) Non-income producing |
(b) The rate quoted is the annualized seven-day yield of the fund at period end. A complete listing of the fund's holdings as of its most recent fiscal year end is available upon request. |
(c) Non-income producing - issuer filed for bankruptcy or is in default of interest payments. |
(d) Debt obligation initially issued in zero coupon form which converts to coupon form at a specified rate and date. The rate shown is the rate at period end. |
(e) Security exempt from registration under Rule 144A of the Securities Act of 1933. These securities may be resold in transactions exempt from registration, normally to qualified institutional buyers. At the period end, the value of these securities amounted to $1,238,000 or 0.1% of net assets. |
(f) Security or a portion of the security purchased on a delayed delivery or when-issued basis. |
(g) Restricted securities - Investment in securities not registered under the Securities Act of 1933. |
Additional information on each holding is as follows: |
Security | Acquisition Date | Acquisition Cost (000s) |
ITF Optical Technologies, Inc. Series A | 10/11/00 | $ 90 |
Metrophotonics, Inc. Series 2 | 9/29/00 | $ 85 |
OZ Optics Ltd. unit | 8/18/00 | $ 80 |
Other Information |
Purchases and sales of securities, other than short-term securities, aggregated $993,935,000 and $336,180,000, respectively, of which long-term U.S. government and government agency obligations aggregated $0 and $6,424,000, respectively. |
The fund placed a portion of its portfolio transactions with brokerage firms which are affiliates of the investment adviser. The commissions paid to these affiliated firms were $15,000 for the period. |
The fund invested in securities that are not registered under the Securities Act of 1933. At the end of the period, the value of restricted securities (excluding 144A issues) amounted to $167,000 or 0% of net assets. |
Income Tax Information |
At October 31, 2003, the fund had a capital loss carryforward of approximately $62,647,000 of which $30,705,000 and $31,942,000 will expire on October 31, 2009 and 2010, respectively. |
See accompanying notes which are an integral part of the financial statements.
Annual Report
Financial Statements
Statement of Assets and Liabilities
Amounts in thousands (except per-share amounts) | October 31, 2003 |
| | |
Assets | | |
Investment in securities, at value (including securities loaned of $43,117) (cost $1,247,191) - See accompanying schedule | | $ 1,440,711 |
Cash | | 197 |
Foreign currency held at value (cost $ 1,025) | | 1,029 |
Receivable for investments sold | | 7,841 |
Receivable for fund shares sold | | 18,274 |
Dividends receivable | | 2,382 |
Interest receivable | | 103 |
Prepaid expenses | | 4 |
Other receivables | | 6 |
Total assets | | 1,470,547 |
| | |
Liabilities | | |
Payable for investments purchased
Regular delivery | $ 22,339 | |
Delayed delivery | 831 | |
Payable for fund shares redeemed | 1,081 | |
Accrued management fee | 796 | |
Distribution fees payable | 436 | |
Other payables and accrued expenses | 2,346 | |
Collateral on securities loaned, at value | 44,789 | |
Total liabilities | | 72,618 |
| | |
Net Assets | | $ 1,397,929 |
Net Assets consist of: | | |
Paid in capital | | $ 1,265,301 |
Undistributed net investment income | | 6,506 |
Accumulated undistributed net realized gain (loss) on investments and foreign currency transactions | | (65,469) |
Net unrealized appreciation (depreciation) on investments and assets and liabilities in foreign currencies | | 191,591 |
Net Assets | | $ 1,397,929 |
See accompanying notes which are an integral part of the financial statements.
Annual Report
Financial Statements - continued
Statement of Assets and Liabilities - continued
Amounts in thousands (except per-share amounts) | October 31, 2003 |
| | |
Calculation of Maximum Offering Price
Class A:
Net Asset Value and redemption price per share ($240,719 ÷ 16,489 shares) | | $ 14.60 |
| | |
Maximum offering price per share (100/94.25 of $14.60) | | $ 15.49 |
Class T:
Net Asset Value and redemption price per share ($552,442 ÷ 38,191 shares) | | $ 14.47 |
| | |
Maximum offering price per share (100/96.50 of $14.47) | | $ 14.99 |
Class B:
Net Asset Value and offering price per share
($89,290 ÷ 6,294 shares) A | | $ 14.19 |
| | |
Class C:
Net Asset Value and offering price per share
($124,003 ÷ 8,722 shares) A | | $ 14.22 |
| | |
| | |
Institutional Class:
Net Asset Value, offering price and redemption price per share ($391,475 ÷ 26,551 shares) | | $ 14.74 |
A Redemption price per share is equal to net asset value less any applicable contingent deferred sales charge.
See accompanying notes which are an integral part of the financial statements.
Annual Report
Statement of Operations
Amounts in thousands | Year ended October 31, 2003 |
| | |
Investment Income | | |
Dividends | | $ 15,593 |
Interest | | 1,320 |
Security lending | | 340 |
| | 17,253 |
Less foreign taxes withheld | | (1,498) |
Total income | | 15,755 |
| | |
Expenses | | |
Management fee | $ 5,424 | |
Transfer agent fees | 2,286 | |
Distribution fees | 3,343 | |
Accounting and security lending fees | 431 | |
Non-interested trustees' compensation | 3 | |
Custodian fees and expenses | 629 | |
Registration fees | 175 | |
Audit | 59 | |
Legal | 17 | |
Miscellaneous | 15 | |
Total expenses before reductions | 12,382 | |
Expense reductions | (196) | 12,186 |
Net investment income (loss) | | 3,569 |
Realized and Unrealized Gain (Loss) Net realized gain (loss) on: | | |
Investment securities | 14,691 | |
Foreign currency transactions | 132 | |
Total net realized gain (loss) | | 14,823 |
Change in net unrealized appreciation (depreciation) on: Investment securities (net of deferred foreign taxes of $1,978) | 218,069 | |
Assets and liabilities in foreign currencies | (1) | |
Total change in net unrealized appreciation (depreciation) | | 218,068 |
Net gain (loss) | | 232,891 |
Net increase (decrease) in net assets resulting from operations | | $ 236,460 |
See accompanying notes which are an integral part of the financial statements.
Annual Report
Financial Statements - continued
Statement of Changes in Net Assets
Amounts in thousands | Year ended
October 31,
2003 | Year ended
October 31,
2002 |
Increase (Decrease) in Net Assets | | |
Operations | | |
Net investment income (loss) | $ 3,569 | $ 1,013 |
Net realized gain (loss) | 14,823 | (33,236) |
Change in net unrealized appreciation (depreciation) | 218,068 | (2,842) |
Net increase (decrease) in net assets resulting
from operations | 236,460 | (35,065) |
Distributions to shareholders from net investment income | (1,439) | - |
Share transactions - net increase (decrease) | 716,381 | 160,808 |
Total increase (decrease) in net assets | 951,402 | 125,743 |
| | |
Net Assets | | |
Beginning of period | 446,527 | 320,784 |
End of period (including undistributed net investment income of $6,506 and undistributed net investment income of $1,106, respectively) | $ 1,397,929 | $ 446,527 |
See accompanying notes which are an integral part of the financial statements.
Annual Report
Financial Highlights - Class A
Years ended October 31, | 2003 | 2002 | 2001 | 2000 | 1999 G |
Selected Per-Share Data | | | | | |
Net asset value, beginning of period | $ 11.12 | $ 11.87 | $ 14.54 | $ 13.05 | $ 10.00 |
Income from Investment Operations | | | | | |
Net investment income (loss)E | .09 | .07 | .10 | .22F | .01 |
Net realized and unrealized gain (loss) | 3.45 | (.82) | (2.48) | 1.49 | 3.04 |
Total from investment operations | 3.54 | (.75) | (2.38) | 1.71 | 3.05 |
Distributions from net investment income | (.06) | - | (.29) | (.03) | - |
Distributions from net realized gain | - | - | - | (.17) | - |
Distributions in excess of net realized gain | - | - | - | (.02) | - |
Total distributions | (.06) | - | (.29) | (.22) | - |
Net asset value, end of period | $ 14.60 | $ 11.12 | $ 11.87 | $ 14.54 | $ 13.05 |
Total ReturnB,C,D | 31.99% | (6.32)% | (16.69)% | 13.13% | 30.50% |
Ratios to Average Net AssetsH | | | | | |
Expenses before expense
reductions | 1.42% | 1.46% | 1.50% | 1.52% | 2.60%A |
Expenses net of voluntary
waivers, if any | 1.42% | 1.46% | 1.50% | 1.52% | 2.00%A |
Expenses net of all reductions | 1.39% | 1.43% | 1.46% | 1.50% | 1.97%A |
Net investment income (loss) | .71% | .54% | .77% | 1.44% | .05%A |
Supplemental Data | | | | | |
Net assets, end of period
(in millions) | $ 241 | $ 52 | $ 38 | $ 27 | $ 4 |
Portfolio turnover rate | 49% | 53% | 84% | 87% | 78%A |
A Annualized
B Total returns for periods of less than one year are not annualized.
C Total returns would have been lower had certain expenses not been reduced during the periods shown.
D Total returns do not include the effect of the sales charges.
E Calculated based on average shares outstanding during the period.
F Investment income per share reflects a special dividend which amounted to $.13 per share.
G For the period December 17, 1998 (commencement of operations) to October 31, 1999.
H Expense ratios reflect operating expenses of the class. Expenses before reductions do not reflect amounts reimbursed by the investment adviser or reductions from brokerage service arrangements or other expense offset arrangements and do not represent the amount paid by the class during periods when reimbursements or reductions occur. Expense ratios before start-up periods may not be representative of longer-term operating periods. Expenses net of any voluntary waivers reflect expenses after reimbursement by the investment adviser but prior to reductions from brokerage service arrangements or other expense offset arrangements. Expenses net of all reductions represent the net expenses paid by the class.
See accompanying notes which are an integral part of the financial statements.
Annual Report
Financial Highlights - Class T
Years ended October 31, | 2003 | 2002 | 2001 | 2000 | 1999 G |
Selected Per-Share Data | | | | | |
Net asset value, beginning of period | $ 11.01 | $ 11.80 | $ 14.46 | $ 13.02 | $ 10.00 |
Income from Investment Operations | | | | | |
Net investment income (loss) E | .05 | .02 | .06 | .17 F | (.02) |
Net realized and unrealized gain (loss) | 3.43 | (.81) | (2.46) | 1.49 | 3.04 |
Total from investment operations | 3.48 | (.79) | (2.40) | 1.66 | 3.02 |
Distributions from net investment income | (.02) | - | (.26) | (.03) | - |
Distributions from net realized gain | - | - | - | (.17) | - |
Distributions in excess of net realized gain | - | - | - | (.02) | - |
Total distributions | (.02) | - | (.26) | (.22) | - |
Net asset value, end of period | $ 14.47 | $ 11.01 | $ 11.80 | $ 14.46 | $ 13.02 |
Total Return B,C,D | 31.66% | (6.69)% | (16.90)% | 12.78% | 30.20% |
Ratios to Average Net Assets H | | | | | |
Expenses before expense reductions | 1.75% | 1.79% | 1.81% | 1.82% | 2.84% A |
Expenses net of voluntary waivers, if any | 1.75% | 1.79% | 1.81% | 1.82% | 2.25% A |
Expenses net of all reductions | 1.72% | 1.76% | 1.76% | 1.80% | 2.22% A |
Net investment income (loss) | .38% | .21% | .47% | 1.15% | (.20)%A |
Supplemental Data | | | | | |
Net assets, end of period
(in millions) | $ 552 | $ 204 | $ 153 | $ 139 | $ 32 |
Portfolio turnover rate | 49% | 53% | 84% | 87% | 78% A |
A Annualized
B Total returns for periods of less than one year are not annualized.
C Total returns would have been lower had certain expenses not been reduced during the periods shown.
D Total returns do not include the effect of the sales charges.
E Calculated based on average shares outstanding during the period.
F Investment income per share reflects a special dividend which amounted to $.13 per share.
G For the period December 17, 1998 (commencement of operations) to October 31, 1999.
H Expense ratios reflect operating expenses of the class. Expenses before reductions do not reflect amounts reimbursed by the investment adviser or reductions from brokerage service arrangements or other expense offset arrangements and do not represent the amount paid by the class during periods when reimbursements or reductions occur. Expense ratios before start-up periods may not be representative of longer-term operating periods. Expenses net of any voluntary waivers reflect expenses after reimbursement by the investment adviser but prior to reductions from brokerage service arrangements or other expense offset arrangements. Expenses net of all reductions represent the net expenses paid by the class.
See accompanying notes which are an integral part of the financial statements.
Annual Report
Financial Highlights - Class B
Years ended October 31, | 2003 | 2002 | 2001 | 2000 | 1999 G |
Selected Per-Share Data | | | | | |
Net asset value, beginning of period | $ 10.84 | $ 11.68 | $ 14.33 | $ 12.96 | $ 10.00 |
Income from Investment Operations | | | | | |
Net investment income (loss)E | (.02) | (.04) | (.01) | .09F | (.07) |
Net realized and unrealized gain (loss) | 3.37 | (.80) | (2.44) | 1.49 | 3.03 |
Total from investment operations | 3.35 | (.84) | (2.45) | 1.58 | 2.96 |
Distributions from net investment income | - | - | (.20) | (.02) | - |
Distributions from net realized gain | - | - | - | (.17) | - |
Distributions in excess of net realized gain | - | - | - | (.02) | - |
Total distributions | - | - | (.20) | (.21) | - |
Net asset value, end of period | $ 14.19 | $ 10.84 | $ 11.68 | $ 14.33 | $ 12.96 |
Total ReturnB,C,D | 30.90% | (7.19)% | (17.33)% | 12.21% | 29.60% |
Ratios to Average Net AssetsH | | | | | |
Expenses before expense
reductions | 2.32% | 2.32% | 2.35% | 2.36% | 3.38%A |
Expenses net of voluntary
waivers, if any | 2.32% | 2.32% | 2.35% | 2.36% | 2.75%A |
Expenses net of all reductions | 2.29% | 2.29% | 2.30% | 2.34% | 2.72%A |
Net investment income (loss) | (.19)% | (.32)% | (.07)% | .60% | (.70)%A |
Supplemental Data | | | | | |
Net assets, end of period
(in millions) | $ 89 | $ 49 | $ 42 | $ 44 | $ 11 |
Portfolio turnover rate | 49% | 53% | 84% | 87% | 78%A |
A Annualized
B Total returns for periods of less than one year are not annualized.
C Total returns would have been lower had certain expenses not been reduced during the periods shown.
D Total returns do not include the effect of the contingent deferred sales charge.
E Calculated based on average shares outstanding during the period.
F Investment income per share reflects a special dividend which amounted to $.13 per share.
G For the period December 17, 1998 (commencement of operations) to October 31, 1999.
H Expense ratios reflect operating expenses of the class. Expenses before reductions do not reflect amounts reimbursed by the investment adviser or reductions from brokerage service arrangements or other expense offset arrangements and do not represent the amount paid by the class during periods when reimbursements or reductions occur. Expense ratios before start-up periods may not be representative of longer-term operating periods. Expenses net of any voluntary waivers reflect expenses after reimbursement by the investment adviser but prior to reductions from brokerage service arrangements or other expense offset arrangements. Expenses net of all reductions represent the net expenses paid by the class.
See accompanying notes which are an integral part of the financial statements.
Annual Report
Financial Highlights - Class C
Years ended October 31, | 2003 | 2002 | 2001 | 2000 | 1999 G |
Selected Per-Share Data | | | | | |
Net asset value, beginning of period | $ 10.86 | $ 11.68 | $ 14.34 | $ 12.96 | $ 10.00 |
Income from Investment Operations | | | | | |
Net investment income (loss) E | (.01) | (.03) | -I | .10 F | (.07) |
Net realized and unrealized gain (loss) | 3.37 | (.79) | (2.45) | 1.48 | 3.03 |
Total from investment operations | 3.36 | (.82) | (2.45) | 1.58 | 2.96 |
Distributions from net investment income | - | - | (.21) | (.01) | - |
Distributions from net realized gain | - | - | - | (.17) | - |
Distributions in excess of net realized gain | - | - | - | (.02) | - |
Total distributions | - | - | (.21) | (.20) | - |
Net asset value, end of period | $ 14.22 | $ 10.86 | $ 11.68 | $ 14.34 | $ 12.96 |
Total Return B,C,D | 30.94% | (7.02)% | (17.33)% | 12.21% | 29.60% |
Ratios to Average Net Assets H | | | | | |
Expenses before expense
reductions | 2.23% | 2.25% | 2.28% | 2.32% | 3.36% A |
Expenses net of voluntary
waivers, if any | 2.23% | 2.25% | 2.28% | 2.32% | 2.75% A |
Expenses net of all reductions | 2.20% | 2.22% | 2.24% | 2.30% | 2.72% A |
Net investment income (loss) | (.10)% | (.25)% | (.01)% | .65% | (.70)%A |
Supplemental Data | | | | | |
Net assets, end of period
(in millions) | $ 124 | $ 54 | $ 44 | $ 38 | $ 8 |
Portfolio turnover rate | 49% | 53% | 84% | 87% | 78% A |
A Annualized
B Total returns for periods of less than one year are not annualized.
C Total returns would have been lower had certain expenses not been reduced during the periods shown.
D Total returns do not include the effect of the contingent deferred sales charge.
E Calculated based on average shares outstanding during the period.
F Investment income per share reflects a special dividend which amounted to $.13 per share.
G For the period December 17, 1998 (commencement of operations) to October 31, 1999.
H Expense ratios reflect operating expenses of the class. Expenses before reductions do not reflect amounts reimbursed by the investment adviser or reductions from brokerage service arrangements or other expense offset arrangements and do not represent the amount paid by the class during periods when reimbursements or reductions occur. Expense ratios before start-up periods may not be representative of longer-term operating periods. Expenses net of any voluntary waivers reflect expenses after reimbursement by the investment adviser but prior to reductions from brokerage service arrangements or other expense offset arrangements. Expenses net of all reductions represent the net expenses paid by the class.
I Amount represents less than .01 per-share.
See accompanying notes which are an integral part of the financial statements.
Annual Report
Financial Highlights - Institutional Class
Years ended October 31, | 2003 | 2002 | 2001 | 2000 | 1999 F |
Selected Per-Share Data | | | | | |
Net asset value, beginning of period | $ 11.22 | $ 11.94 | $ 14.60 | $ 13.08 | $ 10.00 |
Income from Investment Operations | | | | | |
Net investment income (loss)D | .13 | .11 | .14 | .26E | .03 |
Net realized and unrealized gain (loss) | 3.48 | (.83) | (2.48) | 1.49 | 3.05 |
Total from investment operations | 3.61 | (.72) | (2.34) | 1.75 | 3.08 |
Distributions from net investment income | (.09) | - | (.32) | (.04) | - |
Distributions from net realized gain | - | - | - | (.17) | - |
Distributions in excess of net realized gain | - | - | - | (.02) | - |
Total distributions | (.09) | - | (.32) | (.23) | - |
Net asset value, end of period | $ 14.74 | $ 11.22 | $ 11.94 | $ 14.60 | $ 13.08 |
Total ReturnB,C | 32.41% | (6.03)% | (16.38)% | 13.42% | 30.80% |
Ratios to Average Net AssetsG | | | | | |
Expenses before expense
reductions | 1.09% | 1.11% | 1.17% | 1.24% | 2.34%A |
Expenses net of voluntary
waivers, if any | 1.09% | 1.11% | 1.17% | 1.24% | 1.75%A |
Expenses net of all reductions | 1.06% | 1.07% | 1.12% | 1.22% | 1.72%A |
Net investment income (loss) | 1.04% | .89% | 1.11% | 1.73% | .30%A |
Supplemental Data | | | | | |
Net assets, end of period
(in millions) | $ 391 | $ 88 | $ 43 | $ 20 | $ 4 |
Portfolio turnover rate | 49% | 53% | 84% | 87% | 78%A |
A Annualized
B Total returns for periods of less than one year are not annualized.
C Total returns would have been lower had certain expenses not been reduced during the periods shown.
D Calculated based on average shares outstanding during the period.
E Investment income per share reflects a special dividend which amounted to $.13 per share.
F For the period December 17, 1998 (commencement of operations) to October 31, 1999.
G Expense ratios reflect operating expenses of the class. Expenses before reductions do not reflect amounts reimbursed by the investment adviser or reductions from brokerage service arrangements or other expense offset arrangements and do not represent the amount paid by the class during periods when reimbursements or reductions occur. Expense ratios before start-up periods may not be representative of longer-term operating periods. Expenses net of any voluntary waivers reflect expenses after reimbursement by the investment adviser but prior to reductions from brokerage service arrangements or other expense offset arrangements. Expenses net of all reductions represent the net expenses paid by the class.
See accompanying notes which are an integral part of the financial statements.
Annual Report
Notes to Financial Statements
For the period ended October 31, 2003
(Amounts in thousands except ratios)
1. Significant Accounting Policies.
Fidelity Advisor Diversified International Fund (the fund) is a fund of Fidelity Advisor Series VIII (the trust) and is authorized to issue an unlimited number of shares. The trust is registered under the Investment Company Act of 1940, as amended (the 1940 Act), as an open-end management investment company organized as a Massachusetts business trust.
The fund offers Class A, Class T, Class B, Class C and Institutional Class shares, each of which has equal rights as to assets and voting privileges. Each class has exclusive voting rights with respect to matters that affect that class. Class B shares will automatically convert to Class A shares after a holding period of seven years from the initial date of purchase. Investment income, realized and unrealized capital gains and losses, the common expenses of the fund, and certain fund-level expense reductions, if any, are allocated on a pro rata basis to each class based on the relative net assets of each class to the total net assets of the fund. Each class differs with respect to transfer agent and distribution and service plan fees incurred. Certain expense reductions also differ by class.
The fund's investments in emerging markets can be subject to social, economic, regula-tory, and political uncertainties and can be extremely volatile. The financial statements have been prepared in conformity with accounting principles generally accepted in the United States of America, which require management to make certain estimates and assumptions at the date of the financial statements. The following summarizes the significant accounting policies of the fund:
Security Valuation. Net asset value per share (NAV calculation) is calculated as of the close of business of the New York Stock Exchange, normally 4:00 p.m. Eastern time. Equity securities for which market quotations are available are valued at the last sale price or official closing price (closing bid price or last evaluated quote if no sale has occurred) on the primary market or exchange on which they trade. Debt securities for which quotations are readily available are valued at their most recent bid prices (sales prices if the principal market is an exchange) in the principal market in which such securities are normally traded, as determined by recognized dealers in such securities, or securities are valued on the basis of information provided by a pricing service. Pricing services use valuation matrices that incorporate both dealer-supplied valuations and valuation models. If an event that is expected to materially affect the value of a security occurs after the close of an exchange or market on which that security trades, but prior to the NAV calculation, then that security will be fair valued taking the event into account. Securities (including restricted securities) for which market quotations are not readily available are valued at their fair value as determined in good faith under consistently applied procedures under the general supervision of the Board of Trustees. Price movements in futures contracts and ADRs, market and trading trends, the bid/ask quotes
Annual Report
Notes to Financial Statements - continued
(Amounts in thousands except ratios)
1. Significant Accounting Policies - continued
Annual Report
Security Valuation - continued
of brokers and off-exchange institutional trading may be reviewed in the course of making a good faith determination of a security's fair value. Short-term securities with remaining maturities of sixty days or less for which quotations are not readily available are valued on the basis of amortized cost. Investments in open-end investment companies are valued at their net asset value each business day.
Foreign Currency. The fund uses foreign currency contracts to facilitate transactions in foreign-denominated securities. Losses from these transactions may arise from changes in the value of the foreign currency or if the counterparties do not perform under the contracts' terms.
Foreign denominated assets, including investment securities, and liabilities are translated into U.S. dollars at the exchange rate at period end. Purchases and sales of investment securities, income and dividends received and expenses denominated in foreign currencies are translated into U.S. dollars at the exchange rate in effect on the transaction date.
The effects of exchange rate fluctuations on investments are included with the net realized and unrealized gain (loss) on investment securities. Other foreign currency transactions resulting in realized and unrealized gain (loss) are disclosed separately.
Investment Transactions and Income. Security transactions are accounted for as of trade date. Gains and losses on securities sold are determined on the basis of identified cost. Dividend income is recorded on the ex-dividend date, except for certain dividends from foreign securities where the ex-dividend date may have passed, which are recorded as soon as the fund is informed of the ex-dividend date. Non-cash dividends included in dividend income, if any, are recorded at the fair market value of the securities received. Interest income is accrued as earned. Interest income includes coupon interest and amortization of premium and accretion of discount on debt securities which is accrued using the interest method. Investment income is recorded net of foreign taxes withheld where recovery of such taxes is uncertain. Debt obligations may be placed on non-accrual status and related interest income may be reduced by ceasing current accruals and writing off interest receivables when the collection of all or a portion of interest has become doubtful based on consistently applied procedures. A debt obligation is removed from non-accrual status when the issuer resumes interest payments or when collectibility of interest is reasonably assured.
Expenses. Most expenses of the trust can be directly attributed to a fund. Expenses which cannot be directly attributed are apportioned among the funds in the trust.
Income Tax Information and Distributions to Shareholders. Each year the fund intends to qualify as a regulated investment company by distributing all of its taxable
Annual Report
Notes to Financial Statements - continued
(Amounts in thousands except ratios)
1. Significant Accounting Policies - continued
Income Tax Information and Distributions to Shareholders - continued
income and realized gains under Subchapter M of the Internal Revenue Code. As a result, no provision for income taxes is required in the accompanying financial statements. Foreign taxes are provided for based on each fund's understanding of the tax rules and rates that exist in the foreign markets in which it invests. Income dividends and capital gain distributions are declared separately for each class. Distributions are recorded on the ex-dividend date.
Income and capital gain distributions are determined in accordance with income tax regulations, which may differ from generally accepted accounting principles. Capital accounts within the financial statements are adjusted for permanent and temporary book and tax differences. These adjustments have no impact on net assets or the results of operations. Temporary differences will reverse in a subsequent period. These differences are primarily due to foreign currency transactions, passive foreign investment companies (PFIC), prior period premium and discount on debt securities, market discount, non-taxable dividends, capital loss carryforwards and losses deferred due to wash sales.
The tax-basis components of distributable earnings and the federal tax cost as of period end were as follows:
Unrealized appreciation | $ 208,639 | | |
Unrealized depreciation | (23,720) | |
Net unrealized appreciation (depreciation) | 184,919 | |
Undistributed ordinary income | 10,355 | |
Capital loss carryforward | (62,647) | |
Cost for federal income tax purposes | $ 1,255,792 | |
The tax character of distributions paid was as follows:
| October 31,
2003 | October 31,
2002 |
Ordinary Income | $ 1,439 | $ - |
Short-Term Trading (Redemption) Fees. Shares purchased after March 31, 2004 and held in the fund less than 30 days will be subject to a short-term trading fee equal to 1.00% of the proceeds of the redeemed shares. The fee, which will be retained by the fund, is accounted for as an addition to paid in capital.
2. Operating Policies.
Repurchase Agreements. Fidelity Management & Research Company (FMR) has received an Exemptive Order from the Securities and Exchange Commission (the SEC) which permits the fund and other affiliated entities of FMR to transfer uninvested cash
Annual Report
2. Operating Policies - continued
Annual Report
Repurchase Agreements - continued
balances into joint trading accounts. These accounts are then invested in repurchase agreements that are collateralized by U.S. Treasury or Government obligations. The fund may also invest directly with institutions, in repurchase agreements that are collateralized by commercial paper obligations and corporate obligations. Collateral is held in segregated accounts with custodian banks and may be obtained in the event of a default of the counterparty. Collateral is marked-to-market daily and maintained at a value at least equal to the principal amount of the repurchase agreement (including accrued interest).
Delayed Delivery Transactions and When-Issued Securities. The fund may purchase or sell securities on a delayed delivery or when-issued basis. Payment and delivery may take place after the customary settlement period for that security. The price of the underlying securities and the date when the securities will be delivered and paid for are fixed at the time the transaction is negotiated. During the time a delayed delivery sell is outstanding, the contract is marked-to-market daily and equivalent deliverable securities are held for the transaction. The value of the securities purchased on a delayed delivery or when-issued basis are identified as such in the fund's Schedule of Investments. The fund may receive compensation for interest forgone in the purchase of a delayed delivery or when-issued security. With respect to purchase commitments, the fund identifies securities as segregated in its records with a value at least equal to the amount of the commitment. Losses may arise due to changes in the value of the underlying securities or if the counterparty does not perform under the contract, or if the issuer does not issue the securities due to political, economic, or other factors.
Restricted Securities. The fund may invest in securities that are subject to legal or contractual restrictions on resale. These securities generally may be resold in transactions exempt from registration or to the public if the securities are registered. Disposal of these securities may involve time-consuming negotiations and expense, and prompt sale at an acceptable price may be difficult. Information regarding restricted securities is included at the end of the fund's Schedule of Investments.
3. Purchases and Sales of Investments.
Information regarding purchases and sales of securities is included under the caption "Other Information" at the end of the fund's Schedule of Investments.
Notes to Financial Statements - continued
(Amounts in thousands except ratios)
4. Fees and Other Transactions with Affiliates.
Annual Report
Management Fee. FMR and its affiliates provide the fund with investment management related services for which the fund pays a monthly management fee. The management fee is the sum of an individual fund fee rate that is based on an annual rate of .45%
Annual Report
Notes to Financial Statements - continued
(Amounts in thousands except ratios)
4. Fees and Other Transactions with Affiliates - continued
Management Fee - continued
of the fund's average net assets and a group fee rate that averaged .28% during the period. The group fee rate is based upon the average net assets of all the mutual funds advised by FMR. The group fee rate decreases as assets under management increase and increases as assets under management decrease. For the period, the total annual management fee rate was .72% of the fund's average net assets.
Distribution and Service Plan. In accordance with Rule 12b-1 of the 1940 Act, the Fund has adopted separate Distribution and Service Plans for each class of shares. Certain classes pay Fidelity Distributors Corporation (FDC), an affiliate of FMR, separate Distribution and Service Fees, each of which is based on an annual percentage of each class' average net assets. Class A and Class T Plans also authorize the use of brokerage commissions to pay distribution expenses. This practice has been discontinued and no commissions incurred after June 30, 2003 have been used to pay distribution expenses. In addition, FDC may pay financial intermediaries for selling shares of the fund and providing shareholder support services. For the period, the Distribution and Service Fee rates, the total amounts paid to and retained by FDC and the amount of distribution expenses paid with brokerage commissions were as follows:
| Distribution
Fee | Service
Fee | Paid to
FDC | Retained
by FDC | Paid with
Commissions |
Class A | -% | .25% | $ 247 | $ 2 | $ 1 |
Class T | .25% | .25% | 1,710 | 11 | 6 |
Class B | .75% | .25% | 624 | 468 | - |
Class C | .75% | .25% | 762 | 217 | - |
| | | $ 3,343 | $ 698 | $ 7 |
Sales Load. FDC receives a front-end sales charge of up to 5.75% for selling Class A shares, and 3.50% for selling Class T shares of the fund. FDC receives the proceeds of contingent deferred sales charges levied on Class A, Class T, Class B, and Class C redemptions. These charges depend on the holding period. The deferred sales charges range from 5% to 1% for Class B, 1% for Class C, and .25% for certain purchases of Class A and Class T shares.
Annual Report
4. Fees and Other Transactions with Affiliates - continued
Sales Load - continued
For the period, sales charge amounts retained by FDC were as follows:
| Retained
by FDC |
Class A | $ 144 |
Class T | 59 |
Class B* | 154 |
Class C* | 24 |
| $ 381 |
* When Class B and Class C shares are initially sold, FDC pays commissions from its own resources to financial intermediaries through which the sales are made.
Transfer Agent Fees. Fidelity Investments Institutional Operations Company, Inc. (FIIOC), an affiliate of FMR, is the transfer, dividend disbursing and shareholder servicing agent (collectively referred to as the transfer agent) for each class of the fund. FIIOC receives account fees and asset-based fees that vary according to the account size and type of account of the shareholders of the respective classes of the fund. FIIOC pays for typesetting, printing and mailing of all shareholder reports, except proxy statements. For the period, the following amounts were paid to FIIOC:
| Amount | % of
Average
Net Assets |
Class A | $ 267 | .27 |
Class T | 1,190 | .35 |
Class B | 265 | .42 |
Class C | 255 | .33 |
Institutional Class | 309 | .19 |
| $ 2,286 | |
Accounting and Security Lending Fees. Fidelity Service Company, Inc. (FSC), an affiliate of FMR, maintains the fund's accounting records and administers the security lending program. The security lending fee is based on the number and duration of lending transactions. The accounting fee is based on the level of average net assets for the month plus out-of-pocket expenses.
Central Funds. The fund may invest in affiliated Central Funds managed by Fidelity Investments Money Management, Inc. (FIMM), an affiliate of FMR. The Central Funds are open-end investment companies available only to investment companies and other accounts managed by FMR and its affiliates. The Central Funds seek preservation of capital and current income and do not pay a management fee. Income distributions earned by the fund are recorded as income in the accompanying financial statements and totaled $888 for the period.
Annual Report
Notes to Financial Statements - continued
(Amounts in thousands except ratios)
4. Fees and Other Transactions with Affiliates - continued
Brokerage Commissions. The fund placed a portion of its portfolio transactions with brokerage firms which are affiliates of the investment adviser. The commissions paid to these affiliated firms are shown under the caption "Other Information" at the end of the fund's Schedule of Investments.
5. Committed Line of Credit.
The fund participates with other funds managed by FMR in a $3.5 billion credit facility (the "line of credit") to be utilized for temporary or emergency purposes to fund shareholder redemptions or for other short-term liquidity purposes. The fund has agreed to pay commitment fees on its pro rata portion of the line of credit. During the period, there were no borrowings on this line of credit.
6. Security Lending.
The fund lends portfolio securities from time to time in order to earn additional income. The fund receives collateral (in the form of U.S. Treasury obligations, letters of credit and/or cash) against the loaned securities and maintains collateral in an amount not less than 100% of the market value of the loaned securities during the period of the loan. The market value of the loaned securities is determined at the close of business of the fund and any additional required collateral is delivered to the fund on the next business day. If the borrower defaults on its obligation to return the securities loaned because of insolvency or other reasons, a fund could experience delays and costs in recovering the securities loaned or in gaining access to the collateral. Cash collateral is invested in cash equivalents. The value of loaned securities and cash collateral at period end are disclosed on the fund's Statement of Assets and Liabilities.
Annual Report
7. Expense Reductions.
Many of the brokers with whom FMR places trades on behalf of the fund provided services to the fund in addition to trade execution. These services may include payments of expenses on behalf of the fund to support distribution of fund shares for Class A and Class T ("Distribution Expense Reduction") and to pay other fund expenses, such as transfer agent fees ("Other Expense Reduction") collectively referred to as "Brokerage Service Arrangements" in the accompanying table. Brokerage service arrangements generally benefits all shareholders of each class by reducing fund expenses. Each of Class A and Class T shareholders' Other Expense Reduction benefit is reduced by the amount of any Distribution Expense Reduction. In addition, through arrangements with the fund's custodian, credits realized as a result of uninvested cash balances were used to reduce the fund's expenses. All of the applicable expense reductions are noted in the table below.
| Brokerage Service
Arrangements | |
| Distribution
expense
reduction | Other
expense
reduction | Custody
expense
reduction |
| | | |
Fund Level | $ - | $ 186 | $ 3 |
Class A | 1 | - | - |
Class T | 6 | - | - |
| $ 7 | $ 186 | $ 3 |
8. Other Information.
At the end of the period, one unaffiliated shareholder was the owner of record of 15% of the total outstanding shares of the fund.
9. Distributions to Shareholders.
Distributions to shareholders of each class were as follows:
| Years ended
October 31,
2003 | Years ended
October 31,
2002 |
From net investment income | | |
Class A | $ 292 | $ - |
Class T | 397 | - |
Institutional Class | 750 | - |
Total | $ 1,439 | $ - |
Annual Report
Notes to Financial Statements - continued
(Amounts in thousands except ratios)
10. Share Transactions.
Transactions for each class of shares were as follows:
| Shares | Dollars |
Years ended October 31, | 2003 | 2002 | 2003 | 2002 |
Class A | | | | |
Shares sold | 16,942 | 4,966 | $ 218,725 | $ 60,391 |
Reinvestment of distributions | 24 | - | 271 | - |
Shares redeemed | (5,120) | (3,525) | (63,239) | (43,045) |
Net increase (decrease) | 11,846 | 1,441 | $ 155,757 | $ 17,346 |
Class T | | | | |
Shares sold | 29,220 | 11,344 | $ 358,219 | $ 137,199 |
Reinvestment of distributions | 33 | - | 370 | - |
Shares redeemed | (9,624) | (5,761) | (117,763) | (69,065) |
Net increase (decrease) | 19,629 | 5,583 | $ 240,826 | $ 68,134 |
Class B | | | | |
Shares sold | 2,720 | 1,844 | $ 32,792 | $ 21,855 |
Shares redeemed | (917) | (959) | (10,619) | (11,319) |
Net increase (decrease) | 1,803 | 885 | $ 22,173 | $ 10,536 |
Class C | | | | |
Shares sold | 5,286 | 2,496 | $ 64,958 | $ 29,291 |
Shares redeemed | (1,527) | (1,316) | (17,673) | (15,655) |
Net increase (decrease) | 3,759 | 1,180 | $ 47,285 | $ 13,636 |
Institutional Class | | | | |
Shares sold | 26,478 | 8,596 | $ 351,243 | $ 105,185 |
Reinvestment of distributions | 29 | - | 326 | - |
Shares redeemed | (7,794) | (4,386) | (101,229) | (54,029) |
Net increase (decrease) | 18,713 | 4,210 | $ 250,340 | $ 51,156 |
Annual Report
Report of Independent Auditors
To the Trustees of Fidelity Advisor Series VIII and the Shareholders of Fidelity Advisor Diversified International Fund.
In our opinion, the accompanying statement of assets and liabilities, including the schedule of investments, and the related statements of operations and of changes in net assets and the financial highlights present fairly, in all material respects, the financial position of Fidelity Advisor Diversified International Fund (a fund of Fidelity Advisor Series VIII) at October 31, 2003 and the results of its operations, the changes in its net assets and the financial highlights for the periods indicated, in conformity with accounting principles generally accepted in the United States of America. These financial statements and financial highlights (hereafter referred to as "financial statements") are the responsibility of the Fidelity Advisor Diversified International Fund's management; our responsibility is to express an opinion on these financial statements based on our audits. We conducted our audits of these financial statements in accordance with auditing standards generally accepted in the United States of America which require that we plan and perform the audit to obtain reasonable assurance about whether the financial statements are free of material misstatement. An audit includes examining, on a test basis, evidence supporting the amounts and disclosures in the financial statements, assessing the accounting principles used and significant estimates made by management, and evaluating the overall financial statement presentation. We believe that our audits, which included confirmation of securities at October 31, 2003 by correspondence with the custodian and brokers, provide a reasonable basis for our opinion.
/s/PricewaterhouseCoopers LLP
PricewaterhouseCoopers LLP
Boston, Massachusetts
December 12, 2003
Annual Report
Trustees and Officers
The Trustees, Members of the Advisory Board, and executive officers of the trust and fund, as applicable, are listed below. The Board of Trustees governs the fund and is responsible for protecting the interests of shareholders. The Trustees are experienced executives who meet periodically throughout the year to oversee the fund's activities, review contractual arrangements with companies that provide services to the fund, and review the fund's performance. Except for William O. McCoy, each of the Trustees oversees 289 funds advised by FMR or an affiliate. Mr. McCoy oversees 291 funds advised by FMR or an affiliate.
The Trustees hold office without limit in time except that (a) any Trustee may resign; (b) any Trustee may be removed by written instrument, signed by at least two-thirds of the number of Trustees prior to such removal; (c) any Trustee who requests to be retired or who has become incapacitated by illness or injury may be retired by written instrument signed by a majority of the other Trustees; and (d) any Trustee may be removed at any special meeting of shareholders by a two-thirds vote of the outstanding voting securities of the trust. In any event, each non-interested Trustee shall retire not later than the last day of the calendar year in which his or her 72nd birthday occurs. The executive officers and Advisory Board Members hold office without limit in time, except that any officer and Advisory Board Member may resign or may be removed by a vote of a majority of the Trustees at any regular meeting or any special meeting of the Trustees. Except as indicated, each individual has held the office shown or other offices in the same company for the past five years.
The fund's Statement of Additional Information (SAI) includes more information about the Trustees. To request a free copy, call Fidelity at 1-877-208-0098.
Interested Trustees*:
Correspondence intended for each Trustee who is an "interested person" (as defined in the 1940 Act) may be sent to 82 Devonshire Street, Boston, Massachusetts 02109.
Name, Age; Principal Occupation |
Edward C. Johnson 3d (73)** |
| Year of Election or Appointment: 1983 Mr. Johnson is Chairman of the Board of Trustees. Mr. Johnson serves as Chief Executive Officer, Chairman, and a Director of FMR Corp.; a Director and Chairman of the Board and of the Executive Committee of FMR; Chairman and a Director of Fidelity Management & Research (Far East) Inc.; Chairman (1998) and a Director of Fidelity Investments Money Management, Inc.; and Chairman (2001) and a Director (2000) of FMR Co., Inc. |
Abigail P. Johnson (41)** |
| Year of Election or Appointment: 2001 Senior Vice President of Advisor Diversified International (2001). Ms. Johnson also serves as Senior Vice President of other Fidelity funds (2001). She is President and a Director of FMR (2001), Fidelity Investments Money Management, Inc. (2001), FMR Co., Inc. (2001), and a Director of FMR Corp. Previously, Ms. Johnson managed a number of Fidelity funds. |
Laura B. Cronin (49) |
| Year of Election or Appointment: 2003 Ms. Cronin is an Executive Vice President (2002) and Chief Financial Officer (2002) of FMR Corp. and is a member of the Fidelity Management Committee (2003). Previously, Ms. Cronin served as Vice President of Finance of FMR (1997-1999), and Chief Financial Officer of FMR (1999-2001), Fidelity Personal Investments (2001), and Fidelity Brokerage Company (2001-2002). |
Robert L. Reynolds (51) |
| Year of Election or Appointment: 2003 Mr. Reynolds is a Director (2003) and Chief Operating Officer (2002) of FMR Corp. and is the head of the Fidelity Management Committee (2003). He also serves on the Board at Fidelity Investments Canada, Ltd. (2000). Previously, Mr. Reynolds served as President of Fidelity Investments Institutional Retirement Group (1996-2000). |
* Trustees have been determined to be "Interested Trustees" by virtue of, among other things, their affiliation with the trust or various entities under common control with FMR.
** Edward C. Johnson 3d, Trustee, is Abigail P. Johnson's father.
Annual Report
Non-Interested Trustees:
Correspondence intended for each non-interested Trustee (that is, the Trustees other than the Interested Trustees) may be sent to Fidelity Investments, P.O. Box 55235, Boston, Massachusetts 02205-5235.
Name, Age; Principal Occupation |
J. Michael Cook (61) |
| Year of Election or Appointment: 2001 Prior to Mr. Cook's retirement in May 1999, he served as Chairman and Chief Executive Officer of Deloitte & Touche LLP (accounting/consulting), Chairman of the Deloitte & Touche Foundation, and a member of the Board of Deloitte Touche Tohmatsu. He currently serves as a Director of Comcast (telecommunications, 2002), International Flavors & Fragrances, Inc. (2000), Rockwell Automation (2000) and The Dow Chemical Company (2000). He is a Member of the Diversity Advisory Council of Marakon (2003) and the Advisory Board of the Directorship Search Group, Chairman Emeritus of the Board of Catalyst (a leading organization for the advancement of women in business), and is Chairman of the Accountability Advisory Council to the Comptroller General of the United States. He also serves as a Member of the Advisory Board of the Graduate School of Business of the University of Florida, his alma mater. |
Ralph F. Cox (71) |
| Year of Election or Appointment: 1991 Mr. Cox is President of RABAR Enterprises (management consulting for the petroleum industry). Prior to February 1994, he was President of Greenhill Petroleum Corporation (petroleum exploration and production). Until March 1990, Mr. Cox was President and Chief Operating Officer of Union Pacific Resources Company (exploration and production). He is a Director of CH2M Hill Companies (engineering), and Abraxas Petroleum (petroleum exploration and production, 1999). In addition, he is a member of advisory boards of Texas A&M University and the University of Texas at Austin. |
Phyllis Burke Davis (71) |
| Year of Election or Appointment: 1992 Mrs. Davis is retired from Avon Products, Inc. (consumer products) where she held various positions including Senior Vice President of Corporate Affairs and Group Vice President of U.S. product marketing, sales, distribution, and manufacturing. Mrs. Davis is a member of the Board of Directors of the Southampton Hospital in Southampton, N.Y. (1998). Previously, she served as a Director of BellSouth Corporation (telecommunications), Eaton Corporation (diversified industrial), the TJX Companies, Inc. (retail stores), Hallmark Cards, Inc., and Nabisco Brands, Inc. |
Robert M. Gates (60) |
| Year of Election or Appointment: 1997 Dr. Gates is President of Texas A&M University (2002). He was Director of the Central Intelligence Agency (CIA) from 1991 to 1993. From 1989 to 1991, Dr. Gates served as Assistant to the President of the United States and Deputy National Security Advisor. Dr. Gates is a Director of NACCO Industries, Inc. (mining and manufacturing), and Parker Drilling Co., Inc. (drilling and rental tools for the energy industry, 2001). He also serves as a member of the Advisory Board of VoteHere.net (secure internet voting, 2001). Previously, Dr. Gates served as a Director of LucasVarity PLC (automotive components and diesel engines), a Director of TRW Inc. (automotive, space, defense, and information technology), and Dean of the George Bush School of Government and Public Service at Texas A&M University (1999-2001). Dr. Gates also is a Trustee of the Forum for International Policy. |
Donald J. Kirk (70) |
| Year of Election or Appointment: 1987 Mr. Kirk is a Governor of the American Stock Exchange (2001), a Trustee and former Chairman of the Board of Trustees of the Greenwich Hospital Association, a Director of the Yale-New Haven Health Services Corp. (1998), and a Director Emeritus and former Chairman of the Board of Directors of National Arts Strategies Inc. Mr. Kirk was an Executive-in-Residence (1995-2000) and a Professor (1987-1995) at Columbia University Graduate School of Business. Prior to 1987, he was Chairman of the Financial Accounting Standards Board. Previously, Mr. Kirk served as a Governor of the National Association of Securities Dealers, Inc. (1996-2002), a member and Vice Chairman of the Public Oversight Board of the American Institute of Certified Public Accountants' SEC Practice Section (1995-2002), a Director of General Re Corporation (reinsurance, 1987-1998) and as a Director of Valuation Research Corp. (appraisals and valuations). |
Marie L. Knowles (57) |
| Year of Election or Appointment: 2001 Prior to Ms. Knowles' retirement in June 2000, she served as Executive Vice President and Chief Financial Officer of Atlantic Richfield Company (ARCO) (diversified energy, 1996-2000). From 1993 to 1996, she was a Senior Vice President of ARCO and President of ARCO Transportation Company. She served as a Director of ARCO from 1996 to 1998. She currently serves as a Director of Phelps Dodge Corporation (copper mining and manufacturing), URS Corporation (multidisciplinary engineering, 1999), and McKesson Corporation (healthcare service, 2002). Ms. Knowles is a Trustee of the Brookings Institution and the Catalina Island Conservancy and also serves as a member of the Advisory Board for the School of Engineering of the University of Southern California. |
Ned C. Lautenbach (59) |
| Year of Election or Appointment: 2000 Mr. Lautenbach has been a partner of Clayton, Dubilier & Rice, Inc. (private equity investment firm) since September 1998. Previously, Mr. Lautenbach was with the International Business Machines Corporation (IBM) from 1968 until his retirement in 1998. He was most recently Senior Vice President and Group Executive of Worldwide Sales and Services. From 1993 to 1995, he was Chairman of IBM World Trade Corporation, and from 1994 to 1998 was a member of IBM's Corporate Executive Committee. Mr. Lautenbach serves as Chairman and as a Director (1998) of Acterna Corporation (communications test equipment). He is also Co-Chairman of Covansys, Inc. (global provider of business and technology solutions, 2000). In addition, he is a Director of Eaton Corporation (diversified industrial) and the Philharmonic Center for the Arts in Naples, Florida (1999). He also is a member of the Council on Foreign Relations. |
Marvin L. Mann (70) |
| Year of Election or Appointment: 1993 Mr. Mann is Chairman of the non-interested Trustees (2001). He is Chairman Emeritus of Lexmark International, Inc. (computer peripherals) where he served as CEO until April 1998 and retired as Chairman May 1999, and remains a member of the Board. Prior to 1991, he held the positions of Vice President of International Business Machines Corporation (IBM) and President and General Manager of various IBM divisions and subsidiaries. Mr. Mann is a Board member of Imation Corp. (imaging and information storage) and Acterna Corporation (communications test equipment, 1999). He is also a member of the Director Services Committee of the Investment Company Institute. In addition, Mr. Mann is a member of the President's Cabinet at the University of Alabama and the Board of Visitors of the Culverhouse College of Commerce and Business Administration at the University of Alabama. |
William O. McCoy (70) |
| Year of Election or Appointment: 1997 Prior to his retirement in December 1994, Mr. McCoy was Vice Chairman of the Board of BellSouth Corporation (telecommunications) and President of BellSouth Enterprises. He is currently a Director of Liberty Corporation (holding company), Duke Realty Corporation (real estate), Progress Energy, Inc. (electric utility), and Acterna Corporation (communications test equipment, 1999). He is also a partner of Franklin Street Partners (private investment management firm) and a member of the Research Triangle Foundation Board. In addition, Mr. McCoy served as the Interim Chancellor (1999-2000) and a member of the Board of Visitors (1994-1998) for the University of North Carolina at Chapel Hill and currently serves on the Board of Directors of the University of North Carolina Health Care System and the Board of Visitors of the Kenan-Flagler Business School (University of North Carolina at Chapel Hill). He also served as Vice President of Finance for the University of North Carolina (16-school system, 1995-1998). |
William S. Stavropoulos (64) |
| Year of Election or Appointment: 2001 Mr. Stavropoulos is Chairman of the Board, President and CEO (2002), and Chairman of the Executive Committee (2000) and a Director of The Dow Chemical Company. Since joining The Dow Chemical Company in 1967, Mr. Stavropoulos served in numerous senior management positions, including President (1993-2000) and Chief Executive Officer (1995-2000). Currently, he is a Director of NCR Corporation (data warehousing and technology solutions), BellSouth Corporation (telecommunications), Chemical Financial Corporation, and Maersk Inc. (industrial conglomerate, 2002). He also serves as a member of the Board of Trustees of the American Enterprise Institute for Public Policy Research. In addition, Mr. Stavropoulos is a member of The Business Council, J.P. Morgan International Council, World Business Council for Sustainable Development, and the University of Notre Dame Advisory Council for the College of Science. |
Annual Report
Trustees and Officers - continued
Advisory Board Members and Executive Officers:
Correspondence intended for Dr. Heilmeier may be sent to Fidelity Investments, P.O. Box 55235, Boston, Massachusetts 02205-5235. Correspondence intended for each executive officer and Mr. Lynch may be sent to 82 Devonshire Street, Boston, Massachusetts 02109.
Name, Age; Principal Occupation |
George H. Heilmeier (67) |
| Year of Election or Appointment: 2003 Member of the Advisory Board of Fidelity Advisor Series VIII. Dr. Heilmeier is Chairman Emeritus of Telcordia Technologies (communication software and systems), where prior to his retirement, he served as company Chairman and Chief Executive Officer. He currently serves on the Boards of Directors of The Mitre Corporation (systems engineering and information technology support for the government), INET Technologies Inc. (telecommunications network surveillance, 2001) and Teletech Holdings (customer management services, 1998). He is Chairman of the General Motors Technology Advisory Committee and a Life Fellow of the IEEE (2000). Dr. Heilmeier is a member of the Defense Science Board and the National Security Agency Advisory Board. He is also a member of the National Academy of Engineering, the American Academy of Arts and Sciences and The Board of Overseers of the School of Engineering and Applied Science of the University of Pennsylvania. Previously, Dr. Heilmeier served as a Director of TRW Inc. (automotive, space, defense, and information technology, 1992-2002) and Compaq (1994-2002). |
Peter S. Lynch (60) |
| Year of Election or Appointment: 2003 Member of the Advisory Board of Fidelity Advisor Series VIII. Vice Chairman and a Director of FMR, and Vice Chairman (2001) and a Director (2000) of FMR Co., Inc. Previously, Mr. Lynch served as a Trustee of the Fidelity funds (1990-2003). Prior to May 31, 1990, he was a Director of FMR and Executive Vice President of FMR (a position he held until March 31, 1991), Vice President of Fidelity Magellan Fund and FMR Growth Group Leader, and Managing Director of FMR Corp. Mr. Lynch was also Vice President of Fidelity Investments Corporate Services. In addition, he serves as a Trustee of Boston College, Massachusetts Eye & Ear Infirmary, Historic Deerfield, John F. Kennedy Library, and the Museum of Fine Arts of Boston. |
Philip L. Bullen (44) |
| Year of Election or Appointment: 2001 Vice President of Advisor Diversified International. Mr. Bullen also serves as Vice President of certain Equity Funds (2001) and certain High Income Funds (2001). He is Senior Vice President of FMR (2001) and FMR Co., Inc. (2001), President and a Director of Fidelity Management & Research (Far East) Inc. (2001), President and a Director of Fidelity Management & Research (U.K.) Inc. (2002), and a Director of Strategic Advisers, Inc. (2002). Before joining Fidelity Investments, Mr. Bullen was President and Chief Investment Officer of Santander Global Advisors (1997-2000) and President and Chief Executive Officer of Boston's Baring Asset Management Inc. (1994-1997). |
William Bower (36) |
| Year of Election or Appointment: 2001 Vice President of Advisor Diversified International. Mr. Bower is also Vice President of another fund advised by FMR. Prior to assuming his current responsibilities, Mr. Bower managed a variety of Fidelity funds. |
Eric D. Roiter (54) |
| Year of Election or Appointment: 1998 Secretary of Advisor Diversified International. He also serves as Secretary of other Fidelity funds (1998); Vice President, General Counsel, and Clerk of FMR Co., Inc. (2001) and FMR (1998); Vice President and Clerk of FDC (1998); Assistant Clerk of Fidelity Management & Research (U.K.) Inc. (2001) and Fidelity Management & Research (Far East) Inc. (2001); and Assistant Secretary of Fidelity Investments Money Management Inc. (2001). Prior to joining Fidelity, Mr. Roiter was with the law firm of Debevoise & Plimpton, as an associate (1981-1984) and as a partner (1985-1997), and served as an Assistant General Counsel of the U.S. Securities and Exchange Commission (1979-1981). Mr. Roiter is an Adjunct Member, Faculty of Law, at Boston College Law School (2003). |
Stuart Fross (44) |
| Year of Election or Appointment: 2003 Assistant Secretary of Advisor Diversified International. Mr. Fross also serves as Assistant Secretary of other Fidelity funds (2003) and is an employee of FMR. |
Maria F. Dwyer (44) |
| Year of Election or Appointment: 2002 President and Treasurer of Advisor Diversified International. Ms. Dwyer also serves as President and Treasurer of other Fidelity funds (2002) and is a Vice President (1999) and an employee (1996) of FMR. Prior to joining Fidelity, Ms. Dwyer served as Director of Compliance for MFS Investment Management. |
Timothy F. Hayes (52) |
| Year of Election or Appointment: 2002 Chief Financial Officer of Advisor Diversified International. Mr. Hayes also serves as Chief Financial Officer of other Fidelity funds (2002). Recently he was appointed President of Fidelity Service Company (2003) where he also serves as a Director. Mr. Hayes also serves as President of Fidelity Investments Operations Group (FIOG, 2002), which includes Fidelity Pricing and Cash Management Services Group (FPCMS), where he was appointed President in 1998. Previously, Mr. Hayes served as Chief Financial Officer of Fidelity Investments Corporate Systems and Service Group (1998) and Fidelity Systems Company (1997-1998). |
John R. Hebble (45) |
| Year of Election or Appointment: 2003 Deputy Treasurer of Advisor Diversified International. Mr. Hebble also serves as Deputy Treasurer of other Fidelity funds (2003), and is an employee of FMR. Before joining Fidelity Investments, Mr. Hebble worked at Deutsche Asset Management where he served as Director of Fund Accounting (2002-2003) and Assistant Treasurer of the Scudder Funds (1998-2003). |
John H. Costello (57) |
| Year of Election or Appointment: 1998 Assistant Treasurer of Advisor Diversified International. Mr. Costello also serves as Assistant Treasurer of other Fidelity funds and is an employee of FMR. |
Francis V. Knox, Jr. (56) |
| Year of Election or Appointment: 2002 Assistant Treasurer of Advisor Diversified International. Mr. Knox also serves as Assistant Treasurer of other Fidelity funds (2002), and is a Vice President and an employee of FMR. Previously, Mr. Knox served as Vice President of Investment & Advisor Compliance (1990-2001), and Compliance Officer of Fidelity Management & Research (U.K.) Inc. (1992-2002), Fidelity Management & Research (Far East) Inc. (1991-2002), and FMR Corp. (1995-2002). |
Mark Osterheld (48) |
| Year of Election or Appointment: 2002 Assistant Treasurer of Advisor Diversified International. Mr. Osterheld also serves as Assistant Treasurer of other Fidelity funds (2002) and is an employee of FMR. |
Thomas J. Simpson (45) |
| Year of Election or Appointment: 2000 Assistant Treasurer of Advisor Diversified International. Mr. Simpson is Assistant Treasurer of other Fidelity funds (2000) and an employee of FMR (1996). Prior to joining FMR, Mr. Simpson was Vice President and Fund Controller of Liberty Investment Services (1987-1995). |
Annual Report
Distributions
The amounts per share which represent income derived from sources within, and taxes paid to, foreign countries or possessions of the United States are as follows:
| Pay Date | Income | Taxes |
Institutional Class | 12/09/02 | $.104 | $.014 |
Annual Report
Annual Report
Annual Report
Annual Report
Investment Adviser
Fidelity Management & Research Company
Boston, MA
Investment Sub-Advisers
FMR Co., Inc.
Fidelity Management & Research
(U.K.) Inc.
Fidelity Management & Research
(Far East) Inc.
Fidelity International
Investment Advisors
Fidelity Investments Japan Limited
Fidelity International Investment Advisors (U.K.) Limited
General Distributor
Fidelity Distributors Corporation
Boston, MA
Transfer and Shareholder
Servicing Agents
Fidelity Investments Institutional Operations Company, Inc.
Boston, MA
Custodian
State Street Bank and Trust Company
Quincy, MA
Annual Report
Fidelity Advisor Aggressive Growth Fund |
Fidelity Advisor Asset Allocation Fund |
Fidelity Advisor Balanced Fund |
Fidelity Advisor Biotechnology Fund |
Fidelity Advisor California Municipal Income Fund |
Fidelity Advisor Consumer Industries Fund |
Fidelity Advisor Cyclical Industries Fund |
Fidelity Advisor Developing Communications Fund |
Fidelity Advisor Diversified International Fund |
Fidelity Advisor Dividend Growth Fund |
Fidelity Advisor Dynamic Capital Appreciation Fund |
Fidelity Advisor Electronics Fund |
Fidelity Advisor Emerging Asia Fund |
Fidelity Advisor Emerging Markets Income Fund |
Fidelity Advisor Equity Growth Fund |
Fidelity Advisor Equity Income Fund |
Fidelity Advisor Equity Value Fund |
Fidelity Advisor Europe Capital Appreciation Fund |
Fidelity Advisor Fifty Fund |
Fidelity Advisor Financial Services Fund |
Fidelity Advisor Floating Rate High Income Fund |
Fidelity Advisor Global Equity Fund |
Fidelity Advisor Government Investment Fund |
Fidelity Advisor Growth & Income Fund |
Fidelity Advisor Growth Opportunities |
Fidelity Advisor Health Care Fund |
Fidelity Advisor High Income Advantage Fund |
Fidelity Advisor High Income Fund |
Fidelity Advisor Inflation-Protected Bond Fund |
Fidelity Advisor Intermediate Bond Fund |
Fidelity Advisor International Capital Appreciation Fund |
Fidelity Advisor International Small Cap Fund |
Fidelity Advisor Investment Grade Bond Fund |
Fidelity Advisor Japan Fund |
Fidelity Advisor Korea Fund |
Fidelity Advisor Large Cap Fund |
Fidelity Advisor Latin America Fund |
Fidelity Advisor Leveraged Company Stock Fund |
Fidelity Advisor Mid Cap Fund |
Fidelity Advisor Mortgage Securities Fund |
Fidelity Advisor Municipal Income Fund |
Fidelity Advisor Natural Resources Fund |
Fidelity Advisor New York Municipal Income Fund |
Fidelity Advisor Overseas Fund |
Fidelity Advisor Real Estate Fund |
Fidelity Advisor Short Fixed-Income Fund |
Fidelity Advisor Small Cap Fund |
Fidelity Advisor Strategic Growth Fund |
Fidelity Advisor Strategic Income Fund |
Fidelity Advisor Tax Managed
Stock Fund |
Fidelity Advisor Technology Fund |
Fidelity Advisor Telecommunications & Utilities Growth Fund |
Fidelity Advisor Value Leaders Fund |
Fidelity Advisor Value Strategies Fund |
Prime Fund |
Tax-Exempt Fund |
Treasury Fund |
(Fidelity Investment logo)(registered trademark)
Corporate Headquarters
82 Devonshire St., Boston, MA 02109
www.fidelity.com
Fidelity® Advisor
Emerging Asia
Fund - Class A, Class T, Class B
and Class C
Annual Report
October 31, 2003
(2_fidelity_logos) (Registered_Trademark)
Contents
Chairman's Message | <Click Here> | Ned Johnson's message to shareholders. |
Performance | <Click Here> | How the fund has done over time. |
Management's Discussion | <Click Here> | The manager's review of fund performance, strategy and outlook. |
Investment Changes | <Click Here> | A summary of major shifts in the fund's investments over the past six months. |
Investments | <Click Here> | A complete list of the fund's investments with their market values. |
Financial Statements | <Click Here> | Statements of assets and liabilities, operations, and changes in net assets,
as well as financial highlights. |
Notes | <Click Here> | Notes to the financial statements. |
Auditors' Opinion | <Click Here> | |
Trustees and Officers | <Click Here> | |
| | |
| | |
For a free copy of the fund's proxy voting guidelines call 1-877-208-0098 or visit the Securities and Exchange Commission (SEC)'s web site at www.sec.gov.
Third party marks appearing herein are the property of their respective owners.
All other marks appearing herein are registered or unregistered trademarks or service marks of FMR Corp. or an affiliated company.
(Recycle graphic) This report is printed on recycled paper using soy-based inks.
This report and the financial statements contained herein are submitted for the general information of the shareholders of the fund. This report is not authorized for distribution to prospective investors in the fund unless preceded or accompanied by an effective prospectus.
Mutual fund shares are not deposits or obligations of, or guaranteed by, any depository institution. Shares are not insured by the FDIC, Federal Reserve Board or any other agency, and are subject to investment risks, including possible loss of principal amount invested.
Neither the fund nor Fidelity Distributors Corporation is a bank.
For more information on any Fidelity Advisor fund, including charges and expenses, contact your investment professional for a free prospectus. Read it carefully before you invest or send money.
Chairman's Message
(photo_of_Edward_C_Johnson_3d)
Dear Shareholder:
Many of you have read or heard news stories recently that were critical of mutual funds and made allegations that the mutual fund industry has been less than forthright. I find these reports unsettling and not necessarily an accurate picture of the overall industry, and I would like you to know where we at Fidelity stand.
With specific regard to allegations that certain mutual fund companies were violating the Securities and Exchange Commission's forward pricing rules or were involved in so-called "market timing" activities, I want to say two things:
First, Fidelity does not have agreements that permit customers who buy fund shares after 4 p.m. to obtain the 4 p.m. price. This is not to say that someone could not deceive the company through fraudulent acts. But I underscore that we have no so-called "agreements" which would permit this illegal practice.
Second, Fidelity has been on record for years opposing predatory short-term trading which adversely affects other shareholders in a mutual fund. In fact, in the 1980s, we began charging a fee - which is returned to the fund and, therefore, to investors - to discourage this activity. What's more, several years ago we took the industry lead in developing a Fair Value Pricing Policy to prevent market timing on foreign securities in our funds. It is reasonable to assume that another structure can be developed that would alter the system to make it much more difficult for predatory traders to operate. This, however, will only be achieved through close cooperation among regulators, legislators and the industry.
Certainly no industry is perfect, and there have been instances of unethical and illegal activity from time to time within the mutual fund industry. When this occurs, confessed or convicted offenders should be dealt with appropriately. Clearly, every system can be improved. We applaud well thought out improvements by regulators, legislators and industry representatives that achieve the common goal of building and protecting the value of investors' holdings. But we remain concerned about the risk of over-regulation and the quick application of simplistic solutions to intricate problems.
For more than 57 years, Fidelity Investments has worked very hard to improve its products and service to justify your trust. When our family founded this company in 1946, we had only a few hundred customers. Many of them were family and friends. Today, we serve more than 18 million customers including individual investors and participants in retirement plans across America.
Let me close by saying that we do not take your trust in us for granted, and we realize that we must always work to improve all aspects of our service to you. In turn, we urge you to continue your active participation with your financial matters, so that your interests can be well served.
Annual Report
Best regards,
/s/Edward C. Johnson 3d
Edward C. Johnson 3d
Annual Report
Performance: The Bottom Line
Average annual total return reflects the change in the value of an investment, assuming reinvestment of the class' dividend income and capital gains (the profits earned upon the sale of securities that have grown in value) and assuming a constant rate of performance each year. During periods of reimbursement by Fidelity, a fund's total return will be greater than it would be had the reimbursement not occurred. The $10,000 table and the fund's returns do not reflect the deduction of taxes that a shareholder would pay on fund distributions or the redemption of fund shares. How a fund did yesterday is no guarantee of how it will do tomorrow. Returns may reflect the conversion of Class B shares to Class A shares after a maximum of seven years.
Average Annual Total Returns
Periods ended October 31, 2003 | | Past 1
year | Past 5
years | Life of
fundA |
Class A (incl. 5.75% sales charge)B | | 24.55% | 5.09% | -0.55% |
Class T (incl. 3.50% sales charge)C | | 27.09% | 5.34% | -0.43% |
Class B (incl. contingent deferred sales charge)D | | 26.26% | 5.31% | -0.29% |
Class C (incl. contingent deferred sales charge)E | | 30.22% | 5.65% | -0.28% |
A From March 25, 1994.
B Class A's 12b-1 fee may have ranged over time between 0.25% and 0.35%, as an equivalent amount of brokerage commissions of up to 0.10% of the class's average net assets may have been used to promote the sale of class shares. This practice has been discontinued and no commissions incurred after June 30, 2003 have been used to pay distribution expenses. Class A's 12b-1 plan currently authorizes a 0.25% 12b-1 fee. The initial offering of Class A shares took place on June 16, 1999. Returns between March 25, 1994 and June 16, 1999 are those of Fidelity Advisor Emerging Asia Fund, Inc., the Closed-End Fund. On June 15, 1999, the Closed-End Fund reorganized as an open-end fund through a transfer of all its assets and liabilities to Fidelity Advisor Emerging Asia Fund (the fund). Shareholders of the Closed-End Fund received Class A shares of the fund in exchange for their shares of the Closed-End Fund. If Class A shares' total expenses, including its 12b-1 fee, had been reflected in the Closed-End Fund's performance, Class A's returns, prior to June 16,1999, may have been lower.
C Class T's 12b-1 fee may have ranged over time between 0.50% and 0.60%, as an equivalent amount of brokerage commissions of up to 0.10% of the class's average net assets may have been used to promote the sale of class shares. This practice has been discontinued and no commissions incurred after June 30, 2003 have been used to pay distribution expenses. Class T's 12b-1 plan currently authorizes a 0.50% 12b-1 fee. The initial offering of Class T shares took place on June 16, 1999. Returns between March 25, 1994 and June 16, 1999 are those of Fidelity Advisor Emerging Asia Fund, Inc., the Closed-End Fund. On June 15, 1999, the Closed-End Fund reorganized as an open-end fund through a transfer of all its assets and liabilities to Fidelity Advisor Emerging Asia Fund (the fund). Shareholders of the Closed-End Fund received Class A shares of the fund in exchange for their shares of the Closed-End Fund. If Class T shares total expenses, including its 12b-1 fee, had been reflected in the Closed-End Fund's performance, Class T's returns, prior to June 16, 1999, may have been lower.
Annual Report
D Class B shares bear a 1.00% 12b-1 fee that is reflected in returns after June 16, 1999. The initial offering of Class B shares took place on June 16, 1999. Returns between March 25, 1994 and June 16, 1999 are those of Fidelity Advisor Emerging Asia Fund, Inc., the Closed-End Fund. On June 15, 1999, the Closed-End Fund reorganized as an open-end fund through a transfer of all its assets and liabilities to Fidelity Advisor Emerging Asia Fund (the fund). Shareholders of the Closed-End Fund received Class A shares of the fund in exchange for their shares of the Closed-End Fund. If Class B shares' total expenses, including its 1.00% 12b-1 fee, had been reflected in the Closed-End Fund's performance, Class B's returns, prior to June 16, 1999, may have been lower. Class B shares' contingent deferred sales charges included in the past one year, past five year, and life of fund total return figures are 5%, 2%, and 0%, respectively.
E Class C shares bear a 1.00% 12b-1 fee that is reflected in returns after June 16, 1999. Returns between March 25, 1994 and June 16, 1999 are those of Fidelity Advisor Emerging Asia Fund, Inc., the Closed-End Fund. On June 15, 1999, the Closed-End Fund reorganized as an open-end fund through a transfer of all its assets and liabilities to Fidelity Advisor Emerging Asia Fund (the fund). Shareholders of the Closed-End Fund received Class A shares of the fund in exchange for their shares of the Closed-End Fund. If Class C shares' total expenses, including its 1.00% 12b-1 fee, had been reflected in the Closed-End Fund's performance, Class C's returns, prior to June 16, 1999, may have been lower. Class C shares' contingent deferred sales charge included in the past one year, past five year, and life of fund total return figures are 1%, 0%, and 0%, respectively.
Annual Report
$10,000 Over Life of Fund
Let's say hypothetically that $10,000 was invested in Fidelity® Advisor Emerging Asia Fund - Class T on March 25, 1994, when the Closed-End Fund started, and the current 3.50% sales charge was paid. The chart shows what the value of your investment would have been, and also shows how the Morgan Stanley Capital InternationalSM AC Asia Free ex Japan did over the same period.

Annual Report
Management's Discussion of Fund Performance
Comments from Yosawadee Polcharoen, Portfolio Manager of Fidelity® Advisor Emerging Asia Fund
Emerging Asian equity markets were among the world's best performers during the year that ended October 31, 2003. In that time, each country represented in the Morgan Stanley Capital InternationalSM (MSCI®) All Country Asia Free ex Japan Index - a performance benchmark of Asian emerging markets, excluding Japan - returned in excess of 23% in U.S. dollar terms, and the index as a whole advanced 38.86%. Emerging Asian markets were boosted by the improving global economy, a pickup in export growth and a recovery from the SARS epidemic. In terms of individual performance, some of the nations with the smallest exposure in the index had the biggest returns. China, which displayed unexpected resilience to the SARS-related slowdown, represented about 3.5% of the index on average and gained more than 108%, while Thailand, accounting for about 2.5% of the index, advanced 87%. South Korea - the largest index component at 26% on average - underperformed as its economy slipped into a recession. Hong Kong, the benchmark's second-largest weighting, also underperformed despite gaining nearly 35%.
For the 12 months ending October 31, 2003, the fund's Class A, Class T, Class B and Class C shares returned 32.15%, 31.70%, 31.26% and 31.22%, respectively, trailing the Morgan Stanley Capital International All Country Asia Free ex Japan Index. The fund also lagged the LipperSM Pacific Region ex Japan Funds Average, which posted a 37.16% return. An overweighting in the South Korean market, most notably in consumer and banking stocks, hurt performance. Consumer stocks, including CJ Home Shopping, were sidetracked by slowing credit growth and weak domestic consumption. Meanwhile, Korean banking stocks lagged due to high default rates on credit card debt. In the export group, Korean electronics firm Samsung Electro-Mechanics was hampered by sluggish demand for the company's electronics products. Conversely, overweighting India and Thailand, both of which outperformed the benchmark, helped performance. Indian auto manufacturer Tata Motors returned 182% due to robust domestic demand. Also helping was Siam Cement, Thailand's leading construction material company, whose 131% return was driven by strong demand from real estate and infrastructure development.
The views expressed in this statement reflect those of the portfolio manager only through the end of the period of the report as stated on the cover and do not necessarily represent the views of Fidelity or any other person in the Fidelity organization. Any such views are subject to change at any time based upon market or other conditions and Fidelity disclaims any responsibility to update such views. These views may not be relied on as investment advice and, because investment decisions for a Fidelity fund are based on numerous factors, may not be relied on as an indication of trading intent on behalf of any Fidelity fund.
Annual Report
Investment Changes
Top Ten Stocks as of October 31, 2003 |
| % of fund's
net assets | % of fund's net assets
6 months ago |
Samsung Electronics Co. Ltd. | 9.4 | 9.4 |
Taiwan Semiconductor Manufacturing Co. Ltd. | 3.5 | 3.4 |
Hutchison Whampoa Ltd. | 2.9 | 2.7 |
HSBC Holdings PLC (Hong Kong) (Reg.) | 2.8 | 3.5 |
Sun Hung Kai Properties Ltd. | 2.4 | 1.5 |
Cheung Kong Holdings Ltd. | 2.3 | 1.9 |
Li & Fung Ltd. | 2.2 | 1.5 |
Kookmin Bank | 2.1 | 1.8 |
United Overseas Bank Ltd. | 1.9 | 2.2 |
LG Electronics, Inc. | 1.9 | 2.2 |
| 31.4 | |
Top Five Market Sectors as of October 31, 2003 |
| % of fund's
net assets | % of fund's net assets
6 months ago |
Financials | 29.9 | 25.5 |
Information Technology | 28.7 | 21.6 |
Consumer Discretionary | 12.6 | 8.7 |
Materials | 10.3 | 13.0 |
Energy | 4.9 | 7.2 |
Asset Allocation (% of fund's net assets) |
As of October 31, 2003 | As of April 30, 2003 |
| Stocks 97.9% | | | Stocks 93.0% | |
| Short-Term
Investments and
Net Other Assets 2.1% | | | Short-Term
Investments and
Net Other Assets 7.0% | |

Annual Report
Investments October 31, 2003
Showing Percentage of Net Assets
Common Stocks - 95.7% |
| Shares | | Value (Note 1) |
Bermuda - 1.3% |
Skyworth Digital Holdings Ltd. | 2,138,000 | | $ 528,608 |
China - 5.1% |
China Petroleum & Chemical Corp. (H Shares) | 1,506,000 | | 499,375 |
Guangdong Kelon Electrical Holdings Ltd. Series H (a) | 339,000 | | 142,967 |
Harbin Power Equipment Co. Ltd. (H Shares) | 386,000 | | 94,939 |
Nanjing Panda Electronics Co. (H Shares) (a) | 180,000 | | 52,733 |
PetroChina Co. Ltd. (H Shares) | 1,634,000 | | 594,423 |
PICC Property & Casualty Co. Ltd. (H Shares) | 86,000 | | 20,136 |
Sinopec Shanghai Petrochemical Co. Ltd. (H Shares) | 1,466,000 | | 415,319 |
Tianjin Capital Environmental Protection Co. Ltd. (H Shares) | 254,000 | | 70,323 |
Zhenhai Refining & Chemical Co. (H Shares) | 274,000 | | 167,598 |
TOTAL CHINA | | 2,057,813 |
Hong Kong - 20.0% |
ASM Pacific Technology Ltd. | 25,500 | | 95,392 |
Bank of East Asia Ltd. | 141,600 | | 423,035 |
BOC Hong Kong Holdings Ltd. | 237,500 | | 411,349 |
Cheung Kong Holdings Ltd. | 112,000 | | 933,862 |
China Everbright Ltd. | 306,000 | | 168,454 |
China Merchants Holdings International Co. Ltd. | 162,000 | | 219,043 |
Denway Motors Ltd. | 338,000 | | 278,562 |
Elec & Eltek International Holdings Ltd. | 106,000 | | 19,792 |
Esprit Holdings Ltd. | 121,000 | | 380,190 |
Hang Seng Bank Ltd. | 55,000 | | 687,004 |
Hong Kong & China Gas Co. Ltd. | 258,400 | | 357,706 |
Hutchison Whampoa Ltd. | 151,000 | | 1,171,545 |
Li & Fung Ltd. | 530,000 | | 890,659 |
PCCW Ltd. (a) | 372,000 | | 265,865 |
Sun Hung Kai Properties Ltd. | 116,000 | | 982,152 |
Swire Pacific Ltd. (A Shares) | 82,500 | | 503,567 |
Wharf Holdings Ltd. | 114,000 | | 286,997 |
TOTAL HONG KONG | | 8,075,174 |
India - 8.5% |
Bharti Televentures Ltd. (a) | 62,110 | | 123,823 |
BSES Ltd. | 13,790 | | 145,355 |
Dr. Reddy's Laboratories Ltd. | 2,660 | | 70,151 |
Hero Honda Motors Ltd. | 17,100 | | 133,363 |
Hindustan Petroleum Corp. Ltd. | 17,370 | | 126,174 |
Housing Development Finance Corp. Ltd. | 20,280 | | 232,647 |
ICICI Bank Ltd. | 54,211 | | 296,773 |
Infosys Technologies Ltd. | 5,090 | | 532,524 |
Common Stocks - continued |
| Shares | | Value (Note 1) |
India - continued |
ITC Ltd. | 100 | | $ 1,917 |
Ranbaxy Laboratories Ltd. | 12,254 | | 265,832 |
Reliance Industries Ltd. | 54,850 | | 588,560 |
Satyam Computer Services Ltd. | 36,540 | | 246,798 |
State Bank of India | 27,775 | | 296,749 |
Tata Engineering & Locomotive Co. Ltd. | 45,480 | | 375,822 |
TOTAL INDIA | | 3,436,488 |
Indonesia - 1.0% |
PT Telkomunikasi Indonesia Tbk | 576,500 | | 407,110 |
Korea (South) - 24.9% |
Amotech Co. Ltd. | 4,430 | | 91,332 |
Dae Duck Electronics Co. Ltd. | 9,520 | | 87,679 |
Daewoo Heavy Industries & Machinery Ltd. (a) | 13,940 | | 95,407 |
Honam Petrochemical Corp. | 13,250 | | 530,671 |
KH Vatec Co. Ltd. | 2,620 | | 124,857 |
Kookmin Bank | 23,459 | | 856,298 |
Korean Air Co. Ltd. | 12,390 | | 165,409 |
LG Chemical Ltd. | 10,460 | | 419,814 |
LG Electronics, Inc. | 14,510 | | 751,553 |
LG Petrochemical Co. Ltd. | 4,490 | | 102,433 |
POSCO | 5,850 | | 678,132 |
Samsung Electro-Mechanics Co. Ltd. | 9,800 | | 332,049 |
Samsung Electronics Co. Ltd. | 9,577 | | 3,803,285 |
Samsung SDI Co. Ltd. | 6,110 | | 629,843 |
Shinhan Financial Group Co. Ltd. | 26,910 | | 386,540 |
Shinsegae Co. Ltd. | 1,660 | | 333,122 |
SK Telecom Co. Ltd. | 3,760 | | 663,996 |
TOTAL KOREA (SOUTH) | | 10,052,420 |
Malaysia - 3.2% |
AMMB Holdings BHD | 76,500 | | 106,697 |
Berjaya Sports Toto BHD | 80,850 | | 92,765 |
British American Tobacco (Malaysia) BHD | 9,900 | | 108,770 |
Gamuda BHD | 49,300 | | 98,600 |
Hong Leong Bank BHD | 60,300 | | 86,483 |
Malayan Banking BHD | 94,800 | | 254,463 |
Public Bank BHD (For. Reg.) | 378,750 | | 299,013 |
Resorts World BHD | 50,300 | | 145,605 |
Tanjong PLC | 32,300 | | 93,500 |
TOTAL MALAYSIA | | 1,285,896 |
Common Stocks - continued |
| Shares | | Value (Note 1) |
Singapore - 6.4% |
Chartered Semiconductor Manufacturing Ltd. (a) | 194,000 | | $ 190,710 |
City Developments Ltd. | 60,000 | | 208,681 |
DBS Group Holdings Ltd. | 76,463 | | 628,583 |
Huan Hsin Holdings Ltd. | 82,000 | | 53,268 |
Oversea-Chinese Banking Corp. Ltd. | 47,604 | | 331,134 |
Singapore Press Holdings Ltd. | 15,298 | | 173,251 |
Singapore Telecommunications Ltd. | 164,000 | | 162,162 |
ST Assembly Test Services Ltd. (a) | 60,000 | | 78,643 |
United Overseas Bank Ltd. | 96,470 | | 754,235 |
TOTAL SINGAPORE | | 2,580,667 |
Taiwan - 18.7% |
Advanced Semiconductor Engineering, Inc. (a) | 442,000 | | 410,345 |
AU Optronics Corp. | 223,000 | | 301,014 |
Cathay Financial Holding Co. Ltd. | 238,000 | | 392,809 |
China Steel Corp. | 461,320 | | 372,537 |
Chinatrust Financial Holding Co. | 248,433 | | 258,464 |
Chung Hwa Pulp Corp. | 283,000 | | 151,801 |
Compal Electronics, Inc. | 168,850 | | 256,286 |
Compeq Manufacturing Co. Ltd. (a) | 310,000 | | 175,420 |
Delta Electronics, Inc. | 127,000 | | 162,446 |
Evergreen Marine Corp. | 102,760 | | 90,252 |
Formosa Plastic Corp. | 379,811 | | 582,086 |
Fubon Financial Holding Co. Ltd. | 243,000 | | 256,393 |
High Tech Computer Corp. | 21,000 | | 77,984 |
Hon Hai Precision Industries Co. Ltd. | 113,784 | | 509,731 |
Johnson Health Tech Co. Ltd. | 29,000 | | 64,103 |
Merry Electronics Co. Ltd. | 45,000 | | 72,944 |
Nan Ya Plastics Corp. | 380,280 | | 507,712 |
Quanta Computer, Inc. | 138,915 | | 378,710 |
Siliconware Precision Industries Co. Ltd. (a) | 154,000 | | 147,510 |
Sunplus Technology Co. Ltd. | 51,000 | | 88,683 |
Taiwan Semiconductor Manufacturing Co. Ltd. (a) | 723,440 | | 1,428,543 |
United Microelectronics Corp. (a) | 794,476 | | 728,211 |
Yageo Corp. (a) | 303,000 | | 144,668 |
TOTAL TAIWAN | | 7,558,652 |
Thailand - 3.8% |
Bangkok Bank Ltd. PCL (For. Reg.) (a) | 211,600 | | 495,234 |
Krung Thai Bank Public Co. Ltd. | 413,700 | | 92,163 |
Land & House PCL (For. Reg.) | 723,900 | | 244,622 |
Siam Cement PCL (For. Reg.) | 66,200 | | 374,498 |
Common Stocks - continued |
| Shares | | Value (Note 1) |
Thailand - continued |
Siam Commercial Bank PCL (For. Reg.) (a) | 205,300 | | $ 211,981 |
TelecomAsia Corp. PCL (a) | 100 | | 14 |
TelecomAsia Corp. PCL rights 4/30/08 (a) | 190,863 | | 0 |
Thai Military Bank PCL (For.Reg.) (a) | 745,100 | | 82,810 |
Thai Olefins PCL (a) | 57,900 | | 43,479 |
TOTAL THAILAND | | 1,544,801 |
United Kingdom - 2.8% |
HSBC Holdings PLC (Hong Kong) (Reg.) | 76,976 | | 1,155,718 |
TOTAL COMMON STOCKS (Cost $33,168,328) | 38,683,347 |
Nonconvertible Preferred Stocks - 2.2% |
| | | |
Korea (South) - 2.2% |
Hyundai Motor Co. Ltd. | 30,480 | | 502,205 |
Samsung Electronics Co. Ltd. | 2,050 | | 407,055 |
TOTAL NONCONVERTIBLE PREFERRED STOCKS (Cost $727,264) | 909,260 |
Government Obligations - 3.0% |
| Principal Amount (c) | | |
India - 3.0% |
India, Federal Republic of 3.8502% 12/12/03
(Cost $1,208,645) | INR | 55,000,000 | | 1,206,428 |
Money Market Funds - 2.4% |
| Shares | | Value (Note 1) |
Fidelity Cash Central Fund, 1.07% (b)
(Cost $972,288) | 972,288 | | $ 972,288 |
TOTAL INVESTMENT PORTFOLIO - 103.3% (Cost $36,076,525) | | 41,771,323 |
NET OTHER ASSETS - (3.3)% | | (1,352,258) |
NET ASSETS - 100% | $ 40,419,065 |
Currency Abbreviations |
INR | - | Indian rupee |
Legend |
(a) Non-income producing |
(b) The rate quoted is the annualized seven-day yield of the fund at period end. A complete listing of the fund's holdings as of its most recent fiscal year end is available upon request. |
(c) Principal amount is stated in United States dollars unless otherwise noted. |
Other Information |
Purchases and sales of securities, other than short-term securities, aggregated $50,897,932 and $49,252,885, respectively. |
The fund participated in the interfund lending program as a borrower. The average daily loan balance during the period for which loans were outstanding amounted to $2,874,000. The weighted average interest rate was 1.15%. At period end there were no interfund loans outstanding. |
Income Tax Information |
At October 31, 2003, the fund had a capital loss carryforward of approximately $3,457,000 of which $2,034,000 and $1,423,000 will expire on October 31, 2009 and 2010, respectively. |
See accompanying notes which are an integral part of the financial statements.
Annual Report
Financial Statements
Statement of Assets and Liabilities
| October 31, 2003 |
| | |
Assets | | |
Investment in securities, at value (cost $36,076,525) - See accompanying schedule | | $ 41,771,323 |
Foreign currency held at value (cost $326,396) | | 326,773 |
Receivable for investments sold | | 561,922 |
Receivable for fund shares sold | | 223,623 |
Dividends receivable | | 7,800 |
Interest receivable | | 1,038 |
Prepaid expenses | | 173 |
Receivable from investment adviser for expense reductions | | 28,495 |
Total assets | | 42,921,147 |
| | |
Liabilities | | |
Payable for investments purchased | $ 637,411 | |
Payable for fund shares redeemed | 52,140 | |
Accrued management fee | 23,465 | |
Distribution fees payable | 14,367 | |
Other payables and accrued expenses | 1,774,699 | |
Total liabilities | | 2,502,082 |
| | |
Net Assets | | $ 40,419,065 |
Net Assets consist of: | | |
Paid in capital | | $ 38,371,555 |
Undistributed net investment income | | 180,437 |
Accumulated undistributed net realized gain (loss) on investments and foreign currency transactions | | (3,605,277) |
Net unrealized appreciation (depreciation) on investments and assets and liabilities in foreign currencies | | 5,472,350 |
Net Assets | | $ 40,419,065 |
See accompanying notes which are an integral part of the financial statements.
Annual Report
Financial Statements - continued
Statement of Assets and Liabilities - continued
| October 31, 2003 |
| | |
Calculation of Maximum Offering Price
Class A:
Net Asset Value and redemption price per share
($24,161,487 ÷ 1,848,546 shares) | | $ 13.07 |
| | |
Maximum offering price per share (100/94.25 of $13.07) | | $ 13.87 |
Class T:
Net Asset Value and redemption price per share ($4,981,853 ÷ 385,533 shares) | | $ 12.92 |
| | |
Maximum offering price per share (100/96.50 of $12.92) | | $ 13.39 |
Class B:
Net Asset Value and offering price per share ($5,156,870 ÷ 408,090 shares) A | | $ 12.64 |
| | |
Class C:
Net Asset Value and offering price per share ($4,580,983 ÷ 362,141 shares) A | | $ 12.65 |
| | |
Institutional Class:
Net Asset Value, offering price and redemption price per share ($1,537,872 ÷ 116,476 shares) | | $ 13.20 |
A Redemption price per share is equal to net asset value less any applicable contingent deferred sales charge.
See accompanying notes which are an integral part of the financial statements.
Annual Report
Statement of Operations
| Year ended October 31, 2003 |
| | |
Investment Income | | |
Dividends | | $ 867,986 |
Interest | | 55,510 |
| | 923,496 |
Less foreign taxes withheld | | (103,241) |
Total income | | 820,255 |
| | |
Expenses | | |
Management fee | $ 220,272 | |
Transfer agent fees | 126,966 | |
Distribution fees | 123,907 | |
Accounting fees and expenses | 61,615 | |
Non-interested trustees' compensation | 121 | |
Custodian fees and expenses | 217,541 | |
Registration fees | 55,751 | |
Audit | 108,585 | |
Legal | 1,428 | |
Interest | 641 | |
Miscellaneous | 7,911 | |
Total expenses before reductions | 924,738 | |
Expense reductions | (266,360) | 658,378 |
Net investment income (loss) | | 161,877 |
Realized and Unrealized Gain (Loss) Net realized gain (loss) on: | | |
Investment securities | 6,483,503 | |
Foreign currency transactions | (5,082) | |
Total net realized gain (loss) | | 6,478,421 |
Change in net unrealized appreciation (depreciation) on: Investment securities (net of deferred foreign taxes of $195,235) | 3,316,302 | |
Assets and liabilities in foreign currencies | (24,567) | |
Total change in net unrealized appreciation (depreciation) | | 3,291,735 |
Net gain (loss) | | 9,770,156 |
Net increase (decrease) in net assets resulting from operations | | $ 9,932,033 |
See accompanying notes which are an integral part of the financial statements.
Annual Report
Financial Statements - continued
Statement of Changes in Net Assets
| Year ended
October 31,
2003 | Year ended
October 31,
2002 |
Increase (Decrease) in Net Assets | | |
Operations | | |
Net investment income (loss) | $ 161,877 | $ (101,155) |
Net realized gain (loss) | 6,478,421 | (1,376,366) |
Change in net unrealized appreciation (depreciation) | 3,291,735 | 3,700,512 |
Net increase (decrease) in net assets resulting
from operations | 9,932,033 | 2,222,991 |
Share transactions - net increase (decrease) | 2,145,215 | 738,683 |
Total increase (decrease) in net assets | 12,077,248 | 2,961,674 |
| | |
Net Assets | | |
Beginning of period | 28,341,817 | 25,380,143 |
End of period (including undistributed net investment income of $180,437 and accumulated net investment loss of $49,255, respectively) | $ 40,419,065 | $ 28,341,817 |
See accompanying notes which are an integral part of the financial statements.
Annual Report
Financial Highlights - Class A
Years ended October 31, | 2003 | 2002 | 2001 | 2000 | 1999 E |
Selected Per-Share Data | | | | | |
Net asset value, beginning of period | $ 9.89 | $ 9.15 | $ 12.29 | $ 15.01 | $ 9.61 |
Income from Investment Operations | | | | | |
Net investment income (loss) C | .07 | (.02) | (.03) | (.12) | (.03) |
Net realized and unrealized gain (loss) | 3.11 | .76 | (3.11) | (2.60) | 5.30 |
Total from investment operations | 3.18 | .74 | (3.14) | (2.72) | 5.27 |
Redemption fees added to paid in capital C | - | - | - | - | .13 |
Net asset value, end of period | $ 13.07 | $ 9.89 | $ 9.15 | $ 12.29 | $ 15.01 |
Total Return A,B | 32.15% | 8.09% | (25.55)% | (18.12)% | 56.19% |
Ratios to Average Net Assets D | | | | | |
Expenses before expense reductions | 2.81% | 2.56% | 2.56% | 1.98% | 2.04% |
Expenses net of voluntary waivers, if any | 2.02% | 2.00% | 2.00% | 1.98% | 2.04% |
Expenses net of all reductions | 2.02% | 1.98% | 1.97% | 1.96% | 2.03% |
Net investment income (loss) | .70% | (.17)% | (.26)% | (.69)% | (.22)% |
Supplemental Data | | | | | |
Net assets, end of period
(000 omitted) | $ 24,161 | $ 18,314 | $ 18,151 | $ 31,386 | $ 82,492 |
Portfolio turnover rate | 172% | 121% | 62% | 96% | 62% |
A Total returns would have been lower had certain expenses not been reduced during the periods shown.
B Total returns do not include the effect of the sales charges.
C Calculated based on average shares outstanding during the period.
D Expense ratios reflect operating expenses of the class. Expenses before reductions do not reflect amounts reimbursed by the investment adviser or reductions from brokerage service arrangements or other expense offset arrangements and do not represent the amount paid by the class during periods when reimbursements or reductions occur. Expenses net of any voluntary waivers reflect expenses after reimbursement by the investment adviser but prior to reductions from brokerage service arrangements or other expense offset arrangements. Expenses net of all reductions represent the net expenses paid by the class.
E Prior to June 16, 1999, the fund operated as a closed-end investment company. Shares of the fund existing at the time of its conversion to an open-ended management investment company were exchanged for Class A shares.
See accompanying notes which are an integral part of the financial statements.
Annual Report
Financial Highlights - Class T
Years ended October 31, | 2003 | 2002 | 2001 | 2000 | 1999 F |
Selected Per-Share Data | | | | | |
Net asset value, beginning of period | $ 9.81 | $ 9.09 | $ 12.25 | $ 15.01 | $ 14.44 |
Income from Investment Operations | | | | | |
Net investment income (loss) E | .05 | (.05) | (.06) | (.14) | .13 |
Net realized and unrealized gain (loss) | 3.06 | .77 | (3.10) | (2.62) | .34 H |
Total from investment operations | 3.11 | .72 | (3.16) | (2.76) | .47 |
Redemption fees added to paid in capital E | - | - | - | - | .10 H |
Net asset value, end of period | $ 12.92 | $ 9.81 | $ 9.09 | $ 12.25 | $ 15.01 |
Total Return B,C,D | 31.70% | 7.92% | (25.80)% | (18.39)% | 3.95% |
Ratios to Average Net Assets G | | | | | |
Expenses before expense reductions | 3.43% | 3.16% | 3.41% | 2.17% | 2.50% A |
Expenses net of voluntary waivers, if any | 2.27% | 2.25% | 2.25% | 2.17% | 2.25% A |
Expenses net of all reductions | 2.26% | 2.23% | 2.22% | 2.15% | 2.25% A |
Net investment income (loss) | .45% | (.42)% | (.51)% | (.88)% | 2.34% A |
Supplemental Data | | | | | |
Net assets, end of period
(000 omitted) | $ 4,982 | $ 4,347 | $ 2,842 | $ 4,165 | $ 1,405 |
Portfolio turnover rate | 172% | 121% | 62% | 96% | 62% |
A Annualized
B Total returns for periods of less than one year are not annualized.
C Total returns would have been lower had certain expenses not been reduced during the periods shown.
D Total returns do not include the effect of the sales charges.
E Calculated based on average shares outstanding during the period.
F For the period June 16, 1999 (commencement of sale of shares) to October 31, 1999.
G Expense ratios reflect operating expenses of the class. Expenses before reductions do not reflect amounts reimbursed by the investment adviser or reductions from brokerage service arrangements or other expense offset arrangements and do not represent the amount paid by the class during periods when reimbursements or reductions occur. Expense ratios before reductions for start-up periods may not be representative of longer-term operating periods. Expenses net of any voluntary waivers reflect expenses after reimbursement by the investment adviser but prior to reductions from brokerage service arrangements or other expense offset arrangements. Expenses net of all reductions represent the net expenses paid by the class.
H Per share amounts have been reclassified to reflect redemption fees on a class level.
See accompanying notes which are an integral part of the financial statements.
Annual Report
Financial Highlights - Class B
Years ended October 31, | 2003 | 2002 | 2001 | 2000 | 1999 F |
Selected Per-Share Data | | | | | |
Net asset value, beginning of period | $ 9.63 | $ 8.97 | $ 12.15 | $ 14.98 | $ 14.44 |
Income from Investment Operations | | | | | |
Net investment income (loss) E | (.01) | (.10) | (.11) | (.24) | .08 |
Net realized and unrealized gain (loss) | 3.02 | .76 | (3.07) | (2.59) | .37 H |
Total from investment operations | 3.01 | .66 | (3.18) | (2.83) | .45 |
Redemption fees added to paid in capital E | - | - | - | - | .09 H |
Net asset value, end of period | $ 12.64 | $ 9.63 | $ 8.97 | $ 12.15 | $ 14.98 |
Total Return B,C,D | 31.26% | 7.36% | (26.17)% | (18.89)% | 3.74% |
Ratios to Average Net Assets G | | | | | |
Expenses before expense reductions | 3.87% | 3.63% | 3.66% | 2.77% | 3.19% A |
Expenses net of voluntary waivers, if any | 2.77% | 2.75% | 2.75% | 2.77% | 2.75% A |
Expenses net of all reductions | 2.77% | 2.73% | 2.72% | 2.75% | 2.75% A |
Net investment income (loss) | (.05)% | (.92)% | (1.01)% | (1.48)% | 1.38% A |
Supplemental Data | | | | | |
Net assets, end of period
(000 omitted) | $ 5,157 | $ 2,787 | $ 2,466 | $ 3,664 | $ 977 |
Portfolio turnover rate | 172% | 121% | 62% | 96% | 62% |
A Annualized
B Total returns for periods of less than one year are not annualized.
C Total returns would have been lower had certain expenses not been reduced during the periods shown.
D Total returns do not include the effect of the contingent deferred sales charge.
E Calculated based on average shares outstanding during the period.
F For the period June 16, 1999 (commencement of sale of shares) to October 31, 1999.
G Expense ratios reflect operating expenses of the class. Expenses before reductions do not reflect amounts reimbursed by the investment adviser or reductions from brokerage service arrangements or other expense offset arrangements and do not represent the amount paid by the class during periods when reimbursements or reductions occur. Expense ratios before reductions for start-up periods may not be representative of longer-term operating periods. Expenses net of any voluntary waivers reflect expenses after reimbursement by the investment adviser but prior to reductions from brokerage service arrangements or other expense offset arrangements. Expenses net of all reductions represent the net expenses paid by the class.
H Per share amounts have been reclassified to reflect redemption fees on a class level.
See accompanying notes which are an integral part of the financial statements.
Annual Report
Financial Highlights - Class C
Years ended October 31, | 2003 | 2002 | 2001 | 2000 | 1999 F |
Selected Per-Share Data | | | | | |
Net asset value, beginning of period | $ 9.64 | $ 8.98 | $ 12.16 | $ 14.97 | $ 14.44 |
Income from Investment Operations | | | | | |
Net investment income (loss) E | (.01) | (.10) | (.11) | (.23) | .04 |
Net realized and unrealized gain (loss) | 3.02 | .76 | (3.07) | (2.58) | .38 H |
Total from investment operations | 3.01 | .66 | (3.18) | (2.81) | .42 |
Redemption fees added to paid in capital E | - | - | - | - | .11 H |
Net asset value, end of period | $ 12.65 | $ 9.64 | $ 8.98 | $ 12.16 | $ 14.97 |
Total Return B,C,D | 31.22% | 7.35% | (26.15)% | (18.77)% | 3.67% |
Ratios to Average Net Assets G | | | | | |
Expenses before expense reductions | 3.70% | 3.53% | 3.52% | 2.68% | 3.00% A |
Expenses net of voluntary waivers, if any | 2.77% | 2.75% | 2.75% | 2.68% | 2.75% A |
Expenses net of all reductions | 2.76% | 2.73% | 2.72% | 2.66% | 2.75% A |
Net investment income (loss) | (.05)% | (.92)% | (1.01)% | (1.40)% | .75% A |
Supplemental Data | | | | | |
Net assets, end of period (000 omitted) | $ 4,581 | $ 2,220 | $ 1,263 | $ 2,124 | $ 614 |
Portfolio turnover rate | 172% | 121% | 62% | 96% | 62% |
A Annualized
B Total returns for periods of less than one year are not annualized.
C Total returns would have been lower had certain expenses not been reduced during the periods shown.
D Total returns do not include the effect of the contingent deferred sales charge.
E Calculated based on average shares outstanding during the period.
F For the period June 16, 1999 (commencement of sale of shares) to October 31, 1999.
G Expense ratios reflect operating expenses of the class. Expenses before reductions do not reflect amounts reimbursed by the investment adviser or reductions from brokerage service arrangements or other expense offset arrangements and do not represent the amount paid by the class during periods when reimbursements or reductions occur. Expense ratios before reductions for start-up periods may not be representative of longer-term operating periods. Expenses net of any voluntary waivers reflect expenses after reimbursement by the investment adviser but prior to reductions from brokerage service arrangements or other expense offset arrangements. Expenses net of all reductions represent the net expenses paid by the class.
H Per share amounts have been reclassified to reflect redemption fees on a class level.
See accompanying notes which are an integral part of the financial statements.
Annual Report
Financial Highlights - Institutional Class
Years ended October 31, | 2003 | 2002 | 2001 | 2000 | 1999 E |
Selected Per-Share Data | | | | | |
Net asset value, beginning of period | $ 9.97 | $ 9.21 | $ 12.34 | $ 15.03 | $ 14.44 |
Income from Investment Operations | | | | | |
Net investment income (loss) D | .10 | .01 | - H | (.03) | .05 |
Net realized and unrealized gain (loss) | 3.13 | .75 | (3.13) | (2.66) | .40 G |
Total from investment operations | 3.23 | .76 | (3.13) | (2.69) | .45 |
Redemption fees added to paid in capital D | - | - | - | - | .14 G |
Net asset value, end of period | $ 13.20 | $ 9.97 | $ 9.21 | $ 12.34 | $ 15.03 |
Total Return B,C | 32.40% | 8.25% | (25.36)% | (17.90)% | 4.09% |
Ratios to Average Net Assets F | | | | | |
Expenses before expense reductions | 2.55% | 2.18% | 2.20% | 1.45% | 1.97% A |
Expenses net of voluntary waivers, if any | 1.77% | 1.75% | 1.75% | 1.45% | 1.75% A |
Expenses net of all reductions | 1.77% | 1.73% | 1.72% | 1.42% | 1.75% A |
Net investment income (loss) | .94% | .08% | (.01)% | (.16)% | .90% A |
Supplemental Data | | | | | |
Net assets, end of period
(000 omitted) | $ 1,538 | $ 674 | $ 658 | $ 1,523 | $ 172 |
Portfolio turnover rate | 172% | 121% | 62% | 96% | 62% |
A Annualized
B Total returns for periods of less than one year are not annualized.
C Total returns would have been lower had certain expenses not been reduced during the periods shown.
D Calculated based on average shares outstanding during the period.
E For the period June 16, 1999 (commencement of sale of shares) to October 31, 1999.
F Expense ratios reflect operating expenses of the class. Expenses before reductions do not reflect amounts reimbursed by the investment adviser or reductions from brokerage service arrangements or other expense offset arrangements and do not represent the amount paid by the class during periods when reimbursements or reductions occur. Expense ratios before reductions for start-up periods may not be representative of longer-term operating periods. Expenses net of any voluntary waivers reflect expenses after reimbursement by the investment adviser but prior to reductions from brokerage service arrangements or other expense offset arrangements. Expenses net of all reductions represent the net expenses paid by the class.
G Per share amounts have been reclassified to reflect redemption fees on a class level.
H Amount represents less than $.01 per-share.
See accompanying notes which are an integral part of the financial statements.
Annual Report
Notes to Financial Statements
For the period ended October 31, 2003
1. Significant Accounting Policies.
Fidelity Advisor Emerging Asia Fund (the fund) is a fund of Fidelity Advisor Series VIII (the trust) and is authorized to issue an unlimited number of shares. The trust is registered under the Investment Company Act of 1940, as amended (the 1940 Act), as an open-end management investment company organized as a Massachusetts business trust.
The fund offers Class A, Class T, Class B, Class C, and Institutional Class shares, each of which has equal rights as to assets and voting privileges. Each class has exclusive voting rights with respect to matters that affect that class. Class B shares will automatically convert to Class A shares after a holding period of seven years from the initial date of purchase. Investment income, realized and unrealized capital gains and losses, the common expenses of the fund, and certain fund-level expense reductions, if any, are allocated on a pro rata basis to each class based on the relative net assets of each class to the total net assets of the fund. Each class differs with respect to transfer agent and distribution and service plan fees incurred. Certain expense reductions also differ by class.
The fund's investments in emerging markets can be subject to social, economic, regulatory, and political uncertainties and can be extremely volatile.
The financial statements have been prepared in conformity with accounting principles generally accepted in the United States of America, which require management to make certain estimates and assumptions at the date of the financial statements. The following summarizes the significant accounting policies of the fund:
Security Valuation. Net asset value per share (NAV calculation) is calculated as of the close of business of the New York Stock Exchange, normally 4:00 p.m. Eastern time. Equity securities for which market quotations are available are valued at the last sale price or official closing price (closing bid price or last evaluated quote if no sale has occurred) on the primary market or exchange on which they trade. Debt securities for which quotations are readily available are valued at their most recent bid prices (sales prices if the principal market is an exchange) in the principal market in which such securities are normally traded, as determined by recognized dealers in such securities, or securities are valued on the basis of information provided by a pricing service. Pricing services use valuation matrices that incorporate both dealer-supplied valuations and valuation models. If an event that is expected to materially affect the value of a security occurs after the close of an exchange or market on which that security trades, but prior to the NAV calculation, then that security will be fair valued taking the event into account. Securities (including restricted securities) for which market quotations are not readily available are valued at their fair value as determined in good faith under consistently applied procedures under the general supervision of the Board of Trustees. Price movements in futures contracts and ADRs, market and trading trends, the bid/ask quotes of brokers and off-exchange institutional trading may be reviewed in the course of making a good faith determination of a security's fair value. Short-term securities with
Annual Report
Notes to Financial Statements - continued
1. Significant Accounting Policies - continued
Annual Report
Security Valuation - continued
remaining maturities of sixty days or less for which quotations are not readily available are valued on the basis of amortized cost. Investments in open-end investment companies are valued at their net asset value each business day.
Foreign Currency. The fund uses foreign currency contracts to facilitate transactions in foreign-denominated securities. Losses from these transactions may arise from changes in the value of the foreign currency or if the counterparties do not perform under the contracts' terms.
Foreign denominated assets, including investment securities, and liabilities are translated into U.S. dollars at the exchange rate at period end. Purchases and sales of investment securities, income and dividends received and expenses denominated in foreign currencies are translated into U.S. dollars at the exchange rate in effect on the transaction date.
The effects of exchange rate fluctuations on investments are included with the net realized and unrealized gain (loss) on investment securities. Other foreign currency transactions resulting in realized and unrealized gain (loss) are disclosed separately.
Investment Transactions and Income. Security transactions are accounted for as of trade date. Gains and losses on securities sold are determined on the basis of identified cost. Dividend income is recorded on the ex-dividend date, except for certain dividends from foreign securities where the ex-dividend date may have passed, which are recorded as soon as the fund is informed of the ex-dividend date. Non-cash dividends included in dividend income, if any, are recorded at the fair market value of the securities received. Interest income is accrued as earned. Interest income includes coupon interest and amortization of premium and accretion of discount on debt securities, which is accrued using the interest method. Investment income is recorded net of foreign taxes withheld where recovery of such taxes is uncertain.
Expenses. Most expenses of the trust can be directly attributed to a fund. Expenses which cannot be directly attributed are apportioned among the funds in the trust.
Income Tax Information and Distributions to Shareholders. Each year the fund intends to qualify as a regulated investment company by distributing all of its taxable income and realized gains under Subchapter M of the Internal Revenue Code. As a result, no provision for income taxes is required in the accompanying financial statements. Foreign taxes are provided for based on each fund's understanding of the tax rules and rates that exist in the foreign markets in which it invests. In March of 2002, the fund filed for a ruling in India regarding the applicability of taxes imposed by the country on realized capital gains under the US/India tax treaty. The ruling requested the refund of
Annual Report
Notes to Financial Statements - continued
1. Significant Accounting Policies - continued
Annual Report
Income Tax Information and Distributions to Shareholders - continued
taxes paid in prior years and would exempt future realized gains from taxes. Although the ruling is still pending, the fund received a refund of 66 million Indian rupees (approximately $1,450,000) representing taxes paid by the fund in 2000 through 2002. The outcome of the ruling cannot be predicted and the Indian tax authorities could request repayment of the refund if there is an unfavorable ruling. The fund has continued to accrue capital gains taxes (prior and current) until such time as a final ruling is received. Income dividends and capital gain distributions are declared separately for each class. Distributions are recorded on the ex-dividend date.
Income and capital gain distributions are determined in accordance with income tax regulations, which may differ from generally accepted accounting principles. Capital accounts within the financial statements are adjusted for permanent and temporary book and tax differences. These adjustments have no impact on net assets or the results of operations. Temporary differences will reverse in a subsequent period. These differences are primarily due to foreign currency transactions, passive foreign investment companies (PFIC), capital loss carryforwards and losses deferred due to wash sales.
The tax-basis components of distributable earnings and the federal tax cost as of period end were as follows:
Unrealized appreciation | $ 5,759,761 | | |
Unrealized depreciation | (530,529) | |
Net unrealized appreciation (depreciation) | 5,229,232 | |
Undistributed ordinary income | 275,262 | |
Capital loss carryforward | (3,456,984) | |
| | |
Cost for federal income tax purposes | $ 36,542,091 | |
Short-Term Trading (Redemption) Fees. Shares purchased after March 31, 2004 and held in the fund less than 90 days will be subject to a short-term trading fee equal to 1.50% of the proceeds of the redeemed shares. The fee, which will be retained by the fund, is accounted for as an addition to paid in capital.
2. Operating Policies.
Repurchase Agreements. Fidelity Management & Research (FMR) has received an Exemptive Order from the Securities and Exchange Commission (the SEC) which permits the fund and other affiliated entities of FMR to transfer uninvested cash balances into joint trading accounts. These accounts are then invested in repurchase agreements that are collateralized by U.S. Treasury or Government obligations. The fund may also invest directly with institutions, in repurchase agreements that are collateralized by commercial paper obligations and corporate obligations. Collateral is held in
Annual Report
Notes to Financial Statements - continued
2. Operating Policies - continued
Annual Report
Repurchase Agreements - continued
segregated accounts with custodian banks and may be obtained in the event of a default of the counterparty. Collateral is marked-to-market daily and maintained at a value at least equal to the principal amount of the repurchase agreement (including accrued interest).
3. Purchases and Sales of Investments.
Information regarding purchases and sales of securities is included under the caption "Other Information" at the end of the fund's Schedule of Investments.
4. Fees and Other Transactions with Affiliates.
Management Fee. FMR and its affiliates provide the fund with investment management related services for which the fund pays a monthly management fee. The management fee is the sum of an individual fund fee rate that is based on an annual rate of .45% of the fund's average net assets and a group fee rate that averaged .28% during the period. The group fee rate is based upon the average net assets of all the mutual funds advised by FMR. The group fee rate decreases as assets under management increase and increases as assets under management decrease. For the period, the total annual management fee rate was .73% of the fund's average net assets.
Distribution and Service Plan. In accordance with Rule 12b-1 of the 1940 Act, the Fund has adopted separate Distribution and Service Plans for each class of shares. Certain classes pay Fidelity Distributors Corporation (FDC), an affiliate of FMR, separate Distribution and Service Fees, each of which is based on an annual percentage of each class' average net assets. Class A and Class T Plans also authorize the use of brokerage commissions to pay distribution expenses. This practice has been discontinued and no commissions incurred after June 30, 2003 have been used to pay distribution expenses. In addition, FDC may pay financial intermediaries for selling shares of the fund and providing shareholder support services. For the period, the Distribution and Service Fee rates, the total amounts paid to and retained by FDC and the amount of distribution expenses paid with brokerage commissions were as follows:
| Distribution
Fee | Service
Fee | Paid to
FDC | Retained
by FDC | Paid with
Commissions |
Class A | -% | .25% | $ 48,344 | $ 5,982 | $ - |
Class T | .25% | .25% | 18,876 | - | - |
Class B | .75% | .25% | 31,516 | 23,636 | - |
Class C | .75% | .25% | 25,171 | 8,102 | - |
| | | $ 123,907 | $ 37,720 | $ - |
Annual Report
Notes to Financial Statements - continued
4. Fees and Other Transactions with Affiliates - continued
Sales Load. FDC receives a front-end sales charge of up to 5.75% for selling Class A shares, and 3.50% for selling Class T shares of the fund. FDC receives the proceeds of contingent deferred sales charges levied on Class A, Class T, Class B, and Class C redemptions. These charges depend on the holding period. The deferred sales charges range from 5% to 1% for Class B, 1% for Class C, and .25% for certain purchases of Class A and Class T shares.
For the period, sales charge amounts retained by FDC were as follows:
| Retained
by FDC | |
Class A | $ 5,594 | |
Class T | 1,632 | |
Class B* | 9,291 | |
Class C* | 3,770 | |
| $ 20,287 | |
* When Class B and Class C shares are initially sold, FDC pays commissions from its own resources to financial intermediaries through
which the sales are made.
Transfer Agent Fees. Fidelity Investments Institutional Operations Company, Inc. (FIIOC), an affiliate of FMR, is the transfer, dividend disbursing and shareholder servicing agent (collectively referred to as the transfer agent) for each class of the fund. FIIOC receives account fees and asset-based fees that vary according to the account size and type of account of the shareholders of the respective classes of the fund. FIIOC pays for typesetting, printing and mailing of all shareholder reports, except proxy statements. For the period, the following amounts were paid to FIIOC:
| Amount | % of
Average
Net Assets |
Class A | $ 63,635 | .33 |
Class T | 26,658 | .70 |
Class B | 20,447 | .64 |
Class C | 12,012 | .47 |
Institutional Class | 4,214 | .32 |
| $ 126,966 | |
Accounting Fees. Fidelity Service Company, Inc. (FSC), an affiliate of FMR, maintains the fund's accounting records. The fee is based on the level of average net assets for the month plus out-of-pocket expenses.
Annual Report
4. Fees and Other Transactions with Affiliates - continued
Central Funds. The fund may invest in affiliated Central Funds managed by Fidelity Investments Money Management, Inc. (FIMM), an affiliate of FMR. The Central Funds are open-end investment companies available only to investment companies and other accounts managed by FMR and its affiliates. The Central Funds seek preservation of capital and current income and do not pay a management fee. Income distributions earned by the fund are recorded as income in the accompanying financial statements and totaled $8,078 for the period.
Interfund Lending Program. Pursuant to an Exemptive Order issued by the SEC, the fund, along with other registered investment companies having management contracts with FMR, may participate in an interfund lending program. This program provides an alternative credit facility allowing the funds to borrow from, or lend money to, other participating funds. Information regarding the fund's participation in the program is included under the caption "Other Information" at the end of the fund's Schedule of Investments.
5. Committed Line of Credit.
The fund participates with other funds managed by FMR in a $3.5 billion credit facility (the "line of credit") to be utilized for temporary or emergency purposes to fund shareholder redemptions or for other short-term liquidity purposes. The fund has agreed to pay commitment fees on its pro rata portion of the line of credit. During the period, there were no borrowings on this line of credit.
Annual Report
Notes to Financial Statements - continued
6. Expense Reductions.
FMR agreed to reimburse the classes of the fund to the extent operating expenses exceeded certain levels of average net assets as noted in the table below. Some expenses, for example interest expense, are excluded from this reimbursement.
| Expense
Limitations | Reimbursement
from adviser |
| | |
Class A | 2.00% | $ 152,803 |
Class T | 2.25% | 44,179 |
Class B | 2.75% | 34,938 |
Class C | 2.75% | 23,604 |
Institutional Class | 1.75% | 10,207 |
| | $ 265,731 |
Many of the brokers with whom FMR places trades on behalf of the fund provided services to the fund in addition to trade execution. These services may include payments of expenses on behalf of the fund to support distribution of fund shares for Class A and Class T ("Distribution Expense Reduction") and to pay other fund expenses, such as transfer agent fees ("Other Expense Reduction") collectively referred to as "Brokerage Service Arrangements" in the accompanying table. Brokerage service arrangements generally benefits all shareholders of each class by reducing fund expenses. Each of Class A and Class T shareholders' Other Expense Reduction benefit is reduced by the amount of any Distribution Expense Reduction.
| Brokerage Service Arrangements |
| Distribution
expense
reduction | Other
expense
reduction |
| | |
Fund Level | $ - | $ 629 |
Annual Report
7. Share Transactions.
Transactions for each class of shares were as follows:
| Shares | Dollars |
Years ended October 31, | 2003 | 2002 | 2003 | 2002 |
Class A | | | | |
Shares sold | 2,472,329 | 1,558,955 | $ 25,555,609 | $ 17,017,475 |
Shares redeemed | (2,475,129) | (1,691,949) | (26,094,442) | (18,896,118) |
Net increase (decrease) | (2,800) | (132,994) | $ (538,833) | $ (1,878,643) |
Class T | | | | |
Shares sold | 615,784 | 306,332 | $ 6,405,610 | $ 3,507,758 |
Shares redeemed | (673,227) | (175,919) | (6,940,401) | (1,903,003) |
Net increase (decrease) | (57,443) | 130,413 | $ (534,791) | $ 1,604,755 |
Class B | | | | |
Shares sold | 262,810 | 136,244 | $ 2,867,284 | $ 1,467,888 |
Shares redeemed | (143,990) | (121,792) | (1,478,097) | (1,276,878) |
Net increase (decrease) | 118,820 | 14,452 | $ 1,389,187 | $ 191,010 |
Class C | | | | |
Shares sold | 354,068 | 353,152 | $ 3,792,883 | $ 3,841,374 |
Shares redeemed | (222,119) | (263,600) | (2,208,742) | (2,864,649) |
Net increase (decrease) | 131,949 | 89,552 | $ 1,584,141 | $ 976,725 |
Institutional Class | | | | |
Shares sold | 554,755 | 574,658 | $ 5,910,359 | $ 6,068,713 |
Shares redeemed | (505,917) | (578,457) | (5,664,848) | (6,223,877) |
Net increase (decrease) | 48,838 | (3,799) | $ 245,511 | $ (155,164) |
Annual Report
Report of Independent Auditors
To the Trustees of Fidelity Advisor Series VIII and the Shareholders of Fidelity Advisor Emerging Asia Fund.
In our opinion, the accompanying statement of assets and liabilities, including the schedule of investments, and the related statements of operations and of changes in net assets and the financial highlights present fairly, in all material respects, the financial position of Fidelity Advisor Emerging Asia Fund (a fund of Fidelity Advisor Series VIII) at October 31, 2003 and the results of its operations, the changes in its net assets and the financial highlights for the periods indicated, in conformity with accounting principles generally accepted in the United States of America. These financial statements and financial highlights (hereafter referred to as "financial statements") are the responsibility of the Fidelity Advisor Emerging Asia Fund's management; our responsibility is to express an opinion on these financial statements based on our audits. We conducted our audits of these financial statements in accordance with auditing standards generally accepted in the United States of America which require that we plan and perform the audit to obtain reasonable assurance about whether the financial statements are free of material misstatement. An audit includes examining, on a test basis, evidence supporting the amounts and disclosures in the financial statements, assessing the accounting principles used and significant estimates made by management, and evaluating the overall financial statement presentation. We believe that our audits, which included confirmation of securities at October 31, 2003 by correspondence with the custodian and brokers, provide a reasonable basis for our opinion.
/s/PricewaterhouseCoopers LLP
PricewaterhouseCoopers LLP
Boston, Massachusetts
December 12, 2003
Annual Report
Trustees and Officers
The Trustees, Members of the Advisory Board, and executive officers of the trust and fund, as applicable, are listed below. The Board of Trustees governs the fund and is responsible for protecting the interests of shareholders. The Trustees are experienced executives who meet periodically throughout the year to oversee the fund's activities, review contractual arrangements with companies that provide services to the fund, and review the fund's performance. Except for William O. McCoy, each of the Trustees oversees 289 funds advised by FMR or an affiliate. Mr. McCoy oversees 291 funds advised by FMR or an affiliate.
The Trustees hold office without limit in time except that (a) any Trustee may resign; (b) any Trustee may be removed by written instrument, signed by at least two-thirds of the number of Trustees prior to such removal; (c) any Trustee who requests to be retired or who has become incapacitated by illness or injury may be retired by written instrument signed by a majority of the other Trustees; and (d) any Trustee may be removed at any special meeting of shareholders by a two-thirds vote of the outstanding voting securities of the trust. In any event, each non-interested Trustee shall retire not later than the last day of the calendar year in which his or her 72nd birthday occurs. The executive officers and Advisory Board Members hold office without limit in time, except that any officer and Advisory Board Member may resign or may be removed by a vote of a majority of the Trustees at any regular meeting or any special meeting of the Trustees. Except as indicated, each individual has held the office shown or other offices in the same company for the past five years.
The fund's Statement of Additional Information (SAI) includes more information about the Trustees. To request a free copy, call Fidelity at 1-877-208-0098.
Interested Trustees*:
Correspondence intended for each Trustee who is an "interested person" (as defined in the 1940 Act) may be sent to 82 Devonshire Street, Boston, Massachusetts 02109.
Name, Age; Principal Occupation |
Edward C. Johnson 3d (73)** |
| Year of Election or Appointment: 1983 Mr. Johnson is Chairman of the Board of Trustees. Mr. Johnson serves as Chief Executive Officer, Chairman, and a Director of FMR Corp.; a Director and Chairman of the Board and of the Executive Committee of FMR; Chairman and a Director of Fidelity Management & Research (Far East) Inc.; Chairman (1998) and a Director of Fidelity Investments Money Management, Inc.; and Chairman (2001) and a Director (2000) of FMR Co., Inc. |
Abigail P. Johnson (41)** |
| Year of Election or Appointment: 2001 Senior Vice President of Advisor Emerging Asia (2001). Ms. Johnson also serves as Senior Vice President of other Fidelity funds (2001). She is President and a Director of FMR (2001), Fidelity Investments Money Management, Inc. (2001), FMR Co., Inc. (2001), and a Director of FMR Corp. Previously, Ms. Johnson managed a number of Fidelity funds. |
Laura B. Cronin (49) |
| Year of Election or Appointment: 2003 Ms. Cronin is an Executive Vice President (2002) and Chief Financial Officer (2002) of FMR Corp. and is a member of the Fidelity Management Committee (2003). Previously, Ms. Cronin served as Vice President of Finance of FMR (1997-1999), and Chief Financial Officer of FMR (1999-2001), Fidelity Personal Investments (2001), and Fidelity Brokerage Company (2001-2002). |
Robert L. Reynolds (51) |
| Year of Election or Appointment: 2003 Mr. Reynolds is a Director (2003) and Chief Operating Officer (2002) of FMR Corp. and is the head of the Fidelity Management Committee (2003). He also serves on the Board at Fidelity Investments Canada, Ltd. (2000). Previously, Mr. Reynolds served as President of Fidelity Investments Institutional Retirement Group (1996-2000). |
* Trustees have been determined to be "Interested Trustees" by virtue of, among other things, their affiliation with the trust or various entities under common control with FMR.
** Edward C. Johnson 3d, Trustee, is Abigail P. Johnson's father.
Annual Report
Non-Interested Trustees:
Correspondence intended for each non-interested Trustee (that is, the Trustees other than the Interested Trustees) may be sent to Fidelity Investments, P.O. Box 55235, Boston, Massachusetts 02205-5235.
Name, Age; Principal Occupation |
J. Michael Cook (61) |
| Year of Election or Appointment: 2001 Prior to Mr. Cook's retirement in May 1999, he served as Chairman and Chief Executive Officer of Deloitte & Touche LLP (accounting/consulting), Chairman of the Deloitte & Touche Foundation, and a member of the Board of Deloitte Touche Tohmatsu. He currently serves as a Director of Comcast (telecommunications, 2002), International Flavors & Fragrances, Inc. (2000), Rockwell Automation (2000) and The Dow Chemical Company (2000). He is a Member of the Diversity Advisory Council of Marakon (2003) and the Advisory Board of the Directorship Search Group, Chairman Emeritus of the Board of Catalyst (a leading organization for the advancement of women in business), and is Chairman of the Accountability Advisory Council to the Comptroller General of the United States. He also serves as a Member of the Advisory Board of the Graduate School of Business of the University of Florida, his alma mater. |
Ralph F. Cox (71) |
| Year of Election or Appointment: 1991 Mr. Cox is President of RABAR Enterprises (management consulting for the petroleum industry). Prior to February 1994, he was President of Greenhill Petroleum Corporation (petroleum exploration and production). Until March 1990, Mr. Cox was President and Chief Operating Officer of Union Pacific Resources Company (exploration and production). He is a Director of CH2M Hill Companies (engineering), and Abraxas Petroleum (petroleum exploration and production, 1999). In addition, he is a member of advisory boards of Texas A&M University and the University of Texas at Austin. |
Phyllis Burke Davis (71) |
| Year of Election or Appointment: 1992 Mrs. Davis is retired from Avon Products, Inc. (consumer products) where she held various positions including Senior Vice President of Corporate Affairs and Group Vice President of U.S. product marketing, sales, distribution, and manufacturing. Mrs. Davis is a member of the Board of Directors of the Southampton Hospital in Southampton, N.Y. (1998). Previously, she served as a Director of BellSouth Corporation (telecommunications), Eaton Corporation (diversified industrial), the TJX Companies, Inc. (retail stores), Hallmark Cards, Inc., and Nabisco Brands, Inc. |
Robert M. Gates (60) |
| Year of Election or Appointment: 1997 Dr. Gates is President of Texas A&M University (2002). He was Director of the Central Intelligence Agency (CIA) from 1991 to 1993. From 1989 to 1991, Dr. Gates served as Assistant to the President of the United States and Deputy National Security Advisor. Dr. Gates is a Director of NACCO Industries, Inc. (mining and manufacturing), and Parker Drilling Co., Inc. (drilling and rental tools for the energy industry, 2001). He also serves as a member of the Advisory Board of VoteHere.net (secure internet voting, 2001). Previously, Dr. Gates served as a Director of LucasVarity PLC (automotive components and diesel engines), a Director of TRW Inc. (automotive, space, defense, and information technology), and Dean of the George Bush School of Government and Public Service at Texas A&M University (1999-2001). Dr. Gates also is a Trustee of the Forum for International Policy. |
Donald J. Kirk (70) |
| Year of Election or Appointment: 1987 Mr. Kirk is a Governor of the American Stock Exchange (2001), a Trustee and former Chairman of the Board of Trustees of the Greenwich Hospital Association, a Director of the Yale-New Haven Health Services Corp. (1998), and a Director Emeritus and former Chairman of the Board of Directors of National Arts Strategies Inc. Mr. Kirk was an Executive-in-Residence (1995-2000) and a Professor (1987-1995) at Columbia University Graduate School of Business. Prior to 1987, he was Chairman of the Financial Accounting Standards Board. Previously, Mr. Kirk served as a Governor of the National Association of Securities Dealers, Inc. (1996-2002), a member and Vice Chairman of the Public Oversight Board of the American Institute of Certified Public Accountants' SEC Practice Section (1995-2002), a Director of General Re Corporation (reinsurance, 1987-1998) and as a Director of Valuation Research Corp. (appraisals and valuations). |
Marie L. Knowles (57) |
| Year of Election or Appointment: 2001 Prior to Ms. Knowles' retirement in June 2000, she served as Executive Vice President and Chief Financial Officer of Atlantic Richfield Company (ARCO) (diversified energy, 1996-2000). From 1993 to 1996, she was a Senior Vice President of ARCO and President of ARCO Transportation Company. She served as a Director of ARCO from 1996 to 1998. She currently serves as a Director of Phelps Dodge Corporation (copper mining and manufacturing), URS Corporation (multidisciplinary engineering, 1999), and McKesson Corporation (healthcare service, 2002). Ms. Knowles is a Trustee of the Brookings Institution and the Catalina Island Conservancy and also serves as a member of the Advisory Board for the School of Engineering of the University of Southern California. |
Ned C. Lautenbach (59) |
| Year of Election or Appointment: 2000 Mr. Lautenbach has been a partner of Clayton, Dubilier & Rice, Inc. (private equity investment firm) since September 1998. Previously, Mr. Lautenbach was with the International Business Machines Corporation (IBM) from 1968 until his retirement in 1998. He was most recently Senior Vice President and Group Executive of Worldwide Sales and Services. From 1993 to 1995, he was Chairman of IBM World Trade Corporation, and from 1994 to 1998 was a member of IBM's Corporate Executive Committee. Mr. Lautenbach serves as Chairman and as a Director (1998) of Acterna Corporation (communications test equipment). He is also Co-Chairman of Covansys, Inc. (global provider of business and technology solutions, 2000). In addition, he is a Director of Eaton Corporation (diversified industrial) and the Philharmonic Center for the Arts in Naples, Florida (1999). He also is a member of the Council on Foreign Relations. |
Marvin L. Mann (70) |
| Year of Election or Appointment: 1993 Mr. Mann is Chairman of the non-interested Trustees (2001). He is Chairman Emeritus of Lexmark International, Inc. (computer peripherals) where he served as CEO until April 1998 and retired as Chairman May 1999, and remains a member of the Board. Prior to 1991, he held the positions of Vice President of International Business Machines Corporation (IBM) and President and General Manager of various IBM divisions and subsidiaries. Mr. Mann is a Board member of Imation Corp. (imaging and information storage) and Acterna Corporation (communications test equipment, 1999). He is also a member of the Director Services Committee of the Investment Company Institute. In addition, Mr. Mann is a member of the President's Cabinet at the University of Alabama and the Board of Visitors of the Culverhouse College of Commerce and Business Administration at the University of Alabama. |
William O. McCoy (70) |
| Year of Election or Appointment: 1997 Prior to his retirement in December 1994, Mr. McCoy was Vice Chairman of the Board of BellSouth Corporation (telecommunications) and President of BellSouth Enterprises. He is currently a Director of Liberty Corporation (holding company), Duke Realty Corporation (real estate), Progress Energy, Inc. (electric utility), and Acterna Corporation (communications test equipment, 1999). He is also a partner of Franklin Street Partners (private investment management firm) and a member of the Research Triangle Foundation Board. In addition, Mr. McCoy served as the Interim Chancellor (1999-2000) and a member of the Board of Visitors (1994-1998) for the University of North Carolina at Chapel Hill and currently serves on the Board of Directors of the University of North Carolina Health Care System and the Board of Visitors of the Kenan-Flagler Business School (University of North Carolina at Chapel Hill). He also served as Vice President of Finance for the University of North Carolina (16-school system, 1995-1998). |
William S. Stavropoulos (64) |
| Year of Election or Appointment: 2001 Mr. Stavropoulos is Chairman of the Board, President and CEO (2002), and Chairman of the Executive Committee (2000) and a Director of The Dow Chemical Company. Since joining The Dow Chemical Company in 1967, Mr. Stavropoulos served in numerous senior management positions, including President (1993-2000) and Chief Executive Officer (1995-2000). Currently, he is a Director of NCR Corporation (data warehousing and technology solutions), BellSouth Corporation (telecommunications), Chemical Financial Corporation, and Maersk Inc. (industrial conglomerate, 2002). He also serves as a member of the Board of Trustees of the American Enterprise Institute for Public Policy Research. In addition, Mr. Stavropoulos is a member of The Business Council, J.P. Morgan International Council, World Business Council for Sustainable Development, and the University of Notre Dame Advisory Council for the College of Science. |
Annual Report
Trustees and Officers - continued
Advisory Board Members and Executive Officers:
Correspondence intended for Dr. Heilmeier may be sent to Fidelity Investments, P.O. Box 55235, Boston, Massachusetts 02205-5235. Correspondence intended for each executive officer and Mr. Lynch may be sent to 82 Devonshire Street, Boston, Massachusetts 02109.
Name, Age; Principal Occupation |
George H. Heilmeier (67) |
| Year of Election or Appointment: 2003 Member of the Advisory Board of Fidelity Advisor Series VIII. Dr. Heilmeier is Chairman Emeritus of Telcordia Technologies (communication software and systems), where prior to his retirement, he served as company Chairman and Chief Executive Officer. He currently serves on the Boards of Directors of The Mitre Corporation (systems engineering and information technology support for the government), INET Technologies Inc. (telecommunications network surveillance, 2001) and Teletech Holdings (customer management services, 1998). He is Chairman of the General Motors Technology Advisory Committee and a Life Fellow of the IEEE (2000). Dr. Heilmeier is a member of the Defense Science Board and the National Security Agency Advisory Board. He is also a member of the National Academy of Engineering, the American Academy of Arts and Sciences and The Board of Overseers of the School of Engineering and Applied Science of the University of Pennsylvania. Previously, Dr. Heilmeier served as a Director of TRW Inc. (automotive, space, defense, and information technology, 1992-2002) and Compaq (1994-2002). |
Peter S. Lynch (60) |
| Year of Election or Appointment: 2003 Member of the Advisory Board of Fidelity Advisor Series VIII. Vice Chairman and a Director of FMR, and Vice Chairman (2001) and a Director (2000) of FMR Co., Inc. Previously, Mr. Lynch served as a Trustee of the Fidelity funds (1990-2003). Prior to May 31, 1990, he was a Director of FMR and Executive Vice President of FMR (a position he held until March 31, 1991), Vice President of Fidelity Magellan Fund and FMR Growth Group Leader, and Managing Director of FMR Corp. Mr. Lynch was also Vice President of Fidelity Investments Corporate Services. In addition, he serves as a Trustee of Boston College, Massachusetts Eye & Ear Infirmary, Historic Deerfield, John F. Kennedy Library, and the Museum of Fine Arts of Boston. |
Philip L. Bullen (44) |
| Year of Election or Appointment: 2001 Vice President of Advisor Emerging Asia. Mr. Bullen also serves as Vice President of certain Equity Funds (2001) and certain High Income Funds (2001). He is Senior Vice President of FMR (2001) and FMR Co., Inc. (2001), President and a Director of Fidelity Management & Research (Far East) Inc. (2001), President and a Director of Fidelity Management & Research (U.K.) Inc. (2002), and a Director of Strategic Advisers, Inc. (2002). Before joining Fidelity Investments, Mr. Bullen was President and Chief Investment Officer of Santander Global Advisors (1997-2000) and President and Chief Executive Officer of Boston's Baring Asset Management Inc. (1994-1997). |
Eric D. Roiter (54) |
| Year of Election or Appointment: 1998 Secretary of Advisor Emerging Asia. He also serves as Secretary of other Fidelity funds (1998); Vice President, General Counsel, and Clerk of FMR Co., Inc. (2001) and FMR (1998); Vice President and Clerk of FDC (1998); Assistant Clerk of Fidelity Management & Research (U.K.) Inc. (2001) and Fidelity Management & Research (Far East) Inc. (2001); and Assistant Secretary of Fidelity Investments Money Management Inc. (2001). Prior to joining Fidelity, Mr. Roiter was with the law firm of Debevoise & Plimpton, as an associate (1981-1984) and as a partner (1985-1997), and served as an Assistant General Counsel of the U.S. Securities and Exchange Commission (1979-1981). Mr. Roiter is an Adjunct Member, Faculty of Law, at Boston College Law School (2003). |
Stuart Fross (44) |
| Year of Election or Appointment: 2003 Assistant Secretary of Advisor Emerging Asia. Mr. Fross also serves as Assistant Secretary of other Fidelity funds (2003) and is an employee of FMR. |
Maria F. Dwyer (44) |
| Year of Election or Appointment: 2002 President and Treasurer of Advisor Emerging Asia. Ms. Dwyer also serves as President and Treasurer of other Fidelity funds (2002) and is a Vice President (1999) and an employee (1996) of FMR. Prior to joining Fidelity, Ms. Dwyer served as Director of Compliance for MFS Investment Management. |
Timothy F. Hayes (52) |
| Year of Election or Appointment: 2002 Chief Financial Officer of Advisor Emerging Asia. Mr. Hayes also serves as Chief Financial Officer of other Fidelity funds (2002). Recently he was appointed President of Fidelity Service Company (2003) where he also serves as a Director. Mr. Hayes also serves as President of Fidelity Investments Operations Group (FIOG, 2002), which includes Fidelity Pricing and Cash Management Services Group (FPCMS), where he was appointed President in 1998. Previously, Mr. Hayes served as Chief Financial Officer of Fidelity Investments Corporate Systems and Service Group (1998) and Fidelity Systems Company (1997-1998). |
John R. Hebble (45) |
| Year of Election or Appointment: 2003 Deputy Treasurer of Advisor Emerging Asia. Mr. Hebble also serves as Deputy Treasurer of other Fidelity funds (2003), and is an employee of FMR. Before joining Fidelity Investments, Mr. Hebble worked at Deutsche Asset Management where he served as Director of Fund Accounting (2002-2003) and Assistant Treasurer of the Scudder Funds (1998-2003). |
John H. Costello (57) |
| Year of Election or Appointment: 1994 Assistant Treasurer of Advisor Emerging Asia. Mr. Costello also serves as Assistant Treasurer of other Fidelity funds and is an employee of FMR. |
Francis V. Knox, Jr. (56) |
| Year of Election or Appointment: 2002 Assistant Treasurer of Advisor Emerging Asia. Mr. Knox also serves as Assistant Treasurer of other Fidelity funds (2002), and is a Vice President and an employee of FMR. Previously, Mr. Knox served as Vice President of Investment & Advisor Compliance (1990-2001), and Compliance Officer of Fidelity Management & Research (U.K.) Inc. (1992-2002), Fidelity Management & Research (Far East) Inc. (1991-2002), and FMR Corp. (1995-2002). |
Mark Osterheld (48) |
| Year of Election or Appointment: 2002 Assistant Treasurer of Advisor Emerging Asia. Mr. Osterheld also serves as Assistant Treasurer of other Fidelity funds (2002) and is an employee of FMR. |
Thomas J. Simpson (45) |
| Year of Election or Appointment: 2000 Assistant Treasurer of Advisor Emerging Asia. Mr. Simpson is Assistant Treasurer of other Fidelity funds (2000) and an employee of FMR (1996). Prior to joining FMR, Mr. Simpson was Vice President and Fund Controller of Liberty Investment Services (1987-1995). |
Annual Report
Annual Report
Annual Report
Annual Report
Investment Adviser
Fidelity Management & Research Company
Boston, MA
Investment Sub-Advisers
FMR Co., Inc.
Fidelity Management & Research
(U.K.) Inc.
Fidelity Management & Research
(Far East) Inc.
Fidelity International
Investment Advisors
Fidelity Investments Japan Limited
Fidelity International Investment Advisors (U.K.) Limited
General Distributor
Fidelity Distributors Corporation
Boston, MA
Transfer and Shareholder
Servicing Agents
Fidelity Investments Institutional Operations Company, Inc.
Boston, MA
Custodian
Brown Brothers Harriman & Co.
Boston, MA
Annual Report
Fidelity Advisor Aggressive Growth Fund |
Fidelity Advisor Asset Allocation Fund |
Fidelity Advisor Balanced Fund |
Fidelity Advisor Biotechnology Fund |
Fidelity Advisor California Municipal Income Fund |
Fidelity Advisor Consumer Industries Fund |
Fidelity Advisor Cyclical Industries Fund |
Fidelity Advisor Developing Communications Fund |
Fidelity Advisor Diversified International Fund |
Fidelity Advisor Dividend Growth Fund |
Fidelity Advisor Dynamic Capital Appreciation Fund |
Fidelity Advisor Electronics Fund |
Fidelity Advisor Emerging Asia Fund |
Fidelity Advisor Emerging Markets Income Fund |
Fidelity Advisor Equity Growth Fund |
Fidelity Advisor Equity Income Fund |
Fidelity Advisor Equity Value Fund |
Fidelity Advisor Europe Capital Appreciation Fund |
Fidelity Advisor Fifty Fund |
Fidelity Advisor Financial Services Fund |
Fidelity Advisor Floating Rate High Income Fund |
Fidelity Advisor Freedom Income FundSM |
Fidelity Advisor Freedom 2010 FundSM |
Fidelity Advisor Freedom 2020 FundSM |
Fidelity Advisor Freedom 2030 FundSM |
Fidelity Advisor Freedom 2040 FundSM |
Fidelity Advisor Global Equity Fund |
Fidelity Advisor Government Investment Fund |
Fidelity Advisor Growth & Income Fund |
Fidelity Advisor Growth Opportunities |
Fidelity Advisor Health Care Fund |
Fidelity Advisor High Income Advantage Fund |
Fidelity Advisor High Income Fund |
Fidelity Advisor Inflation-Protected Bond Fund |
Fidelity Advisor Intermediate Bond Fund |
Fidelity Advisor International Capital Appreciation Fund |
Fidelity Advisor International Small Cap Fund |
Fidelity Advisor Investment Grade Bond Fund |
Fidelity Advisor Japan Fund |
Fidelity Advisor Korea Fund |
Fidelity Advisor Large Cap Fund |
Fidelity Advisor Latin America Fund |
Fidelity Advisor Leveraged Company Stock Fund |
Fidelity Advisor Mid Cap Fund |
Fidelity Advisor Mortgage Securities Fund |
Fidelity Advisor Municipal Income Fund |
Fidelity Advisor Natural Resources Fund |
Fidelity Advisor New Insights Fund |
Fidelity Advisor New York Municipal Income Fund |
Fidelity Advisor Overseas Fund |
Fidelity Advisor Real Estate Fund |
Fidelity Advisor Short Fixed-Income Fund |
Fidelity Advisor Short Intermediate Municipal Income Fund |
Fidelity Advisor Small Cap Fund |
Fidelity Advisor Strategic Growth Fund |
Fidelity Advisor Strategic Income Fund |
Fidelity Advisor Tax Managed
Stock Fund |
Fidelity Advisor Technology Fund |
Fidelity Advisor Telecommunications & Utilities Growth Fund |
Fidelity Advisor Value Leaders Fund |
Fidelity Advisor Value Strategies Fund |
Prime Fund |
Tax-Exempt Fund |
Treasury Fund |
(Fidelity Investment logo)(registered trademark)
Corporate Headquarters
82 Devonshire St., Boston, MA 02109
www.fidelity.com
AEA-UANN-1203
1.784737.100
Fidelity® Advisor
Emerging Asia
Fund - Institutional Class
Annual Report
October 31, 2003
(2_fidelity_logos) (Registered_Trademark)
Contents
Chairman's Message | <Click Here> | Ned Johnson's message to shareholders. |
Performance | <Click Here> | How the fund has done over time. |
Management's Discussion | <Click Here> | The manager's review of fund performance, strategy and outlook. |
Investment Changes | <Click Here> | A summary of major shifts in the fund's investments over the past six months. |
Investments | <Click Here> | A complete list of the fund's investments with their market values. |
Financial Statements | <Click Here> | Statements of assets and liabilities, operations, and changes in net assets,
as well as financial highlights. |
Notes | <Click Here> | Notes to the financial statements. |
Auditors' Opinion | <Click Here> | |
Trustees and Officers | <Click Here> | |
| | |
| | |
For a free copy of the fund's proxy voting guidelines call 1-877-208-0098 or visit the Securities and Exchange Commission (SEC)'s web site at www.sec.gov.
Third party marks appearing herein are the property of their respective owners.
All other marks appearing herein are registered or unregistered trademarks or service marks of FMR Corp. or an affiliated company.
(Recycle graphic) This report is printed on recycled paper using soy-based inks.
This report and the financial statements contained herein are submitted for the general information of the shareholders of the fund. This report is not authorized for distribution to prospective investors in the fund unless preceded or accompanied by an effective prospectus.
Mutual fund shares are not deposits or obligations of, or guaranteed by, any depository institution. Shares are not insured by the FDIC, Federal Reserve Board or any other agency, and are subject to investment risks, including possible loss of principal amount invested.
Neither the fund nor Fidelity Distributors Corporation is a bank.
For more information on any Fidelity Advisor fund, including charges and expenses, contact your investment professional for a free prospectus. Read it carefully before you invest or send money.
Chairman's Message
(photo_of_Edward_C_Johnson_3d)
Dear Shareholder:
Many of you have read or heard news stories recently that were critical of mutual funds and made allegations that the mutual fund industry has been less than forthright. I find these reports unsettling and not necessarily an accurate picture of the overall industry, and I would like you to know where we at Fidelity stand.
With specific regard to allegations that certain mutual fund companies were violating the Securities and Exchange Commission's forward pricing rules or were involved in so-called "market timing" activities, I want to say two things:
First, Fidelity does not have agreements that permit customers who buy fund shares after 4 p.m. to obtain the 4 p.m. price. This is not to say that someone could not deceive the company through fraudulent acts. But I underscore that we have no so-called "agreements" which would permit this illegal practice.
Second, Fidelity has been on record for years opposing predatory short-term trading which adversely affects other shareholders in a mutual fund. In fact, in the 1980s, we began charging a fee - which is returned to the fund and, therefore, to investors - to discourage this activity. What's more, several years ago we took the industry lead in developing a Fair Value Pricing Policy to prevent market timing on foreign securities in our funds. It is reasonable to assume that another structure can be developed that would alter the system to make it much more difficult for predatory traders to operate. This, however, will only be achieved through close cooperation among regulators, legislators and the industry.
Certainly no industry is perfect, and there have been instances of unethical and illegal activity from time to time within the mutual fund industry. When this occurs, confessed or convicted offenders should be dealt with appropriately. Clearly, every system can be improved. We applaud well thought out improvements by regulators, legislators and industry representatives that achieve the common goal of building and protecting the value of investors' holdings. But we remain concerned about the risk of over-regulation and the quick application of simplistic solutions to intricate problems.
For more than 57 years, Fidelity Investments has worked very hard to improve its products and service to justify your trust. When our family founded this company in 1946, we had only a few hundred customers. Many of them were family and friends. Today, we serve more than 18 million customers including individual investors and participants in retirement plans across America.
Let me close by saying that we do not take your trust in us for granted, and we realize that we must always work to improve all aspects of our service to you. In turn, we urge you to continue your active participation with your financial matters, so that your interests can be well served.
Annual Report
Best regards,
/s/Edward C. Johnson 3d
Edward C. Johnson 3d
Annual Report
Performance: The Bottom Line
Average annual total return reflects the change in the value of an investment, assuming reinvestment of the class' dividend income and capital gains (the profits earned upon the sale of securities that have grown in value) and assuming a constant rate of performance each year. During periods of reimbursement by Fidelity, a fund's total return will be greater than it would be had the reimbursement not occurred. The $10,000 table and the fund's returns do not reflect the deduction of taxes that a shareholder would pay on fund distributions or the redemption of fund shares. How a fund did yesterday is no guarantee of how it will do tomorrow.
Average Annual Total Returns
Periods ended October 31, 2003 | | Past 1
year | Past 5
years | Life of
fund |
Institutional Class A | | 32.40% | 6.55% | 0.16% |
A Institutional Class shares are sold to eligible investors without a sales load or 12b-1 fee. Returns between March 25, 1994 and June 16, 1999 are those of Fidelity Advisor Emerging Asia Fund, Inc., the Closed-End Fund. On June 15, 1999, the Closed-End Fund reorganized as an open-end fund through a transfer of all its assets and liabilities to Fidelity Advisor Emerging Asia Fund (the fund). Shareholders of the Closed-End Fund received Class A shares of the fund in exchange for their shares of the Closed-End Fund. If the effect of Institutional Class expenses was reflected, returns may be lower than shown because Institutional Class shares of the fund may have higher total expenses than the Closed-End Fund.
Annual Report
$10,000 Over Life of Fund
Let's say hypothetically that $10,000 was invested in Fidelity® Advisor Emerging Asia Fund - Institutional Class on March 25, 1994, when the Closed-End Fund started. The chart shows how the value of your investment would have grown, and also shows how the Morgan Stanley Capital InternationalSM AC Asia Free ex Japan did over the same period.

Annual Report
Management's Discussion of Fund Performance
Comments from Yosawadee Polcharoen, Portfolio Manager of Fidelity® Advisor Emerging Asia Fund
Emerging Asian equity markets were among the world's best performers during the year that ended October 31, 2003. In that time, each country represented in the Morgan Stanley Capital InternationalSM (MSCI®) All Country Asia Free ex Japan Index - a performance benchmark of Asian emerging markets, excluding Japan - returned in excess of 23% in U.S. dollar terms, and the index as a whole advanced 38.86%. Emerging Asian markets were boosted by the improving global economy, a pickup in export growth and a recovery from the SARS epidemic. In terms of individual performance, some of the nations with the smallest exposure in the index had the biggest returns. China, which displayed unexpected resilience to the SARS-related slowdown, represented about 3.5% of the index on average and gained more than 108%, while Thailand, accounting for about 2.5% of the index, advanced 87%. South Korea - the largest index component at 26% on average - underperformed as its economy slipped into a recession. Hong Kong, the benchmark's second-largest weighting, also underperformed despite gaining nearly 35%.
During the 12 months ending October 31, 2003, the fund's Institutional Class shares returned 32.40%, trailing the Morgan Stanley Capital International All Country Asia Free ex Japan Index. The fund also lagged the LipperSM Pacific Region ex Japan Funds Average, which posted a 37.16% return. An overweighting in the South Korean market, most notably in consumer and banking stocks, hurt performance. Consumer stocks, including CJ Home Shopping, were sidetracked by slowing credit growth and weak domestic consumption. Meanwhile, Korean banking stocks lagged due to high default rates on credit card debt. In the export group, Korean electronics firm Samsung Electro-Mechanics was hampered by sluggish demand for the company's electronics products. Conversely, overweighting India and Thailand, both of which outperformed the benchmark, helped performance. Indian auto manufacturer Tata Motors returned 182% due to robust domestic demand. Also helping was Siam Cement, Thailand's leading construction material company, whose 131% return was driven by strong demand from real estate and infrastructure development.
The views expressed in this statement reflect those of the portfolio manager only through the end of the period of the report as stated on the cover and do not necessarily represent the views of Fidelity or any other person in the Fidelity organization. Any such views are subject to change at any time based upon market or other conditions and Fidelity disclaims any responsibility to update such views. These views may not be relied on as investment advice and, because investment decisions for a Fidelity fund are based on numerous factors, may not be relied on as an indication of trading intent on behalf of any Fidelity fund.
Annual Report
Investment Changes
Top Ten Stocks as of October 31, 2003 |
| % of fund's
net assets | % of fund's net assets
6 months ago |
Samsung Electronics Co. Ltd. | 9.4 | 9.4 |
Taiwan Semiconductor Manufacturing Co. Ltd. | 3.5 | 3.4 |
Hutchison Whampoa Ltd. | 2.9 | 2.7 |
HSBC Holdings PLC (Hong Kong) (Reg.) | 2.8 | 3.5 |
Sun Hung Kai Properties Ltd. | 2.4 | 1.5 |
Cheung Kong Holdings Ltd. | 2.3 | 1.9 |
Li & Fung Ltd. | 2.2 | 1.5 |
Kookmin Bank | 2.1 | 1.8 |
United Overseas Bank Ltd. | 1.9 | 2.2 |
LG Electronics, Inc. | 1.9 | 2.2 |
| 31.4 | |
Top Five Market Sectors as of October 31, 2003 |
| % of fund's
net assets | % of fund's net assets
6 months ago |
Financials | 29.9 | 25.5 |
Information Technology | 28.7 | 21.6 |
Consumer Discretionary | 12.6 | 8.7 |
Materials | 10.3 | 13.0 |
Energy | 4.9 | 7.2 |
Asset Allocation (% of fund's net assets) |
As of October 31, 2003 | As of April 30, 2003 |
| Stocks 97.9% | | | Stocks 93.0% | |
| Short-Term
Investments and
Net Other Assets 2.1% | | | Short-Term
Investments and
Net Other Assets 7.0% | |

Annual Report
Investments October 31, 2003
Showing Percentage of Net Assets
Common Stocks - 95.7% |
| Shares | | Value (Note 1) |
Bermuda - 1.3% |
Skyworth Digital Holdings Ltd. | 2,138,000 | | $ 528,608 |
China - 5.1% |
China Petroleum & Chemical Corp. (H Shares) | 1,506,000 | | 499,375 |
Guangdong Kelon Electrical Holdings Ltd. Series H (a) | 339,000 | | 142,967 |
Harbin Power Equipment Co. Ltd. (H Shares) | 386,000 | | 94,939 |
Nanjing Panda Electronics Co. (H Shares) (a) | 180,000 | | 52,733 |
PetroChina Co. Ltd. (H Shares) | 1,634,000 | | 594,423 |
PICC Property & Casualty Co. Ltd. (H Shares) | 86,000 | | 20,136 |
Sinopec Shanghai Petrochemical Co. Ltd. (H Shares) | 1,466,000 | | 415,319 |
Tianjin Capital Environmental Protection Co. Ltd. (H Shares) | 254,000 | | 70,323 |
Zhenhai Refining & Chemical Co. (H Shares) | 274,000 | | 167,598 |
TOTAL CHINA | | 2,057,813 |
Hong Kong - 20.0% |
ASM Pacific Technology Ltd. | 25,500 | | 95,392 |
Bank of East Asia Ltd. | 141,600 | | 423,035 |
BOC Hong Kong Holdings Ltd. | 237,500 | | 411,349 |
Cheung Kong Holdings Ltd. | 112,000 | | 933,862 |
China Everbright Ltd. | 306,000 | | 168,454 |
China Merchants Holdings International Co. Ltd. | 162,000 | | 219,043 |
Denway Motors Ltd. | 338,000 | | 278,562 |
Elec & Eltek International Holdings Ltd. | 106,000 | | 19,792 |
Esprit Holdings Ltd. | 121,000 | | 380,190 |
Hang Seng Bank Ltd. | 55,000 | | 687,004 |
Hong Kong & China Gas Co. Ltd. | 258,400 | | 357,706 |
Hutchison Whampoa Ltd. | 151,000 | | 1,171,545 |
Li & Fung Ltd. | 530,000 | | 890,659 |
PCCW Ltd. (a) | 372,000 | | 265,865 |
Sun Hung Kai Properties Ltd. | 116,000 | | 982,152 |
Swire Pacific Ltd. (A Shares) | 82,500 | | 503,567 |
Wharf Holdings Ltd. | 114,000 | | 286,997 |
TOTAL HONG KONG | | 8,075,174 |
India - 8.5% |
Bharti Televentures Ltd. (a) | 62,110 | | 123,823 |
BSES Ltd. | 13,790 | | 145,355 |
Dr. Reddy's Laboratories Ltd. | 2,660 | | 70,151 |
Hero Honda Motors Ltd. | 17,100 | | 133,363 |
Hindustan Petroleum Corp. Ltd. | 17,370 | | 126,174 |
Housing Development Finance Corp. Ltd. | 20,280 | | 232,647 |
ICICI Bank Ltd. | 54,211 | | 296,773 |
Infosys Technologies Ltd. | 5,090 | | 532,524 |
Common Stocks - continued |
| Shares | | Value (Note 1) |
India - continued |
ITC Ltd. | 100 | | $ 1,917 |
Ranbaxy Laboratories Ltd. | 12,254 | | 265,832 |
Reliance Industries Ltd. | 54,850 | | 588,560 |
Satyam Computer Services Ltd. | 36,540 | | 246,798 |
State Bank of India | 27,775 | | 296,749 |
Tata Engineering & Locomotive Co. Ltd. | 45,480 | | 375,822 |
TOTAL INDIA | | 3,436,488 |
Indonesia - 1.0% |
PT Telkomunikasi Indonesia Tbk | 576,500 | | 407,110 |
Korea (South) - 24.9% |
Amotech Co. Ltd. | 4,430 | | 91,332 |
Dae Duck Electronics Co. Ltd. | 9,520 | | 87,679 |
Daewoo Heavy Industries & Machinery Ltd. (a) | 13,940 | | 95,407 |
Honam Petrochemical Corp. | 13,250 | | 530,671 |
KH Vatec Co. Ltd. | 2,620 | | 124,857 |
Kookmin Bank | 23,459 | | 856,298 |
Korean Air Co. Ltd. | 12,390 | | 165,409 |
LG Chemical Ltd. | 10,460 | | 419,814 |
LG Electronics, Inc. | 14,510 | | 751,553 |
LG Petrochemical Co. Ltd. | 4,490 | | 102,433 |
POSCO | 5,850 | | 678,132 |
Samsung Electro-Mechanics Co. Ltd. | 9,800 | | 332,049 |
Samsung Electronics Co. Ltd. | 9,577 | | 3,803,285 |
Samsung SDI Co. Ltd. | 6,110 | | 629,843 |
Shinhan Financial Group Co. Ltd. | 26,910 | | 386,540 |
Shinsegae Co. Ltd. | 1,660 | | 333,122 |
SK Telecom Co. Ltd. | 3,760 | | 663,996 |
TOTAL KOREA (SOUTH) | | 10,052,420 |
Malaysia - 3.2% |
AMMB Holdings BHD | 76,500 | | 106,697 |
Berjaya Sports Toto BHD | 80,850 | | 92,765 |
British American Tobacco (Malaysia) BHD | 9,900 | | 108,770 |
Gamuda BHD | 49,300 | | 98,600 |
Hong Leong Bank BHD | 60,300 | | 86,483 |
Malayan Banking BHD | 94,800 | | 254,463 |
Public Bank BHD (For. Reg.) | 378,750 | | 299,013 |
Resorts World BHD | 50,300 | | 145,605 |
Tanjong PLC | 32,300 | | 93,500 |
TOTAL MALAYSIA | | 1,285,896 |
Common Stocks - continued |
| Shares | | Value (Note 1) |
Singapore - 6.4% |
Chartered Semiconductor Manufacturing Ltd. (a) | 194,000 | | $ 190,710 |
City Developments Ltd. | 60,000 | | 208,681 |
DBS Group Holdings Ltd. | 76,463 | | 628,583 |
Huan Hsin Holdings Ltd. | 82,000 | | 53,268 |
Oversea-Chinese Banking Corp. Ltd. | 47,604 | | 331,134 |
Singapore Press Holdings Ltd. | 15,298 | | 173,251 |
Singapore Telecommunications Ltd. | 164,000 | | 162,162 |
ST Assembly Test Services Ltd. (a) | 60,000 | | 78,643 |
United Overseas Bank Ltd. | 96,470 | | 754,235 |
TOTAL SINGAPORE | | 2,580,667 |
Taiwan - 18.7% |
Advanced Semiconductor Engineering, Inc. (a) | 442,000 | | 410,345 |
AU Optronics Corp. | 223,000 | | 301,014 |
Cathay Financial Holding Co. Ltd. | 238,000 | | 392,809 |
China Steel Corp. | 461,320 | | 372,537 |
Chinatrust Financial Holding Co. | 248,433 | | 258,464 |
Chung Hwa Pulp Corp. | 283,000 | | 151,801 |
Compal Electronics, Inc. | 168,850 | | 256,286 |
Compeq Manufacturing Co. Ltd. (a) | 310,000 | | 175,420 |
Delta Electronics, Inc. | 127,000 | | 162,446 |
Evergreen Marine Corp. | 102,760 | | 90,252 |
Formosa Plastic Corp. | 379,811 | | 582,086 |
Fubon Financial Holding Co. Ltd. | 243,000 | | 256,393 |
High Tech Computer Corp. | 21,000 | | 77,984 |
Hon Hai Precision Industries Co. Ltd. | 113,784 | | 509,731 |
Johnson Health Tech Co. Ltd. | 29,000 | | 64,103 |
Merry Electronics Co. Ltd. | 45,000 | | 72,944 |
Nan Ya Plastics Corp. | 380,280 | | 507,712 |
Quanta Computer, Inc. | 138,915 | | 378,710 |
Siliconware Precision Industries Co. Ltd. (a) | 154,000 | | 147,510 |
Sunplus Technology Co. Ltd. | 51,000 | | 88,683 |
Taiwan Semiconductor Manufacturing Co. Ltd. (a) | 723,440 | | 1,428,543 |
United Microelectronics Corp. (a) | 794,476 | | 728,211 |
Yageo Corp. (a) | 303,000 | | 144,668 |
TOTAL TAIWAN | | 7,558,652 |
Thailand - 3.8% |
Bangkok Bank Ltd. PCL (For. Reg.) (a) | 211,600 | | 495,234 |
Krung Thai Bank Public Co. Ltd. | 413,700 | | 92,163 |
Land & House PCL (For. Reg.) | 723,900 | | 244,622 |
Siam Cement PCL (For. Reg.) | 66,200 | | 374,498 |
Common Stocks - continued |
| Shares | | Value (Note 1) |
Thailand - continued |
Siam Commercial Bank PCL (For. Reg.) (a) | 205,300 | | $ 211,981 |
TelecomAsia Corp. PCL (a) | 100 | | 14 |
TelecomAsia Corp. PCL rights 4/30/08 (a) | 190,863 | | 0 |
Thai Military Bank PCL (For.Reg.) (a) | 745,100 | | 82,810 |
Thai Olefins PCL (a) | 57,900 | | 43,479 |
TOTAL THAILAND | | 1,544,801 |
United Kingdom - 2.8% |
HSBC Holdings PLC (Hong Kong) (Reg.) | 76,976 | | 1,155,718 |
TOTAL COMMON STOCKS (Cost $33,168,328) | 38,683,347 |
Nonconvertible Preferred Stocks - 2.2% |
| | | |
Korea (South) - 2.2% |
Hyundai Motor Co. Ltd. | 30,480 | | 502,205 |
Samsung Electronics Co. Ltd. | 2,050 | | 407,055 |
TOTAL NONCONVERTIBLE PREFERRED STOCKS (Cost $727,264) | 909,260 |
Government Obligations - 3.0% |
| Principal Amount (c) | | |
India - 3.0% |
India, Federal Republic of 3.8502% 12/12/03
(Cost $1,208,645) | INR | 55,000,000 | | 1,206,428 |
Money Market Funds - 2.4% |
| Shares | | Value (Note 1) |
Fidelity Cash Central Fund, 1.07% (b)
(Cost $972,288) | 972,288 | | $ 972,288 |
TOTAL INVESTMENT PORTFOLIO - 103.3% (Cost $36,076,525) | | 41,771,323 |
NET OTHER ASSETS - (3.3)% | | (1,352,258) |
NET ASSETS - 100% | $ 40,419,065 |
Currency Abbreviations |
INR | - | Indian rupee |
Legend |
(a) Non-income producing |
(b) The rate quoted is the annualized seven-day yield of the fund at period end. A complete listing of the fund's holdings as of its most recent fiscal year end is available upon request. |
(c) Principal amount is stated in United States dollars unless otherwise noted. |
Other Information |
Purchases and sales of securities, other than short-term securities, aggregated $50,897,932 and $49,252,885, respectively. |
The fund participated in the interfund lending program as a borrower. The average daily loan balance during the period for which loans were outstanding amounted to $2,874,000. The weighted average interest rate was 1.15%. At period end there were no interfund loans outstanding. |
Income Tax Information |
At October 31, 2003, the fund had a capital loss carryforward of approximately $3,457,000 of which $2,034,000 and $1,423,000 will expire on October 31, 2009 and 2010, respectively. |
See accompanying notes which are an integral part of the financial statements.
Annual Report
Financial Statements
Statement of Assets and Liabilities
| October 31, 2003 |
| | |
Assets | | |
Investment in securities, at value (cost $36,076,525) - See accompanying schedule | | $ 41,771,323 |
Foreign currency held at value (cost $326,396) | | 326,773 |
Receivable for investments sold | | 561,922 |
Receivable for fund shares sold | | 223,623 |
Dividends receivable | | 7,800 |
Interest receivable | | 1,038 |
Prepaid expenses | | 173 |
Receivable from investment adviser for expense reductions | | 28,495 |
Total assets | | 42,921,147 |
| | |
Liabilities | | |
Payable for investments purchased | $ 637,411 | |
Payable for fund shares redeemed | 52,140 | |
Accrued management fee | 23,465 | |
Distribution fees payable | 14,367 | |
Other payables and accrued expenses | 1,774,699 | |
Total liabilities | | 2,502,082 |
| | |
Net Assets | | $ 40,419,065 |
Net Assets consist of: | | |
Paid in capital | | $ 38,371,555 |
Undistributed net investment income | | 180,437 |
Accumulated undistributed net realized gain (loss) on investments and foreign currency transactions | | (3,605,277) |
Net unrealized appreciation (depreciation) on investments and assets and liabilities in foreign currencies | | 5,472,350 |
Net Assets | | $ 40,419,065 |
See accompanying notes which are an integral part of the financial statements.
Annual Report
Financial Statements - continued
Statement of Assets and Liabilities - continued
| October 31, 2003 |
| | |
Calculation of Maximum Offering Price
Class A:
Net Asset Value and redemption price per share
($24,161,487 ÷ 1,848,546 shares) | | $ 13.07 |
| | |
Maximum offering price per share (100/94.25 of $13.07) | | $ 13.87 |
Class T:
Net Asset Value and redemption price per share ($4,981,853 ÷ 385,533 shares) | | $ 12.92 |
| | |
Maximum offering price per share (100/96.50 of $12.92) | | $ 13.39 |
Class B:
Net Asset Value and offering price per share ($5,156,870 ÷ 408,090 shares) A | | $ 12.64 |
| | |
Class C:
Net Asset Value and offering price per share ($4,580,983 ÷ 362,141 shares) A | | $ 12.65 |
| | |
Institutional Class:
Net Asset Value, offering price and redemption price per share ($1,537,872 ÷ 116,476 shares) | | $ 13.20 |
A Redemption price per share is equal to net asset value less any applicable contingent deferred sales charge.
See accompanying notes which are an integral part of the financial statements.
Annual Report
Statement of Operations
| Year ended October 31, 2003 |
| | |
Investment Income | | |
Dividends | | $ 867,986 |
Interest | | 55,510 |
| | 923,496 |
Less foreign taxes withheld | | (103,241) |
Total income | | 820,255 |
| | |
Expenses | | |
Management fee | $ 220,272 | |
Transfer agent fees | 126,966 | |
Distribution fees | 123,907 | |
Accounting fees and expenses | 61,615 | |
Non-interested trustees' compensation | 121 | |
Custodian fees and expenses | 217,541 | |
Registration fees | 55,751 | |
Audit | 108,585 | |
Legal | 1,428 | |
Interest | 641 | |
Miscellaneous | 7,911 | |
Total expenses before reductions | 924,738 | |
Expense reductions | (266,360) | 658,378 |
Net investment income (loss) | | 161,877 |
Realized and Unrealized Gain (Loss) Net realized gain (loss) on: | | |
Investment securities | 6,483,503 | |
Foreign currency transactions | (5,082) | |
Total net realized gain (loss) | | 6,478,421 |
Change in net unrealized appreciation (depreciation) on: Investment securities (net of deferred foreign taxes of $195,235) | 3,316,302 | |
Assets and liabilities in foreign currencies | (24,567) | |
Total change in net unrealized appreciation (depreciation) | | 3,291,735 |
Net gain (loss) | | 9,770,156 |
Net increase (decrease) in net assets resulting from operations | | $ 9,932,033 |
See accompanying notes which are an integral part of the financial statements.
Annual Report
Financial Statements - continued
Statement of Changes in Net Assets
| Year ended
October 31,
2003 | Year ended
October 31,
2002 |
Increase (Decrease) in Net Assets | | |
Operations | | |
Net investment income (loss) | $ 161,877 | $ (101,155) |
Net realized gain (loss) | 6,478,421 | (1,376,366) |
Change in net unrealized appreciation (depreciation) | 3,291,735 | 3,700,512 |
Net increase (decrease) in net assets resulting
from operations | 9,932,033 | 2,222,991 |
Share transactions - net increase (decrease) | 2,145,215 | 738,683 |
Total increase (decrease) in net assets | 12,077,248 | 2,961,674 |
| | |
Net Assets | | |
Beginning of period | 28,341,817 | 25,380,143 |
End of period (including undistributed net investment income of $180,437 and accumulated net investment loss of $49,255, respectively) | $ 40,419,065 | $ 28,341,817 |
See accompanying notes which are an integral part of the financial statements.
Annual Report
Financial Highlights - Class A
Years ended October 31, | 2003 | 2002 | 2001 | 2000 | 1999 E |
Selected Per-Share Data | | | | | |
Net asset value, beginning of period | $ 9.89 | $ 9.15 | $ 12.29 | $ 15.01 | $ 9.61 |
Income from Investment Operations | | | | | |
Net investment income (loss) C | .07 | (.02) | (.03) | (.12) | (.03) |
Net realized and unrealized gain (loss) | 3.11 | .76 | (3.11) | (2.60) | 5.30 |
Total from investment operations | 3.18 | .74 | (3.14) | (2.72) | 5.27 |
Redemption fees added to paid in capital C | - | - | - | - | .13 |
Net asset value, end of period | $ 13.07 | $ 9.89 | $ 9.15 | $ 12.29 | $ 15.01 |
Total Return A,B | 32.15% | 8.09% | (25.55)% | (18.12)% | 56.19% |
Ratios to Average Net Assets D | | | | | |
Expenses before expense reductions | 2.81% | 2.56% | 2.56% | 1.98% | 2.04% |
Expenses net of voluntary waivers, if any | 2.02% | 2.00% | 2.00% | 1.98% | 2.04% |
Expenses net of all reductions | 2.02% | 1.98% | 1.97% | 1.96% | 2.03% |
Net investment income (loss) | .70% | (.17)% | (.26)% | (.69)% | (.22)% |
Supplemental Data | | | | | |
Net assets, end of period
(000 omitted) | $ 24,161 | $ 18,314 | $ 18,151 | $ 31,386 | $ 82,492 |
Portfolio turnover rate | 172% | 121% | 62% | 96% | 62% |
A Total returns would have been lower had certain expenses not been reduced during the periods shown.
B Total returns do not include the effect of the sales charges.
C Calculated based on average shares outstanding during the period.
D Expense ratios reflect operating expenses of the class. Expenses before reductions do not reflect amounts reimbursed by the investment adviser or reductions from brokerage service arrangements or other expense offset arrangements and do not represent the amount paid by the class during periods when reimbursements or reductions occur. Expenses net of any voluntary waivers reflect expenses after reimbursement by the investment adviser but prior to reductions from brokerage service arrangements or other expense offset arrangements. Expenses net of all reductions represent the net expenses paid by the class.
E Prior to June 16, 1999, the fund operated as a closed-end investment company. Shares of the fund existing at the time of its conversion to an open-ended management investment company were exchanged for Class A shares.
See accompanying notes which are an integral part of the financial statements.
Annual Report
Financial Highlights - Class T
Years ended October 31, | 2003 | 2002 | 2001 | 2000 | 1999 F |
Selected Per-Share Data | | | | | |
Net asset value, beginning of period | $ 9.81 | $ 9.09 | $ 12.25 | $ 15.01 | $ 14.44 |
Income from Investment Operations | | | | | |
Net investment income (loss) E | .05 | (.05) | (.06) | (.14) | .13 |
Net realized and unrealized gain (loss) | 3.06 | .77 | (3.10) | (2.62) | .34 H |
Total from investment operations | 3.11 | .72 | (3.16) | (2.76) | .47 |
Redemption fees added to paid in capital E | - | - | - | - | .10 H |
Net asset value, end of period | $ 12.92 | $ 9.81 | $ 9.09 | $ 12.25 | $ 15.01 |
Total Return B,C,D | 31.70% | 7.92% | (25.80)% | (18.39)% | 3.95% |
Ratios to Average Net Assets G | | | | | |
Expenses before expense reductions | 3.43% | 3.16% | 3.41% | 2.17% | 2.50% A |
Expenses net of voluntary waivers, if any | 2.27% | 2.25% | 2.25% | 2.17% | 2.25% A |
Expenses net of all reductions | 2.26% | 2.23% | 2.22% | 2.15% | 2.25% A |
Net investment income (loss) | .45% | (.42)% | (.51)% | (.88)% | 2.34% A |
Supplemental Data | | | | | |
Net assets, end of period
(000 omitted) | $ 4,982 | $ 4,347 | $ 2,842 | $ 4,165 | $ 1,405 |
Portfolio turnover rate | 172% | 121% | 62% | 96% | 62% |
A Annualized
B Total returns for periods of less than one year are not annualized.
C Total returns would have been lower had certain expenses not been reduced during the periods shown.
D Total returns do not include the effect of the sales charges.
E Calculated based on average shares outstanding during the period.
F For the period June 16, 1999 (commencement of sale of shares) to October 31, 1999.
G Expense ratios reflect operating expenses of the class. Expenses before reductions do not reflect amounts reimbursed by the investment adviser or reductions from brokerage service arrangements or other expense offset arrangements and do not represent the amount paid by the class during periods when reimbursements or reductions occur. Expense ratios before reductions for start-up periods may not be representative of longer-term operating periods. Expenses net of any voluntary waivers reflect expenses after reimbursement by the investment adviser but prior to reductions from brokerage service arrangements or other expense offset arrangements. Expenses net of all reductions represent the net expenses paid by the class.
H Per share amounts have been reclassified to reflect redemption fees on a class level.
See accompanying notes which are an integral part of the financial statements.
Annual Report
Financial Highlights - Class B
Years ended October 31, | 2003 | 2002 | 2001 | 2000 | 1999 F |
Selected Per-Share Data | | | | | |
Net asset value, beginning of period | $ 9.63 | $ 8.97 | $ 12.15 | $ 14.98 | $ 14.44 |
Income from Investment Operations | | | | | |
Net investment income (loss) E | (.01) | (.10) | (.11) | (.24) | .08 |
Net realized and unrealized gain (loss) | 3.02 | .76 | (3.07) | (2.59) | .37 H |
Total from investment operations | 3.01 | .66 | (3.18) | (2.83) | .45 |
Redemption fees added to paid in capital E | - | - | - | - | .09 H |
Net asset value, end of period | $ 12.64 | $ 9.63 | $ 8.97 | $ 12.15 | $ 14.98 |
Total Return B,C,D | 31.26% | 7.36% | (26.17)% | (18.89)% | 3.74% |
Ratios to Average Net Assets G | | | | | |
Expenses before expense reductions | 3.87% | 3.63% | 3.66% | 2.77% | 3.19% A |
Expenses net of voluntary waivers, if any | 2.77% | 2.75% | 2.75% | 2.77% | 2.75% A |
Expenses net of all reductions | 2.77% | 2.73% | 2.72% | 2.75% | 2.75% A |
Net investment income (loss) | (.05)% | (.92)% | (1.01)% | (1.48)% | 1.38% A |
Supplemental Data | | | | | |
Net assets, end of period
(000 omitted) | $ 5,157 | $ 2,787 | $ 2,466 | $ 3,664 | $ 977 |
Portfolio turnover rate | 172% | 121% | 62% | 96% | 62% |
A Annualized
B Total returns for periods of less than one year are not annualized.
C Total returns would have been lower had certain expenses not been reduced during the periods shown.
D Total returns do not include the effect of the contingent deferred sales charge.
E Calculated based on average shares outstanding during the period.
F For the period June 16, 1999 (commencement of sale of shares) to October 31, 1999.
G Expense ratios reflect operating expenses of the class. Expenses before reductions do not reflect amounts reimbursed by the investment adviser or reductions from brokerage service arrangements or other expense offset arrangements and do not represent the amount paid by the class during periods when reimbursements or reductions occur. Expense ratios before reductions for start-up periods may not be representative of longer-term operating periods. Expenses net of any voluntary waivers reflect expenses after reimbursement by the investment adviser but prior to reductions from brokerage service arrangements or other expense offset arrangements. Expenses net of all reductions represent the net expenses paid by the class.
H Per share amounts have been reclassified to reflect redemption fees on a class level.
See accompanying notes which are an integral part of the financial statements.
Annual Report
Financial Highlights - Class C
Years ended October 31, | 2003 | 2002 | 2001 | 2000 | 1999 F |
Selected Per-Share Data | | | | | |
Net asset value, beginning of period | $ 9.64 | $ 8.98 | $ 12.16 | $ 14.97 | $ 14.44 |
Income from Investment Operations | | | | | |
Net investment income (loss) E | (.01) | (.10) | (.11) | (.23) | .04 |
Net realized and unrealized gain (loss) | 3.02 | .76 | (3.07) | (2.58) | .38 H |
Total from investment operations | 3.01 | .66 | (3.18) | (2.81) | .42 |
Redemption fees added to paid in capital E | - | - | - | - | .11 H |
Net asset value, end of period | $ 12.65 | $ 9.64 | $ 8.98 | $ 12.16 | $ 14.97 |
Total Return B,C,D | 31.22% | 7.35% | (26.15)% | (18.77)% | 3.67% |
Ratios to Average Net Assets G | | | | | |
Expenses before expense reductions | 3.70% | 3.53% | 3.52% | 2.68% | 3.00% A |
Expenses net of voluntary waivers, if any | 2.77% | 2.75% | 2.75% | 2.68% | 2.75% A |
Expenses net of all reductions | 2.76% | 2.73% | 2.72% | 2.66% | 2.75% A |
Net investment income (loss) | (.05)% | (.92)% | (1.01)% | (1.40)% | .75% A |
Supplemental Data | | | | | |
Net assets, end of period (000 omitted) | $ 4,581 | $ 2,220 | $ 1,263 | $ 2,124 | $ 614 |
Portfolio turnover rate | 172% | 121% | 62% | 96% | 62% |
A Annualized
B Total returns for periods of less than one year are not annualized.
C Total returns would have been lower had certain expenses not been reduced during the periods shown.
D Total returns do not include the effect of the contingent deferred sales charge.
E Calculated based on average shares outstanding during the period.
F For the period June 16, 1999 (commencement of sale of shares) to October 31, 1999.
G Expense ratios reflect operating expenses of the class. Expenses before reductions do not reflect amounts reimbursed by the investment adviser or reductions from brokerage service arrangements or other expense offset arrangements and do not represent the amount paid by the class during periods when reimbursements or reductions occur. Expense ratios before reductions for start-up periods may not be representative of longer-term operating periods. Expenses net of any voluntary waivers reflect expenses after reimbursement by the investment adviser but prior to reductions from brokerage service arrangements or other expense offset arrangements. Expenses net of all reductions represent the net expenses paid by the class.
H Per share amounts have been reclassified to reflect redemption fees on a class level.
See accompanying notes which are an integral part of the financial statements.
Annual Report
Financial Highlights - Institutional Class
Years ended October 31, | 2003 | 2002 | 2001 | 2000 | 1999 E |
Selected Per-Share Data | | | | | |
Net asset value, beginning of period | $ 9.97 | $ 9.21 | $ 12.34 | $ 15.03 | $ 14.44 |
Income from Investment Operations | | | | | |
Net investment income (loss) D | .10 | .01 | - H | (.03) | .05 |
Net realized and unrealized gain (loss) | 3.13 | .75 | (3.13) | (2.66) | .40 G |
Total from investment operations | 3.23 | .76 | (3.13) | (2.69) | .45 |
Redemption fees added to paid in capital D | - | - | - | - | .14 G |
Net asset value, end of period | $ 13.20 | $ 9.97 | $ 9.21 | $ 12.34 | $ 15.03 |
Total Return B,C | 32.40% | 8.25% | (25.36)% | (17.90)% | 4.09% |
Ratios to Average Net Assets F | | | | | |
Expenses before expense reductions | 2.55% | 2.18% | 2.20% | 1.45% | 1.97% A |
Expenses net of voluntary waivers, if any | 1.77% | 1.75% | 1.75% | 1.45% | 1.75% A |
Expenses net of all reductions | 1.77% | 1.73% | 1.72% | 1.42% | 1.75% A |
Net investment income (loss) | .94% | .08% | (.01)% | (.16)% | .90% A |
Supplemental Data | | | | | |
Net assets, end of period
(000 omitted) | $ 1,538 | $ 674 | $ 658 | $ 1,523 | $ 172 |
Portfolio turnover rate | 172% | 121% | 62% | 96% | 62% |
A Annualized
B Total returns for periods of less than one year are not annualized.
C Total returns would have been lower had certain expenses not been reduced during the periods shown.
D Calculated based on average shares outstanding during the period.
E For the period June 16, 1999 (commencement of sale of shares) to October 31, 1999.
F Expense ratios reflect operating expenses of the class. Expenses before reductions do not reflect amounts reimbursed by the investment adviser or reductions from brokerage service arrangements or other expense offset arrangements and do not represent the amount paid by the class during periods when reimbursements or reductions occur. Expense ratios before reductions for start-up periods may not be representative of longer-term operating periods. Expenses net of any voluntary waivers reflect expenses after reimbursement by the investment adviser but prior to reductions from brokerage service arrangements or other expense offset arrangements. Expenses net of all reductions represent the net expenses paid by the class.
G Per share amounts have been reclassified to reflect redemption fees on a class level.
H Amount represents less than $.01 per-share.
See accompanying notes which are an integral part of the financial statements.
Annual Report
Notes to Financial Statements
For the period ended October 31, 2003
1. Significant Accounting Policies.
Fidelity Advisor Emerging Asia Fund (the fund) is a fund of Fidelity Advisor Series VIII (the trust) and is authorized to issue an unlimited number of shares. The trust is registered under the Investment Company Act of 1940, as amended (the 1940 Act), as an open-end management investment company organized as a Massachusetts business trust.
The fund offers Class A, Class T, Class B, Class C, and Institutional Class shares, each of which has equal rights as to assets and voting privileges. Each class has exclusive voting rights with respect to matters that affect that class. Class B shares will automatically convert to Class A shares after a holding period of seven years from the initial date of purchase. Investment income, realized and unrealized capital gains and losses, the common expenses of the fund, and certain fund-level expense reductions, if any, are allocated on a pro rata basis to each class based on the relative net assets of each class to the total net assets of the fund. Each class differs with respect to transfer agent and distribution and service plan fees incurred. Certain expense reductions also differ by class.
The fund's investments in emerging markets can be subject to social, economic, regulatory, and political uncertainties and can be extremely volatile.
The financial statements have been prepared in conformity with accounting principles generally accepted in the United States of America, which require management to make certain estimates and assumptions at the date of the financial statements. The following summarizes the significant accounting policies of the fund:
Security Valuation. Net asset value per share (NAV calculation) is calculated as of the close of business of the New York Stock Exchange, normally 4:00 p.m. Eastern time. Equity securities for which market quotations are available are valued at the last sale price or official closing price (closing bid price or last evaluated quote if no sale has occurred) on the primary market or exchange on which they trade. Debt securities for which quotations are readily available are valued at their most recent bid prices (sales prices if the principal market is an exchange) in the principal market in which such securities are normally traded, as determined by recognized dealers in such securities, or securities are valued on the basis of information provided by a pricing service. Pricing services use valuation matrices that incorporate both dealer-supplied valuations and valuation models. If an event that is expected to materially affect the value of a security occurs after the close of an exchange or market on which that security trades, but prior to the NAV calculation, then that security will be fair valued taking the event into account. Securities (including restricted securities) for which market quotations are not readily available are valued at their fair value as determined in good faith under consistently applied procedures under the general supervision of the Board of Trustees. Price movements in futures contracts and ADRs, market and trading trends, the bid/ask quotes of brokers and off-exchange institutional trading may be reviewed in the course of making a good faith determination of a security's fair value. Short-term securities with
Annual Report
Notes to Financial Statements - continued
1. Significant Accounting Policies - continued
Annual Report
Security Valuation - continued
remaining maturities of sixty days or less for which quotations are not readily available are valued on the basis of amortized cost. Investments in open-end investment companies are valued at their net asset value each business day.
Foreign Currency. The fund uses foreign currency contracts to facilitate transactions in foreign-denominated securities. Losses from these transactions may arise from changes in the value of the foreign currency or if the counterparties do not perform under the contracts' terms.
Foreign denominated assets, including investment securities, and liabilities are translated into U.S. dollars at the exchange rate at period end. Purchases and sales of investment securities, income and dividends received and expenses denominated in foreign currencies are translated into U.S. dollars at the exchange rate in effect on the transaction date.
The effects of exchange rate fluctuations on investments are included with the net realized and unrealized gain (loss) on investment securities. Other foreign currency transactions resulting in realized and unrealized gain (loss) are disclosed separately.
Investment Transactions and Income. Security transactions are accounted for as of trade date. Gains and losses on securities sold are determined on the basis of identified cost. Dividend income is recorded on the ex-dividend date, except for certain dividends from foreign securities where the ex-dividend date may have passed, which are recorded as soon as the fund is informed of the ex-dividend date. Non-cash dividends included in dividend income, if any, are recorded at the fair market value of the securities received. Interest income is accrued as earned. Interest income includes coupon interest and amortization of premium and accretion of discount on debt securities, which is accrued using the interest method. Investment income is recorded net of foreign taxes withheld where recovery of such taxes is uncertain.
Expenses. Most expenses of the trust can be directly attributed to a fund. Expenses which cannot be directly attributed are apportioned among the funds in the trust.
Income Tax Information and Distributions to Shareholders. Each year the fund intends to qualify as a regulated investment company by distributing all of its taxable income and realized gains under Subchapter M of the Internal Revenue Code. As a result, no provision for income taxes is required in the accompanying financial statements. Foreign taxes are provided for based on each fund's understanding of the tax rules and rates that exist in the foreign markets in which it invests. In March of 2002, the fund filed for a ruling in India regarding the applicability of taxes imposed by the country on realized capital gains under the US/India tax treaty. The ruling requested the refund of
Annual Report
Notes to Financial Statements - continued
1. Significant Accounting Policies - continued
Annual Report
Income Tax Information and Distributions to Shareholders - continued
taxes paid in prior years and would exempt future realized gains from taxes. Although the ruling is still pending, the fund received a refund of 66 million Indian rupees (approximately $1,450,000) representing taxes paid by the fund in 2000 through 2002. The outcome of the ruling cannot be predicted and the Indian tax authorities could request repayment of the refund if there is an unfavorable ruling. The fund has continued to accrue capital gains taxes (prior and current) until such time as a final ruling is received. Income dividends and capital gain distributions are declared separately for each class. Distributions are recorded on the ex-dividend date.
Income and capital gain distributions are determined in accordance with income tax regulations, which may differ from generally accepted accounting principles. Capital accounts within the financial statements are adjusted for permanent and temporary book and tax differences. These adjustments have no impact on net assets or the results of operations. Temporary differences will reverse in a subsequent period. These differences are primarily due to foreign currency transactions, passive foreign investment companies (PFIC), capital loss carryforwards and losses deferred due to wash sales.
The tax-basis components of distributable earnings and the federal tax cost as of period end were as follows:
Unrealized appreciation | $ 5,759,761 | | |
Unrealized depreciation | (530,529) | |
Net unrealized appreciation (depreciation) | 5,229,232 | |
Undistributed ordinary income | 275,262 | |
Capital loss carryforward | (3,456,984) | |
| | |
Cost for federal income tax purposes | $ 36,542,091 | |
Short-Term Trading (Redemption) Fees. Shares purchased after March 31, 2004 and held in the fund less than 90 days will be subject to a short-term trading fee equal to 1.50% of the proceeds of the redeemed shares. The fee, which will be retained by the fund, is accounted for as an addition to paid in capital.
2. Operating Policies.
Repurchase Agreements. Fidelity Management & Research (FMR) has received an Exemptive Order from the Securities and Exchange Commission (the SEC) which permits the fund and other affiliated entities of FMR to transfer uninvested cash balances into joint trading accounts. These accounts are then invested in repurchase agreements that are collateralized by U.S. Treasury or Government obligations. The fund may also invest directly with institutions, in repurchase agreements that are collateralized by commercial paper obligations and corporate obligations. Collateral is held in
Annual Report
Notes to Financial Statements - continued
2. Operating Policies - continued
Annual Report
Repurchase Agreements - continued
segregated accounts with custodian banks and may be obtained in the event of a default of the counterparty. Collateral is marked-to-market daily and maintained at a value at least equal to the principal amount of the repurchase agreement (including accrued interest).
3. Purchases and Sales of Investments.
Information regarding purchases and sales of securities is included under the caption "Other Information" at the end of the fund's Schedule of Investments.
4. Fees and Other Transactions with Affiliates.
Management Fee. FMR and its affiliates provide the fund with investment management related services for which the fund pays a monthly management fee. The management fee is the sum of an individual fund fee rate that is based on an annual rate of .45% of the fund's average net assets and a group fee rate that averaged .28% during the period. The group fee rate is based upon the average net assets of all the mutual funds advised by FMR. The group fee rate decreases as assets under management increase and increases as assets under management decrease. For the period, the total annual management fee rate was .73% of the fund's average net assets.
Distribution and Service Plan. In accordance with Rule 12b-1 of the 1940 Act, the Fund has adopted separate Distribution and Service Plans for each class of shares. Certain classes pay Fidelity Distributors Corporation (FDC), an affiliate of FMR, separate Distribution and Service Fees, each of which is based on an annual percentage of each class' average net assets. Class A and Class T Plans also authorize the use of brokerage commissions to pay distribution expenses. This practice has been discontinued and no commissions incurred after June 30, 2003 have been used to pay distribution expenses. In addition, FDC may pay financial intermediaries for selling shares of the fund and providing shareholder support services. For the period, the Distribution and Service Fee rates, the total amounts paid to and retained by FDC and the amount of distribution expenses paid with brokerage commissions were as follows:
| Distribution
Fee | Service
Fee | Paid to
FDC | Retained
by FDC | Paid with
Commissions |
Class A | -% | .25% | $ 48,344 | $ 5,982 | $ - |
Class T | .25% | .25% | 18,876 | - | - |
Class B | .75% | .25% | 31,516 | 23,636 | - |
Class C | .75% | .25% | 25,171 | 8,102 | - |
| | | $ 123,907 | $ 37,720 | $ - |
Annual Report
Notes to Financial Statements - continued
4. Fees and Other Transactions with Affiliates - continued
Sales Load. FDC receives a front-end sales charge of up to 5.75% for selling Class A shares, and 3.50% for selling Class T shares of the fund. FDC receives the proceeds of contingent deferred sales charges levied on Class A, Class T, Class B, and Class C redemptions. These charges depend on the holding period. The deferred sales charges range from 5% to 1% for Class B, 1% for Class C, and .25% for certain purchases of Class A and Class T shares.
For the period, sales charge amounts retained by FDC were as follows:
| Retained
by FDC | |
Class A | $ 5,594 | |
Class T | 1,632 | |
Class B* | 9,291 | |
Class C* | 3,770 | |
| $ 20,287 | |
* When Class B and Class C shares are initially sold, FDC pays commissions from its own resources to financial intermediaries through
which the sales are made.
Transfer Agent Fees. Fidelity Investments Institutional Operations Company, Inc. (FIIOC), an affiliate of FMR, is the transfer, dividend disbursing and shareholder servicing agent (collectively referred to as the transfer agent) for each class of the fund. FIIOC receives account fees and asset-based fees that vary according to the account size and type of account of the shareholders of the respective classes of the fund. FIIOC pays for typesetting, printing and mailing of all shareholder reports, except proxy statements. For the period, the following amounts were paid to FIIOC:
| Amount | % of
Average
Net Assets |
Class A | $ 63,635 | .33 |
Class T | 26,658 | .70 |
Class B | 20,447 | .64 |
Class C | 12,012 | .47 |
Institutional Class | 4,214 | .32 |
| $ 126,966 | |
Accounting Fees. Fidelity Service Company, Inc. (FSC), an affiliate of FMR, maintains the fund's accounting records. The fee is based on the level of average net assets for the month plus out-of-pocket expenses.
Annual Report
4. Fees and Other Transactions with Affiliates - continued
Central Funds. The fund may invest in affiliated Central Funds managed by Fidelity Investments Money Management, Inc. (FIMM), an affiliate of FMR. The Central Funds are open-end investment companies available only to investment companies and other accounts managed by FMR and its affiliates. The Central Funds seek preservation of capital and current income and do not pay a management fee. Income distributions earned by the fund are recorded as income in the accompanying financial statements and totaled $8,078 for the period.
Interfund Lending Program. Pursuant to an Exemptive Order issued by the SEC, the fund, along with other registered investment companies having management contracts with FMR, may participate in an interfund lending program. This program provides an alternative credit facility allowing the funds to borrow from, or lend money to, other participating funds. Information regarding the fund's participation in the program is included under the caption "Other Information" at the end of the fund's Schedule of Investments.
5. Committed Line of Credit.
The fund participates with other funds managed by FMR in a $3.5 billion credit facility (the "line of credit") to be utilized for temporary or emergency purposes to fund shareholder redemptions or for other short-term liquidity purposes. The fund has agreed to pay commitment fees on its pro rata portion of the line of credit. During the period, there were no borrowings on this line of credit.
Annual Report
Notes to Financial Statements - continued
6. Expense Reductions.
FMR agreed to reimburse the classes of the fund to the extent operating expenses exceeded certain levels of average net assets as noted in the table below. Some expenses, for example interest expense, are excluded from this reimbursement.
| Expense
Limitations | Reimbursement
from adviser |
| | |
Class A | 2.00% | $ 152,803 |
Class T | 2.25% | 44,179 |
Class B | 2.75% | 34,938 |
Class C | 2.75% | 23,604 |
Institutional Class | 1.75% | 10,207 |
| | $ 265,731 |
Many of the brokers with whom FMR places trades on behalf of the fund provided services to the fund in addition to trade execution. These services may include payments of expenses on behalf of the fund to support distribution of fund shares for Class A and Class T ("Distribution Expense Reduction") and to pay other fund expenses, such as transfer agent fees ("Other Expense Reduction") collectively referred to as "Brokerage Service Arrangements" in the accompanying table. Brokerage service arrangements generally benefits all shareholders of each class by reducing fund expenses. Each of Class A and Class T shareholders' Other Expense Reduction benefit is reduced by the amount of any Distribution Expense Reduction.
| Brokerage Service Arrangements |
| Distribution
expense
reduction | Other
expense
reduction |
| | |
Fund Level | $ - | $ 629 |
Annual Report
7. Share Transactions.
Transactions for each class of shares were as follows:
| Shares | Dollars |
Years ended October 31, | 2003 | 2002 | 2003 | 2002 |
Class A | | | | |
Shares sold | 2,472,329 | 1,558,955 | $ 25,555,609 | $ 17,017,475 |
Shares redeemed | (2,475,129) | (1,691,949) | (26,094,442) | (18,896,118) |
Net increase (decrease) | (2,800) | (132,994) | $ (538,833) | $ (1,878,643) |
Class T | | | | |
Shares sold | 615,784 | 306,332 | $ 6,405,610 | $ 3,507,758 |
Shares redeemed | (673,227) | (175,919) | (6,940,401) | (1,903,003) |
Net increase (decrease) | (57,443) | 130,413 | $ (534,791) | $ 1,604,755 |
Class B | | | | |
Shares sold | 262,810 | 136,244 | $ 2,867,284 | $ 1,467,888 |
Shares redeemed | (143,990) | (121,792) | (1,478,097) | (1,276,878) |
Net increase (decrease) | 118,820 | 14,452 | $ 1,389,187 | $ 191,010 |
Class C | | | | |
Shares sold | 354,068 | 353,152 | $ 3,792,883 | $ 3,841,374 |
Shares redeemed | (222,119) | (263,600) | (2,208,742) | (2,864,649) |
Net increase (decrease) | 131,949 | 89,552 | $ 1,584,141 | $ 976,725 |
Institutional Class | | | | |
Shares sold | 554,755 | 574,658 | $ 5,910,359 | $ 6,068,713 |
Shares redeemed | (505,917) | (578,457) | (5,664,848) | (6,223,877) |
Net increase (decrease) | 48,838 | (3,799) | $ 245,511 | $ (155,164) |
Annual Report
Report of Independent Auditors
To the Trustees of Fidelity Advisor Series VIII and the Shareholders of Fidelity Advisor Emerging Asia Fund.
In our opinion, the accompanying statement of assets and liabilities, including the schedule of investments, and the related statements of operations and of changes in net assets and the financial highlights present fairly, in all material respects, the financial position of Fidelity Advisor Emerging Asia Fund (a fund of Fidelity Advisor Series VIII) at October 31, 2003 and the results of its operations, the changes in its net assets and the financial highlights for the periods indicated, in conformity with accounting principles generally accepted in the United States of America. These financial statements and financial highlights (hereafter referred to as "financial statements") are the responsibility of the Fidelity Advisor Emerging Asia Fund's management; our responsibility is to express an opinion on these financial statements based on our audits. We conducted our audits of these financial statements in accordance with auditing standards generally accepted in the United States of America which require that we plan and perform the audit to obtain reasonable assurance about whether the financial statements are free of material misstatement. An audit includes examining, on a test basis, evidence supporting the amounts and disclosures in the financial statements, assessing the accounting principles used and significant estimates made by management, and evaluating the overall financial statement presentation. We believe that our audits, which included confirmation of securities at October 31, 2003 by correspondence with the custodian and brokers, provide a reasonable basis for our opinion.
/s/PricewaterhouseCoopers LLP
PricewaterhouseCoopers LLP
Boston, Massachusetts
December 12, 2003
Annual Report
Trustees and Officers
The Trustees, Members of the Advisory Board, and executive officers of the trust and fund, as applicable, are listed below. The Board of Trustees governs the fund and is responsible for protecting the interests of shareholders. The Trustees are experienced executives who meet periodically throughout the year to oversee the fund's activities, review contractual arrangements with companies that provide services to the fund, and review the fund's performance. Except for William O. McCoy, each of the Trustees oversees 289 funds advised by FMR or an affiliate. Mr. McCoy oversees 291 funds advised by FMR or an affiliate.
The Trustees hold office without limit in time except that (a) any Trustee may resign; (b) any Trustee may be removed by written instrument, signed by at least two-thirds of the number of Trustees prior to such removal; (c) any Trustee who requests to be retired or who has become incapacitated by illness or injury may be retired by written instrument signed by a majority of the other Trustees; and (d) any Trustee may be removed at any special meeting of shareholders by a two-thirds vote of the outstanding voting securities of the trust. In any event, each non-interested Trustee shall retire not later than the last day of the calendar year in which his or her 72nd birthday occurs. The executive officers and Advisory Board Members hold office without limit in time, except that any officer and Advisory Board Member may resign or may be removed by a vote of a majority of the Trustees at any regular meeting or any special meeting of the Trustees. Except as indicated, each individual has held the office shown or other offices in the same company for the past five years.
The fund's Statement of Additional Information (SAI) includes more information about the Trustees. To request a free copy, call Fidelity at 1-877-208-0098.
Interested Trustees*:
Correspondence intended for each Trustee who is an "interested person" (as defined in the 1940 Act) may be sent to 82 Devonshire Street, Boston, Massachusetts 02109.
Name, Age; Principal Occupation |
Edward C. Johnson 3d (73)** |
| Year of Election or Appointment: 1983 Mr. Johnson is Chairman of the Board of Trustees. Mr. Johnson serves as Chief Executive Officer, Chairman, and a Director of FMR Corp.; a Director and Chairman of the Board and of the Executive Committee of FMR; Chairman and a Director of Fidelity Management & Research (Far East) Inc.; Chairman (1998) and a Director of Fidelity Investments Money Management, Inc.; and Chairman (2001) and a Director (2000) of FMR Co., Inc. |
Abigail P. Johnson (41)** |
| Year of Election or Appointment: 2001 Senior Vice President of Advisor Emerging Asia (2001). Ms. Johnson also serves as Senior Vice President of other Fidelity funds (2001). She is President and a Director of FMR (2001), Fidelity Investments Money Management, Inc. (2001), FMR Co., Inc. (2001), and a Director of FMR Corp. Previously, Ms. Johnson managed a number of Fidelity funds. |
Laura B. Cronin (49) |
| Year of Election or Appointment: 2003 Ms. Cronin is an Executive Vice President (2002) and Chief Financial Officer (2002) of FMR Corp. and is a member of the Fidelity Management Committee (2003). Previously, Ms. Cronin served as Vice President of Finance of FMR (1997-1999), and Chief Financial Officer of FMR (1999-2001), Fidelity Personal Investments (2001), and Fidelity Brokerage Company (2001-2002). |
Robert L. Reynolds (51) |
| Year of Election or Appointment: 2003 Mr. Reynolds is a Director (2003) and Chief Operating Officer (2002) of FMR Corp. and is the head of the Fidelity Management Committee (2003). He also serves on the Board at Fidelity Investments Canada, Ltd. (2000). Previously, Mr. Reynolds served as President of Fidelity Investments Institutional Retirement Group (1996-2000). |
* Trustees have been determined to be "Interested Trustees" by virtue of, among other things, their affiliation with the trust or various entities under common control with FMR.
** Edward C. Johnson 3d, Trustee, is Abigail P. Johnson's father.
Annual Report
Non-Interested Trustees:
Correspondence intended for each non-interested Trustee (that is, the Trustees other than the Interested Trustees) may be sent to Fidelity Investments, P.O. Box 55235, Boston, Massachusetts 02205-5235.
Name, Age; Principal Occupation |
J. Michael Cook (61) |
| Year of Election or Appointment: 2001 Prior to Mr. Cook's retirement in May 1999, he served as Chairman and Chief Executive Officer of Deloitte & Touche LLP (accounting/consulting), Chairman of the Deloitte & Touche Foundation, and a member of the Board of Deloitte Touche Tohmatsu. He currently serves as a Director of Comcast (telecommunications, 2002), International Flavors & Fragrances, Inc. (2000), Rockwell Automation (2000) and The Dow Chemical Company (2000). He is a Member of the Diversity Advisory Council of Marakon (2003) and the Advisory Board of the Directorship Search Group, Chairman Emeritus of the Board of Catalyst (a leading organization for the advancement of women in business), and is Chairman of the Accountability Advisory Council to the Comptroller General of the United States. He also serves as a Member of the Advisory Board of the Graduate School of Business of the University of Florida, his alma mater. |
Ralph F. Cox (71) |
| Year of Election or Appointment: 1991 Mr. Cox is President of RABAR Enterprises (management consulting for the petroleum industry). Prior to February 1994, he was President of Greenhill Petroleum Corporation (petroleum exploration and production). Until March 1990, Mr. Cox was President and Chief Operating Officer of Union Pacific Resources Company (exploration and production). He is a Director of CH2M Hill Companies (engineering), and Abraxas Petroleum (petroleum exploration and production, 1999). In addition, he is a member of advisory boards of Texas A&M University and the University of Texas at Austin. |
Phyllis Burke Davis (71) |
| Year of Election or Appointment: 1992 Mrs. Davis is retired from Avon Products, Inc. (consumer products) where she held various positions including Senior Vice President of Corporate Affairs and Group Vice President of U.S. product marketing, sales, distribution, and manufacturing. Mrs. Davis is a member of the Board of Directors of the Southampton Hospital in Southampton, N.Y. (1998). Previously, she served as a Director of BellSouth Corporation (telecommunications), Eaton Corporation (diversified industrial), the TJX Companies, Inc. (retail stores), Hallmark Cards, Inc., and Nabisco Brands, Inc. |
Robert M. Gates (60) |
| Year of Election or Appointment: 1997 Dr. Gates is President of Texas A&M University (2002). He was Director of the Central Intelligence Agency (CIA) from 1991 to 1993. From 1989 to 1991, Dr. Gates served as Assistant to the President of the United States and Deputy National Security Advisor. Dr. Gates is a Director of NACCO Industries, Inc. (mining and manufacturing), and Parker Drilling Co., Inc. (drilling and rental tools for the energy industry, 2001). He also serves as a member of the Advisory Board of VoteHere.net (secure internet voting, 2001). Previously, Dr. Gates served as a Director of LucasVarity PLC (automotive components and diesel engines), a Director of TRW Inc. (automotive, space, defense, and information technology), and Dean of the George Bush School of Government and Public Service at Texas A&M University (1999-2001). Dr. Gates also is a Trustee of the Forum for International Policy. |
Donald J. Kirk (70) |
| Year of Election or Appointment: 1987 Mr. Kirk is a Governor of the American Stock Exchange (2001), a Trustee and former Chairman of the Board of Trustees of the Greenwich Hospital Association, a Director of the Yale-New Haven Health Services Corp. (1998), and a Director Emeritus and former Chairman of the Board of Directors of National Arts Strategies Inc. Mr. Kirk was an Executive-in-Residence (1995-2000) and a Professor (1987-1995) at Columbia University Graduate School of Business. Prior to 1987, he was Chairman of the Financial Accounting Standards Board. Previously, Mr. Kirk served as a Governor of the National Association of Securities Dealers, Inc. (1996-2002), a member and Vice Chairman of the Public Oversight Board of the American Institute of Certified Public Accountants' SEC Practice Section (1995-2002), a Director of General Re Corporation (reinsurance, 1987-1998) and as a Director of Valuation Research Corp. (appraisals and valuations). |
Marie L. Knowles (57) |
| Year of Election or Appointment: 2001 Prior to Ms. Knowles' retirement in June 2000, she served as Executive Vice President and Chief Financial Officer of Atlantic Richfield Company (ARCO) (diversified energy, 1996-2000). From 1993 to 1996, she was a Senior Vice President of ARCO and President of ARCO Transportation Company. She served as a Director of ARCO from 1996 to 1998. She currently serves as a Director of Phelps Dodge Corporation (copper mining and manufacturing), URS Corporation (multidisciplinary engineering, 1999), and McKesson Corporation (healthcare service, 2002). Ms. Knowles is a Trustee of the Brookings Institution and the Catalina Island Conservancy and also serves as a member of the Advisory Board for the School of Engineering of the University of Southern California. |
Ned C. Lautenbach (59) |
| Year of Election or Appointment: 2000 Mr. Lautenbach has been a partner of Clayton, Dubilier & Rice, Inc. (private equity investment firm) since September 1998. Previously, Mr. Lautenbach was with the International Business Machines Corporation (IBM) from 1968 until his retirement in 1998. He was most recently Senior Vice President and Group Executive of Worldwide Sales and Services. From 1993 to 1995, he was Chairman of IBM World Trade Corporation, and from 1994 to 1998 was a member of IBM's Corporate Executive Committee. Mr. Lautenbach serves as Chairman and as a Director (1998) of Acterna Corporation (communications test equipment). He is also Co-Chairman of Covansys, Inc. (global provider of business and technology solutions, 2000). In addition, he is a Director of Eaton Corporation (diversified industrial) and the Philharmonic Center for the Arts in Naples, Florida (1999). He also is a member of the Council on Foreign Relations. |
Marvin L. Mann (70) |
| Year of Election or Appointment: 1993 Mr. Mann is Chairman of the non-interested Trustees (2001). He is Chairman Emeritus of Lexmark International, Inc. (computer peripherals) where he served as CEO until April 1998 and retired as Chairman May 1999, and remains a member of the Board. Prior to 1991, he held the positions of Vice President of International Business Machines Corporation (IBM) and President and General Manager of various IBM divisions and subsidiaries. Mr. Mann is a Board member of Imation Corp. (imaging and information storage) and Acterna Corporation (communications test equipment, 1999). He is also a member of the Director Services Committee of the Investment Company Institute. In addition, Mr. Mann is a member of the President's Cabinet at the University of Alabama and the Board of Visitors of the Culverhouse College of Commerce and Business Administration at the University of Alabama. |
William O. McCoy (70) |
| Year of Election or Appointment: 1997 Prior to his retirement in December 1994, Mr. McCoy was Vice Chairman of the Board of BellSouth Corporation (telecommunications) and President of BellSouth Enterprises. He is currently a Director of Liberty Corporation (holding company), Duke Realty Corporation (real estate), Progress Energy, Inc. (electric utility), and Acterna Corporation (communications test equipment, 1999). He is also a partner of Franklin Street Partners (private investment management firm) and a member of the Research Triangle Foundation Board. In addition, Mr. McCoy served as the Interim Chancellor (1999-2000) and a member of the Board of Visitors (1994-1998) for the University of North Carolina at Chapel Hill and currently serves on the Board of Directors of the University of North Carolina Health Care System and the Board of Visitors of the Kenan-Flagler Business School (University of North Carolina at Chapel Hill). He also served as Vice President of Finance for the University of North Carolina (16-school system, 1995-1998). |
William S. Stavropoulos (64) |
| Year of Election or Appointment: 2001 Mr. Stavropoulos is Chairman of the Board, President and CEO (2002), and Chairman of the Executive Committee (2000) and a Director of The Dow Chemical Company. Since joining The Dow Chemical Company in 1967, Mr. Stavropoulos served in numerous senior management positions, including President (1993-2000) and Chief Executive Officer (1995-2000). Currently, he is a Director of NCR Corporation (data warehousing and technology solutions), BellSouth Corporation (telecommunications), Chemical Financial Corporation, and Maersk Inc. (industrial conglomerate, 2002). He also serves as a member of the Board of Trustees of the American Enterprise Institute for Public Policy Research. In addition, Mr. Stavropoulos is a member of The Business Council, J.P. Morgan International Council, World Business Council for Sustainable Development, and the University of Notre Dame Advisory Council for the College of Science. |
Annual Report
Trustees and Officers - continued
Advisory Board Members and Executive Officers:
Correspondence intended for Dr. Heilmeier may be sent to Fidelity Investments, P.O. Box 55235, Boston, Massachusetts 02205-5235. Correspondence intended for each executive officer and Mr. Lynch may be sent to 82 Devonshire Street, Boston, Massachusetts 02109.
Name, Age; Principal Occupation |
George H. Heilmeier (67) |
| Year of Election or Appointment: 2003 Member of the Advisory Board of Fidelity Advisor Series VIII. Dr. Heilmeier is Chairman Emeritus of Telcordia Technologies (communication software and systems), where prior to his retirement, he served as company Chairman and Chief Executive Officer. He currently serves on the Boards of Directors of The Mitre Corporation (systems engineering and information technology support for the government), INET Technologies Inc. (telecommunications network surveillance, 2001) and Teletech Holdings (customer management services, 1998). He is Chairman of the General Motors Technology Advisory Committee and a Life Fellow of the IEEE (2000). Dr. Heilmeier is a member of the Defense Science Board and the National Security Agency Advisory Board. He is also a member of the National Academy of Engineering, the American Academy of Arts and Sciences and The Board of Overseers of the School of Engineering and Applied Science of the University of Pennsylvania. Previously, Dr. Heilmeier served as a Director of TRW Inc. (automotive, space, defense, and information technology, 1992-2002) and Compaq (1994-2002). |
Peter S. Lynch (60) |
| Year of Election or Appointment: 2003 Member of the Advisory Board of Fidelity Advisor Series VIII. Vice Chairman and a Director of FMR, and Vice Chairman (2001) and a Director (2000) of FMR Co., Inc. Previously, Mr. Lynch served as a Trustee of the Fidelity funds (1990-2003). Prior to May 31, 1990, he was a Director of FMR and Executive Vice President of FMR (a position he held until March 31, 1991), Vice President of Fidelity Magellan Fund and FMR Growth Group Leader, and Managing Director of FMR Corp. Mr. Lynch was also Vice President of Fidelity Investments Corporate Services. In addition, he serves as a Trustee of Boston College, Massachusetts Eye & Ear Infirmary, Historic Deerfield, John F. Kennedy Library, and the Museum of Fine Arts of Boston. |
Philip L. Bullen (44) |
| Year of Election or Appointment: 2001 Vice President of Advisor Emerging Asia. Mr. Bullen also serves as Vice President of certain Equity Funds (2001) and certain High Income Funds (2001). He is Senior Vice President of FMR (2001) and FMR Co., Inc. (2001), President and a Director of Fidelity Management & Research (Far East) Inc. (2001), President and a Director of Fidelity Management & Research (U.K.) Inc. (2002), and a Director of Strategic Advisers, Inc. (2002). Before joining Fidelity Investments, Mr. Bullen was President and Chief Investment Officer of Santander Global Advisors (1997-2000) and President and Chief Executive Officer of Boston's Baring Asset Management Inc. (1994-1997). |
Eric D. Roiter (54) |
| Year of Election or Appointment: 1998 Secretary of Advisor Emerging Asia. He also serves as Secretary of other Fidelity funds (1998); Vice President, General Counsel, and Clerk of FMR Co., Inc. (2001) and FMR (1998); Vice President and Clerk of FDC (1998); Assistant Clerk of Fidelity Management & Research (U.K.) Inc. (2001) and Fidelity Management & Research (Far East) Inc. (2001); and Assistant Secretary of Fidelity Investments Money Management Inc. (2001). Prior to joining Fidelity, Mr. Roiter was with the law firm of Debevoise & Plimpton, as an associate (1981-1984) and as a partner (1985-1997), and served as an Assistant General Counsel of the U.S. Securities and Exchange Commission (1979-1981). Mr. Roiter is an Adjunct Member, Faculty of Law, at Boston College Law School (2003). |
Stuart Fross (44) |
| Year of Election or Appointment: 2003 Assistant Secretary of Advisor Emerging Asia. Mr. Fross also serves as Assistant Secretary of other Fidelity funds (2003) and is an employee of FMR. |
Maria F. Dwyer (44) |
| Year of Election or Appointment: 2002 President and Treasurer of Advisor Emerging Asia. Ms. Dwyer also serves as President and Treasurer of other Fidelity funds (2002) and is a Vice President (1999) and an employee (1996) of FMR. Prior to joining Fidelity, Ms. Dwyer served as Director of Compliance for MFS Investment Management. |
Timothy F. Hayes (52) |
| Year of Election or Appointment: 2002 Chief Financial Officer of Advisor Emerging Asia. Mr. Hayes also serves as Chief Financial Officer of other Fidelity funds (2002). Recently he was appointed President of Fidelity Service Company (2003) where he also serves as a Director. Mr. Hayes also serves as President of Fidelity Investments Operations Group (FIOG, 2002), which includes Fidelity Pricing and Cash Management Services Group (FPCMS), where he was appointed President in 1998. Previously, Mr. Hayes served as Chief Financial Officer of Fidelity Investments Corporate Systems and Service Group (1998) and Fidelity Systems Company (1997-1998). |
John R. Hebble (45) |
| Year of Election or Appointment: 2003 Deputy Treasurer of Advisor Emerging Asia. Mr. Hebble also serves as Deputy Treasurer of other Fidelity funds (2003), and is an employee of FMR. Before joining Fidelity Investments, Mr. Hebble worked at Deutsche Asset Management where he served as Director of Fund Accounting (2002-2003) and Assistant Treasurer of the Scudder Funds (1998-2003). |
John H. Costello (57) |
| Year of Election or Appointment: 1994 Assistant Treasurer of Advisor Emerging Asia. Mr. Costello also serves as Assistant Treasurer of other Fidelity funds and is an employee of FMR. |
Francis V. Knox, Jr. (56) |
| Year of Election or Appointment: 2002 Assistant Treasurer of Advisor Emerging Asia. Mr. Knox also serves as Assistant Treasurer of other Fidelity funds (2002), and is a Vice President and an employee of FMR. Previously, Mr. Knox served as Vice President of Investment & Advisor Compliance (1990-2001), and Compliance Officer of Fidelity Management & Research (U.K.) Inc. (1992-2002), Fidelity Management & Research (Far East) Inc. (1991-2002), and FMR Corp. (1995-2002). |
Mark Osterheld (48) |
| Year of Election or Appointment: 2002 Assistant Treasurer of Advisor Emerging Asia. Mr. Osterheld also serves as Assistant Treasurer of other Fidelity funds (2002) and is an employee of FMR. |
Thomas J. Simpson (45) |
| Year of Election or Appointment: 2000 Assistant Treasurer of Advisor Emerging Asia. Mr. Simpson is Assistant Treasurer of other Fidelity funds (2000) and an employee of FMR (1996). Prior to joining FMR, Mr. Simpson was Vice President and Fund Controller of Liberty Investment Services (1987-1995). |
Annual Report
Annual Report
Annual Report
Annual Report
Annual Report
Annual Report
Annual Report
Investment Adviser
Fidelity Management & Research Company
Boston, MA
Investment Sub-Advisers
FMR Co., Inc.
Fidelity Management & Research
(U.K.) Inc.
Fidelity Management & Research
(Far East) Inc.
Fidelity International
Investment Advisors
Fidelity Investments Japan Limited
Fidelity International Investment Advisors (U.K.) Limited
General Distributor
Fidelity Distributors Corporation
Boston, MA
Transfer and Shareholder
Servicing Agents
Fidelity Investments Institutional Operations Company, Inc.
Boston, MA
Custodian
Brown Brothers Harriman & Co.
Boston, MA
Annual Report
Fidelity Advisor Aggressive Growth Fund |
Fidelity Advisor Asset Allocation Fund |
Fidelity Advisor Balanced Fund |
Fidelity Advisor Biotechnology Fund |
Fidelity Advisor California Municipal Income Fund |
Fidelity Advisor Consumer Industries Fund |
Fidelity Advisor Cyclical Industries Fund |
Fidelity Advisor Developing Communications Fund |
Fidelity Advisor Diversified International Fund |
Fidelity Advisor Dividend Growth Fund |
Fidelity Advisor Dynamic Capital Appreciation Fund |
Fidelity Advisor Electronics Fund |
Fidelity Advisor Emerging Asia Fund |
Fidelity Advisor Emerging Markets Income Fund |
Fidelity Advisor Equity Growth Fund |
Fidelity Advisor Equity Income Fund |
Fidelity Advisor Equity Value Fund |
Fidelity Advisor Europe Capital Appreciation Fund |
Fidelity Advisor Fifty Fund |
Fidelity Advisor Financial Services Fund |
Fidelity Advisor Floating Rate High Income Fund |
Fidelity Advisor Freedom Income FundSM |
Fidelity Advisor Freedom 2010 FundSM |
Fidelity Advisor Freedom 2020 FundSM |
Fidelity Advisor Freedom 2030 FundSM |
Fidelity Advisor Freedom 2040 FundSM |
Fidelity Advisor Global Equity Fund |
Fidelity Advisor Government Investment Fund |
Fidelity Advisor Growth & Income Fund |
Fidelity Advisor Growth Opportunities |
Fidelity Advisor Health Care Fund |
Fidelity Advisor High Income Advantage Fund |
Fidelity Advisor High Income Fund |
Fidelity Advisor Inflation-Protected Bond Fund |
Fidelity Advisor Intermediate Bond Fund |
Fidelity Advisor International Capital Appreciation Fund |
Fidelity Advisor International Small Cap Fund |
Fidelity Advisor Investment Grade Bond Fund |
Fidelity Advisor Japan Fund |
Fidelity Advisor Korea Fund |
Fidelity Advisor Large Cap Fund |
Fidelity Advisor Latin America Fund |
Fidelity Advisor Leveraged Company Stock Fund |
Fidelity Advisor Mid Cap Fund |
Fidelity Advisor Mortgage Securities Fund |
Fidelity Advisor Municipal Income Fund |
Fidelity Advisor Natural Resources Fund |
Fidelity Advisor New Insights Fund |
Fidelity Advisor New York Municipal Income Fund |
Fidelity Advisor Overseas Fund |
Fidelity Advisor Real Estate Fund |
Fidelity Advisor Short Fixed-Income Fund |
Fidelity Advisor Short Intermediate Municipal Income Fund |
Fidelity Advisor Small Cap Fund |
Fidelity Advisor Strategic Growth Fund |
Fidelity Advisor Strategic Income Fund |
Fidelity Advisor Tax Managed
Stock Fund |
Fidelity Advisor Technology Fund |
Fidelity Advisor Telecommunications & Utilities Growth Fund |
Fidelity Advisor Value Leaders Fund |
Fidelity Advisor Value Strategies Fund |
Prime Fund |
Tax-Exempt Fund |
Treasury Fund |
(Fidelity Investment logo)(registered trademark)
Corporate Headquarters
82 Devonshire St., Boston, MA 02109
www.fidelity.com
AEAI-UANN-1203
1.784738.100
Fidelity® Advisor
Europe Capital Appreciation
Fund - Class A, Class T, Class B
and Class C
Annual Report
October 31, 2003
(2_fidelity_logos) (Registered_Trademark)
Contents
Chairman's Message | <Click Here> | Ned Johnson's message to shareholders. |
Performance | <Click Here> | How the fund has done over time. |
Management's Discussion | <Click Here> | The manager's review of fund performance, strategy and outlook. |
Investment Changes | <Click Here> | A summary of major shifts in the fund's investments over the past six months. |
Investments | <Click Here> | A complete list of the fund's investments with their market values. |
Financial Statements | <Click Here> | Statements of assets and liabilities, operations, and changes in net assets,
as well as financial highlights. |
Notes | <Click Here> | Notes to the financial statements. |
Auditors' Opinion | <Click Here> | |
Trustees and Officers | <Click Here> | |
Distributions | <Click Here> | |
For a free copy of the fund's proxy voting guidelines call 1-877-208-0098 or visit the Securities and Exchange Commission (SEC)'s web site at www.sec.gov.
Third party marks appearing herein are the property of their respective owners.
All other marks appearing herein are registered or unregistered trademarks or service marks of FMR Corp. or an affiliated company.
(Recycle graphic) This report is printed on recycled paper using soy-based inks.
This report and the financial statements contained herein are submitted for the general information of the shareholders of the fund. This report is not authorized for distribution to prospective investors in the fund unless preceded or accompanied by an effective prospectus.
Mutual fund shares are not deposits or obligations of, or guaranteed by, any depository institution. Shares are not insured by the FDIC, Federal Reserve Board or any other agency, and are subject to investment risks, including possible loss of principal amount invested.
Neither the fund nor Fidelity Distributors Corporation is a bank.
For more information on any Fidelity Advisor fund, including charges and expenses, contact your investment professional for a free prospectus. Read it carefully before you invest or send money.
Annual Report
Chairman's Message
(photo_of_Edward_C_Johnson_3d)
Dear Shareholder:
Many of you have read or heard news stories recently that were critical of mutual funds and made allegations that the mutual fund industry has been less than forthright. I find these reports unsettling and not necessarily an accurate picture of the overall industry, and I would like you to know where we at Fidelity stand.
With specific regard to allegations that certain mutual fund companies were violating the Securities and Exchange Commission's forward pricing rules or were involved in so-called "market timing" activities, I want to say two things:
First, Fidelity does not have agreements that permit customers who buy fund shares after 4 p.m. to obtain the 4 p.m. price. This is not to say that someone could not deceive the company through fraudulent acts. But I underscore that we have no so-called "agreements" which would permit this illegal practice.
Second, Fidelity has been on record for years opposing predatory short-term trading which adversely affects other shareholders in a mutual fund. In fact, in the 1980s, we began charging a fee - which is returned to the fund and, therefore, to investors - to discourage this activity. What's more, several years ago we took the industry lead in developing a Fair Value Pricing Policy to prevent market timing on foreign securities in our funds. It is reasonable to assume that another structure can be developed that would alter the system to make it much more difficult for predatory traders to operate. This, however, will only be achieved through close cooperation among regulators, legislators and the industry.
Certainly no industry is perfect, and there have been instances of unethical and illegal activity from time to time within the mutual fund industry. When this occurs, confessed or convicted offenders should be dealt with appropriately. Clearly, every system can be improved. We applaud well thought out improvements by regulators, legislators and industry representatives that achieve the common goal of building and protecting the value of investors' holdings. But we remain concerned about the risk of over-regulation and the quick application of simplistic solutions to intricate problems.
For more than 57 years, Fidelity Investments has worked very hard to improve its products and service to justify your trust. When our family founded this company in 1946, we had only a few hundred customers. Many of them were family and friends. Today, we serve more than 18 million customers including individual investors and participants in retirement plans across America.
Let me close by saying that we do not take your trust in us for granted, and we realize that we must always work to improve all aspects of our service to you. In turn, we urge you to continue your active participation with your financial matters, so that your interests can be well served.
Annual Report
Best regards,
/s/Edward C. Johnson 3d
Edward C. Johnson 3d
Annual Report
Performance: The Bottom Line
Average annual total return reflects the change in the value of an investment, assuming reinvestment of the class' dividend income and capital gains (the profits earned upon the sale of securities that have grown in value) and assuming a constant rate of performance each year. During periods of reimbursement by Fidelity, a fund's total return will be greater than it would be had the reimbursement not occurred. The $10,000 table and the fund's returns do not reflect the deduction of taxes that a shareholder would pay on fund distributions or the redemption of fund shares. How a fund did yesterday is no guarantee of how it will do tomorrow. Returns may reflect the conversion of Class B shares to Class A shares after a maximum of seven years.
Average Annual Total Returns
Periods ended October 31, 2003 | Past 1
year | Life of
fund A |
Class A (incl. 5.75% sales charge) | 18.10% | -1.03% |
Class T (incl. 3.50% sales charge) | 20.53% | -0.76% |
Class B (incl. contingent deferred sales charge) B | 19.30% | -0.99% |
Class C (incl. contingent deferred sales charge) C | 23.27% | -0.56% |
A From December 17, 1998.
B Class B shares' contingent deferred sales charges included in the past one year and life of fund total return figures are 5% and 2%, respectively.
C Class C shares' contingent deferred sales charges included in the past one year and life of fund total return figures are 1% and 0%, respectively.
Annual Report
$10,000 Over Life of Fund
Let's say hypothetically that $10,000 was invested in Fidelity® Advisor Europe Capital Appreciation Fund - Class T on December 17, 1998, when the fund started, and the current 3.50% sales charge was paid. The chart shows how the value of your investment would have grown, and also shows how the MSCI® Europe Index did over the same period.

Annual Report
Management's Discussion of Fund Performance
Comments from Ian Hart, Portfolio Manager of Fidelity® Advisor Europe Capital Appreciation Fund
Mirroring the U.S. rally, most international stock markets rebounded sharply during the 12-month period ending October 31, 2003. Encouraged by improved corporate earnings, favorable interest rates and the easing of geopolitical tensions, the Morgan Stanley Capital InternationalSM Europe, Australasia, Far East (MSCI® EAFE®) Index - a proxy for stock markets outside the United States and Canada - gained 27.39% during the past year. From a regional perspective, all 16 countries in the MSCI Europe index - which gained 24.56% - - had double-digit advances. Spain, Denmark and Sweden were among the region's best performers. In Japan, increased capital spending, exports and machinery orders helped the Tokyo Stock Exchange Stock Price Index (TOPIX) advance 36.39%. Following the SARS epidemic, other Asian markets also rebounded. For instance, the Hong Kong market, as measured by the Hang Seng Index, gained 34.51%. Emerging markets also fared well, particularly Latin America. The MSCI Emerging Markets Free Latin America index rose 59.75%. Canadian equities, as measured by the S&P/TSX Composite Index, also posted an impressive annual gain, advancing 50.66%.
For the 12-month period that ended October 31, 2003, the fund's Class A, Class T, Class B and C shares had returns of 25.30%, 24.90%, 24.30% and 24.27%, respectively. By comparison, the Morgan Stanley Capital International Europe Index posted a total return of 24.56% for the same period, while the LipperSM European Region Funds Average returned 23.64%. Stock picking accounted for most of the fund's outperformance, with individual stocks in the telecommunications space - notably Ericsson, Alcatel, Mobistar and Versatel - providing very attractive gains. Solid performance from such top-10 holdings as Germany's Deutsche Boerse and France's SEB also boosted returns. The fund was hurt by an underweighted position in the banking sector and disappointing earnings growth from companies such as Van Der Moolen, the Dutch market maker, and Ahold, the Dutch food retailer. Unilever, the Anglo-Dutch consumer goods company, also detracted from performance.
The views expressed in this statement reflect those of the portfolio manager only through the end of the period of the report as stated on the cover and do not necessarily represent the views of Fidelity or any other person in the Fidelity organization. Any such views are subject to change at any time based upon market or other conditions and Fidelity disclaims any responsibility to update such views. These views may not be relied on as investment advice and, because investment decisions for a Fidelity fund are based on numerous factors, may not be relied on as an indication of trading intent on behalf of any Fidelity fund.
Annual Report
Investment Changes
Top Five Stocks as of October 31, 2003 |
| % of fund's
net assets | % of fund's net assets
6 months ago |
Deutsche Boerse AG (Germany, Diversified Financial Services) | 6.6 | 6.6 |
Vodafone Group PLC (United Kingdom, Wireless Telecommunication Services) | 3.1 | 3.5 |
Marks & Spencer Group PLC (United Kingdom, Multiline Retail) | 2.9 | 0.0 |
Unilever PLC (United Kingdom, Food Products) | 2.1 | 2.7 |
British Sky Broadcasting Group PLC (BSkyB) (United Kingdom, Media) | 1.8 | 0.9 |
| 16.5 | |
Top Five Market Sectors as of October 31, 2003 |
| % of fund's
net assets | % of fund's net assets
6 months ago |
Consumer Discretionary | 22.5 | 15.7 |
Financials | 20.8 | 21.0 |
Telecommunication Services | 16.9 | 10.8 |
Health Care | 12.1 | 14.3 |
Information Technology | 9.3 | 4.4 |
Top Five Countries as of October 31, 2003 |
(excluding cash equivalents) | % of fund's
net assets | % of fund's net assets
6 months ago |
United Kingdom | 31.6 | 33.1 |
Germany | 16.3 | 18.5 |
France | 10.3 | 13.2 |
Switzerland | 6.6 | 11.1 |
Sweden | 5.7 | 1.8 |
Percentages are adjusted for the effect of open futures contracts, if applicable. |
Asset Allocation (% of fund's net assets) |
As of October 31, 2003 | As of April 30, 2003 |
| Stocks 95.8% | | | Stocks 96.9% | |
| Bonds 0.8% | | | Bonds 0.0% | |
| Short-Term
Investments and
Net Other Assets 3.4% | | | Short-Term
Investments and
Net Other Assets 3.1% | |

Annual Report
Investments October 31, 2003
Showing Percentage of Net Assets
Common Stocks - 94.1% |
| Shares | | Value (Note 1) |
Belgium - 0.7% |
Mobistar SA (a) | 2,700 | | $ 135,122 |
Denmark - 3.6% |
A.P. Moller - Maersk AS Series B | 10 | | 78,228 |
Bryggerigruppen AS | 1,000 | | 55,477 |
Coloplast AS Series B | 3,200 | | 268,283 |
Danske Bank AS | 7,900 | | 158,810 |
Novo Nordisk AS Series B | 4,700 | | 168,456 |
TOTAL DENMARK | | 729,254 |
Finland - 0.6% |
Comptel Oyj (a) | 17,800 | | 45,984 |
F-Secure Oyj (a) | 46,600 | | 72,878 |
TOTAL FINLAND | | 118,862 |
France - 10.3% |
Alcatel SA sponsored ADR (a) | 10,600 | | 139,708 |
Assurances Generales France (Bearer) | 200 | | 10,519 |
Cap Gemini SA (a) | 1,200 | | 60,263 |
Casino Guichard Perrachon et Compagnie | 1,400 | | 127,719 |
CNP Assurances | 2,100 | | 95,437 |
France Telecom SA (a) | 2,000 | | 48,238 |
France Telecom SA sponsored ADR | 6,300 | | 152,712 |
L'Oreal SA | 4,100 | | 302,077 |
NRJ Group | 7,000 | | 136,639 |
Pernod-Ricard | 3,725 | | 358,164 |
SEB SA | 2,200 | | 241,606 |
Suez SA (France) | 6,100 | | 97,518 |
Vivendi Universal SA (a) | 3,900 | | 81,639 |
Vivendi Universal SA sponsored ADR (a) | 6,000 | | 126,180 |
Wanadoo SA (a) | 10,600 | | 78,589 |
TOTAL FRANCE | | 2,057,008 |
Germany - 15.1% |
Adidas-Salomon AG | 1,200 | | 110,794 |
Allianz AG (Reg.) | 2,500 | | 267,081 |
Bayerische Hypo Und Verein AG (a) | 2,900 | | 63,663 |
Celanese AG (Reg.) | 3,100 | | 107,484 |
DAB Bank AG (a) | 21,600 | | 177,160 |
Deutsche Boerse AG | 23,708 | | 1,313,355 |
Deutsche Telekom AG (Reg.) (a) | 18,000 | | 280,980 |
Fresenius Medical Care AG | 3,300 | | 187,513 |
Fresenius Medical Care AG sponsored ADR | 1 | | 19 |
Common Stocks - continued |
| Shares | | Value (Note 1) |
Germany - continued |
Puma AG | 500 | | $ 72,681 |
SAP AG | 800 | | 116,928 |
Sixt AG | 5,600 | | 62,408 |
T-Online International AG (a) | 10,800 | | 139,250 |
Zapf Creation AG (a) | 3,900 | | 120,449 |
TOTAL GERMANY | | 3,019,765 |
Israel - 0.4% |
Emblaze Ltd. (a) | 37,400 | | 88,402 |
Italy - 2.7% |
Amplifon Spa | 2,100 | | 53,764 |
Banca Intesa Spa | 22,031 | | 74,166 |
Banca Nazionale del Lavoro (BNL) (a) | 36,800 | | 83,557 |
Bulgari Spa | 11,100 | | 100,414 |
Fiat Spa (a) | 16,500 | | 128,736 |
Telecom Italia Spa | 37,770 | | 98,229 |
TOTAL ITALY | | 538,866 |
Luxembourg - 0.3% |
Metro International SA Swedish Depositary Receipt
(A Shares) (a) | 51,300 | | 57,635 |
Netherlands - 4.8% |
Completel Europe NV (a) | 6,342 | | 168,978 |
Equant NV (a) | 5,800 | | 51,064 |
ING Groep NV (Certificaten Van Aandelen) | 8,530 | | 177,765 |
Koninklijke KPN NV (a) | 38,800 | | 293,959 |
Koninklijke Philips Electronics NV | 3,500 | | 93,940 |
Koninklijke Philips Electronics NV (NY Shares) | 3,100 | | 83,204 |
Samas Groep NV (Certificaten Van Aandelen) | 7,600 | | 42,524 |
Versatel Telecom International NV (a) | 23,200 | | 53,215 |
TOTAL NETHERLANDS | | 964,649 |
Norway - 2.3% |
Storebrand ASA (A Shares) (a) | 33,000 | | 182,874 |
TANDBERG Television ASA (a) | 73,700 | | 275,735 |
TOTAL NORWAY | | 458,609 |
Russia - 1.6% |
Lukoil Oil Co. sponsored ADR | 1,200 | | 97,560 |
OAO Gazprom sponsored ADR | 5,900 | | 141,600 |
Vimpel Communications sponsored ADR (a) | 1,200 | | 78,120 |
TOTAL RUSSIA | | 317,280 |
Common Stocks - continued |
| Shares | | Value (Note 1) |
Spain - 4.7% |
Antena 3 Television SA (a) | 20 | | $ 651 |
Banco Espanol de Credito SA (Reg.) | 6,800 | | 68,061 |
Corporacion Mapfre SA (Reg.) | 16,000 | | 198,697 |
Grupo Auxiliar Metalurgico SA (Gamesa) | 4,200 | | 113,269 |
Prosegur Comp Securidad SA (Reg.) | 7,600 | | 123,259 |
Repsol YPF SA | 6,200 | | 107,694 |
Telefonica SA | 6,000 | | 74,800 |
Telefonica SA sponsored ADR | 6,681 | | 249,869 |
TOTAL SPAIN | | 936,300 |
Sweden - 5.7% |
Eniro AB | 15,800 | | 126,072 |
Modern Times Group AB (MTG) (B Shares) (a) | 14,000 | | 261,848 |
OMHEX AB | 23,250 | | 237,463 |
Song Networks Holding AB (a) | 24,400 | | 158,870 |
Tele2 AB (B Shares) (a) | 4,100 | | 205,450 |
Telefonaktiebolaget LM Ericsson (B Shares) (a) | 91,700 | | 156,624 |
TOTAL SWEDEN | | 1,146,327 |
Switzerland - 6.6% |
ABB Ltd. (Switzerland) (Reg.) (a) | 18,940 | | 110,905 |
Actelion Ltd. (Reg.) (a) | 1,749 | | 165,689 |
Clariant AG (Reg.) (a) | 5,400 | | 75,727 |
Novartis AG sponsored ADR | 8,900 | | 341,493 |
Roche Holding AG (participation certificate) | 3,470 | | 286,017 |
Sulzer AG (Reg.) | 560 | | 132,627 |
Swiss Life Holding (a) | 170 | | 28,722 |
Zurich Financial Services AG | 1,350 | | 172,199 |
TOTAL SWITZERLAND | | 1,313,379 |
Turkey - 1.0% |
Turkcell Iletisim Hizmet AS sponsored ADR (a) | 11,100 | | 210,900 |
United Kingdom - 30.8% |
3i Group PLC | 11,900 | | 125,013 |
Alvis PLC | 21,400 | | 67,988 |
Amlin PLC | 40,600 | | 99,749 |
Autonomy Corp. PLC (a) | 47,400 | | 201,590 |
Axis Shield PLC (a) | 11,500 | | 32,638 |
Barratt Developments PLC | 14,900 | | 123,708 |
Boots Group PLC | 13,500 | | 162,980 |
British Sky Broadcasting Group PLC (BSkyB) (a) | 33,200 | | 360,026 |
Carlton Communications PLC | 35,300 | | 129,195 |
Common Stocks - continued |
| Shares | | Value (Note 1) |
United Kingdom - continued |
Cattles PLC | 21,400 | | $ 115,670 |
Celltech Group PLC (a) | 25,800 | | 200,654 |
Corin Group PLC | 20,800 | | 72,778 |
Dixons Group PLC | 121,800 | | 280,158 |
Easynet Group PLC (a) | 31,400 | | 67,569 |
Galen Holdings PLC | 14,100 | | 180,138 |
Jazztel PLC (a) | 168,200 | | 75,992 |
Land Securities Group PLC | 7,000 | | 106,866 |
Lastminute.com PLC (a) | 9,800 | | 49,234 |
London Bridge Software Holdings PLC | 68,100 | | 70,964 |
London Stock Exchange PLC | 19,700 | | 127,677 |
Maiden Group PLC | 22,300 | | 96,352 |
Marks & Spencer Group PLC | 118,800 | | 579,226 |
Mothercare PLC (a) | 10,800 | | 59,107 |
MyTravel Group PLC (a) | 438,500 | | 137,454 |
NDS Group PLC sponsored ADR (a) | 2,700 | | 47,277 |
Next PLC | 4,300 | | 85,974 |
Pace Micro Technology PLC | 68,800 | | 75,774 |
Prudential PLC | 36,400 | | 282,014 |
Reckitt Benckiser PLC | 6,100 | | 128,164 |
Rentokil Initial PLC | 23,200 | | 87,760 |
Shire Pharmaceuticals Group PLC (a) | 25,900 | | 197,704 |
SMG PLC | 36,400 | | 62,293 |
Sygen International PLC | 91,118 | | 78,739 |
Ted Baker PLC | 15,900 | | 97,257 |
Unilever PLC | 48,800 | | 417,240 |
Vodafone Group PLC | 293,300 | | 620,330 |
Vodafone Group PLC sponsored ADR | 7,700 | | 162,855 |
William Hill PLC | 21,300 | | 122,348 |
Woolworths Group PLC | 163,300 | | 127,280 |
Wyevale Garden Centres PLC | 9,100 | | 51,885 |
TOTAL UNITED KINGDOM | | 6,167,620 |
United States of America - 2.9% |
Covad Communications Group, Inc. (a) | 100 | | 438 |
Infonet Services Corp. Class B (a) | 11,300 | | 26,781 |
Network Associates, Inc. (a) | 13,400 | | 186,662 |
NTL, Inc. (a) | 1,500 | | 92,595 |
Pfizer, Inc. | 4,300 | | 135,880 |
Common Stocks - continued |
| Shares | | Value (Note 1) |
United States of America - continued |
Secure Computing Corp. (a) | 4,700 | | $ 67,586 |
Synthes-Stratec, Inc. | 87 | | 79,563 |
TOTAL UNITED STATES OF AMERICA | | 589,505 |
TOTAL COMMON STOCKS (Cost $16,034,219) | 18,849,483 |
Nonconvertible Preferred Stocks - 1.7% |
| | | |
Germany - 1.2% |
Fresenius Medical Care AG | 1,500 | | 61,340 |
Porsche AG (non-vtg.) | 370 | | 181,103 |
TOTAL GERMANY | | 242,443 |
Italy - 0.5% |
Telecom Italia Spa (Risp) (a) | 56,094 | | 96,953 |
TOTAL NONCONVERTIBLE PREFERRED STOCKS (Cost $317,525) | 339,396 |
Nonconvertible Bonds - 0.8% |
| Principal Amount | | |
United Kingdom - 0.8% |
Telewest Communications PLC yankee: | | | | |
0% 4/15/09 (c)(d) | | $ 10,000 | | 4,425 |
0% 2/1/10 (c)(d) | | 45,000 | | 18,113 |
9.875% 2/1/10 (c) | | 35,000 | | 18,025 |
11.25% 11/1/08 (c) | | 10,000 | | 5,375 |
Telewest PLC 11% 10/1/07 (c) | | 200,000 | | 108,000 |
TOTAL NONCONVERTIBLE BONDS (Cost $138,232) | 153,938 |
Money Market Funds - 2.9% |
| Shares | | Value (Note 1) |
Fidelity Cash Central Fund, 1.07% (b)
(Cost $574,215) | 574,215 | | $ 574,215 |
TOTAL INVESTMENT PORTFOLIO - 99.5% (Cost $17,064,191) | | 19,917,032 |
NET OTHER ASSETS - 0.5% | | 100,146 |
NET ASSETS - 100% | $ 20,017,178 |
Legend |
(a) Non-income producing |
(b) The rate quoted is the annualized seven-day yield of the fund at period end. A complete listing of the fund's holdings as of its most recent fiscal year end is available upon request. |
(c) Non-income producing - issuer filed for bankruptcy or is in default of interest payments. |
(d) Debt obligation initially issued in zero coupon form which converts to coupon form at a specified rate and date. The rate shown is the rate at period end. |
Other Information |
Purchases and sales of securities, other than short-term securities, aggregated $34,198,923 and $36,136,577, respectively. |
The fund placed a portion of its portfolio transactions with brokerage firms which are affiliates of the investment adviser. The commissions paid to these affiliated firms were $239 for the period. |
Income Tax Information |
At October 31, 2003, the fund had a capital loss carryforward of approximately $6,957,000 of which $2,681,000 and $4,276,000 will expire on October 31, 2009 and 2010, respectively. |
See accompanying notes which are an integral part of the financial statements.
Annual Report
Financial Statements
Statement of Assets and Liabilities
| October 31, 2003 |
| | |
Assets | | |
Investment in securities, at value (cost $17,064,191) - See accompanying schedule | | $ 19,917,032 |
Receivable for investments sold | | 529,337 |
Receivable for fund shares sold | | 22,942 |
Dividends receivable | | 48,600 |
Interest receivable | | 398 |
Prepaid expenses | | 97 |
Receivable from investment adviser for expense reductions | | 27,574 |
Total assets | | 20,545,980 |
| | |
Liabilities | | |
Payable to custodian bank | $ 2,151 | |
Payable for investments purchased | 386,816 | |
Payable for fund shares redeemed | 63,562 | |
Accrued management fee | 11,987 | |
Distribution fees payable | 10,957 | |
Other payables and accrued expenses | 53,329 | |
Total liabilities | | 528,802 |
| | |
Net Assets | | $ 20,017,178 |
Net Assets consist of: | | |
Paid in capital | | $ 24,199,899 |
Undistributed net investment income | | 39,615 |
Accumulated undistributed net realized gain (loss) on investments and foreign currency transactions | | (7,080,337) |
Net unrealized appreciation (depreciation) on investments and assets and liabilities in foreign currencies | | 2,858,001 |
Net Assets | | $ 20,017,178 |
See accompanying notes which are an integral part of the financial statements.
Annual Report
Financial Statements - continued
Statement of Assets and Liabilities - continued
| October 31, 2003 |
| | |
Calculation of Maximum Offering Price
Class A:
Net Asset Value and redemption price per share
($3,346,333 ÷ 334,723 shares) | | $ 10.00 |
| | |
Maximum offering price per share (100/94.25 of $10.00) | | $ 10.61 |
Class T:
Net Asset Value and redemption price per share ($7,628,125 ÷ 768,026 shares) | | $ 9.93 |
| | |
Maximum offering price per share (100/96.50 of $9.93) | | $ 10.29 |
Class B:
Net Asset Value and offering price per share ($5,596,099 ÷ 575,733 shares) A | | $ 9.72 |
| | |
Class C:
Net Asset Value and offering price per share ($3,075,844 ÷ 316,028 shares) A | | $ 9.73 |
| | |
| | |
Institutional Class:
Net Asset Value, offering price and redemption price per share ($370,777 ÷ 36,831 shares) | | $ 10.07 |
A Redemption price per share is equal to net asset value less any applicable contingent deferred sales charge.
See accompanying notes which are an integral part of the financial statements.
Annual Report
Statement of Operations
| Year ended October 31, 2003 |
| | |
Investment Income | | |
Dividends | | $ 427,461 |
Interest | | 10,864 |
Security lending | | 1,824 |
| | 440,149 |
Less foreign taxes withheld | | (48,712) |
Total income | | 391,437 |
| | |
Expenses | | |
Management fee | $ 131,763 | |
Transfer agent fees | 95,192 | |
Distribution fees | 120,853 | |
Accounting fees and security lending fees | 61,675 | |
Non-interested trustees' compensation | 74 | |
Custodian fees and expenses | 120,164 | |
Registration fees | 50,736 | |
Audit | 47,373 | |
Legal | 756 | |
Miscellaneous | 729 | |
Total expenses before reductions | 629,315 | |
Expense reductions | (249,713) | 379,602 |
Net investment income (loss) | | 11,835 |
Realized and Unrealized Gain (Loss) Net realized gain (loss) on: | | |
Investment securities | 1,066,391 | |
Foreign currency transactions | 12,439 | |
Total net realized gain (loss) | | 1,078,830 |
Change in net unrealized appreciation (depreciation) on: Investment securities | 3,060,143 | |
Assets and liabilities in foreign currencies | 2,018 | |
Total change in net unrealized appreciation (depreciation) | | 3,062,161 |
Net gain (loss) | | 4,140,991 |
Net increase (decrease) in net assets resulting from operations | | $ 4,152,826 |
See accompanying notes which are an integral part of the financial statements.
Annual Report
Financial Statements - continued
Statement of Changes in Net Assets
| Year ended
October 31,
2003 | Year ended
October 31,
2002 |
Increase (Decrease) in Net Assets | | |
Operations | | |
Net investment income (loss) | $ 11,835 | $ 12,890 |
Net realized gain (loss) | 1,078,830 | (4,196,134) |
Change in net unrealized appreciation (depreciation) | 3,062,161 | 1,907,542 |
Net increase (decrease) in net assets resulting
from operations | 4,152,826 | (2,275,702) |
Distributions to shareholders from net investment income | (44,256) | - |
Share transactions - net increase (decrease) | (2,514,690) | (3,347,014) |
Total increase (decrease) in net assets | 1,593,880 | (5,622,716) |
| | |
Net Assets | | |
Beginning of period | 18,423,298 | 24,046,014 |
End of period (including undistributed net investment income of $39,615 and undistributed net investment income of $23,625, respectively) | $ 20,017,178 | $ 18,423,298 |
See accompanying notes which are an integral part of the financial statements.
Annual Report
Financial Highlights - Class A
Years ended October 31, | 2003 | 2002 | 2001 | 2000 | 1999 F |
Selected Per-Share Data | | | | | |
Net asset value, beginning of period | $ 8.03 | $ 9.00 | $ 11.13 | $ 10.56 | $ 10.00 |
Income from Investment Operations | | | | | |
Net investment income (loss) E | .04 | .05 | .01 | (.02) | .05 |
Net realized and unrealized gain (loss) | 1.98 | (1.02) | (2.14) | .62 | .51 |
Total from investment operations | 2.02 | (.97) | (2.13) | .60 | .56 |
Distributions from net investment income | (.05) | - | - | (.03) | - |
Net asset value, end of period | $ 10.00 | $ 8.03 | $ 9.00 | $ 11.13 | $ 10.56 |
Total Return B,C,D | 25.30% | (10.78)% | (19.14)% | 5.67% | 5.60% |
Ratios to Average Net Assets G | | | | | |
Expenses before expense reductions | 3.07% | 2.57% | 2.16% | 1.97% | 3.52% A |
Expenses net of voluntary waivers, if any | 1.75% | 1.96% | 2.00% | 1.97% | 2.00% A |
Expenses net of all reductions | 1.69% | 1.91% | 1.95% | 1.93% | 1.96% A |
Net investment income (loss) | .49% | .48% | .14% | (.14)% | .56% A |
Supplemental Data | | | | | |
Net assets, end of period
(000 omitted) | $ 3,346 | $ 2,071 | $ 2,577 | $ 3,501 | $ 2,060 |
Portfolio turnover rate | 199% | 137% | 85% | 151% | 164% A |
A Annualized
B Total returns for periods of less than one year are not annualized.
C Total returns would have been lower had certain expenses not been reduced during the periods shown.
D Total returns do not include the effect of the sales charges.
E Calculated based on average shares outstanding during the period.
F For the period December 17, 1998 (commencement of operations) to October 31, 1999.
G Expense ratios reflect operating expenses of the class. Expenses before reductions do not reflect amounts reimbursed by the investment adviser or reductions from brokerage service arrangements or other expense offset arrangements and do not represent the amount paid by the class during periods when reimbursements or reductions occur. Expense ratios before reductions for start-up periods may not be representative of longer-term operating periods. Expenses net of any voluntary waivers reflect expenses after reimbursement by the investment adviser but prior to reductions from brokerage service arrangements or other expense offset arrangements. Expenses net of all reductions represent the net expenses paid by the class.
See accompanying notes which are an integral part of the financial statements.
Annual Report
Financial Highlights - Class T
Years ended October 31, | 2003 | 2002 | 2001 | 2000 | 1999 F |
Selected Per-Share Data | | | | | |
Net asset value, beginning of period | $ 7.98 | $ 8.95 | $ 11.09 | $ 10.54 | $ 10.00 |
Income from Investment Operations | | | | | |
Net investment income (loss) E | .02 | .02 | (.01) | (.05) | .03 |
Net realized and unrealized gain (loss) | 1.96 | (.99) | (2.13) | .62 | .51 |
Total from investment operations | 1.98 | (.97) | (2.14) | .57 | .54 |
Distributions from net investment income | (.03) | - | - | (.02) | - |
Net asset value, end of period | $ 9.93 | $ 7.98 | $ 8.95 | $ 11.09 | $ 10.54 |
Total Return B,C,D | 24.90% | (10.84)% | (19.30)% | 5.40% | 5.40% |
Ratios to Average Net Assets G | | | | | |
Expenses before expense reductions | 3.34% | 2.80% | 2.40% | 2.24% | 3.72% A |
Expenses net of voluntary waivers, if any | 2.00% | 2.20% | 2.25% | 2.24% | 2.25% A |
Expenses net of all reductions | 1.94% | 2.16% | 2.19% | 2.20% | 2.21% A |
Net investment income (loss) | .24% | .24% | (.10)% | (.41)% | .31% A |
Supplemental Data | | | | | |
Net assets, end of period
(000 omitted) | $ 7,628 | $ 7,079 | $ 9,749 | $ 15,505 | $ 12,343 |
Portfolio turnover rate | 199% | 137% | 85% | 151% | 164% A |
A Annualized
B Total returns for periods of less than one year are not annualized.
C Total returns would have been lower had certain expenses not been reduced during the periods shown.
D Total returns do not include the effect of the sales charges.
E Calculated based on average shares outstanding during the period.
F For the period December 17, 1998 (commencement of operations) to October 31, 1999.
G Expense ratios reflect operating expenses of the class. Expenses before reductions do not reflect amounts reimbursed by the investment adviser or reductions from brokerage service arrangements or other expense offset arrangements and do not represent the amount paid by the class during periods when reimbursements or reductions occur. Expense ratios before reductions for start-up periods may not be representative of longer-term operating periods. Expenses net of any voluntary waivers reflect expenses after reimbursement by the investment adviser but prior to reductions from brokerage service arrangements or other expense offset arrangements. Expenses net of all reductions represent the net expenses paid by the class.
See accompanying notes which are an integral part of the financial statements.
Annual Report
Financial Highlights - Class B
Years ended October 31, | 2003 | 2002 | 2001 | 2000 | 1999 F |
Selected Per-Share Data | | | | | |
Net asset value, beginning of period | $ 7.82 | $ 8.82 | $ 10.99 | $ 10.48 | $ 10.00 |
Income from Investment Operations | | | | | |
Net investment income (loss) E | (.02) | (.02) | (.06) | (.11) | (.02) |
Net realized and unrealized gain (loss) | 1.92 | (.98) | (2.11) | .62 | .50 |
Total from investment operations | 1.90 | (1.00) | (2.17) | .51 | .48 |
Net asset value, end of period | $ 9.72 | $ 7.82 | $ 8.82 | $ 10.99 | $ 10.48 |
Total Return B,C,D | 24.30% | (11.34)% | (19.75)% | 4.87% | 4.80% |
Ratios to Average Net Assets G | | | | | |
Expenses before expense reductions | 3.87% | 3.33% | 2.95% | 2.81% | 4.29% A |
Expenses net of voluntary waivers, if any | 2.50% | 2.70% | 2.75% | 2.75% | 2.75% A |
Expenses net of all reductions | 2.44% | 2.65% | 2.70% | 2.71% | 2.71% A |
Net investment income (loss) | (.26)% | (.26)% | (.61)% | (.91)% | (.19)% A |
Supplemental Data | | | | | |
Net assets, end of period
(000 omitted) | $ 5,596 | $ 5,717 | $ 6,507 | $ 8,132 | $ 3,765 |
Portfolio turnover rate | 199% | 137% | 85% | 151% | 164% A |
A Annualized
B Total returns for periods of less than one year are not annualized.
C Total returns would have been lower had certain expenses not been reduced during the periods shown.
D Total returns do not include the effect of the contingent deferred sales charge.
E Calculated based on average shares outstanding during the period.
F For the period December 17, 1998 (commencement of operations) to October 31, 1999.
G Expense ratios reflect operating expenses of the class. Expenses before reductions do not reflect amounts reimbursed by the investment adviser or reductions from brokerage service arrangements or other expense offset arrangements and do not represent the amount paid by the class during periods when reimbursements or reductions occur. Expense ratios before reductions for start-up periods may not be representative of longer-term operating periods. Expenses net of any voluntary waivers reflect expenses after reimbursement by the investment adviser but prior to reductions from brokerage service arrangements or other expense offset arrangements. Expenses net of all reductions represent the net expenses paid by the class.
See accompanying notes which are an integral part of the financial statements.
Annual Report
Financial Highlights - Class C
Years ended October 31, | 2003 | 2002 | 2001 | 2000 | 1999 F |
Selected Per-Share Data | | | | | |
Net asset value, beginning of period | $ 7.83 | $ 8.84 | $ 11.01 | $ 10.49 | $ 10.00 |
Income from Investment Operations | | | | | |
Net investment income (loss) E | (.02) | (.02) | (.06) | (.10) | (.02) |
Net realized and unrealized gain (loss) | 1.92 | (.99) | (2.11) | .62 | .51 |
Total from investment operations | 1.90 | (1.01) | (2.17) | .52 | .49 |
Net asset value, end of period | $ 9.73 | $ 7.83 | $ 8.84 | $ 11.01 | $ 10.49 |
Total Return B,C,D | 24.27% | (11.43)% | (19.71)% | 4.96% | 4.90% |
Ratios to Average Net Assets G | | | | | |
Expenses before expense reductions | 3.74% | 3.22% | 2.80% | 2.67% | 4.16% A |
Expenses net of voluntary waivers, if any | 2.50% | 2.71% | 2.75% | 2.67% | 2.75% A |
Expenses net of all reductions | 2.44% | 2.66% | 2.70% | 2.63% | 2.71% A |
Net investment income (loss) | (.26)% | (.27)% | (.61)% | (.84)% | (.19)% A |
Supplemental Data | | | | | |
Net assets, end of period
(000 omitted) | $ 3,076 | $ 2,876 | $ 4,393 | $ 7,117 | $ 3,894 |
Portfolio turnover rate | 199% | 137% | 85% | 151% | 164% A |
A Annualized
B Total returns for periods of less than one year are not annualized.
C Total returns would have been lower had certain expenses not been reduced during the periods shown.
D Total returns do not include the effect of the contingent deferred sales charge.
E Calculated based on average shares outstanding during the period.
F For the period December 17, 1998 (commencement of operations) to October 31, 1999.
G Expense ratios reflect operating expenses of the class. Expenses before reductions do not reflect amounts reimbursed by the investment adviser or reductions from brokerage service arrangements or other expense offset arrangements and do not represent the amount paid by the class during periods when reimbursements or reductions occur. Expense ratios before reductions for start-up periods may not be representative of longer-term operating periods. Expenses net of any voluntary waivers reflect expenses after reimbursement by the investment adviser but prior to reductions from brokerage service arrangements or other expense offset arrangements. Expenses net of all reductions represent the net expenses paid by the class.
See accompanying notes which are an integral part of the financial statements.
Annual Report
Financial Highlights - Institutional Class
Years ended October 31, | 2003 | 2002 | 2001 | 2000 | 1999 E |
Selected Per-Share Data | | | | | |
Net asset value, beginning of period | $ 8.10 | $ 9.05 | $ 11.16 | $ 10.58 | $ 10.00 |
Income from Investment Operations | | | | | |
Net investment income (loss) D | .06 | .07 | .04 | .02 | .07 |
Net realized and unrealized gain (loss) | 1.98 | (1.02) | (2.15) | .61 | .51 |
Total from investment operations | 2.04 | (.95) | (2.11) | .63 | .58 |
Distributions from net investment income | (.07) | - | - | (.05) | - |
Net asset value, end of period | $ 10.07 | $ 8.10 | $ 9.05 | $ 11.16 | $ 10.58 |
Total Return B,C | 25.39% | (10.50)% | (18.91)% | 5.94% | 5.80% |
Ratios to Average Net Assets F | | | | | |
Expenses before expense reductions | 2.56% | 2.07% | 1.75% | 1.70% | 3.31% A |
Expenses net of voluntary waivers, if any | 1.50% | 1.71% | 1.75% | 1.70% | 1.75% A |
Expenses net of all reductions | 1.44% | 1.66% | 1.69% | 1.66% | 1.71% A |
Net investment income (loss) | .73% | .74% | .40% | .14% | .81% A |
Supplemental Data | | | | | |
Net assets, end of period
(000 omitted) | $ 371 | $ 681 | $ 820 | $ 1,193 | $ 838 |
Portfolio turnover rate | 199% | 137% | 85% | 151% | 164% A |
A Annualized
B Total returns for periods of less than one year are not annualized.
C Total returns would have been lower had certain expenses not been reduced during the periods shown.
D Calculated based on average shares outstanding during the period.
E For the period December 17, 1998 (commencement of operations) to October 31, 1999.
F Expense ratios reflect operating expenses of the class. Expenses before reductions do not reflect amounts reimbursed by the investment adviser or reductions from brokerage service arrangements or other expense offset arrangements and do not represent the amount paid by the class during periods when reimbursements or reductions occur. Expense ratios before reductions for start-up periods may not be representative of longer-term operating periods. Expenses net of any voluntary waivers reflect expenses after reimbursement by the investment adviser but prior to reductions from brokerage service arrangements or other expense offset arrangements. Expenses net of all reductions represent the net expenses paid by the class.
See accompanying notes which are an integral part of the financial statements.
Annual Report
Notes to Financial Statements
For the period ended October 31, 2003
1. Significant Accounting Policies.
Fidelity Advisor Europe Capital Appreciation Fund (the fund) is a fund of Fidelity Advisor Series VIII (the trust) and is authorized to issue an unlimited number of shares. The trust is registered under the Investment Company Act of 1940, as amended (the 1940 Act), as an open-end management investment company organized as a Massachusetts business trust.
The fund offers Class A, Class T, Class B, Class C, and Institutional Class shares, each of which has equal rights as to assets and voting privileges. Each class has exclusive voting rights with respect to matters that affect that class. Class B shares will automatically convert to Class A shares after a holding period of seven years from the initial date of purchase. Investment income, realized and unrealized capital gains and losses, the common expenses of the fund, and certain fund-level expense reductions, if any, are allocated on a pro rata basis to each class based on the relative net assets of each class to the total net assets of the fund. Each class differs with respect to transfer agent and distribution and service plan fees incurred. Certain expense reductions also differ by class.
The financial statements have been prepared in conformity with accounting principles generally accepted in the United States of America, which require management to make certain estimates and assumptions at the date of the financial statements. The following summarizes the significant accounting policies of the fund:
Security Valuation. Net asset value per share (NAV calculation) is calculated as of the close of business of the New York Stock Exchange, normally 4:00 p.m. Eastern time. Equity securities for which market quotations are available are valued at the last sale price or official closing price (closing bid price or last evaluated quote if no sale has occurred) on the primary market or exchange on which they trade. Debt securities for which quotations are readily available are valued at their most recent bid prices (sales prices if the principal market is an exchange) in the principal market in which such securities are normally traded, as determined by recognized dealers in such securities, or securities are valued on the basis of information provided by a pricing service. Pricing services use valuation matrices that incorporate both dealer-supplied valuations and valuation models. If an event that is expected to materially affect the value of a security occurs after the close of an exchange or market on which that security trades, but prior to the NAV calculation, then that security will be fair valued taking the event into account. Securities (including restricted securities) for which market quotations are not readily available are valued at their fair value as determined in good faith under consistently applied procedures under the general supervision of the Board of Trustees. Price movements in futures contracts and ADRs, market and trading trends, the bid/ask quotes of brokers and off-exchange institutional trading may be reviewed in the course of making a good faith determination of a security's fair value. Short-term securities with
Annual Report
Notes to Financial Statements - continued
1. Significant Accounting Policies - continued
Annual Report
Security Valuation - continued
remaining maturities of sixty days or less for which quotations are not readily available are valued on the basis of amortized cost. Investments in open-end investment companies are valued at their net asset value each business day.
Foreign Currency. The fund uses foreign currency contracts to facilitate transactions in foreign-denominated securities. Losses from these transactions may arise from changes in the value of the foreign currency or if the counterparties do not perform under the contracts' terms.
Foreign denominated assets, including investment securities, and liabilities are translated into U.S. dollars at the exchange rate at period end. Purchases and sales of investment securities, income and dividends received and expenses denominated in foreign currencies are translated into U.S. dollars at the exchange rate in effect on the transaction date.
The effects of exchange rate fluctuations on investments are included with the net realized and unrealized gain (loss) on investment securities. Other foreign currency transactions resulting in realized and unrealized gain (loss) are disclosed separately.
Investment Transactions and Income. Security transactions are accounted for as of trade date. Gains and losses on securities sold are determined on the basis of identified cost. Dividend income is recorded on the ex-dividend date, except for certain dividends from foreign securities where the ex-dividend date may have passed, which are recorded as soon as the fund is informed of the ex-dividend date. Non-cash dividends included in dividend income, if any, are recorded at the fair market value of the securities received. Interest income is accrued as earned. Interest income includes coupon interest and amortization of premium and accretion of discount on debt securities, which is accrued using the interest method. Investment income is recorded net of foreign taxes withheld where recovery of such taxes is uncertain.
Expenses. Most expenses of the trust can be directly attributed to a fund. Expenses which cannot be directly attributed are apportioned among the funds in the trust.
Income Tax Information and Distributions to Shareholders. Each year the fund intends to qualify as a regulated investment company by distributing all of its taxable income and realized gains under Subchapter M of the Internal Revenue Code. As a result, no provision for income taxes is required in the accompanying financial statements. Foreign taxes are provided for based on each fund's understanding of the tax rules and rates that exist in the foreign markets in which it invests. Income dividends and capital gain distributions are declared separately for each class. Distributions are recorded on the ex-dividend date.
Annual Report
Notes to Financial Statements - continued
1. Significant Accounting Policies - continued
Income Tax Information and Distributions to Shareholders - continued
Income and capital gain distributions are determined in accordance with income tax regulations, which may differ from generally accepted accounting principles. Capital accounts within the financial statements are adjusted for permanent and temporary book and tax differences. These adjustments have no impact on net assets or the results of operations. Temporary differences will reverse in a subsequent period. These differences are primarily due to foreign currency transactions, certain foreign taxes, passive foreign investment companies (PFIC), capital loss carryforwards and losses deferred due to wash sales.
The tax-basis components of distributable earnings and the federal tax cost as of period end were as follows:
Unrealized appreciation | $ 3,054,340 | |
Unrealized depreciation | (358,214) | |
Net unrealized appreciation (depreciation) | 2,696,126 | |
Undistributed ordinary income | 78,215 | |
Capital loss carryforward | (6,957,067) | |
Cost for federal income tax purposes | $ 17,220,906 | |
The tax character of distributions paid was as follows:
| October 31,
2003 | October 31,
2002 |
Ordinary Income | $ 44,256 | $ - |
Short-Term Trading (Redemption) Fees. Shares purchased after March 31, 2004 and held in the fund less than 30 days will be subject to a short-term trading fee equal to 1.00% of the proceeds of the redeemed shares. The fee, which will be retained by the fund, is accounted for as an addition to paid in capital.
2. Operating Policies.
Repurchase Agreements. Fidelity Management & Research Company (FMR) has received an Exemptive Order from the Securities and Exchange Commission (the SEC) which permits the fund and other affiliated entities of FMR to transfer uninvested cash balances into joint trading accounts. These accounts are then invested in repurchase agreements that are collateralized by U.S. Treasury or Government obligations. The fund may also invest directly with institutions, in repurchase agreements that are collateralized by commercial paper obligations and corporate obligations. Collateral is held in segregated accounts with custodian banks and may be obtained in the event of a default
Annual Report
2. Operating Policies - continued
Repurchase Agreements - continued
of the counterparty. Collateral is marked-to-market daily and maintained at a value at least equal to the principal amount of the repurchase agreement (including accrued interest).
3. Purchases and Sales of Investments.
Information regarding purchases and sales of securities is included under the caption "Other Information" at the end of the fund's Schedule of Investments.
4. Fees and Other Transactions with Affiliates.
Management Fee. FMR and its affiliates provide the fund with investment management related services for which the fund pays a monthly management fee. The management fee is the sum of an individual fund fee rate that is based on an annual rate of .45% of the fund's average net assets and a group fee rate that averaged .28% during the period. The group fee rate is based upon the average net assets of all the mutual funds advised by FMR. The group fee rate decreases as assets under management increase and increases as assets under management decrease. For the period, the total annual management fee rate was .73% of the fund's average net assets.
Distribution and Service Plan. In accordance with Rule 12b-1 of the 1940 Act, the Fund has adopted separate Distribution and Service Plans for each class of shares. Certain classes pay Fidelity Distributors Corporation (FDC), an affiliate of FMR, separate Distribution and Service Fees, each of which is based on an annual percentage of each class' average net assets. Class A and Class T Plans also authorize the use of brokerage commissions to pay distribution expenses. This practice has been discontinued and no commissions incurred after June 30, 2003 have been used to pay distribution expenses. In addition, FDC may pay financial intermediaries for selling shares of the fund and providing shareholder support services. For the period, the Distribution and Service Fee rates, the total amounts paid to and retained by FDC and the amount of distribution expenses paid with brokerage commissions were as follows:
| Distribution
Fee | Service
Fee | Paid to
FDC | Retained
by FDC | Paid with
Commissions |
Class A | -% | .25% | $ 6,227 | $ 81 | $ - |
Class T | .25% | .25% | 34,624 | - | - |
Class B | .75% | .25% | 51,865 | 38,899 | - |
Class C | .75% | .25% | 28,137 | 1,807 | - |
| | | $ 120,853 | $ 40,787 | $ - |
Annual Report
Notes to Financial Statements - continued
4. Fees and Other Transactions with Affiliates - continued
Sales Load. FDC receives a front-end sales charge of up to 5.75% for selling Class A shares, and 3.50% for selling Class T shares of the fund. FDC receives the proceeds of contingent deferred sales charges levied on Class A, Class T, Class B, and Class C redemptions. These charges depend on the holding period. The deferred sales charges range from 5% to 1% for Class B, 1% for Class C, and .25% for certain purchases of Class A and Class T shares.
For the period, sales charge amounts retained by FDC were as follows:
| Retained
by FDC | |
Class A | $ 1,693 | |
Class T | 1,660 | |
Class B* | 19,581 | |
Class C* | 1,439 | |
| $ 24,373 | |
* When Class B and Class C shares are initially sold, FDC pays commissions from its own resources to financial intermediaries through
which the sales are made.
Transfer Agent Fees. Fidelity Investments Institutional Operations Company, Inc. (FIIOC), an affiliate of FMR, is the transfer, dividend disbursing and shareholder servicing agent (collectively referred to as the transfer agent) for each class of the fund. FIIOC receives account fees and asset-based fees that vary according to the account size and type of account of the shareholders of the respective classes of the fund. FIIOC pays for typesetting, printing and mailing of all shareholder reports, except proxy statements. For the period, the following amounts were paid to FIIOC:
| Amount | % of
Average
Net Assets |
Class A | $ 13,164 | .53 |
Class T | 37,892 | .55 |
Class B | 30,086 | .58 |
Class C | 12,521 | .44 |
Institutional Class | 1,529 | .27 |
| $ 95,192 | |
Accounting and Security Lending Fees. Fidelity Service Company, Inc. (FSC), an affiliate of FMR, maintains the fund's accounting records and administers the security lending program. The security lending fee is based on the number and duration of lending transactions. The accounting fee is based on the level of average net assets for the month plus out-of-pocket expenses.
Annual Report
4. Fees and Other Transactions with Affiliates - continued
Central Funds. The fund may invest in affiliated Central Funds managed by Fidelity Investments Money Management, Inc. (FIMM), an affiliate of FMR. The Central Funds are open-end investment companies available only to investment companies and other accounts managed by FMR and its affiliates. The Central Funds seek preservation of capital and current income and do not pay a management fee. Income distributions earned by the fund are recorded as income in the accompanying financial statements and totaled $11,202 for the period.
Brokerage Commissions. The fund placed a portion of its portfolio transactions with brokerage firms which are affiliates of the investment adviser. The commissions paid to these affiliated firms are shown under the caption "Other Information" at the end of the fund's Schedule of Investments.
5. Committed Line of Credit.
The fund participates with other funds managed by FMR in a $3.5 billion credit facility (the "line of credit") to be utilized for temporary or emergency purposes to fund shareholder redemptions or for other short-term liquidity purposes. The fund has agreed to pay commitment fees on its pro rata portion of the line of credit. During the period, there were no borrowings on this line of credit.
6. Security Lending.
The fund lends portfolio securities from time to time in order to earn additional income. The fund receives collateral (in the form of U.S. Treasury obligations, letters of credit and/or cash) against the loaned securities and maintains collateral in an amount not less than 100% of the market value of the loaned securities during the period of the loan. The market value of the loaned securities is determined at the close of business of the fund and any additional required collateral is delivered to the fund on the next business day. If the borrower defaults on its obligation to return the securities loaned because of insolvency or other reasons, a fund could experience delays and costs in recovering the securities loaned or in gaining access to the collateral. Cash collateral is invested in cash equivalents. At period end there were no security loans outstanding.
Annual Report
Notes to Financial Statements - continued
7. Expense Reductions.
FMR agreed to reimburse the classes of the fund to the extent operating expenses exceeded certain levels of average net assets as noted in the table below. Some expenses, for example interest expense, are excluded from this reimbursement.
| Expense
Limitations | Reimbursement
from adviser |
| | |
Class A | 1.75% | $ 33,042 |
Class T | 2.00% | 92,940 |
Class B | 2.50% | 71,304 |
Class C | 2.50% | 34,856 |
Institutional Class | 1.50% | 6,043 |
| | $ 238,185 |
Many of the brokers with whom FMR places trades on behalf of the fund provided services to the fund in addition to trade execution. These services may include payments of expenses on behalf of the fund to support distribution of fund shares for Class A and Class T ("Distribution Expense Reduction") and to pay other fund expenses, such as transfer agent fees ("Other Expense Reduction") collectively referred to as "Brokerage Service Arrangements" in the accompanying table. Brokerage service arrangements generally benefits all shareholders of each class by reducing fund expenses. Each of Class A and Class T shareholders' Other Expense Reduction benefit is reduced by the amount of any Distribution Expense Reduction.
| Brokerage Service Arrangements |
| Distribution
expense
reduction | Other
expense
reduction |
Fund Level | $ - | $ 11,528 |
Class A | - | - |
Class T | - | - |
| $ - | $ 11,528 |
8. Distributions to Shareholders.
Distributions to shareholders of each class were as follows:
Years ended October 31, | 2003 | 2002 |
From net investment income | | |
Class A | $ 12,873 | $ - |
Class T | 26,438 | - |
Institutional Class | 4,945 | - |
Total | $ 44,256 | $ - |
Annual Report
9. Share Transactions.
Transactions for each class of shares were as follows:
| Shares | Dollars |
Years ended October 31, | 2003 | 2002 | 2003 | 2002 |
Class A | | | | |
Shares sold | 316,316 | 427,176 | $ 2,713,286 | $ 3,978,076 |
Reinvestment of distributions | 1,448 | - | 11,764 | - |
Shares redeemed | (240,897) | (455,720) | (2,051,864) | (4,247,881) |
Net increase (decrease) | 76,867 | (28,544) | $ 673,186 | $ (269,805) |
Class T | | | | |
Shares sold | 153,987 | 242,800 | $ 1,293,026 | $ 2,191,017 |
Reinvestment of distributions | 3,125 | - | 25,256 | - |
Shares redeemed | (276,339) | (444,772) | (2,311,651) | (4,027,999) |
Net increase (decrease) | (119,227) | (201,972) | $ (993,369) | $ (1,836,982) |
Class B | | | | |
Shares sold | 116,409 | 256,719 | $ 971,513 | $ 2,405,037 |
Shares redeemed | (271,990) | (262,795) | (2,226,193) | (2,368,364) |
Net increase (decrease) | (155,581) | (6,076) | $ (1,254,680) | $ 36,673 |
Class C | | | | |
Shares sold | 51,238 | 101,482 | $ 440,459 | $ 918,375 |
Shares redeemed | (102,640) | (231,210) | (855,030) | (2,099,373) |
Net increase (decrease) | (51,402) | (129,728) | $ (414,571) | $ (1,180,998) |
Institutional Class | | | | |
Shares sold | 319,492 | 622,922 | $ 2,847,002 | $ 6,154,110 |
Reinvestment of distributions | 320 | - | 2,614 | - |
Shares redeemed | (367,066) | (629,370) | (3,374,872) | (6,250,012) |
Net increase (decrease) | (47,254) | (6,448) | $ (525,256) | $ (95,902) |
Annual Report
Independent Auditors' Report
To the Trustees of Fidelity Advisor Series VIII and Shareholders of Fidelity Advisor Europe Capital Appreciation Fund:
We have audited the accompanying statement of assets and liabilities of Fidelity Advisor Europe Capital Appreciation Fund (the Fund), a fund of Fidelity Advisor Series VIII, including the portfolio of investments, as of October 31, 2003, and the related statement of operations for the year then ended, the statement of changes in net assets for each of the two years in the period then ended, and the financial highlights for each of the five years in the period then ended. These financial statements and financial highlights are the responsibility of the Fund's management. Our responsibility is to express an opinion on these financial statements and financial highlights based on our audits.
We conducted our audits in accordance with auditing standards generally accepted in the United States of America. Those standards require that we plan and perform the audit to obtain reasonable assurance about whether the financial statements and financial highlights are free of material misstatement. An audit includes examining, on a test basis, evidence supporting the amounts and disclosures in the financial statements. Our procedures included confirmation of securities owned as of October 31, 2003, by correspondence with the custodian and brokers; where replies were not received from brokers, we performed other auditing procedures. An audit also includes assessing the accounting principles used and significant estimates made by management, as well as evaluating the overall financial statement presentation. We believe that our audits provide a reasonable basis for our opinion.
In our opinion, the financial statements and financial highlights referred to above present fairly, in all material respects, the financial position of Fidelity Advisor Europe Capital Appreciation Fund as of October 31, 2003, the results of its operations for the year then ended, the changes in its net assets for each of the two years in the period then ended, and its financial highlights for each of the five years in the period then ended, in conformity with accounting principles generally accepted in the United States of America.
/s/DELOITTE & TOUCHE LLP
DELOITTE & TOUCHE LLP
Boston, Massachusetts
December 12, 2003
Annual Report
Trustees and Officers
The Trustees, Members of the Advisory Board, and executive officers of the trust and fund, as applicable, are listed below. The Board of Trustees governs the fund and is responsible for protecting the interests of shareholders. The Trustees are experienced executives who meet periodically throughout the year to oversee the fund's activities, review contractual arrangements with companies that provide services to the fund, and review the fund's performance. Except for William O. McCoy, each of the Trustees oversees 289 funds advised by FMR or an affiliate. Mr. McCoy oversees 291 funds advised by FMR or an affiliate.
The Trustees hold office without limit in time except that (a) any Trustee may resign; (b) any Trustee may be removed by written instrument, signed by at least two-thirds of the number of Trustees prior to such removal; (c) any Trustee who requests to be retired or who has become incapacitated by illness or injury may be retired by written instrument signed by a majority of the other Trustees; and (d) any Trustee may be removed at any special meeting of shareholders by a two-thirds vote of the outstanding voting securities of the trust. In any event, each non-interested Trustee shall retire not later than the last day of the calendar year in which his or her 72nd birthday occurs. The executive officers and Advisory Board Member hold office without limit in time, except that any officer and Advisory Board Member may resign or may be removed by a vote of a majority of the Trustees at any regular meeting or any special meeting of the Trustees. Except as indicated, each individual has held the office shown or other offices in the same company for the past five years.
The fund's Statement of Additional Information (SAI) includes more information about the Trustees. To request a free copy, call Fidelity at 1-877-208-0098.
Interested Trustees*:
Correspondence intended for each Trustee who is an "interested person" (as defined in the 1940 Act) may be sent to 82 Devonshire Street, Boston, Massachusetts 02109.
Name, Age; Principal Occupation |
Edward C. Johnson 3d (73)** |
| Year of Election or Appointment: 1983 Mr. Johnson is Chairman of the Board of Trustees. Mr. Johnson serves as Chief Executive Officer, Chairman, and a Director of FMR Corp.; a Director and Chairman of the Board and of the Executive Committee of FMR; Chairman and a Director of Fidelity Management & Research (Far East) Inc.; Chairman (1998) and a Director of Fidelity Investments Money Management, Inc.; and Chairman (2001) and a Director (2000) of FMR Co., Inc. |
Abigail P. Johnson (41)** |
| Year of Election or Appointment: 2001 Senior Vice President of Advisor Europe Capital Appreciation (2001). Ms. Johnson also serves as Senior Vice President of other Fidelity funds (2001). She is President and a Director of FMR (2001), Fidelity Investments Money Management, Inc. (2001), FMR Co., Inc. (2001), and a Director of FMR Corp. Previously, Ms. Johnson managed a number of Fidelity funds. |
Laura B. Cronin (49) |
| Year of Election or Appointment: 2003 Ms. Cronin is an Executive Vice President (2002) and Chief Financial Officer (2002) of FMR Corp. and is a member of the Fidelity Management Committee (2003). Previously, Ms. Cronin served as Vice President of Finance of FMR (1997-1999), and Chief Financial Officer of FMR (1999-2001), Fidelity Personal Investments (2001), and Fidelity Brokerage Company (2001-2002). |
Robert L. Reynolds (51) |
| Year of Election or Appointment: 2003 Mr. Reynolds is a Director (2003) and Chief Operating Officer (2002) of FMR Corp. and is the head of the Fidelity Management Committee (2003). He also serves on the Board at Fidelity Investments Canada, Ltd. (2000). Previously, Mr. Reynolds served as President of Fidelity Investments Institutional Retirement Group (1996-2000). |
* Trustees have been determined to be "Interested Trustees" by virtue of, among other things, their affiliation with the trust or various entities under common control with FMR.
** Edward C. Johnson 3d, Trustee, is Abigail P. Johnson's father.
Annual Report
Non-Interested Trustees:
Correspondence intended for each non-interested Trustee (that is, the Trustees other than the Interested Trustees) may be sent to Fidelity Investments, P.O. Box 55235, Boston, Massachusetts 02205-5235.
Name, Age; Principal Occupation |
J. Michael Cook (61) |
| Year of Election or Appointment: 2001 Prior to Mr. Cook's retirement in May 1999, he served as Chairman and Chief Executive Officer of Deloitte & Touche LLP (accounting/consulting), Chairman of the Deloitte & Touche Foundation, and a member of the Board of Deloitte Touche Tohmatsu. He currently serves as a Director of Comcast (telecommunications, 2002), International Flavors & Fragrances, Inc. (2000), Rockwell Automation (2000) and The Dow Chemical Company (2000). He is a Member of the Diversity Advisory Council of Marakon (2003) and the Advisory Board of the Directorship Search Group, Chairman Emeritus of the Board of Catalyst (a leading organization for the advancement of women in business), and is Chairman of the Accountability Advisory Council to the Comptroller General of the United States. He also serves as a Member of the Advisory Board of the Graduate School of Business of the University of Florida, his alma mater. |
Ralph F. Cox (71) |
| Year of Election or Appointment: 1991 Mr. Cox is President of RABAR Enterprises (management consulting for the petroleum industry). Prior to February 1994, he was President of Greenhill Petroleum Corporation (petroleum exploration and production). Until March 1990, Mr. Cox was President and Chief Operating Officer of Union Pacific Resources Company (exploration and production). He is a Director of CH2M Hill Companies (engineering), and Abraxas Petroleum (petroleum exploration and production, 1999). In addition, he is a member of advisory boards of Texas A&M University and the University of Texas at Austin. |
Phyllis Burke Davis (71) |
| Year of Election or Appointment: 1992 Mrs. Davis is retired from Avon Products, Inc. (consumer products) where she held various positions including Senior Vice President of Corporate Affairs and Group Vice President of U.S. product marketing, sales, distribution, and manufacturing. Mrs. Davis is a member of the Board of Directors of the Southampton Hospital in Southampton, N.Y. (1998). Previously, she served as a Director of BellSouth Corporation (telecommunications), Eaton Corporation (diversified industrial), the TJX Companies, Inc. (retail stores), Hallmark Cards, Inc., and Nabisco Brands, Inc. |
Robert M. Gates (60) |
| Year of Election or Appointment: 1997 Dr. Gates is President of Texas A&M University (2002). He was Director of the Central Intelligence Agency (CIA) from 1991 to 1993. From 1989 to 1991, Dr. Gates served as Assistant to the President of the United States and Deputy National Security Advisor. Dr. Gates is a Director of NACCO Industries, Inc. (mining and manufacturing), and Parker Drilling Co., Inc. (drilling and rental tools for the energy industry, 2001). He also serves as a member of the Advisory Board of VoteHere.net (secure internet voting, 2001). Previously, Dr. Gates served as a Director of LucasVarity PLC (automotive components and diesel engines), a Director of TRW Inc. (automotive, space, defense, and information technology), and Dean of the George Bush School of Government and Public Service at Texas A&M University (1999-2001). Dr. Gates also is a Trustee of the Forum for International Policy. |
Donald J. Kirk (70) |
| Year of Election or Appointment: 1987 Mr. Kirk is a Governor of the American Stock Exchange (2001), a Trustee and former Chairman of the Board of Trustees of the Greenwich Hospital Association, a Director of the Yale-New Haven Health Services Corp. (1998), and a Director Emeritus and former Chairman of the Board of Directors of National Arts Strategies Inc. Mr. Kirk was an Executive-in-Residence (1995-2000) and a Professor (1987-1995) at Columbia University Graduate School of Business. Prior to 1987, he was Chairman of the Financial Accounting Standards Board. Previously, Mr. Kirk served as a Governor of the National Association of Securities Dealers, Inc. (1996-2002), a member and Vice Chairman of the Public Oversight Board of the American Institute of Certified Public Accountants' SEC Practice Section (1995-2002), a Director of General Re Corporation (reinsurance, 1987-1998) and as a Director of Valuation Research Corp. (appraisals and valuations). |
Marie L. Knowles (57) |
| Year of Election or Appointment: 2001 Prior to Ms. Knowles' retirement in June 2000, she served as Executive Vice President and Chief Financial Officer of Atlantic Richfield Company (ARCO) (diversified energy, 1996-2000). From 1993 to 1996, she was a Senior Vice President of ARCO and President of ARCO Transportation Company. She served as a Director of ARCO from 1996 to 1998. She currently serves as a Director of Phelps Dodge Corporation (copper mining and manufacturing), URS Corporation (multidisciplinary engineering, 1999), and McKesson Corporation (healthcare service, 2002). Ms. Knowles is a Trustee of the Brookings Institution and the Catalina Island Conservancy and also serves as a member of the Advisory Board for the School of Engineering of the University of Southern California. |
Ned C. Lautenbach (59) |
| Year of Election or Appointment: 2000 Mr. Lautenbach has been a partner of Clayton, Dubilier & Rice, Inc. (private equity investment firm) since September 1998. Previously, Mr. Lautenbach was with the International Business Machines Corporation (IBM) from 1968 until his retirement in 1998. He was most recently Senior Vice President and Group Executive of Worldwide Sales and Services. From 1993 to 1995, he was Chairman of IBM World Trade Corporation, and from 1994 to 1998 was a member of IBM's Corporate Executive Committee. Mr. Lautenbach serves as Chairman and as a Director (1998) of Acterna Corporation (communications test equipment). He is also Co-Chairman of Covansys, Inc. (global provider of business and technology solutions, 2000). In addition, he is a Director of Eaton Corporation (diversified industrial) and the Philharmonic Center for the Arts in Naples, Florida (1999). He also is a member of the Council on Foreign Relations. |
Marvin L. Mann (70) |
| Year of Election or Appointment: 1993 Mr. Mann is Chairman of the non-interested Trustees (2001). He is Chairman Emeritus of Lexmark International, Inc. (computer peripherals) where he served as CEO until April 1998 and retired as Chairman May 1999, and remains a member of the Board. Prior to 1991, he held the positions of Vice President of International Business Machines Corporation (IBM) and President and General Manager of various IBM divisions and subsidiaries. Mr. Mann is a Board member of Imation Corp. (imaging and information storage) and Acterna Corporation (communications test equipment, 1999). He is also a member of the Director Services Committee of the Investment Company Institute. In addition, Mr. Mann is a member of the President's Cabinet at the University of Alabama and the Board of Visitors of the Culverhouse College of Commerce and Business Administration at the University of Alabama. |
William O. McCoy (70) |
| Year of Election or Appointment: 1997 Prior to his retirement in December 1994, Mr. McCoy was Vice Chairman of the Board of BellSouth Corporation (telecommunications) and President of BellSouth Enterprises. He is currently a Director of Liberty Corporation (holding company), Duke Realty Corporation (real estate), Progress Energy, Inc. (electric utility), and Acterna Corporation (communications test equipment, 1999). He is also a partner of Franklin Street Partners (private investment management firm) and a member of the Research Triangle Foundation Board. In addition, Mr. McCoy served as the Interim Chancellor (1999-2000) and a member of the Board of Visitors (1994-1998) for the University of North Carolina at Chapel Hill and currently serves on the Board of Directors of the University of North Carolina Health Care System and the Board of Visitors of the Kenan-Flagler Business School (University of North Carolina at Chapel Hill). He also served as Vice President of Finance for the University of North Carolina (16-school system, 1995-1998). |
William S. Stavropoulos (64) |
| Year of Election or Appointment: 2001 Mr. Stavropoulos is Chairman of the Board, President and CEO (2002), and Chairman of the Executive Committee (2000) and a Director of The Dow Chemical Company. Since joining The Dow Chemical Company in 1967, Mr. Stavropoulos served in numerous senior management positions, including President (1993-2000) and Chief Executive Officer (1995-2000). Currently, he is a Director of NCR Corporation (data warehousing and technology solutions), BellSouth Corporation (telecommunications), Chemical Financial Corporation, and Maersk Inc. (industrial conglomerate, 2002). He also serves as a member of the Board of Trustees of the American Enterprise Institute for Public Policy Research. In addition, Mr. Stavropoulos is a member of The Business Council, J.P. Morgan International Council, World Business Council for Sustainable Development, and the University of Notre Dame Advisory Council for the College of Science. |
Annual Report
Trustees and Officers - continued
Advisory Board Members and Executive Officers:
Correspondence intended for Dr. Heilmeier may be sent to Fidelity Investments, P.O. Box 55235, Boston, Massachusetts 02205-5235. Correspondence intended for each executive officer and Mr. Lynch may be sent to 82 Devonshire Street, Boston, Massachusetts 02109.
Name, Age; Principal Occupation |
George H. Heilmeier (67) |
| Year of Election or Appointment: 2003 Member of the Advisory Board of Fidelity Advisor Series VIII. Dr. Heilmeier is Chairman Emeritus of Telcordia Technologies (communication software and systems), where prior to his retirement, he served as company Chairman and Chief Executive Officer. He currently serves on the Boards of Directors of The Mitre Corporation (systems engineering and information technology support for the government), INET Technologies Inc. (telecommunications network surveillance, 2001) and Teletech Holdings (customer management services, 1998). He is Chairman of the General Motors Technology Advisory Committee and a Life Fellow of the IEEE (2000). Dr. Heilmeier is a member of the Defense Science Board and the National Security Agency Advisory Board. He is also a member of the National Academy of Engineering, the American Academy of Arts and Sciences and The Board of Overseers of the School of Engineering and Applied Science of the University of Pennsylvania. Previously, Dr. Heilmeier served as a Director of TRW Inc. (automotive, space, defense, and information technology, 1992-2002) and Compaq (1994-2002). |
Peter S. Lynch (60) |
| Year of Election or Appointment: 2003 Member of the Advisory Board of Fidelity Advisor VIII. Vice Chairman and a Director of FMR, and Vice Chairman (2001) and a Director (2000) of FMR Co., Inc. Previously, Mr. Lynch served as a Trustee of the Fidelity funds (1990-2003). Prior to May 31, 1990, he was a Director of FMR and Executive Vice President of FMR (a position he held until March 31, 1991), Vice President of Fidelity® Magellan® Fund and FMR Growth Group Leader, and Managing Director of FMR Corp. Mr. Lynch was also Vice President of Fidelity Investments Corporate Services. In addition, he serves as a Trustee of Boston College, Massachusetts Eye & Ear Infirmary, Historic Deerfield, John F. Kennedy Library, and the Museum of Fine Arts of Boston. |
Philip L. Bullen (44) |
| Year of Election or Appointment: 2001 Vice President of Advisor Europe Capital Appreciation. Mr. Bullen also serves as Vice President of certain Equity Funds (2001) and certain High Income Funds (2001). He is Senior Vice President of FMR (2001) and FMR Co., Inc. (2001), President and a Director of Fidelity Management & Research (Far East) Inc. (2001), President and a Director of Fidelity Management & Research (U.K.) Inc. (2002), and a Director of Strategic Advisers, Inc. (2002). Before joining Fidelity Investments, Mr. Bullen was President and Chief Investment Officer of Santander Global Advisors (1997-2000) and President and Chief Executive Officer of Boston's Baring Asset Management Inc. (1994-1997). |
Ian Hart (36) |
| Year of Election or Appointment: 2001 Vice President of Advisor Europe Capital Appreciation. Mr. Hart is also Vice President of another fund advised by FMR. Prior to assuming his current responsibilities, Mr. Hart managed a variety of Fidelity funds. |
Eric D. Roiter (54) |
| Year of Election or Appointment: 1998 Secretary of Advisor Europe Capital Appreciation. He also serves as Secretary of other Fidelity funds (1998); Vice President, General Counsel, and Clerk of FMR Co., Inc. (2001) and FMR (1998); Vice President and Clerk of FDC (1998); Assistant Clerk of Fidelity Management & Research (U.K.) Inc. (2001) and Fidelity Management & Research (Far East) Inc. (2001); and Assistant Secretary of Fidelity Investments Money Management Inc. (2001). Prior to joining Fidelity, Mr. Roiter was with the law firm of Debevoise & Plimpton, as an associate (1981-1984) and as a partner (1985-1997), and served as an Assistant General Counsel of the U.S. Securities and Exchange Commission (1979-1981). Mr. Roiter is an Adjunct Member, Faculty of Law, at Boston College Law School (2003). |
Stuart Fross (44) |
| Year of Election or Appointment: 2003 Assistant Secretary of Advisor Europe Capital Appreciation. Mr. Fross also serves as Assistant Secretary of other Fidelity funds (2003) and is an employee of FMR. |
Maria F. Dwyer (44) |
| Year of Election or Appointment: 2002 President and Treasurer of Advisor Europe Capital Appreciation. Ms. Dwyer also serves as President and Treasurer of other Fidelity funds (2002) and is a Vice President (1999) and an employee (1996) of FMR. Prior to joining Fidelity, Ms. Dwyer served as Director of Compliance for MFS Investment Management. |
Timothy F. Hayes (52) |
| Year of Election or Appointment: 2002 Chief Financial Officer of Advisor Europe Capital Appreciation. Mr. Hayes also serves as Chief Financial Officer of other Fidelity funds (2002). Recently he was appointed President of Fidelity Service Company (2003) where he also serves as a Director. Mr. Hayes also serves as President of Fidelity Investments Operations Group (FIOG, 2002), which includes Fidelity Pricing and Cash Management Services Group (FPCMS), where he was appointed President in 1998. Previously, Mr. Hayes served as Chief Financial Officer of Fidelity Investments Corporate Systems and Service Group (1998) and Fidelity Systems Company (1997-1998). |
John R. Hebble (45) |
| Year of Election or Appointment: 2003 Deputy Treasurer of Advisor Europe Capital Appreciation. Mr. Hebble also serves as Deputy Treasurer of other Fidelity funds (2003), and is an employee of FMR. Before joining Fidelity Investments, Mr. Hebble worked at Deutsche Asset Management where he served as Director of Fund Accounting (2002-2003) and Assistant Treasurer of the Scudder Funds (1998-2003). |
John H. Costello (57) |
| Year of Election or Appointment: 1998 Assistant Treasurer of Advisor Europe Capital Appreciation. Mr. Costello also serves as Assistant Treasurer of other Fidelity funds and is an employee of FMR. |
Francis V. Knox, Jr. (56) |
| Year of Election or Appointment: 2002 Assistant Treasurer of Advisor Europe Capital Appreciation. Mr. Knox also serves as Assistant Treasurer of other Fidelity funds (2002), and is a Vice President and an employee of FMR. Previously, Mr. Knox served as Vice President of Investment & Advisor Compliance (1990-2001), and Compliance Officer of Fidelity Management & Research (U.K.) Inc. (1992-2002), Fidelity Management & Research (Far East) Inc. (1991-2002), and FMR Corp. (1995-2002). |
Mark Osterheld (48) |
| Year of Election or Appointment: 2002 Assistant Treasurer of Advisor Europe Capital Appreciation. Mr. Osterheld also serves as Assistant Treasurer of other Fidelity funds (2002) and is an employee of FMR. |
Thomas J. Simpson (45) |
| Year of Election or Appointment: 2000 Assistant Treasurer of Advisor Europe Capital Appreciation. Mr. Simpson is Assistant Treasurer of other Fidelity funds (2000) and an employee of FMR (1996). Prior to joining FMR, Mr. Simpson was Vice President and Fund Controller of Liberty Investment Services (1987-1995). |
Annual Report
Distributions
The amounts per share which represent income derived from sources within, and taxes paid to, foreign countries or possessions of the United States are as follows:
| Pay Date | Income | Taxes |
Class A | 12/9/02 | $.072 | $.022 |
Class T | 12/9/02 | $.052 | $.022 |
Annual Report
Annual Report
Annual Report
Investment Adviser
Fidelity Management & Research Company
Boston, MA
Investment Sub-Advisers
FMR Co., Inc.
Fidelity Management & Research
(U.K.) Inc.
Fidelity Management & Research
(Far East) Inc.
Fidelity International
Investment Advisors
Fidelity Investments Japan Limited
Fidelity International Investment Advisors (U.K.) Limited
General Distributor
Fidelity Distributors Corporation
Boston, MA
Transfer and Shareholder
Servicing Agents
Fidelity Investments Institutional Operations Company, Inc.
Boston, MA
Custodian
State Street Bank and Trust Company
Quincy, MA
Annual Report
Fidelity Advisor Aggressive Growth Fund |
Fidelity Advisor Asset Allocation Fund |
Fidelity Advisor Balanced Fund |
Fidelity Advisor Biotechnology Fund |
Fidelity Advisor California Municipal Income Fund |
Fidelity Advisor Consumer Industries Fund |
Fidelity Advisor Cyclical Industries Fund |
Fidelity Advisor Developing Communications Fund |
Fidelity Advisor Diversified International Fund |
Fidelity Advisor Dividend Growth Fund |
Fidelity Advisor Dynamic Capital Appreciation Fund |
Fidelity Advisor Electronics Fund |
Fidelity Advisor Emerging Asia Fund |
Fidelity Advisor Emerging Markets Income Fund |
Fidelity Advisor Equity Growth Fund |
Fidelity Advisor Equity Income Fund |
Fidelity Advisor Equity Value Fund |
Fidelity Advisor Europe Capital Appreciation Fund |
Fidelity Advisor Fifty Fund |
Fidelity Advisor Financial Services Fund |
Fidelity Advisor Floating Rate High Income Fund |
Fidelity Advisor Freedom Income FundSM |
Fidelity Advisor Freedom 2010 FundSM |
Fidelity Advisor Freedom 2020 FundSM |
Fidelity Advisor Freedom 2030 FundSM |
Fidelity Advisor Freedom 2040 FundSM |
Fidelity Advisor Global Equity Fund |
Fidelity Advisor Government Investment Fund |
Fidelity Advisor Growth & Income Fund |
Fidelity Advisor Growth Opportunities |
Fidelity Advisor Health Care Fund |
Fidelity Advisor High Income Advantage Fund |
Fidelity Advisor High Income Fund |
Fidelity Advisor Inflation-Protected Bond Fund |
Fidelity Advisor Intermediate Bond Fund |
Fidelity Advisor International Capital Appreciation Fund |
Fidelity Advisor International Small Cap Fund |
Fidelity Advisor Investment Grade Bond Fund |
Fidelity Advisor Japan Fund |
Fidelity Advisor Korea Fund |
Fidelity Advisor Large Cap Fund |
Fidelity Advisor Latin America Fund |
Fidelity Advisor Leveraged Company Stock Fund |
Fidelity Advisor Mid Cap Fund |
Fidelity Advisor Mortgage Securities Fund |
Fidelity Advisor Municipal Income Fund |
Fidelity Advisor Natural Resources Fund |
Fidelity Advisor New Insights Fund |
Fidelity Advisor New York Municipal Income Fund |
Fidelity Advisor Overseas Fund |
Fidelity Advisor Real Estate Fund |
Fidelity Advisor Short Fixed-Income Fund |
Fidelity Advisor Short Intermediate Municipal Income Fund |
Fidelity Advisor Small Cap Fund |
Fidelity Advisor Strategic Growth Fund |
Fidelity Advisor Strategic Income Fund |
Fidelity Advisor Tax Managed
Stock Fund |
Fidelity Advisor Technology Fund |
Fidelity Advisor Telecommunications & Utilities Growth Fund |
Fidelity Advisor Value Leaders Fund |
Fidelity Advisor Value Strategies Fund |
Prime Fund |
Tax-Exempt Fund |
Treasury Fund |
(Fidelity Investment logo)(registered trademark)
Corporate Headquarters
82 Devonshire St., Boston, MA 02109
www.fidelity.com
AEUR-UANN-1203
1.784739.100
Fidelity® Advisor
Europe Capital Appreciation
Fund - Institutional Class
Annual Report
October 31, 2003
(2_fidelity_logos) (Registered_Trademark)
Contents
Chairman's Message | <Click Here> | Ned Johnson's message to shareholders. |
Performance | <Click Here> | How the fund has done over time. |
Management's Discussion | <Click Here> | The manager's review of fund performance, strategy and outlook. |
Investment Changes | <Click Here> | A summary of major shifts in the fund's investments over the past six months. |
Investments | <Click Here> | A complete list of the fund's investments with their market values. |
Financial Statements | <Click Here> | Statements of assets and liabilities, operations, and changes in net assets,
as well as financial highlights. |
Notes | <Click Here> | Notes to the financial statements. |
Auditors' Opinion | <Click Here> | |
Trustees and Officers | <Click Here> | |
Distributions | <Click Here> | |
For a free copy of the fund's proxy voting guidelines call 1-877-208-0098 or visit the Securities and Exchange Commission (SEC)'s web site at www.sec.gov.
Third party marks appearing herein are the property of their respective owners.
All other marks appearing herein are registered or unregistered trademarks or service marks of FMR Corp. or an affiliated company.
(Recycle graphic) This report is printed on recycled paper using soy-based inks.
This report and the financial statements contained herein are submitted for the general information of the shareholders of the fund. This report is not authorized for distribution to prospective investors in the fund unless preceded or accompanied by an effective prospectus.
Mutual fund shares are not deposits or obligations of, or guaranteed by, any depository institution. Shares are not insured by the FDIC, Federal Reserve Board or any other agency, and are subject to investment risks, including possible loss of principal amount invested.
Neither the fund nor Fidelity Distributors Corporation is a bank.
For more information on any Fidelity Advisor fund, including charges and expenses, contact your investment professional for a free prospectus. Read it carefully before you invest or send money.
Annual Report
Chairman's Message
(photo_of_Edward_C_Johnson_3d)
Dear Shareholder:
Many of you have read or heard news stories recently that were critical of mutual funds and made allegations that the mutual fund industry has been less than forthright. I find these reports unsettling and not necessarily an accurate picture of the overall industry, and I would like you to know where we at Fidelity stand.
With specific regard to allegations that certain mutual fund companies were violating the Securities and Exchange Commission's forward pricing rules or were involved in so-called "market timing" activities, I want to say two things:
First, Fidelity does not have agreements that permit customers who buy fund shares after 4 p.m. to obtain the 4 p.m. price. This is not to say that someone could not deceive the company through fraudulent acts. But I underscore that we have no so-called "agreements" which would permit this illegal practice.
Second, Fidelity has been on record for years opposing predatory short-term trading which adversely affects other shareholders in a mutual fund. In fact, in the 1980s, we began charging a fee - which is returned to the fund and, therefore, to investors - to discourage this activity. What's more, several years ago we took the industry lead in developing a Fair Value Pricing Policy to prevent market timing on foreign securities in our funds. It is reasonable to assume that another structure can be developed that would alter the system to make it much more difficult for predatory traders to operate. This, however, will only be achieved through close cooperation among regulators, legislators and the industry.
Certainly no industry is perfect, and there have been instances of unethical and illegal activity from time to time within the mutual fund industry. When this occurs, confessed or convicted offenders should be dealt with appropriately. Clearly, every system can be improved. We applaud well thought out improvements by regulators, legislators and industry representatives that achieve the common goal of building and protecting the value of investors' holdings. But we remain concerned about the risk of over-regulation and the quick application of simplistic solutions to intricate problems.
For more than 57 years, Fidelity Investments has worked very hard to improve its products and service to justify your trust. When our family founded this company in 1946, we had only a few hundred customers. Many of them were family and friends. Today, we serve more than 18 million customers including individual investors and participants in retirement plans across America.
Let me close by saying that we do not take your trust in us for granted, and we realize that we must always work to improve all aspects of our service to you. In turn, we urge you to continue your active participation with your financial matters, so that your interests can be well served.
Annual Report
Best regards,
/s/Edward C. Johnson 3d
Edward C. Johnson 3d
Annual Report
Performance: The Bottom Line
Average annual total return reflects the change in the value of an investment, assuming reinvestment of the class' dividend income and capital gains (the profits earned upon the sale of securities that have grown in value) and assuming a constant rate of performance each year. During periods of reimbursement by Fidelity, a fund's total return will be greater than it would be had the reimbursement not occurred. The $10,000 table and the fund's returns do not reflect the deduction of taxes that a shareholder would pay on fund distributions or the redemption of fund shares. How a fund did yesterday is no guarantee of how it will do tomorrow.
Average Annual Total Returns
Periods ended October 31, 2003 | Past 1
year | Life of
fundA |
Institutional Class | 25.39% | 0.41% |
A From December 17, 1998.
$10,000 Over Life of Fund
Let's say hypothetically that $10,000 was invested in Fidelity® Advisor Europe Capital Appreciation Fund - Institutional Class on December 17, 1998, when the fund started. The chart shows how the value of your investment would have grown, and also shows how the MSCI® Europe Index did over the same period.
Annual Report
Management's Discussion of Fund Performance
Comments from Ian Hart, Portfolio Manager of Fidelity® Advisor Europe Capital Appreciation Fund
Mirroring the U.S. rally, most international stock markets rebounded sharply during the 12-month period ending October 31, 2003. Encouraged by improved corporate earnings, favorable interest rates and the easing of geopolitical tensions, the Morgan Stanley Capital InternationalSM Europe, Australasia, Far East (MSCI® EAFE®) Index - a proxy for stock markets outside the United States and Canada - gained 27.39% during the past year. From a regional perspective, all 16 countries in the MSCI Europe index - which gained 24.56% - - had double-digit advances. Spain, Denmark and Sweden were among the region's best performers. In Japan, increased capital spending, exports and machinery orders helped the Tokyo Stock Exchange Stock Price Index (TOPIX) advance 36.39%. Following the SARS epidemic, other Asian markets also rebounded. For instance, the Hong Kong market, as measured by the Hang Seng Index, gained 34.51%. Emerging markets also fared well, particularly Latin America. The MSCI Emerging Markets Free Latin America index rose 59.75%. Canadian equities, as measured by the S&P/TSX Composite Index, also posted an impressive annual gain, advancing 50.66%.
For the 12-month period that ended October 31, 2003, the fund's Institutional Class shares had a return of 25.39%. By comparison, the Morgan Stanley Capital International Europe Index posted a total return of 24.56% for the same period, while the LipperSM European Region Funds Average returned 23.64%. Stock picking accounted for most of the fund's outperformance, with individual stocks in the telecommunications space - notably Ericsson, Alcatel, Mobistar and Versatel - providing very attractive gains. Solid performance from such top-10 holdings as Germany's Deutsche Boerse and France's SEB also boosted returns. The fund was hurt by an underweighted position in the banking sector and disappointing earnings growth from companies such as Van Der Moolen, the Dutch market maker, and Ahold, the Dutch food retailer. Unilever, the Anglo-Dutch consumer goods company, also detracted from performance.
The views expressed in this statement reflect those of the portfolio manager only through the end of the period of the report as stated on the cover and do not necessarily represent the views of Fidelity or any other person in the Fidelity organization. Any such views are subject to change at any time based upon market or other conditions and Fidelity disclaims any responsibility to update such views. These views may not be relied on as investment advice and, because investment decisions for a Fidelity fund are based on numerous factors, may not be relied on as an indication of trading intent on behalf of any Fidelity fund.
Annual Report
Investment Changes
Top Five Stocks as of October 31, 2003 |
| % of fund's
net assets | % of fund's net assets
6 months ago |
Deutsche Boerse AG (Germany, Diversified Financial Services) | 6.6 | 6.6 |
Vodafone Group PLC (United Kingdom, Wireless Telecommunication Services) | 3.1 | 3.5 |
Marks & Spencer Group PLC (United Kingdom, Multiline Retail) | 2.9 | 0.0 |
Unilever PLC (United Kingdom, Food Products) | 2.1 | 2.7 |
British Sky Broadcasting Group PLC (BSkyB) (United Kingdom, Media) | 1.8 | 0.9 |
| 16.5 | |
Top Five Market Sectors as of October 31, 2003 |
| % of fund's
net assets | % of fund's net assets
6 months ago |
Consumer Discretionary | 22.5 | 15.7 |
Financials | 20.8 | 21.0 |
Telecommunication Services | 16.9 | 10.8 |
Health Care | 12.1 | 14.3 |
Information Technology | 9.3 | 4.4 |
Top Five Countries as of October 31, 2003 |
(excluding cash equivalents) | % of fund's
net assets | % of fund's net assets
6 months ago |
United Kingdom | 31.6 | 33.1 |
Germany | 16.3 | 18.5 |
France | 10.3 | 13.2 |
Switzerland | 6.6 | 11.1 |
Sweden | 5.7 | 1.8 |
Percentages are adjusted for the effect of open futures contracts, if applicable. |
Asset Allocation (% of fund's net assets) |
As of October 31, 2003 | As of April 30, 2003 |
| Stocks 95.8% | | | Stocks 96.9% | |
| Bonds 0.8% | | | Bonds 0.0% | |
| Short-Term
Investments and
Net Other Assets 3.4% | | | Short-Term
Investments and
Net Other Assets 3.1% | |
Annual Report
Investments October 31, 2003
Showing Percentage of Net Assets
Common Stocks - 94.1% |
| Shares | | Value (Note 1) |
Belgium - 0.7% |
Mobistar SA (a) | 2,700 | | $ 135,122 |
Denmark - 3.6% |
A.P. Moller - Maersk AS Series B | 10 | | 78,228 |
Bryggerigruppen AS | 1,000 | | 55,477 |
Coloplast AS Series B | 3,200 | | 268,283 |
Danske Bank AS | 7,900 | | 158,810 |
Novo Nordisk AS Series B | 4,700 | | 168,456 |
TOTAL DENMARK | | 729,254 |
Finland - 0.6% |
Comptel Oyj (a) | 17,800 | | 45,984 |
F-Secure Oyj (a) | 46,600 | | 72,878 |
TOTAL FINLAND | | 118,862 |
France - 10.3% |
Alcatel SA sponsored ADR (a) | 10,600 | | 139,708 |
Assurances Generales France (Bearer) | 200 | | 10,519 |
Cap Gemini SA (a) | 1,200 | | 60,263 |
Casino Guichard Perrachon et Compagnie | 1,400 | | 127,719 |
CNP Assurances | 2,100 | | 95,437 |
France Telecom SA (a) | 2,000 | | 48,238 |
France Telecom SA sponsored ADR | 6,300 | | 152,712 |
L'Oreal SA | 4,100 | | 302,077 |
NRJ Group | 7,000 | | 136,639 |
Pernod-Ricard | 3,725 | | 358,164 |
SEB SA | 2,200 | | 241,606 |
Suez SA (France) | 6,100 | | 97,518 |
Vivendi Universal SA (a) | 3,900 | | 81,639 |
Vivendi Universal SA sponsored ADR (a) | 6,000 | | 126,180 |
Wanadoo SA (a) | 10,600 | | 78,589 |
TOTAL FRANCE | | 2,057,008 |
Germany - 15.1% |
Adidas-Salomon AG | 1,200 | | 110,794 |
Allianz AG (Reg.) | 2,500 | | 267,081 |
Bayerische Hypo Und Verein AG (a) | 2,900 | | 63,663 |
Celanese AG (Reg.) | 3,100 | | 107,484 |
DAB Bank AG (a) | 21,600 | | 177,160 |
Deutsche Boerse AG | 23,708 | | 1,313,355 |
Deutsche Telekom AG (Reg.) (a) | 18,000 | | 280,980 |
Fresenius Medical Care AG | 3,300 | | 187,513 |
Fresenius Medical Care AG sponsored ADR | 1 | | 19 |
Common Stocks - continued |
| Shares | | Value (Note 1) |
Germany - continued |
Puma AG | 500 | | $ 72,681 |
SAP AG | 800 | | 116,928 |
Sixt AG | 5,600 | | 62,408 |
T-Online International AG (a) | 10,800 | | 139,250 |
Zapf Creation AG (a) | 3,900 | | 120,449 |
TOTAL GERMANY | | 3,019,765 |
Israel - 0.4% |
Emblaze Ltd. (a) | 37,400 | | 88,402 |
Italy - 2.7% |
Amplifon Spa | 2,100 | | 53,764 |
Banca Intesa Spa | 22,031 | | 74,166 |
Banca Nazionale del Lavoro (BNL) (a) | 36,800 | | 83,557 |
Bulgari Spa | 11,100 | | 100,414 |
Fiat Spa (a) | 16,500 | | 128,736 |
Telecom Italia Spa | 37,770 | | 98,229 |
TOTAL ITALY | | 538,866 |
Luxembourg - 0.3% |
Metro International SA Swedish Depositary Receipt
(A Shares) (a) | 51,300 | | 57,635 |
Netherlands - 4.8% |
Completel Europe NV (a) | 6,342 | | 168,978 |
Equant NV (a) | 5,800 | | 51,064 |
ING Groep NV (Certificaten Van Aandelen) | 8,530 | | 177,765 |
Koninklijke KPN NV (a) | 38,800 | | 293,959 |
Koninklijke Philips Electronics NV | 3,500 | | 93,940 |
Koninklijke Philips Electronics NV (NY Shares) | 3,100 | | 83,204 |
Samas Groep NV (Certificaten Van Aandelen) | 7,600 | | 42,524 |
Versatel Telecom International NV (a) | 23,200 | | 53,215 |
TOTAL NETHERLANDS | | 964,649 |
Norway - 2.3% |
Storebrand ASA (A Shares) (a) | 33,000 | | 182,874 |
TANDBERG Television ASA (a) | 73,700 | | 275,735 |
TOTAL NORWAY | | 458,609 |
Russia - 1.6% |
Lukoil Oil Co. sponsored ADR | 1,200 | | 97,560 |
OAO Gazprom sponsored ADR | 5,900 | | 141,600 |
Vimpel Communications sponsored ADR (a) | 1,200 | | 78,120 |
TOTAL RUSSIA | | 317,280 |
Common Stocks - continued |
| Shares | | Value (Note 1) |
Spain - 4.7% |
Antena 3 Television SA (a) | 20 | | $ 651 |
Banco Espanol de Credito SA (Reg.) | 6,800 | | 68,061 |
Corporacion Mapfre SA (Reg.) | 16,000 | | 198,697 |
Grupo Auxiliar Metalurgico SA (Gamesa) | 4,200 | | 113,269 |
Prosegur Comp Securidad SA (Reg.) | 7,600 | | 123,259 |
Repsol YPF SA | 6,200 | | 107,694 |
Telefonica SA | 6,000 | | 74,800 |
Telefonica SA sponsored ADR | 6,681 | | 249,869 |
TOTAL SPAIN | | 936,300 |
Sweden - 5.7% |
Eniro AB | 15,800 | | 126,072 |
Modern Times Group AB (MTG) (B Shares) (a) | 14,000 | | 261,848 |
OMHEX AB | 23,250 | | 237,463 |
Song Networks Holding AB (a) | 24,400 | | 158,870 |
Tele2 AB (B Shares) (a) | 4,100 | | 205,450 |
Telefonaktiebolaget LM Ericsson (B Shares) (a) | 91,700 | | 156,624 |
TOTAL SWEDEN | | 1,146,327 |
Switzerland - 6.6% |
ABB Ltd. (Switzerland) (Reg.) (a) | 18,940 | | 110,905 |
Actelion Ltd. (Reg.) (a) | 1,749 | | 165,689 |
Clariant AG (Reg.) (a) | 5,400 | | 75,727 |
Novartis AG sponsored ADR | 8,900 | | 341,493 |
Roche Holding AG (participation certificate) | 3,470 | | 286,017 |
Sulzer AG (Reg.) | 560 | | 132,627 |
Swiss Life Holding (a) | 170 | | 28,722 |
Zurich Financial Services AG | 1,350 | | 172,199 |
TOTAL SWITZERLAND | | 1,313,379 |
Turkey - 1.0% |
Turkcell Iletisim Hizmet AS sponsored ADR (a) | 11,100 | | 210,900 |
United Kingdom - 30.8% |
3i Group PLC | 11,900 | | 125,013 |
Alvis PLC | 21,400 | | 67,988 |
Amlin PLC | 40,600 | | 99,749 |
Autonomy Corp. PLC (a) | 47,400 | | 201,590 |
Axis Shield PLC (a) | 11,500 | | 32,638 |
Barratt Developments PLC | 14,900 | | 123,708 |
Boots Group PLC | 13,500 | | 162,980 |
British Sky Broadcasting Group PLC (BSkyB) (a) | 33,200 | | 360,026 |
Carlton Communications PLC | 35,300 | | 129,195 |
Common Stocks - continued |
| Shares | | Value (Note 1) |
United Kingdom - continued |
Cattles PLC | 21,400 | | $ 115,670 |
Celltech Group PLC (a) | 25,800 | | 200,654 |
Corin Group PLC | 20,800 | | 72,778 |
Dixons Group PLC | 121,800 | | 280,158 |
Easynet Group PLC (a) | 31,400 | | 67,569 |
Galen Holdings PLC | 14,100 | | 180,138 |
Jazztel PLC (a) | 168,200 | | 75,992 |
Land Securities Group PLC | 7,000 | | 106,866 |
Lastminute.com PLC (a) | 9,800 | | 49,234 |
London Bridge Software Holdings PLC | 68,100 | | 70,964 |
London Stock Exchange PLC | 19,700 | | 127,677 |
Maiden Group PLC | 22,300 | | 96,352 |
Marks & Spencer Group PLC | 118,800 | | 579,226 |
Mothercare PLC (a) | 10,800 | | 59,107 |
MyTravel Group PLC (a) | 438,500 | | 137,454 |
NDS Group PLC sponsored ADR (a) | 2,700 | | 47,277 |
Next PLC | 4,300 | | 85,974 |
Pace Micro Technology PLC | 68,800 | | 75,774 |
Prudential PLC | 36,400 | | 282,014 |
Reckitt Benckiser PLC | 6,100 | | 128,164 |
Rentokil Initial PLC | 23,200 | | 87,760 |
Shire Pharmaceuticals Group PLC (a) | 25,900 | | 197,704 |
SMG PLC | 36,400 | | 62,293 |
Sygen International PLC | 91,118 | | 78,739 |
Ted Baker PLC | 15,900 | | 97,257 |
Unilever PLC | 48,800 | | 417,240 |
Vodafone Group PLC | 293,300 | | 620,330 |
Vodafone Group PLC sponsored ADR | 7,700 | | 162,855 |
William Hill PLC | 21,300 | | 122,348 |
Woolworths Group PLC | 163,300 | | 127,280 |
Wyevale Garden Centres PLC | 9,100 | | 51,885 |
TOTAL UNITED KINGDOM | | 6,167,620 |
United States of America - 2.9% |
Covad Communications Group, Inc. (a) | 100 | | 438 |
Infonet Services Corp. Class B (a) | 11,300 | | 26,781 |
Network Associates, Inc. (a) | 13,400 | | 186,662 |
NTL, Inc. (a) | 1,500 | | 92,595 |
Pfizer, Inc. | 4,300 | | 135,880 |
Common Stocks - continued |
| Shares | | Value (Note 1) |
United States of America - continued |
Secure Computing Corp. (a) | 4,700 | | $ 67,586 |
Synthes-Stratec, Inc. | 87 | | 79,563 |
TOTAL UNITED STATES OF AMERICA | | 589,505 |
TOTAL COMMON STOCKS (Cost $16,034,219) | 18,849,483 |
Nonconvertible Preferred Stocks - 1.7% |
| | | |
Germany - 1.2% |
Fresenius Medical Care AG | 1,500 | | 61,340 |
Porsche AG (non-vtg.) | 370 | | 181,103 |
TOTAL GERMANY | | 242,443 |
Italy - 0.5% |
Telecom Italia Spa (Risp) (a) | 56,094 | | 96,953 |
TOTAL NONCONVERTIBLE PREFERRED STOCKS (Cost $317,525) | 339,396 |
Nonconvertible Bonds - 0.8% |
| Principal Amount | | |
United Kingdom - 0.8% |
Telewest Communications PLC yankee: | | | | |
0% 4/15/09 (c)(d) | | $ 10,000 | | 4,425 |
0% 2/1/10 (c)(d) | | 45,000 | | 18,113 |
9.875% 2/1/10 (c) | | 35,000 | | 18,025 |
11.25% 11/1/08 (c) | | 10,000 | | 5,375 |
Telewest PLC 11% 10/1/07 (c) | | 200,000 | | 108,000 |
TOTAL NONCONVERTIBLE BONDS (Cost $138,232) | 153,938 |
Money Market Funds - 2.9% |
| Shares | | Value (Note 1) |
Fidelity Cash Central Fund, 1.07% (b)
(Cost $574,215) | 574,215 | | $ 574,215 |
TOTAL INVESTMENT PORTFOLIO - 99.5% (Cost $17,064,191) | | 19,917,032 |
NET OTHER ASSETS - 0.5% | | 100,146 |
NET ASSETS - 100% | $ 20,017,178 |
Legend |
(a) Non-income producing |
(b) The rate quoted is the annualized seven-day yield of the fund at period end. A complete listing of the fund's holdings as of its most recent fiscal year end is available upon request. |
(c) Non-income producing - issuer filed for bankruptcy or is in default of interest payments. |
(d) Debt obligation initially issued in zero coupon form which converts to coupon form at a specified rate and date. The rate shown is the rate at period end. |
Other Information |
Purchases and sales of securities, other than short-term securities, aggregated $34,198,923 and $36,136,577, respectively. |
The fund placed a portion of its portfolio transactions with brokerage firms which are affiliates of the investment adviser. The commissions paid to these affiliated firms were $239 for the period. |
Income Tax Information |
At October 31, 2003, the fund had a capital loss carryforward of approximately $6,957,000 of which $2,681,000 and $4,276,000 will expire on October 31, 2009 and 2010, respectively. |
See accompanying notes which are an integral part of the financial statements.
Annual Report
Financial Statements
Statement of Assets and Liabilities
| October 31, 2003 |
| | |
Assets | | |
Investment in securities, at value (cost $17,064,191) - See accompanying schedule | | $ 19,917,032 |
Receivable for investments sold | | 529,337 |
Receivable for fund shares sold | | 22,942 |
Dividends receivable | | 48,600 |
Interest receivable | | 398 |
Prepaid expenses | | 97 |
Receivable from investment adviser for expense reductions | | 27,574 |
Total assets | | 20,545,980 |
| | |
Liabilities | | |
Payable to custodian bank | $ 2,151 | |
Payable for investments purchased | 386,816 | |
Payable for fund shares redeemed | 63,562 | |
Accrued management fee | 11,987 | |
Distribution fees payable | 10,957 | |
Other payables and accrued expenses | 53,329 | |
Total liabilities | | 528,802 |
| | |
Net Assets | | $ 20,017,178 |
Net Assets consist of: | | |
Paid in capital | | $ 24,199,899 |
Undistributed net investment income | | 39,615 |
Accumulated undistributed net realized gain (loss) on investments and foreign currency transactions | | (7,080,337) |
Net unrealized appreciation (depreciation) on investments and assets and liabilities in foreign currencies | | 2,858,001 |
Net Assets | | $ 20,017,178 |
See accompanying notes which are an integral part of the financial statements.
Annual Report
Financial Statements - continued
Statement of Assets and Liabilities - continued
| October 31, 2003 |
| | |
Calculation of Maximum Offering Price
Class A:
Net Asset Value and redemption price per share
($3,346,333 ÷ 334,723 shares) | | $ 10.00 |
| | |
Maximum offering price per share (100/94.25 of $10.00) | | $ 10.61 |
Class T:
Net Asset Value and redemption price per share ($7,628,125 ÷ 768,026 shares) | | $ 9.93 |
| | |
Maximum offering price per share (100/96.50 of $9.93) | | $ 10.29 |
Class B:
Net Asset Value and offering price per share ($5,596,099 ÷ 575,733 shares) A | | $ 9.72 |
| | |
Class C:
Net Asset Value and offering price per share ($3,075,844 ÷ 316,028 shares) A | | $ 9.73 |
| | |
| | |
Institutional Class:
Net Asset Value, offering price and redemption price per share ($370,777 ÷ 36,831 shares) | | $ 10.07 |
A Redemption price per share is equal to net asset value less any applicable contingent deferred sales charge.
See accompanying notes which are an integral part of the financial statements.
Annual Report
Statement of Operations
| Year ended October 31, 2003 |
| | |
Investment Income | | |
Dividends | | $ 427,461 |
Interest | | 10,864 |
Security lending | | 1,824 |
| | 440,149 |
Less foreign taxes withheld | | (48,712) |
Total income | | 391,437 |
| | |
Expenses | | |
Management fee | $ 131,763 | |
Transfer agent fees | 95,192 | |
Distribution fees | 120,853 | |
Accounting fees and security lending fees | 61,675 | |
Non-interested trustees' compensation | 74 | |
Custodian fees and expenses | 120,164 | |
Registration fees | 50,736 | |
Audit | 47,373 | |
Legal | 756 | |
Miscellaneous | 729 | |
Total expenses before reductions | 629,315 | |
Expense reductions | (249,713) | 379,602 |
Net investment income (loss) | | 11,835 |
Realized and Unrealized Gain (Loss) Net realized gain (loss) on: | | |
Investment securities | 1,066,391 | |
Foreign currency transactions | 12,439 | |
Total net realized gain (loss) | | 1,078,830 |
Change in net unrealized appreciation (depreciation) on: Investment securities | 3,060,143 | |
Assets and liabilities in foreign currencies | 2,018 | |
Total change in net unrealized appreciation (depreciation) | | 3,062,161 |
Net gain (loss) | | 4,140,991 |
Net increase (decrease) in net assets resulting from operations | | $ 4,152,826 |
See accompanying notes which are an integral part of the financial statements.
Annual Report
Financial Statements - continued
Statement of Changes in Net Assets
| Year ended
October 31,
2003 | Year ended
October 31,
2002 |
Increase (Decrease) in Net Assets | | |
Operations | | |
Net investment income (loss) | $ 11,835 | $ 12,890 |
Net realized gain (loss) | 1,078,830 | (4,196,134) |
Change in net unrealized appreciation (depreciation) | 3,062,161 | 1,907,542 |
Net increase (decrease) in net assets resulting
from operations | 4,152,826 | (2,275,702) |
Distributions to shareholders from net investment income | (44,256) | - |
Share transactions - net increase (decrease) | (2,514,690) | (3,347,014) |
Total increase (decrease) in net assets | 1,593,880 | (5,622,716) |
| | |
Net Assets | | |
Beginning of period | 18,423,298 | 24,046,014 |
End of period (including undistributed net investment income of $39,615 and undistributed net investment income of $23,625, respectively) | $ 20,017,178 | $ 18,423,298 |
See accompanying notes which are an integral part of the financial statements.
Annual Report
Financial Highlights - Class A
Years ended October 31, | 2003 | 2002 | 2001 | 2000 | 1999 F |
Selected Per-Share Data | | | | | |
Net asset value, beginning of period | $ 8.03 | $ 9.00 | $ 11.13 | $ 10.56 | $ 10.00 |
Income from Investment Operations | | | | | |
Net investment income (loss) E | .04 | .05 | .01 | (.02) | .05 |
Net realized and unrealized gain (loss) | 1.98 | (1.02) | (2.14) | .62 | .51 |
Total from investment operations | 2.02 | (.97) | (2.13) | .60 | .56 |
Distributions from net investment income | (.05) | - | - | (.03) | - |
Net asset value, end of period | $ 10.00 | $ 8.03 | $ 9.00 | $ 11.13 | $ 10.56 |
Total Return B,C,D | 25.30% | (10.78)% | (19.14)% | 5.67% | 5.60% |
Ratios to Average Net Assets G | | | | | |
Expenses before expense reductions | 3.07% | 2.57% | 2.16% | 1.97% | 3.52% A |
Expenses net of voluntary waivers, if any | 1.75% | 1.96% | 2.00% | 1.97% | 2.00% A |
Expenses net of all reductions | 1.69% | 1.91% | 1.95% | 1.93% | 1.96% A |
Net investment income (loss) | .49% | .48% | .14% | (.14)% | .56% A |
Supplemental Data | | | | | |
Net assets, end of period
(000 omitted) | $ 3,346 | $ 2,071 | $ 2,577 | $ 3,501 | $ 2,060 |
Portfolio turnover rate | 199% | 137% | 85% | 151% | 164% A |
A Annualized
B Total returns for periods of less than one year are not annualized.
C Total returns would have been lower had certain expenses not been reduced during the periods shown.
D Total returns do not include the effect of the sales charges.
E Calculated based on average shares outstanding during the period.
F For the period December 17, 1998 (commencement of operations) to October 31, 1999.
G Expense ratios reflect operating expenses of the class. Expenses before reductions do not reflect amounts reimbursed by the investment adviser or reductions from brokerage service arrangements or other expense offset arrangements and do not represent the amount paid by the class during periods when reimbursements or reductions occur. Expense ratios before reductions for start-up periods may not be representative of longer-term operating periods. Expenses net of any voluntary waivers reflect expenses after reimbursement by the investment adviser but prior to reductions from brokerage service arrangements or other expense offset arrangements. Expenses net of all reductions represent the net expenses paid by the class.
See accompanying notes which are an integral part of the financial statements.
Annual Report
Financial Highlights - Class T
Years ended October 31, | 2003 | 2002 | 2001 | 2000 | 1999 F |
Selected Per-Share Data | | | | | |
Net asset value, beginning of period | $ 7.98 | $ 8.95 | $ 11.09 | $ 10.54 | $ 10.00 |
Income from Investment Operations | | | | | |
Net investment income (loss) E | .02 | .02 | (.01) | (.05) | .03 |
Net realized and unrealized gain (loss) | 1.96 | (.99) | (2.13) | .62 | .51 |
Total from investment operations | 1.98 | (.97) | (2.14) | .57 | .54 |
Distributions from net investment income | (.03) | - | - | (.02) | - |
Net asset value, end of period | $ 9.93 | $ 7.98 | $ 8.95 | $ 11.09 | $ 10.54 |
Total Return B,C,D | 24.90% | (10.84)% | (19.30)% | 5.40% | 5.40% |
Ratios to Average Net Assets G | | | | | |
Expenses before expense reductions | 3.34% | 2.80% | 2.40% | 2.24% | 3.72% A |
Expenses net of voluntary waivers, if any | 2.00% | 2.20% | 2.25% | 2.24% | 2.25% A |
Expenses net of all reductions | 1.94% | 2.16% | 2.19% | 2.20% | 2.21% A |
Net investment income (loss) | .24% | .24% | (.10)% | (.41)% | .31% A |
Supplemental Data | | | | | |
Net assets, end of period
(000 omitted) | $ 7,628 | $ 7,079 | $ 9,749 | $ 15,505 | $ 12,343 |
Portfolio turnover rate | 199% | 137% | 85% | 151% | 164% A |
A Annualized
B Total returns for periods of less than one year are not annualized.
C Total returns would have been lower had certain expenses not been reduced during the periods shown.
D Total returns do not include the effect of the sales charges.
E Calculated based on average shares outstanding during the period.
F For the period December 17, 1998 (commencement of operations) to October 31, 1999.
G Expense ratios reflect operating expenses of the class. Expenses before reductions do not reflect amounts reimbursed by the investment adviser or reductions from brokerage service arrangements or other expense offset arrangements and do not represent the amount paid by the class during periods when reimbursements or reductions occur. Expense ratios before reductions for start-up periods may not be representative of longer-term operating periods. Expenses net of any voluntary waivers reflect expenses after reimbursement by the investment adviser but prior to reductions from brokerage service arrangements or other expense offset arrangements. Expenses net of all reductions represent the net expenses paid by the class.
See accompanying notes which are an integral part of the financial statements.
Annual Report
Financial Highlights - Class B
Years ended October 31, | 2003 | 2002 | 2001 | 2000 | 1999 F |
Selected Per-Share Data | | | | | |
Net asset value, beginning of period | $ 7.82 | $ 8.82 | $ 10.99 | $ 10.48 | $ 10.00 |
Income from Investment Operations | | | | | |
Net investment income (loss) E | (.02) | (.02) | (.06) | (.11) | (.02) |
Net realized and unrealized gain (loss) | 1.92 | (.98) | (2.11) | .62 | .50 |
Total from investment operations | 1.90 | (1.00) | (2.17) | .51 | .48 |
Net asset value, end of period | $ 9.72 | $ 7.82 | $ 8.82 | $ 10.99 | $ 10.48 |
Total Return B,C,D | 24.30% | (11.34)% | (19.75)% | 4.87% | 4.80% |
Ratios to Average Net Assets G | | | | | |
Expenses before expense reductions | 3.87% | 3.33% | 2.95% | 2.81% | 4.29% A |
Expenses net of voluntary waivers, if any | 2.50% | 2.70% | 2.75% | 2.75% | 2.75% A |
Expenses net of all reductions | 2.44% | 2.65% | 2.70% | 2.71% | 2.71% A |
Net investment income (loss) | (.26)% | (.26)% | (.61)% | (.91)% | (.19)% A |
Supplemental Data | | | | | |
Net assets, end of period
(000 omitted) | $ 5,596 | $ 5,717 | $ 6,507 | $ 8,132 | $ 3,765 |
Portfolio turnover rate | 199% | 137% | 85% | 151% | 164% A |
A Annualized
B Total returns for periods of less than one year are not annualized.
C Total returns would have been lower had certain expenses not been reduced during the periods shown.
D Total returns do not include the effect of the contingent deferred sales charge.
E Calculated based on average shares outstanding during the period.
F For the period December 17, 1998 (commencement of operations) to October 31, 1999.
G Expense ratios reflect operating expenses of the class. Expenses before reductions do not reflect amounts reimbursed by the investment adviser or reductions from brokerage service arrangements or other expense offset arrangements and do not represent the amount paid by the class during periods when reimbursements or reductions occur. Expense ratios before reductions for start-up periods may not be representative of longer-term operating periods. Expenses net of any voluntary waivers reflect expenses after reimbursement by the investment adviser but prior to reductions from brokerage service arrangements or other expense offset arrangements. Expenses net of all reductions represent the net expenses paid by the class.
See accompanying notes which are an integral part of the financial statements.
Annual Report
Financial Highlights - Class C
Years ended October 31, | 2003 | 2002 | 2001 | 2000 | 1999 F |
Selected Per-Share Data | | | | | |
Net asset value, beginning of period | $ 7.83 | $ 8.84 | $ 11.01 | $ 10.49 | $ 10.00 |
Income from Investment Operations | | | | | |
Net investment income (loss) E | (.02) | (.02) | (.06) | (.10) | (.02) |
Net realized and unrealized gain (loss) | 1.92 | (.99) | (2.11) | .62 | .51 |
Total from investment operations | 1.90 | (1.01) | (2.17) | .52 | .49 |
Net asset value, end of period | $ 9.73 | $ 7.83 | $ 8.84 | $ 11.01 | $ 10.49 |
Total Return B,C,D | 24.27% | (11.43)% | (19.71)% | 4.96% | 4.90% |
Ratios to Average Net Assets G | | | | | |
Expenses before expense reductions | 3.74% | 3.22% | 2.80% | 2.67% | 4.16% A |
Expenses net of voluntary waivers, if any | 2.50% | 2.71% | 2.75% | 2.67% | 2.75% A |
Expenses net of all reductions | 2.44% | 2.66% | 2.70% | 2.63% | 2.71% A |
Net investment income (loss) | (.26)% | (.27)% | (.61)% | (.84)% | (.19)% A |
Supplemental Data | | | | | |
Net assets, end of period
(000 omitted) | $ 3,076 | $ 2,876 | $ 4,393 | $ 7,117 | $ 3,894 |
Portfolio turnover rate | 199% | 137% | 85% | 151% | 164% A |
A Annualized
B Total returns for periods of less than one year are not annualized.
C Total returns would have been lower had certain expenses not been reduced during the periods shown.
D Total returns do not include the effect of the contingent deferred sales charge.
E Calculated based on average shares outstanding during the period.
F For the period December 17, 1998 (commencement of operations) to October 31, 1999.
G Expense ratios reflect operating expenses of the class. Expenses before reductions do not reflect amounts reimbursed by the investment adviser or reductions from brokerage service arrangements or other expense offset arrangements and do not represent the amount paid by the class during periods when reimbursements or reductions occur. Expense ratios before reductions for start-up periods may not be representative of longer-term operating periods. Expenses net of any voluntary waivers reflect expenses after reimbursement by the investment adviser but prior to reductions from brokerage service arrangements or other expense offset arrangements. Expenses net of all reductions represent the net expenses paid by the class.
See accompanying notes which are an integral part of the financial statements.
Annual Report
Financial Highlights - Institutional Class
Years ended October 31, | 2003 | 2002 | 2001 | 2000 | 1999 E |
Selected Per-Share Data | | | | | |
Net asset value, beginning of period | $ 8.10 | $ 9.05 | $ 11.16 | $ 10.58 | $ 10.00 |
Income from Investment Operations | | | | | |
Net investment income (loss) D | .06 | .07 | .04 | .02 | .07 |
Net realized and unrealized gain (loss) | 1.98 | (1.02) | (2.15) | .61 | .51 |
Total from investment operations | 2.04 | (.95) | (2.11) | .63 | .58 |
Distributions from net investment income | (.07) | - | - | (.05) | - |
Net asset value, end of period | $ 10.07 | $ 8.10 | $ 9.05 | $ 11.16 | $ 10.58 |
Total Return B,C | 25.39% | (10.50)% | (18.91)% | 5.94% | 5.80% |
Ratios to Average Net Assets F | | | | | |
Expenses before expense reductions | 2.56% | 2.07% | 1.75% | 1.70% | 3.31% A |
Expenses net of voluntary waivers, if any | 1.50% | 1.71% | 1.75% | 1.70% | 1.75% A |
Expenses net of all reductions | 1.44% | 1.66% | 1.69% | 1.66% | 1.71% A |
Net investment income (loss) | .73% | .74% | .40% | .14% | .81% A |
Supplemental Data | | | | | |
Net assets, end of period
(000 omitted) | $ 371 | $ 681 | $ 820 | $ 1,193 | $ 838 |
Portfolio turnover rate | 199% | 137% | 85% | 151% | 164% A |
A Annualized
B Total returns for periods of less than one year are not annualized.
C Total returns would have been lower had certain expenses not been reduced during the periods shown.
D Calculated based on average shares outstanding during the period.
E For the period December 17, 1998 (commencement of operations) to October 31, 1999.
F Expense ratios reflect operating expenses of the class. Expenses before reductions do not reflect amounts reimbursed by the investment adviser or reductions from brokerage service arrangements or other expense offset arrangements and do not represent the amount paid by the class during periods when reimbursements or reductions occur. Expense ratios before reductions for start-up periods may not be representative of longer-term operating periods. Expenses net of any voluntary waivers reflect expenses after reimbursement by the investment adviser but prior to reductions from brokerage service arrangements or other expense offset arrangements. Expenses net of all reductions represent the net expenses paid by the class.
See accompanying notes which are an integral part of the financial statements.
Annual Report
Notes to Financial Statements
For the period ended October 31, 2003
1. Significant Accounting Policies.
Fidelity Advisor Europe Capital Appreciation Fund (the fund) is a fund of Fidelity Advisor Series VIII (the trust) and is authorized to issue an unlimited number of shares. The trust is registered under the Investment Company Act of 1940, as amended (the 1940 Act), as an open-end management investment company organized as a Massachusetts business trust.
The fund offers Class A, Class T, Class B, Class C, and Institutional Class shares, each of which has equal rights as to assets and voting privileges. Each class has exclusive voting rights with respect to matters that affect that class. Class B shares will automatically convert to Class A shares after a holding period of seven years from the initial date of purchase. Investment income, realized and unrealized capital gains and losses, the common expenses of the fund, and certain fund-level expense reductions, if any, are allocated on a pro rata basis to each class based on the relative net assets of each class to the total net assets of the fund. Each class differs with respect to transfer agent and distribution and service plan fees incurred. Certain expense reductions also differ by class.
The financial statements have been prepared in conformity with accounting principles generally accepted in the United States of America, which require management to make certain estimates and assumptions at the date of the financial statements. The following summarizes the significant accounting policies of the fund:
Security Valuation. Net asset value per share (NAV calculation) is calculated as of the close of business of the New York Stock Exchange, normally 4:00 p.m. Eastern time. Equity securities for which market quotations are available are valued at the last sale price or official closing price (closing bid price or last evaluated quote if no sale has occurred) on the primary market or exchange on which they trade. Debt securities for which quotations are readily available are valued at their most recent bid prices (sales prices if the principal market is an exchange) in the principal market in which such securities are normally traded, as determined by recognized dealers in such securities, or securities are valued on the basis of information provided by a pricing service. Pricing services use valuation matrices that incorporate both dealer-supplied valuations and valuation models. If an event that is expected to materially affect the value of a security occurs after the close of an exchange or market on which that security trades, but prior to the NAV calculation, then that security will be fair valued taking the event into account. Securities (including restricted securities) for which market quotations are not readily available are valued at their fair value as determined in good faith under consistently applied procedures under the general supervision of the Board of Trustees. Price movements in futures contracts and ADRs, market and trading trends, the bid/ask quotes of brokers and off-exchange institutional trading may be reviewed in the course of making a good faith determination of a security's fair value. Short-term securities with
Annual Report
Notes to Financial Statements - continued
1. Significant Accounting Policies - continued
Annual Report
Security Valuation - continued
remaining maturities of sixty days or less for which quotations are not readily available are valued on the basis of amortized cost. Investments in open-end investment companies are valued at their net asset value each business day.
Foreign Currency. The fund uses foreign currency contracts to facilitate transactions in foreign-denominated securities. Losses from these transactions may arise from changes in the value of the foreign currency or if the counterparties do not perform under the contracts' terms.
Foreign denominated assets, including investment securities, and liabilities are translated into U.S. dollars at the exchange rate at period end. Purchases and sales of investment securities, income and dividends received and expenses denominated in foreign currencies are translated into U.S. dollars at the exchange rate in effect on the transaction date.
The effects of exchange rate fluctuations on investments are included with the net realized and unrealized gain (loss) on investment securities. Other foreign currency transactions resulting in realized and unrealized gain (loss) are disclosed separately.
Investment Transactions and Income. Security transactions are accounted for as of trade date. Gains and losses on securities sold are determined on the basis of identified cost. Dividend income is recorded on the ex-dividend date, except for certain dividends from foreign securities where the ex-dividend date may have passed, which are recorded as soon as the fund is informed of the ex-dividend date. Non-cash dividends included in dividend income, if any, are recorded at the fair market value of the securities received. Interest income is accrued as earned. Interest income includes coupon interest and amortization of premium and accretion of discount on debt securities, which is accrued using the interest method. Investment income is recorded net of foreign taxes withheld where recovery of such taxes is uncertain.
Expenses. Most expenses of the trust can be directly attributed to a fund. Expenses which cannot be directly attributed are apportioned among the funds in the trust.
Income Tax Information and Distributions to Shareholders. Each year the fund intends to qualify as a regulated investment company by distributing all of its taxable income and realized gains under Subchapter M of the Internal Revenue Code. As a result, no provision for income taxes is required in the accompanying financial statements. Foreign taxes are provided for based on each fund's understanding of the tax rules and rates that exist in the foreign markets in which it invests. Income dividends and capital gain distributions are declared separately for each class. Distributions are recorded on the ex-dividend date.
Annual Report
Notes to Financial Statements - continued
1. Significant Accounting Policies - continued
Income Tax Information and Distributions to Shareholders - continued
Income and capital gain distributions are determined in accordance with income tax regulations, which may differ from generally accepted accounting principles. Capital accounts within the financial statements are adjusted for permanent and temporary book and tax differences. These adjustments have no impact on net assets or the results of operations. Temporary differences will reverse in a subsequent period. These differences are primarily due to foreign currency transactions, certain foreign taxes, passive foreign investment companies (PFIC), capital loss carryforwards and losses deferred due to wash sales.
The tax-basis components of distributable earnings and the federal tax cost as of period end were as follows:
Unrealized appreciation | $ 3,054,340 | |
Unrealized depreciation | (358,214) | |
Net unrealized appreciation (depreciation) | 2,696,126 | |
Undistributed ordinary income | 78,215 | |
Capital loss carryforward | (6,957,067) | |
Cost for federal income tax purposes | $ 17,220,906 | |
The tax character of distributions paid was as follows:
| October 31,
2003 | October 31,
2002 |
Ordinary Income | $ 44,256 | $ - |
Short-Term Trading (Redemption) Fees. Shares purchased after March 31, 2004 and held in the fund less than 30 days will be subject to a short-term trading fee equal to 1.00% of the proceeds of the redeemed shares. The fee, which will be retained by the fund, is accounted for as an addition to paid in capital.
2. Operating Policies.
Repurchase Agreements. Fidelity Management & Research Company (FMR) has received an Exemptive Order from the Securities and Exchange Commission (the SEC) which permits the fund and other affiliated entities of FMR to transfer uninvested cash balances into joint trading accounts. These accounts are then invested in repurchase agreements that are collateralized by U.S. Treasury or Government obligations. The fund may also invest directly with institutions, in repurchase agreements that are collateralized by commercial paper obligations and corporate obligations. Collateral is held in segregated accounts with custodian banks and may be obtained in the event of a default
Annual Report
2. Operating Policies - continued
Repurchase Agreements - continued
of the counterparty. Collateral is marked-to-market daily and maintained at a value at least equal to the principal amount of the repurchase agreement (including accrued interest).
3. Purchases and Sales of Investments.
Information regarding purchases and sales of securities is included under the caption "Other Information" at the end of the fund's Schedule of Investments.
4. Fees and Other Transactions with Affiliates.
Management Fee. FMR and its affiliates provide the fund with investment management related services for which the fund pays a monthly management fee. The management fee is the sum of an individual fund fee rate that is based on an annual rate of .45% of the fund's average net assets and a group fee rate that averaged .28% during the period. The group fee rate is based upon the average net assets of all the mutual funds advised by FMR. The group fee rate decreases as assets under management increase and increases as assets under management decrease. For the period, the total annual management fee rate was .73% of the fund's average net assets.
Distribution and Service Plan. In accordance with Rule 12b-1 of the 1940 Act, the Fund has adopted separate Distribution and Service Plans for each class of shares. Certain classes pay Fidelity Distributors Corporation (FDC), an affiliate of FMR, separate Distribution and Service Fees, each of which is based on an annual percentage of each class' average net assets. Class A and Class T Plans also authorize the use of brokerage commissions to pay distribution expenses. This practice has been discontinued and no commissions incurred after June 30, 2003 have been used to pay distribution expenses. In addition, FDC may pay financial intermediaries for selling shares of the fund and providing shareholder support services. For the period, the Distribution and Service Fee rates, the total amounts paid to and retained by FDC and the amount of distribution expenses paid with brokerage commissions were as follows:
| Distribution
Fee | Service
Fee | Paid to
FDC | Retained
by FDC | Paid with
Commissions |
Class A | -% | .25% | $ 6,227 | $ 81 | $ - |
Class T | .25% | .25% | 34,624 | - | - |
Class B | .75% | .25% | 51,865 | 38,899 | - |
Class C | .75% | .25% | 28,137 | 1,807 | - |
| | | $ 120,853 | $ 40,787 | $ - |
Annual Report
Notes to Financial Statements - continued
4. Fees and Other Transactions with Affiliates - continued
Sales Load. FDC receives a front-end sales charge of up to 5.75% for selling Class A shares, and 3.50% for selling Class T shares of the fund. FDC receives the proceeds of contingent deferred sales charges levied on Class A, Class T, Class B, and Class C redemptions. These charges depend on the holding period. The deferred sales charges range from 5% to 1% for Class B, 1% for Class C, and .25% for certain purchases of Class A and Class T shares.
For the period, sales charge amounts retained by FDC were as follows:
| Retained
by FDC | |
Class A | $ 1,693 | |
Class T | 1,660 | |
Class B* | 19,581 | |
Class C* | 1,439 | |
| $ 24,373 | |
* When Class B and Class C shares are initially sold, FDC pays commissions from its own resources to financial intermediaries through
which the sales are made.
Transfer Agent Fees. Fidelity Investments Institutional Operations Company, Inc. (FIIOC), an affiliate of FMR, is the transfer, dividend disbursing and shareholder servicing agent (collectively referred to as the transfer agent) for each class of the fund. FIIOC receives account fees and asset-based fees that vary according to the account size and type of account of the shareholders of the respective classes of the fund. FIIOC pays for typesetting, printing and mailing of all shareholder reports, except proxy statements. For the period, the following amounts were paid to FIIOC:
| Amount | % of
Average
Net Assets |
Class A | $ 13,164 | .53 |
Class T | 37,892 | .55 |
Class B | 30,086 | .58 |
Class C | 12,521 | .44 |
Institutional Class | 1,529 | .27 |
| $ 95,192 | |
Accounting and Security Lending Fees. Fidelity Service Company, Inc. (FSC), an affiliate of FMR, maintains the fund's accounting records and administers the security lending program. The security lending fee is based on the number and duration of lending transactions. The accounting fee is based on the level of average net assets for the month plus out-of-pocket expenses.
Annual Report
4. Fees and Other Transactions with Affiliates - continued
Central Funds. The fund may invest in affiliated Central Funds managed by Fidelity Investments Money Management, Inc. (FIMM), an affiliate of FMR. The Central Funds are open-end investment companies available only to investment companies and other accounts managed by FMR and its affiliates. The Central Funds seek preservation of capital and current income and do not pay a management fee. Income distributions earned by the fund are recorded as income in the accompanying financial statements and totaled $11,202 for the period.
Brokerage Commissions. The fund placed a portion of its portfolio transactions with brokerage firms which are affiliates of the investment adviser. The commissions paid to these affiliated firms are shown under the caption "Other Information" at the end of the fund's Schedule of Investments.
5. Committed Line of Credit.
The fund participates with other funds managed by FMR in a $3.5 billion credit facility (the "line of credit") to be utilized for temporary or emergency purposes to fund shareholder redemptions or for other short-term liquidity purposes. The fund has agreed to pay commitment fees on its pro rata portion of the line of credit. During the period, there were no borrowings on this line of credit.
6. Security Lending.
The fund lends portfolio securities from time to time in order to earn additional income. The fund receives collateral (in the form of U.S. Treasury obligations, letters of credit and/or cash) against the loaned securities and maintains collateral in an amount not less than 100% of the market value of the loaned securities during the period of the loan. The market value of the loaned securities is determined at the close of business of the fund and any additional required collateral is delivered to the fund on the next business day. If the borrower defaults on its obligation to return the securities loaned because of insolvency or other reasons, a fund could experience delays and costs in recovering the securities loaned or in gaining access to the collateral. Cash collateral is invested in cash equivalents. At period end there were no security loans outstanding.
Annual Report
Notes to Financial Statements - continued
7. Expense Reductions.
FMR agreed to reimburse the classes of the fund to the extent operating expenses exceeded certain levels of average net assets as noted in the table below. Some expenses, for example interest expense, are excluded from this reimbursement.
| Expense
Limitations | Reimbursement
from adviser |
| | |
Class A | 1.75% | $ 33,042 |
Class T | 2.00% | 92,940 |
Class B | 2.50% | 71,304 |
Class C | 2.50% | 34,856 |
Institutional Class | 1.50% | 6,043 |
| | $ 238,185 |
Many of the brokers with whom FMR places trades on behalf of the fund provided services to the fund in addition to trade execution. These services may include payments of expenses on behalf of the fund to support distribution of fund shares for Class A and Class T ("Distribution Expense Reduction") and to pay other fund expenses, such as transfer agent fees ("Other Expense Reduction") collectively referred to as "Brokerage Service Arrangements" in the accompanying table. Brokerage service arrangements generally benefits all shareholders of each class by reducing fund expenses. Each of Class A and Class T shareholders' Other Expense Reduction benefit is reduced by the amount of any Distribution Expense Reduction.
| Brokerage Service Arrangements |
| Distribution
expense
reduction | Other
expense
reduction |
Fund Level | $ - | $ 11,528 |
Class A | - | - |
Class T | - | - |
| $ - | $ 11,528 |
8. Distributions to Shareholders.
Distributions to shareholders of each class were as follows:
Years ended October 31, | 2003 | 2002 |
From net investment income | | |
Class A | $ 12,873 | $ - |
Class T | 26,438 | - |
Institutional Class | 4,945 | - |
Total | $ 44,256 | $ - |
Annual Report
9. Share Transactions.
Transactions for each class of shares were as follows:
| Shares | Dollars |
Years ended October 31, | 2003 | 2002 | 2003 | 2002 |
Class A | | | | |
Shares sold | 316,316 | 427,176 | $ 2,713,286 | $ 3,978,076 |
Reinvestment of distributions | 1,448 | - | 11,764 | - |
Shares redeemed | (240,897) | (455,720) | (2,051,864) | (4,247,881) |
Net increase (decrease) | 76,867 | (28,544) | $ 673,186 | $ (269,805) |
Class T | | | | |
Shares sold | 153,987 | 242,800 | $ 1,293,026 | $ 2,191,017 |
Reinvestment of distributions | 3,125 | - | 25,256 | - |
Shares redeemed | (276,339) | (444,772) | (2,311,651) | (4,027,999) |
Net increase (decrease) | (119,227) | (201,972) | $ (993,369) | $ (1,836,982) |
Class B | | | | |
Shares sold | 116,409 | 256,719 | $ 971,513 | $ 2,405,037 |
Shares redeemed | (271,990) | (262,795) | (2,226,193) | (2,368,364) |
Net increase (decrease) | (155,581) | (6,076) | $ (1,254,680) | $ 36,673 |
Class C | | | | |
Shares sold | 51,238 | 101,482 | $ 440,459 | $ 918,375 |
Shares redeemed | (102,640) | (231,210) | (855,030) | (2,099,373) |
Net increase (decrease) | (51,402) | (129,728) | $ (414,571) | $ (1,180,998) |
Institutional Class | | | | |
Shares sold | 319,492 | 622,922 | $ 2,847,002 | $ 6,154,110 |
Reinvestment of distributions | 320 | - | 2,614 | - |
Shares redeemed | (367,066) | (629,370) | (3,374,872) | (6,250,012) |
Net increase (decrease) | (47,254) | (6,448) | $ (525,256) | $ (95,902) |
Annual Report
Independent Auditors' Report
To the Trustees of Fidelity Advisor Series VIII and Shareholders of Fidelity Advisor Europe Capital Appreciation Fund:
We have audited the accompanying statement of assets and liabilities of Fidelity Advisor Europe Capital Appreciation Fund (the Fund), a fund of Fidelity Advisor Series VIII, including the portfolio of investments, as of October 31, 2003, and the related statement of operations for the year then ended, the statement of changes in net assets for each of the two years in the period then ended, and the financial highlights for each of the five years in the period then ended. These financial statements and financial highlights are the responsibility of the Fund's management. Our responsibility is to express an opinion on these financial statements and financial highlights based on our audits.
We conducted our audits in accordance with auditing standards generally accepted in the United States of America. Those standards require that we plan and perform the audit to obtain reasonable assurance about whether the financial statements and financial highlights are free of material misstatement. An audit includes examining, on a test basis, evidence supporting the amounts and disclosures in the financial statements. Our procedures included confirmation of securities owned as of October 31, 2003, by correspondence with the custodian and brokers; where replies were not received from brokers, we performed other auditing procedures. An audit also includes assessing the accounting principles used and significant estimates made by management, as well as evaluating the overall financial statement presentation. We believe that our audits provide a reasonable basis for our opinion.
In our opinion, the financial statements and financial highlights referred to above present fairly, in all material respects, the financial position of Fidelity Advisor Europe Capital Appreciation Fund as of October 31, 2003, the results of its operations for the year then ended, the changes in its net assets for each of the two years in the period then ended, and its financial highlights for each of the five years in the period then ended, in conformity with accounting principles generally accepted in the United States of America.
/s/DELOITTE & TOUCHE LLP
DELOITTE & TOUCHE LLP
Boston, Massachusetts
December 12, 2003
Annual Report
Trustees and Officers
The Trustees, Members of the Advisory Board, and executive officers of the trust and fund, as applicable, are listed below. The Board of Trustees governs the fund and is responsible for protecting the interests of shareholders. The Trustees are experienced executives who meet periodically throughout the year to oversee the fund's activities, review contractual arrangements with companies that provide services to the fund, and review the fund's performance. Except for William O. McCoy, each of the Trustees oversees 289 funds advised by FMR or an affiliate. Mr. McCoy oversees 291 funds advised by FMR or an affiliate.
The Trustees hold office without limit in time except that (a) any Trustee may resign; (b) any Trustee may be removed by written instrument, signed by at least two-thirds of the number of Trustees prior to such removal; (c) any Trustee who requests to be retired or who has become incapacitated by illness or injury may be retired by written instrument signed by a majority of the other Trustees; and (d) any Trustee may be removed at any special meeting of shareholders by a two-thirds vote of the outstanding voting securities of the trust. In any event, each non-interested Trustee shall retire not later than the last day of the calendar year in which his or her 72nd birthday occurs. The executive officers and Advisory Board Member hold office without limit in time, except that any officer and Advisory Board Member may resign or may be removed by a vote of a majority of the Trustees at any regular meeting or any special meeting of the Trustees. Except as indicated, each individual has held the office shown or other offices in the same company for the past five years.
The fund's Statement of Additional Information (SAI) includes more information about the Trustees. To request a free copy, call Fidelity at 1-877-208-0098.
Interested Trustees*:
Correspondence intended for each Trustee who is an "interested person" (as defined in the 1940 Act) may be sent to 82 Devonshire Street, Boston, Massachusetts 02109.
Name, Age; Principal Occupation |
Edward C. Johnson 3d (73)** |
| Year of Election or Appointment: 1983 Mr. Johnson is Chairman of the Board of Trustees. Mr. Johnson serves as Chief Executive Officer, Chairman, and a Director of FMR Corp.; a Director and Chairman of the Board and of the Executive Committee of FMR; Chairman and a Director of Fidelity Management & Research (Far East) Inc.; Chairman (1998) and a Director of Fidelity Investments Money Management, Inc.; and Chairman (2001) and a Director (2000) of FMR Co., Inc. |
Abigail P. Johnson (41)** |
| Year of Election or Appointment: 2001 Senior Vice President of Advisor Europe Capital Appreciation (2001). Ms. Johnson also serves as Senior Vice President of other Fidelity funds (2001). She is President and a Director of FMR (2001), Fidelity Investments Money Management, Inc. (2001), FMR Co., Inc. (2001), and a Director of FMR Corp. Previously, Ms. Johnson managed a number of Fidelity funds. |
Laura B. Cronin (49) |
| Year of Election or Appointment: 2003 Ms. Cronin is an Executive Vice President (2002) and Chief Financial Officer (2002) of FMR Corp. and is a member of the Fidelity Management Committee (2003). Previously, Ms. Cronin served as Vice President of Finance of FMR (1997-1999), and Chief Financial Officer of FMR (1999-2001), Fidelity Personal Investments (2001), and Fidelity Brokerage Company (2001-2002). |
Robert L. Reynolds (51) |
| Year of Election or Appointment: 2003 Mr. Reynolds is a Director (2003) and Chief Operating Officer (2002) of FMR Corp. and is the head of the Fidelity Management Committee (2003). He also serves on the Board at Fidelity Investments Canada, Ltd. (2000). Previously, Mr. Reynolds served as President of Fidelity Investments Institutional Retirement Group (1996-2000). |
* Trustees have been determined to be "Interested Trustees" by virtue of, among other things, their affiliation with the trust or various entities under common control with FMR.
** Edward C. Johnson 3d, Trustee, is Abigail P. Johnson's father.
Annual Report
Non-Interested Trustees:
Correspondence intended for each non-interested Trustee (that is, the Trustees other than the Interested Trustees) may be sent to Fidelity Investments, P.O. Box 55235, Boston, Massachusetts 02205-5235.
Name, Age; Principal Occupation |
J. Michael Cook (61) |
| Year of Election or Appointment: 2001 Prior to Mr. Cook's retirement in May 1999, he served as Chairman and Chief Executive Officer of Deloitte & Touche LLP (accounting/consulting), Chairman of the Deloitte & Touche Foundation, and a member of the Board of Deloitte Touche Tohmatsu. He currently serves as a Director of Comcast (telecommunications, 2002), International Flavors & Fragrances, Inc. (2000), Rockwell Automation (2000) and The Dow Chemical Company (2000). He is a Member of the Diversity Advisory Council of Marakon (2003) and the Advisory Board of the Directorship Search Group, Chairman Emeritus of the Board of Catalyst (a leading organization for the advancement of women in business), and is Chairman of the Accountability Advisory Council to the Comptroller General of the United States. He also serves as a Member of the Advisory Board of the Graduate School of Business of the University of Florida, his alma mater. |
Ralph F. Cox (71) |
| Year of Election or Appointment: 1991 Mr. Cox is President of RABAR Enterprises (management consulting for the petroleum industry). Prior to February 1994, he was President of Greenhill Petroleum Corporation (petroleum exploration and production). Until March 1990, Mr. Cox was President and Chief Operating Officer of Union Pacific Resources Company (exploration and production). He is a Director of CH2M Hill Companies (engineering), and Abraxas Petroleum (petroleum exploration and production, 1999). In addition, he is a member of advisory boards of Texas A&M University and the University of Texas at Austin. |
Phyllis Burke Davis (71) |
| Year of Election or Appointment: 1992 Mrs. Davis is retired from Avon Products, Inc. (consumer products) where she held various positions including Senior Vice President of Corporate Affairs and Group Vice President of U.S. product marketing, sales, distribution, and manufacturing. Mrs. Davis is a member of the Board of Directors of the Southampton Hospital in Southampton, N.Y. (1998). Previously, she served as a Director of BellSouth Corporation (telecommunications), Eaton Corporation (diversified industrial), the TJX Companies, Inc. (retail stores), Hallmark Cards, Inc., and Nabisco Brands, Inc. |
Robert M. Gates (60) |
| Year of Election or Appointment: 1997 Dr. Gates is President of Texas A&M University (2002). He was Director of the Central Intelligence Agency (CIA) from 1991 to 1993. From 1989 to 1991, Dr. Gates served as Assistant to the President of the United States and Deputy National Security Advisor. Dr. Gates is a Director of NACCO Industries, Inc. (mining and manufacturing), and Parker Drilling Co., Inc. (drilling and rental tools for the energy industry, 2001). He also serves as a member of the Advisory Board of VoteHere.net (secure internet voting, 2001). Previously, Dr. Gates served as a Director of LucasVarity PLC (automotive components and diesel engines), a Director of TRW Inc. (automotive, space, defense, and information technology), and Dean of the George Bush School of Government and Public Service at Texas A&M University (1999-2001). Dr. Gates also is a Trustee of the Forum for International Policy. |
Donald J. Kirk (70) |
| Year of Election or Appointment: 1987 Mr. Kirk is a Governor of the American Stock Exchange (2001), a Trustee and former Chairman of the Board of Trustees of the Greenwich Hospital Association, a Director of the Yale-New Haven Health Services Corp. (1998), and a Director Emeritus and former Chairman of the Board of Directors of National Arts Strategies Inc. Mr. Kirk was an Executive-in-Residence (1995-2000) and a Professor (1987-1995) at Columbia University Graduate School of Business. Prior to 1987, he was Chairman of the Financial Accounting Standards Board. Previously, Mr. Kirk served as a Governor of the National Association of Securities Dealers, Inc. (1996-2002), a member and Vice Chairman of the Public Oversight Board of the American Institute of Certified Public Accountants' SEC Practice Section (1995-2002), a Director of General Re Corporation (reinsurance, 1987-1998) and as a Director of Valuation Research Corp. (appraisals and valuations). |
Marie L. Knowles (57) |
| Year of Election or Appointment: 2001 Prior to Ms. Knowles' retirement in June 2000, she served as Executive Vice President and Chief Financial Officer of Atlantic Richfield Company (ARCO) (diversified energy, 1996-2000). From 1993 to 1996, she was a Senior Vice President of ARCO and President of ARCO Transportation Company. She served as a Director of ARCO from 1996 to 1998. She currently serves as a Director of Phelps Dodge Corporation (copper mining and manufacturing), URS Corporation (multidisciplinary engineering, 1999), and McKesson Corporation (healthcare service, 2002). Ms. Knowles is a Trustee of the Brookings Institution and the Catalina Island Conservancy and also serves as a member of the Advisory Board for the School of Engineering of the University of Southern California. |
Ned C. Lautenbach (59) |
| Year of Election or Appointment: 2000 Mr. Lautenbach has been a partner of Clayton, Dubilier & Rice, Inc. (private equity investment firm) since September 1998. Previously, Mr. Lautenbach was with the International Business Machines Corporation (IBM) from 1968 until his retirement in 1998. He was most recently Senior Vice President and Group Executive of Worldwide Sales and Services. From 1993 to 1995, he was Chairman of IBM World Trade Corporation, and from 1994 to 1998 was a member of IBM's Corporate Executive Committee. Mr. Lautenbach serves as Chairman and as a Director (1998) of Acterna Corporation (communications test equipment). He is also Co-Chairman of Covansys, Inc. (global provider of business and technology solutions, 2000). In addition, he is a Director of Eaton Corporation (diversified industrial) and the Philharmonic Center for the Arts in Naples, Florida (1999). He also is a member of the Council on Foreign Relations. |
Marvin L. Mann (70) |
| Year of Election or Appointment: 1993 Mr. Mann is Chairman of the non-interested Trustees (2001). He is Chairman Emeritus of Lexmark International, Inc. (computer peripherals) where he served as CEO until April 1998 and retired as Chairman May 1999, and remains a member of the Board. Prior to 1991, he held the positions of Vice President of International Business Machines Corporation (IBM) and President and General Manager of various IBM divisions and subsidiaries. Mr. Mann is a Board member of Imation Corp. (imaging and information storage) and Acterna Corporation (communications test equipment, 1999). He is also a member of the Director Services Committee of the Investment Company Institute. In addition, Mr. Mann is a member of the President's Cabinet at the University of Alabama and the Board of Visitors of the Culverhouse College of Commerce and Business Administration at the University of Alabama. |
William O. McCoy (70) |
| Year of Election or Appointment: 1997 Prior to his retirement in December 1994, Mr. McCoy was Vice Chairman of the Board of BellSouth Corporation (telecommunications) and President of BellSouth Enterprises. He is currently a Director of Liberty Corporation (holding company), Duke Realty Corporation (real estate), Progress Energy, Inc. (electric utility), and Acterna Corporation (communications test equipment, 1999). He is also a partner of Franklin Street Partners (private investment management firm) and a member of the Research Triangle Foundation Board. In addition, Mr. McCoy served as the Interim Chancellor (1999-2000) and a member of the Board of Visitors (1994-1998) for the University of North Carolina at Chapel Hill and currently serves on the Board of Directors of the University of North Carolina Health Care System and the Board of Visitors of the Kenan-Flagler Business School (University of North Carolina at Chapel Hill). He also served as Vice President of Finance for the University of North Carolina (16-school system, 1995-1998). |
William S. Stavropoulos (64) |
| Year of Election or Appointment: 2001 Mr. Stavropoulos is Chairman of the Board, President and CEO (2002), and Chairman of the Executive Committee (2000) and a Director of The Dow Chemical Company. Since joining The Dow Chemical Company in 1967, Mr. Stavropoulos served in numerous senior management positions, including President (1993-2000) and Chief Executive Officer (1995-2000). Currently, he is a Director of NCR Corporation (data warehousing and technology solutions), BellSouth Corporation (telecommunications), Chemical Financial Corporation, and Maersk Inc. (industrial conglomerate, 2002). He also serves as a member of the Board of Trustees of the American Enterprise Institute for Public Policy Research. In addition, Mr. Stavropoulos is a member of The Business Council, J.P. Morgan International Council, World Business Council for Sustainable Development, and the University of Notre Dame Advisory Council for the College of Science. |
Annual Report
Trustees and Officers - continued
Advisory Board Members and Executive Officers:
Correspondence intended for Dr. Heilmeier may be sent to Fidelity Investments, P.O. Box 55235, Boston, Massachusetts 02205-5235. Correspondence intended for each executive officer and Mr. Lynch may be sent to 82 Devonshire Street, Boston, Massachusetts 02109.
Name, Age; Principal Occupation |
George H. Heilmeier (67) |
| Year of Election or Appointment: 2003 Member of the Advisory Board of Fidelity Advisor Series VIII. Dr. Heilmeier is Chairman Emeritus of Telcordia Technologies (communication software and systems), where prior to his retirement, he served as company Chairman and Chief Executive Officer. He currently serves on the Boards of Directors of The Mitre Corporation (systems engineering and information technology support for the government), INET Technologies Inc. (telecommunications network surveillance, 2001) and Teletech Holdings (customer management services, 1998). He is Chairman of the General Motors Technology Advisory Committee and a Life Fellow of the IEEE (2000). Dr. Heilmeier is a member of the Defense Science Board and the National Security Agency Advisory Board. He is also a member of the National Academy of Engineering, the American Academy of Arts and Sciences and The Board of Overseers of the School of Engineering and Applied Science of the University of Pennsylvania. Previously, Dr. Heilmeier served as a Director of TRW Inc. (automotive, space, defense, and information technology, 1992-2002) and Compaq (1994-2002). |
Peter S. Lynch (60) |
| Year of Election or Appointment: 2003 Member of the Advisory Board of Fidelity Advisor VIII. Vice Chairman and a Director of FMR, and Vice Chairman (2001) and a Director (2000) of FMR Co., Inc. Previously, Mr. Lynch served as a Trustee of the Fidelity funds (1990-2003). Prior to May 31, 1990, he was a Director of FMR and Executive Vice President of FMR (a position he held until March 31, 1991), Vice President of Fidelity® Magellan® Fund and FMR Growth Group Leader, and Managing Director of FMR Corp. Mr. Lynch was also Vice President of Fidelity Investments Corporate Services. In addition, he serves as a Trustee of Boston College, Massachusetts Eye & Ear Infirmary, Historic Deerfield, John F. Kennedy Library, and the Museum of Fine Arts of Boston. |
Philip L. Bullen (44) |
| Year of Election or Appointment: 2001 Vice President of Advisor Europe Capital Appreciation. Mr. Bullen also serves as Vice President of certain Equity Funds (2001) and certain High Income Funds (2001). He is Senior Vice President of FMR (2001) and FMR Co., Inc. (2001), President and a Director of Fidelity Management & Research (Far East) Inc. (2001), President and a Director of Fidelity Management & Research (U.K.) Inc. (2002), and a Director of Strategic Advisers, Inc. (2002). Before joining Fidelity Investments, Mr. Bullen was President and Chief Investment Officer of Santander Global Advisors (1997-2000) and President and Chief Executive Officer of Boston's Baring Asset Management Inc. (1994-1997). |
Ian Hart (36) |
| Year of Election or Appointment: 2001 Vice President of Advisor Europe Capital Appreciation. Mr. Hart is also Vice President of another fund advised by FMR. Prior to assuming his current responsibilities, Mr. Hart managed a variety of Fidelity funds. |
Eric D. Roiter (54) |
| Year of Election or Appointment: 1998 Secretary of Advisor Europe Capital Appreciation. He also serves as Secretary of other Fidelity funds (1998); Vice President, General Counsel, and Clerk of FMR Co., Inc. (2001) and FMR (1998); Vice President and Clerk of FDC (1998); Assistant Clerk of Fidelity Management & Research (U.K.) Inc. (2001) and Fidelity Management & Research (Far East) Inc. (2001); and Assistant Secretary of Fidelity Investments Money Management Inc. (2001). Prior to joining Fidelity, Mr. Roiter was with the law firm of Debevoise & Plimpton, as an associate (1981-1984) and as a partner (1985-1997), and served as an Assistant General Counsel of the U.S. Securities and Exchange Commission (1979-1981). Mr. Roiter is an Adjunct Member, Faculty of Law, at Boston College Law School (2003). |
Stuart Fross (44) |
| Year of Election or Appointment: 2003 Assistant Secretary of Advisor Europe Capital Appreciation. Mr. Fross also serves as Assistant Secretary of other Fidelity funds (2003) and is an employee of FMR. |
Maria F. Dwyer (44) |
| Year of Election or Appointment: 2002 President and Treasurer of Advisor Europe Capital Appreciation. Ms. Dwyer also serves as President and Treasurer of other Fidelity funds (2002) and is a Vice President (1999) and an employee (1996) of FMR. Prior to joining Fidelity, Ms. Dwyer served as Director of Compliance for MFS Investment Management. |
Timothy F. Hayes (52) |
| Year of Election or Appointment: 2002 Chief Financial Officer of Advisor Europe Capital Appreciation. Mr. Hayes also serves as Chief Financial Officer of other Fidelity funds (2002). Recently he was appointed President of Fidelity Service Company (2003) where he also serves as a Director. Mr. Hayes also serves as President of Fidelity Investments Operations Group (FIOG, 2002), which includes Fidelity Pricing and Cash Management Services Group (FPCMS), where he was appointed President in 1998. Previously, Mr. Hayes served as Chief Financial Officer of Fidelity Investments Corporate Systems and Service Group (1998) and Fidelity Systems Company (1997-1998). |
John R. Hebble (45) |
| Year of Election or Appointment: 2003 Deputy Treasurer of Advisor Europe Capital Appreciation. Mr. Hebble also serves as Deputy Treasurer of other Fidelity funds (2003), and is an employee of FMR. Before joining Fidelity Investments, Mr. Hebble worked at Deutsche Asset Management where he served as Director of Fund Accounting (2002-2003) and Assistant Treasurer of the Scudder Funds (1998-2003). |
John H. Costello (57) |
| Year of Election or Appointment: 1998 Assistant Treasurer of Advisor Europe Capital Appreciation. Mr. Costello also serves as Assistant Treasurer of other Fidelity funds and is an employee of FMR. |
Francis V. Knox, Jr. (56) |
| Year of Election or Appointment: 2002 Assistant Treasurer of Advisor Europe Capital Appreciation. Mr. Knox also serves as Assistant Treasurer of other Fidelity funds (2002), and is a Vice President and an employee of FMR. Previously, Mr. Knox served as Vice President of Investment & Advisor Compliance (1990-2001), and Compliance Officer of Fidelity Management & Research (U.K.) Inc. (1992-2002), Fidelity Management & Research (Far East) Inc. (1991-2002), and FMR Corp. (1995-2002). |
Mark Osterheld (48) |
| Year of Election or Appointment: 2002 Assistant Treasurer of Advisor Europe Capital Appreciation. Mr. Osterheld also serves as Assistant Treasurer of other Fidelity funds (2002) and is an employee of FMR. |
Thomas J. Simpson (45) |
| Year of Election or Appointment: 2000 Assistant Treasurer of Advisor Europe Capital Appreciation. Mr. Simpson is Assistant Treasurer of other Fidelity funds (2000) and an employee of FMR (1996). Prior to joining FMR, Mr. Simpson was Vice President and Fund Controller of Liberty Investment Services (1987-1995). |
Annual Report
Distributions
The amounts per share which represent income derived from sources within, and taxes paid to, foreign countries or possessions of the United States are as follows:
| Pay Date | Income | Taxes |
Institutional Class | 12/9/02 | $.092 | $.022 |
Annual Report
Annual Report
Annual Report
Annual Report
Annual Report
Annual Report
Investment Adviser
Fidelity Management & Research Company
Boston, MA
Investment Sub-Advisers
FMR Co., Inc.
Fidelity Management & Research
(U.K.) Inc.
Fidelity Management & Research
(Far East) Inc.
Fidelity International
Investment Advisors
Fidelity Investments Japan Limited
Fidelity International Investment Advisors (U.K.) Limited
General Distributor
Fidelity Distributors Corporation
Boston, MA
Transfer and Shareholder
Servicing Agents
Fidelity Investments Institutional Operations Company, Inc.
Boston, MA
Custodian
State Street Bank and Trust Company
Quincy, MA
Annual Report
Fidelity Advisor Aggressive Growth Fund |
Fidelity Advisor Asset Allocation Fund |
Fidelity Advisor Balanced Fund |
Fidelity Advisor Biotechnology Fund |
Fidelity Advisor California Municipal Income Fund |
Fidelity Advisor Consumer Industries Fund |
Fidelity Advisor Cyclical Industries Fund |
Fidelity Advisor Developing Communications Fund |
Fidelity Advisor Diversified International Fund |
Fidelity Advisor Dividend Growth Fund |
Fidelity Advisor Dynamic Capital Appreciation Fund |
Fidelity Advisor Electronics Fund |
Fidelity Advisor Emerging Asia Fund |
Fidelity Advisor Emerging Markets Income Fund |
Fidelity Advisor Equity Growth Fund |
Fidelity Advisor Equity Income Fund |
Fidelity Advisor Equity Value Fund |
Fidelity Advisor Europe Capital Appreciation Fund |
Fidelity Advisor Fifty Fund |
Fidelity Advisor Financial Services Fund |
Fidelity Advisor Floating Rate High Income Fund |
Fidelity Advisor Freedom Income FundSM |
Fidelity Advisor Freedom 2010 FundSM |
Fidelity Advisor Freedom 2020 FundSM |
Fidelity Advisor Freedom 2030 FundSM |
Fidelity Advisor Freedom 2040 FundSM |
Fidelity Advisor Global Equity Fund |
Fidelity Advisor Government Investment Fund |
Fidelity Advisor Growth & Income Fund |
Fidelity Advisor Growth Opportunities |
Fidelity Advisor Health Care Fund |
Fidelity Advisor High Income Advantage Fund |
Fidelity Advisor High Income Fund |
Fidelity Advisor Inflation-Protected Bond Fund |
Fidelity Advisor Intermediate Bond Fund |
Fidelity Advisor International Capital Appreciation Fund |
Fidelity Advisor International Small Cap Fund |
Fidelity Advisor Investment Grade Bond Fund |
Fidelity Advisor Japan Fund |
Fidelity Advisor Korea Fund |
Fidelity Advisor Large Cap Fund |
Fidelity Advisor Latin America Fund |
Fidelity Advisor Leveraged Company Stock Fund |
Fidelity Advisor Mid Cap Fund |
Fidelity Advisor Mortgage Securities Fund |
Fidelity Advisor Municipal Income Fund |
Fidelity Advisor Natural Resources Fund |
Fidelity Advisor New Insights Fund |
Fidelity Advisor New York Municipal Income Fund |
Fidelity Advisor Overseas Fund |
Fidelity Advisor Real Estate Fund |
Fidelity Advisor Short Fixed-Income Fund |
Fidelity Advisor Short Intermediate Municipal Income Fund |
Fidelity Advisor Small Cap Fund |
Fidelity Advisor Strategic Growth Fund |
Fidelity Advisor Strategic Income Fund |
Fidelity Advisor Tax Managed
Stock Fund |
Fidelity Advisor Technology Fund |
Fidelity Advisor Telecommunications & Utilities Growth Fund |
Fidelity Advisor Value Leaders Fund |
Fidelity Advisor Value Strategies Fund |
Prime Fund |
Tax-Exempt Fund |
Treasury Fund |
(Fidelity Investment logo)(registered trademark)
Corporate Headquarters
82 Devonshire St., Boston, MA 02109
www.fidelity.com
AEURI-UANN-1203
1.784740.100
Fidelity® Advisor
Global Equity
Fund - Class A, Class T, Class B
and Class C
Annual Report
October 31, 2003
(2_fidelity_logos) (Registered_Trademark)
Contents
Chairman's Message | <Click Here> | Ned Johnson's message to shareholders. |
Performance | <Click Here> | How the fund has done over time. |
Management's Discussion | <Click Here> | The manager's review of fund performance, strategy and outlook. |
Investment Changes | <Click Here> | A summary of major shifts in the fund's investments over the past six months. |
Investments | <Click Here> | A complete list of the fund's investments with their market values. |
Financial Statements | <Click Here> | Statements of assets and liabilities, operations, and changes in net assets,
as well as financial highlights. |
Notes | <Click Here> | Notes to the financial statements. |
Auditors' Opinion | <Click Here> | |
Trustees and Officers | <Click Here> | |
| | |
For a free copy of the fund's proxy voting guidelines call 1-877-208-0098 or visit the Securities and Exchange Commission (SEC)'s web site at www.sec.gov.
Third party marks appearing herein are the property of their respective owners.
All other marks appearing herein are registered or unregistered trademarks or service marks of FMR Corp. or an affiliated company.
(Recycle graphic) This report is printed on recycled paper using soy-based inks.
This report and the financial statements contained herein are submitted for the general information of the shareholders of the fund. This report is not authorized for distribution to prospective investors in the fund unless preceded or accompanied by an effective prospectus.
Mutual fund shares are not deposits or obligations of, or guaranteed by, any depository institution. Shares are not insured by the FDIC, Federal Reserve Board or any other agency, and are subject to investment risks, including possible loss of principal amount invested.
Neither the fund nor Fidelity Distributors Corporation is a bank.
For more information on any Fidelity Advisor fund, including charges and expenses, contact your investment professional for a free prospectus. Read it carefully before you invest or send money.
Annual Report
Chairman's Message
(photo_of_Edward_C_Johnson_3d)
Dear Shareholder:
Many of you have read or heard news stories recently that were critical of mutual funds and made allegations that the mutual fund industry has been less than forthright. I find these reports unsettling and not necessarily an accurate picture of the overall industry, and I would like you to know where we at Fidelity stand.
With specific regard to allegations that certain mutual fund companies were violating the Securities and Exchange Commission's forward pricing rules or were involved in so-called "market timing" activities, I want to say two things:
First, Fidelity does not have agreements that permit customers who buy fund shares after 4 p.m. to obtain the 4 p.m. price. This is not to say that someone could not deceive the company through fraudulent acts. But I underscore that we have no so-called "agreements" which would permit this illegal practice.
Second, Fidelity has been on record for years opposing predatory short-term trading which adversely affects other shareholders in a mutual fund. In fact, in the 1980s, we began charging a fee - which is returned to the fund and, therefore, to investors - to discourage this activity. What's more, several years ago we took the industry lead in developing a Fair Value Pricing Policy to prevent market timing on foreign securities in our funds. It is reasonable to assume that another structure can be developed that would alter the system to make it much more difficult for predatory traders to operate. This, however, will only be achieved through close cooperation among regulators, legislators and the industry.
Certainly no industry is perfect, and there have been instances of unethical and illegal activity from time to time within the mutual fund industry. When this occurs, confessed or convicted offenders should be dealt with appropriately. Clearly, every system can be improved. We applaud well thought out improvements by regulators, legislators and industry representatives that achieve the common goal of building and protecting the value of investors' holdings. But we remain concerned about the risk of over-regulation and the quick application of simplistic solutions to intricate problems.
For more than 57 years, Fidelity Investments has worked very hard to improve its products and service to justify your trust. When our family founded this company in 1946, we had only a few hundred customers. Many of them were family and friends. Today, we serve more than 18 million customers including individual investors and participants in retirement plans across America.
Let me close by saying that we do not take your trust in us for granted, and we realize that we must always work to improve all aspects of our service to you. In turn, we urge you to continue your active participation with your financial matters, so that your interests can be well served.
Annual Report
Best regards,
/s/Edward C. Johnson 3d
Edward C. Johnson 3d
Annual Report
Performance: The Bottom Line
Average annual total return reflects the change in the value of an investment, assuming reinvestment of the class' dividend income and capital gains (the profits earned upon the sale of securities that have grown in value) and assuming a constant rate of performance each year. During periods of reimbursement by Fidelity, a fund's total return will be greater than it would be had the reimbursement not occurred. The $10,000 table and the fund's returns do not reflect the deduction of taxes that a shareholder would pay on fund distributions or the redemption of fund shares. How a fund did yesterday is no guarantee of how it will do tomorrow. Returns may reflect the conversion of Class B shares to Class A shares after a maximum of seven years.
Average Annual Total Returns
Periods ended October 31, 2003 | Past 1
year | Life of
fund A |
Class A (incl. 5.75% sales charge) | 17.32% | 0.66% |
Class T (incl. 3.50% sales charge) | 19.89% | 0.88% |
Class B (incl. contingent deferred sales charge)B | 18.63% | 0.71% |
Class C (incl. contingent deferred sales charge)C | 22.72% | 1.15% |
A From December 17, 1998.
B Class B shares' contingent deferred sales charges included in the past one year and life of fund total return figures are 5% and 2%, respectively.
C Class C shares' contingent deferred sales charges included in the past one year and life of fund total return figures are 1% and 0%, respectively.
** Not available
Annual Report
$10,000 Over Life of Fund
Let's say hypothetically that $10,000 was invested in Fidelity® Advisor Global Equity Fund - Class T on December 17, 1998, when the fund started, and the current 3.50% sales charge was paid. The chart shows how the value of your investment would have grown, and also shows how the MSCI® World Index did over the same period.

Annual Report
Management's Discussion of Fund Performance
Comments from Richard Habermann, Portfolio Manager of Fidelity® Advisor Global Equity Fund
Mirroring the U.S. rally, most international stock markets rebounded sharply during the 12-month period ending October 31, 2003. Encouraged by improved corporate earnings, favorable interest rates and the easing of geopolitical tensions, the Morgan Stanley Capital InternationalSM Europe, Australasia, Far East (MSCI® EAFE®) Index - a proxy for stock markets outside the United States and Canada - gained 27.39% during the past year. From a regional perspective, all 16 countries in the MSCI Europe index - which gained 24.56% - - had double-digit advances. Spain, Denmark and Sweden were among the region's best performers. In Japan, increased capital spending, exports and machinery orders helped the Tokyo Stock Exchange Stock Price Index (TOPIX) advance 36.39%. Following the SARS epidemic, other Asian markets also rebounded. For instance, the Hong Kong market, as measured by the Hang Seng Index, gained 34.51%. Emerging markets also fared well, particularly Latin America. The MSCI Emerging Markets Free Latin America index rose 59.75%. Canadian equities, as measured by the S&P/TSX Composite Index, also posted an impressive annual gain, advancing 50.66%.
Fidelity Advisor Global Equity Fund's Class A, Class T, Class B and Class C shares gained 24.48%, 24.24%, 23.63% and 23.72%, respectively, during the one-year period ending Octo-ber 31, 2003. In comparison, the Morgan Stanley Capital International World Index and the LipperSM Global Funds Average returned 24.24% and 23.59%, respectively. While security selection largely drove the fund's results, my regional allocation decisions also added value. I maintained a modest overweighting in Japan and Southeast Asia, while underweighting Europe - whose economies I felt would be slower to benefit from a pickup in global demand. This strategy worked well earlier in the period as Europe lagged the world market. The fund's U.S. holdings had by far the most influence on performance. Our aggressive positioning in technology helped a lot, driven by industry leaders such as Yahoo!, Motorola and EMC. Some good picks among homebuilding and medical device stocks also contributed. Japanese consumer cyclical and brokerage stocks - including NOK and Nomura Holdings, respectively - further aided results, while the fund's more-defensive positioning in Europe curbed our gains in that market. Conversely, the fund suffered from its overexposure to lagging health care stocks, including Tenet Healthcare, Cardinal Health, Johnson & Johnson and France-based Aventis.
The views expressed in this statement reflect those of the portfolio manager only through the end of the period of the report as stated on the cover and do not necessarily represent the views of Fidelity or any other person in the Fidelity organization. Any such views are subject to change at any time based upon market or other conditions and Fidelity disclaims any responsibility to update such views. These views may not be relied on as investment advice and, because investment decisions for a Fidelity fund are based on numerous factors, may not be relied on as an indication of trading intent on behalf of any Fidelity fund.
Annual Report
Investment Changes
Top Five Stocks as of October 31, 2003 |
| % of fund's
net assets | % of fund's net assets
6 months ago |
Johnson & Johnson (United States of America, Pharmaceuticals) | 2.2 | 2.9 |
Lennar Corp. Class A (United States of America, Household Durables) | 2.1 | 1.6 |
Microsoft Corp. (United States of America, Software) | 2.1 | 3.4 |
Motorola, Inc. (United States of America, Communications Equipment) | 1.8 | 0.5 |
Univision Communications, Inc. Class A (United States of America, Media) | 1.7 | 1.9 |
| 9.9 | |
Top Five Market Sectors as of October 31, 2003 |
| % of fund's
net assets | % of fund's net assets
6 months ago |
Consumer Discretionary | 16.9 | 18.8 |
Financials | 17.5 | 17.0 |
Information Technology | 15.6 | 14.3 |
Health Care | 14.4 | 15.5 |
Consumer Staples | 7.3 | 8.9 |
Top Five Countries as of October 31, 2003 |
(excluding cash equivalents) | % of fund's
net assets | % of fund's net assets
6 months ago |
United States of America | 53.9 | 55.2 |
Japan | 10.3 | 8.1 |
United Kingdom | 8.6 | 10.3 |
France | 3.8 | 3.8 |
Canada | 2.6 | 2.4 |
Percentages are adjusted for the effect of open futures contracts, if applicable. |
Asset Allocation (% of fund's net assets) |
As of October 31, 2003 | As of April 30, 2003 |
| Stocks and Equity
Futures 97.0% | | | Stocks and Equity
Futures 97.2% | |
| Short-Term
Investments and
Net Other Assets 3.0% | | | Short-Term
Investments and
Net Other Assets 2.8% | |

Annual Report
Investments October 31, 2003
Showing Percentage of Net Assets
Common Stocks - 91.3% |
| Shares | | Value (Note 1) |
Australia - 1.9% |
Amcor Ltd. | 2,848 | | $ 17,133 |
AMP Ltd. | 4,200 | | 19,559 |
AMP Ltd. rights 1/2/04 | 4,200 | | 244 |
Australia & New Zealand Banking Group Ltd. | 3,900 | | 49,132 |
Australia & New Zealand Banking Group Ltd. rights 11/24/03 (a) | 709 | | 2,163 |
Australian Gas Light Co. | 1,053 | | 7,974 |
Australian Stock Exchange Ltd. | 700 | | 7,927 |
AXA Asia Pacific Holdings Ltd. | 5,800 | | 11,617 |
BHP Billiton Ltd. | 9,785 | | 81,165 |
BHP Steel Ltd. | 2,457 | | 9,425 |
Brambles Industries Ltd. | 1,900 | | 6,280 |
Coca-Cola Amatil Ltd. | 3,666 | | 15,282 |
Commonwealth Bank of Australia | 2,200 | | 42,819 |
CSL Ltd. | 1,310 | | 15,762 |
Fosters Group Ltd. | 1,700 | | 5,499 |
Gunns Ltd. | 1,177 | | 10,663 |
Insurance Australia Group Ltd. | 3,909 | | 12,311 |
JB Hi-Fi Ltd. (a) | 4,650 | | 6,977 |
Lend Lease Corp. Ltd. | 1,833 | | 14,543 |
National Australia Bank Ltd. | 1,200 | | 25,980 |
Newcrest Mining Ltd. | 1,600 | | 13,679 |
News Corp. Ltd. | 2,466 | | 21,978 |
Origin Energy Ltd. | 2,024 | | 6,160 |
Publishing & Broadcasting Ltd. | 1,500 | | 12,793 |
Qantas Airways Ltd. | 2,979 | | 7,611 |
QBE Insurance Group Ltd. | 2,990 | | 21,797 |
Rinker Group Ltd. | 2,900 | | 13,033 |
Rio Tinto Ltd. | 1,403 | | 35,399 |
Westfield Holdings Ltd. | 1,000 | | 10,057 |
Westpac Banking Corp. | 3,600 | | 41,149 |
WMC Resources Ltd. (a) | 5,700 | | 20,655 |
Woolworths Ltd. | 2,000 | | 15,740 |
TOTAL AUSTRALIA | | 582,506 |
Belgium - 0.4% |
Agfa-Gevaert NV | 1,700 | | 42,046 |
Colruyt NV | 400 | | 36,144 |
Mobistar SA (a) | 900 | | 45,041 |
TOTAL BELGIUM | | 123,231 |
Canada - 2.6% |
Agnico-Eagle Mines Ltd. | 290 | | 3,163 |
Common Stocks - continued |
| Shares | | Value (Note 1) |
Canada - continued |
Agrium, Inc. | 570 | | $ 8,798 |
Alcan, Inc. | 360 | | 14,362 |
Alimentation Couche-Tard, Inc. Class B (sub. vtg.) (a) | 100 | | 1,706 |
Angiotech Pharmaceuticals, Inc. (a) | 480 | | 21,992 |
Astral Media, Inc. Class A (non-vtg.) | 760 | | 15,102 |
ATI Technologies, Inc. (a) | 810 | | 11,599 |
Bank of Montreal, Quebec | 800 | | 29,931 |
Bank of Nova Scotia | 840 | | 41,710 |
BCE, Inc. | 1,150 | | 26,035 |
Bombardier, Inc. Class B (sub. vtg.) | 1,820 | | 8,172 |
Brascan Corp. Class A (ltd. vtg.) | 200 | | 5,688 |
C.I. Fund Management, Inc. | 350 | | 3,915 |
Cameco Corp. | 230 | | 9,961 |
Canadian Imperial Bank of Commerce | 710 | | 31,884 |
Canadian National Railway Co. | 390 | | 23,441 |
Cinram International, Inc. | 1,270 | | 26,460 |
CP Ships Ltd. | 200 | | 3,785 |
Enbridge, Inc. | 290 | | 11,391 |
EnCana Corp. | 994 | | 34,128 |
Fairfax Financial Holdings Ltd. | 30 | | 4,664 |
Goldcorp, Inc. | 880 | | 13,829 |
Great-West Lifeco, Inc. | 590 | | 18,271 |
Inco Ltd. (a) | 410 | | 13,601 |
Industrial Alliance Life Insurance Co. | 110 | | 3,254 |
Investors Group, Inc. | 160 | | 3,537 |
Kinross Gold Corp. (a) | 1,470 | | 12,052 |
Loblaw Companies Ltd. | 370 | | 17,918 |
Magna International, Inc. Class A | 100 | | 8,019 |
Manitoba Telecom Services, Inc. | 240 | | 7,312 |
Masonite International Corp. (a) | 180 | | 4,027 |
National Bank of Canada | 430 | | 13,342 |
Newmont Mining Corp. of Canada Ltd. (exchangeable shares) | 440 | | 19,175 |
Nortel Networks Corp. (a) | 6,740 | | 29,993 |
Penn West Petroleum Ltd. (a) | 230 | | 7,831 |
Petro-Canada | 550 | | 22,163 |
PetroKazakhstan, Inc. Class A (a) | 190 | | 4,323 |
Power Financial Corp. | 420 | | 14,459 |
Precision Drilling Corp. (a) | 180 | | 7,081 |
Research in Motion Ltd. (a) | 580 | | 25,619 |
Rogers Communications, Inc. Class B (non-vtg.) | 270 | | 4,249 |
Royal Bank of Canada | 1,040 | | 50,071 |
Saputo, Inc. | 700 | | 13,910 |
Common Stocks - continued |
| Shares | | Value (Note 1) |
Canada - continued |
Shell Canada Ltd. Class A | 80 | | $ 3,143 |
Sun Life Financial, Inc. | 333 | | 8,231 |
Suncor Energy, Inc. | 600 | | 12,601 |
Talisman Energy, Inc. | 380 | | 18,558 |
Teck Cominco Ltd. Class B (sub. vtg.) | 480 | | 6,262 |
TELUS Corp. (non-vtg.) | 480 | | 8,406 |
Terasen, Inc. | 310 | | 10,879 |
Toronto-Dominion Bank | 1,050 | | 34,928 |
TransCanada Corp. | 780 | | 15,914 |
TOTAL CANADA | | 770,845 |
Cayman Islands - 1.0% |
Noble Corp. (a) | 3,960 | | 135,947 |
Seagate Technology | 7,740 | | 177,865 |
TOTAL CAYMAN ISLANDS | | 313,812 |
Denmark - 0.8% |
A.P. Moller - Maersk AS Series A | 6 | | 45,441 |
Danske Bank AS | 2,630 | | 52,870 |
ISS AS | 2,128 | | 101,142 |
Novo Nordisk AS Series B | 1,250 | | 44,802 |
TOTAL DENMARK | | 244,255 |
Finland - 0.4% |
Fortum Oyj | 4,440 | | 40,788 |
Nokia Corp. | 3,110 | | 52,839 |
Sampo Oyj (A Shares) | 4,129 | | 34,631 |
TOTAL FINLAND | | 128,258 |
France - 3.8% |
Alcatel SA (RFD) (a) | 4,200 | | 55,356 |
Aventis SA (France) | 2,193 | | 116,141 |
AXA SA | 9,474 | | 178,895 |
BNP Paribas SA | 1,792 | | 93,833 |
Cap Gemini SA (a) | 1,800 | | 90,394 |
CNP Assurances | 600 | | 27,268 |
Credit Agricole SA | 2,900 | | 61,378 |
Credit Agricole SA rights 11/7/03 (a) | 2,900 | | 672 |
France Telecom SA (a) | 2,400 | | 57,885 |
Suez SA (France) | 2,400 | | 38,368 |
Television Francaise 1 SA | 1,170 | | 34,969 |
Common Stocks - continued |
| Shares | | Value (Note 1) |
France - continued |
Total SA Series B | 1,525 | | $ 238,114 |
Vivendi Universal SA (a) | 7,100 | | 148,626 |
TOTAL FRANCE | | 1,141,899 |
Germany - 1.4% |
Allianz AG (Reg.) | 700 | | 74,783 |
Altana AG | 600 | | 37,680 |
Bayerische Hypo Und Verein AG (a) | 1,200 | | 26,343 |
Deutsche Boerse AG | 1,101 | | 60,992 |
Deutsche Telekom AG (Reg.) (a) | 2,200 | | 34,342 |
Merck KGaA | 600 | | 20,942 |
Muenchener Rueckversicherungs-Gesellschaft AG: | | | |
rights 11/10/03 (a) | 1,253 | | 10,320 |
(Reg.) | 1,253 | | 148,913 |
TOTAL GERMANY | | 414,315 |
Hong Kong - 0.9% |
Bank of East Asia Ltd. | 4,452 | | 13,301 |
Cafe de Coral Holdings Ltd. | 6,000 | | 5,408 |
Cheung Kong Holdings Ltd. | 3,000 | | 25,014 |
China Everbright Ltd. | 12,000 | | 6,606 |
CLP Holdings Ltd. | 900 | | 4,068 |
CNOOC Ltd. | 3,500 | | 6,603 |
Denway Motors Ltd. | 10,000 | | 8,241 |
Esprit Holdings Ltd. | 2,000 | | 6,284 |
Guoco Group Ltd. | 783 | | 5,520 |
Hang Seng Bank Ltd. | 900 | | 11,242 |
Hong Kong & China Gas Co. Ltd. | 9,400 | | 13,013 |
Hutchison Whampoa Ltd. | 6,600 | | 51,207 |
Johnson Electric Holdings Ltd. | 5,000 | | 6,503 |
Li & Fung Ltd. | 12,000 | | 20,166 |
PCCW Ltd. (a) | 18,000 | | 12,864 |
Sun Hung Kai Properties Ltd. | 4,000 | | 33,867 |
Swire Pacific Ltd. (A Shares) | 1,500 | | 9,156 |
Television Broadcasts Ltd. | 3,000 | | 14,217 |
Varitronix International Ltd. | 5,000 | | 5,312 |
Wharf Holdings Ltd. | 2,000 | | 5,035 |
TOTAL HONG KONG | | 263,627 |
Ireland - 0.2% |
CRH PLC | 3,427 | | 61,337 |
Common Stocks - continued |
| Shares | | Value (Note 1) |
Italy - 1.3% |
Autostrade Spa | 5,840 | | $ 85,243 |
Banca Intesa Spa | 20,000 | | 67,329 |
Banco Popolare di Verona e Novara | 5,890 | | 90,715 |
ENI Spa | 6,111 | | 96,675 |
Riunione Adriatica di Sicurta Spa (RAS) | 2,315 | | 36,046 |
TOTAL ITALY | | 376,008 |
Japan - 10.3% |
Ajinomoto Co., Inc. | 2,000 | | 20,193 |
Asahi Glass Co. Ltd. | 2,000 | | 15,790 |
Bridgestone Corp. | 1,000 | | 13,098 |
Canon, Inc. | 2,000 | | 97,900 |
Citizen Watch Co. Ltd. | 3,000 | | 24,586 |
Daicel Chemical Industries Ltd. | 5,000 | | 21,193 |
Daikin Industries Ltd. | 1,000 | | 21,330 |
Dainippon Screen Manufacturing Co. Ltd. (a) | 2,000 | | 14,281 |
Daito Trust Construction Co. | 1,000 | | 30,926 |
Denki Kagaku Kogyo KK | 6,000 | | 18,228 |
Denso Corp. | 1,300 | | 24,654 |
Dowa Mining Co. Ltd. | 5,000 | | 27,015 |
East Japan Railway Co. | 7 | | 31,708 |
Faith, Inc. | 1 | | 8,141 |
Fast Retailing Co. Ltd. | 1,100 | | 66,836 |
Fuji Photo Film Co. Ltd. | 2,000 | | 58,941 |
Funai Electric Co. Ltd. | 100 | | 13,325 |
Heiwa Corp. | 500 | | 7,240 |
Hitachi Cable Ltd. | 3,000 | | 11,925 |
Hitachi Chemical Co. Ltd. | 1,700 | | 27,462 |
Hoya Corp. | 400 | | 36,202 |
Isetan Co. Ltd. | 1,700 | | 17,597 |
Ito Yokado Ltd. | 1,000 | | 36,747 |
JAFCO Co. Ltd. | 200 | | 17,100 |
Japan Radio Co. Ltd. (a) | 3,000 | | 14,517 |
Japan Retail Fund Investment Corp. | 3 | | 17,546 |
JFE Holdings, Inc. | 1,100 | | 28,115 |
JSR Corp. | 2,000 | | 42,387 |
Kaneka Corp. | 2,000 | | 15,590 |
Kao Corp. | 1,000 | | 20,557 |
KDDI Corp. | 13 | | 70,593 |
Keyence Corp. | 100 | | 21,994 |
Kokuyo Co. Ltd. | 1,000 | | 10,397 |
Konami Corp. | 300 | | 9,141 |
Common Stocks - continued |
| Shares | | Value (Note 1) |
Japan - continued |
Konica Minolta Holdings, Inc. | 6,500 | | $ 85,433 |
Kyocera Corp. | 600 | | 36,129 |
Kyorin Pharmaceutical Co. Ltd. | 1,000 | | 15,054 |
Matsushita Electric Industrial Co. Ltd. | 3,000 | | 39,360 |
Meitec Corp. | 500 | | 17,873 |
Millea Holdings, Inc. | 2 | | 23,831 |
Mitsubishi Securities Co. Ltd. | 4,000 | | 45,479 |
Mitsubishi Tokyo Financial Group, Inc. (MTFG) | 10 | | 73,400 |
Mitsui & Co. Ltd. | 12,000 | | 87,320 |
Mitsui Fudosan Co. Ltd. | 2,000 | | 18,610 |
Mitsui O.S.K. Lines Ltd. | 6,000 | | 24,395 |
Mizuho Financial Group, Inc. (a) | 13 | | 31,808 |
Murata Manufacturing Co. Ltd. | 300 | | 17,055 |
Nichicon Corp. | 1,800 | | 20,924 |
Nidec Corp. | 200 | | 19,374 |
Nikko Cordial Corp. | 7,000 | | 37,757 |
Nippon Sheet Glass Co. Ltd. | 4,000 | | 12,298 |
Nippon Steel Corp. | 14,000 | | 28,779 |
Nishimatsuya Chain Co. Ltd. | 500 | | 15,008 |
Nissan Motor Co. Ltd. | 11,100 | | 125,486 |
Nitto Denko Corp. | 1,200 | | 62,980 |
NOK Corp. | 3,000 | | 118,155 |
Nomura Holdings, Inc. | 5,000 | | 85,865 |
Nomura Research Institute Ltd. | 100 | | 10,051 |
NTN Corp. | 5,000 | | 26,060 |
Oji Paper Co. Ltd. | 3,000 | | 15,963 |
ORIX Corp. | 300 | | 25,241 |
Pacific Metals Co. Ltd. (a) | 3,000 | | 14,299 |
Ricoh Co. Ltd. | 2,000 | | 37,930 |
Rohm Co. Ltd. | 500 | | 67,400 |
Sanken Electric Co. Ltd. | 2,000 | | 22,176 |
Sankyo Co. Ltd. (Gunma) | 500 | | 16,691 |
Sankyo Seiki Manufacturing Co. Ltd. (a) | 1,000 | | 7,704 |
Sanyo Shokai Ltd. | 1,000 | | 6,149 |
SFCG Co. Ltd. | 210 | | 30,600 |
Shimachu Co. Ltd. | 1,100 | | 21,512 |
Shin-Etsu Chemical Co. Ltd. | 1,200 | | 44,643 |
SMC Corp. | 300 | | 36,102 |
Stanley Electric Co. Ltd. | 3,000 | | 63,853 |
Sumisho Lease Co. Ltd. | 400 | | 12,298 |
Sumitomo Corp. | 4,000 | | 27,761 |
Sumitomo Electric Industries Ltd. | 2,000 | | 17,191 |
Common Stocks - continued |
| Shares | | Value (Note 1) |
Japan - continued |
Sumitomo Mitsui Financial Group, Inc. | 21 | | $ 105,630 |
Takeda Chemical Industries Ltd. | 1,700 | | 60,151 |
Terumo Corp. | 1,800 | | 34,219 |
THK Co. Ltd. | 1,400 | | 28,397 |
Tokyo Electric Power Co. | 2,500 | | 53,325 |
Tokyo Electron Ltd. | 800 | | 57,340 |
Toray Industries, Inc. | 3,000 | | 12,470 |
Toyoda Gosei Co. Ltd. | 900 | | 26,605 |
Toyota Motor Corp. | 5,600 | | 162,456 |
UFJ Holdings, Inc. (a) | 15 | | 64,126 |
Uni-Charm Corp. | 500 | | 23,331 |
Uniden Corp. | 1,000 | | 19,010 |
TOTAL JAPAN | | 3,106,312 |
Netherlands - 1.8% |
Euronext NV | 4,550 | | 110,953 |
ING Groep NV (Certificaten Van Aandelen) | 7,210 | | 150,256 |
Koninklijke Ahold NV (a) | 5,400 | | 45,541 |
Koninklijke Numico NV (Certificaten Van Aandelen) (a) | 5,300 | | 119,173 |
Koninklijke Philips Electronics NV | 3,721 | | 99,872 |
TOTAL NETHERLANDS | | 525,795 |
New Zealand - 0.1% |
Sky City Entertainment Group Ltd. | 1,200 | | 6,591 |
Telecom Corp. of New Zealand Ltd. | 3,481 | | 10,340 |
TOTAL NEW ZEALAND | | 16,931 |
Norway - 0.5% |
DnB Holding ASA | 5,420 | | 31,484 |
Gjensidige NOR ASA | 800 | | 32,631 |
Statoil ASA | 3,300 | | 30,866 |
Telenor ASA | 9,600 | | 51,985 |
TOTAL NORWAY | | 146,966 |
Papua New Guinea - 0.1% |
Lihir Gold Ltd. | 9,100 | | 10,949 |
Oil Search Ltd. | 15,400 | | 11,226 |
TOTAL PAPUA NEW GUINEA | | 22,175 |
Singapore - 0.6% |
City Developments Ltd. | 3,000 | | 10,434 |
DBS Group Holdings Ltd. | 2,000 | | 16,442 |
Flextronics International Ltd. (a) | 7,070 | | 98,980 |
Common Stocks - continued |
| Shares | | Value (Note 1) |
Singapore - continued |
Keppel Corp. Ltd. | 2,000 | | $ 6,841 |
Oversea-Chinese Banking Corp. Ltd. | 1,000 | | 6,956 |
Singapore Airlines Ltd. | 1,000 | | 6,956 |
Singapore Exchange Ltd. | 6,000 | | 5,726 |
Singapore Post Ltd. | 23,000 | | 8,859 |
Singapore Press Holdings Ltd. | 400 | | 4,530 |
United Overseas Bank Ltd. | 3,096 | | 24,206 |
TOTAL SINGAPORE | | 189,930 |
Spain - 2.3% |
Altadis SA (Spain) | 7,600 | | 183,656 |
Antena 3 Television SA (a) | 44 | | 1,432 |
Banco Popular Espanol SA (Reg.) | 1,030 | | 53,372 |
Banco Santander Central Hispano SA | 8,790 | | 84,008 |
Corporacion Mapfre SA (Reg.) | 3,100 | | 38,498 |
Fomento Construcciones y Contratas SA (FOCSA) | 1,370 | | 44,533 |
Grupo Dragados SA | 3,610 | | 73,478 |
Sogecable SA (a) | 1,550 | | 39,449 |
Telefonica SA | 13,153 | | 163,974 |
TOTAL SPAIN | | 682,400 |
Sweden - 1.0% |
Hennes & Mauritz AB (H&M) (B Shares) | 4,200 | | 88,742 |
Securitas AB (B Shares) | 4,500 | | 55,153 |
Svenska Handelsbanken AB (A Shares) | 3,678 | | 64,565 |
Telefonaktiebolaget LM Ericsson (B Shares) (a) | 62,200 | | 106,238 |
TOTAL SWEDEN | | 314,698 |
Switzerland - 2.1% |
Adecco SA | 1,114 | | 65,439 |
Credit Suisse Group (Reg.) | 5,470 | | 191,976 |
Nestle SA (Reg.) | 921 | | 201,980 |
Novartis AG (Reg.) | 3,136 | | 120,328 |
Swiss Life Holding (a) | 270 | | 45,618 |
TOTAL SWITZERLAND | | 625,341 |
United Kingdom - 8.6% |
3i Group PLC | 15,420 | | 161,991 |
Anglo American PLC (United Kingdom) | 3,740 | | 76,425 |
AstraZeneca PLC (Sweden) | 2,112 | | 99,900 |
Barclays PLC | 10,770 | | 90,696 |
BG Group PLC | 21,490 | | 97,859 |
Boots Group PLC | 5,700 | | 68,814 |
Common Stocks - continued |
| Shares | | Value (Note 1) |
United Kingdom - continued |
BP PLC | 31,800 | | $ 224,614 |
British Sky Broadcasting Group PLC (BSkyB) (a) | 5,500 | | 59,643 |
Carnival PLC | 2,100 | | 72,410 |
GlaxoSmithKline PLC | 10,031 | | 217,121 |
HSBC Holdings PLC: | | | |
(Hong Kong) (Reg.) | 3,844 | | 57,714 |
(United Kingdom) (Reg.) | 13,940 | | 209,295 |
Kesa Electricals PLC | 7,136 | | 29,503 |
Kingfisher PLC | 5,258 | | 25,168 |
Man Group PLC | 3,250 | | 79,794 |
Prudential PLC | 9,290 | | 71,976 |
Reed Elsevier PLC | 4,180 | | 32,438 |
Royal Bank of Scotland Group PLC | 1,600 | | 42,807 |
Shell Transport & Trading Co. PLC (Reg.) | 33,590 | | 213,632 |
Standard Chartered PLC | 6,300 | | 100,609 |
Unilever PLC | 15,680 | | 134,064 |
United Business Media PLC | 7,594 | | 59,704 |
Vodafone Group PLC | 167,564 | | 354,398 |
TOTAL UNITED KINGDOM | | 2,580,575 |
United States of America - 49.2% |
Abbott Laboratories | 3,290 | | 140,220 |
Abercrombie & Fitch Co. Class A (a) | 940 | | 26,790 |
Aetna, Inc. | 1,560 | | 89,560 |
AFLAC, Inc. | 930 | | 33,926 |
Agere Systems, Inc.: | | | |
Class A (a) | 260 | | 905 |
Class B (a) | 6,397 | | 21,686 |
Albany International Corp. Class A | 2,280 | | 70,452 |
Allergan, Inc. | 2,070 | | 156,533 |
Allstate Corp. | 2,090 | | 82,555 |
Altria Group, Inc. | 60 | | 2,790 |
American International Group, Inc. | 1,420 | | 86,379 |
AmerisourceBergen Corp. | 1,110 | | 63,015 |
Amphenol Corp. Class A (a) | 660 | | 38,775 |
Analog Devices, Inc. (a) | 1,870 | | 82,897 |
Aramark Corp. Class B (a) | 1,910 | | 51,035 |
AT&T Corp. | 2,268 | | 42,162 |
Avon Products, Inc. | 1,590 | | 108,056 |
Baker Hughes, Inc. | 1,800 | | 50,868 |
Bank of America Corp. | 690 | | 52,254 |
Bank of Hawaii Corp. | 1,500 | | 59,100 |
Common Stocks - continued |
| Shares | | Value (Note 1) |
United States of America - continued |
BEA Systems, Inc. (a) | 290 | | $ 4,031 |
Becton, Dickinson & Co. | 2,100 | | 76,776 |
Biomet, Inc. | 1,480 | | 53,073 |
BJ Services Co. (a) | 1,100 | | 36,091 |
Black & Decker Corp. | 340 | | 16,255 |
Boston Scientific Corp. (a) | 730 | | 49,436 |
Bristol-Myers Squibb Co. | 2,400 | | 60,888 |
Burlington Resources, Inc. | 690 | | 33,562 |
Cardinal Health, Inc. | 580 | | 34,417 |
Cavco Industries, Inc. (a) | 52 | | 1,256 |
Cendant Corp. (a) | 4,020 | | 82,129 |
Centex Corp. | 1,040 | | 101,400 |
Charles Schwab Corp. | 4,210 | | 57,088 |
ChevronTexaco Corp. | 1,510 | | 112,193 |
Clear Channel Communications, Inc. | 4,054 | | 165,484 |
Comcast Corp.: | | | |
Class A (a) | 228 | | 7,734 |
Class A (special) (a) | 3,050 | | 99,491 |
Compuware Corp. (a) | 8,930 | | 50,187 |
ConocoPhillips | 790 | | 45,149 |
Danaher Corp. | 2,140 | | 177,299 |
Dean Foods Co. (a) | 6,000 | | 181,500 |
Dell, Inc. (a) | 11,080 | | 400,210 |
Dow Chemical Co. | 2,170 | | 81,787 |
EMC Corp. (a) | 13,220 | | 182,965 |
ENSCO International, Inc. | 2,170 | | 57,180 |
Fairchild Semiconductor International, Inc. (a) | 1,490 | | 33,674 |
Fannie Mae | 1,780 | | 127,608 |
FedEx Corp. | 730 | | 55,305 |
FirstEnergy Corp. | 890 | | 30,607 |
FleetBoston Financial Corp. | 1,140 | | 46,045 |
Fleetwood Enterprises, Inc. (a) | 2,630 | | 26,510 |
Forest Laboratories, Inc. (a) | 620 | | 31,006 |
Freddie Mac | 1,610 | | 90,369 |
Freeport-McMoRan Copper & Gold, Inc. Class B | 4,530 | | 175,538 |
Gap, Inc. | 3,850 | | 73,458 |
Genentech, Inc. (a) | 2,220 | | 181,973 |
Gillette Co. | 3,830 | | 122,177 |
Golden West Financial Corp., Delaware | 710 | | 71,305 |
HCA, Inc. | 810 | | 30,983 |
Herman Miller, Inc. | 1,200 | | 27,564 |
Hewlett-Packard Co. | 6,250 | | 139,438 |
Common Stocks - continued |
| Shares | | Value (Note 1) |
United States of America - continued |
Home Depot, Inc. | 890 | | $ 32,992 |
Hudson Highland Group, Inc. (a) | 207 | | 4,560 |
Illinois Tool Works, Inc. | 450 | | 33,098 |
Integrated Silicon Solution, Inc. (a) | 970 | | 13,696 |
Intel Corp. | 12,850 | | 424,693 |
InterActiveCorp (a) | 3,380 | | 124,080 |
Intersil Corp. Class A | 640 | | 16,506 |
J.P. Morgan Chase & Co. | 3,280 | | 117,752 |
Jabil Circuit, Inc. (a) | 3,280 | | 91,348 |
Johnson & Johnson | 12,870 | | 647,737 |
KB Home | 220 | | 15,068 |
KLA-Tencor Corp. (a) | 4,010 | | 229,893 |
Lattice Semiconductor Corp. (a) | 960 | | 7,488 |
Lennar Corp.: | | | |
Class A | 6,910 | | 634,684 |
Class B | 698 | | 60,621 |
Liberty Media Corp. Class A (a) | 38,987 | | 393,379 |
Lowe's Companies, Inc. | 1,020 | | 60,109 |
LSI Logic Corp. (a) | 2,750 | | 25,410 |
Lucent Technologies, Inc. (a) | 24,180 | | 77,376 |
Lyondell Chemical Co. | 3,780 | | 54,054 |
Manpower, Inc. | 6,400 | | 296,960 |
Martin Marietta Materials, Inc. | 1,280 | | 52,442 |
Masco Corp. | 1,110 | | 30,525 |
Maytag Corp. | 960 | | 24,384 |
McKesson Corp. | 2,960 | | 89,599 |
Medtronic, Inc. | 4,220 | | 192,305 |
Merck & Co., Inc. | 7,910 | | 350,018 |
Merrill Lynch & Co., Inc. | 3,510 | | 207,792 |
MetLife, Inc. | 1,160 | | 36,424 |
Mettler-Toledo International, Inc. (a) | 1,750 | | 67,095 |
Micron Technology, Inc. (a) | 7,260 | | 104,108 |
Microsoft Corp. | 23,800 | | 622,370 |
Millennium Chemicals, Inc. | 500 | | 5,010 |
Mohawk Industries, Inc. (a) | 436 | | 32,316 |
Monster Worldwide, Inc. (a) | 2,770 | | 70,552 |
Morgan Stanley | 2,110 | | 115,776 |
Motorola, Inc. | 41,020 | | 555,001 |
National Semiconductor Corp. (a) | 720 | | 29,254 |
National-Oilwell, Inc. (a) | 2,070 | | 39,475 |
NIKE, Inc. Class B | 760 | | 48,564 |
Northrop Grumman Corp. | 280 | | 25,032 |
Common Stocks - continued |
| Shares | | Value (Note 1) |
United States of America - continued |
Northwest Airlines Corp. (a) | 2,305 | | $ 31,555 |
Parker Hannifin Corp. | 560 | | 28,543 |
PepsiCo, Inc. | 1,990 | | 95,162 |
Performance Food Group Co. (a) | 1,460 | | 54,385 |
Perrigo Co. | 2,480 | | 33,356 |
Pfizer, Inc. | 10,522 | | 332,495 |
PolyOne Corp. | 2,710 | | 13,089 |
Progressive Corp. | 410 | | 30,258 |
Pulte Homes, Inc. | 1,660 | | 143,607 |
RealNetworks, Inc. (a) | 1,490 | | 9,909 |
ResMed, Inc. Chess Depositary Interests (a) | 765 | | 3,249 |
St. Jude Medical, Inc. (a) | 4,240 | | 246,598 |
Stryker Corp. | 1,380 | | 111,932 |
Synovus Financial Corp. | 1,460 | | 40,296 |
Synthes-Stratec, Inc. | 63 | | 57,615 |
Sysco Corp. | 1,810 | | 60,925 |
Tenet Healthcare Corp. (a) | 2,495 | | 34,431 |
Texas Instruments, Inc. | 3,220 | | 93,122 |
The Coca-Cola Co. | 4,620 | | 214,368 |
Time Warner, Inc. (a) | 26,320 | | 402,433 |
Toys 'R' Us, Inc. (a) | 3,280 | | 42,640 |
Transocean, Inc. (a) | 1,400 | | 26,866 |
Tyson Foods, Inc. Class A | 4,110 | | 58,650 |
Union Pacific Corp. | 550 | | 34,430 |
UnitedHealth Group, Inc. | 1,260 | | 64,109 |
Univision Communications, Inc. Class A (a) | 14,970 | | 508,232 |
VERITAS Software Corp. (a) | 2,220 | | 80,253 |
Viacom, Inc. Class B (non-vtg.) | 9,890 | | 394,314 |
Wachovia Corp. | 1,380 | | 63,301 |
Wal-Mart Stores, Inc. | 2,460 | | 145,017 |
Waste Management, Inc. | 3,210 | | 83,203 |
Weatherford International Ltd. (a) | 3,750 | | 130,313 |
Whole Foods Market, Inc. (a) | 310 | | 18,364 |
Wyeth | 1,370 | | 60,472 |
Xilinx, Inc. (a) | 710 | | 22,507 |
Zimmer Holdings, Inc. (a) | 4,380 | | 279,488 |
TOTAL UNITED STATES OF AMERICA | | 14,800,132 |
TOTAL COMMON STOCKS (Cost $24,237,181) | 27,431,348 |
Nonconvertible Preferred Stocks - 1.0% |
| Shares | | Value (Note 1) |
Australia - 0.1% |
News Corp. Ltd. (ltd. vtg.) | 2,822 | | $ 20,712 |
Germany - 0.6% |
Fresenius AG | 800 | | 50,953 |
Fresenius Medical Care AG | 130 | | 5,316 |
ProSiebenSat.1 Media AG | 3,150 | | 48,351 |
Wella AG | 850 | | 67,451 |
TOTAL GERMANY | | 172,071 |
Italy - 0.3% |
Telecom Italia Spa (Risp) (a) | 52,270 | | 90,344 |
TOTAL NONCONVERTIBLE PREFERRED STOCKS (Cost $303,123) | 283,127 |
Government Obligations - 0.3% |
| Principal Amount | | |
United States of America - 0.3% |
U.S. Treasury Bills, yield at date of purchase 0.86% to 0.87% 12/18/03 (c)
(Cost $99,885) | | $ 100,000 | | 99,886 |
Money Market Funds - 7.8% |
| Shares | | |
Fidelity Cash Central Fund, 1.07% (b)
(Cost $2,354,711) | 2,354,711 | | 2,354,711 |
TOTAL INVESTMENT PORTFOLIO - 100.4% (Cost $26,994,900) | | 30,169,072 |
NET OTHER ASSETS - (0.4)% | | (116,484) |
NET ASSETS - 100% | $ 30,052,588 |
Futures Contracts |
| Expiration Date | | Underlying Face Amount at Value | | Unrealized Gain/(Loss) |
Purchased |
Equity Index Contracts |
27 S&P 500 E-Mini Index Contracts | Dec. 2003 | | $ 1,416,825 | | $ 34,400 |
|
The face value of futures purchased as a percentage of net assets - 4.7% |
Legend |
(a) Non-income producing |
(b) The rate quoted is the annualized seven-day yield of the fund at period end. A complete listing of the fund's holdings as of its most recent fiscal year end is available upon request. |
(c) Security or a portion of the security was pledged to cover margin requirements for futures contracts. At the period end, the value of securities pledged amounted to $89,897. |
Other Information |
Purchases and sales of securities, other
than short-term securities, aggregated $12,618,202 and $13,355,437, respectively. |
The fund placed a portion of its portfolio transactions with brokerage firms which are affiliates of the investment adviser. The commissions paid to these affiliated firms were $454 for the period. |
Income Tax Information |
At October 31, 2003, the fund had a capital loss carryforward of approximately $4,996,000 of which $154,000, $2,322,000 and $2,520,000 will expire on October 31, 2008, 2009 and 2010, respectively. |
See accompanying notes which are an integral part of the financial statements.
Annual Report
Financial Statements
Statement of Assets and Liabilities
| October 31, 2003 |
| | |
Assets | | |
Investment in securities, at value (cost $26,994,900) - See accompanying schedule | | $ 30,169,072 |
Foreign currency held at value (cost $ 3,688) | | 3,678 |
Receivable for investments sold | | 241,032 |
Receivable for fund shares sold | | 25,791 |
Dividends receivable | | 31,410 |
Interest receivable | | 1,746 |
Receivable for daily variation on futures contracts | | 1,350 |
Prepaid expenses | | 139 |
Receivable from investment adviser for expense reductions | | 5,844 |
Total assets | | 30,480,062 |
| | |
Liabilities | | |
Payable to custodian bank | $ 9,024 | |
Payable for investments purchased | 299,215 | |
Payable for fund shares redeemed | 43,492 | |
Accrued management fee | 17,900 | |
Distribution fees payable | 14,614 | |
Other payables and accrued expenses | 43,229 | |
Total liabilities | | 427,474 |
| | |
Net Assets | | $ 30,052,588 |
Net Assets consist of: | | |
Paid in capital | | $ 32,025,817 |
Accumulated net investment loss | | (32,311) |
Accumulated undistributed net realized gain (loss) on investments and foreign currency transactions | | (5,150,324) |
Net unrealized appreciation (depreciation) on investments and assets and liabilities in foreign currencies | | 3,209,406 |
Net Assets | | $ 30,052,588 |
See accompanying notes which are an integral part of the financial statements.
Annual Report
Financial Statements - continued
Statement of Assets and Liabilities - continued
| October 31, 2003 |
| | |
Calculation of Maximum Offering Price
Class A:
Net Asset Value and redemption price per share ($4,435,913÷413,224 shares) | | $ 10.73 |
| | |
Maximum offering price per share (100/94.25 of $10.73) | | $ 11.38 |
Class T:
Net Asset Value and redemption price per share ($17,333,663 ÷ 1,633,043 shares) | | $ 10.61 |
| | |
Maximum offering price per share (100/96.50 of $10.61) | | $ 10.99 |
Class B:
Net Asset Value and offering price per share ($4,917,622 ÷ 474,559 shares) A | | $ 10.36 |
| | |
Class C:
Net Asset Value and offering price per share ($3,190,152 ÷ 307,472 shares) A | | $ 10.38 |
| | |
| | |
Institutional Class:
Net Asset Value, offering price and redemption price per share ($175,238 ÷ 16,107 shares) | | $ 10.88 |
A Redemption price per share is equal to net asset value less any applicable contingent deferred sales charge.
See accompanying notes which are an integral part of the financial statements.
Annual Report
Statement of Operations
| Year ended October 31, 2003 |
| | |
Investment Income | | |
Dividends | | $ 383,505 |
Interest | | 15,329 |
| | 398,834 |
Less foreign taxes withheld | | (28,086) |
Total income | | 370,748 |
| | |
Expenses | | |
Management fee | $ 184,854 | |
Transfer agent fees | 129,573 | |
Distribution fees | 151,752 | |
Accounting fees and expenses | 61,499 | |
Non-interested trustees' compensation | 102 | |
Custodian fees and expenses | 62,311 | |
Registration fees | 54,699 | |
Audit | 43,627 | |
Legal | 887 | |
Miscellaneous | 472 | |
Total expenses before reductions | 689,776 | |
Expense reductions | (164,997) | 524,779 |
Net investment income (loss) | | (154,031) |
Realized and Unrealized Gain (Loss) Net realized gain (loss) on: | | |
Investment securities | 62,450 | |
Foreign currency transactions | 3,097 | |
Futures contracts | 68,161 | |
Total net realized gain (loss) | | 133,708 |
Change in net unrealized appreciation (depreciation) on: Investment securities | 5,632,591 | |
Assets and liabilities in foreign currencies | (449) | |
Futures contracts | 24,433 | |
Total change in net unrealized appreciation (depreciation) | | 5,656,575 |
Net gain (loss) | | 5,790,283 |
Net increase (decrease) in net assets resulting from operations | | $ 5,636,252 |
See accompanying notes which are an integral part of the financial statements.
Annual Report
Financial Statements - continued
Statement of Changes in Net Assets
| Year ended
October 31,
2003 | Year ended
October 31,
2002 |
Increase (Decrease) in Net Assets | | |
Operations | | |
Net investment income (loss) | $ (154,031) | $ (215,199) |
Net realized gain (loss) | 133,708 | (2,446,716) |
Change in net unrealized appreciation (depreciation) | 5,656,575 | (634,363) |
Net increase (decrease) in net assets resulting
from operations | 5,636,252 | (3,296,278) |
Share transactions - net increase (decrease) | 954,173 | 6,075,998 |
Total increase (decrease) in net assets | 6,590,425 | 2,779,720 |
| | |
Net Assets | | |
Beginning of period | 23,462,163 | 20,682,443 |
End of period (including accumulated net investment loss of $32,311 and undistributed net investment income of $0, respectively) | $ 30,052,588 | $ 23,462,163 |
See accompanying notes which are an integral part of the financial statements.
Annual Report
Financial Highlights - Class A
Years ended October 31, | 2003 | 2002 | 2001 | 2000 | 1999 H |
Selected Per-Share Data | | | | | |
Net asset value, beginning of period | $ 8.62 | $ 9.76 | $ 12.62 | $ 11.79 | $ 10.00 |
Income from Investment Operations | | | | | |
Net investment income (loss) E | (.02) | (.05) | (.02) G | (.04) F | (.04) |
Net realized and unrealized gain (loss) | 2.13 | (1.09) | (2.84) | 1.13 | 1.83 |
Total from investment operations | 2.11 | (1.14) | (2.86) | 1.09 | 1.79 |
Distributions from net realized gain | - | - | - | (.20) | - |
Distributions in excess of net
realized gain | - | - | - | (.06) | - |
Total distributions | - | - | - | (.26) | - |
Net asset value, end of period | $ 10.73 | $ 8.62 | $ 9.76 | $ 12.62 | $ 11.79 |
Total Return B,C,D | 24.48% | (11.68)% | (22.66)% | 9.28% | 17.90% |
Ratios to Average Net Assets I | | | | | |
Expenses before expense
reductions | 2.25% | 2.38% | 2.40% | 2.32% | 4.39% A |
Expenses net of voluntary
waivers, if any | 1.76% | 1.94% | 2.00% | 2.00% | 2.00% A |
Expenses net of all reductions | 1.73% | 1.92% | 1.96% | 1.99% | 1.99% A |
Net investment income (loss) | (.27)% | (.57)% | (.17)% | (.33)% | (.47)%A |
Supplemental Data | | | | | |
Net assets, end of period
(000 omitted) | $ 4,436 | $ 3,343 | $ 3,516 | $ 2,868 | $ 1,853 |
Portfolio turnover rate | 53% | 76% | 141% | 106% | 69% A |
A Annualized
B Total returns for periods of less than one year are not annualized.
C Total returns would have been lower had certain expenses not been reduced during the periods shown.
D Total returns do not include the effect of the sales charges.
E Calculated based on average shares outstanding during the period.
F Investment income per share reflects a special dividend which amounted to $.03 per share.
G Investment income per share reflects a special dividend which amounted to $.04 per share.
H For the period December 17, 1998 (commencement of operations) to October 31, 1999.
I Expense ratios reflect operating expenses of the class. Expenses before reductions do not reflect amounts reimbursed by the investment adviser or reductions from brokerage service arrangements or other expense offset arrangements and do not represent the amount paid by the class during periods when reimbursements or reductions occur. Expense ratios before reductions for start-up periods may not be representative of longer-term operating periods. Expenses net of any voluntary waivers reflect expenses after reimbursement by the investment adviser but prior to reductions from brokerage service arrangements or other expense offset arrangements. Expenses net of all reductions represent the net expenses paid by the class.
See accompanying notes which are an integral part of the financial statements.
Annual Report
Financial Highlights - Class T
Years ended October 31, | 2003 | 2002 | 2001 | 2000 | 1999 H |
Selected Per-Share Data | | | | | |
Net asset value, beginning of period | $ 8.54 | $ 9.70 | $ 12.60 | $ 11.77 | $ 10.00 |
Income from Investment Operations | | | | | |
Net investment income (loss) E | (.05) | (.08) | (.05) G | (.08) F | (.07) |
Net realized and unrealized gain (loss) | 2.12 | (1.08) | (2.85) | 1.15 | 1.84 |
Total from investment operations | 2.07 | (1.16) | (2.90) | 1.07 | 1.77 |
Distributions from net realized gain | - | - | - | (.18) | - |
Distributions in excess of net
realized gain | - | - | - | (.06) | - |
Total distributions | - | - | - | (.24) | - |
Net asset value, end of period | $ 10.61 | $ 8.54 | $ 9.70 | $ 12.60 | $ 11.77 |
Total Return B,C,D | 24.24% | (11.96)% | (23.02)% | 9.12% | 17.70% |
Ratios to Average Net Assets I | | | | | |
Expenses before expense
reductions | 2.65% | 2.85% | 2.88% | 2.70% | 4.70% A |
Expenses net of voluntary
waivers, if any | 2.01% | 2.19% | 2.25% | 2.25% | 2.25% A |
Expenses net of all reductions | 1.98% | 2.16% | 2.21% | 2.24% | 2.24% A |
Net investment income (loss) | (.52)% | (.81)% | (.42)% | (.58)% | (.72)%A |
Supplemental Data | | | | | |
Net assets, end of period
(000 omitted) | $ 17,334 | $ 12,496 | $ 7,642 | $ 8,019 | $ 3,204 |
Portfolio turnover rate | 53% | 76% | 141% | 106% | 69% A |
A Annualized
B Total returns for periods of less than one year are not annualized.
C Total returns would have been lower had certain expenses not been reduced during the periods shown.
D Total returns do not include the effect of the sales charges.
E Calculated based on average shares outstanding during the period.
F Investment income per share reflects a special dividend which amounted to $.03 per share.
G Investment income per share reflects a special dividend which amounted to $.04 per share.
H For the period December 17, 1998 (commencement of operations) to October 31, 1999.
I Expense ratios reflect operating expenses of the class. Expenses before reductions do not reflect amounts reimbursed by the investment adviser or reductions from brokerage service arrangements or other expense offset arrangements and do not represent the amount paid by the class during periods when reimbursements or reductions occur. Expense ratios before reductions for start-up periods may not be representative of longer-term operating periods. Expenses net of any voluntary waivers reflect expenses after reimbursement by the investment adviser but prior to reductions from brokerage service arrangements or other expense offset arrangements. Expenses net of all reductions represent the net expenses paid by the class.
See accompanying notes which are an integral part of the financial statements.
Annual Report
Financial Highlights - Class B
Years ended October 31, | 2003 | 2002 | 2001 | 2000 | 1999H |
Selected Per-Share Data | | | | | |
Net asset value, beginning of period | $ 8.38 | $ 9.56 | $ 12.48 | $ 11.71 | $ 10.00 |
Income from Investment Operations | | | | | |
Net investment income (loss)E | (.09) | (.12) | (.10)G | (.14)F | (.12) |
Net realized and unrealized gain (loss) | 2.07 | (1.06) | (2.82) | 1.14 | 1.83 |
Total from investment operations | 1.98 | (1.18) | (2.92) | 1.00 | 1.71 |
Distributions from net realized gain | - | - | - | (.17) | - |
Distributions in excess of net
realized gain | - | - | - | (.06) | - |
Total distributions | - | - | - | (.23) | - |
Net asset value, end of period | $ 10.36 | $ 8.38 | $ 9.56 | $ 12.48 | $ 11.71 |
Total ReturnB,C,D | 23.63% | (12.34)% | (23.40)% | 8.56% | 17.10% |
Ratios to Average Net AssetsI | | | | | |
Expenses before expense
reductions | 3.25% | 3.36% | 3.30% | 3.24% | 5.19%A |
Expenses net of voluntary
waivers, if any | 2.50% | 2.69% | 2.75% | 2.75% | 2.75%A |
Expenses net of all reductions | 2.47% | 2.66% | 2.71% | 2.74% | 2.74%A |
Net investment income (loss) | (1.01)% | (1.31)% | (.92)% | (1.08)% | (1.22)%A |
Supplemental Data | | | | | |
Net assets, end of period
(000 omitted) | $ 4,918 | $ 3,848 | $ 4,865 | $ 5,187 | $ 2,268 |
Portfolio turnover rate | 53% | 76% | 141% | 106% | 69%A |
A Annualized
B Total returns for periods of less than one year are not annualized.
C Total returns would have been lower had certain expenses not been reduced during the periods shown.
D Total returns do not include the effect of the contingent deferred sales charge.
E Calculated based on average shares outstanding during the period.
F Investment income per share reflects a special dividend which amounted to $.03 per share.
G Investment income per share reflects a special dividend which amounted to $.04 per share.
H For the period December 17, 1998 (commencement of operations) to October 31, 1999.
I Expense ratios reflect operating expenses of the class. Expenses before reductions do not reflect amounts reimbursed by the investment adviser or reductions from brokerage service arrangements or other expense offset arrangements and do not represent the amount paid by the class during periods when reimbursements or reductions occur. Expense ratios before reductions for start-up periods may not be representative of longer-term operating periods. Expenses net of any voluntary waivers reflect expenses after reimbursement by the investment adviser but prior to reductions from brokerage service arrangements or other expense offset arrangements. Expenses net of all reductions represent the net expenses paid by the class.
See accompanying notes which are an integral part of the financial statements.
Annual Report
Financial Highlights - Class C
Years ended October 31, | 2003 | 2002 | 2001 | 2000 | 1999H |
Selected Per-Share Data | | | | | |
Net asset value, beginning of period | $ 8.39 | $ 9.58 | $ 12.49 | $ 11.71 | $ 10.00 |
Income from Investment Operations | | | | | |
Net investment income (loss)E | (.09) | (.12) | (.10)G | (.14)F | (.12) |
Net realized and unrealized gain (loss) | 2.08 | (1.07) | (2.81) | 1.15 | 1.83 |
Total from investment operations | 1.99 | (1.19) | (2.91) | 1.01 | 1.71 |
Distributions from net realized gain | - | - | - | (.17) | - |
Distributions in excess of net
realized gain | - | - | - | (.06) | - |
Total distributions | - | - | - | (.23) | - |
Net asset value, end of period | $ 10.38 | $ 8.39 | $ 9.58 | $ 12.49 | $ 11.71 |
Total ReturnB,C,D | 23.72% | (12.42)% | (23.30)% | 8.65% | 17.10% |
Ratios to Average Net AssetsI | | | | | |
Expenses before expense
reductions | 3.10% | 3.18% | 3.16% | 3.13% | 5.16%A |
Expenses net of voluntary
waivers, if any | 2.50% | 2.69% | 2.75% | 2.75% | 2.75%A |
Expenses net of all reductions | 2.47% | 2.66% | 2.71% | 2.74% | 2.74%A |
Net investment income (loss) | (1.01)% | (1.31)% | (.92)% | (1.08)% | (1.22)%A |
Supplemental Data | | | | | |
Net assets, end of period
(000 omitted) | $ 3,190 | $ 2,967 | $ 3,750 | $ 5,146 | $ 2,649 |
Portfolio turnover rate | 53% | 76% | 141% | 106% | 69%A |
A Annualized
B Total returns for periods of less than one year are not annualized.
C Total returns would have been lower had certain expenses not been reduced during the periods shown.
D Total returns do not include the effect of the contingent deferred sales charge.
E Calculated based on average shares outstanding during the period.
F Investment income per share reflects a special dividend which amounted to $.03 per share.
G Investment income per share reflects a special dividend which amounted to $.04 per share.
H For the period December 17, 1998 (commencement of operations) to October 31, 1999.
I Expense ratios reflect operating expenses of the class. Expenses before reductions do not reflect amounts reimbursed by the investment adviser or reductions from brokerage service arrangements or other expense offset arrangements and do not represent the amount paid by the class during periods when reimbursements or reductions occur. Expense ratios before reductions for start-up periods may not be representative of longer-term operating periods. Expenses net of any voluntary waivers reflect expenses after reimbursement by the investment adviser but prior to reductions from brokerage service arrangements or other expense offset arrangements. Expenses net of all reductions represent the net expenses paid by the class.
See accompanying notes which are an integral part of the financial statements.
Annual Report
Financial Highlights - Institutional Class
Years ended October 31, | 2003 | 2002 | 2001 | 2000 | 1999G |
Selected Per-Share Data | | | | | |
Net asset value, beginning of period | $ 8.68 | $ 9.81 | $ 12.68 | $ 11.81 | $ 10.00 |
Income from Investment Operations | | | | | |
Net investment income (loss)D | -I | (.03) | .01F | (.01)E | (.02) |
Net realized and unrealized gain (loss) | 2.20 | (1.10) | (2.88) | 1.16 | 1.83 |
Total from investment operations | 2.20 | (1.13) | (2.87) | 1.15 | 1.81 |
Distributions from net realized gain | - | - | - | (.21) | - |
Distributions in excess of net
realized gain | - | - | - | (.07) | - |
Total distributions | - | - | - | (.28) | - |
Net asset value, end of period | $ 10.88 | $ 8.68 | $ 9.81 | $ 12.68 | $ 11.81 |
Total ReturnB,C | 25.35% | (11.52)% | (22.63)% | 9.79% | 18.10% |
Ratios to Average Net AssetsH | | | | | |
Expenses before expense
reductions | 1.87% | 1.95% | 2.02% | 2.06% | 4.10%A |
Expenses net of voluntary
waivers, if any | 1.50% | 1.70% | 1.75% | 1.75% | 1.75%A |
Expenses net of all reductions | 1.48% | 1.67% | 1.71% | 1.74% | 1.74%A |
Net investment income (loss) | (.01)% | (.32)% | .08% | (.08)% | (.22)%A |
Supplemental Data | | | | | |
Net assets, end of period
(000 omitted) | $ 175 | $ 808 | $ 909 | $ 1,256 | $ 1,182 |
Portfolio turnover rate | 53% | 76% | 141% | 106% | 69%A |
A Annualized
B Total returns for periods of less than one year are not annualized.
C Total returns would have been lower had certain expenses not been reduced during the periods shown.
D Calculated based on average shares outstanding during the period.
E Investment income per share reflects a special dividend which amounted to $.03 per share.
F Investment income per share reflects a special dividend which amounted to $.04 per share.
G For the period December 17, 1998 (commencement of operations) to October 31, 1999.
H Expense ratios reflect operating expenses of the class. Expenses before reductions do not reflect amounts reimbursed by the investment adviser or reductions from brokerage service arrangements or other expense offset arrangements and do not represent the amount paid by the class during periods when reimbursements or reductions occur. Expense ratios before reductions for start-up periods may not be representative of longer-term operating periods. Expenses net of any voluntary waivers reflect expenses after reimbursement by the investment adviser but prior to reductions from brokerage service arrangements or other expense offset arrangements. Expenses net of all reductions represent the net expenses paid by the class.
I Amount represents less than .01 per share.
See accompanying notes which are an integral part of the financial statements.
Annual Report
Notes to Financial Statements
For the period ended October 31, 2003
1. Significant Accounting Policies.
Fidelity Advisor Global Equity Fund (the fund) is a fund of Fidelity Advisor Series VIII (the trust) and is authorized to issue an unlimited number of shares. The trust is registered under the Investment Company Act of 1940, as amended (the 1940 Act), as an open-end management investment company organized as a Massachusetts business trust.
The fund offers Class A, Class T, Class B, Class C, and Institutional Class shares, each of which has equal rights as to assets and voting privileges. Each class has exclusive voting rights with respect to matters that affect that class. Class B shares will automatically convert to Class A shares after a holding period of seven years from the initial date of purchase. Investment income, realized and unrealized capital gains and losses, the common expenses of the fund, and certain fund-level expense reductions, if any, are allocated on a pro rata basis to each class based on the relative net assets of each class to the total net assets of the fund. Each class differs with respect to transfer agent and distribution and service plan fees incurred. Certain expense reductions also differ by class.
The financial statements have been prepared in conformity with accounting principles generally accepted in the United States of America, which require management to make certain estimates and assumptions at the date of the financial statements. The following summarizes the significant accounting policies of the fund:
Security Valuation. Net asset value per share (NAV calculation) is calculated as of the close of business of the New York Stock Exchange, normally 4:00 p.m. Eastern time. Equity securities for which market quotations are available are valued at the last sale price or official closing price (closing bid price or last evaluated quote if no sale has occurred) on the primary market or exchange on which they trade. If an event that is expected to materially affect the value of a security occurs after the close of an exchange or market on which that security trades, but prior to the NAV calculation, then that security will be fair valued taking the event into account. Securities (including restricted securities) for which market quotations are not readily available are valued at their fair value as determined in good faith under consistently applied procedures under the general supervision of the Board of Trustees. Price movements in futures contracts and ADRs, market and trading trends, the bid/ask quotes of brokers and off-exchange institutional trading may be reviewed in the course of making a good faith determination of a security's fair value. Short-term securities with remaining maturities of sixty days or less for which quotations are not readily available are valued on the basis of amortized cost. Investments in open-end investment companies are valued at their net asset value each business day.
Annual Report
Notes to Financial Statements - continued
1. Significant Accounting Policies - continued
Foreign Currency. The fund uses foreign currency contracts to facilitate transactions in foreign-denominated securities. Losses from these transactions may arise from changes in the value of the foreign currency or if the counterparties do not perform under the contracts' terms.
Foreign denominated assets, including investment securities, and liabilities are translated into U.S. dollars at the exchange rate at period end. Purchases and sales of investment securities, income and dividends received and expenses denominated in foreign currencies are translated into U.S. dollars at the exchange rate in effect on the transaction date.
The effects of exchange rate fluctuations on investments are included with the net realized and unrealized gain (loss) on investment securities. Other foreign currency transactions resulting in realized and unrealized gain (loss) are disclosed separately.
Investment Transactions and Income. Security transactions are accounted for as of trade date. Gains and losses on securities sold are determined on the basis of identified cost. Dividend income is recorded on the ex-dividend date, except for certain dividends from foreign securities where the ex-dividend date may have passed, which are recorded as soon as the fund is informed of the ex-dividend date. Non-cash dividends included in dividend income, if any, are recorded at the fair market value of the securities received. Interest income is accrued as earned. Interest income includes coupon interest and amortization of premium and accretion of discount on debt securities, which is accrued using the interest method. Investment income is recorded net of foreign taxes withheld where recovery of such taxes is uncertain.
Expenses. Most expenses of the trust can be directly attributed to a fund. Expenses which cannot be directly attributed are apportioned among the funds in the trust.
Income Tax Information and Distributions to Shareholders. Each year the fund intends to qualify as a regulated investment company by distributing all of its taxable income and realized gains under Subchapter M of the Internal Revenue Code. As a result, no provision for income taxes is required in the accompanying financial statements. Foreign taxes are provided for based on the fund's understanding of the tax rules and rates that exist in the foreign markets in which it invests. Income dividends and capital gain distributions are declared separately for each class. Distributions are recorded on the ex-dividend date.
Income and capital gain distributions are determined in accordance with income tax regulations, which may differ from generally accepted accounting principles. Capital accounts within the financial statements are adjusted for permanent and temporary book and tax differences. These adjustments have no impact on net assets or the results of operations. Temporary differences will reverse in a subsequent period. These
Annual Report
1. Significant Accounting Policies - continued
Income Tax and Distributions to Shareholders - continued
differences are primarily due to futures transactions, foreign currency transactions, passive foreign investment companies (PFIC), non-taxable dividends, net operating losses, capital loss carryforwards and losses deferred due to wash sales.
The tax-basis components of distributable earnings and the federal tax cost as of period end were as follows:
Unrealized appreciation | $ 4,701,150 | | |
Unrealized depreciation | (1,678,778) | |
Net unrealized appreciation (depreciation) | 3,022,372 | |
Capital loss carryforward | (4,995,615) | |
| | |
Cost for federal income tax purposes | $ 27,146,700 | |
Short-Term Trading (Redemption) Fees. Shares purchased after March 31, 2004 and held in the fund less than 30 days will be subject to a short-term trading fee equal to 1.00% of the proceeds of the redeemed shares. The fee, which will be retained by the fund, is accounted for as an addition to paid in capital.
2. Operating Policies.
Repurchase Agreements. Fidelity Management & Research Company (FMR) has received an Exemptive Order from the Securities and Exchange Commission (the SEC) which permits the fund and other affiliated entities of FMR to transfer uninvested cash balances into joint trading accounts. These accounts are then invested in repurchase agreements that are collateralized by U.S. Treasury or Government obligations. The fund may also invest directly with institutions, in repurchase agreements that are collateralized by commercial paper obligations and corporate obligations. Collateral is held in segregated accounts with custodian banks and may be obtained in the event of a default of the counterparty. Collateral is marked-to-market daily and maintained at a value at least equal to the principal amount of the repurchase agreement (including accrued interest).
Futures Contracts. The fund may use futures contracts to manage its exposure to the stock market. Buying futures tends to increase the fund's exposure to the underlying instrument, while selling futures tends to decrease the fund's exposure to the underlying instrument or hedge other fund investments. Futures contracts involve, to varying degrees, risk of loss in excess of any futures variation margin reflected in the Statement of Assets and Liabilities. The underlying face amount at value of any open futures contracts at period end is shown in the Schedule of Investments under the caption
Annual Report
Notes to Financial Statements - continued
2. Operating Policies - continued
Futures Contracts - continued
Futures Contracts. This amount reflects each contract's exposure to the underlying instrument at period end. Losses may arise from changes in the value of the underlying instruments or if the counter-parties do not perform under the contracts' terms. Gains (losses) are realized upon the expiration or closing of the futures contracts. Futures contracts are valued at the settlement price established each day by the board of trade or exchange on which they are traded.
3. Purchases and Sales of Investments.
Information regarding purchases and sales of securities is included under the caption "Other Information" at the end of the fund's Schedule of Investments.
4. Fees and Other Transactions with Affiliates.
Management Fee. FMR and its affiliates provide the fund with investment management related services for which the fund pays a monthly management fee. The management fee is the sum of an individual fund fee rate that is based on an annual rate of .45% of the fund's average net assets and a group fee rate that averaged .28% during the period. The group fee rate is based upon the average net assets of all the mutual funds advised by FMR. The group fee rate decreases as assets under management increase and increases as assets under management decrease. For the period, the total annual management fee rate was .73% of the fund's average net assets.
Distribution and Service Plan. In accordance with Rule 12b-1 of the 1940 Act, the Fund has adopted separate Distribution and Service Plans for each class of shares, except for the Institutional Class. Certain classes pay Fidelity Distributors Corporation (FDC), an affiliate of FMR, separate Distribution and Service Fees, each of which is based on an annual percentage of each class' average net assets. Class A and Class T Plans also authorize the use of brokerage commissions to pay distribution expenses. This practice has been discontinued and no commissions incurred after June 30, 2003 have been used to pay distribution expenses. In addition, FDC may pay financial intermediaries for selling shares of the fund and providing shareholder support services. For the period, the Distribution and Service Fee rates, the total amounts paid to and retained by FDC and the amount of distribution expenses paid with brokerage commissions were as follows:
| Distribution
Fee | Service
Fee | Paid to
FDC | Retained
by FDC | Paid with
Commissions |
Class A | .01% | .25% | $ 9,743 | $ 858 | $ 416 |
Class T | .26% | .25% | 71,921 | - | 1,556 |
Class B | .75% | .25% | 41,322 | 30,991 | |
Class C | .75% | .25% | 28,766 | 4,078 |
|
| | | $ 151,752 | $ 35,927 | $ 1,972 |
4. Fees and Other Transactions with Affiliates - continued
Sales Load. FDC receives a front-end sales charge of up to 5.75% for selling Class A shares, and 3.50% for selling Class T shares of the fund. FDC receives the proceeds of contingent deferred sales charges levied on Class A, Class T, Class B, and Class C redemptions. These charges depend on the holding period. The deferred sales charges range from 5% to 1% for Class B, 1% for Class C, and .25% for certain purchases of Class A and Class T shares.
For the period, sales charge amounts retained by FDC were as follows:
| Retained
by FDC | |
Class A | $ 3,533 | |
Class T | 3,770 | |
Class B* | 12,036 | |
Class C* | 937 | |
| $ 20,276 | |
* When Class B and Class C shares are initially sold, FDC pays commissions from its own resources to financial intermediaries through which the sales are made.
Transfer Agent Fees. Fidelity Investments Institutional Operations Company, Inc. (FIIOC), an affiliate of FMR, is the transfer, dividend disbursing and shareholder servicing agent (collectively referred to as the transfer agent) for each class of the fund. FIIOC receives account fees and asset-based fees that vary according to the account size and type of account of the shareholders of the respective classes of the fund. FIIOC pays for typesetting, printing and mailing of all shareholder reports, except proxy statements. For the period, the following amounts were paid to FIIOC:
| Amount | % of
Average
Net Assets |
Class A | $ 14,018 | .37 |
Class T | 74,238 | .53 |
Class B | 26,305 | .63 |
Class C | 13,939 | .48 |
Institutional Class | 1,073 | .26 |
| $ 129,573 | |
Annual Report
Notes to Financial Statements - continued
Accounting Fees. Fidelity Service Company, Inc. (FSC), an affiliate of FMR, maintains the fund's accounting records. The fee is based on the level of average net assets for the month plus out-of-pocket expenses.
Annual Report
4. Fees and Other Transactions with Affiliates - continued
Central Funds. The fund may invest in affiliated Central Funds managed by Fidelity Investments Money Management, Inc. (FIMM), an affiliate of FMR. The Central Funds are open-end investment companies available only to investment companies and other accounts managed by FMR and its affiliates. The Central Funds seek preservation of capital and current income and do not pay a management fee. Income distributions earned by the fund are recorded as income in the accompanying financial statements and totaled $14,555 for the period.
Brokerage Commissions. The fund placed a portion of its portfolio transactions with brokerage firms which are affiliates of the investment adviser. The commissions paid to these affiliated firms are shown under the caption "Other Information" at the end of the fund's Schedule of Investments.
5. Committed Line of Credit.
The fund participates with other funds managed by FMR in a $3.5 billion credit facility (the "line of credit") to be utilized for temporary or emergency purposes to fund shareholder redemptions or for other short-term liquidity purposes. The fund has agreed to pay commitment fees on its pro rata portion of the line of credit. During the period, there were no borrowings on this line of credit.
6. Expense Reductions.
FMR agreed to reimburse the classes of the fund to the extent operating expenses exceeded certain levels of average net assets as noted in the table below. Some expenses, for example interest expense, are excluded from this reimbursement.
| Expense
Limitations | Reimbursement
from adviser |
Class A | 1.75% | $ 18,308 |
Class T | 2.00% | 90,342 |
Class B | 2.50% | 30,986 |
Class C | 2.50% | 17,237 |
Institutional Class | 1.50% | 1,537 |
| | $ 158,410 |
Many of the brokers with whom FMR places trades on behalf of the fund provided services to the fund in addition to trade execution. These services may include payments of expenses on behalf of the fund to support distribution of fund shares for Class A and Class T ("Distribution Expense Reduction") and to pay other fund expenses, such as transfer agent fees ("Other Expense Reduction") collectively referred to as "Brokerage Service Arrangements" in the accompanying table. Brokerage service arrangements
Annual Report
Notes to Financial Statements - continued
6. Expense Reductions - continued
Annual Report
generally benefits all shareholders of each class by reducing fund expenses. Each of Class A and Class T shareholders' Other Expense Reduction benefit is reduced by the amount of any Distribution Expense Reduction. All of the applicable expense reductions are noted in the table below.
| Brokerage Service Arrangements |
| Distribution expense
reduction | Other expense
reduction |
Fund Level | $ - | $ 4,615 |
Class A | 416 | - |
Class T | 1,556 | - |
| $ 1,972 | $ 4,615 |
7. Other Information.
At the end of the period, one unaffiliated shareholder was the owner of record of 16% of the total outstanding shares of the fund.
8. Share Transactions.
Transactions for each class of shares were as follows:
| Shares
Years ended October 31, | Dollars
Years ended October 31, |
| 2003 | 2002 | 2003 | 2002 |
Class A | | | | |
Shares sold | 136,246 | 120,119 | $ 1,270,282 | $ 1,181,117 |
Shares redeemed | (110,997) | (92,414) | (1,047,311) | (899,451) |
Net increase (decrease) | 25,249 | 27,705 | $ 222,971 | $ 281,666 |
Class T | | | | |
Shares sold | 589,459 | 1,004,408 | $ 5,360,716 | $ 9,714,971 |
Shares redeemed | (419,255) | (329,227) | (3,739,570) | (3,121,953) |
Net increase (decrease) | 170,204 | 675,181 | $ 1,621,146 | $ 6,593,018 |
Class B | | | | |
Shares sold | 101,806 | 109,175 | $ 919,391 | $ 1,054,797 |
Shares redeemed | (86,440) | (158,673) | (766,624) | (1,521,443) |
Net increase (decrease) | 15,366 | (49,498) | $ 152,767 | $ (466,646) |
Class C | | | | |
Shares sold | 46,725 | 97,361 | $ 426,595 | $ 951,823 |
Shares redeemed | (92,865) | (135,352) | (817,236) | (1,300,309) |
Net increase (decrease) | (46,140) | (37,991) | $ (390,641) | $ (348,486) |
Institutional Class | | | | |
Shares sold | 28,067 | 18,329 | $ 247,062 | $ 181,469 |
Shares redeemed | (105,018) | (17,921) | (899,132) | (165,023) |
Net increase (decrease) | (76,951) | 408 | $ (652,070) | $ 16,446 |
Annual Report
Report of Independent Auditors
To the Trustees of Fidelity Advisor Series VIII and the Shareholders of Fidelity Advisor Global Equity Fund.
In our opinion, the accompanying statement of assets and liabilities, including the schedule of investments, and the related statements of operations and of changes in net assets and the financial highlights present fairly, in all material respects, the financial position of Fidelity Advisor Global Equity Fund (a fund of Fidelity Advisor Series VIII) at October 31, 2003 and the results of its operations, the changes in its net assets and the financial highlights for the periods indicated, in conformity with accounting principles generally accepted in the United States of America. These financial statements and financial highlights (hereafter referred to as "financial statements") are the responsibility of the Fidelity Advisor Global Equity Fund's management; our responsibility is to express an opinion on these financial statements based on our audits. We conducted our audits of these financial statements in accordance with auditing standards generally accepted in the United States of America which require that we plan and perform the audit to obtain reasonable assurance about whether the financial statements are free of material misstatement. An audit includes examining, on a test basis, evidence supporting the amounts and disclosures in the financial statements, assessing the accounting principles used and significant estimates made by management, and evaluating the overall financial statement presentation. We believe that our audits, which included confirmation of securities at October 31, 2003 by correspondence with the custodian and brokers, provide a reasonable basis for our opinion.
/s/PricewaterhouseCoopers LLP
PricewaterhouseCoopers LLP
Boston, Massachusetts
December 12, 2003
Annual Report
Trustees and Officers
The Trustees, Members of the Advisory Board, and executive officers of the trust and fund, as applicable, are listed below. The Board of Trustees governs the fund and is responsible for protecting the interests of shareholders. The Trustees are experienced executives who meet periodically throughout the year to oversee the fund's activities, review contractual arrangements with companies that provide services to the fund, and review the fund's performance. Except for William O. McCoy, each of the Trustees oversees 289 funds advised by FMR or an affiliate. Mr. McCoy oversees 291 funds advised by FMR or an affiliate.
The Trustees hold office without limit in time except that (a) any Trustee may resign; (b) any Trustee may be removed by written instrument, signed by at least two-thirds of the number of Trustees prior to such removal; (c) any Trustee who requests to be retired or who has become incapacitated by illness or injury may be retired by written instrument signed by a majority of the other Trustees; and (d) any Trustee may be removed at any special meeting of shareholders by a two-thirds vote of the outstanding voting securities of the trust. In any event, each non-interested Trustee shall retire not later than the last day of the calendar year in which his or her 72nd birthday occurs. The executive officers and Advisory Board Members hold office without limit in time, except that any officer and Advisory Board Member may resign or may be removed by a vote of a majority of the Trustees at any regular meeting or any special meeting of the Trustees. Except as indicated, each individual has held the office shown or other offices in the same company for the past five years.
The fund's Statement of Additional Information (SAI) includes more information about the Trustees. To request a free copy, call Fidelity at 1-877-208-0098.
Interested Trustees*:
Correspondence intended for each Trustee who is an "interested person" (as defined in the 1940 Act) may be sent to 82 Devonshire Street, Boston, Massachusetts 02109.
Name, Age; Principal Occupation |
Edward C. Johnson 3d (73)** |
| Year of Election or Appointment: 1983 Mr. Johnson is Chairman of the Board of Trustees. Mr. Johnson serves as Chief Executive Officer, Chairman, and a Director of FMR Corp.; a Director and Chairman of the Board and of the Executive Committee of FMR; Chairman and a Director of Fidelity Management & Research (Far East) Inc.; Chairman (1998) and a Director of Fidelity Investments Money Management, Inc.; and Chairman (2001) and a Director (2000) of FMR Co., Inc. |
Abigail P. Johnson (41)** |
| Year of Election or Appointment: 2001 Senior Vice President of Advisor Global Equity (2001). Ms. Johnson also serves as Senior Vice President of other Fidelity funds (2001). She is President and a Director of FMR (2001), Fidelity Investments Money Management, Inc. (2001), FMR Co., Inc. (2001), and a Director of FMR Corp. Previously, Ms. Johnson managed a number of Fidelity funds. |
Laura B. Cronin (49) |
| Year of Election or Appointment: 2003 Ms. Cronin is an Executive Vice President (2002) and Chief Financial Officer (2002) of FMR Corp. and is a member of the Fidelity Management Committee (2003). Previously, Ms. Cronin served as Vice President of Finance of FMR (1997-1999), and Chief Financial Officer of FMR (1999-2001), Fidelity Personal Investments (2001), and Fidelity Brokerage Company (2001-2002). |
Robert L. Reynolds (51) |
| Year of Election or Appointment: 2003 Mr. Reynolds is a Director (2003) and Chief Operating Officer (2002) of FMR Corp. and is the head of the Fidelity Management Committee (2003). He also serves on the Board at Fidelity Investments Canada, Ltd. (2000). Previously, Mr. Reynolds served as President of Fidelity Investments Institutional Retirement Group (1996-2000). |
* Trustees have been determined to be "Interested Trustees" by virtue of, among other things, their affiliation with the trust or various entities under common control with FMR.
** Edward C. Johnson 3d, Trustee, is Abigail P. Johnson's father.
Annual Report
Non-Interested Trustees:
Correspondence intended for each non-interested Trustee (that is, the Trustees other than the Interested Trustees) may be sent to Fidelity Investments, P.O. Box 55235, Boston, Massachusetts 02205-5235.
Name, Age; Principal Occupation |
J. Michael Cook (61) |
| Year of Election or Appointment: 2001 Prior to Mr. Cook's retirement in May 1999, he served as Chairman and Chief Executive Officer of Deloitte & Touche LLP (accounting/consulting), Chairman of the Deloitte & Touche Foundation, and a member of the Board of Deloitte Touche Tohmatsu. He currently serves as a Director of Comcast (telecommunications, 2002), International Flavors & Fragrances, Inc. (2000), Rockwell Automation (2000) and The Dow Chemical Company (2000). He is a Member of the Diversity Advisory Council of Marakon (2003) and the Advisory Board of the Directorship Search Group, Chairman Emeritus of the Board of Catalyst (a leading organization for the advancement of women in business), and is Chairman of the Accountability Advisory Council to the Comptroller General of the United States. He also serves as a Member of the Advisory Board of the Graduate School of Business of the University of Florida, his alma mater. |
Ralph F. Cox (71) |
| Year of Election or Appointment: 1991 Mr. Cox is President of RABAR Enterprises (management consulting for the petroleum industry). Prior to February 1994, he was President of Greenhill Petroleum Corporation (petroleum exploration and production). Until March 1990, Mr. Cox was President and Chief Operating Officer of Union Pacific Resources Company (exploration and production). He is a Director of CH2M Hill Companies (engineering), and Abraxas Petroleum (petroleum exploration and production, 1999). In addition, he is a member of advisory boards of Texas A&M University and the University of Texas at Austin. |
Phyllis Burke Davis (71) |
| Year of Election or Appointment: 1992 Mrs. Davis is retired from Avon Products, Inc. (consumer products) where she held various positions including Senior Vice President of Corporate Affairs and Group Vice President of U.S. product marketing, sales, distribution, and manufacturing. Mrs. Davis is a member of the Board of Directors of the Southampton Hospital in Southampton, N.Y. (1998). Previously, she served as a Director of BellSouth Corporation (telecommunications), Eaton Corporation (diversified industrial), the TJX Companies, Inc. (retail stores), Hallmark Cards, Inc., and Nabisco Brands, Inc. |
Robert M. Gates (60) |
| Year of Election or Appointment: 1997 Dr. Gates is President of Texas A&M University (2002). He was Director of the Central Intelligence Agency (CIA) from 1991 to 1993. From 1989 to 1991, Dr. Gates served as Assistant to the President of the United States and Deputy National Security Advisor. Dr. Gates is a Director of NACCO Industries, Inc. (mining and manufacturing), and Parker Drilling Co., Inc. (drilling and rental tools for the energy industry, 2001). He also serves as a member of the Advisory Board of VoteHere.net (secure internet voting, 2001). Previously, Dr. Gates served as a Director of LucasVarity PLC (automotive components and diesel engines), a Director of TRW Inc. (automotive, space, defense, and information technology), and Dean of the George Bush School of Government and Public Service at Texas A&M University (1999-2001). Dr. Gates also is a Trustee of the Forum for International Policy. |
Donald J. Kirk (70) |
| Year of Election or Appointment: 1987 Mr. Kirk is a Governor of the American Stock Exchange (2001), a Trustee and former Chairman of the Board of Trustees of the Greenwich Hospital Association, a Director of the Yale-New Haven Health Services Corp. (1998), and a Director Emeritus and former Chairman of the Board of Directors of National Arts Strategies Inc. Mr. Kirk was an Executive-in-Residence (1995-2000) and a Professor (1987-1995) at Columbia University Graduate School of Business. Prior to 1987, he was Chairman of the Financial Accounting Standards Board. Previously, Mr. Kirk served as a Governor of the National Association of Securities Dealers, Inc. (1996-2002), a member and Vice Chairman of the Public Oversight Board of the American Institute of Certified Public Accountants' SEC Practice Section (1995-2002), a Director of General Re Corporation (reinsurance, 1987-1998) and as a Director of Valuation Research Corp. (appraisals and valuations). |
Marie L. Knowles (57) |
| Year of Election or Appointment: 2001 Prior to Ms. Knowles' retirement in June 2000, she served as Executive Vice President and Chief Financial Officer of Atlantic Richfield Company (ARCO) (diversified energy, 1996-2000). From 1993 to 1996, she was a Senior Vice President of ARCO and President of ARCO Transportation Company. She served as a Director of ARCO from 1996 to 1998. She currently serves as a Director of Phelps Dodge Corporation (copper mining and manufacturing), URS Corporation (multidisciplinary engineering, 1999), and McKesson Corporation (healthcare service, 2002). Ms. Knowles is a Trustee of the Brookings Institution and the Catalina Island Conservancy and also serves as a member of the Advisory Board for the School of Engineering of the University of Southern California. |
Ned C. Lautenbach (59) |
| Year of Election or Appointment: 2000 Mr. Lautenbach has been a partner of Clayton, Dubilier & Rice, Inc. (private equity investment firm) since September 1998. Previously, Mr. Lautenbach was with the International Business Machines Corporation (IBM) from 1968 until his retirement in 1998. He was most recently Senior Vice President and Group Executive of Worldwide Sales and Services. From 1993 to 1995, he was Chairman of IBM World Trade Corporation, and from 1994 to 1998 was a member of IBM's Corporate Executive Committee. Mr. Lautenbach serves as Chairman and as a Director (1998) of Acterna Corporation (communications test equipment). He is also Co-Chairman of Covansys, Inc. (global provider of business and technology solutions, 2000). In addition, he is a Director of Eaton Corporation (diversified industrial) and the Philharmonic Center for the Arts in Naples, Florida (1999). He also is a member of the Council on Foreign Relations. |
Marvin L. Mann (70) |
| Year of Election or Appointment: 1993 Mr. Mann is Chairman of the non-interested Trustees (2001). He is Chairman Emeritus of Lexmark International, Inc. (computer peripherals) where he served as CEO until April 1998 and retired as Chairman May 1999, and remains a member of the Board. Prior to 1991, he held the positions of Vice President of International Business Machines Corporation (IBM) and President and General Manager of various IBM divisions and subsidiaries. Mr. Mann is a Board member of Imation Corp. (imaging and information storage) and Acterna Corporation (communications test equipment, 1999). He is also a member of the Director Services Committee of the Investment Company Institute. In addition, Mr. Mann is a member of the President's Cabinet at the University of Alabama and the Board of Visitors of the Culverhouse College of Commerce and Business Administration at the University of Alabama. |
William O. McCoy (70) |
| Year of Election or Appointment: 1997 Prior to his retirement in December 1994, Mr. McCoy was Vice Chairman of the Board of BellSouth Corporation (telecommunications) and President of BellSouth Enterprises. He is currently a Director of Liberty Corporation (holding company), Duke Realty Corporation (real estate), Progress Energy, Inc. (electric utility), and Acterna Corporation (communications test equipment, 1999). He is also a partner of Franklin Street Partners (private investment management firm) and a member of the Research Triangle Foundation Board. In addition, Mr. McCoy served as the Interim Chancellor (1999-2000) and a member of the Board of Visitors (1994-1998) for the University of North Carolina at Chapel Hill and currently serves on the Board of Directors of the University of North Carolina Health Care System and the Board of Visitors of the Kenan-Flagler Business School (University of North Carolina at Chapel Hill). He also served as Vice President of Finance for the University of North Carolina (16-school system, 1995-1998). |
William S. Stavropoulos (64) |
| Year of Election or Appointment: 2001 Mr. Stavropoulos is Chairman of the Board, President and CEO (2002), and Chairman of the Executive Committee (2000) and a Director of The Dow Chemical Company. Since joining The Dow Chemical Company in 1967, Mr. Stavropoulos served in numerous senior management positions, including President (1993-2000) and Chief Executive Officer (1995-2000). Currently, he is a Director of NCR Corporation (data warehousing and technology solutions), BellSouth Corporation (telecommunications), Chemical Financial Corporation, and Maersk Inc. (industrial conglomerate, 2002). He also serves as a member of the Board of Trustees of the American Enterprise Institute for Public Policy Research. In addition, Mr. Stavropoulos is a member of The Business Council, J.P. Morgan International Council, World Business Council for Sustainable Development, and the University of Notre Dame Advisory Council for the College of Science. |
Annual Report
Trustees and Officers - continued
Advisory Board Members and Executive Officers:
Correspondence intended for Dr. Heilmeier may be sent to Fidelity Investments, P.O. Box 55235, Boston, Massachusetts 02205-5235. Correspondence intended for each executive officer and Mr. Lynch may be sent to 82 Devonshire Street, Boston, Massachusetts 02109.
Name, Age; Principal Occupation |
George H. Heilmeier (67) |
| Year of Election or Appointment: 2003 Member of the Advisory Board of Fidelity Advisor Series VIII. Dr. Heilmeier is Chairman Emeritus of Telcordia Technologies (communication software and systems), where prior to his retirement, he served as company Chairman and Chief Executive Officer. He currently serves on the Boards of Directors of The Mitre Corporation (systems engineering and information technology support for the government), INET Technologies Inc. (telecommunications network surveillance, 2001) and Teletech Holdings (customer management services, 1998). He is Chairman of the General Motors Technology Advisory Committee and a Life Fellow of the IEEE (2000). Dr. Heilmeier is a member of the Defense Science Board and the National Security Agency Advisory Board. He is also a member of the National Academy of Engineering, the American Academy of Arts and Sciences and The Board of Overseers of the School of Engineering and Applied Science of the University of Pennsylvania. Previously, Dr. Heilmeier served as a Director of TRW Inc. (automotive, space, defense, and information technology, 1992-2002) and Compaq (1994-2002). |
Peter S. Lynch (60) |
| Year of Election or Appointment: 2003 Member of the Advisory Board of Fidelity Advisor Series VIII. Vice Chairman and a Director of FMR, and Vice Chairman (2001) and a Director (2000) of FMR Co., Inc. Previously, Mr. Lynch served as a Trustee of the Fidelity funds (1990-2003). Prior to May 31, 1990, he was a Director of FMR and Executive Vice President of FMR (a position he held until March 31, 1991), Vice President of Fidelity® Magellan® Fund and FMR Growth Group Leader, and Managing Director of FMR Corp. Mr. Lynch was also Vice President of Fidelity Investments Corporate Services. In addition, he serves as a Trustee of Boston College, Massachusetts Eye & Ear Infirmary, Historic Deerfield, John F. Kennedy Library, and the Museum of Fine Arts of Boston. |
Philip L. Bullen (44) |
| Year of Election or Appointment: 2001 Vice President of Advisor Global Equity. Mr. Bullen also serves as Vice President of certain Equity Funds (2001) and certain High Income Funds (2001). He is Senior Vice President of FMR (2001) and FMR Co., Inc. (2001), President and a Director of Fidelity Management & Research (Far East) Inc. (2001), President and a Director of Fidelity Management & Research (U.K.) Inc. (2002), and a Director of Strategic Advisers, Inc. (2002). Before joining Fidelity Investments, Mr. Bullen was President and Chief Investment Officer of Santander Global Advisors (1997-2000) and President and Chief Executive Officer of Boston's Baring Asset Management Inc. (1994-1997). |
Richard C. Habermann (63) |
| Year of Election or Appointment: 1998 Vice President of Advisor Global Equity. Mr. Habermann is also Vice President of other funds advised by FMR. Prior to assuming his current responsibilities, Mr. Habermann managed a variety of Fidelity Funds. |
Eric D. Roiter (54) |
| Year of Election or Appointment: 1998 Secretary of Advisor Global Equity. He also serves as Secretary of other Fidelity funds (1998); Vice President, General Counsel, and Clerk of FMR Co., Inc. (2001) and FMR (1998); Vice President and Clerk of FDC (1998); Assistant Clerk of Fidelity Management & Research (U.K.) Inc. (2001) and Fidelity Management & Research (Far East) Inc. (2001); and Assistant Secretary of Fidelity Investments Money Management Inc. (2001). Prior to joining Fidelity, Mr. Roiter was with the law firm of Debevoise & Plimpton, as an associate (1981-1984) and as a partner (1985-1997), and served as an Assistant General Counsel of the U.S. Securities and Exchange Commission (1979-1981). Mr. Roiter is an Adjunct Member, Faculty of Law, at Boston College Law School (2003). |
Stuart Fross (44) |
| Year of Election or Appointment: 2003 Assistant Secretary of Advisor Global Equity. Mr. Fross also serves as Assistant Secretary of other Fidelity funds (2003) and is an employee of FMR. |
Maria F. Dwyer (44) |
| Year of Election or Appointment: 2002 President and Treasurer of Advisor Global Equity. Ms. Dwyer also serves as President and Treasurer of other Fidelity funds (2002) and is a Vice President (1999) and an employee (1996) of FMR. Prior to joining Fidelity, Ms. Dwyer served as Director of Compliance for MFS Investment Management. |
Timothy F. Hayes (52) |
| Year of Election or Appointment: 2002 Chief Financial Officer of Advisor Global Equity. Mr. Hayes also serves as Chief Financial Officer of other Fidelity funds (2002). Recently he was appointed President of Fidelity Service Company (2003) where he also serves as a Director. Mr. Hayes also serves as President of Fidelity Investments Operations Group (FIOG, 2002), which includes Fidelity Pricing and Cash Management Services Group (FPCMS), where he was appointed President in 1998. Previously, Mr. Hayes served as Chief Financial Officer of Fidelity Investments Corporate Systems and Service Group (1998) and Fidelity Systems Company (1997-1998). |
John R. Hebble (45) |
| Year of Election or Appointment: 2003 Deputy Treasurer of Advisor Global Equity. Mr. Hebble also serves as Deputy Treasurer of other Fidelity funds (2003), and is an employee of FMR. Before joining Fidelity Investments, Mr. Hebble worked at Deutsche Asset Management where he served as Director of Fund Accounting (2002-2003) and Assistant Treasurer of the Scudder Funds (1998-2003). |
John H. Costello (57) |
| Year of Election or Appointment: 1998 Assistant Treasurer of Advisor Global Equity. Mr. Costello also serves as Assistant Treasurer of other Fidelity funds and is an employee of FMR. |
Francis V. Knox, Jr. (56) |
| Year of Election or Appointment: 2002 Assistant Treasurer of Advisor Global Equity. Mr. Knox also serves as Assistant Treasurer of other Fidelity funds (2002), and is a Vice President and an employee of FMR. Previously, Mr. Knox served as Vice President of Investment & Advisor Compliance (1990-2001), and Compliance Officer of Fidelity Management & Research (U.K.) Inc. (1992-2002), Fidelity Management & Research (Far East) Inc. (1991-2002), and FMR Corp. (1995-2002). |
Mark Osterheld (48) |
| Year of Election or Appointment: 2002 Assistant Treasurer of Advisor Global Equity. Mr. Osterheld also serves as Assistant Treasurer of other Fidelity funds (2002) and is an employee of FMR. |
Thomas J. Simpson (45) |
| Year of Election or Appointment: 2000 Assistant Treasurer of Advisor Global Equity. Mr. Simpson is Assistant Treasurer of other Fidelity funds (2000) and an employee of FMR (1996). Prior to joining FMR, Mr. Simpson was Vice President and Fund Controller of Liberty Investment Services (1987-1995). |
Annual Report
Annual Report
Annual Report
Annual Report
Annual Report
Annual Report
Investment Adviser
Fidelity Management & Research Company
Boston, MA
Investment Sub-Advisers
FMR Co., Inc.
Fidelity Management & Research
(U.K.) Inc.
Fidelity Management & Research
(Far East) Inc.
Fidelity International
Investment Advisors
Fidelity Investments Japan Limited
Fidelity International Investment Advisors (U.K.) Limited
General Distributor
Fidelity Distributors Corporation
Boston, MA
Transfer and Shareholder
Servicing Agents
Fidelity Investments Institutional Operations Company, Inc.
Boston, MA
Custodian
State Street Bank and Trust Company
Quincy, MA
Annual Report
Fidelity Advisor Aggressive Growth Fund |
Fidelity Advisor Asset Allocation Fund |
Fidelity Advisor Balanced Fund |
Fidelity Advisor Biotechnology Fund |
Fidelity Advisor California Municipal Income Fund |
Fidelity Advisor Consumer Industries Fund |
Fidelity Advisor Cyclical Industries Fund |
Fidelity Advisor Developing Communications Fund |
Fidelity Advisor Diversified International Fund |
Fidelity Advisor Dividend Growth Fund |
Fidelity Advisor Dynamic Capital Appreciation Fund |
Fidelity Advisor Electronics Fund |
Fidelity Advisor Emerging Asia Fund |
Fidelity Advisor Emerging Markets Income Fund |
Fidelity Advisor Equity Growth Fund |
Fidelity Advisor Equity Income Fund |
Fidelity Advisor Equity Value Fund |
Fidelity Advisor Europe Capital Appreciation Fund |
Fidelity Advisor Fifty Fund |
Fidelity Advisor Financial Services Fund |
Fidelity Advisor Floating Rate High Income Fund |
Fidelity Advisor Global Equity Fund |
Fidelity Advisor Government Investment Fund |
Fidelity Advisor Growth & Income Fund |
Fidelity Advisor Growth Opportunities |
Fidelity Advisor Health Care Fund |
Fidelity Advisor High Income Advantage Fund |
Fidelity Advisor High Income Fund |
Fidelity Advisor Inflation-Protected Bond Fund |
Fidelity Advisor Intermediate Bond Fund |
Fidelity Advisor International Capital Appreciation Fund |
Fidelity Advisor International Small Cap Fund |
Fidelity Advisor Investment Grade Bond Fund |
Fidelity Advisor Japan Fund |
Fidelity Advisor Korea Fund |
Fidelity Advisor Large Cap Fund |
Fidelity Advisor Latin America Fund |
Fidelity Advisor Leveraged Company Stock Fund |
Fidelity Advisor Mid Cap Fund |
Fidelity Advisor Mortgage Securities Fund |
Fidelity Advisor Municipal Income Fund |
Fidelity Advisor Natural Resources Fund |
Fidelity Advisor New York Municipal Income Fund |
Fidelity Advisor Overseas Fund |
Fidelity Advisor Real Estate Fund |
Fidelity Advisor Short Fixed-Income Fund |
Fidelity Advisor Small Cap Fund |
Fidelity Advisor Strategic Growth Fund |
Fidelity Advisor Strategic Income Fund |
Fidelity Advisor Tax Managed
Stock Fund |
Fidelity Advisor Technology Fund |
Fidelity Advisor Telecommunications & Utilities Growth Fund |
Fidelity Advisor Value Leaders Fund |
Fidelity Advisor Value Strategies Fund |
Prime Fund |
Tax-Exempt Fund |
Treasury Fund |
(Fidelity Investment logo)(registered trademark)
Corporate Headquarters
82 Devonshire St., Boston, MA 02109
www.fidelity.com
Fidelity® Advisor
Global Equity
Fund - Institutional Class
Annual Report
October 31, 2003
(2_fidelity_logos) (Registered_Trademark)
Contents
Chairman's Message | <Click Here> | Ned Johnson's message to shareholders. |
Performance | <Click Here> | How the fund has done over time. |
Management's Discussion | <Click Here> | The manager's review of fund performance, strategy and outlook. |
Investment Changes | <Click Here> | A summary of major shifts in the fund's investments over the past six months. |
Investments | <Click Here> | A complete list of the fund's investments with their market values. |
Financial Statements | <Click Here> | Statements of assets and liabilities, operations, and changes in net assets,
as well as financial highlights. |
Notes | <Click Here> | Notes to the financial statements. |
Auditors' Opinion | <Click Here> | |
Trustees and Officers | <Click Here> | |
| | |
For a free copy of the fund's proxy voting guidelines call 1-877-208-0098 or visit the Securities and Exchange Commission (SEC)'s web site at www.sec.gov.
Third party marks appearing herein are the property of their respective owners.
All other marks appearing herein are registered or unregistered trademarks or service marks of FMR Corp. or an affiliated company.
(Recycle graphic) This report is printed on recycled paper using soy-based inks.
This report and the financial statements contained herein are submitted for the general information of the shareholders of the fund. This report is not authorized for distribution to prospective investors in the fund unless preceded or accompanied by an effective prospectus.
Mutual fund shares are not deposits or obligations of, or guaranteed by, any depository institution. Shares are not insured by the FDIC, Federal Reserve Board or any other agency, and are subject to investment risks, including possible loss of principal amount invested.
Neither the fund nor Fidelity Distributors Corporation is a bank.
For more information on any Fidelity Advisor fund, including charges and expenses, contact your investment professional for a free prospectus. Read it carefully before you invest or send money.
Annual Report
Chairman's Message
(photo_of_Edward_C_Johnson_3d)
Dear Shareholder:
Many of you have read or heard news stories recently that were critical of mutual funds and made allegations that the mutual fund industry has been less than forthright. I find these reports unsettling and not necessarily an accurate picture of the overall industry, and I would like you to know where we at Fidelity stand.
With specific regard to allegations that certain mutual fund companies were violating the Securities and Exchange Commission's forward pricing rules or were involved in so-called "market timing" activities, I want to say two things:
First, Fidelity does not have agreements that permit customers who buy fund shares after 4 p.m. to obtain the 4 p.m. price. This is not to say that someone could not deceive the company through fraudulent acts. But I underscore that we have no so-called "agreements" which would permit this illegal practice.
Second, Fidelity has been on record for years opposing predatory short-term trading which adversely affects other shareholders in a mutual fund. In fact, in the 1980s, we began charging a fee - which is returned to the fund and, therefore, to investors - to discourage this activity. What's more, several years ago we took the industry lead in developing a Fair Value Pricing Policy to prevent market timing on foreign securities in our funds. It is reasonable to assume that another structure can be developed that would alter the system to make it much more difficult for predatory traders to operate. This, however, will only be achieved through close cooperation among regulators, legislators and the industry.
Certainly no industry is perfect, and there have been instances of unethical and illegal activity from time to time within the mutual fund industry. When this occurs, confessed or convicted offenders should be dealt with appropriately. Clearly, every system can be improved. We applaud well thought out improvements by regulators, legislators and industry representatives that achieve the common goal of building and protecting the value of investors' holdings. But we remain concerned about the risk of over-regulation and the quick application of simplistic solutions to intricate problems.
For more than 57 years, Fidelity Investments has worked very hard to improve its products and service to justify your trust. When our family founded this company in 1946, we had only a few hundred customers. Many of them were family and friends. Today, we serve more than 18 million customers including individual investors and participants in retirement plans across America.
Let me close by saying that we do not take your trust in us for granted, and we realize that we must always work to improve all aspects of our service to you. In turn, we urge you to continue your active participation with your financial matters, so that your interests can be well served.
Annual Report
Best regards,
/s/Edward C. Johnson 3d
Edward C. Johnson 3d
Annual Report
Performance: The Bottom Line
Average annual total return reflects the change in the value of an investment, assuming reinvestment of the class' dividend income and capital gains (the profits earned upon the sale of securities that have grown in value) and assuming a constant rate of performance each year. During periods of reimbursement by Fidelity, a fund's total return will be greater than it would be had the reimbursement not occurred. The $10,000 table and the fund's returns do not reflect the deduction of taxes that a shareholder would pay on fund distributions or the redemption of fund shares. How a fund did yesterday is no guarantee of how it will do tomorrow.
Average Annual Total Returns
Periods ended October 31, 2003 | Past 1
year | Life of
fund A |
Institutional Class | 25.35% | 2.21% |
A From December 17, 1998
$10,000 Over 10 Years
Let's say hypothetically that $10,000 was invested in Fidelity® Advisor Global Equity Fund - Institutional Class on December 17, 1998, when the fund started. The chart shows how the value of your investment would have grown, and also shows how the MSCI® World Index did over the same period.

Annual Report
Management's Discussion of Fund Performance
Comments from Richard Habermann, Portfolio Manager of Fidelity® Advisor Global Equity Fund
Mirroring the U.S. rally, most international stock markets rebounded sharply during the 12-month period ending October 31, 2003. Encouraged by improved corporate earnings, favorable interest rates and the easing of geopolitical tensions, the Morgan Stanley Capital InternationalSM Europe, Australasia, Far East (MSCI® EAFE®) Index - a proxy for stock markets outside the United States and Canada - gained 27.39% during the past year. From a regional perspective, all 16 countries in the MSCI Europe index - which gained 24.56% - - had double-digit advances. Spain, Denmark and Sweden were among the region's best performers. In Japan, increased capital spending, exports and machinery orders helped the Tokyo Stock Exchange Stock Price Index (TOPIX) advance 36.39%. Following the SARS epidemic, other Asian markets also rebounded. For instance, the Hong Kong market, as measured by the Hang Seng Index, gained 34.51%. Emerging markets also fared well, particularly Latin America. The MSCI Emerging Markets Free Latin America index rose 59.75%. Canadian equities, as measured by the S&P/TSX Composite Index, also posted an impressive annual gain, advancing 50.66%.
Fidelity Advisor Global Equity Fund's Institutional Class shares gained 25.35% during the one-year period ending October 31, 2003. In comparison, the Morgan Stanley Capital International World Index and the LipperSM Global Funds Average returned 24.24% and 23.59%, respectively. While security selection largely drove the fund's results, my regional allocation decisions also added value. I maintained a modest overweighting in Japan and Southeast Asia, while underweighting Europe - whose economies I felt would be slower to benefit from a pickup in global demand. This strategy worked well earlier in the period as Europe lagged the world market. The fund's U.S. holdings had by far the most influence on performance. Our aggressive positioning in technology helped a lot, driven by industry leaders such as Yahoo!, Motorola and EMC. Some good picks among homebuilding and medical device stocks also contributed. Japanese consumer cyclical and brokerage stocks - - including NOK and Nomura Holdings, respectively - further aided results, while the fund's more-defensive positioning in Europe curbed our gains in that market. Conversely, the fund suffered from its overexposure to lagging health care stocks, including Tenet Healthcare, Cardinal Health, Johnson & Johnson and France-based Aventis.
The views expressed in this statement reflect those of the portfolio manager only through the end of the period of the report as stated on the cover and do not necessarily represent the views of Fidelity or any other person in the Fidelity organization. Any such views are subject to change at any time based upon market or other conditions and Fidelity disclaims any responsibility to update such views. These views may not be relied on as investment advice and, because investment decisions for a Fidelity fund are based on numerous factors, may not be relied on as an indication of trading intent on behalf of any Fidelity fund.
Annual Report
Investment Changes
Top Five Stocks as of October 31, 2003 |
| % of fund's
net assets | % of fund's net assets
6 months ago |
Johnson & Johnson (United States of America, Pharmaceuticals) | 2.2 | 2.9 |
Lennar Corp. Class A (United States of America, Household Durables) | 2.1 | 1.6 |
Microsoft Corp. (United States of America, Software) | 2.1 | 3.4 |
Motorola, Inc. (United States of America, Communications Equipment) | 1.8 | 0.5 |
Univision Communications, Inc. Class A (United States of America, Media) | 1.7 | 1.9 |
| 9.9 | |
Top Five Market Sectors as of October 31, 2003 |
| % of fund's
net assets | % of fund's net assets
6 months ago |
Consumer Discretionary | 16.9 | 18.8 |
Financials | 17.5 | 17.0 |
Information Technology | 15.6 | 14.3 |
Health Care | 14.4 | 15.5 |
Consumer Staples | 7.3 | 8.9 |
Top Five Countries as of October 31, 2003 |
(excluding cash equivalents) | % of fund's
net assets | % of fund's net assets
6 months ago |
United States of America | 53.9 | 55.2 |
Japan | 10.3 | 8.1 |
United Kingdom | 8.6 | 10.3 |
France | 3.8 | 3.8 |
Canada | 2.6 | 2.4 |
Percentages are adjusted for the effect of open futures contracts, if applicable. |
Asset Allocation (% of fund's net assets) |
As of October 31, 2003 | As of April 30, 2003 |
| Stocks and Equity
Futures 97.0% | | | Stocks and Equity
Futures 97.2% | |
| Short-Term
Investments and
Net Other Assets 3.0% | | | Short-Term
Investments and
Net Other Assets 2.8% | |

Annual Report
Investments October 31, 2003
Showing Percentage of Net Assets
Common Stocks - 91.3% |
| Shares | | Value (Note 1) |
Australia - 1.9% |
Amcor Ltd. | 2,848 | | $ 17,133 |
AMP Ltd. | 4,200 | | 19,559 |
AMP Ltd. rights 1/2/04 | 4,200 | | 244 |
Australia & New Zealand Banking Group Ltd. | 3,900 | | 49,132 |
Australia & New Zealand Banking Group Ltd. rights 11/24/03 (a) | 709 | | 2,163 |
Australian Gas Light Co. | 1,053 | | 7,974 |
Australian Stock Exchange Ltd. | 700 | | 7,927 |
AXA Asia Pacific Holdings Ltd. | 5,800 | | 11,617 |
BHP Billiton Ltd. | 9,785 | | 81,165 |
BHP Steel Ltd. | 2,457 | | 9,425 |
Brambles Industries Ltd. | 1,900 | | 6,280 |
Coca-Cola Amatil Ltd. | 3,666 | | 15,282 |
Commonwealth Bank of Australia | 2,200 | | 42,819 |
CSL Ltd. | 1,310 | | 15,762 |
Fosters Group Ltd. | 1,700 | | 5,499 |
Gunns Ltd. | 1,177 | | 10,663 |
Insurance Australia Group Ltd. | 3,909 | | 12,311 |
JB Hi-Fi Ltd. (a) | 4,650 | | 6,977 |
Lend Lease Corp. Ltd. | 1,833 | | 14,543 |
National Australia Bank Ltd. | 1,200 | | 25,980 |
Newcrest Mining Ltd. | 1,600 | | 13,679 |
News Corp. Ltd. | 2,466 | | 21,978 |
Origin Energy Ltd. | 2,024 | | 6,160 |
Publishing & Broadcasting Ltd. | 1,500 | | 12,793 |
Qantas Airways Ltd. | 2,979 | | 7,611 |
QBE Insurance Group Ltd. | 2,990 | | 21,797 |
Rinker Group Ltd. | 2,900 | | 13,033 |
Rio Tinto Ltd. | 1,403 | | 35,399 |
Westfield Holdings Ltd. | 1,000 | | 10,057 |
Westpac Banking Corp. | 3,600 | | 41,149 |
WMC Resources Ltd. (a) | 5,700 | | 20,655 |
Woolworths Ltd. | 2,000 | | 15,740 |
TOTAL AUSTRALIA | | 582,506 |
Belgium - 0.4% |
Agfa-Gevaert NV | 1,700 | | 42,046 |
Colruyt NV | 400 | | 36,144 |
Mobistar SA (a) | 900 | | 45,041 |
TOTAL BELGIUM | | 123,231 |
Canada - 2.6% |
Agnico-Eagle Mines Ltd. | 290 | | 3,163 |
Common Stocks - continued |
| Shares | | Value (Note 1) |
Canada - continued |
Agrium, Inc. | 570 | | $ 8,798 |
Alcan, Inc. | 360 | | 14,362 |
Alimentation Couche-Tard, Inc. Class B (sub. vtg.) (a) | 100 | | 1,706 |
Angiotech Pharmaceuticals, Inc. (a) | 480 | | 21,992 |
Astral Media, Inc. Class A (non-vtg.) | 760 | | 15,102 |
ATI Technologies, Inc. (a) | 810 | | 11,599 |
Bank of Montreal, Quebec | 800 | | 29,931 |
Bank of Nova Scotia | 840 | | 41,710 |
BCE, Inc. | 1,150 | | 26,035 |
Bombardier, Inc. Class B (sub. vtg.) | 1,820 | | 8,172 |
Brascan Corp. Class A (ltd. vtg.) | 200 | | 5,688 |
C.I. Fund Management, Inc. | 350 | | 3,915 |
Cameco Corp. | 230 | | 9,961 |
Canadian Imperial Bank of Commerce | 710 | | 31,884 |
Canadian National Railway Co. | 390 | | 23,441 |
Cinram International, Inc. | 1,270 | | 26,460 |
CP Ships Ltd. | 200 | | 3,785 |
Enbridge, Inc. | 290 | | 11,391 |
EnCana Corp. | 994 | | 34,128 |
Fairfax Financial Holdings Ltd. | 30 | | 4,664 |
Goldcorp, Inc. | 880 | | 13,829 |
Great-West Lifeco, Inc. | 590 | | 18,271 |
Inco Ltd. (a) | 410 | | 13,601 |
Industrial Alliance Life Insurance Co. | 110 | | 3,254 |
Investors Group, Inc. | 160 | | 3,537 |
Kinross Gold Corp. (a) | 1,470 | | 12,052 |
Loblaw Companies Ltd. | 370 | | 17,918 |
Magna International, Inc. Class A | 100 | | 8,019 |
Manitoba Telecom Services, Inc. | 240 | | 7,312 |
Masonite International Corp. (a) | 180 | | 4,027 |
National Bank of Canada | 430 | | 13,342 |
Newmont Mining Corp. of Canada Ltd. (exchangeable shares) | 440 | | 19,175 |
Nortel Networks Corp. (a) | 6,740 | | 29,993 |
Penn West Petroleum Ltd. (a) | 230 | | 7,831 |
Petro-Canada | 550 | | 22,163 |
PetroKazakhstan, Inc. Class A (a) | 190 | | 4,323 |
Power Financial Corp. | 420 | | 14,459 |
Precision Drilling Corp. (a) | 180 | | 7,081 |
Research in Motion Ltd. (a) | 580 | | 25,619 |
Rogers Communications, Inc. Class B (non-vtg.) | 270 | | 4,249 |
Royal Bank of Canada | 1,040 | | 50,071 |
Saputo, Inc. | 700 | | 13,910 |
Common Stocks - continued |
| Shares | | Value (Note 1) |
Canada - continued |
Shell Canada Ltd. Class A | 80 | | $ 3,143 |
Sun Life Financial, Inc. | 333 | | 8,231 |
Suncor Energy, Inc. | 600 | | 12,601 |
Talisman Energy, Inc. | 380 | | 18,558 |
Teck Cominco Ltd. Class B (sub. vtg.) | 480 | | 6,262 |
TELUS Corp. (non-vtg.) | 480 | | 8,406 |
Terasen, Inc. | 310 | | 10,879 |
Toronto-Dominion Bank | 1,050 | | 34,928 |
TransCanada Corp. | 780 | | 15,914 |
TOTAL CANADA | | 770,845 |
Cayman Islands - 1.0% |
Noble Corp. (a) | 3,960 | | 135,947 |
Seagate Technology | 7,740 | | 177,865 |
TOTAL CAYMAN ISLANDS | | 313,812 |
Denmark - 0.8% |
A.P. Moller - Maersk AS Series A | 6 | | 45,441 |
Danske Bank AS | 2,630 | | 52,870 |
ISS AS | 2,128 | | 101,142 |
Novo Nordisk AS Series B | 1,250 | | 44,802 |
TOTAL DENMARK | | 244,255 |
Finland - 0.4% |
Fortum Oyj | 4,440 | | 40,788 |
Nokia Corp. | 3,110 | | 52,839 |
Sampo Oyj (A Shares) | 4,129 | | 34,631 |
TOTAL FINLAND | | 128,258 |
France - 3.8% |
Alcatel SA (RFD) (a) | 4,200 | | 55,356 |
Aventis SA (France) | 2,193 | | 116,141 |
AXA SA | 9,474 | | 178,895 |
BNP Paribas SA | 1,792 | | 93,833 |
Cap Gemini SA (a) | 1,800 | | 90,394 |
CNP Assurances | 600 | | 27,268 |
Credit Agricole SA | 2,900 | | 61,378 |
Credit Agricole SA rights 11/7/03 (a) | 2,900 | | 672 |
France Telecom SA (a) | 2,400 | | 57,885 |
Suez SA (France) | 2,400 | | 38,368 |
Television Francaise 1 SA | 1,170 | | 34,969 |
Common Stocks - continued |
| Shares | | Value (Note 1) |
France - continued |
Total SA Series B | 1,525 | | $ 238,114 |
Vivendi Universal SA (a) | 7,100 | | 148,626 |
TOTAL FRANCE | | 1,141,899 |
Germany - 1.4% |
Allianz AG (Reg.) | 700 | | 74,783 |
Altana AG | 600 | | 37,680 |
Bayerische Hypo Und Verein AG (a) | 1,200 | | 26,343 |
Deutsche Boerse AG | 1,101 | | 60,992 |
Deutsche Telekom AG (Reg.) (a) | 2,200 | | 34,342 |
Merck KGaA | 600 | | 20,942 |
Muenchener Rueckversicherungs-Gesellschaft AG: | | | |
rights 11/10/03 (a) | 1,253 | | 10,320 |
(Reg.) | 1,253 | | 148,913 |
TOTAL GERMANY | | 414,315 |
Hong Kong - 0.9% |
Bank of East Asia Ltd. | 4,452 | | 13,301 |
Cafe de Coral Holdings Ltd. | 6,000 | | 5,408 |
Cheung Kong Holdings Ltd. | 3,000 | | 25,014 |
China Everbright Ltd. | 12,000 | | 6,606 |
CLP Holdings Ltd. | 900 | | 4,068 |
CNOOC Ltd. | 3,500 | | 6,603 |
Denway Motors Ltd. | 10,000 | | 8,241 |
Esprit Holdings Ltd. | 2,000 | | 6,284 |
Guoco Group Ltd. | 783 | | 5,520 |
Hang Seng Bank Ltd. | 900 | | 11,242 |
Hong Kong & China Gas Co. Ltd. | 9,400 | | 13,013 |
Hutchison Whampoa Ltd. | 6,600 | | 51,207 |
Johnson Electric Holdings Ltd. | 5,000 | | 6,503 |
Li & Fung Ltd. | 12,000 | | 20,166 |
PCCW Ltd. (a) | 18,000 | | 12,864 |
Sun Hung Kai Properties Ltd. | 4,000 | | 33,867 |
Swire Pacific Ltd. (A Shares) | 1,500 | | 9,156 |
Television Broadcasts Ltd. | 3,000 | | 14,217 |
Varitronix International Ltd. | 5,000 | | 5,312 |
Wharf Holdings Ltd. | 2,000 | | 5,035 |
TOTAL HONG KONG | | 263,627 |
Ireland - 0.2% |
CRH PLC | 3,427 | | 61,337 |
Common Stocks - continued |
| Shares | | Value (Note 1) |
Italy - 1.3% |
Autostrade Spa | 5,840 | | $ 85,243 |
Banca Intesa Spa | 20,000 | | 67,329 |
Banco Popolare di Verona e Novara | 5,890 | | 90,715 |
ENI Spa | 6,111 | | 96,675 |
Riunione Adriatica di Sicurta Spa (RAS) | 2,315 | | 36,046 |
TOTAL ITALY | | 376,008 |
Japan - 10.3% |
Ajinomoto Co., Inc. | 2,000 | | 20,193 |
Asahi Glass Co. Ltd. | 2,000 | | 15,790 |
Bridgestone Corp. | 1,000 | | 13,098 |
Canon, Inc. | 2,000 | | 97,900 |
Citizen Watch Co. Ltd. | 3,000 | | 24,586 |
Daicel Chemical Industries Ltd. | 5,000 | | 21,193 |
Daikin Industries Ltd. | 1,000 | | 21,330 |
Dainippon Screen Manufacturing Co. Ltd. (a) | 2,000 | | 14,281 |
Daito Trust Construction Co. | 1,000 | | 30,926 |
Denki Kagaku Kogyo KK | 6,000 | | 18,228 |
Denso Corp. | 1,300 | | 24,654 |
Dowa Mining Co. Ltd. | 5,000 | | 27,015 |
East Japan Railway Co. | 7 | | 31,708 |
Faith, Inc. | 1 | | 8,141 |
Fast Retailing Co. Ltd. | 1,100 | | 66,836 |
Fuji Photo Film Co. Ltd. | 2,000 | | 58,941 |
Funai Electric Co. Ltd. | 100 | | 13,325 |
Heiwa Corp. | 500 | | 7,240 |
Hitachi Cable Ltd. | 3,000 | | 11,925 |
Hitachi Chemical Co. Ltd. | 1,700 | | 27,462 |
Hoya Corp. | 400 | | 36,202 |
Isetan Co. Ltd. | 1,700 | | 17,597 |
Ito Yokado Ltd. | 1,000 | | 36,747 |
JAFCO Co. Ltd. | 200 | | 17,100 |
Japan Radio Co. Ltd. (a) | 3,000 | | 14,517 |
Japan Retail Fund Investment Corp. | 3 | | 17,546 |
JFE Holdings, Inc. | 1,100 | | 28,115 |
JSR Corp. | 2,000 | | 42,387 |
Kaneka Corp. | 2,000 | | 15,590 |
Kao Corp. | 1,000 | | 20,557 |
KDDI Corp. | 13 | | 70,593 |
Keyence Corp. | 100 | | 21,994 |
Kokuyo Co. Ltd. | 1,000 | | 10,397 |
Konami Corp. | 300 | | 9,141 |
Common Stocks - continued |
| Shares | | Value (Note 1) |
Japan - continued |
Konica Minolta Holdings, Inc. | 6,500 | | $ 85,433 |
Kyocera Corp. | 600 | | 36,129 |
Kyorin Pharmaceutical Co. Ltd. | 1,000 | | 15,054 |
Matsushita Electric Industrial Co. Ltd. | 3,000 | | 39,360 |
Meitec Corp. | 500 | | 17,873 |
Millea Holdings, Inc. | 2 | | 23,831 |
Mitsubishi Securities Co. Ltd. | 4,000 | | 45,479 |
Mitsubishi Tokyo Financial Group, Inc. (MTFG) | 10 | | 73,400 |
Mitsui & Co. Ltd. | 12,000 | | 87,320 |
Mitsui Fudosan Co. Ltd. | 2,000 | | 18,610 |
Mitsui O.S.K. Lines Ltd. | 6,000 | | 24,395 |
Mizuho Financial Group, Inc. (a) | 13 | | 31,808 |
Murata Manufacturing Co. Ltd. | 300 | | 17,055 |
Nichicon Corp. | 1,800 | | 20,924 |
Nidec Corp. | 200 | | 19,374 |
Nikko Cordial Corp. | 7,000 | | 37,757 |
Nippon Sheet Glass Co. Ltd. | 4,000 | | 12,298 |
Nippon Steel Corp. | 14,000 | | 28,779 |
Nishimatsuya Chain Co. Ltd. | 500 | | 15,008 |
Nissan Motor Co. Ltd. | 11,100 | | 125,486 |
Nitto Denko Corp. | 1,200 | | 62,980 |
NOK Corp. | 3,000 | | 118,155 |
Nomura Holdings, Inc. | 5,000 | | 85,865 |
Nomura Research Institute Ltd. | 100 | | 10,051 |
NTN Corp. | 5,000 | | 26,060 |
Oji Paper Co. Ltd. | 3,000 | | 15,963 |
ORIX Corp. | 300 | | 25,241 |
Pacific Metals Co. Ltd. (a) | 3,000 | | 14,299 |
Ricoh Co. Ltd. | 2,000 | | 37,930 |
Rohm Co. Ltd. | 500 | | 67,400 |
Sanken Electric Co. Ltd. | 2,000 | | 22,176 |
Sankyo Co. Ltd. (Gunma) | 500 | | 16,691 |
Sankyo Seiki Manufacturing Co. Ltd. (a) | 1,000 | | 7,704 |
Sanyo Shokai Ltd. | 1,000 | | 6,149 |
SFCG Co. Ltd. | 210 | | 30,600 |
Shimachu Co. Ltd. | 1,100 | | 21,512 |
Shin-Etsu Chemical Co. Ltd. | 1,200 | | 44,643 |
SMC Corp. | 300 | | 36,102 |
Stanley Electric Co. Ltd. | 3,000 | | 63,853 |
Sumisho Lease Co. Ltd. | 400 | | 12,298 |
Sumitomo Corp. | 4,000 | | 27,761 |
Sumitomo Electric Industries Ltd. | 2,000 | | 17,191 |
Common Stocks - continued |
| Shares | | Value (Note 1) |
Japan - continued |
Sumitomo Mitsui Financial Group, Inc. | 21 | | $ 105,630 |
Takeda Chemical Industries Ltd. | 1,700 | | 60,151 |
Terumo Corp. | 1,800 | | 34,219 |
THK Co. Ltd. | 1,400 | | 28,397 |
Tokyo Electric Power Co. | 2,500 | | 53,325 |
Tokyo Electron Ltd. | 800 | | 57,340 |
Toray Industries, Inc. | 3,000 | | 12,470 |
Toyoda Gosei Co. Ltd. | 900 | | 26,605 |
Toyota Motor Corp. | 5,600 | | 162,456 |
UFJ Holdings, Inc. (a) | 15 | | 64,126 |
Uni-Charm Corp. | 500 | | 23,331 |
Uniden Corp. | 1,000 | | 19,010 |
TOTAL JAPAN | | 3,106,312 |
Netherlands - 1.8% |
Euronext NV | 4,550 | | 110,953 |
ING Groep NV (Certificaten Van Aandelen) | 7,210 | | 150,256 |
Koninklijke Ahold NV (a) | 5,400 | | 45,541 |
Koninklijke Numico NV (Certificaten Van Aandelen) (a) | 5,300 | | 119,173 |
Koninklijke Philips Electronics NV | 3,721 | | 99,872 |
TOTAL NETHERLANDS | | 525,795 |
New Zealand - 0.1% |
Sky City Entertainment Group Ltd. | 1,200 | | 6,591 |
Telecom Corp. of New Zealand Ltd. | 3,481 | | 10,340 |
TOTAL NEW ZEALAND | | 16,931 |
Norway - 0.5% |
DnB Holding ASA | 5,420 | | 31,484 |
Gjensidige NOR ASA | 800 | | 32,631 |
Statoil ASA | 3,300 | | 30,866 |
Telenor ASA | 9,600 | | 51,985 |
TOTAL NORWAY | | 146,966 |
Papua New Guinea - 0.1% |
Lihir Gold Ltd. | 9,100 | | 10,949 |
Oil Search Ltd. | 15,400 | | 11,226 |
TOTAL PAPUA NEW GUINEA | | 22,175 |
Singapore - 0.6% |
City Developments Ltd. | 3,000 | | 10,434 |
DBS Group Holdings Ltd. | 2,000 | | 16,442 |
Flextronics International Ltd. (a) | 7,070 | | 98,980 |
Common Stocks - continued |
| Shares | | Value (Note 1) |
Singapore - continued |
Keppel Corp. Ltd. | 2,000 | | $ 6,841 |
Oversea-Chinese Banking Corp. Ltd. | 1,000 | | 6,956 |
Singapore Airlines Ltd. | 1,000 | | 6,956 |
Singapore Exchange Ltd. | 6,000 | | 5,726 |
Singapore Post Ltd. | 23,000 | | 8,859 |
Singapore Press Holdings Ltd. | 400 | | 4,530 |
United Overseas Bank Ltd. | 3,096 | | 24,206 |
TOTAL SINGAPORE | | 189,930 |
Spain - 2.3% |
Altadis SA (Spain) | 7,600 | | 183,656 |
Antena 3 Television SA (a) | 44 | | 1,432 |
Banco Popular Espanol SA (Reg.) | 1,030 | | 53,372 |
Banco Santander Central Hispano SA | 8,790 | | 84,008 |
Corporacion Mapfre SA (Reg.) | 3,100 | | 38,498 |
Fomento Construcciones y Contratas SA (FOCSA) | 1,370 | | 44,533 |
Grupo Dragados SA | 3,610 | | 73,478 |
Sogecable SA (a) | 1,550 | | 39,449 |
Telefonica SA | 13,153 | | 163,974 |
TOTAL SPAIN | | 682,400 |
Sweden - 1.0% |
Hennes & Mauritz AB (H&M) (B Shares) | 4,200 | | 88,742 |
Securitas AB (B Shares) | 4,500 | | 55,153 |
Svenska Handelsbanken AB (A Shares) | 3,678 | | 64,565 |
Telefonaktiebolaget LM Ericsson (B Shares) (a) | 62,200 | | 106,238 |
TOTAL SWEDEN | | 314,698 |
Switzerland - 2.1% |
Adecco SA | 1,114 | | 65,439 |
Credit Suisse Group (Reg.) | 5,470 | | 191,976 |
Nestle SA (Reg.) | 921 | | 201,980 |
Novartis AG (Reg.) | 3,136 | | 120,328 |
Swiss Life Holding (a) | 270 | | 45,618 |
TOTAL SWITZERLAND | | 625,341 |
United Kingdom - 8.6% |
3i Group PLC | 15,420 | | 161,991 |
Anglo American PLC (United Kingdom) | 3,740 | | 76,425 |
AstraZeneca PLC (Sweden) | 2,112 | | 99,900 |
Barclays PLC | 10,770 | | 90,696 |
BG Group PLC | 21,490 | | 97,859 |
Boots Group PLC | 5,700 | | 68,814 |
Common Stocks - continued |
| Shares | | Value (Note 1) |
United Kingdom - continued |
BP PLC | 31,800 | | $ 224,614 |
British Sky Broadcasting Group PLC (BSkyB) (a) | 5,500 | | 59,643 |
Carnival PLC | 2,100 | | 72,410 |
GlaxoSmithKline PLC | 10,031 | | 217,121 |
HSBC Holdings PLC: | | | |
(Hong Kong) (Reg.) | 3,844 | | 57,714 |
(United Kingdom) (Reg.) | 13,940 | | 209,295 |
Kesa Electricals PLC | 7,136 | | 29,503 |
Kingfisher PLC | 5,258 | | 25,168 |
Man Group PLC | 3,250 | | 79,794 |
Prudential PLC | 9,290 | | 71,976 |
Reed Elsevier PLC | 4,180 | | 32,438 |
Royal Bank of Scotland Group PLC | 1,600 | | 42,807 |
Shell Transport & Trading Co. PLC (Reg.) | 33,590 | | 213,632 |
Standard Chartered PLC | 6,300 | | 100,609 |
Unilever PLC | 15,680 | | 134,064 |
United Business Media PLC | 7,594 | | 59,704 |
Vodafone Group PLC | 167,564 | | 354,398 |
TOTAL UNITED KINGDOM | | 2,580,575 |
United States of America - 49.2% |
Abbott Laboratories | 3,290 | | 140,220 |
Abercrombie & Fitch Co. Class A (a) | 940 | | 26,790 |
Aetna, Inc. | 1,560 | | 89,560 |
AFLAC, Inc. | 930 | | 33,926 |
Agere Systems, Inc.: | | | |
Class A (a) | 260 | | 905 |
Class B (a) | 6,397 | | 21,686 |
Albany International Corp. Class A | 2,280 | | 70,452 |
Allergan, Inc. | 2,070 | | 156,533 |
Allstate Corp. | 2,090 | | 82,555 |
Altria Group, Inc. | 60 | | 2,790 |
American International Group, Inc. | 1,420 | | 86,379 |
AmerisourceBergen Corp. | 1,110 | | 63,015 |
Amphenol Corp. Class A (a) | 660 | | 38,775 |
Analog Devices, Inc. (a) | 1,870 | | 82,897 |
Aramark Corp. Class B (a) | 1,910 | | 51,035 |
AT&T Corp. | 2,268 | | 42,162 |
Avon Products, Inc. | 1,590 | | 108,056 |
Baker Hughes, Inc. | 1,800 | | 50,868 |
Bank of America Corp. | 690 | | 52,254 |
Bank of Hawaii Corp. | 1,500 | | 59,100 |
Common Stocks - continued |
| Shares | | Value (Note 1) |
United States of America - continued |
BEA Systems, Inc. (a) | 290 | | $ 4,031 |
Becton, Dickinson & Co. | 2,100 | | 76,776 |
Biomet, Inc. | 1,480 | | 53,073 |
BJ Services Co. (a) | 1,100 | | 36,091 |
Black & Decker Corp. | 340 | | 16,255 |
Boston Scientific Corp. (a) | 730 | | 49,436 |
Bristol-Myers Squibb Co. | 2,400 | | 60,888 |
Burlington Resources, Inc. | 690 | | 33,562 |
Cardinal Health, Inc. | 580 | | 34,417 |
Cavco Industries, Inc. (a) | 52 | | 1,256 |
Cendant Corp. (a) | 4,020 | | 82,129 |
Centex Corp. | 1,040 | | 101,400 |
Charles Schwab Corp. | 4,210 | | 57,088 |
ChevronTexaco Corp. | 1,510 | | 112,193 |
Clear Channel Communications, Inc. | 4,054 | | 165,484 |
Comcast Corp.: | | | |
Class A (a) | 228 | | 7,734 |
Class A (special) (a) | 3,050 | | 99,491 |
Compuware Corp. (a) | 8,930 | | 50,187 |
ConocoPhillips | 790 | | 45,149 |
Danaher Corp. | 2,140 | | 177,299 |
Dean Foods Co. (a) | 6,000 | | 181,500 |
Dell, Inc. (a) | 11,080 | | 400,210 |
Dow Chemical Co. | 2,170 | | 81,787 |
EMC Corp. (a) | 13,220 | | 182,965 |
ENSCO International, Inc. | 2,170 | | 57,180 |
Fairchild Semiconductor International, Inc. (a) | 1,490 | | 33,674 |
Fannie Mae | 1,780 | | 127,608 |
FedEx Corp. | 730 | | 55,305 |
FirstEnergy Corp. | 890 | | 30,607 |
FleetBoston Financial Corp. | 1,140 | | 46,045 |
Fleetwood Enterprises, Inc. (a) | 2,630 | | 26,510 |
Forest Laboratories, Inc. (a) | 620 | | 31,006 |
Freddie Mac | 1,610 | | 90,369 |
Freeport-McMoRan Copper & Gold, Inc. Class B | 4,530 | | 175,538 |
Gap, Inc. | 3,850 | | 73,458 |
Genentech, Inc. (a) | 2,220 | | 181,973 |
Gillette Co. | 3,830 | | 122,177 |
Golden West Financial Corp., Delaware | 710 | | 71,305 |
HCA, Inc. | 810 | | 30,983 |
Herman Miller, Inc. | 1,200 | | 27,564 |
Hewlett-Packard Co. | 6,250 | | 139,438 |
Common Stocks - continued |
| Shares | | Value (Note 1) |
United States of America - continued |
Home Depot, Inc. | 890 | | $ 32,992 |
Hudson Highland Group, Inc. (a) | 207 | | 4,560 |
Illinois Tool Works, Inc. | 450 | | 33,098 |
Integrated Silicon Solution, Inc. (a) | 970 | | 13,696 |
Intel Corp. | 12,850 | | 424,693 |
InterActiveCorp (a) | 3,380 | | 124,080 |
Intersil Corp. Class A | 640 | | 16,506 |
J.P. Morgan Chase & Co. | 3,280 | | 117,752 |
Jabil Circuit, Inc. (a) | 3,280 | | 91,348 |
Johnson & Johnson | 12,870 | | 647,737 |
KB Home | 220 | | 15,068 |
KLA-Tencor Corp. (a) | 4,010 | | 229,893 |
Lattice Semiconductor Corp. (a) | 960 | | 7,488 |
Lennar Corp.: | | | |
Class A | 6,910 | | 634,684 |
Class B | 698 | | 60,621 |
Liberty Media Corp. Class A (a) | 38,987 | | 393,379 |
Lowe's Companies, Inc. | 1,020 | | 60,109 |
LSI Logic Corp. (a) | 2,750 | | 25,410 |
Lucent Technologies, Inc. (a) | 24,180 | | 77,376 |
Lyondell Chemical Co. | 3,780 | | 54,054 |
Manpower, Inc. | 6,400 | | 296,960 |
Martin Marietta Materials, Inc. | 1,280 | | 52,442 |
Masco Corp. | 1,110 | | 30,525 |
Maytag Corp. | 960 | | 24,384 |
McKesson Corp. | 2,960 | | 89,599 |
Medtronic, Inc. | 4,220 | | 192,305 |
Merck & Co., Inc. | 7,910 | | 350,018 |
Merrill Lynch & Co., Inc. | 3,510 | | 207,792 |
MetLife, Inc. | 1,160 | | 36,424 |
Mettler-Toledo International, Inc. (a) | 1,750 | | 67,095 |
Micron Technology, Inc. (a) | 7,260 | | 104,108 |
Microsoft Corp. | 23,800 | | 622,370 |
Millennium Chemicals, Inc. | 500 | | 5,010 |
Mohawk Industries, Inc. (a) | 436 | | 32,316 |
Monster Worldwide, Inc. (a) | 2,770 | | 70,552 |
Morgan Stanley | 2,110 | | 115,776 |
Motorola, Inc. | 41,020 | | 555,001 |
National Semiconductor Corp. (a) | 720 | | 29,254 |
National-Oilwell, Inc. (a) | 2,070 | | 39,475 |
NIKE, Inc. Class B | 760 | | 48,564 |
Northrop Grumman Corp. | 280 | | 25,032 |
Common Stocks - continued |
| Shares | | Value (Note 1) |
United States of America - continued |
Northwest Airlines Corp. (a) | 2,305 | | $ 31,555 |
Parker Hannifin Corp. | 560 | | 28,543 |
PepsiCo, Inc. | 1,990 | | 95,162 |
Performance Food Group Co. (a) | 1,460 | | 54,385 |
Perrigo Co. | 2,480 | | 33,356 |
Pfizer, Inc. | 10,522 | | 332,495 |
PolyOne Corp. | 2,710 | | 13,089 |
Progressive Corp. | 410 | | 30,258 |
Pulte Homes, Inc. | 1,660 | | 143,607 |
RealNetworks, Inc. (a) | 1,490 | | 9,909 |
ResMed, Inc. Chess Depositary Interests (a) | 765 | | 3,249 |
St. Jude Medical, Inc. (a) | 4,240 | | 246,598 |
Stryker Corp. | 1,380 | | 111,932 |
Synovus Financial Corp. | 1,460 | | 40,296 |
Synthes-Stratec, Inc. | 63 | | 57,615 |
Sysco Corp. | 1,810 | | 60,925 |
Tenet Healthcare Corp. (a) | 2,495 | | 34,431 |
Texas Instruments, Inc. | 3,220 | | 93,122 |
The Coca-Cola Co. | 4,620 | | 214,368 |
Time Warner, Inc. (a) | 26,320 | | 402,433 |
Toys 'R' Us, Inc. (a) | 3,280 | | 42,640 |
Transocean, Inc. (a) | 1,400 | | 26,866 |
Tyson Foods, Inc. Class A | 4,110 | | 58,650 |
Union Pacific Corp. | 550 | | 34,430 |
UnitedHealth Group, Inc. | 1,260 | | 64,109 |
Univision Communications, Inc. Class A (a) | 14,970 | | 508,232 |
VERITAS Software Corp. (a) | 2,220 | | 80,253 |
Viacom, Inc. Class B (non-vtg.) | 9,890 | | 394,314 |
Wachovia Corp. | 1,380 | | 63,301 |
Wal-Mart Stores, Inc. | 2,460 | | 145,017 |
Waste Management, Inc. | 3,210 | | 83,203 |
Weatherford International Ltd. (a) | 3,750 | | 130,313 |
Whole Foods Market, Inc. (a) | 310 | | 18,364 |
Wyeth | 1,370 | | 60,472 |
Xilinx, Inc. (a) | 710 | | 22,507 |
Zimmer Holdings, Inc. (a) | 4,380 | | 279,488 |
TOTAL UNITED STATES OF AMERICA | | 14,800,132 |
TOTAL COMMON STOCKS (Cost $24,237,181) | 27,431,348 |
Nonconvertible Preferred Stocks - 1.0% |
| Shares | | Value (Note 1) |
Australia - 0.1% |
News Corp. Ltd. (ltd. vtg.) | 2,822 | | $ 20,712 |
Germany - 0.6% |
Fresenius AG | 800 | | 50,953 |
Fresenius Medical Care AG | 130 | | 5,316 |
ProSiebenSat.1 Media AG | 3,150 | | 48,351 |
Wella AG | 850 | | 67,451 |
TOTAL GERMANY | | 172,071 |
Italy - 0.3% |
Telecom Italia Spa (Risp) (a) | 52,270 | | 90,344 |
TOTAL NONCONVERTIBLE PREFERRED STOCKS (Cost $303,123) | 283,127 |
Government Obligations - 0.3% |
| Principal Amount | | |
United States of America - 0.3% |
U.S. Treasury Bills, yield at date of purchase 0.86% to 0.87% 12/18/03 (c)
(Cost $99,885) | | $ 100,000 | | 99,886 |
Money Market Funds - 7.8% |
| Shares | | |
Fidelity Cash Central Fund, 1.07% (b)
(Cost $2,354,711) | 2,354,711 | | 2,354,711 |
TOTAL INVESTMENT PORTFOLIO - 100.4% (Cost $26,994,900) | | 30,169,072 |
NET OTHER ASSETS - (0.4)% | | (116,484) |
NET ASSETS - 100% | $ 30,052,588 |
Futures Contracts |
| Expiration Date | | Underlying Face Amount at Value | | Unrealized Gain/(Loss) |
Purchased |
Equity Index Contracts |
27 S&P 500 E-Mini Index Contracts | Dec. 2003 | | $ 1,416,825 | | $ 34,400 |
|
The face value of futures purchased as a percentage of net assets - 4.7% |
Legend |
(a) Non-income producing |
(b) The rate quoted is the annualized seven-day yield of the fund at period end. A complete listing of the fund's holdings as of its most recent fiscal year end is available upon request. |
(c) Security or a portion of the security was pledged to cover margin requirements for futures contracts. At the period end, the value of securities pledged amounted to $89,897. |
Other Information |
Purchases and sales of securities, other
than short-term securities, aggregated $12,618,202 and $13,355,437, respectively. |
The fund placed a portion of its portfolio transactions with brokerage firms which are affiliates of the investment adviser. The commissions paid to these affiliated firms were $454 for the period. |
Income Tax Information |
At October 31, 2003, the fund had a capital loss carryforward of approximately $4,996,000 of which $154,000, $2,322,000 and $2,520,000 will expire on October 31, 2008, 2009 and 2010, respectively. |
See accompanying notes which are an integral part of the financial statements.
Annual Report
Financial Statements
Statement of Assets and Liabilities
| October 31, 2003 |
| | |
Assets | | |
Investment in securities, at value (cost $26,994,900) - See accompanying schedule | | $ 30,169,072 |
Foreign currency held at value (cost $ 3,688) | | 3,678 |
Receivable for investments sold | | 241,032 |
Receivable for fund shares sold | | 25,791 |
Dividends receivable | | 31,410 |
Interest receivable | | 1,746 |
Receivable for daily variation on futures contracts | | 1,350 |
Prepaid expenses | | 139 |
Receivable from investment adviser for expense reductions | | 5,844 |
Total assets | | 30,480,062 |
| | |
Liabilities | | |
Payable to custodian bank | $ 9,024 | |
Payable for investments purchased | 299,215 | |
Payable for fund shares redeemed | 43,492 | |
Accrued management fee | 17,900 | |
Distribution fees payable | 14,614 | |
Other payables and accrued expenses | 43,229 | |
Total liabilities | | 427,474 |
| | |
Net Assets | | $ 30,052,588 |
Net Assets consist of: | | |
Paid in capital | | $ 32,025,817 |
Accumulated net investment loss | | (32,311) |
Accumulated undistributed net realized gain (loss) on investments and foreign currency transactions | | (5,150,324) |
Net unrealized appreciation (depreciation) on investments and assets and liabilities in foreign currencies | | 3,209,406 |
Net Assets | | $ 30,052,588 |
See accompanying notes which are an integral part of the financial statements.
Annual Report
Financial Statements - continued
Statement of Assets and Liabilities - continued
| October 31, 2003 |
| | |
Calculation of Maximum Offering Price
Class A:
Net Asset Value and redemption price per share ($4,435,913÷413,224 shares) | | $ 10.73 |
| | |
Maximum offering price per share (100/94.25 of $10.73) | | $ 11.38 |
Class T:
Net Asset Value and redemption price per share ($17,333,663 ÷ 1,633,043 shares) | | $ 10.61 |
| | |
Maximum offering price per share (100/96.50 of $10.61) | | $ 10.99 |
Class B:
Net Asset Value and offering price per share ($4,917,622 ÷ 474,559 shares) A | | $ 10.36 |
| | |
Class C:
Net Asset Value and offering price per share ($3,190,152 ÷ 307,472 shares) A | | $ 10.38 |
| | |
| | |
Institutional Class:
Net Asset Value, offering price and redemption price per share ($175,238 ÷ 16,107 shares) | | $ 10.88 |
A Redemption price per share is equal to net asset value less any applicable contingent deferred sales charge.
See accompanying notes which are an integral part of the financial statements.
Annual Report
Statement of Operations
| Year ended October 31, 2003 |
| | |
Investment Income | | |
Dividends | | $ 383,505 |
Interest | | 15,329 |
| | 398,834 |
Less foreign taxes withheld | | (28,086) |
Total income | | 370,748 |
| | |
Expenses | | |
Management fee | $ 184,854 | |
Transfer agent fees | 129,573 | |
Distribution fees | 151,752 | |
Accounting fees and expenses | 61,499 | |
Non-interested trustees' compensation | 102 | |
Custodian fees and expenses | 62,311 | |
Registration fees | 54,699 | |
Audit | 43,627 | |
Legal | 887 | |
Miscellaneous | 472 | |
Total expenses before reductions | 689,776 | |
Expense reductions | (164,997) | 524,779 |
Net investment income (loss) | | (154,031) |
Realized and Unrealized Gain (Loss) Net realized gain (loss) on: | | |
Investment securities | 62,450 | |
Foreign currency transactions | 3,097 | |
Futures contracts | 68,161 | |
Total net realized gain (loss) | | 133,708 |
Change in net unrealized appreciation (depreciation) on: Investment securities | 5,632,591 | |
Assets and liabilities in foreign currencies | (449) | |
Futures contracts | 24,433 | |
Total change in net unrealized appreciation (depreciation) | | 5,656,575 |
Net gain (loss) | | 5,790,283 |
Net increase (decrease) in net assets resulting from operations | | $ 5,636,252 |
See accompanying notes which are an integral part of the financial statements.
Annual Report
Financial Statements - continued
Statement of Changes in Net Assets
| Year ended
October 31,
2003 | Year ended
October 31,
2002 |
Increase (Decrease) in Net Assets | | |
Operations | | |
Net investment income (loss) | $ (154,031) | $ (215,199) |
Net realized gain (loss) | 133,708 | (2,446,716) |
Change in net unrealized appreciation (depreciation) | 5,656,575 | (634,363) |
Net increase (decrease) in net assets resulting
from operations | 5,636,252 | (3,296,278) |
Share transactions - net increase (decrease) | 954,173 | 6,075,998 |
Total increase (decrease) in net assets | 6,590,425 | 2,779,720 |
| | |
Net Assets | | |
Beginning of period | 23,462,163 | 20,682,443 |
End of period (including accumulated net investment loss of $32,311 and undistributed net investment income of $0, respectively) | $ 30,052,588 | $ 23,462,163 |
See accompanying notes which are an integral part of the financial statements.
Annual Report
Financial Highlights - Class A
Years ended October 31, | 2003 | 2002 | 2001 | 2000 | 1999 H |
Selected Per-Share Data | | | | | |
Net asset value, beginning of period | $ 8.62 | $ 9.76 | $ 12.62 | $ 11.79 | $ 10.00 |
Income from Investment Operations | | | | | |
Net investment income (loss) E | (.02) | (.05) | (.02) G | (.04) F | (.04) |
Net realized and unrealized gain (loss) | 2.13 | (1.09) | (2.84) | 1.13 | 1.83 |
Total from investment operations | 2.11 | (1.14) | (2.86) | 1.09 | 1.79 |
Distributions from net realized gain | - | - | - | (.20) | - |
Distributions in excess of net
realized gain | - | - | - | (.06) | - |
Total distributions | - | - | - | (.26) | - |
Net asset value, end of period | $ 10.73 | $ 8.62 | $ 9.76 | $ 12.62 | $ 11.79 |
Total Return B,C,D | 24.48% | (11.68)% | (22.66)% | 9.28% | 17.90% |
Ratios to Average Net Assets I | | | | | |
Expenses before expense
reductions | 2.25% | 2.38% | 2.40% | 2.32% | 4.39% A |
Expenses net of voluntary
waivers, if any | 1.76% | 1.94% | 2.00% | 2.00% | 2.00% A |
Expenses net of all reductions | 1.73% | 1.92% | 1.96% | 1.99% | 1.99% A |
Net investment income (loss) | (.27)% | (.57)% | (.17)% | (.33)% | (.47)%A |
Supplemental Data | | | | | |
Net assets, end of period
(000 omitted) | $ 4,436 | $ 3,343 | $ 3,516 | $ 2,868 | $ 1,853 |
Portfolio turnover rate | 53% | 76% | 141% | 106% | 69% A |
A Annualized
B Total returns for periods of less than one year are not annualized.
C Total returns would have been lower had certain expenses not been reduced during the periods shown.
D Total returns do not include the effect of the sales charges.
E Calculated based on average shares outstanding during the period.
F Investment income per share reflects a special dividend which amounted to $.03 per share.
G Investment income per share reflects a special dividend which amounted to $.04 per share.
H For the period December 17, 1998 (commencement of operations) to October 31, 1999.
I Expense ratios reflect operating expenses of the class. Expenses before reductions do not reflect amounts reimbursed by the investment adviser or reductions from brokerage service arrangements or other expense offset arrangements and do not represent the amount paid by the class during periods when reimbursements or reductions occur. Expense ratios before reductions for start-up periods may not be representative of longer-term operating periods. Expenses net of any voluntary waivers reflect expenses after reimbursement by the investment adviser but prior to reductions from brokerage service arrangements or other expense offset arrangements. Expenses net of all reductions represent the net expenses paid by the class.
See accompanying notes which are an integral part of the financial statements.
Annual Report
Financial Highlights - Class T
Years ended October 31, | 2003 | 2002 | 2001 | 2000 | 1999 H |
Selected Per-Share Data | | | | | |
Net asset value, beginning of period | $ 8.54 | $ 9.70 | $ 12.60 | $ 11.77 | $ 10.00 |
Income from Investment Operations | | | | | |
Net investment income (loss) E | (.05) | (.08) | (.05) G | (.08) F | (.07) |
Net realized and unrealized gain (loss) | 2.12 | (1.08) | (2.85) | 1.15 | 1.84 |
Total from investment operations | 2.07 | (1.16) | (2.90) | 1.07 | 1.77 |
Distributions from net realized gain | - | - | - | (.18) | - |
Distributions in excess of net
realized gain | - | - | - | (.06) | - |
Total distributions | - | - | - | (.24) | - |
Net asset value, end of period | $ 10.61 | $ 8.54 | $ 9.70 | $ 12.60 | $ 11.77 |
Total Return B,C,D | 24.24% | (11.96)% | (23.02)% | 9.12% | 17.70% |
Ratios to Average Net Assets I | | | | | |
Expenses before expense
reductions | 2.65% | 2.85% | 2.88% | 2.70% | 4.70% A |
Expenses net of voluntary
waivers, if any | 2.01% | 2.19% | 2.25% | 2.25% | 2.25% A |
Expenses net of all reductions | 1.98% | 2.16% | 2.21% | 2.24% | 2.24% A |
Net investment income (loss) | (.52)% | (.81)% | (.42)% | (.58)% | (.72)%A |
Supplemental Data | | | | | |
Net assets, end of period
(000 omitted) | $ 17,334 | $ 12,496 | $ 7,642 | $ 8,019 | $ 3,204 |
Portfolio turnover rate | 53% | 76% | 141% | 106% | 69% A |
A Annualized
B Total returns for periods of less than one year are not annualized.
C Total returns would have been lower had certain expenses not been reduced during the periods shown.
D Total returns do not include the effect of the sales charges.
E Calculated based on average shares outstanding during the period.
F Investment income per share reflects a special dividend which amounted to $.03 per share.
G Investment income per share reflects a special dividend which amounted to $.04 per share.
H For the period December 17, 1998 (commencement of operations) to October 31, 1999.
I Expense ratios reflect operating expenses of the class. Expenses before reductions do not reflect amounts reimbursed by the investment adviser or reductions from brokerage service arrangements or other expense offset arrangements and do not represent the amount paid by the class during periods when reimbursements or reductions occur. Expense ratios before reductions for start-up periods may not be representative of longer-term operating periods. Expenses net of any voluntary waivers reflect expenses after reimbursement by the investment adviser but prior to reductions from brokerage service arrangements or other expense offset arrangements. Expenses net of all reductions represent the net expenses paid by the class.
See accompanying notes which are an integral part of the financial statements.
Annual Report
Financial Highlights - Class B
Years ended October 31, | 2003 | 2002 | 2001 | 2000 | 1999H |
Selected Per-Share Data | | | | | |
Net asset value, beginning of period | $ 8.38 | $ 9.56 | $ 12.48 | $ 11.71 | $ 10.00 |
Income from Investment Operations | | | | | |
Net investment income (loss)E | (.09) | (.12) | (.10)G | (.14)F | (.12) |
Net realized and unrealized gain (loss) | 2.07 | (1.06) | (2.82) | 1.14 | 1.83 |
Total from investment operations | 1.98 | (1.18) | (2.92) | 1.00 | 1.71 |
Distributions from net realized gain | - | - | - | (.17) | - |
Distributions in excess of net
realized gain | - | - | - | (.06) | - |
Total distributions | - | - | - | (.23) | - |
Net asset value, end of period | $ 10.36 | $ 8.38 | $ 9.56 | $ 12.48 | $ 11.71 |
Total ReturnB,C,D | 23.63% | (12.34)% | (23.40)% | 8.56% | 17.10% |
Ratios to Average Net AssetsI | | | | | |
Expenses before expense
reductions | 3.25% | 3.36% | 3.30% | 3.24% | 5.19%A |
Expenses net of voluntary
waivers, if any | 2.50% | 2.69% | 2.75% | 2.75% | 2.75%A |
Expenses net of all reductions | 2.47% | 2.66% | 2.71% | 2.74% | 2.74%A |
Net investment income (loss) | (1.01)% | (1.31)% | (.92)% | (1.08)% | (1.22)%A |
Supplemental Data | | | | | |
Net assets, end of period
(000 omitted) | $ 4,918 | $ 3,848 | $ 4,865 | $ 5,187 | $ 2,268 |
Portfolio turnover rate | 53% | 76% | 141% | 106% | 69%A |
A Annualized
B Total returns for periods of less than one year are not annualized.
C Total returns would have been lower had certain expenses not been reduced during the periods shown.
D Total returns do not include the effect of the contingent deferred sales charge.
E Calculated based on average shares outstanding during the period.
F Investment income per share reflects a special dividend which amounted to $.03 per share.
G Investment income per share reflects a special dividend which amounted to $.04 per share.
H For the period December 17, 1998 (commencement of operations) to October 31, 1999.
I Expense ratios reflect operating expenses of the class. Expenses before reductions do not reflect amounts reimbursed by the investment adviser or reductions from brokerage service arrangements or other expense offset arrangements and do not represent the amount paid by the class during periods when reimbursements or reductions occur. Expense ratios before reductions for start-up periods may not be representative of longer-term operating periods. Expenses net of any voluntary waivers reflect expenses after reimbursement by the investment adviser but prior to reductions from brokerage service arrangements or other expense offset arrangements. Expenses net of all reductions represent the net expenses paid by the class.
See accompanying notes which are an integral part of the financial statements.
Annual Report
Financial Highlights - Class C
Years ended October 31, | 2003 | 2002 | 2001 | 2000 | 1999H |
Selected Per-Share Data | | | | | |
Net asset value, beginning of period | $ 8.39 | $ 9.58 | $ 12.49 | $ 11.71 | $ 10.00 |
Income from Investment Operations | | | | | |
Net investment income (loss)E | (.09) | (.12) | (.10)G | (.14)F | (.12) |
Net realized and unrealized gain (loss) | 2.08 | (1.07) | (2.81) | 1.15 | 1.83 |
Total from investment operations | 1.99 | (1.19) | (2.91) | 1.01 | 1.71 |
Distributions from net realized gain | - | - | - | (.17) | - |
Distributions in excess of net
realized gain | - | - | - | (.06) | - |
Total distributions | - | - | - | (.23) | - |
Net asset value, end of period | $ 10.38 | $ 8.39 | $ 9.58 | $ 12.49 | $ 11.71 |
Total ReturnB,C,D | 23.72% | (12.42)% | (23.30)% | 8.65% | 17.10% |
Ratios to Average Net AssetsI | | | | | |
Expenses before expense
reductions | 3.10% | 3.18% | 3.16% | 3.13% | 5.16%A |
Expenses net of voluntary
waivers, if any | 2.50% | 2.69% | 2.75% | 2.75% | 2.75%A |
Expenses net of all reductions | 2.47% | 2.66% | 2.71% | 2.74% | 2.74%A |
Net investment income (loss) | (1.01)% | (1.31)% | (.92)% | (1.08)% | (1.22)%A |
Supplemental Data | | | | | |
Net assets, end of period
(000 omitted) | $ 3,190 | $ 2,967 | $ 3,750 | $ 5,146 | $ 2,649 |
Portfolio turnover rate | 53% | 76% | 141% | 106% | 69%A |
A Annualized
B Total returns for periods of less than one year are not annualized.
C Total returns would have been lower had certain expenses not been reduced during the periods shown.
D Total returns do not include the effect of the contingent deferred sales charge.
E Calculated based on average shares outstanding during the period.
F Investment income per share reflects a special dividend which amounted to $.03 per share.
G Investment income per share reflects a special dividend which amounted to $.04 per share.
H For the period December 17, 1998 (commencement of operations) to October 31, 1999.
I Expense ratios reflect operating expenses of the class. Expenses before reductions do not reflect amounts reimbursed by the investment adviser or reductions from brokerage service arrangements or other expense offset arrangements and do not represent the amount paid by the class during periods when reimbursements or reductions occur. Expense ratios before reductions for start-up periods may not be representative of longer-term operating periods. Expenses net of any voluntary waivers reflect expenses after reimbursement by the investment adviser but prior to reductions from brokerage service arrangements or other expense offset arrangements. Expenses net of all reductions represent the net expenses paid by the class.
See accompanying notes which are an integral part of the financial statements.
Annual Report
Financial Highlights - Institutional Class
Years ended October 31, | 2003 | 2002 | 2001 | 2000 | 1999G |
Selected Per-Share Data | | | | | |
Net asset value, beginning of period | $ 8.68 | $ 9.81 | $ 12.68 | $ 11.81 | $ 10.00 |
Income from Investment Operations | | | | | |
Net investment income (loss)D | -I | (.03) | .01F | (.01)E | (.02) |
Net realized and unrealized gain (loss) | 2.20 | (1.10) | (2.88) | 1.16 | 1.83 |
Total from investment operations | 2.20 | (1.13) | (2.87) | 1.15 | 1.81 |
Distributions from net realized gain | - | - | - | (.21) | - |
Distributions in excess of net
realized gain | - | - | - | (.07) | - |
Total distributions | - | - | - | (.28) | - |
Net asset value, end of period | $ 10.88 | $ 8.68 | $ 9.81 | $ 12.68 | $ 11.81 |
Total ReturnB,C | 25.35% | (11.52)% | (22.63)% | 9.79% | 18.10% |
Ratios to Average Net AssetsH | | | | | |
Expenses before expense
reductions | 1.87% | 1.95% | 2.02% | 2.06% | 4.10%A |
Expenses net of voluntary
waivers, if any | 1.50% | 1.70% | 1.75% | 1.75% | 1.75%A |
Expenses net of all reductions | 1.48% | 1.67% | 1.71% | 1.74% | 1.74%A |
Net investment income (loss) | (.01)% | (.32)% | .08% | (.08)% | (.22)%A |
Supplemental Data | | | | | |
Net assets, end of period
(000 omitted) | $ 175 | $ 808 | $ 909 | $ 1,256 | $ 1,182 |
Portfolio turnover rate | 53% | 76% | 141% | 106% | 69%A |
A Annualized
B Total returns for periods of less than one year are not annualized.
C Total returns would have been lower had certain expenses not been reduced during the periods shown.
D Calculated based on average shares outstanding during the period.
E Investment income per share reflects a special dividend which amounted to $.03 per share.
F Investment income per share reflects a special dividend which amounted to $.04 per share.
G For the period December 17, 1998 (commencement of operations) to October 31, 1999.
H Expense ratios reflect operating expenses of the class. Expenses before reductions do not reflect amounts reimbursed by the investment adviser or reductions from brokerage service arrangements or other expense offset arrangements and do not represent the amount paid by the class during periods when reimbursements or reductions occur. Expense ratios before reductions for start-up periods may not be representative of longer-term operating periods. Expenses net of any voluntary waivers reflect expenses after reimbursement by the investment adviser but prior to reductions from brokerage service arrangements or other expense offset arrangements. Expenses net of all reductions represent the net expenses paid by the class.
I Amount represents less than .01 per share.
See accompanying notes which are an integral part of the financial statements.
Annual Report
Notes to Financial Statements
For the period ended October 31, 2003
1. Significant Accounting Policies.
Fidelity Advisor Global Equity Fund (the fund) is a fund of Fidelity Advisor Series VIII (the trust) and is authorized to issue an unlimited number of shares. The trust is registered under the Investment Company Act of 1940, as amended (the 1940 Act), as an open-end management investment company organized as a Massachusetts business trust.
The fund offers Class A, Class T, Class B, Class C, and Institutional Class shares, each of which has equal rights as to assets and voting privileges. Each class has exclusive voting rights with respect to matters that affect that class. Class B shares will automatically convert to Class A shares after a holding period of seven years from the initial date of purchase. Investment income, realized and unrealized capital gains and losses, the common expenses of the fund, and certain fund-level expense reductions, if any, are allocated on a pro rata basis to each class based on the relative net assets of each class to the total net assets of the fund. Each class differs with respect to transfer agent and distribution and service plan fees incurred. Certain expense reductions also differ by class.
The financial statements have been prepared in conformity with accounting principles generally accepted in the United States of America, which require management to make certain estimates and assumptions at the date of the financial statements. The following summarizes the significant accounting policies of the fund:
Security Valuation. Net asset value per share (NAV calculation) is calculated as of the close of business of the New York Stock Exchange, normally 4:00 p.m. Eastern time. Equity securities for which market quotations are available are valued at the last sale price or official closing price (closing bid price or last evaluated quote if no sale has occurred) on the primary market or exchange on which they trade. If an event that is expected to materially affect the value of a security occurs after the close of an exchange or market on which that security trades, but prior to the NAV calculation, then that security will be fair valued taking the event into account. Securities (including restricted securities) for which market quotations are not readily available are valued at their fair value as determined in good faith under consistently applied procedures under the general supervision of the Board of Trustees. Price movements in futures contracts and ADRs, market and trading trends, the bid/ask quotes of brokers and off-exchange institutional trading may be reviewed in the course of making a good faith determination of a security's fair value. Short-term securities with remaining maturities of sixty days or less for which quotations are not readily available are valued on the basis of amortized cost. Investments in open-end investment companies are valued at their net asset value each business day.
Annual Report
Notes to Financial Statements - continued
1. Significant Accounting Policies - continued
Foreign Currency. The fund uses foreign currency contracts to facilitate transactions in foreign-denominated securities. Losses from these transactions may arise from changes in the value of the foreign currency or if the counterparties do not perform under the contracts' terms.
Foreign denominated assets, including investment securities, and liabilities are translated into U.S. dollars at the exchange rate at period end. Purchases and sales of investment securities, income and dividends received and expenses denominated in foreign currencies are translated into U.S. dollars at the exchange rate in effect on the transaction date.
The effects of exchange rate fluctuations on investments are included with the net realized and unrealized gain (loss) on investment securities. Other foreign currency transactions resulting in realized and unrealized gain (loss) are disclosed separately.
Investment Transactions and Income. Security transactions are accounted for as of trade date. Gains and losses on securities sold are determined on the basis of identified cost. Dividend income is recorded on the ex-dividend date, except for certain dividends from foreign securities where the ex-dividend date may have passed, which are recorded as soon as the fund is informed of the ex-dividend date. Non-cash dividends included in dividend income, if any, are recorded at the fair market value of the securities received. Interest income is accrued as earned. Interest income includes coupon interest and amortization of premium and accretion of discount on debt securities, which is accrued using the interest method. Investment income is recorded net of foreign taxes withheld where recovery of such taxes is uncertain.
Expenses. Most expenses of the trust can be directly attributed to a fund. Expenses which cannot be directly attributed are apportioned among the funds in the trust.
Income Tax Information and Distributions to Shareholders. Each year the fund intends to qualify as a regulated investment company by distributing all of its taxable income and realized gains under Subchapter M of the Internal Revenue Code. As a result, no provision for income taxes is required in the accompanying financial statements. Foreign taxes are provided for based on the fund's understanding of the tax rules and rates that exist in the foreign markets in which it invests. Income dividends and capital gain distributions are declared separately for each class. Distributions are recorded on the ex-dividend date.
Income and capital gain distributions are determined in accordance with income tax regulations, which may differ from generally accepted accounting principles. Capital accounts within the financial statements are adjusted for permanent and temporary book and tax differences. These adjustments have no impact on net assets or the results of operations. Temporary differences will reverse in a subsequent period. These
Annual Report
1. Significant Accounting Policies - continued
Income Tax and Distributions to Shareholders - continued
differences are primarily due to futures transactions, foreign currency transactions, passive foreign investment companies (PFIC), non-taxable dividends, net operating losses, capital loss carryforwards and losses deferred due to wash sales.
The tax-basis components of distributable earnings and the federal tax cost as of period end were as follows:
Unrealized appreciation | $ 4,701,150 | | |
Unrealized depreciation | (1,678,778) | |
Net unrealized appreciation (depreciation) | 3,022,372 | |
Capital loss carryforward | (4,995,615) | |
| | |
Cost for federal income tax purposes | $ 27,146,700 | |
Short-Term Trading (Redemption) Fees. Shares purchased after March 31, 2004 and held in the fund less than 30 days will be subject to a short-term trading fee equal to 1.00% of the proceeds of the redeemed shares. The fee, which will be retained by the fund, is accounted for as an addition to paid in capital.
2. Operating Policies.
Repurchase Agreements. Fidelity Management & Research Company (FMR) has received an Exemptive Order from the Securities and Exchange Commission (the SEC) which permits the fund and other affiliated entities of FMR to transfer uninvested cash balances into joint trading accounts. These accounts are then invested in repurchase agreements that are collateralized by U.S. Treasury or Government obligations. The fund may also invest directly with institutions, in repurchase agreements that are collateralized by commercial paper obligations and corporate obligations. Collateral is held in segregated accounts with custodian banks and may be obtained in the event of a default of the counterparty. Collateral is marked-to-market daily and maintained at a value at least equal to the principal amount of the repurchase agreement (including accrued interest).
Futures Contracts. The fund may use futures contracts to manage its exposure to the stock market. Buying futures tends to increase the fund's exposure to the underlying instrument, while selling futures tends to decrease the fund's exposure to the underlying instrument or hedge other fund investments. Futures contracts involve, to varying degrees, risk of loss in excess of any futures variation margin reflected in the Statement of Assets and Liabilities. The underlying face amount at value of any open futures contracts at period end is shown in the Schedule of Investments under the caption
Annual Report
Notes to Financial Statements - continued
2. Operating Policies - continued
Futures Contracts - continued
Futures Contracts. This amount reflects each contract's exposure to the underlying instrument at period end. Losses may arise from changes in the value of the underlying instruments or if the counter-parties do not perform under the contracts' terms. Gains (losses) are realized upon the expiration or closing of the futures contracts. Futures contracts are valued at the settlement price established each day by the board of trade or exchange on which they are traded.
3. Purchases and Sales of Investments.
Information regarding purchases and sales of securities is included under the caption "Other Information" at the end of the fund's Schedule of Investments.
4. Fees and Other Transactions with Affiliates.
Management Fee. FMR and its affiliates provide the fund with investment management related services for which the fund pays a monthly management fee. The management fee is the sum of an individual fund fee rate that is based on an annual rate of .45% of the fund's average net assets and a group fee rate that averaged .28% during the period. The group fee rate is based upon the average net assets of all the mutual funds advised by FMR. The group fee rate decreases as assets under management increase and increases as assets under management decrease. For the period, the total annual management fee rate was .73% of the fund's average net assets.
Distribution and Service Plan. In accordance with Rule 12b-1 of the 1940 Act, the Fund has adopted separate Distribution and Service Plans for each class of shares, except for the Institutional Class. Certain classes pay Fidelity Distributors Corporation (FDC), an affiliate of FMR, separate Distribution and Service Fees, each of which is based on an annual percentage of each class' average net assets. Class A and Class T Plans also authorize the use of brokerage commissions to pay distribution expenses. This practice has been discontinued and no commissions incurred after June 30, 2003 have been used to pay distribution expenses. In addition, FDC may pay financial intermediaries for selling shares of the fund and providing shareholder support services. For the period, the Distribution and Service Fee rates, the total amounts paid to and retained by FDC and the amount of distribution expenses paid with brokerage commissions were as follows:
| Distribution
Fee | Service
Fee | Paid to
FDC | Retained
by FDC | Paid with
Commissions |
Class A | .01% | .25% | $ 9,743 | $ 858 | $ 416 |
Class T | .26% | .25% | 71,921 | - | 1,556 |
Class B | .75% | .25% | 41,322 | 30,991 | |
Class C | .75% | .25% | 28,766 | 4,078 |
|
| | | $ 151,752 | $ 35,927 | $ 1,972 |
4. Fees and Other Transactions with Affiliates - continued
Sales Load. FDC receives a front-end sales charge of up to 5.75% for selling Class A shares, and 3.50% for selling Class T shares of the fund. FDC receives the proceeds of contingent deferred sales charges levied on Class A, Class T, Class B, and Class C redemptions. These charges depend on the holding period. The deferred sales charges range from 5% to 1% for Class B, 1% for Class C, and .25% for certain purchases of Class A and Class T shares.
For the period, sales charge amounts retained by FDC were as follows:
| Retained
by FDC | |
Class A | $ 3,533 | |
Class T | 3,770 | |
Class B* | 12,036 | |
Class C* | 937 | |
| $ 20,276 | |
* When Class B and Class C shares are initially sold, FDC pays commissions from its own resources to financial intermediaries through which the sales are made.
Transfer Agent Fees. Fidelity Investments Institutional Operations Company, Inc. (FIIOC), an affiliate of FMR, is the transfer, dividend disbursing and shareholder servicing agent (collectively referred to as the transfer agent) for each class of the fund. FIIOC receives account fees and asset-based fees that vary according to the account size and type of account of the shareholders of the respective classes of the fund. FIIOC pays for typesetting, printing and mailing of all shareholder reports, except proxy statements. For the period, the following amounts were paid to FIIOC:
| Amount | % of
Average
Net Assets |
Class A | $ 14,018 | .37 |
Class T | 74,238 | .53 |
Class B | 26,305 | .63 |
Class C | 13,939 | .48 |
Institutional Class | 1,073 | .26 |
| $ 129,573 | |
Annual Report
Notes to Financial Statements - continued
Accounting Fees. Fidelity Service Company, Inc. (FSC), an affiliate of FMR, maintains the fund's accounting records. The fee is based on the level of average net assets for the month plus out-of-pocket expenses.
Annual Report
4. Fees and Other Transactions with Affiliates - continued
Central Funds. The fund may invest in affiliated Central Funds managed by Fidelity Investments Money Management, Inc. (FIMM), an affiliate of FMR. The Central Funds are open-end investment companies available only to investment companies and other accounts managed by FMR and its affiliates. The Central Funds seek preservation of capital and current income and do not pay a management fee. Income distributions earned by the fund are recorded as income in the accompanying financial statements and totaled $14,555 for the period.
Brokerage Commissions. The fund placed a portion of its portfolio transactions with brokerage firms which are affiliates of the investment adviser. The commissions paid to these affiliated firms are shown under the caption "Other Information" at the end of the fund's Schedule of Investments.
5. Committed Line of Credit.
The fund participates with other funds managed by FMR in a $3.5 billion credit facility (the "line of credit") to be utilized for temporary or emergency purposes to fund shareholder redemptions or for other short-term liquidity purposes. The fund has agreed to pay commitment fees on its pro rata portion of the line of credit. During the period, there were no borrowings on this line of credit.
6. Expense Reductions.
FMR agreed to reimburse the classes of the fund to the extent operating expenses exceeded certain levels of average net assets as noted in the table below. Some expenses, for example interest expense, are excluded from this reimbursement.
| Expense
Limitations | Reimbursement
from adviser |
Class A | 1.75% | $ 18,308 |
Class T | 2.00% | 90,342 |
Class B | 2.50% | 30,986 |
Class C | 2.50% | 17,237 |
Institutional Class | 1.50% | 1,537 |
| | $ 158,410 |
Many of the brokers with whom FMR places trades on behalf of the fund provided services to the fund in addition to trade execution. These services may include payments of expenses on behalf of the fund to support distribution of fund shares for Class A and Class T ("Distribution Expense Reduction") and to pay other fund expenses, such as transfer agent fees ("Other Expense Reduction") collectively referred to as "Brokerage Service Arrangements" in the accompanying table. Brokerage service arrangements
Annual Report
Notes to Financial Statements - continued
6. Expense Reductions - continued
Annual Report
generally benefits all shareholders of each class by reducing fund expenses. Each of Class A and Class T shareholders' Other Expense Reduction benefit is reduced by the amount of any Distribution Expense Reduction. All of the applicable expense reductions are noted in the table below.
| Brokerage Service Arrangements |
| Distribution expense
reduction | Other expense
reduction |
Fund Level | $ - | $ 4,615 |
Class A | 416 | - |
Class T | 1,556 | - |
| $ 1,972 | $ 4,615 |
7. Other Information.
At the end of the period, one unaffiliated shareholder was the owner of record of 16% of the total outstanding shares of the fund.
8. Share Transactions.
Transactions for each class of shares were as follows:
| Shares
Years ended October 31, | Dollars
Years ended October 31, |
| 2003 | 2002 | 2003 | 2002 |
Class A | | | | |
Shares sold | 136,246 | 120,119 | $ 1,270,282 | $ 1,181,117 |
Shares redeemed | (110,997) | (92,414) | (1,047,311) | (899,451) |
Net increase (decrease) | 25,249 | 27,705 | $ 222,971 | $ 281,666 |
Class T | | | | |
Shares sold | 589,459 | 1,004,408 | $ 5,360,716 | $ 9,714,971 |
Shares redeemed | (419,255) | (329,227) | (3,739,570) | (3,121,953) |
Net increase (decrease) | 170,204 | 675,181 | $ 1,621,146 | $ 6,593,018 |
Class B | | | | |
Shares sold | 101,806 | 109,175 | $ 919,391 | $ 1,054,797 |
Shares redeemed | (86,440) | (158,673) | (766,624) | (1,521,443) |
Net increase (decrease) | 15,366 | (49,498) | $ 152,767 | $ (466,646) |
Class C | | | | |
Shares sold | 46,725 | 97,361 | $ 426,595 | $ 951,823 |
Shares redeemed | (92,865) | (135,352) | (817,236) | (1,300,309) |
Net increase (decrease) | (46,140) | (37,991) | $ (390,641) | $ (348,486) |
Institutional Class | | | | |
Shares sold | 28,067 | 18,329 | $ 247,062 | $ 181,469 |
Shares redeemed | (105,018) | (17,921) | (899,132) | (165,023) |
Net increase (decrease) | (76,951) | 408 | $ (652,070) | $ 16,446 |
Annual Report
Report of Independent Auditors
To the Trustees of Fidelity Advisor Series VIII and the Shareholders of Fidelity Advisor Global Equity Fund.
In our opinion, the accompanying statement of assets and liabilities, including the schedule of investments, and the related statements of operations and of changes in net assets and the financial highlights present fairly, in all material respects, the financial position of Fidelity Advisor Global Equity Fund (a fund of Fidelity Advisor Series VIII) at October 31, 2003 and the results of its operations, the changes in its net assets and the financial highlights for the periods indicated, in conformity with accounting principles generally accepted in the United States of America. These financial statements and financial highlights (hereafter referred to as "financial statements") are the responsibility of the Fidelity Advisor Global Equity Fund's management; our responsibility is to express an opinion on these financial statements based on our audits. We conducted our audits of these financial statements in accordance with auditing standards generally accepted in the United States of America which require that we plan and perform the audit to obtain reasonable assurance about whether the financial statements are free of material misstatement. An audit includes examining, on a test basis, evidence supporting the amounts and disclosures in the financial statements, assessing the accounting principles used and significant estimates made by management, and evaluating the overall financial statement presentation. We believe that our audits, which included confirmation of securities at October 31, 2003 by correspondence with the custodian and brokers, provide a reasonable basis for our opinion.
/s/PricewaterhouseCoopers LLP
PricewaterhouseCoopers LLP
Boston, Massachusetts
December 12, 2003
Annual Report
Trustees and Officers
The Trustees, Members of the Advisory Board, and executive officers of the trust and fund, as applicable, are listed below. The Board of Trustees governs the fund and is responsible for protecting the interests of shareholders. The Trustees are experienced executives who meet periodically throughout the year to oversee the fund's activities, review contractual arrangements with companies that provide services to the fund, and review the fund's performance. Except for William O. McCoy, each of the Trustees oversees 289 funds advised by FMR or an affiliate. Mr. McCoy oversees 291 funds advised by FMR or an affiliate.
The Trustees hold office without limit in time except that (a) any Trustee may resign; (b) any Trustee may be removed by written instrument, signed by at least two-thirds of the number of Trustees prior to such removal; (c) any Trustee who requests to be retired or who has become incapacitated by illness or injury may be retired by written instrument signed by a majority of the other Trustees; and (d) any Trustee may be removed at any special meeting of shareholders by a two-thirds vote of the outstanding voting securities of the trust. In any event, each non-interested Trustee shall retire not later than the last day of the calendar year in which his or her 72nd birthday occurs. The executive officers and Advisory Board Members hold office without limit in time, except that any officer and Advisory Board Member may resign or may be removed by a vote of a majority of the Trustees at any regular meeting or any special meeting of the Trustees. Except as indicated, each individual has held the office shown or other offices in the same company for the past five years.
The fund's Statement of Additional Information (SAI) includes more information about the Trustees. To request a free copy, call Fidelity at 1-877-208-0098.
Interested Trustees*:
Correspondence intended for each Trustee who is an "interested person" (as defined in the 1940 Act) may be sent to 82 Devonshire Street, Boston, Massachusetts 02109.
Name, Age; Principal Occupation |
Edward C. Johnson 3d (73)** |
| Year of Election or Appointment: 1983 Mr. Johnson is Chairman of the Board of Trustees. Mr. Johnson serves as Chief Executive Officer, Chairman, and a Director of FMR Corp.; a Director and Chairman of the Board and of the Executive Committee of FMR; Chairman and a Director of Fidelity Management & Research (Far East) Inc.; Chairman (1998) and a Director of Fidelity Investments Money Management, Inc.; and Chairman (2001) and a Director (2000) of FMR Co., Inc. |
Abigail P. Johnson (41)** |
| Year of Election or Appointment: 2001 Senior Vice President of Advisor Global Equity (2001). Ms. Johnson also serves as Senior Vice President of other Fidelity funds (2001). She is President and a Director of FMR (2001), Fidelity Investments Money Management, Inc. (2001), FMR Co., Inc. (2001), and a Director of FMR Corp. Previously, Ms. Johnson managed a number of Fidelity funds. |
Laura B. Cronin (49) |
| Year of Election or Appointment: 2003 Ms. Cronin is an Executive Vice President (2002) and Chief Financial Officer (2002) of FMR Corp. and is a member of the Fidelity Management Committee (2003). Previously, Ms. Cronin served as Vice President of Finance of FMR (1997-1999), and Chief Financial Officer of FMR (1999-2001), Fidelity Personal Investments (2001), and Fidelity Brokerage Company (2001-2002). |
Robert L. Reynolds (51) |
| Year of Election or Appointment: 2003 Mr. Reynolds is a Director (2003) and Chief Operating Officer (2002) of FMR Corp. and is the head of the Fidelity Management Committee (2003). He also serves on the Board at Fidelity Investments Canada, Ltd. (2000). Previously, Mr. Reynolds served as President of Fidelity Investments Institutional Retirement Group (1996-2000). |
* Trustees have been determined to be "Interested Trustees" by virtue of, among other things, their affiliation with the trust or various entities under common control with FMR.
** Edward C. Johnson 3d, Trustee, is Abigail P. Johnson's father.
Annual Report
Non-Interested Trustees:
Correspondence intended for each non-interested Trustee (that is, the Trustees other than the Interested Trustees) may be sent to Fidelity Investments, P.O. Box 55235, Boston, Massachusetts 02205-5235.
Name, Age; Principal Occupation |
J. Michael Cook (61) |
| Year of Election or Appointment: 2001 Prior to Mr. Cook's retirement in May 1999, he served as Chairman and Chief Executive Officer of Deloitte & Touche LLP (accounting/consulting), Chairman of the Deloitte & Touche Foundation, and a member of the Board of Deloitte Touche Tohmatsu. He currently serves as a Director of Comcast (telecommunications, 2002), International Flavors & Fragrances, Inc. (2000), Rockwell Automation (2000) and The Dow Chemical Company (2000). He is a Member of the Diversity Advisory Council of Marakon (2003) and the Advisory Board of the Directorship Search Group, Chairman Emeritus of the Board of Catalyst (a leading organization for the advancement of women in business), and is Chairman of the Accountability Advisory Council to the Comptroller General of the United States. He also serves as a Member of the Advisory Board of the Graduate School of Business of the University of Florida, his alma mater. |
Ralph F. Cox (71) |
| Year of Election or Appointment: 1991 Mr. Cox is President of RABAR Enterprises (management consulting for the petroleum industry). Prior to February 1994, he was President of Greenhill Petroleum Corporation (petroleum exploration and production). Until March 1990, Mr. Cox was President and Chief Operating Officer of Union Pacific Resources Company (exploration and production). He is a Director of CH2M Hill Companies (engineering), and Abraxas Petroleum (petroleum exploration and production, 1999). In addition, he is a member of advisory boards of Texas A&M University and the University of Texas at Austin. |
Phyllis Burke Davis (71) |
| Year of Election or Appointment: 1992 Mrs. Davis is retired from Avon Products, Inc. (consumer products) where she held various positions including Senior Vice President of Corporate Affairs and Group Vice President of U.S. product marketing, sales, distribution, and manufacturing. Mrs. Davis is a member of the Board of Directors of the Southampton Hospital in Southampton, N.Y. (1998). Previously, she served as a Director of BellSouth Corporation (telecommunications), Eaton Corporation (diversified industrial), the TJX Companies, Inc. (retail stores), Hallmark Cards, Inc., and Nabisco Brands, Inc. |
Robert M. Gates (60) |
| Year of Election or Appointment: 1997 Dr. Gates is President of Texas A&M University (2002). He was Director of the Central Intelligence Agency (CIA) from 1991 to 1993. From 1989 to 1991, Dr. Gates served as Assistant to the President of the United States and Deputy National Security Advisor. Dr. Gates is a Director of NACCO Industries, Inc. (mining and manufacturing), and Parker Drilling Co., Inc. (drilling and rental tools for the energy industry, 2001). He also serves as a member of the Advisory Board of VoteHere.net (secure internet voting, 2001). Previously, Dr. Gates served as a Director of LucasVarity PLC (automotive components and diesel engines), a Director of TRW Inc. (automotive, space, defense, and information technology), and Dean of the George Bush School of Government and Public Service at Texas A&M University (1999-2001). Dr. Gates also is a Trustee of the Forum for International Policy. |
Donald J. Kirk (70) |
| Year of Election or Appointment: 1987 Mr. Kirk is a Governor of the American Stock Exchange (2001), a Trustee and former Chairman of the Board of Trustees of the Greenwich Hospital Association, a Director of the Yale-New Haven Health Services Corp. (1998), and a Director Emeritus and former Chairman of the Board of Directors of National Arts Strategies Inc. Mr. Kirk was an Executive-in-Residence (1995-2000) and a Professor (1987-1995) at Columbia University Graduate School of Business. Prior to 1987, he was Chairman of the Financial Accounting Standards Board. Previously, Mr. Kirk served as a Governor of the National Association of Securities Dealers, Inc. (1996-2002), a member and Vice Chairman of the Public Oversight Board of the American Institute of Certified Public Accountants' SEC Practice Section (1995-2002), a Director of General Re Corporation (reinsurance, 1987-1998) and as a Director of Valuation Research Corp. (appraisals and valuations). |
Marie L. Knowles (57) |
| Year of Election or Appointment: 2001 Prior to Ms. Knowles' retirement in June 2000, she served as Executive Vice President and Chief Financial Officer of Atlantic Richfield Company (ARCO) (diversified energy, 1996-2000). From 1993 to 1996, she was a Senior Vice President of ARCO and President of ARCO Transportation Company. She served as a Director of ARCO from 1996 to 1998. She currently serves as a Director of Phelps Dodge Corporation (copper mining and manufacturing), URS Corporation (multidisciplinary engineering, 1999), and McKesson Corporation (healthcare service, 2002). Ms. Knowles is a Trustee of the Brookings Institution and the Catalina Island Conservancy and also serves as a member of the Advisory Board for the School of Engineering of the University of Southern California. |
Ned C. Lautenbach (59) |
| Year of Election or Appointment: 2000 Mr. Lautenbach has been a partner of Clayton, Dubilier & Rice, Inc. (private equity investment firm) since September 1998. Previously, Mr. Lautenbach was with the International Business Machines Corporation (IBM) from 1968 until his retirement in 1998. He was most recently Senior Vice President and Group Executive of Worldwide Sales and Services. From 1993 to 1995, he was Chairman of IBM World Trade Corporation, and from 1994 to 1998 was a member of IBM's Corporate Executive Committee. Mr. Lautenbach serves as Chairman and as a Director (1998) of Acterna Corporation (communications test equipment). He is also Co-Chairman of Covansys, Inc. (global provider of business and technology solutions, 2000). In addition, he is a Director of Eaton Corporation (diversified industrial) and the Philharmonic Center for the Arts in Naples, Florida (1999). He also is a member of the Council on Foreign Relations. |
Marvin L. Mann (70) |
| Year of Election or Appointment: 1993 Mr. Mann is Chairman of the non-interested Trustees (2001). He is Chairman Emeritus of Lexmark International, Inc. (computer peripherals) where he served as CEO until April 1998 and retired as Chairman May 1999, and remains a member of the Board. Prior to 1991, he held the positions of Vice President of International Business Machines Corporation (IBM) and President and General Manager of various IBM divisions and subsidiaries. Mr. Mann is a Board member of Imation Corp. (imaging and information storage) and Acterna Corporation (communications test equipment, 1999). He is also a member of the Director Services Committee of the Investment Company Institute. In addition, Mr. Mann is a member of the President's Cabinet at the University of Alabama and the Board of Visitors of the Culverhouse College of Commerce and Business Administration at the University of Alabama. |
William O. McCoy (70) |
| Year of Election or Appointment: 1997 Prior to his retirement in December 1994, Mr. McCoy was Vice Chairman of the Board of BellSouth Corporation (telecommunications) and President of BellSouth Enterprises. He is currently a Director of Liberty Corporation (holding company), Duke Realty Corporation (real estate), Progress Energy, Inc. (electric utility), and Acterna Corporation (communications test equipment, 1999). He is also a partner of Franklin Street Partners (private investment management firm) and a member of the Research Triangle Foundation Board. In addition, Mr. McCoy served as the Interim Chancellor (1999-2000) and a member of the Board of Visitors (1994-1998) for the University of North Carolina at Chapel Hill and currently serves on the Board of Directors of the University of North Carolina Health Care System and the Board of Visitors of the Kenan-Flagler Business School (University of North Carolina at Chapel Hill). He also served as Vice President of Finance for the University of North Carolina (16-school system, 1995-1998). |
William S. Stavropoulos (64) |
| Year of Election or Appointment: 2001 Mr. Stavropoulos is Chairman of the Board, President and CEO (2002), and Chairman of the Executive Committee (2000) and a Director of The Dow Chemical Company. Since joining The Dow Chemical Company in 1967, Mr. Stavropoulos served in numerous senior management positions, including President (1993-2000) and Chief Executive Officer (1995-2000). Currently, he is a Director of NCR Corporation (data warehousing and technology solutions), BellSouth Corporation (telecommunications), Chemical Financial Corporation, and Maersk Inc. (industrial conglomerate, 2002). He also serves as a member of the Board of Trustees of the American Enterprise Institute for Public Policy Research. In addition, Mr. Stavropoulos is a member of The Business Council, J.P. Morgan International Council, World Business Council for Sustainable Development, and the University of Notre Dame Advisory Council for the College of Science. |
Annual Report
Trustees and Officers - continued
Advisory Board Members and Executive Officers:
Correspondence intended for Dr. Heilmeier may be sent to Fidelity Investments, P.O. Box 55235, Boston, Massachusetts 02205-5235. Correspondence intended for each executive officer and Mr. Lynch may be sent to 82 Devonshire Street, Boston, Massachusetts 02109.
Name, Age; Principal Occupation |
George H. Heilmeier (67) |
| Year of Election or Appointment: 2003 Member of the Advisory Board of Fidelity Advisor Series VIII. Dr. Heilmeier is Chairman Emeritus of Telcordia Technologies (communication software and systems), where prior to his retirement, he served as company Chairman and Chief Executive Officer. He currently serves on the Boards of Directors of The Mitre Corporation (systems engineering and information technology support for the government), INET Technologies Inc. (telecommunications network surveillance, 2001) and Teletech Holdings (customer management services, 1998). He is Chairman of the General Motors Technology Advisory Committee and a Life Fellow of the IEEE (2000). Dr. Heilmeier is a member of the Defense Science Board and the National Security Agency Advisory Board. He is also a member of the National Academy of Engineering, the American Academy of Arts and Sciences and The Board of Overseers of the School of Engineering and Applied Science of the University of Pennsylvania. Previously, Dr. Heilmeier served as a Director of TRW Inc. (automotive, space, defense, and information technology, 1992-2002) and Compaq (1994-2002). |
Peter S. Lynch (60) |
| Year of Election or Appointment: 2003 Member of the Advisory Board of Fidelity Advisor Series VIII. Vice Chairman and a Director of FMR, and Vice Chairman (2001) and a Director (2000) of FMR Co., Inc. Previously, Mr. Lynch served as a Trustee of the Fidelity funds (1990-2003). Prior to May 31, 1990, he was a Director of FMR and Executive Vice President of FMR (a position he held until March 31, 1991), Vice President of Fidelity® Magellan® Fund and FMR Growth Group Leader, and Managing Director of FMR Corp. Mr. Lynch was also Vice President of Fidelity Investments Corporate Services. In addition, he serves as a Trustee of Boston College, Massachusetts Eye & Ear Infirmary, Historic Deerfield, John F. Kennedy Library, and the Museum of Fine Arts of Boston. |
Philip L. Bullen (44) |
| Year of Election or Appointment: 2001 Vice President of Advisor Global Equity. Mr. Bullen also serves as Vice President of certain Equity Funds (2001) and certain High Income Funds (2001). He is Senior Vice President of FMR (2001) and FMR Co., Inc. (2001), President and a Director of Fidelity Management & Research (Far East) Inc. (2001), President and a Director of Fidelity Management & Research (U.K.) Inc. (2002), and a Director of Strategic Advisers, Inc. (2002). Before joining Fidelity Investments, Mr. Bullen was President and Chief Investment Officer of Santander Global Advisors (1997-2000) and President and Chief Executive Officer of Boston's Baring Asset Management Inc. (1994-1997). |
Richard C. Habermann (63) |
| Year of Election or Appointment: 1998 Vice President of Advisor Global Equity. Mr. Habermann is also Vice President of other funds advised by FMR. Prior to assuming his current responsibilities, Mr. Habermann managed a variety of Fidelity Funds. |
Eric D. Roiter (54) |
| Year of Election or Appointment: 1998 Secretary of Advisor Global Equity. He also serves as Secretary of other Fidelity funds (1998); Vice President, General Counsel, and Clerk of FMR Co., Inc. (2001) and FMR (1998); Vice President and Clerk of FDC (1998); Assistant Clerk of Fidelity Management & Research (U.K.) Inc. (2001) and Fidelity Management & Research (Far East) Inc. (2001); and Assistant Secretary of Fidelity Investments Money Management Inc. (2001). Prior to joining Fidelity, Mr. Roiter was with the law firm of Debevoise & Plimpton, as an associate (1981-1984) and as a partner (1985-1997), and served as an Assistant General Counsel of the U.S. Securities and Exchange Commission (1979-1981). Mr. Roiter is an Adjunct Member, Faculty of Law, at Boston College Law School (2003). |
Stuart Fross (44) |
| Year of Election or Appointment: 2003 Assistant Secretary of Advisor Global Equity. Mr. Fross also serves as Assistant Secretary of other Fidelity funds (2003) and is an employee of FMR. |
Maria F. Dwyer (44) |
| Year of Election or Appointment: 2002 President and Treasurer of Advisor Global Equity. Ms. Dwyer also serves as President and Treasurer of other Fidelity funds (2002) and is a Vice President (1999) and an employee (1996) of FMR. Prior to joining Fidelity, Ms. Dwyer served as Director of Compliance for MFS Investment Management. |
Timothy F. Hayes (52) |
| Year of Election or Appointment: 2002 Chief Financial Officer of Advisor Global Equity. Mr. Hayes also serves as Chief Financial Officer of other Fidelity funds (2002). Recently he was appointed President of Fidelity Service Company (2003) where he also serves as a Director. Mr. Hayes also serves as President of Fidelity Investments Operations Group (FIOG, 2002), which includes Fidelity Pricing and Cash Management Services Group (FPCMS), where he was appointed President in 1998. Previously, Mr. Hayes served as Chief Financial Officer of Fidelity Investments Corporate Systems and Service Group (1998) and Fidelity Systems Company (1997-1998). |
John R. Hebble (45) |
| Year of Election or Appointment: 2003 Deputy Treasurer of Advisor Global Equity. Mr. Hebble also serves as Deputy Treasurer of other Fidelity funds (2003), and is an employee of FMR. Before joining Fidelity Investments, Mr. Hebble worked at Deutsche Asset Management where he served as Director of Fund Accounting (2002-2003) and Assistant Treasurer of the Scudder Funds (1998-2003). |
John H. Costello (57) |
| Year of Election or Appointment: 1998 Assistant Treasurer of Advisor Global Equity. Mr. Costello also serves as Assistant Treasurer of other Fidelity funds and is an employee of FMR. |
Francis V. Knox, Jr. (56) |
| Year of Election or Appointment: 2002 Assistant Treasurer of Advisor Global Equity. Mr. Knox also serves as Assistant Treasurer of other Fidelity funds (2002), and is a Vice President and an employee of FMR. Previously, Mr. Knox served as Vice President of Investment & Advisor Compliance (1990-2001), and Compliance Officer of Fidelity Management & Research (U.K.) Inc. (1992-2002), Fidelity Management & Research (Far East) Inc. (1991-2002), and FMR Corp. (1995-2002). |
Mark Osterheld (48) |
| Year of Election or Appointment: 2002 Assistant Treasurer of Advisor Global Equity. Mr. Osterheld also serves as Assistant Treasurer of other Fidelity funds (2002) and is an employee of FMR. |
Thomas J. Simpson (45) |
| Year of Election or Appointment: 2000 Assistant Treasurer of Advisor Global Equity. Mr. Simpson is Assistant Treasurer of other Fidelity funds (2000) and an employee of FMR (1996). Prior to joining FMR, Mr. Simpson was Vice President and Fund Controller of Liberty Investment Services (1987-1995). |
Annual Report
Investment Adviser
Fidelity Management & Research Company
Boston, MA
Investment Sub-Advisers
FMR Co., Inc.
Fidelity Management & Research
(U.K.) Inc.
Fidelity Management & Research
(Far East) Inc.
Fidelity International
Investment Advisors
Fidelity Investments Japan Limited
Fidelity International Investment Advisors (U.K.) Limited
General Distributor
Fidelity Distributors Corporation
Boston, MA
Transfer and Shareholder
Servicing Agents
Fidelity Investments Institutional Operations Company, Inc.
Boston, MA
Custodian
State Street Bank and Trust Company
Quincy, MA
Annual Report
Fidelity Advisor Aggressive Growth Fund |
Fidelity Advisor Asset Allocation Fund |
Fidelity Advisor Balanced Fund |
Fidelity Advisor Biotechnology Fund |
Fidelity Advisor California Municipal Income Fund |
Fidelity Advisor Consumer Industries Fund |
Fidelity Advisor Cyclical Industries Fund |
Fidelity Advisor Developing Communications Fund |
Fidelity Advisor Diversified International Fund |
Fidelity Advisor Dividend Growth Fund |
Fidelity Advisor Dynamic Capital Appreciation Fund |
Fidelity Advisor Electronics Fund |
Fidelity Advisor Emerging Asia Fund |
Fidelity Advisor Emerging Markets Income Fund |
Fidelity Advisor Equity Growth Fund |
Fidelity Advisor Equity Income Fund |
Fidelity Advisor Equity Value Fund |
Fidelity Advisor Europe Capital Appreciation Fund |
Fidelity Advisor Fifty Fund |
Fidelity Advisor Financial Services Fund |
Fidelity Advisor Floating Rate High Income Fund |
Fidelity Advisor Global Equity Fund |
Fidelity Advisor Government Investment Fund |
Fidelity Advisor Growth & Income Fund |
Fidelity Advisor Growth Opportunities |
Fidelity Advisor Health Care Fund |
Fidelity Advisor High Income Advantage Fund |
Fidelity Advisor High Income Fund |
Fidelity Advisor Inflation-Protected Bond Fund |
Fidelity Advisor Intermediate Bond Fund |
Fidelity Advisor International Capital Appreciation Fund |
Fidelity Advisor International Small Cap Fund |
Fidelity Advisor Investment Grade Bond Fund |
Fidelity Advisor Japan Fund |
Fidelity Advisor Korea Fund |
Fidelity Advisor Large Cap Fund |
Fidelity Advisor Latin America Fund |
Fidelity Advisor Leveraged Company Stock Fund |
Fidelity Advisor Mid Cap Fund |
Fidelity Advisor Mortgage Securities Fund |
Fidelity Advisor Municipal Income Fund |
Fidelity Advisor Natural Resources Fund |
Fidelity Advisor New York Municipal Income Fund |
Fidelity Advisor Overseas Fund |
Fidelity Advisor Real Estate Fund |
Fidelity Advisor Short Fixed-Income Fund |
Fidelity Advisor Small Cap Fund |
Fidelity Advisor Strategic Growth Fund |
Fidelity Advisor Strategic Income Fund |
Fidelity Advisor Tax Managed
Stock Fund |
Fidelity Advisor Technology Fund |
Fidelity Advisor Telecommunications & Utilities Growth Fund |
Fidelity Advisor Value Leaders Fund |
Fidelity Advisor Value Strategies Fund |
Prime Fund |
Tax-Exempt Fund |
Treasury Fund |
(Fidelity Investment logo)(registered trademark)
Corporate Headquarters
82 Devonshire St., Boston, MA 02109
www.fidelity.com
Fidelity® Advisor
International
Capital Appreciation
Fund - Class A, Class T, Class B
and Class C
Annual Report
October 31, 2003
(2_fidelity_logos) (Registered_Trademark)
Contents
Chairman's Message | <Click Here> | Ned Johnson's message to shareholders. |
Performance | <Click Here> | How the fund has done over time. |
Management's Discussion | <Click Here> | The manager's review of fund performance, strategy and outlook. |
Investment Changes | <Click Here> | A summary of major shifts in the fund's investments over the past six months. |
Investments | <Click Here> | A complete list of the fund's investments with their market values. |
Financial Statements | <Click Here> | Statements of assets and liabilities, operations, and changes in net assets,
as well as financial highlights. |
Notes | <Click Here> | Notes to the financial statements. |
Auditors' Opinion | <Click Here> | |
Trustees and Officers | <Click Here> | |
| | |
| | |
For a free copy of the fund's proxy voting guidelines call 1-877-208-0098 or visit the Securities and Exchange Commission (SEC)'s web site at www.sec.gov.
Third party marks appearing herein are the property of their respective owners.
All other marks appearing herein are registered or unregistered trademarks or service marks of FMR Corp. or an affiliated company.
(Recycle graphic) This report is printed on recycled paper using soy-based inks.
This report and the financial statements contained herein are submitted for the general information of the shareholders of the fund. This report is not authorized for distribution to prospective investors in the fund unless preceded or accompanied by an effective prospectus.
Mutual fund shares are not deposits or obligations of, or guaranteed by, any depository institution. Shares are not insured by the FDIC, Federal Reserve Board or any other agency, and are subject to investment risks, including possible loss of principal amount invested.
Neither the fund nor Fidelity Distributors Corporation is a bank.
For more information on any Fidelity Advisor fund, including charges and expenses, contact your investment professional for a free prospectus. Read it carefully before you invest or send money.
Annual Report
Chairman's Message
(photo_of_Edward_C_Johnson_3d)
Dear Shareholder:
Many of you have read or heard news stories recently that were critical of mutual funds and made allegations that the mutual fund industry has been less than forthright. I find these reports unsettling and not necessarily an accurate picture of the overall industry, and I would like you to know where we at Fidelity stand.
With specific regard to allegations that certain mutual fund companies were violating the Securities and Exchange Commission's forward pricing rules or were involved in so-called "market timing" activities, I want to say two things:
First, Fidelity does not have agreements that permit customers who buy fund shares after 4 p.m. to obtain the 4 p.m. price. This is not to say that someone could not deceive the company through fraudulent acts. But I underscore that we have no so-called "agreements" which would permit this illegal practice.
Second, Fidelity has been on record for years opposing predatory short-term trading which adversely affects other shareholders in a mutual fund. In fact, in the 1980s, we began charging a fee - which is returned to the fund and, therefore, to investors - to discourage this activity. What's more, several years ago we took the industry lead in developing a Fair Value Pricing Policy to prevent market timing on foreign securities in our funds. It is reasonable to assume that another structure can be developed that would alter the system to make it much more difficult for predatory traders to operate. This, however, will only be achieved through close cooperation among regulators, legislators and the industry.
Certainly no industry is perfect, and there have been instances of unethical and illegal activity from time to time within the mutual fund industry. When this occurs, confessed or convicted offenders should be dealt with appropriately. Clearly, every system can be improved. We applaud well thought out improvements by regulators, legislators and industry representatives that achieve the common goal of building and protecting the value of investors' holdings. But we remain concerned about the risk of over-regulation and the quick application of simplistic solutions to intricate problems.
For more than 57 years, Fidelity Investments has worked very hard to improve its products and service to justify your trust. When our family founded this company in 1946, we had only a few hundred customers. Many of them were family and friends. Today, we serve more than 18 million customers including individual investors and participants in retirement plans across America.
Let me close by saying that we do not take your trust in us for granted, and we realize that we must always work to improve all aspects of our service to you. In turn, we urge you to continue your active participation with your financial matters, so that your interests can be well served.
Annual Report
Best regards,
/s/Edward C. Johnson 3d
Edward C. Johnson 3d
Annual Report
Performance: The Bottom Line
Average annual total return reflects the change in the value of an investment, assuming reinvestment of the class' dividend income and capital gains (the profits earned upon the sale of securities that have grown in value) and assuming a constant rate of performance each year. During periods of reimbursement by Fidelity, a fund's total return will be greater than it would be had the reimbursement not occurred. The $10,000 table and the fund's returns do not reflect the deduction of taxes that a shareholder would pay on fund distributions or the redemption of fund shares. How a fund did yesterday is no guarantee of how it will do tomorrow. Returns may reflect the conversion of Class B shares to Class A shares after a maximum of seven years.
Average Annual Total Returns
Periods ended October 31, 2003 | | Past 1
year | Past 5
years | Life of
fundA |
Class A (incl. 5.75% sales charge) | | 24.78% | 7.73% | 6.53% |
Class T (incl. 3.50% sales charge) | | 27.54% | 8.08% | 6.77% |
Class B (incl. contingent deferred sales charge)B | | 26.39% | 7.89% | 6.64% |
Class C (incl. contingent deferred sales charge)C | | 30.45% | 8.28% | 6.82% |
A From November 3, 1997.
B Class B shares' contingent deferred sales charges included in the past one year, past five year, and life of fund total return figures are 5%, 2%, and 1%, respectively.
C Class C shares' contingent deferred sales charge included in the past one year, past five year, and life of fund total return figures are 1%, 0%, and 0%, respectively.
Annual Report
$10,000 Over Life of Fund
Let's say hypothetically that $10,000 was invested in Fidelity® Advisor International Capital Appreciation Fund - Class T on November 3, 1997, when the fund started, and the current 3.50% sales charge was paid. The chart shows how the value of your investment would have grown, and also shows how the Morgan Stanley Capital InternationalSM AC World Index Free ex USA did over the same period.
Annual Report
Management's Discussion of Fund Performance
Comments from Kevin McCarey, Portfolio Manager of Fidelity® Advisor International Capital Appreciation Portfolio
Mirroring the U.S. rally, most international stock markets rebounded sharply during the 12-month period ending October 31, 2003. Encouraged by improved corporate earnings, favorable interest rates and the easing of geopolitical tensions, the Morgan Stanley Capital InternationalSM Europe, Australasia, Far East (MSCI® EAFE®) Index - a proxy for stock markets outside the United States and Canada - gained 27.39% during the past year. From a regional perspective, all 16 countries in the MSCI Europe index - which gained 24.56% - - had double-digit advances. Spain, Denmark and Sweden were among the region's best performers. In Japan, increased capital spending, exports and machinery orders helped the Tokyo Stock Exchange Stock Price Index (TOPIX) advance 36.39%. Following the SARS epidemic, other Asian markets also rebounded. For instance, the Hong Kong market, as measured by the Hang Seng Index, gained 34.51%. Emerging markets also fared well, particularly Latin America. The MSCI Emerging Markets Free-Latin America Index rose 59.75%. Canadian equities, as measured by the S&P/TSX Composite Index, also posted an impressive annual gain, advancing 50.66%.
For the year ending October 31, 2003, the fund's Class A, Class T, Class B and Class C shares gained 32.39%, 32.17%, 31.39% and 31.45%, respectively. In comparison, the MSCI All Country World ex-USA Index rose 30.20% and the LipperSM International Funds Average returned 24.51%. The market environment was very conducive to the fund's aggressive style of growth investing, and investments in the semiconductor industry particularly helped performance. Dutch company ASML Holding and Tokyo Electron, both among the world's largest makers of semiconductor equipment, were strong performers. Performance also was helped by Sumitomo Mitsui Financial Group, one of the world's largest banks, which benefited as expectations for an economic recovery increased and optimism rose about Japan's economy. On the negative side, the strong economy led capital goods stocks to perform well, and being underweighted in this area hurt the fund's relative performance. Also, some of the capital goods stocks we did own failed to perform as I hoped. For example, ABB, a Swiss conglomerate, was a strong performer, but I sold it from the fund before it rebounded. Another capital goods disappointment was Neopost, a French maker of postal equipment that encountered weak demand for its products.
The views expressed in this statement reflect those of the portfolio manager only through the end of the period of the report as stated on the cover and do not necessarily represent the views of Fidelity or any other person in the Fidelity organization. Any such views are subject to change at any time based upon market or other conditions and Fidelity disclaims any responsibility to update such views. These views may not be relied on as investment advice and, because investment decisions for a Fidelity fund are based on numerous factors, may not be relied on as an indication of trading intent on behalf of any Fidelity fund.
Annual Report
Investment Changes
Top Five Stocks as of October 31, 2003 |
| % of fund's
net assets | % of fund's net assets
6 months ago |
Nikko Cordial Corp. (Japan, Capital Markets) | 4.7 | 1.4 |
United Microelectronics Corp. (Taiwan, Semiconductors & Semiconductor Equipment) | 4.0 | 0.0 |
Telefonaktiebolaget LM Ericsson (B Shares) (Sweden, Communications Equipment) | 4.0 | 2.7 |
ASML Holding NV (NY Shares) (Netherlands, Semiconductors & Semiconductor Equipment) | 3.6 | 4.6 |
China Telecom Corp. Ltd. (H Shares) (China, Diversified Telecommunication Services) | 3.6 | 0.0 |
| 19.9 | |
Top Five Market Sectors as of October 31, 2003 |
| % of fund's
net assets | % of fund's net assets
6 months ago |
Financials | 28.7 | 20.5 |
Information Technology | 18.0 | 17.5 |
Health Care | 12.9 | 18.9 |
Consumer Discretionary | 10.2 | 14.2 |
Telecommunication Services | 7.3 | 7.6 |
Top Five Countries as of October 31, 2003 |
(excluding cash equivalents) | % of fund's
net assets | % of fund's net assets
6 months ago |
Japan | 19.3 | 10.5 |
United Kingdom | 12.7 | 7.9 |
Switzerland | 8.7 | 11.2 |
Germany | 8.5 | 13.3 |
India | 8.5 | 2.6 |
Percentages are adjusted for the effect of open futures contracts, if applicable. |
Asset Allocation (% of fund's net assets) |
As of October 31, 2003 | As of April 30, 2003 |
| Stocks 91.9% | | | Stocks 94.6% | |
| Short-Term
Investments and
Net Other Assets 8.1% | | | Short-Term
Investments and
Net Other Assets 5.4% | |

Annual Report
Investments October 31, 2003
Showing Percentage of Net Assets
Common Stocks - 91.9% |
| Shares | | Value (Note 1) |
Brazil - 2.0% |
Aracruz Celulose SA sponsored ADR | 391,300 | | $ 10,995,530 |
Canada - 4.7% |
Biovail Corp. (a) | 281,400 | | 6,769,820 |
Precision Drilling Corp. (a) | 168,100 | | 6,613,081 |
Talisman Energy, Inc. | 137,400 | | 6,710,039 |
TELUS Corp. (non-vtg.) | 315,700 | | 5,528,641 |
TOTAL CANADA | | 25,621,581 |
China - 3.6% |
China Telecom Corp. Ltd. (H Shares) | 58,872,000 | | 19,521,402 |
PICC Property & Casualty Co. Ltd. (H Shares) | 122,000 | | 28,564 |
TOTAL CHINA | | 19,549,966 |
Denmark - 1.3% |
Coloplast AS Series B | 86,670 | | 7,266,282 |
France - 2.9% |
Business Objects SA (a) | 268,900 | | 8,784,503 |
Pernod-Ricard | 72,475 | | 6,968,569 |
TOTAL FRANCE | | 15,753,072 |
Germany - 8.5% |
Allianz AG (Reg.) | 103,500 | | 11,057,139 |
Deutsche Boerse AG | 139,550 | | 7,730,662 |
Deutsche Lufthansa AG (Reg.) | 826,500 | | 12,916,121 |
Fresenius Medical Care AG | 263,500 | | 14,972,590 |
TOTAL GERMANY | | 46,676,512 |
Hungary - 0.5% |
OTP Bank Rt. unit (a) | 104,800 | | 2,572,840 |
India - 8.5% |
Bank of Baroda | 1,355,293 | | 5,714,839 |
Bank of India | 3,960,300 | | 5,413,517 |
Cipla Ltd. | 93,185 | | 2,670,330 |
Dr. Reddy's Laboratories Ltd. | 240,600 | | 6,345,214 |
I-Flex Solutions Ltd. | 299,443 | | 4,538,557 |
Reliance Industries Ltd. | 707,600 | | 7,592,804 |
State Bank of India | 781,300 | | 8,347,428 |
State Bank of India GDR (Reg. S) | 195,400 | | 5,871,770 |
TOTAL INDIA | | 46,494,459 |
Common Stocks - continued |
| Shares | | Value (Note 1) |
Indonesia - 0.5% |
PT Bank Central Asia Tbk | 6,498,500 | | $ 2,696,087 |
PT Bank Rakyat Indonesia (a)(c) | 3,206,500 | | 330,218 |
TOTAL INDONESIA | | 3,026,305 |
Italy - 1.4% |
Bulgari Spa | 837,600 | | 7,577,211 |
Japan - 19.3% |
Aeon Credit Service Ltd. | 121,400 | | 5,620,575 |
Canon, Inc. | 102,500 | | 5,017,375 |
Don Quijote Co. Ltd. | 83,700 | | 4,499,427 |
FamilyMart Co. Ltd. | 343,300 | | 7,463,043 |
Konica Minolta Holdings, Inc. | 474,500 | | 6,236,606 |
Nikko Cordial Corp. | 4,710,000 | | 25,405,036 |
Nitto Denko Corp. | 119,900 | | 6,292,732 |
Nomura Holdings, Inc. | 1,033,000 | | 17,739,712 |
Skylark Co. Ltd. | 255,200 | | 4,203,813 |
Sumitomo Mitsui Financial Group, Inc. | 1,481 | | 7,449,454 |
TDK Corp. | 94,700 | | 6,201,928 |
Tokyo Electron Ltd. | 70,500 | | 5,053,120 |
Tv Asahi Corp. | 2,894 | | 4,606,603 |
TOTAL JAPAN | | 105,789,424 |
Korea (South) - 0.9% |
LG Card Co. Ltd. | 479,360 | | 4,880,680 |
Netherlands - 6.0% |
ASML Holding NV (NY Shares) (a) | 1,134,600 | | 19,912,230 |
Versatel Telecom International NV (a) | 2,717,400 | | 6,232,985 |
VNU NV | 189,500 | | 5,751,588 |
Wolters Kluwer NV (Certificaten Van Aandelen) | 59,800 | | 837,539 |
TOTAL NETHERLANDS | | 32,734,342 |
Spain - 1.0% |
Banco Popular Espanol SA (Reg.) | 106,800 | | 5,534,106 |
Sweden - 4.9% |
Securitas AB (B Shares) | 415,000 | | 5,086,304 |
Telefonaktiebolaget LM Ericsson (B Shares) (a) | 12,672,500 | | 21,644,626 |
TOTAL SWEDEN | | 26,730,930 |
Switzerland - 8.7% |
Actelion Ltd. (Reg.) (a) | 151,742 | | 14,375,081 |
Credit Suisse Group (Reg.) | 286,500 | | 10,055,069 |
Novartis AG (Reg.) | 86,850 | | 3,332,434 |
Common Stocks - continued |
| Shares | | Value (Note 1) |
Switzerland - continued |
Roche Holding AG (participation certificate) | 37,730 | | $ 3,109,925 |
Serono SA Series B | 7,477 | | 5,142,320 |
The Swatch Group AG (Reg.) | 305,970 | | 6,504,658 |
UBS AG (Reg.) | 80,220 | | 4,906,788 |
TOTAL SWITZERLAND | | 47,426,275 |
Taiwan - 4.0% |
United Microelectronics Corp. (a) | 23,690,766 | | 21,714,790 |
Turkey - 0.5% |
Akbank Turk Anonim Sirketi | 538,110,600 | | 2,520,671 |
United Kingdom - 12.7% |
British American Tobacco PLC | 828,100 | | 9,997,320 |
Collins Stewart Tullett PLC | 1,014,194 | | 6,616,034 |
EMAP PLC | 406,200 | | 5,509,564 |
HSBC Holdings PLC (United Kingdom) (Reg.) | 756,357 | | 11,355,939 |
Kingfisher PLC | 1,930,026 | | 9,238,417 |
Man Group PLC | 222,000 | | 5,450,512 |
Signet Group PLC | 3,804,400 | | 6,671,792 |
Smith & Nephew PLC | 759,100 | | 6,022,721 |
Vodafone Group PLC | 4,119,300 | | 8,712,323 |
TOTAL UNITED KINGDOM | | 69,574,622 |
TOTAL COMMON STOCKS (Cost $433,148,760) | 502,439,598 |
Money Market Funds - 7.6% |
| | | |
Fidelity Cash Central Fund, 1.07% (b) | 23,184,734 | | 23,184,734 |
Fidelity Securities Lending Cash Central Fund, 1.09% (b) | 18,530,889 | | 18,530,889 |
TOTAL MONEY MARKET FUNDS (Cost $41,715,623) | 41,715,623 |
TOTAL INVESTMENT PORTFOLIO - 99.5% (Cost $474,864,383) | | 544,155,221 |
NET OTHER ASSETS - 0.5% | | 2,767,494 |
NET ASSETS - 100% | $ 546,922,715 |
Legend |
(a) Non-income producing |
(b) The rate quoted is the annualized seven-day yield of the fund at period end. A complete listing of the fund's holdings as of its most recent fiscal year end is available upon request. |
(c) Security or a portion of the security purchased on a delayed delivery or when-issued basis. |
Other Information |
Purchases and sales of securities, other than short-term securities, aggregated $784,903,173 and $565,840,493, respectively. |
The fund placed a portion of its portfolio transactions with brokerage firms which are affiliates of the investment adviser. The commissions paid to these affiliated firms were $134 for the period. |
Income Tax Information |
At October 31, 2003, the fund had a capital loss carryforward of approximately $76,360,000 of which $64,126,000 and $12,234,000 will expire on October 31, 2009 and 2010, respectively. |
See accompanying notes which are an integral part of the financial statements.
Annual Report
Financial Statements
Statement of Assets and Liabilities
| October 31, 2003 |
| | |
Assets | | |
Investment in securities, at value (including securities loaned of $17,776,162) (cost $474,864,383) - See accompanying schedule | | $ 544,155,221 |
Foreign currency held at value (cost $ 5,432,559) | | 5,435,044 |
Receivable for investments sold | | 19,966,221 |
Receivable for fund shares sold | | 3,263,891 |
Dividends receivable | | 460,449 |
Interest receivable | | 40,988 |
Prepaid expenses | | 2,430 |
Other receivables | | 3,145 |
Total assets | | 573,327,389 |
| | |
Liabilities | | |
Payable for investments purchased
Regular delivery | $ 3,979,580 | |
Delayed delivery | 333,520 | |
Payable for fund shares redeemed | 1,848,801 | |
Accrued management fee | 326,273 | |
Distribution fees payable | 157,883 | |
Other payables and accrued expenses | 1,227,728 | |
Collateral on securities loaned, at value | 18,530,889 | |
Total liabilities | | 26,404,674 |
| | |
Net Assets | | $ 546,922,715 |
Net Assets consist of: | | |
Paid in capital | | $ 554,774,985 |
Undistributed net investment income | | 354,316 |
Accumulated undistributed net realized gain (loss) on investments and foreign currency transactions | | (76,424,130) |
Net unrealized appreciation (depreciation) on investments and assets and liabilities in foreign currencies | | 68,217,544 |
Net Assets | | $ 546,922,715 |
See accompanying notes which are an integral part of the financial statements.
Annual Report
Financial Statements - continued
Statement of Assets and Liabilities - continued
| October 31, 2003 |
| | |
Calculation of Maximum Offering Price
Class A:
Net Asset Value and redemption price per share
($41,867,418 ÷ 2,893,569 shares) | | $ 14.47 |
| | |
Maximum offering price per share (100/94.25 of $14.47) | | $ 15.35 |
Class T:
Net Asset Value and redemption price per share ($149,513,522 ÷ 10,400,087 shares) | | $ 14.38 |
| | |
Maximum offering price per share (100/96.50 of $14.38) | | $ 14.90 |
Class B:
Net Asset Value and offering price per share ($50,358,393 ÷ 3,613,802 shares) A | | $ 13.94 |
| | |
Class C:
Net Asset Value and offering price per share ($58,559,912 ÷ 4,196,156 shares) A | | $ 13.96 |
| | |
| | |
Institutional Class:
Net Asset Value, offering price and redemption price per share ($246,623,470 ÷ 16,772,538 shares) | | $ 14.70 |
A Redemption price per share is equal to net asset value less any applicable contingent deferred sales charge.
See accompanying notes which are an integral part of the financial statements.
Annual Report
Statement of Operations
| Year ended October 31, 2003 |
| | |
Investment Income | | |
Dividends | | $ 4,716,191 |
Interest | | 419,630 |
Security lending | | 193,735 |
| | 5,329,556 |
Less foreign taxes withheld | | (514,752) |
Total income | | 4,814,804 |
| | |
Expenses | | |
Management fee | $ 2,248,941 | |
Transfer agent fees | 1,316,134 | |
Distribution fees | 1,461,105 | |
Accounting and security lending fees | 189,462 | |
Non-interested trustees' compensation | 1,157 | |
Custodian fees and expenses | 197,822 | |
Registration fees | 127,981 | |
Audit | 60,616 | |
Legal | 7,766 | |
Miscellaneous | 3,643 | |
Total expenses before reductions | 5,614,627 | |
Expense reductions | (173,357) | 5,441,270 |
Net investment income (loss) | | (626,466) |
Realized and Unrealized Gain (Loss) Net realized gain (loss) on: | | |
Investment securities | 27,965,720 | |
Foreign currency transactions | (134,608) | |
Total net realized gain (loss) | | 27,831,112 |
Change in net unrealized appreciation (depreciation) on: Investment securities (net of deferred foreign taxes of $1,041,856) | 71,760,838 | |
Assets and liabilities in foreign currencies | 267,153 | |
Total change in net unrealized appreciation (depreciation) | | 72,027,991 |
Net gain (loss) | | 99,859,103 |
Net increase (decrease) in net assets resulting from operations | | $ 99,232,637 |
See accompanying notes which are an integral part of the financial statements.
Annual Report
Financial Statements - continued
Statement of Changes in Net Assets
| Year ended
October 31,
2003 | Year ended
October 31,
2002 |
Increase (Decrease) in Net Assets | | |
Operations | | |
Net investment income (loss) | $ (626,466) | $ (812,361) |
Net realized gain (loss) | 27,831,112 | (11,502,014) |
Change in net unrealized appreciation (depreciation) | 72,027,991 | 5,664,330 |
Net increase (decrease) in net assets resulting
from operations | 99,232,637 | (6,650,045) |
Share transactions - net increase (decrease) | 247,591,083 | 29,718,211 |
Total increase (decrease) in net assets | 346,823,720 | 23,068,166 |
| | |
Net Assets | | |
Beginning of period | 200,098,995 | 177,030,829 |
End of period (including undistributed net investment income of $354,316 and undistributed net investment income of $0, respectively) | $ 546,922,715 | $ 200,098,995 |
See accompanying notes which are an integral part of the financial statements.
Annual Report
Financial Highlights - Class A
Years ended October 31, | 2003 | 2002 | 2001 | 2000 | 1999 |
Selected Per-Share Data | | | | | |
Net asset value, beginning of period | $ 10.93 | $ 11.08 | $ 15.26 | $ 15.06 | $ 10.07 |
Income from Investment Operations | | | | | |
Net investment income (loss) C | - E | - E | (.01) | (.03) | (.01) |
Net realized and unrealized gain (loss) | 3.54 | (.15) | (3.73) | .88 | 5.00 |
Total from investment operations | 3.54 | (.15) | (3.74) | .85 | 4.99 |
Distributions from net investment income | - | - | (.44) | - | - |
Distributions in excess of net investment income | - | - | - | (.02) | - |
Distributions from net realized gain | - | - | - | (.63) | - |
Total distributions | - | - | (.44) | (.65) | - |
Net asset value, end of period | $ 14.47 | $ 10.93 | $ 11.08 | $ 15.26 | $ 15.06 |
Total Return A,B | 32.39% | (1.35)% | (25.17)% | 5.31% | 49.55% |
Ratios to Average Net Assets D | | | | | |
Expenses before expense reductions | 1.59% | 1.67% | 1.71% | 1.55% | 2.13% |
Expenses net of voluntary waivers, if any | 1.59% | 1.67% | 1.70% | 1.55% | 1.72% |
Expenses net of all reductions | 1.54% | 1.57% | 1.57% | 1.50% | 1.67% |
Net investment income (loss) | .01% | (.02)% | (.05)% | (.16)% | (.06)% |
Supplemental Data | | | | | |
Net assets, end of period
(000 omitted) | $ 41,867 | $ 16,879 | $ 12,070 | $ 15,348 | $ 3,407 |
Portfolio turnover rate | 205% | 193% | 270% | 308% | 218% |
A Total returns would have been lower had certain expenses not been reduced during the periods shown.
B Total returns do not include the effect of the sales charges.
C Calculated based on average shares outstanding during the period.
D Expense ratios reflect operating expenses of the class. Expenses before reductions do not reflect amounts reimbursed by the investment adviser or reductions from brokerage service arrangements or other expense offset arrangements and do not represent the amount paid by the class during periods when reimbursements or reductions occur. Expenses net of any voluntary waivers reflect expenses after reimbursement by the investment adviser but prior to reductions from brokerage service arrangements or other expense offset arrangements. Expenses net of all reductions represent the net expenses paid by the class.
E Amount represents less than $.01 per-share.
See accompanying notes which are an integral part of the financial statements.
Annual Report
Financial Highlights - Class T
Years ended October 31, | 2003 | 2002 | 2001 | 2000 | 1999 |
Selected Per-Share Data | | | | | |
Net asset value, beginning of period | $ 10.88 | $ 11.05 | $ 15.21 | $ 15.02 | $ 10.04 |
Income from Investment Operations | | | | | |
Net investment income (loss) C | (.03) | (.03) | (.03) | (.06) | (.04) |
Net realized and unrealized gain (loss) | 3.53 | (.14) | (3.73) | .88 | 5.02 |
Total from investment operations | 3.50 | (.17) | (3.76) | .82 | 4.98 |
Distributions from net investment income | - | - | (.40) | - | - |
Distributions in excess of net investment income | - | - | - | (.01) | - |
Distributions from net realized gain | - | - | - | (.62) | - |
Total distributions | - | - | (.40) | (.63) | - |
Net asset value, end of period | $ 14.38 | $ 10.88 | $ 11.05 | $ 15.21 | $ 15.02 |
Total Return A,B | 32.17% | (1.54)% | (25.32)% | 5.13% | 49.60% |
Ratios to Average Net Assets D | | | | | |
Expenses before expense reductions | 1.85% | 1.86% | 1.87% | 1.72% | 2.29% |
Expenses net of voluntary waivers, if any | 1.85% | 1.86% | 1.87% | 1.72% | 1.97% |
Expenses net of all reductions | 1.79% | 1.76% | 1.73% | 1.67% | 1.92% |
Net investment income (loss) | (.24)% | (.21)% | (.22)% | (.33)% | (.31)% |
Supplemental Data | | | | | |
Net assets, end of period
(000 omitted) | $ 149,514 | $ 98,148 | $ 88,818 | $ 145,721 | $ 44,233 |
Portfolio turnover rate | 205% | 193% | 270% | 308% | 218% |
A Total returns would have been lower had certain expenses not been reduced during the periods shown.
B Total returns do not include the effect of the sales charges.
C Calculated based on average shares outstanding during the period.
D Expense ratios reflect operating expenses of the class. Expenses before reductions do not reflect amounts reimbursed by the investment adviser or reductions from brokerage service arrangements or other expense offset arrangements and do not represent the amount paid by the class during periods when reimbursements or reductions occur. Expenses net of any voluntary waivers reflect expenses after reimbursement by the investment adviser but prior to reductions from brokerage service arrangements or other expense offset arrangements. Expenses net of all reductions represent the net expenses paid by the class.
See accompanying notes which are an integral part of the financial statements.
Annual Report
Financial Highlights - Class B
Years ended October 31, | 2003 | 2002 | 2001 | 2000 | 1999 |
Selected Per-Share Data | | | | | |
Net asset value, beginning of period | $ 10.61 | $ 10.84 | $ 14.96 | $ 14.82 | $ 9.99 |
Income from Investment Operations | | | | | |
Net investment income (loss) C | (.09) | (.09) | (.10) | (.16) | (.10) |
Net realized and unrealized gain (loss) | 3.42 | (.14) | (3.67) | .89 | 4.93 |
Total from investment operations | 3.33 | (.23) | (3.77) | .73 | 4.83 |
Distributions from net investment income | - | - | (.35) | - | - |
Distributions in excess of net investment income | - | - | - | (.01) | - |
Distributions from net realized gain | - | - | - | (.58) | - |
Total distributions | - | - | (.35) | (.59) | - |
Net asset value, end of period | $ 13.94 | $ 10.61 | $ 10.84 | $ 14.96 | $ 14.82 |
Total Return A,B | 31.39% | (2.12)% | (25.75)% | 4.60% | 48.35% |
Ratios to Average Net Assets D | | | | | |
Expenses before expense reductions | 2.42% | 2.44% | 2.47% | 2.30% | 2.82% |
Expenses net of voluntary waivers, if any | 2.42% | 2.44% | 2.45% | 2.30% | 2.47% |
Expenses net of all reductions | 2.37% | 2.34% | 2.32% | 2.26% | 2.42% |
Net investment income (loss) | (.82)% | (.79)% | (.80)% | (.92)% | (.81)% |
Supplemental Data | | | | | |
Net assets, end of period
(000 omitted) | $ 50,358 | $ 36,981 | $ 36,593 | $ 49,140 | $ 11,098 |
Portfolio turnover rate | 205% | 193% | 270% | 308% | 218% |
A Total returns would have been lower had certain expenses not been reduced during the periods shown.
B Total returns do not include the effect of the contingent deferred sales charge.
C Calculated based on average shares outstanding during the period.
D Expense ratios reflect operating expenses of the class. Expenses before reductions do not reflect amounts reimbursed by the investment adviser or reductions from brokerage service arrangements or other expense offset arrangements and do not represent the amount paid by the class during periods when reimbursements or reductions occur. Expenses net of any voluntary waivers reflect expenses after reimbursement by the investment adviser but prior to reductions from brokerage service arrangements or other expense offset arrangements. Expenses net of all reductions represent the net expenses paid by the class.
See accompanying notes which are an integral part of the financial statements.
Annual Report
Financial Highlights - Class C
Years ended October 31, | 2003 | 2002 | 2001 | 2000 | 1999 |
Selected Per-Share Data | | | | | |
Net asset value, beginning of period | $ 10.62 | $ 10.83 | $ 14.96 | $ 14.83 | $ 9.98 |
Income from Investment Operations | | | | | |
Net investment income (loss) C | (.08) | (.08) | (.09) | (.15) | (.10) |
Net realized and unrealized gain (loss) | 3.42 | (.13) | (3.67) | .88 | 4.95 |
Total from investment operations | 3.34 | (.21) | (3.76) | .73 | 4.85 |
Distributions from net investment income | - | - | (.37) | - | - |
Distributions in excess of net investment income | - | - | - | (.01) | - |
Distributions from net realized gain | - | - | - | (.59) | - |
Total distributions | - | - | (.37) | (.60) | - |
Net asset value, end of period | $ 13.96 | $ 10.62 | $ 10.83 | $ 14.96 | $ 14.83 |
Total Return A,B | 31.45% | (1.94)% | (25.71)% | 4.59% | 48.60% |
Ratios to Average Net Assets D | | | | | |
Expenses before expense reductions | 2.33% | 2.34% | 2.38% | 2.25% | 2.82% |
Expenses net of voluntary waivers, if any | 2.33% | 2.34% | 2.38% | 2.25% | 2.47% |
Expenses net of all reductions | 2.28% | 2.24% | 2.24% | 2.21% | 2.42% |
Net investment income (loss) | (.73)% | (.69)% | (.73)% | (.86)% | (.81)% |
Supplemental Data | | | | | |
Net assets, end of period
(000 omitted) | $ 58,560 | $ 37,514 | $ 33,118 | $ 44,041 | $ 7,874 |
Portfolio turnover rate | 205% | 193% | 270% | 308% | 218% |
A Total returns would have been lower had certain expenses not been reduced during the periods shown.
B Total returns do not include the effect of the contingent deferred sales charge.
C Calculated based on average shares outstanding during the period.
D Expense ratios reflect operating expenses of the class. Expenses before reductions do not reflect amounts reimbursed by the investment adviser or reductions from brokerage service arrangements or other expense offset arrangements and do not represent the amount paid by the class during periods when reimbursements or reductions occur. Expenses net of any voluntary waivers reflect expenses after reimbursement by the investment adviser but prior to reductions from brokerage service arrangements or other expense offset arrangements. Expenses net of all reductions represent the net expenses paid by the class.
See accompanying notes which are an integral part of the financial statements.
Annual Report
Financial Highlights - Institutional Class
Years ended October 31, | 2003 | 2002 | 2001 | 2000 | 1999 |
Selected Per-Share Data | | | | | |
Net asset value, beginning of period | $ 11.08 | $ 11.17 | $ 15.35 | $ 15.09 | $ 10.09 |
Income from Investment Operations | | | | | |
Net investment income (loss) B | .04 | .06 | .06 | .04 | .02 |
Net realized and unrealized gain (loss) | 3.58 | (.15) | (3.75) | .88 | 4.98 |
Total from investment operations | 3.62 | (.09) | (3.69) | .92 | 5.00 |
Distributions from net investment income | - | - | (.49) | - | - |
Distributions in excess of net investment income | - | - | - | (.03) | - |
Distributions from net realized gain | - | - | - | (.63) | - |
Total distributions | - | - | (.49) | (.66) | - |
Net asset value, end of period | $ 14.70 | $ 11.08 | $ 11.17 | $ 15.35 | $ 15.09 |
Total Return A | 32.67% | (.81)% | (24.75)% | 5.78% | 49.55% |
Ratios to Average Net Assets C | | | | | |
Expenses before expense reductions | 1.28% | 1.15% | 1.19% | 1.15% | 1.70% |
Expenses net of voluntary waivers, if any | 1.28% | 1.15% | 1.19% | 1.15% | 1.47% |
Expenses net of all reductions | 1.22% | 1.06% | 1.05% | 1.10% | 1.42% |
Net investment income (loss) | .33% | .50% | .46% | .24% | .19% |
Supplemental Data | | | | | |
Net assets, end of period
(000 omitted) | $ 246,623 | $ 10,577 | $ 6,432 | $ 9,551 | $ 7,099 |
Portfolio turnover rate | 205% | 193% | 270% | 308% | 218% |
A Total returns would have been lower had certain expenses not been reduced during the periods shown.
B Calculated based on average shares outstanding during the period.
C Expense ratios reflect operating expenses of the class. Expenses before reductions do not reflect amounts reimbursed by the investment adviser or reductions from brokerage service arrangements or other expense offset arrangements and do not represent the amount paid by the class during periods when reimbursements or reductions occur. Expenses net of any voluntary waivers reflect expenses after reimbursement by the investment adviser but prior to reductions from brokerage service arrangements or other expense offset arrangements. Expenses net of all reductions represent the net expenses paid by the class.
See accompanying notes which are an integral part of the financial statements.
Annual Report
Notes to Financial Statements
For the period ended October 31, 2003
1. Significant Accounting Policies.
Fidelity Advisor International Capital Appreciation Fund (the fund) is a fund of Fidelity Advisor Series VIII (the trust) and is authorized to issue an unlimited number of shares. The trust is registered under the Investment Company Act of 1940, as amended (the 1940 Act), as an open-end management investment company organized as a Massachusetts business trust.
The fund offers Class A, Class T, Class B, Class C, and Institutional Class shares, each of which has equal rights as to assets and voting privileges. Each class has exclusive voting rights with respect to matters that affect that class. Class B shares will automatically convert to Class A shares after a holding period of seven years from the initial date of purchase. Investment income, realized and unrealized capital gains and losses, the common expenses of the fund, and certain fund-level expense reductions, if any, are allocated on a pro rata basis to each class based on the relative net assets of each class to the total net assets of the fund. Each class differs with respect to transfer agent and distribution and service plan fees incurred. Certain expense reductions also differ by class.
The fund's investments in emerging markets can be subject to social, economic, regulatory, and political uncertainties and can be extremely volatile. The financial statements have been prepared in conformity with accounting principles generally accepted in the United States of America, which require management to make certain estimates and assumptions at the date of the financial statements. The following summarizes the significant accounting policies of the fund:
Security Valuation. Net asset value per share (NAV calculation) is calculated as of the close of business of the New York Stock Exchange, normally 4:00 p.m. Eastern time. Equity securities for which market quotations are available are valued at the last sale price or official closing price (closing bid price or last evaluated quote if no sale has occurred) on the primary market or exchange on which they trade. If an event that is expected to materially affect the value of a security occurs after the close of an exchange or market on which that security trades, but prior to the NAV calculation, then that security will be fair valued taking the event into account. Securities (including restricted securities) for which market quotations are not readily available are valued at their fair value as determined in good faith under consistently applied procedures under the general supervision of the Board of Trustees. Price movements in futures contracts and ADRs, market and trading trends, the bid/ask quotes of brokers and off-exchange institutional trading may be reviewed in the course of making a good faith determination of a security's fair value. Short-term securities with remaining maturities of sixty days or less for which quotations are not readily available are valued on the basis of amortized cost. Investments in open-end investment companies are valued at their net asset value each business day.
Annual Report
Notes to Financial Statements - continued
1. Significant Accounting Policies - continued
Foreign Currency. The fund uses foreign currency contracts to facilitate transactions in foreign-denominated securities. Losses from these transactions may arise from changes in the value of the foreign currency or if the counterparties do not perform under the contracts' terms.
Foreign denominated assets, including investment securities, and liabilities are translated into U.S. dollars at the exchange rate at period end. Purchases and sales of investment securities, income and dividends received and expenses denominated in foreign currencies are translated into U.S. dollars at the exchange rate in effect on the transaction date.
The effects of exchange rate fluctuations on investments are included with the net realized and unrealized gain (loss) on investment securities. Other foreign currency transactions resulting in realized and unrealized gain (loss) are disclosed separately.
Investment Transactions and Income. Security transactions are accounted for as of trade date. Gains and losses on securities sold are determined on the basis of identified cost. Dividend income is recorded on the ex-dividend date, except for certain dividends from foreign securities where the ex-dividend date may have passed, which are recorded as soon as the fund is informed of the ex-dividend date. Non-cash dividends included in dividend income, if any, are recorded at the fair market value of the securities received. Interest income is accrued as earned. Interest income includes coupon interest and amortization of premium and accretion of discount on debt securities, which is accrued using the interest method. Investment income is recorded net of foreign taxes withheld where recovery of such taxes is uncertain.
Expenses. Most expenses of the trust can be directly attributed to a fund. Expenses which cannot be directly attributed are apportioned among the funds in the trust.
Income Tax Information and Distributions to Shareholders. Each year the fund intends to qualify as a regulated investment company by distributing all of its taxable income and realized gains under Subchapter M of the Internal Revenue Code. As a result, no provision for income taxes is required in the accompanying financial statements. Foreign taxes are provided for based on each fund's understanding of the tax rules and rates that exist in the foreign markets in which it invests. Income dividends and capital gain distributions are declared separately for each class. Distributions are recorded on the ex-dividend date.
Income and capital gain distributions are determined in accordance with income tax regulations, which may differ from generally accepted accounting principles. Capital accounts within the financial statements are adjusted for permanent and temporary book and tax differences. These adjustments have no impact on net assets or the results
Annual Report
1. Significant Accounting Policies - continued
Income Tax Information and Distributions to Shareholders - continued
of operations. Temporary differences will reverse in a subsequent period. These differences are primarily due to foreign currency transactions, passive foreign investment companies (PFIC), capital loss carryforwards and losses deferred due to wash sales. The tax-basis components of distributable earnings and the federal tax cost as of period end were as follows:
Unrealized appreciation | $ 76,037,736 | | |
Unrealized depreciation | (8,022,573) | |
Net unrealized appreciation (depreciation) | 68,015,163 | |
Undistributed ordinary income | 492,324 | |
Capital loss carryforward | (76,359,757) | |
| | |
Cost for federal income tax purposes | $ 476,140,058 | |
Short-Term Trading (Redemption) Fees. Shares purchased after March 31, 2004 and held in the fund less than 30 days will be subject to a short-term trading fee equal to 1.00% of the proceeds of the redeemed shares. The fee, which will be retained by the fund, is accounted for as an addition to paid in capital.
2. Operating Policies.
Repurchase Agreements. Fidelity Management & Research Company (FMR) has received an Exemptive Order from the Securities and Exchange Commission (the SEC) which permits the fund and other affiliated entities of FMR to transfer uninvested cash balances into joint trading accounts. These accounts are then invested in repurchase agreements that are collateralized by U.S. Treasury or Government obligations. The fund may also invest directly with institutions, in repurchase agreements that are collateralized by commercial paper obligations and corporate obligations. Collateral is held in segregated accounts with custodian banks and may be obtained in the event of a default of the counterparty. Collateral is marked-to-market daily and maintained at a value at least equal to the principal amount of the repurchase agreement (including accrued interest).
Delayed Delivery Transactions and When-Issued Securities. The fund may purchase or sell securities on a delayed delivery or when-issued basis. Payment and delivery may take place after the customary settlement period for that security. The price of the underlying securities and the date when the securities will be delivered and paid for are fixed at the time the transaction is negotiated. During the time a delayed delivery sell is outstanding, the contract is marked-to-market daily and equivalent deliverable
Annual Report
Notes to Financial Statements - continued
2. Operating Policies - continued
Delayed Delivery Transactions and When-Issued Securities - continued
securities are held for the transaction. The value of the securities purchased on a delayed delivery or when-issued basis are identified as such in the fund's Schedule of Investments. The fund may receive compensation for interest forgone in the purchase of a delayed delivery or when-issued security. With respect to purchase commitments, the fund identifies securities as segregated in its records with a value at least equal to the amount of the commitment. Losses may arise due to changes in the value of the underlying securities or if the counterparty does not perform under the contract, or if the issuer does not issue the securities due to political, economic, or other factors.
3. Purchases and Sales of Investments.
Information regarding purchases and sales of securities is included under the caption "Other Information" at the end of the fund's Schedule of Investments.
4. Fees and Other Transactions with Affiliates.
Management Fee. FMR and its affiliates provide the fund with investment management related services for which the fund pays a monthly management fee. The management fee is the sum of an individual fund fee rate that is based on an annual rate of .45% of the fund's average net assets and a group fee rate that averaged .28% during the period. The group fee rate is based upon the average net assets of all the mutual funds advised by FMR. The group fee rate decreases as assets under management increase and increases as assets under management decrease. For the period, the total annual management fee rate was .72% of the fund's average net assets.
Distribution and Service Plan. In accordance with Rule 12b-1 of the 1940 Act, the Fund has adopted separate Distribution and Service Plans for each class of shares. Certain classes pay Fidelity Distributors Corporation (FDC), an affiliate of FMR, separate Distribution and Service Fees, each of which is based on an annual percentage of each class' average net assets. Class A and Class T Plans also authorize the use of brokerage commissions to pay distribution expenses. This practice has been discontinued and no commissions incurred after June 30, 2003 have been used to pay distribution expenses. In addition, FDC may pay financial intermediaries for selling shares of the fund
Annual Report
4. Fees and Other Transactions with Affiliates - continued
Distribution and Service Plan - continued
and providing shareholder support services. For the period, the Distribution and Service Fee rates, the total amounts paid to and retained by FDC and the amount of distribution expenses paid with brokerage commissions were as follows:
| Distribution
Fee | Service
Fee | Paid to
FDC | Retained
by FDC | Paid with
Commissions |
Class A | -% | .25% | $ 61,873 | $ - | $ 401 |
Class T | .25% | .25% | 573,493 | 5,427 | 2,235 |
Class B | .75% | .25% | 395,537 | 296,654 | - |
Class C | .75% | .25% | 430,202 | 85,462 | - |
| | | $ 1,461,105 | $ 387,543 | $2,636 |
Sales Load. FDC receives a front-end sales charge of up to 5.75% for selling Class A shares, and 3.50% for selling Class T shares of the fund. FDC receives the proceeds of contingent deferred sales charges levied on Class A, Class T, Class B, and Class C redemptions. These charges depend on the holding period. The deferred sales charges range from 5% to 1% for Class B, 1% for Class C, and .25% for certain purchases of Class A and Class T shares.
For the period, sales charge amounts retained by FDC were as follows:
| Retained
by FDC | |
Class A | $ 25,090 | |
Class T | 14,110 | |
Class B* | 105,556 | |
Class C* | 8,499 | |
| $ 153,255 | |
* When Class B and Class C shares are initially sold, FDC pays commissions from its own resources to financial intermediaries through
which the sales are made.
Annual Report
Notes to Financial Statements - continued
4. Fees and Other Transactions with Affiliates - continued
Transfer Agent Fees. Fidelity Investments Institutional Operations Company, Inc. (FIIOC), an affiliate of FMR, is the transfer, dividend disbursing and shareholder servicing agent (collectively referred to as the transfer agent) for each class of the fund. FIIOC receives account fees and asset-based fees that vary according to the account size and type of account of the shareholders of the respective classes of the fund. FIIOC pays for typesetting, printing and mailing of all shareholder reports, except proxy statements. For the period, the following amounts were paid to FIIOC:
| Amount | % of
Average
Net Assets |
Class A | $ 106,757 | .43 |
Class T | 497,303 | .43 |
Class B | 204,368 | .51 |
Class C | 183,491 | .42 |
Institutional Class | 324,215 | .37 |
| $ 1,316,134 | |
Accounting and Security Lending Fees. Fidelity Service Company, Inc. (FSC), an affiliate of FMR, maintains the fund's accounting records and administers the security lending program. The security lending fee is based on the number and duration of lending transactions. The accounting fee is based on the level of average net assets for the month plus out-of-pocket expenses.
Central Funds. The fund may invest in affiliated Central Funds managed by Fidelity Investments Money Management, Inc. (FIMM), an affiliate of FMR. The Central Funds are open-end investment companies available only to investment companies and other accounts managed by FMR and its affiliates. The Central Funds seek preservation of capital and current income and do not pay a management fee. Income distributions earned by the fund are recorded as income in the accompanying financial statements and totaled $414,432 for the period.
Brokerage Commissions. The fund placed a portion of its portfolio transactions with brokerage firms which are affiliates of the investment adviser. The commissions paid to these affiliated firms are shown under the caption "Other Information" at the end of the fund's Schedule of Investments.
5. Committed Line of Credit.
The fund participates with other funds managed by FMR in a $3.5 billion credit facility (the "line of credit") to be utilized for temporary or emergency purposes to fund shareholder redemptions or for other short-term liquidity purposes. The fund has agreed to pay commitment fees on its pro rata portion of the line of credit. During the period, there were no borrowings on this line of credit.
Annual Report
6. Security Lending.
The fund lends portfolio securities from time to time in order to earn additional income. The fund receives collateral (in the form of U.S. Treasury obligations, letters of credit and/or cash) against the loaned securities and maintains collateral in an amount not less than 100% of the market value of the loaned securities during the period of the loan. The market value of the loaned securities is determined at the close of business of the fund and any additional required collateral is delivered to the fund on the next business day. If the borrower defaults on its obligation to return the securities loaned because of insolvency or other reasons, a fund could experience delays and costs in recovering the securities loaned or in gaining access to the collateral. Cash collateral is invested in cash equivalents. The value of loaned securities and cash collateral at period end are disclosed on the fund's Statement of Assets and Liabilities.
7. Expense Reductions.
Many of the brokers with whom FMR places trades on behalf of the fund provided services to the fund in addition to trade execution. These services may include payments of expenses on behalf of the fund to support distribution of fund shares for Class A and Class T ("Distribution Expense Reduction") and to pay other fund expenses, such as transfer agent fees ("Other Expense Reduction") collectively referred to as "Brokerage Service Arrangements" in the accompanying table. Brokerage service arrangements generally benefits all shareholders of each class by reducing fund expenses. Each of Class A and Class T shareholders' Other Expense Reduction benefit is reduced by the amount of any Distribution Expense Reduction. In addition, through arrangements with the fund's custodian, credits realized as a result of uninvested cash balances were used to reduce the fund's custodian expenses. All of the applicable expense reductions are noted in the table below.
| Brokerage Service
Arrangements | |
| Distribution
expense
reduction | Other
expense
reduction | Custody
expense
reduction |
Fund Level | $ - | $ 169,772 | $ 949 |
Class A | 401 | - | - |
Class T | 2,235 | - | - |
| $ 2,636 | $ 169,772 | $ 949 |
Annual Report
Notes to Financial Statements - continued
8. Share Transactions.
Transactions for each class of shares were as follows:
| Shares | Dollars |
| Years ended October 31, | Years ended October 31, |
| 2003 | 2002 | 2003 | 2002 |
Class A | | | | |
Shares sold | 4,243,415 | 3,695,180 | $ 49,989,621 | $ 45,047,908 |
Shares redeemed | (2,893,829) | (3,240,498) | (32,761,195) | (39,441,245) |
Net increase (decrease) | 1,349,586 | 454,682 | $ 17,228,426 | $ 5,606,663 |
Class T | | | | |
Shares sold | 5,031,240 | 7,972,427 | $ 60,317,196 | $ 98,947,323 |
Shares redeemed | (3,649,898) | (6,989,312) | (42,360,440) | (86,656,988) |
Net increase (decrease) | 1,381,342 | 983,115 | $ 17,956,756 | $ 12,290,335 |
Class B | | | | |
Shares sold | 941,457 | 1,073,501 | $ 11,384,820 | $ 13,249,979 |
Shares redeemed | (812,547) | (964,258) | (9,256,128) | (11,540,142) |
Net increase (decrease) | 128,910 | 109,243 | $ 2,128,692 | $ 1,709,837 |
Class C | | | | |
Shares sold | 1,929,759 | 2,256,558 | $ 23,497,018 | $ 27,408,888 |
Shares redeemed | (1,266,712) | (1,780,095) | (15,061,286) | (21,555,315) |
Net increase (decrease) | 663,047 | 476,463 | $ 8,435,732 | $ 5,853,573 |
Institutional Class | | | | |
Shares sold | 18,971,810 | 1,939,247 | $ 242,761,451 | $ 24,872,811 |
Shares redeemed | (3,154,144) | (1,560,448) | (40,919,974) | (20,615,008) |
Net increase (decrease) | 15,817,666 | 378,799 | $ 201,841,477 | $ 4,257,803 |
Annual Report
Independent Auditors' Report
To the Trustees of Fidelity Advisor Series VIII and Shareholders of Fidelity Advisor International Capital Appreciation Fund:
We have audited the accompanying statement of assets and liabilities of Fidelity Advisor International Capital Appreciation Fund (the Fund), a fund of Fidelity Advisor Series VIII, including the portfolio of investments, as of October 31, 2003, and the related statement of operations for the year then ended, the statement of changes in net assets for each of the two years in the period then ended, and the financial highlights for each of the five years in the period then ended. These financial statements and financial highlights are the responsibility of the Fund's management. Our responsibility is to express an opinion on these financial statements and financial highlights based on our audits.
We conducted our audits in accordance with auditing standards generally accepted in the United States of America. Those standards require that we plan and perform the audit to obtain reasonable assurance about whether the financial statements and financial highlights are free of material misstatement. An audit includes examining, on a test basis, evidence supporting the amounts and disclosures in the financial statements. Our procedures included confirmation of securities owned as of October 31, 2003, by correspondence with the custodian and brokers; where replies were not received from brokers, we performed other auditing procedures. An audit also includes assessing the accounting principles used and significant estimates made by management, as well as evaluating the overall financial statement presentation. We believe that our audits provide a reasonable basis for our opinion.
In our opinion, the financial statements and financial highlights referred to above present fairly, in all material respects, the financial position of Fidelity Advisor International Capital Appreciation Fund as of October 31, 2003, the results of its operations for the year then ended, the changes in its net assets for each of the two years in the period then ended, and its financial highlights for each of the five years in the period then ended, in conformity with accounting principles generally accepted in the United States of America.
/s/DELOITTE & TOUCHE LLP
DELOITTE & TOUCHE LLP
Boston, Massachusetts
December 12, 2003
Annual Report
Trustees and Officers
The Trustees, Members of the Advisory Board, and executive officers of the trust and fund, as applicable, are listed below. The Board of Trustees governs the fund and is responsible for protecting the interests of shareholders. The Trustees are experienced executives who meet periodically throughout the year to oversee the fund's activities, review contractual arrangements with companies that provide services to the fund, and review the fund's performance. Except for William O. McCoy, each of the Trustees oversees 289 funds advised by FMR or an affiliate. Mr. McCoy oversees 291 funds advised by FMR or an affiliate.
The Trustees hold office without limit in time except that (a) any Trustee may resign; (b) any Trustee may be removed by written instrument, signed by at least two-thirds of the number of Trustees prior to such removal; (c) any Trustee who requests to be retired or who has become incapacitated by illness or injury may be retired by written instrument signed by a majority of the other Trustees; and (d) any Trustee may be removed at any special meeting of shareholders by a two-thirds vote of the outstanding voting securities of the trust. In any event, each non-interested Trustee shall retire not later than the last day of the calendar year in which his or her 72nd birthday occurs. The executive officers and Advisory Board Members hold office without limit in time, except that any officer and Advisory Board Member may resign or may be removed by a vote of a majority of the Trustees at any regular meeting or any special meeting of the Trustees. Except as indicated, each individual has held the office shown or other offices in the same company for the past five years.
The fund's Statement of Additional Information (SAI) includes more information about the Trustees. To request a free copy, call Fidelity at 1-877-208-0098.
Interested Trustees*:
Correspondence intended for each Trustee who is an "interested person" (as defined in the 1940 Act) may be sent to 82 Devonshire Street, Boston, Massachusetts 02109.
Name, Age; Principal Occupation |
Edward C. Johnson 3d (73)** |
| Year of Election or Appointment: 1983 Mr. Johnson is Chairman of the Board of Trustees. Mr. Johnson serves as Chief Executive Officer, Chairman, and a Director of FMR Corp.; a Director and Chairman of the Board and of the Executive Committee of FMR; Chairman and a Director of Fidelity Management & Research (Far East) Inc.; Chairman (1998) and a Director of Fidelity Investments Money Management, Inc.; and Chairman (2001) and a Director (2000) of FMR Co., Inc. |
Abigail P. Johnson (41)** |
| Year of Election or Appointment: 2001 Senior Vice President of Advisor International Capital Appreciation (2001). Ms. Johnson also serves as Senior Vice President of other Fidelity funds (2001). She is President and a Director of FMR (2001), Fidelity Investments Money Management, Inc. (2001), FMR Co., Inc. (2001), and a Director of FMR Corp. Previously, Ms. Johnson managed a number of Fidelity funds. |
Laura B. Cronin (49) |
| Year of Election or Appointment: 2003 Ms. Cronin is an Executive Vice President (2002) and Chief Financial Officer (2002) of FMR Corp. and is a member of the Fidelity Management Committee (2003). Previously, Ms. Cronin served as Vice President of Finance of FMR (1997-1999), and Chief Financial Officer of FMR (1999-2001), Fidelity Personal Investments (2001), and Fidelity Brokerage Company (2001-2002). |
Robert L. Reynolds (51) |
| Year of Election or Appointment: 2003 Mr. Reynolds is a Director (2003) and Chief Operating Officer (2002) of FMR Corp. and is the head of the Fidelity Management Committee (2003). He also serves on the Board at Fidelity Investments Canada, Ltd. (2000). Previously, Mr. Reynolds served as President of Fidelity Investments Institutional Retirement Group (1996-2000). |
* Trustees have been determined to be "Interested Trustees" by virtue of, among other things, their affiliation with the trust or various entities under common control with FMR.
** Edward C. Johnson 3d, Trustee, is Abigail P. Johnson's father.
Annual Report
Non-Interested Trustees:
Correspondence intended for each non-interested Trustee (that is, the Trustees other than the Interested Trustees) may be sent to Fidelity Investments, P.O. Box 55235, Boston, Massachusetts 02205-5235.
Name, Age; Principal Occupation |
J. Michael Cook (61) |
| Year of Election or Appointment: 2001 Prior to Mr. Cook's retirement in May 1999, he served as Chairman and Chief Executive Officer of Deloitte & Touche LLP (accounting/consulting), Chairman of the Deloitte & Touche Foundation, and a member of the Board of Deloitte Touche Tohmatsu. He currently serves as a Director of Comcast (telecommunications, 2002), International Flavors & Fragrances, Inc. (2000), Rockwell Automation (2000) and The Dow Chemical Company (2000). He is a Member of the Diversity Advisory Council of Marakon (2003) and the Advisory Board of the Directorship Search Group, Chairman Emeritus of the Board of Catalyst (a leading organization for the advancement of women in business), and is Chairman of the Accountability Advisory Council to the Comptroller General of the United States. He also serves as a Member of the Advisory Board of the Graduate School of Business of the University of Florida, his alma mater. |
Ralph F. Cox (71) |
| Year of Election or Appointment: 1991 Mr. Cox is President of RABAR Enterprises (management consulting for the petroleum industry). Prior to February 1994, he was President of Greenhill Petroleum Corporation (petroleum exploration and production). Until March 1990, Mr. Cox was President and Chief Operating Officer of Union Pacific Resources Company (exploration and production). He is a Director of CH2M Hill Companies (engineering), and Abraxas Petroleum (petroleum exploration and production, 1999). In addition, he is a member of advisory boards of Texas A&M University and the University of Texas at Austin. |
Phyllis Burke Davis (71) |
| Year of Election or Appointment: 1992 Mrs. Davis is retired from Avon Products, Inc. (consumer products) where she held various positions including Senior Vice President of Corporate Affairs and Group Vice President of U.S. product marketing, sales, distribution, and manufacturing. Mrs. Davis is a member of the Board of Directors of the Southampton Hospital in Southampton, N.Y. (1998). Previously, she served as a Director of BellSouth Corporation (telecommunications), Eaton Corporation (diversified industrial), the TJX Companies, Inc. (retail stores), Hallmark Cards, Inc., and Nabisco Brands, Inc. |
Robert M. Gates (60) |
| Year of Election or Appointment: 1997 Dr. Gates is President of Texas A&M University (2002). He was Director of the Central Intelligence Agency (CIA) from 1991 to 1993. From 1989 to 1991, Dr. Gates served as Assistant to the President of the United States and Deputy National Security Advisor. Dr. Gates is a Director of NACCO Industries, Inc. (mining and manufacturing), and Parker Drilling Co., Inc. (drilling and rental tools for the energy industry, 2001). He also serves as a member of the Advisory Board of VoteHere.net (secure internet voting, 2001). Previously, Dr. Gates served as a Director of LucasVarity PLC (automotive components and diesel engines), a Director of TRW Inc. (automotive, space, defense, and information technology), and Dean of the George Bush School of Government and Public Service at Texas A&M University (1999-2001). Dr. Gates also is a Trustee of the Forum for International Policy. |
Donald J. Kirk (70) |
| Year of Election or Appointment: 1987 Mr. Kirk is a Governor of the American Stock Exchange (2001), a Trustee and former Chairman of the Board of Trustees of the Greenwich Hospital Association, a Director of the Yale-New Haven Health Services Corp. (1998), and a Director Emeritus and former Chairman of the Board of Directors of National Arts Strategies Inc. Mr. Kirk was an Executive-in-Residence (1995-2000) and a Professor (1987-1995) at Columbia University Graduate School of Business. Prior to 1987, he was Chairman of the Financial Accounting Standards Board. Previously, Mr. Kirk served as a Governor of the National Association of Securities Dealers, Inc. (1996-2002), a member and Vice Chairman of the Public Oversight Board of the American Institute of Certified Public Accountants' SEC Practice Section (1995-2002), a Director of General Re Corporation (reinsurance, 1987-1998) and as a Director of Valuation Research Corp. (appraisals and valuations). |
Marie L. Knowles (57) |
| Year of Election or Appointment: 2001 Prior to Ms. Knowles' retirement in June 2000, she served as Executive Vice President and Chief Financial Officer of Atlantic Richfield Company (ARCO) (diversified energy, 1996-2000). From 1993 to 1996, she was a Senior Vice President of ARCO and President of ARCO Transportation Company. She served as a Director of ARCO from 1996 to 1998. She currently serves as a Director of Phelps Dodge Corporation (copper mining and manufacturing), URS Corporation (multidisciplinary engineering, 1999), and McKesson Corporation (healthcare service, 2002). Ms. Knowles is a Trustee of the Brookings Institution and the Catalina Island Conservancy and also serves as a member of the Advisory Board for the School of Engineering of the University of Southern California. |
Ned C. Lautenbach (59) |
| Year of Election or Appointment: 2000 Mr. Lautenbach has been a partner of Clayton, Dubilier & Rice, Inc. (private equity investment firm) since September 1998. Previously, Mr. Lautenbach was with the International Business Machines Corporation (IBM) from 1968 until his retirement in 1998. He was most recently Senior Vice President and Group Executive of Worldwide Sales and Services. From 1993 to 1995, he was Chairman of IBM World Trade Corporation, and from 1994 to 1998 was a member of IBM's Corporate Executive Committee. Mr. Lautenbach serves as Chairman and as a Director (1998) of Acterna Corporation (communications test equipment). He is also Co-Chairman of Covansys, Inc. (global provider of business and technology solutions, 2000). In addition, he is a Director of Eaton Corporation (diversified industrial) and the Philharmonic Center for the Arts in Naples, Florida (1999). He also is a member of the Council on Foreign Relations. |
Marvin L. Mann (70) |
| Year of Election or Appointment: 1993 Mr. Mann is Chairman of the non-interested Trustees (2001). He is Chairman Emeritus of Lexmark International, Inc. (computer peripherals) where he served as CEO until April 1998 and retired as Chairman May 1999, and remains a member of the Board. Prior to 1991, he held the positions of Vice President of International Business Machines Corporation (IBM) and President and General Manager of various IBM divisions and subsidiaries. Mr. Mann is a Board member of Imation Corp. (imaging and information storage) and Acterna Corporation (communications test equipment, 1999). He is also a member of the Director Services Committee of the Investment Company Institute. In addition, Mr. Mann is a member of the President's Cabinet at the University of Alabama and the Board of Visitors of the Culverhouse College of Commerce and Business Administration at the University of Alabama. |
William O. McCoy (70) |
| Year of Election or Appointment: 1997 Prior to his retirement in December 1994, Mr. McCoy was Vice Chairman of the Board of BellSouth Corporation (telecommunications) and President of BellSouth Enterprises. He is currently a Director of Liberty Corporation (holding company), Duke Realty Corporation (real estate), Progress Energy, Inc. (electric utility), and Acterna Corporation (communications test equipment, 1999). He is also a partner of Franklin Street Partners (private investment management firm) and a member of the Research Triangle Foundation Board. In addition, Mr. McCoy served as the Interim Chancellor (1999-2000) and a member of the Board of Visitors (1994-1998) for the University of North Carolina at Chapel Hill and currently serves on the Board of Directors of the University of North Carolina Health Care System and the Board of Visitors of the Kenan-Flagler Business School (University of North Carolina at Chapel Hill). He also served as Vice President of Finance for the University of North Carolina (16-school system, 1995-1998). |
William S. Stavropoulos (64) |
| Year of Election or Appointment: 2001 Mr. Stavropoulos is Chairman of the Board, President and CEO (2002), and Chairman of the Executive Committee (2000) and a Director of The Dow Chemical Company. Since joining The Dow Chemical Company in 1967, Mr. Stavropoulos served in numerous senior management positions, including President (1993-2000) and Chief Executive Officer (1995-2000). Currently, he is a Director of NCR Corporation (data warehousing and technology solutions), BellSouth Corporation (telecommunications), Chemical Financial Corporation, and Maersk Inc. (industrial conglomerate, 2002). He also serves as a member of the Board of Trustees of the American Enterprise Institute for Public Policy Research. In addition, Mr. Stavropoulos is a member of The Business Council, J.P. Morgan International Council, World Business Council for Sustainable Development, and the University of Notre Dame Advisory Council for the College of Science. |
Annual Report
Trustees and Officers - continued
Advisory Board Members and Executive Officers:
Correspondence intended for Dr. Heilmeier may be sent to Fidelity Investments, P.O. Box 55235, Boston, Massachusetts 02205-5235. Correspondence intended for each executive officer and Mr. Lynch may be sent to 82 Devonshire Street, Boston, Massachusetts 02109.
Name, Age; Principal Occupation |
George H. Heilmeier (67) |
| Year of Election or Appointment: 2003 Member of the Advisory Board of Fidelity Advisor Series VIII. Dr. Heilmeier is Chairman Emeritus of Telcordia Technologies (communication software and systems), where prior to his retirement, he served as company Chairman and Chief Executive Officer. He currently serves on the Boards of Directors of The Mitre Corporation (systems engineering and information technology support for the government), INET Technologies Inc. (telecommunications network surveillance, 2001) and Teletech Holdings (customer management services, 1998). He is Chairman of the General Motors Technology Advisory Committee and a Life Fellow of the IEEE (2000). Dr. Heilmeier is a member of the Defense Science Board and the National Security Agency Advisory Board. He is also a member of the National Academy of Engineering, the American Academy of Arts and Sciences and The Board of Overseers of the School of Engineering and Applied Science of the University of Pennsylvania. Previously, Dr. Heilmeier served as a Director of TRW Inc. (automotive, space, defense, and information technology, 1992-2002) and Compaq (1994-2002). |
Peter S. Lynch (60) |
| Year of Election or Appointment: 2003 Member of the Advisory Board of Fidelity Advisor Series VIII. Vice Chairman and a Director of FMR, and Vice Chairman (2001) and a Director (2000) of FMR Co., Inc. Previously, Mr. Lynch served as a Trustee of the Fidelity funds (1990-2003). Prior to May 31, 1990, he was a Director of FMR and Executive Vice President of FMR (a position he held until March 31, 1991), Vice President of Fidelity® Magellan® Fund and FMR Growth Group Leader, and Managing Director of FMR Corp. Mr. Lynch was also Vice President of Fidelity Investments Corporate Services. In addition, he serves as a Trustee of Boston College, Massachusetts Eye & Ear Infirmary, Historic Deerfield, John F. Kennedy Library, and the Museum of Fine Arts of Boston. |
Philip L. Bullen (44) |
| Year of Election or Appointment: 2001 Vice President of Advisor International Capital Appreciation. Mr. Bullen also serves as Vice President of certain Equity Funds (2001) and certain High Income Funds (2001). He is Senior Vice President of FMR (2001) and FMR Co., Inc. (2001), President and a Director of Fidelity Management & Research (Far East) Inc. (2001), President and a Director of Fidelity Management & Research (U.K.) Inc. (2002), and a Director of Strategic Advisers, Inc. (2002). Before joining Fidelity Investments, Mr. Bullen was President and Chief Investment Officer of Santander Global Advisors (1997-2000) and President and Chief Executive Officer of Boston's Baring Asset Management Inc. (1994-1997). |
Kevin R. McCarey (43) |
| Year of Election or Appointment: 1997 Vice President of Advisor International Capital Appreciation. Mr. McCarey is also Vice President of another fund advised by FMR. |
Eric D. Roiter (54) |
| Year of Election or Appointment: 1998 Secretary of Advisor International Capital Appreciation. He also serves as Secretary of other Fidelity funds (1998); Vice President, General Counsel, and Clerk of FMR Co., Inc. (2001) and FMR (1998); Vice President and Clerk of FDC (1998); Assistant Clerk of Fidelity Management & Research (U.K.) Inc. (2001) and Fidelity Management & Research (Far East) Inc. (2001); and Assistant Secretary of Fidelity Investments Money Management Inc. (2001). Prior to joining Fidelity, Mr. Roiter was with the law firm of Debevoise & Plimpton, as an associate (1981-1984) and as a partner (1985-1997), and served as an Assistant General Counsel of the U.S. Securities and Exchange Commission (1979-1981). Mr. Roiter is an Adjunct Member, Faculty of Law, at Boston College Law School (2003). |
Stuart Fross (44) |
| Year of Election or Appointment: 2003 Assistant Secretary of Advisor International Capital Appreciation. Mr. Fross also serves as Assistant Secretary of other Fidelity funds (2003) and is an employee of FMR. |
Maria F. Dwyer (44) |
| Year of Election or Appointment: 2002 President and Treasurer of Advisor International Capital Appreciation. Ms. Dwyer also serves as President and Treasurer of other Fidelity funds (2002) and is a Vice President (1999) and an employee (1996) of FMR. Prior to joining Fidelity, Ms. Dwyer served as Director of Compliance for MFS Investment Management. |
Timothy F. Hayes (52) |
| Year of Election or Appointment: 2002 Chief Financial Officer of Advisor International Capital Appreciation. Mr. Hayes also serves as Chief Financial Officer of other Fidelity funds (2002). Recently he was appointed President of Fidelity Service Company (2003) where he also serves as a Director. Mr. Hayes also serves as President of Fidelity Investments Operations Group (FIOG, 2002), which includes Fidelity Pricing and Cash Management Services Group (FPCMS), where he was appointed President in 1998. Previously, Mr. Hayes served as Chief Financial Officer of Fidelity Investments Corporate Systems and Service Group (1998) and Fidelity Systems Company (1997-1998). |
John R. Hebble (45) |
| Year of Election or Appointment: 2003 Deputy Treasurer of Advisor International Capital Appreciation. Mr. Hebble also serves as Deputy Treasurer of other Fidelity funds (2003), and is an employee of FMR. Before joining Fidelity Investments, Mr. Hebble worked at Deutsche Asset Management where he served as Director of Fund Accounting (2002-2003) and Assistant Treasurer of the Scudder Funds (1998-2003). |
John H. Costello (57) |
| Year of Election or Appointment: 1997 Assistant Treasurer of Advisor International Capital Appreciation. Mr. Costello also serves as Assistant Treasurer of other Fidelity funds and is an employee of FMR. |
Francis V. Knox, Jr. (56) |
| Year of Election or Appointment: 2002 Assistant Treasurer of Advisor International Capital Appreciation. Mr. Knox also serves as Assistant Treasurer of other Fidelity funds (2002), and is a Vice President and an employee of FMR. Previously, Mr. Knox served as Vice President of Investment & Advisor Compliance (1990-2001), and Compliance Officer of Fidelity Management & Research (U.K.) Inc. (1992-2002), Fidelity Management & Research (Far East) Inc. (1991-2002), and FMR Corp. (1995-2002). |
Mark Osterheld (48) |
| Year of Election or Appointment: 2002 Assistant Treasurer of Advisor International Capital Appreciation. Mr. Osterheld also serves as Assistant Treasurer of other Fidelity funds (2002) and is an employee of FMR. |
Thomas J. Simpson (45) |
| Year of Election or Appointment: 2000 Assistant Treasurer of Advisor International Capital Appreciation. Mr. Simpson is Assistant Treasurer of other Fidelity funds (2000) and an employee of FMR (1996). Prior to joining FMR, Mr. Simpson was Vice President and Fund Controller of Liberty Investment Services (1987-1995). |
Annual Report
Annual Report
Annual Report
Annual Report
Annual Report
Annual Report
Investment Adviser
Fidelity Management & Research Company
Boston, MA
Investment Sub-Advisers
FMR Co., Inc.
Fidelity Management & Research
(U.K.) Inc.
Fidelity Management & Research
(Far East) Inc.
Fidelity International
Investment Advisors
Fidelity Investments Japan Limited
Fidelity International Investment Advisors (U.K.) Limited
General Distributor
Fidelity Distributors Corporation
Boston, MA
Transfer and Shareholder
Servicing Agents
Fidelity Investments Institutional Operations Company, Inc.
Boston, MA
Custodian
Brown Brothers Harriman & Co.
Boston, MA
Annual Report
Fidelity Advisor Aggressive Growth Fund |
Fidelity Advisor Asset Allocation Fund |
Fidelity Advisor Balanced Fund |
Fidelity Advisor Biotechnology Fund |
Fidelity Advisor California Municipal Income Fund |
Fidelity Advisor Consumer Industries Fund |
Fidelity Advisor Cyclical Industries Fund |
Fidelity Advisor Developing Communications Fund |
Fidelity Advisor Diversified International Fund |
Fidelity Advisor Dividend Growth Fund |
Fidelity Advisor Dynamic Capital Appreciation Fund |
Fidelity Advisor Electronics Fund |
Fidelity Advisor Emerging Asia Fund |
Fidelity Advisor Emerging Markets Income Fund |
Fidelity Advisor Equity Growth Fund |
Fidelity Advisor Equity Income Fund |
Fidelity Advisor Equity Value Fund |
Fidelity Advisor Europe Capital Appreciation Fund |
Fidelity Advisor Fifty Fund |
Fidelity Advisor Financial Services Fund |
Fidelity Advisor Floating Rate High Income Fund |
Fidelity Advisor Freedom Income FundSM |
Fidelity Advisor Freedom 2010 FundSM |
Fidelity Advisor Freedom 2020 FundSM |
Fidelity Advisor Freedom 2030 FundSM |
Fidelity Advisor Freedom 2040 FundSM |
Fidelity Advisor Global Equity Fund |
Fidelity Advisor Government Investment Fund |
Fidelity Advisor Growth & Income Fund |
Fidelity Advisor Growth Opportunities |
Fidelity Advisor Health Care Fund |
Fidelity Advisor High Income Advantage Fund |
Fidelity Advisor High Income Fund |
Fidelity Advisor Inflation-Protected Bond Fund |
Fidelity Advisor Intermediate Bond Fund |
Fidelity Advisor International Capital Appreciation Fund |
Fidelity Advisor International Small Cap Fund |
Fidelity Advisor Investment Grade Bond Fund |
Fidelity Advisor Japan Fund |
Fidelity Advisor Korea Fund |
Fidelity Advisor Large Cap Fund |
Fidelity Advisor Latin America Fund |
Fidelity Advisor Leveraged Company Stock Fund |
Fidelity Advisor Mid Cap Fund |
Fidelity Advisor Mortgage Securities Fund |
Fidelity Advisor Municipal Income Fund |
Fidelity Advisor Natural Resources Fund |
Fidelity Advisor New Insights Fund |
Fidelity Advisor New York Municipal Income Fund |
Fidelity Advisor Overseas Fund |
Fidelity Advisor Real Estate Fund |
Fidelity Advisor Short Fixed-Income Fund |
Fidelity Advisor Short Intermediate Municipal Income Fund |
Fidelity Advisor Small Cap Fund |
Fidelity Advisor Strategic Growth Fund |
Fidelity Advisor Strategic Income Fund |
Fidelity Advisor Tax Managed
Stock Fund |
Fidelity Advisor Technology Fund |
Fidelity Advisor Telecommunications & Utilities Growth Fund |
Fidelity Advisor Value Leaders Fund |
Fidelity Advisor Value Strategies Fund |
Prime Fund |
Tax-Exempt Fund |
Treasury Fund |
(Fidelity Investment logo)(registered trademark)
Corporate Headquarters
82 Devonshire St., Boston, MA 02109
www.fidelity.com
AICAP-UANN-1203
1.784754.100
Fidelity® Advisor
Investment Grade BondInternational
Capital Appreciation
Fund - Institutional Class
Annual Report
October 31, 2003
Contents
Chairman's Message | <Click Here> | Ned Johnson's message to shareholders. |
Performance | <Click Here> | How the fund has done over time. |
Management's Discussion | <Click Here> | The manager's review of fund performance, strategy and outlook. |
Investment Changes | <Click Here> | A summary of major shifts in the fund's investments over the past six months. |
Investments | <Click Here> | A complete list of the fund's investments with their market values. |
Financial Statements | <Click Here> | Statements of assets and liabilities, operations, and changes in net assets,
as well as financial highlights. |
Notes | <Click Here> | Notes to the financial statements. |
Auditors' Opinion | <Click Here> | |
Trustees and Officers | <Click Here> | |
| | |
| | |
For a free copy of the fund's proxy voting guidelines call 1-877-208-0098 or visit the Securities and Exchange Commission (SEC)'s web site at www.sec.gov.
Third party marks appearing herein are the property of their respective owners.
All other marks appearing herein are registered or unregistered trademarks or service marks of FMR Corp. or an affiliated company.
(Recycle graphic) This report is printed on recycled paper using soy-based inks.
This report and the financial statements contained herein are submitted for the general information of the shareholders of the fund. This report is not authorized for distribution to prospective investors in the fund unless preceded or accompanied by an effective prospectus.
Mutual fund shares are not deposits or obligations of, or guaranteed by, any depository institution. Shares are not insured by the FDIC, Federal Reserve Board or any other agency, and are subject to investment risks, including possible loss of principal amount invested.
Neither the fund nor Fidelity Distributors Corporation is a bank.
For more information on any Fidelity Advisor fund, including charges and expenses, contact your investment professional for a free prospectus. Read it carefully before you invest or send money.
Annual Report
Chairman's Message
(photo_of_Edward_C_Johnson_3d)
Dear Shareholder:
Many of you have read or heard news stories recently that were critical of mutual funds and made allegations that the mutual fund industry has been less than forthright. I find these reports unsettling and not necessarily an accurate picture of the overall industry, and I would like you to know where we at Fidelity stand.
With specific regard to allegations that certain mutual fund companies were violating the Securities and Exchange Commission's forward pricing rules or were involved in so-called "market timing" activities, I want to say two things:
First, Fidelity does not have agreements that permit customers who buy fund shares after 4 p.m. to obtain the 4 p.m. price. This is not to say that someone could not deceive the company through fraudulent acts. But I underscore that we have no so-called "agreements" which would permit this illegal practice.
Second, Fidelity has been on record for years opposing predatory short-term trading which adversely affects other shareholders in a mutual fund. In fact, in the 1980s, we began charging a fee - which is returned to the fund and, therefore, to investors - to discourage this activity. What's more, several years ago we took the industry lead in developing a Fair Value Pricing Policy to prevent market timing on foreign securities in our funds. It is reasonable to assume that another structure can be developed that would alter the system to make it much more difficult for predatory traders to operate. This, however, will only be achieved through close cooperation among regulators, legislators and the industry.
Certainly no industry is perfect, and there have been instances of unethical and illegal activity from time to time within the mutual fund industry. When this occurs, confessed or convicted offenders should be dealt with appropriately. Clearly, every system can be improved. We applaud well thought out improvements by regulators, legislators and industry representatives that achieve the common goal of building and protecting the value of investors' holdings. But we remain concerned about the risk of over-regulation and the quick application of simplistic solutions to intricate problems.
For more than 57 years, Fidelity Investments has worked very hard to improve its products and service to justify your trust. When our family founded this company in 1946, we had only a few hundred customers. Many of them were family and friends. Today, we serve more than 18 million customers including individual investors and participants in retirement plans across America.
Let me close by saying that we do not take your trust in us for granted, and we realize that we must always work to improve all aspects of our service to you. In turn, we urge you to continue your active participation with your financial matters, so that your interests can be well served.
Annual Report
Best regards,
/s/Edward C. Johnson 3d
Edward C. Johnson 3d
Annual Report
Performance: The Bottom Line
Average annual total return reflects the change in the value of an investment, assuming reinvestment of the class' dividend income and capital gains (the profits earned upon the sale of securities that have grown in value) and assuming a constant rate of performance each year. During periods of reimbursement by Fidelity, a fund's total return will be greater than it would be had the reimbursement not occurred. The $10,000 table and the fund's returns do not reflect the deduction of taxes that a shareholder would pay on fund distributions or the redemption of fund shares. How a fund did yesterday is no guarantee of how it will do tomorrow.
Average Annual Total Returns
Periods ended October 31, 2003 | | Past 1
year | Past 5
years | Life of
fundA |
Institutional Class | | 32.67% | 9.39% | 7.94% |
A From November 3, 1997.
$10,000 Over Life of Fund
Let's say hypothetically that $10,000 was invested in Fidelity® Advisor International Capital Appreciation Fund - Institutional Class on November 3, 1997, when the fund started. The chart shows how the value of your investment would have grown, and also shows how the Morgan Stanley Capital InternationalSM AC World Index Free ex USA did over the same period.
Annual Report
Management's Discussion of Fund Performance
Comments from Kevin McCarey, Portfolio Manager of Fidelity® Advisor International Capital Appreciation Portfolio
Mirroring the U.S. rally, most international stock markets rebounded sharply during the 12-month period ending October 31, 2003. Encouraged by improved corporate earnings, favorable interest rates and the easing of geopolitical tensions, the Morgan Stanley Capital InternationalSM Europe, Australasia, Far East (MSCI® EAFE®) Index - a proxy for stock markets outside the United States and Canada - gained 27.39% during the past year. From a regional perspective, all 16 countries in the MSCI Europe index - which gained 24.56% - - had double-digit advances. Spain, Denmark and Sweden were among the region's best performers. In Japan, increased capital spending, exports and machinery orders helped the Tokyo Stock Exchange Stock Price Index (TOPIX) advance 36.39%. Following the SARS epidemic, other Asian markets also rebounded. For instance, the Hong Kong market, as measured by the Hang Seng Index, gained 34.51%. Emerging markets also fared well, particularly Latin America. The MSCI Emerging Markets Free-Latin America Index rose 59.75%. Canadian equities, as measured by the S&P/TSX Composite Index, also posted an impressive annual gain, advancing 50.66%.
For the year ending October 31, 2003, the fund's Institutional Class shares gained 32.67%. During the same time frame, the MSCI All Country World ex-USA Index rose 30.20% and the LipperSM International Funds Average returned 24.51%. The market environment was very conducive to the fund's aggressive style of growth investing, and investments in the semiconductor industry particularly helped performance. Dutch company ASML Holding and Tokyo Electron, both among the world's largest makers of semiconductor equipment, were strong performers. Performance also was helped by Sumitomo Mitsui Financial Group, one of the world's largest banks, which benefited as expectations for an economic recovery increased and optimism rose about Japan's economy. On the negative side, the strong economy led capital goods stocks to perform well, and being underweighted in this area hurt the fund's relative performance. Also, some of the capital goods stocks we did own failed to perform as I hoped. For example, ABB, a Swiss conglomerate, was a strong performer, but I sold it from the fund before it rebounded. Another capital goods disappointment was Neopost, a French maker of postal equipment that encountered weak demand for its products..
The views expressed in this statement reflect those of the portfolio manager only through the end of the period of the report as stated on the cover and do not necessarily represent the views of Fidelity or any other person in the Fidelity organization. Any such views are subject to change at any time based upon market or other conditions and Fidelity disclaims any responsibility to update such views. These views may not be relied on as investment advice and, because investment decisions for a Fidelity fund are based on numerous factors, may not be relied on as an indication of trading intent on behalf of any Fidelity fund.
Annual Report
Investment Changes
Top Five Stocks as of October 31, 2003 |
| % of fund's
net assets | % of fund's net assets
6 months ago |
Nikko Cordial Corp. (Japan, Capital Markets) | 4.7 | 1.4 |
United Microelectronics Corp. (Taiwan, Semiconductors & Semiconductor Equipment) | 4.0 | 0.0 |
Telefonaktiebolaget LM Ericsson (B Shares) (Sweden, Communications Equipment) | 4.0 | 2.7 |
ASML Holding NV (NY Shares) (Netherlands, Semiconductors & Semiconductor Equipment) | 3.6 | 4.6 |
China Telecom Corp. Ltd. (H Shares) (China, Diversified Telecommunication Services) | 3.6 | 0.0 |
| 19.9 | |
Top Five Market Sectors as of October 31, 2003 |
| % of fund's
net assets | % of fund's net assets
6 months ago |
Financials | 28.7 | 20.5 |
Information Technology | 18.0 | 17.5 |
Health Care | 12.9 | 18.9 |
Consumer Discretionary | 10.2 | 14.2 |
Telecommunication Services | 7.3 | 7.6 |
Top Five Countries as of October 31, 2003 |
(excluding cash equivalents) | % of fund's
net assets | % of fund's net assets
6 months ago |
Japan | 19.3 | 10.5 |
United Kingdom | 12.7 | 7.9 |
Switzerland | 8.7 | 11.2 |
Germany | 8.5 | 13.3 |
India | 8.5 | 2.6 |
Percentages are adjusted for the effect of open futures contracts, if applicable. |
Asset Allocation (% of fund's net assets) |
As of October 31, 2003 | As of April 30, 2003 |
| Stocks 91.9% | | | Stocks 94.6% | |
| Short-Term
Investments and
Net Other Assets 8.1% | | | Short-Term
Investments and
Net Other Assets 5.4% | |

Annual Report
Investments October 31, 2003
Showing Percentage of Net Assets
Common Stocks - 91.9% |
| Shares | | Value (Note 1) |
Brazil - 2.0% |
Aracruz Celulose SA sponsored ADR | 391,300 | | $ 10,995,530 |
Canada - 4.7% |
Biovail Corp. (a) | 281,400 | | 6,769,820 |
Precision Drilling Corp. (a) | 168,100 | | 6,613,081 |
Talisman Energy, Inc. | 137,400 | | 6,710,039 |
TELUS Corp. (non-vtg.) | 315,700 | | 5,528,641 |
TOTAL CANADA | | 25,621,581 |
China - 3.6% |
China Telecom Corp. Ltd. (H Shares) | 58,872,000 | | 19,521,402 |
PICC Property & Casualty Co. Ltd. (H Shares) | 122,000 | | 28,564 |
TOTAL CHINA | | 19,549,966 |
Denmark - 1.3% |
Coloplast AS Series B | 86,670 | | 7,266,282 |
France - 2.9% |
Business Objects SA (a) | 268,900 | | 8,784,503 |
Pernod-Ricard | 72,475 | | 6,968,569 |
TOTAL FRANCE | | 15,753,072 |
Germany - 8.5% |
Allianz AG (Reg.) | 103,500 | | 11,057,139 |
Deutsche Boerse AG | 139,550 | | 7,730,662 |
Deutsche Lufthansa AG (Reg.) | 826,500 | | 12,916,121 |
Fresenius Medical Care AG | 263,500 | | 14,972,590 |
TOTAL GERMANY | | 46,676,512 |
Hungary - 0.5% |
OTP Bank Rt. unit (a) | 104,800 | | 2,572,840 |
India - 8.5% |
Bank of Baroda | 1,355,293 | | 5,714,839 |
Bank of India | 3,960,300 | | 5,413,517 |
Cipla Ltd. | 93,185 | | 2,670,330 |
Dr. Reddy's Laboratories Ltd. | 240,600 | | 6,345,214 |
I-Flex Solutions Ltd. | 299,443 | | 4,538,557 |
Reliance Industries Ltd. | 707,600 | | 7,592,804 |
State Bank of India | 781,300 | | 8,347,428 |
State Bank of India GDR (Reg. S) | 195,400 | | 5,871,770 |
TOTAL INDIA | | 46,494,459 |
Common Stocks - continued |
| Shares | | Value (Note 1) |
Indonesia - 0.5% |
PT Bank Central Asia Tbk | 6,498,500 | | $ 2,696,087 |
PT Bank Rakyat Indonesia (a)(c) | 3,206,500 | | 330,218 |
TOTAL INDONESIA | | 3,026,305 |
Italy - 1.4% |
Bulgari Spa | 837,600 | | 7,577,211 |
Japan - 19.3% |
Aeon Credit Service Ltd. | 121,400 | | 5,620,575 |
Canon, Inc. | 102,500 | | 5,017,375 |
Don Quijote Co. Ltd. | 83,700 | | 4,499,427 |
FamilyMart Co. Ltd. | 343,300 | | 7,463,043 |
Konica Minolta Holdings, Inc. | 474,500 | | 6,236,606 |
Nikko Cordial Corp. | 4,710,000 | | 25,405,036 |
Nitto Denko Corp. | 119,900 | | 6,292,732 |
Nomura Holdings, Inc. | 1,033,000 | | 17,739,712 |
Skylark Co. Ltd. | 255,200 | | 4,203,813 |
Sumitomo Mitsui Financial Group, Inc. | 1,481 | | 7,449,454 |
TDK Corp. | 94,700 | | 6,201,928 |
Tokyo Electron Ltd. | 70,500 | | 5,053,120 |
Tv Asahi Corp. | 2,894 | | 4,606,603 |
TOTAL JAPAN | | 105,789,424 |
Korea (South) - 0.9% |
LG Card Co. Ltd. | 479,360 | | 4,880,680 |
Netherlands - 6.0% |
ASML Holding NV (NY Shares) (a) | 1,134,600 | | 19,912,230 |
Versatel Telecom International NV (a) | 2,717,400 | | 6,232,985 |
VNU NV | 189,500 | | 5,751,588 |
Wolters Kluwer NV (Certificaten Van Aandelen) | 59,800 | | 837,539 |
TOTAL NETHERLANDS | | 32,734,342 |
Spain - 1.0% |
Banco Popular Espanol SA (Reg.) | 106,800 | | 5,534,106 |
Sweden - 4.9% |
Securitas AB (B Shares) | 415,000 | | 5,086,304 |
Telefonaktiebolaget LM Ericsson (B Shares) (a) | 12,672,500 | | 21,644,626 |
TOTAL SWEDEN | | 26,730,930 |
Switzerland - 8.7% |
Actelion Ltd. (Reg.) (a) | 151,742 | | 14,375,081 |
Credit Suisse Group (Reg.) | 286,500 | | 10,055,069 |
Novartis AG (Reg.) | 86,850 | | 3,332,434 |
Common Stocks - continued |
| Shares | | Value (Note 1) |
Switzerland - continued |
Roche Holding AG (participation certificate) | 37,730 | | $ 3,109,925 |
Serono SA Series B | 7,477 | | 5,142,320 |
The Swatch Group AG (Reg.) | 305,970 | | 6,504,658 |
UBS AG (Reg.) | 80,220 | | 4,906,788 |
TOTAL SWITZERLAND | | 47,426,275 |
Taiwan - 4.0% |
United Microelectronics Corp. (a) | 23,690,766 | | 21,714,790 |
Turkey - 0.5% |
Akbank Turk Anonim Sirketi | 538,110,600 | | 2,520,671 |
United Kingdom - 12.7% |
British American Tobacco PLC | 828,100 | | 9,997,320 |
Collins Stewart Tullett PLC | 1,014,194 | | 6,616,034 |
EMAP PLC | 406,200 | | 5,509,564 |
HSBC Holdings PLC (United Kingdom) (Reg.) | 756,357 | | 11,355,939 |
Kingfisher PLC | 1,930,026 | | 9,238,417 |
Man Group PLC | 222,000 | | 5,450,512 |
Signet Group PLC | 3,804,400 | | 6,671,792 |
Smith & Nephew PLC | 759,100 | | 6,022,721 |
Vodafone Group PLC | 4,119,300 | | 8,712,323 |
TOTAL UNITED KINGDOM | | 69,574,622 |
TOTAL COMMON STOCKS (Cost $433,148,760) | 502,439,598 |
Money Market Funds - 7.6% |
| | | |
Fidelity Cash Central Fund, 1.07% (b) | 23,184,734 | | 23,184,734 |
Fidelity Securities Lending Cash Central Fund, 1.09% (b) | 18,530,889 | | 18,530,889 |
TOTAL MONEY MARKET FUNDS (Cost $41,715,623) | 41,715,623 |
TOTAL INVESTMENT PORTFOLIO - 99.5% (Cost $474,864,383) | | 544,155,221 |
NET OTHER ASSETS - 0.5% | | 2,767,494 |
NET ASSETS - 100% | $ 546,922,715 |
Legend |
(a) Non-income producing |
(b) The rate quoted is the annualized seven-day yield of the fund at period end. A complete listing of the fund's holdings as of its most recent fiscal year end is available upon request. |
(c) Security or a portion of the security purchased on a delayed delivery or when-issued basis. |
Other Information |
Purchases and sales of securities, other than short-term securities, aggregated $784,903,173 and $565,840,493, respectively. |
The fund placed a portion of its portfolio transactions with brokerage firms which are affiliates of the investment adviser. The commissions paid to these affiliated firms were $134 for the period. |
Income Tax Information |
At October 31, 2003, the fund had a capital loss carryforward of approximately $76,360,000 of which $64,126,000 and $12,234,000 will expire on October 31, 2009 and 2010, respectively. |
See accompanying notes which are an integral part of the financial statements.
Annual Report
Financial Statements
Statement of Assets and Liabilities
| October 31, 2003 |
| | |
Assets | | |
Investment in securities, at value (including securities loaned of $17,776,162) (cost $474,864,383) - See accompanying schedule | | $ 544,155,221 |
Foreign currency held at value (cost $ 5,432,559) | | 5,435,044 |
Receivable for investments sold | | 19,966,221 |
Receivable for fund shares sold | | 3,263,891 |
Dividends receivable | | 460,449 |
Interest receivable | | 40,988 |
Prepaid expenses | | 2,430 |
Other receivables | | 3,145 |
Total assets | | 573,327,389 |
| | |
Liabilities | | |
Payable for investments purchased
Regular delivery | $ 3,979,580 | |
Delayed delivery | 333,520 | |
Payable for fund shares redeemed | 1,848,801 | |
Accrued management fee | 326,273 | |
Distribution fees payable | 157,883 | |
Other payables and accrued expenses | 1,227,728 | |
Collateral on securities loaned, at value | 18,530,889 | |
Total liabilities | | 26,404,674 |
| | |
Net Assets | | $ 546,922,715 |
Net Assets consist of: | | |
Paid in capital | | $ 554,774,985 |
Undistributed net investment income | | 354,316 |
Accumulated undistributed net realized gain (loss) on investments and foreign currency transactions | | (76,424,130) |
Net unrealized appreciation (depreciation) on investments and assets and liabilities in foreign currencies | | 68,217,544 |
Net Assets | | $ 546,922,715 |
See accompanying notes which are an integral part of the financial statements.
Annual Report
Financial Statements - continued
Statement of Assets and Liabilities - continued
| October 31, 2003 |
| | |
Calculation of Maximum Offering Price
Class A:
Net Asset Value and redemption price per share
($41,867,418 ÷ 2,893,569 shares) | | $ 14.47 |
| | |
Maximum offering price per share (100/94.25 of $14.47) | | $ 15.35 |
Class T:
Net Asset Value and redemption price per share ($149,513,522 ÷ 10,400,087 shares) | | $ 14.38 |
| | |
Maximum offering price per share (100/96.50 of $14.38) | | $ 14.90 |
Class B:
Net Asset Value and offering price per share ($50,358,393 ÷ 3,613,802 shares) A | | $ 13.94 |
| | |
Class C:
Net Asset Value and offering price per share ($58,559,912 ÷ 4,196,156 shares) A | | $ 13.96 |
| | |
| | |
Institutional Class:
Net Asset Value, offering price and redemption price per share ($246,623,470 ÷ 16,772,538 shares) | | $ 14.70 |
A Redemption price per share is equal to net asset value less any applicable contingent deferred sales charge.
See accompanying notes which are an integral part of the financial statements.
Annual Report
Statement of Operations
| Year ended October 31, 2003 |
| | |
Investment Income | | |
Dividends | | $ 4,716,191 |
Interest | | 419,630 |
Security lending | | 193,735 |
| | 5,329,556 |
Less foreign taxes withheld | | (514,752) |
Total income | | 4,814,804 |
| | |
Expenses | | |
Management fee | $ 2,248,941 | |
Transfer agent fees | 1,316,134 | |
Distribution fees | 1,461,105 | |
Accounting and security lending fees | 189,462 | |
Non-interested trustees' compensation | 1,157 | |
Custodian fees and expenses | 197,822 | |
Registration fees | 127,981 | |
Audit | 60,616 | |
Legal | 7,766 | |
Miscellaneous | 3,643 | |
Total expenses before reductions | 5,614,627 | |
Expense reductions | (173,357) | 5,441,270 |
Net investment income (loss) | | (626,466) |
Realized and Unrealized Gain (Loss) Net realized gain (loss) on: | | |
Investment securities | 27,965,720 | |
Foreign currency transactions | (134,608) | |
Total net realized gain (loss) | | 27,831,112 |
Change in net unrealized appreciation (depreciation) on: Investment securities (net of deferred foreign taxes of $1,041,856) | 71,760,838 | |
Assets and liabilities in foreign currencies | 267,153 | |
Total change in net unrealized appreciation (depreciation) | | 72,027,991 |
Net gain (loss) | | 99,859,103 |
Net increase (decrease) in net assets resulting from operations | | $ 99,232,637 |
See accompanying notes which are an integral part of the financial statements.
Annual Report
Financial Statements - continued
Statement of Changes in Net Assets
| Year ended
October 31,
2003 | Year ended
October 31,
2002 |
Increase (Decrease) in Net Assets | | |
Operations | | |
Net investment income (loss) | $ (626,466) | $ (812,361) |
Net realized gain (loss) | 27,831,112 | (11,502,014) |
Change in net unrealized appreciation (depreciation) | 72,027,991 | 5,664,330 |
Net increase (decrease) in net assets resulting
from operations | 99,232,637 | (6,650,045) |
Share transactions - net increase (decrease) | 247,591,083 | 29,718,211 |
Total increase (decrease) in net assets | 346,823,720 | 23,068,166 |
| | |
Net Assets | | |
Beginning of period | 200,098,995 | 177,030,829 |
End of period (including undistributed net investment income of $354,316 and undistributed net investment income of $0, respectively) | $ 546,922,715 | $ 200,098,995 |
See accompanying notes which are an integral part of the financial statements.
Annual Report
Financial Highlights - Class A
Years ended October 31, | 2003 | 2002 | 2001 | 2000 | 1999 |
Selected Per-Share Data | | | | | |
Net asset value, beginning of period | $ 10.93 | $ 11.08 | $ 15.26 | $ 15.06 | $ 10.07 |
Income from Investment Operations | | | | | |
Net investment income (loss) C | - E | - E | (.01) | (.03) | (.01) |
Net realized and unrealized gain (loss) | 3.54 | (.15) | (3.73) | .88 | 5.00 |
Total from investment operations | 3.54 | (.15) | (3.74) | .85 | 4.99 |
Distributions from net investment income | - | - | (.44) | - | - |
Distributions in excess of net investment income | - | - | - | (.02) | - |
Distributions from net realized gain | - | - | - | (.63) | - |
Total distributions | - | - | (.44) | (.65) | - |
Net asset value, end of period | $ 14.47 | $ 10.93 | $ 11.08 | $ 15.26 | $ 15.06 |
Total Return A,B | 32.39% | (1.35)% | (25.17)% | 5.31% | 49.55% |
Ratios to Average Net Assets D | | | | | |
Expenses before expense reductions | 1.59% | 1.67% | 1.71% | 1.55% | 2.13% |
Expenses net of voluntary waivers, if any | 1.59% | 1.67% | 1.70% | 1.55% | 1.72% |
Expenses net of all reductions | 1.54% | 1.57% | 1.57% | 1.50% | 1.67% |
Net investment income (loss) | .01% | (.02)% | (.05)% | (.16)% | (.06)% |
Supplemental Data | | | | | |
Net assets, end of period
(000 omitted) | $ 41,867 | $ 16,879 | $ 12,070 | $ 15,348 | $ 3,407 |
Portfolio turnover rate | 205% | 193% | 270% | 308% | 218% |
A Total returns would have been lower had certain expenses not been reduced during the periods shown.
B Total returns do not include the effect of the sales charges.
C Calculated based on average shares outstanding during the period.
D Expense ratios reflect operating expenses of the class. Expenses before reductions do not reflect amounts reimbursed by the investment adviser or reductions from brokerage service arrangements or other expense offset arrangements and do not represent the amount paid by the class during periods when reimbursements or reductions occur. Expenses net of any voluntary waivers reflect expenses after reimbursement by the investment adviser but prior to reductions from brokerage service arrangements or other expense offset arrangements. Expenses net of all reductions represent the net expenses paid by the class.
E Amount represents less than $.01 per-share.
See accompanying notes which are an integral part of the financial statements.
Annual Report
Financial Highlights - Class T
Years ended October 31, | 2003 | 2002 | 2001 | 2000 | 1999 |
Selected Per-Share Data | | | | | |
Net asset value, beginning of period | $ 10.88 | $ 11.05 | $ 15.21 | $ 15.02 | $ 10.04 |
Income from Investment Operations | | | | | |
Net investment income (loss) C | (.03) | (.03) | (.03) | (.06) | (.04) |
Net realized and unrealized gain (loss) | 3.53 | (.14) | (3.73) | .88 | 5.02 |
Total from investment operations | 3.50 | (.17) | (3.76) | .82 | 4.98 |
Distributions from net investment income | - | - | (.40) | - | - |
Distributions in excess of net investment income | - | - | - | (.01) | - |
Distributions from net realized gain | - | - | - | (.62) | - |
Total distributions | - | - | (.40) | (.63) | - |
Net asset value, end of period | $ 14.38 | $ 10.88 | $ 11.05 | $ 15.21 | $ 15.02 |
Total Return A,B | 32.17% | (1.54)% | (25.32)% | 5.13% | 49.60% |
Ratios to Average Net Assets D | | | | | |
Expenses before expense reductions | 1.85% | 1.86% | 1.87% | 1.72% | 2.29% |
Expenses net of voluntary waivers, if any | 1.85% | 1.86% | 1.87% | 1.72% | 1.97% |
Expenses net of all reductions | 1.79% | 1.76% | 1.73% | 1.67% | 1.92% |
Net investment income (loss) | (.24)% | (.21)% | (.22)% | (.33)% | (.31)% |
Supplemental Data | | | | | |
Net assets, end of period
(000 omitted) | $ 149,514 | $ 98,148 | $ 88,818 | $ 145,721 | $ 44,233 |
Portfolio turnover rate | 205% | 193% | 270% | 308% | 218% |
A Total returns would have been lower had certain expenses not been reduced during the periods shown.
B Total returns do not include the effect of the sales charges.
C Calculated based on average shares outstanding during the period.
D Expense ratios reflect operating expenses of the class. Expenses before reductions do not reflect amounts reimbursed by the investment adviser or reductions from brokerage service arrangements or other expense offset arrangements and do not represent the amount paid by the class during periods when reimbursements or reductions occur. Expenses net of any voluntary waivers reflect expenses after reimbursement by the investment adviser but prior to reductions from brokerage service arrangements or other expense offset arrangements. Expenses net of all reductions represent the net expenses paid by the class.
See accompanying notes which are an integral part of the financial statements.
Annual Report
Financial Highlights - Class B
Years ended October 31, | 2003 | 2002 | 2001 | 2000 | 1999 |
Selected Per-Share Data | | | | | |
Net asset value, beginning of period | $ 10.61 | $ 10.84 | $ 14.96 | $ 14.82 | $ 9.99 |
Income from Investment Operations | | | | | |
Net investment income (loss) C | (.09) | (.09) | (.10) | (.16) | (.10) |
Net realized and unrealized gain (loss) | 3.42 | (.14) | (3.67) | .89 | 4.93 |
Total from investment operations | 3.33 | (.23) | (3.77) | .73 | 4.83 |
Distributions from net investment income | - | - | (.35) | - | - |
Distributions in excess of net investment income | - | - | - | (.01) | - |
Distributions from net realized gain | - | - | - | (.58) | - |
Total distributions | - | - | (.35) | (.59) | - |
Net asset value, end of period | $ 13.94 | $ 10.61 | $ 10.84 | $ 14.96 | $ 14.82 |
Total Return A,B | 31.39% | (2.12)% | (25.75)% | 4.60% | 48.35% |
Ratios to Average Net Assets D | | | | | |
Expenses before expense reductions | 2.42% | 2.44% | 2.47% | 2.30% | 2.82% |
Expenses net of voluntary waivers, if any | 2.42% | 2.44% | 2.45% | 2.30% | 2.47% |
Expenses net of all reductions | 2.37% | 2.34% | 2.32% | 2.26% | 2.42% |
Net investment income (loss) | (.82)% | (.79)% | (.80)% | (.92)% | (.81)% |
Supplemental Data | | | | | |
Net assets, end of period
(000 omitted) | $ 50,358 | $ 36,981 | $ 36,593 | $ 49,140 | $ 11,098 |
Portfolio turnover rate | 205% | 193% | 270% | 308% | 218% |
A Total returns would have been lower had certain expenses not been reduced during the periods shown.
B Total returns do not include the effect of the contingent deferred sales charge.
C Calculated based on average shares outstanding during the period.
D Expense ratios reflect operating expenses of the class. Expenses before reductions do not reflect amounts reimbursed by the investment adviser or reductions from brokerage service arrangements or other expense offset arrangements and do not represent the amount paid by the class during periods when reimbursements or reductions occur. Expenses net of any voluntary waivers reflect expenses after reimbursement by the investment adviser but prior to reductions from brokerage service arrangements or other expense offset arrangements. Expenses net of all reductions represent the net expenses paid by the class.
See accompanying notes which are an integral part of the financial statements.
Annual Report
Financial Highlights - Class C
Years ended October 31, | 2003 | 2002 | 2001 | 2000 | 1999 |
Selected Per-Share Data | | | | | |
Net asset value, beginning of period | $ 10.62 | $ 10.83 | $ 14.96 | $ 14.83 | $ 9.98 |
Income from Investment Operations | | | | | |
Net investment income (loss) C | (.08) | (.08) | (.09) | (.15) | (.10) |
Net realized and unrealized gain (loss) | 3.42 | (.13) | (3.67) | .88 | 4.95 |
Total from investment operations | 3.34 | (.21) | (3.76) | .73 | 4.85 |
Distributions from net investment income | - | - | (.37) | - | - |
Distributions in excess of net investment income | - | - | - | (.01) | - |
Distributions from net realized gain | - | - | - | (.59) | - |
Total distributions | - | - | (.37) | (.60) | - |
Net asset value, end of period | $ 13.96 | $ 10.62 | $ 10.83 | $ 14.96 | $ 14.83 |
Total Return A,B | 31.45% | (1.94)% | (25.71)% | 4.59% | 48.60% |
Ratios to Average Net Assets D | | | | | |
Expenses before expense reductions | 2.33% | 2.34% | 2.38% | 2.25% | 2.82% |
Expenses net of voluntary waivers, if any | 2.33% | 2.34% | 2.38% | 2.25% | 2.47% |
Expenses net of all reductions | 2.28% | 2.24% | 2.24% | 2.21% | 2.42% |
Net investment income (loss) | (.73)% | (.69)% | (.73)% | (.86)% | (.81)% |
Supplemental Data | | | | | |
Net assets, end of period
(000 omitted) | $ 58,560 | $ 37,514 | $ 33,118 | $ 44,041 | $ 7,874 |
Portfolio turnover rate | 205% | 193% | 270% | 308% | 218% |
A Total returns would have been lower had certain expenses not been reduced during the periods shown.
B Total returns do not include the effect of the contingent deferred sales charge.
C Calculated based on average shares outstanding during the period.
D Expense ratios reflect operating expenses of the class. Expenses before reductions do not reflect amounts reimbursed by the investment adviser or reductions from brokerage service arrangements or other expense offset arrangements and do not represent the amount paid by the class during periods when reimbursements or reductions occur. Expenses net of any voluntary waivers reflect expenses after reimbursement by the investment adviser but prior to reductions from brokerage service arrangements or other expense offset arrangements. Expenses net of all reductions represent the net expenses paid by the class.
See accompanying notes which are an integral part of the financial statements.
Annual Report
Financial Highlights - Institutional Class
Years ended October 31, | 2003 | 2002 | 2001 | 2000 | 1999 |
Selected Per-Share Data | | | | | |
Net asset value, beginning of period | $ 11.08 | $ 11.17 | $ 15.35 | $ 15.09 | $ 10.09 |
Income from Investment Operations | | | | | |
Net investment income (loss) B | .04 | .06 | .06 | .04 | .02 |
Net realized and unrealized gain (loss) | 3.58 | (.15) | (3.75) | .88 | 4.98 |
Total from investment operations | 3.62 | (.09) | (3.69) | .92 | 5.00 |
Distributions from net investment income | - | - | (.49) | - | - |
Distributions in excess of net investment income | - | - | - | (.03) | - |
Distributions from net realized gain | - | - | - | (.63) | - |
Total distributions | - | - | (.49) | (.66) | - |
Net asset value, end of period | $ 14.70 | $ 11.08 | $ 11.17 | $ 15.35 | $ 15.09 |
Total Return A | 32.67% | (.81)% | (24.75)% | 5.78% | 49.55% |
Ratios to Average Net Assets C | | | | | |
Expenses before expense reductions | 1.28% | 1.15% | 1.19% | 1.15% | 1.70% |
Expenses net of voluntary waivers, if any | 1.28% | 1.15% | 1.19% | 1.15% | 1.47% |
Expenses net of all reductions | 1.22% | 1.06% | 1.05% | 1.10% | 1.42% |
Net investment income (loss) | .33% | .50% | .46% | .24% | .19% |
Supplemental Data | | | | | |
Net assets, end of period
(000 omitted) | $ 246,623 | $ 10,577 | $ 6,432 | $ 9,551 | $ 7,099 |
Portfolio turnover rate | 205% | 193% | 270% | 308% | 218% |
A Total returns would have been lower had certain expenses not been reduced during the periods shown.
B Calculated based on average shares outstanding during the period.
C Expense ratios reflect operating expenses of the class. Expenses before reductions do not reflect amounts reimbursed by the investment adviser or reductions from brokerage service arrangements or other expense offset arrangements and do not represent the amount paid by the class during periods when reimbursements or reductions occur. Expenses net of any voluntary waivers reflect expenses after reimbursement by the investment adviser but prior to reductions from brokerage service arrangements or other expense offset arrangements. Expenses net of all reductions represent the net expenses paid by the class.
See accompanying notes which are an integral part of the financial statements.
Annual Report
Notes to Financial Statements
For the period ended October 31, 2003
1. Significant Accounting Policies.
Fidelity Advisor International Capital Appreciation Fund (the fund) is a fund of Fidelity Advisor Series VIII (the trust) and is authorized to issue an unlimited number of shares. The trust is registered under the Investment Company Act of 1940, as amended (the 1940 Act), as an open-end management investment company organized as a Massachusetts business trust.
The fund offers Class A, Class T, Class B, Class C, and Institutional Class shares, each of which has equal rights as to assets and voting privileges. Each class has exclusive voting rights with respect to matters that affect that class. Class B shares will automatically convert to Class A shares after a holding period of seven years from the initial date of purchase. Investment income, realized and unrealized capital gains and losses, the common expenses of the fund, and certain fund-level expense reductions, if any, are allocated on a pro rata basis to each class based on the relative net assets of each class to the total net assets of the fund. Each class differs with respect to transfer agent and distribution and service plan fees incurred. Certain expense reductions also differ by class.
The fund's investments in emerging markets can be subject to social, economic, regulatory, and political uncertainties and can be extremely volatile. The financial statements have been prepared in conformity with accounting principles generally accepted in the United States of America, which require management to make certain estimates and assumptions at the date of the financial statements. The following summarizes the significant accounting policies of the fund:
Security Valuation. Net asset value per share (NAV calculation) is calculated as of the close of business of the New York Stock Exchange, normally 4:00 p.m. Eastern time. Equity securities for which market quotations are available are valued at the last sale price or official closing price (closing bid price or last evaluated quote if no sale has occurred) on the primary market or exchange on which they trade. If an event that is expected to materially affect the value of a security occurs after the close of an exchange or market on which that security trades, but prior to the NAV calculation, then that security will be fair valued taking the event into account. Securities (including restricted securities) for which market quotations are not readily available are valued at their fair value as determined in good faith under consistently applied procedures under the general supervision of the Board of Trustees. Price movements in futures contracts and ADRs, market and trading trends, the bid/ask quotes of brokers and off-exchange institutional trading may be reviewed in the course of making a good faith determination of a security's fair value. Short-term securities with remaining maturities of sixty days or less for which quotations are not readily available are valued on the basis of amortized cost. Investments in open-end investment companies are valued at their net asset value each business day.
Annual Report
Notes to Financial Statements - continued
1. Significant Accounting Policies - continued
Foreign Currency. The fund uses foreign currency contracts to facilitate transactions in foreign-denominated securities. Losses from these transactions may arise from changes in the value of the foreign currency or if the counterparties do not perform under the contracts' terms.
Foreign denominated assets, including investment securities, and liabilities are translated into U.S. dollars at the exchange rate at period end. Purchases and sales of investment securities, income and dividends received and expenses denominated in foreign currencies are translated into U.S. dollars at the exchange rate in effect on the transaction date.
The effects of exchange rate fluctuations on investments are included with the net realized and unrealized gain (loss) on investment securities. Other foreign currency transactions resulting in realized and unrealized gain (loss) are disclosed separately.
Investment Transactions and Income. Security transactions are accounted for as of trade date. Gains and losses on securities sold are determined on the basis of identified cost. Dividend income is recorded on the ex-dividend date, except for certain dividends from foreign securities where the ex-dividend date may have passed, which are recorded as soon as the fund is informed of the ex-dividend date. Non-cash dividends included in dividend income, if any, are recorded at the fair market value of the securities received. Interest income is accrued as earned. Interest income includes coupon interest and amortization of premium and accretion of discount on debt securities, which is accrued using the interest method. Investment income is recorded net of foreign taxes withheld where recovery of such taxes is uncertain.
Expenses. Most expenses of the trust can be directly attributed to a fund. Expenses which cannot be directly attributed are apportioned among the funds in the trust.
Income Tax Information and Distributions to Shareholders. Each year the fund intends to qualify as a regulated investment company by distributing all of its taxable income and realized gains under Subchapter M of the Internal Revenue Code. As a result, no provision for income taxes is required in the accompanying financial statements. Foreign taxes are provided for based on each fund's understanding of the tax rules and rates that exist in the foreign markets in which it invests. Income dividends and capital gain distributions are declared separately for each class. Distributions are recorded on the ex-dividend date.
Income and capital gain distributions are determined in accordance with income tax regulations, which may differ from generally accepted accounting principles. Capital accounts within the financial statements are adjusted for permanent and temporary book and tax differences. These adjustments have no impact on net assets or the results
Annual Report
1. Significant Accounting Policies - continued
Income Tax Information and Distributions to Shareholders - continued
of operations. Temporary differences will reverse in a subsequent period. These differences are primarily due to foreign currency transactions, passive foreign investment companies (PFIC), capital loss carryforwards and losses deferred due to wash sales. The tax-basis components of distributable earnings and the federal tax cost as of period end were as follows:
Unrealized appreciation | $ 76,037,736 | | |
Unrealized depreciation | (8,022,573) | |
Net unrealized appreciation (depreciation) | 68,015,163 | |
Undistributed ordinary income | 492,324 | |
Capital loss carryforward | (76,359,757) | |
| | |
Cost for federal income tax purposes | $ 476,140,058 | |
Short-Term Trading (Redemption) Fees. Shares purchased after March 31, 2004 and held in the fund less than 30 days will be subject to a short-term trading fee equal to 1.00% of the proceeds of the redeemed shares. The fee, which will be retained by the fund, is accounted for as an addition to paid in capital.
2. Operating Policies.
Repurchase Agreements. Fidelity Management & Research Company (FMR) has received an Exemptive Order from the Securities and Exchange Commission (the SEC) which permits the fund and other affiliated entities of FMR to transfer uninvested cash balances into joint trading accounts. These accounts are then invested in repurchase agreements that are collateralized by U.S. Treasury or Government obligations. The fund may also invest directly with institutions, in repurchase agreements that are collateralized by commercial paper obligations and corporate obligations. Collateral is held in segregated accounts with custodian banks and may be obtained in the event of a default of the counterparty. Collateral is marked-to-market daily and maintained at a value at least equal to the principal amount of the repurchase agreement (including accrued interest).
Delayed Delivery Transactions and When-Issued Securities. The fund may purchase or sell securities on a delayed delivery or when-issued basis. Payment and delivery may take place after the customary settlement period for that security. The price of the underlying securities and the date when the securities will be delivered and paid for are fixed at the time the transaction is negotiated. During the time a delayed delivery sell is outstanding, the contract is marked-to-market daily and equivalent deliverable
Annual Report
Notes to Financial Statements - continued
2. Operating Policies - continued
Delayed Delivery Transactions and When-Issued Securities - continued
securities are held for the transaction. The value of the securities purchased on a delayed delivery or when-issued basis are identified as such in the fund's Schedule of Investments. The fund may receive compensation for interest forgone in the purchase of a delayed delivery or when-issued security. With respect to purchase commitments, the fund identifies securities as segregated in its records with a value at least equal to the amount of the commitment. Losses may arise due to changes in the value of the underlying securities or if the counterparty does not perform under the contract, or if the issuer does not issue the securities due to political, economic, or other factors.
3. Purchases and Sales of Investments.
Information regarding purchases and sales of securities is included under the caption "Other Information" at the end of the fund's Schedule of Investments.
4. Fees and Other Transactions with Affiliates.
Management Fee. FMR and its affiliates provide the fund with investment management related services for which the fund pays a monthly management fee. The management fee is the sum of an individual fund fee rate that is based on an annual rate of .45% of the fund's average net assets and a group fee rate that averaged .28% during the period. The group fee rate is based upon the average net assets of all the mutual funds advised by FMR. The group fee rate decreases as assets under management increase and increases as assets under management decrease. For the period, the total annual management fee rate was .72% of the fund's average net assets.
Distribution and Service Plan. In accordance with Rule 12b-1 of the 1940 Act, the Fund has adopted separate Distribution and Service Plans for each class of shares. Certain classes pay Fidelity Distributors Corporation (FDC), an affiliate of FMR, separate Distribution and Service Fees, each of which is based on an annual percentage of each class' average net assets. Class A and Class T Plans also authorize the use of brokerage commissions to pay distribution expenses. This practice has been discontinued and no commissions incurred after June 30, 2003 have been used to pay distribution expenses. In addition, FDC may pay financial intermediaries for selling shares of the fund
Annual Report
4. Fees and Other Transactions with Affiliates - continued
Distribution and Service Plan - continued
and providing shareholder support services. For the period, the Distribution and Service Fee rates, the total amounts paid to and retained by FDC and the amount of distribution expenses paid with brokerage commissions were as follows:
| Distribution
Fee | Service
Fee | Paid to
FDC | Retained
by FDC | Paid with
Commissions |
Class A | -% | .25% | $ 61,873 | $ - | $ 401 |
Class T | .25% | .25% | 573,493 | 5,427 | 2,235 |
Class B | .75% | .25% | 395,537 | 296,654 | - |
Class C | .75% | .25% | 430,202 | 85,462 | - |
| | | $ 1,461,105 | $ 387,543 | $2,636 |
Sales Load. FDC receives a front-end sales charge of up to 5.75% for selling Class A shares, and 3.50% for selling Class T shares of the fund. FDC receives the proceeds of contingent deferred sales charges levied on Class A, Class T, Class B, and Class C redemptions. These charges depend on the holding period. The deferred sales charges range from 5% to 1% for Class B, 1% for Class C, and .25% for certain purchases of Class A and Class T shares.
For the period, sales charge amounts retained by FDC were as follows:
| Retained
by FDC | |
Class A | $ 25,090 | |
Class T | 14,110 | |
Class B* | 105,556 | |
Class C* | 8,499 | |
| $ 153,255 | |
* When Class B and Class C shares are initially sold, FDC pays commissions from its own resources to financial intermediaries through
which the sales are made.
Annual Report
Notes to Financial Statements - continued
4. Fees and Other Transactions with Affiliates - continued
Transfer Agent Fees. Fidelity Investments Institutional Operations Company, Inc. (FIIOC), an affiliate of FMR, is the transfer, dividend disbursing and shareholder servicing agent (collectively referred to as the transfer agent) for each class of the fund. FIIOC receives account fees and asset-based fees that vary according to the account size and type of account of the shareholders of the respective classes of the fund. FIIOC pays for typesetting, printing and mailing of all shareholder reports, except proxy statements. For the period, the following amounts were paid to FIIOC:
| Amount | % of
Average
Net Assets |
Class A | $ 106,757 | .43 |
Class T | 497,303 | .43 |
Class B | 204,368 | .51 |
Class C | 183,491 | .42 |
Institutional Class | 324,215 | .37 |
| $ 1,316,134 | |
Accounting and Security Lending Fees. Fidelity Service Company, Inc. (FSC), an affiliate of FMR, maintains the fund's accounting records and administers the security lending program. The security lending fee is based on the number and duration of lending transactions. The accounting fee is based on the level of average net assets for the month plus out-of-pocket expenses.
Central Funds. The fund may invest in affiliated Central Funds managed by Fidelity Investments Money Management, Inc. (FIMM), an affiliate of FMR. The Central Funds are open-end investment companies available only to investment companies and other accounts managed by FMR and its affiliates. The Central Funds seek preservation of capital and current income and do not pay a management fee. Income distributions earned by the fund are recorded as income in the accompanying financial statements and totaled $414,432 for the period.
Brokerage Commissions. The fund placed a portion of its portfolio transactions with brokerage firms which are affiliates of the investment adviser. The commissions paid to these affiliated firms are shown under the caption "Other Information" at the end of the fund's Schedule of Investments.
5. Committed Line of Credit.
The fund participates with other funds managed by FMR in a $3.5 billion credit facility (the "line of credit") to be utilized for temporary or emergency purposes to fund shareholder redemptions or for other short-term liquidity purposes. The fund has agreed to pay commitment fees on its pro rata portion of the line of credit. During the period, there were no borrowings on this line of credit.
Annual Report
6. Security Lending.
The fund lends portfolio securities from time to time in order to earn additional income. The fund receives collateral (in the form of U.S. Treasury obligations, letters of credit and/or cash) against the loaned securities and maintains collateral in an amount not less than 100% of the market value of the loaned securities during the period of the loan. The market value of the loaned securities is determined at the close of business of the fund and any additional required collateral is delivered to the fund on the next business day. If the borrower defaults on its obligation to return the securities loaned because of insolvency or other reasons, a fund could experience delays and costs in recovering the securities loaned or in gaining access to the collateral. Cash collateral is invested in cash equivalents. The value of loaned securities and cash collateral at period end are disclosed on the fund's Statement of Assets and Liabilities.
7. Expense Reductions.
Many of the brokers with whom FMR places trades on behalf of the fund provided services to the fund in addition to trade execution. These services may include payments of expenses on behalf of the fund to support distribution of fund shares for Class A and Class T ("Distribution Expense Reduction") and to pay other fund expenses, such as transfer agent fees ("Other Expense Reduction") collectively referred to as "Brokerage Service Arrangements" in the accompanying table. Brokerage service arrangements generally benefits all shareholders of each class by reducing fund expenses. Each of Class A and Class T shareholders' Other Expense Reduction benefit is reduced by the amount of any Distribution Expense Reduction. In addition, through arrangements with the fund's custodian, credits realized as a result of uninvested cash balances were used to reduce the fund's custodian expenses. All of the applicable expense reductions are noted in the table below.
| Brokerage Service
Arrangements | |
| Distribution
expense
reduction | Other
expense
reduction | Custody
expense
reduction |
Fund Level | $ - | $ 169,772 | $ 949 |
Class A | 401 | - | - |
Class T | 2,235 | - | - |
| $ 2,636 | $ 169,772 | $ 949 |
Annual Report
Notes to Financial Statements - continued
8. Share Transactions.
Transactions for each class of shares were as follows:
| Shares | Dollars |
| Years ended October 31, | Years ended October 31, |
| 2003 | 2002 | 2003 | 2002 |
Class A | | | | |
Shares sold | 4,243,415 | 3,695,180 | $ 49,989,621 | $ 45,047,908 |
Shares redeemed | (2,893,829) | (3,240,498) | (32,761,195) | (39,441,245) |
Net increase (decrease) | 1,349,586 | 454,682 | $ 17,228,426 | $ 5,606,663 |
Class T | | | | |
Shares sold | 5,031,240 | 7,972,427 | $ 60,317,196 | $ 98,947,323 |
Shares redeemed | (3,649,898) | (6,989,312) | (42,360,440) | (86,656,988) |
Net increase (decrease) | 1,381,342 | 983,115 | $ 17,956,756 | $ 12,290,335 |
Class B | | | | |
Shares sold | 941,457 | 1,073,501 | $ 11,384,820 | $ 13,249,979 |
Shares redeemed | (812,547) | (964,258) | (9,256,128) | (11,540,142) |
Net increase (decrease) | 128,910 | 109,243 | $ 2,128,692 | $ 1,709,837 |
Class C | | | | |
Shares sold | 1,929,759 | 2,256,558 | $ 23,497,018 | $ 27,408,888 |
Shares redeemed | (1,266,712) | (1,780,095) | (15,061,286) | (21,555,315) |
Net increase (decrease) | 663,047 | 476,463 | $ 8,435,732 | $ 5,853,573 |
Institutional Class | | | | |
Shares sold | 18,971,810 | 1,939,247 | $ 242,761,451 | $ 24,872,811 |
Shares redeemed | (3,154,144) | (1,560,448) | (40,919,974) | (20,615,008) |
Net increase (decrease) | 15,817,666 | 378,799 | $ 201,841,477 | $ 4,257,803 |
Annual Report
Independent Auditors' Report
To the Trustees of Fidelity Advisor Series VIII and Shareholders of Fidelity Advisor International Capital Appreciation Fund:
We have audited the accompanying statement of assets and liabilities of Fidelity Advisor International Capital Appreciation Fund (the Fund), a fund of Fidelity Advisor Series VIII, including the portfolio of investments, as of October 31, 2003, and the related statement of operations for the year then ended, the statement of changes in net assets for each of the two years in the period then ended, and the financial highlights for each of the five years in the period then ended. These financial statements and financial highlights are the responsibility of the Fund's management. Our responsibility is to express an opinion on these financial statements and financial highlights based on our audits.
We conducted our audits in accordance with auditing standards generally accepted in the United States of America. Those standards require that we plan and perform the audit to obtain reasonable assurance about whether the financial statements and financial highlights are free of material misstatement. An audit includes examining, on a test basis, evidence supporting the amounts and disclosures in the financial statements. Our procedures included confirmation of securities owned as of October 31, 2003, by correspondence with the custodian and brokers; where replies were not received from brokers, we performed other auditing procedures. An audit also includes assessing the accounting principles used and significant estimates made by management, as well as evaluating the overall financial statement presentation. We believe that our audits provide a reasonable basis for our opinion.
In our opinion, the financial statements and financial highlights referred to above present fairly, in all material respects, the financial position of Fidelity Advisor International Capital Appreciation Fund as of October 31, 2003, the results of its operations for the year then ended, the changes in its net assets for each of the two years in the period then ended, and its financial highlights for each of the five years in the period then ended, in conformity with accounting principles generally accepted in the United States of America.
/s/DELOITTE & TOUCHE LLP
DELOITTE & TOUCHE LLP
Boston, Massachusetts
December 12, 2003
Annual Report
Trustees and Officers
The Trustees, Members of the Advisory Board, and executive officers of the trust and fund, as applicable, are listed below. The Board of Trustees governs the fund and is responsible for protecting the interests of shareholders. The Trustees are experienced executives who meet periodically throughout the year to oversee the fund's activities, review contractual arrangements with companies that provide services to the fund, and review the fund's performance. Except for William O. McCoy, each of the Trustees oversees 289 funds advised by FMR or an affiliate. Mr. McCoy oversees 291 funds advised by FMR or an affiliate.
The Trustees hold office without limit in time except that (a) any Trustee may resign; (b) any Trustee may be removed by written instrument, signed by at least two-thirds of the number of Trustees prior to such removal; (c) any Trustee who requests to be retired or who has become incapacitated by illness or injury may be retired by written instrument signed by a majority of the other Trustees; and (d) any Trustee may be removed at any special meeting of shareholders by a two-thirds vote of the outstanding voting securities of the trust. In any event, each non-interested Trustee shall retire not later than the last day of the calendar year in which his or her 72nd birthday occurs. The executive officers and Advisory Board Members hold office without limit in time, except that any officer and Advisory Board Member may resign or may be removed by a vote of a majority of the Trustees at any regular meeting or any special meeting of the Trustees. Except as indicated, each individual has held the office shown or other offices in the same company for the past five years.
The fund's Statement of Additional Information (SAI) includes more information about the Trustees. To request a free copy, call Fidelity at 1-877-208-0098.
Interested Trustees*:
Correspondence intended for each Trustee who is an "interested person" (as defined in the 1940 Act) may be sent to 82 Devonshire Street, Boston, Massachusetts 02109.
Name, Age; Principal Occupation |
Edward C. Johnson 3d (73)** |
| Year of Election or Appointment: 1983 Mr. Johnson is Chairman of the Board of Trustees. Mr. Johnson serves as Chief Executive Officer, Chairman, and a Director of FMR Corp.; a Director and Chairman of the Board and of the Executive Committee of FMR; Chairman and a Director of Fidelity Management & Research (Far East) Inc.; Chairman (1998) and a Director of Fidelity Investments Money Management, Inc.; and Chairman (2001) and a Director (2000) of FMR Co., Inc. |
Abigail P. Johnson (41)** |
| Year of Election or Appointment: 2001 Senior Vice President of Advisor International Capital Appreciation (2001). Ms. Johnson also serves as Senior Vice President of other Fidelity funds (2001). She is President and a Director of FMR (2001), Fidelity Investments Money Management, Inc. (2001), FMR Co., Inc. (2001), and a Director of FMR Corp. Previously, Ms. Johnson managed a number of Fidelity funds. |
Laura B. Cronin (49) |
| Year of Election or Appointment: 2003 Ms. Cronin is an Executive Vice President (2002) and Chief Financial Officer (2002) of FMR Corp. and is a member of the Fidelity Management Committee (2003). Previously, Ms. Cronin served as Vice President of Finance of FMR (1997-1999), and Chief Financial Officer of FMR (1999-2001), Fidelity Personal Investments (2001), and Fidelity Brokerage Company (2001-2002). |
Robert L. Reynolds (51) |
| Year of Election or Appointment: 2003 Mr. Reynolds is a Director (2003) and Chief Operating Officer (2002) of FMR Corp. and is the head of the Fidelity Management Committee (2003). He also serves on the Board at Fidelity Investments Canada, Ltd. (2000). Previously, Mr. Reynolds served as President of Fidelity Investments Institutional Retirement Group (1996-2000). |
* Trustees have been determined to be "Interested Trustees" by virtue of, among other things, their affiliation with the trust or various entities under common control with FMR.
** Edward C. Johnson 3d, Trustee, is Abigail P. Johnson's father.
Annual Report
Non-Interested Trustees:
Correspondence intended for each non-interested Trustee (that is, the Trustees other than the Interested Trustees) may be sent to Fidelity Investments, P.O. Box 55235, Boston, Massachusetts 02205-5235.
Name, Age; Principal Occupation |
J. Michael Cook (61) |
| Year of Election or Appointment: 2001 Prior to Mr. Cook's retirement in May 1999, he served as Chairman and Chief Executive Officer of Deloitte & Touche LLP (accounting/consulting), Chairman of the Deloitte & Touche Foundation, and a member of the Board of Deloitte Touche Tohmatsu. He currently serves as a Director of Comcast (telecommunications, 2002), International Flavors & Fragrances, Inc. (2000), Rockwell Automation (2000) and The Dow Chemical Company (2000). He is a Member of the Diversity Advisory Council of Marakon (2003) and the Advisory Board of the Directorship Search Group, Chairman Emeritus of the Board of Catalyst (a leading organization for the advancement of women in business), and is Chairman of the Accountability Advisory Council to the Comptroller General of the United States. He also serves as a Member of the Advisory Board of the Graduate School of Business of the University of Florida, his alma mater. |
Ralph F. Cox (71) |
| Year of Election or Appointment: 1991 Mr. Cox is President of RABAR Enterprises (management consulting for the petroleum industry). Prior to February 1994, he was President of Greenhill Petroleum Corporation (petroleum exploration and production). Until March 1990, Mr. Cox was President and Chief Operating Officer of Union Pacific Resources Company (exploration and production). He is a Director of CH2M Hill Companies (engineering), and Abraxas Petroleum (petroleum exploration and production, 1999). In addition, he is a member of advisory boards of Texas A&M University and the University of Texas at Austin. |
Phyllis Burke Davis (71) |
| Year of Election or Appointment: 1992 Mrs. Davis is retired from Avon Products, Inc. (consumer products) where she held various positions including Senior Vice President of Corporate Affairs and Group Vice President of U.S. product marketing, sales, distribution, and manufacturing. Mrs. Davis is a member of the Board of Directors of the Southampton Hospital in Southampton, N.Y. (1998). Previously, she served as a Director of BellSouth Corporation (telecommunications), Eaton Corporation (diversified industrial), the TJX Companies, Inc. (retail stores), Hallmark Cards, Inc., and Nabisco Brands, Inc. |
Robert M. Gates (60) |
| Year of Election or Appointment: 1997 Dr. Gates is President of Texas A&M University (2002). He was Director of the Central Intelligence Agency (CIA) from 1991 to 1993. From 1989 to 1991, Dr. Gates served as Assistant to the President of the United States and Deputy National Security Advisor. Dr. Gates is a Director of NACCO Industries, Inc. (mining and manufacturing), and Parker Drilling Co., Inc. (drilling and rental tools for the energy industry, 2001). He also serves as a member of the Advisory Board of VoteHere.net (secure internet voting, 2001). Previously, Dr. Gates served as a Director of LucasVarity PLC (automotive components and diesel engines), a Director of TRW Inc. (automotive, space, defense, and information technology), and Dean of the George Bush School of Government and Public Service at Texas A&M University (1999-2001). Dr. Gates also is a Trustee of the Forum for International Policy. |
Donald J. Kirk (70) |
| Year of Election or Appointment: 1987 Mr. Kirk is a Governor of the American Stock Exchange (2001), a Trustee and former Chairman of the Board of Trustees of the Greenwich Hospital Association, a Director of the Yale-New Haven Health Services Corp. (1998), and a Director Emeritus and former Chairman of the Board of Directors of National Arts Strategies Inc. Mr. Kirk was an Executive-in-Residence (1995-2000) and a Professor (1987-1995) at Columbia University Graduate School of Business. Prior to 1987, he was Chairman of the Financial Accounting Standards Board. Previously, Mr. Kirk served as a Governor of the National Association of Securities Dealers, Inc. (1996-2002), a member and Vice Chairman of the Public Oversight Board of the American Institute of Certified Public Accountants' SEC Practice Section (1995-2002), a Director of General Re Corporation (reinsurance, 1987-1998) and as a Director of Valuation Research Corp. (appraisals and valuations). |
Marie L. Knowles (57) |
| Year of Election or Appointment: 2001 Prior to Ms. Knowles' retirement in June 2000, she served as Executive Vice President and Chief Financial Officer of Atlantic Richfield Company (ARCO) (diversified energy, 1996-2000). From 1993 to 1996, she was a Senior Vice President of ARCO and President of ARCO Transportation Company. She served as a Director of ARCO from 1996 to 1998. She currently serves as a Director of Phelps Dodge Corporation (copper mining and manufacturing), URS Corporation (multidisciplinary engineering, 1999), and McKesson Corporation (healthcare service, 2002). Ms. Knowles is a Trustee of the Brookings Institution and the Catalina Island Conservancy and also serves as a member of the Advisory Board for the School of Engineering of the University of Southern California. |
Ned C. Lautenbach (59) |
| Year of Election or Appointment: 2000 Mr. Lautenbach has been a partner of Clayton, Dubilier & Rice, Inc. (private equity investment firm) since September 1998. Previously, Mr. Lautenbach was with the International Business Machines Corporation (IBM) from 1968 until his retirement in 1998. He was most recently Senior Vice President and Group Executive of Worldwide Sales and Services. From 1993 to 1995, he was Chairman of IBM World Trade Corporation, and from 1994 to 1998 was a member of IBM's Corporate Executive Committee. Mr. Lautenbach serves as Chairman and as a Director (1998) of Acterna Corporation (communications test equipment). He is also Co-Chairman of Covansys, Inc. (global provider of business and technology solutions, 2000). In addition, he is a Director of Eaton Corporation (diversified industrial) and the Philharmonic Center for the Arts in Naples, Florida (1999). He also is a member of the Council on Foreign Relations. |
Marvin L. Mann (70) |
| Year of Election or Appointment: 1993 Mr. Mann is Chairman of the non-interested Trustees (2001). He is Chairman Emeritus of Lexmark International, Inc. (computer peripherals) where he served as CEO until April 1998 and retired as Chairman May 1999, and remains a member of the Board. Prior to 1991, he held the positions of Vice President of International Business Machines Corporation (IBM) and President and General Manager of various IBM divisions and subsidiaries. Mr. Mann is a Board member of Imation Corp. (imaging and information storage) and Acterna Corporation (communications test equipment, 1999). He is also a member of the Director Services Committee of the Investment Company Institute. In addition, Mr. Mann is a member of the President's Cabinet at the University of Alabama and the Board of Visitors of the Culverhouse College of Commerce and Business Administration at the University of Alabama. |
William O. McCoy (70) |
| Year of Election or Appointment: 1997 Prior to his retirement in December 1994, Mr. McCoy was Vice Chairman of the Board of BellSouth Corporation (telecommunications) and President of BellSouth Enterprises. He is currently a Director of Liberty Corporation (holding company), Duke Realty Corporation (real estate), Progress Energy, Inc. (electric utility), and Acterna Corporation (communications test equipment, 1999). He is also a partner of Franklin Street Partners (private investment management firm) and a member of the Research Triangle Foundation Board. In addition, Mr. McCoy served as the Interim Chancellor (1999-2000) and a member of the Board of Visitors (1994-1998) for the University of North Carolina at Chapel Hill and currently serves on the Board of Directors of the University of North Carolina Health Care System and the Board of Visitors of the Kenan-Flagler Business School (University of North Carolina at Chapel Hill). He also served as Vice President of Finance for the University of North Carolina (16-school system, 1995-1998). |
William S. Stavropoulos (64) |
| Year of Election or Appointment: 2001 Mr. Stavropoulos is Chairman of the Board, President and CEO (2002), and Chairman of the Executive Committee (2000) and a Director of The Dow Chemical Company. Since joining The Dow Chemical Company in 1967, Mr. Stavropoulos served in numerous senior management positions, including President (1993-2000) and Chief Executive Officer (1995-2000). Currently, he is a Director of NCR Corporation (data warehousing and technology solutions), BellSouth Corporation (telecommunications), Chemical Financial Corporation, and Maersk Inc. (industrial conglomerate, 2002). He also serves as a member of the Board of Trustees of the American Enterprise Institute for Public Policy Research. In addition, Mr. Stavropoulos is a member of The Business Council, J.P. Morgan International Council, World Business Council for Sustainable Development, and the University of Notre Dame Advisory Council for the College of Science. |
Annual Report
Trustees and Officers - continued
Advisory Board Members and Executive Officers:
Correspondence intended for Dr. Heilmeier may be sent to Fidelity Investments, P.O. Box 55235, Boston, Massachusetts 02205-5235. Correspondence intended for each executive officer and Mr. Lynch may be sent to 82 Devonshire Street, Boston, Massachusetts 02109.
Name, Age; Principal Occupation |
George H. Heilmeier (67) |
| Year of Election or Appointment: 2003 Member of the Advisory Board of Fidelity Advisor Series VIII. Dr. Heilmeier is Chairman Emeritus of Telcordia Technologies (communication software and systems), where prior to his retirement, he served as company Chairman and Chief Executive Officer. He currently serves on the Boards of Directors of The Mitre Corporation (systems engineering and information technology support for the government), INET Technologies Inc. (telecommunications network surveillance, 2001) and Teletech Holdings (customer management services, 1998). He is Chairman of the General Motors Technology Advisory Committee and a Life Fellow of the IEEE (2000). Dr. Heilmeier is a member of the Defense Science Board and the National Security Agency Advisory Board. He is also a member of the National Academy of Engineering, the American Academy of Arts and Sciences and The Board of Overseers of the School of Engineering and Applied Science of the University of Pennsylvania. Previously, Dr. Heilmeier served as a Director of TRW Inc. (automotive, space, defense, and information technology, 1992-2002) and Compaq (1994-2002). |
Peter S. Lynch (60) |
| Year of Election or Appointment: 2003 Member of the Advisory Board of Fidelity Advisor Series VIII. Vice Chairman and a Director of FMR, and Vice Chairman (2001) and a Director (2000) of FMR Co., Inc. Previously, Mr. Lynch served as a Trustee of the Fidelity funds (1990-2003). Prior to May 31, 1990, he was a Director of FMR and Executive Vice President of FMR (a position he held until March 31, 1991), Vice President of Fidelity® Magellan® Fund and FMR Growth Group Leader, and Managing Director of FMR Corp. Mr. Lynch was also Vice President of Fidelity Investments Corporate Services. In addition, he serves as a Trustee of Boston College, Massachusetts Eye & Ear Infirmary, Historic Deerfield, John F. Kennedy Library, and the Museum of Fine Arts of Boston. |
Philip L. Bullen (44) |
| Year of Election or Appointment: 2001 Vice President of Advisor International Capital Appreciation. Mr. Bullen also serves as Vice President of certain Equity Funds (2001) and certain High Income Funds (2001). He is Senior Vice President of FMR (2001) and FMR Co., Inc. (2001), President and a Director of Fidelity Management & Research (Far East) Inc. (2001), President and a Director of Fidelity Management & Research (U.K.) Inc. (2002), and a Director of Strategic Advisers, Inc. (2002). Before joining Fidelity Investments, Mr. Bullen was President and Chief Investment Officer of Santander Global Advisors (1997-2000) and President and Chief Executive Officer of Boston's Baring Asset Management Inc. (1994-1997). |
Kevin R. McCarey (43) |
| Year of Election or Appointment: 1997 Vice President of Advisor International Capital Appreciation. Mr. McCarey is also Vice President of another fund advised by FMR. |
Eric D. Roiter (54) |
| Year of Election or Appointment: 1998 Secretary of Advisor International Capital Appreciation. He also serves as Secretary of other Fidelity funds (1998); Vice President, General Counsel, and Clerk of FMR Co., Inc. (2001) and FMR (1998); Vice President and Clerk of FDC (1998); Assistant Clerk of Fidelity Management & Research (U.K.) Inc. (2001) and Fidelity Management & Research (Far East) Inc. (2001); and Assistant Secretary of Fidelity Investments Money Management Inc. (2001). Prior to joining Fidelity, Mr. Roiter was with the law firm of Debevoise & Plimpton, as an associate (1981-1984) and as a partner (1985-1997), and served as an Assistant General Counsel of the U.S. Securities and Exchange Commission (1979-1981). Mr. Roiter is an Adjunct Member, Faculty of Law, at Boston College Law School (2003). |
Stuart Fross (44) |
| Year of Election or Appointment: 2003 Assistant Secretary of Advisor International Capital Appreciation. Mr. Fross also serves as Assistant Secretary of other Fidelity funds (2003) and is an employee of FMR. |
Maria F. Dwyer (44) |
| Year of Election or Appointment: 2002 President and Treasurer of Advisor International Capital Appreciation. Ms. Dwyer also serves as President and Treasurer of other Fidelity funds (2002) and is a Vice President (1999) and an employee (1996) of FMR. Prior to joining Fidelity, Ms. Dwyer served as Director of Compliance for MFS Investment Management. |
Timothy F. Hayes (52) |
| Year of Election or Appointment: 2002 Chief Financial Officer of Advisor International Capital Appreciation. Mr. Hayes also serves as Chief Financial Officer of other Fidelity funds (2002). Recently he was appointed President of Fidelity Service Company (2003) where he also serves as a Director. Mr. Hayes also serves as President of Fidelity Investments Operations Group (FIOG, 2002), which includes Fidelity Pricing and Cash Management Services Group (FPCMS), where he was appointed President in 1998. Previously, Mr. Hayes served as Chief Financial Officer of Fidelity Investments Corporate Systems and Service Group (1998) and Fidelity Systems Company (1997-1998). |
John R. Hebble (45) |
| Year of Election or Appointment: 2003 Deputy Treasurer of Advisor International Capital Appreciation. Mr. Hebble also serves as Deputy Treasurer of other Fidelity funds (2003), and is an employee of FMR. Before joining Fidelity Investments, Mr. Hebble worked at Deutsche Asset Management where he served as Director of Fund Accounting (2002-2003) and Assistant Treasurer of the Scudder Funds (1998-2003). |
John H. Costello (57) |
| Year of Election or Appointment: 1997 Assistant Treasurer of Advisor International Capital Appreciation. Mr. Costello also serves as Assistant Treasurer of other Fidelity funds and is an employee of FMR. |
Francis V. Knox, Jr. (56) |
| Year of Election or Appointment: 2002 Assistant Treasurer of Advisor International Capital Appreciation. Mr. Knox also serves as Assistant Treasurer of other Fidelity funds (2002), and is a Vice President and an employee of FMR. Previously, Mr. Knox served as Vice President of Investment & Advisor Compliance (1990-2001), and Compliance Officer of Fidelity Management & Research (U.K.) Inc. (1992-2002), Fidelity Management & Research (Far East) Inc. (1991-2002), and FMR Corp. (1995-2002). |
Mark Osterheld (48) |
| Year of Election or Appointment: 2002 Assistant Treasurer of Advisor International Capital Appreciation. Mr. Osterheld also serves as Assistant Treasurer of other Fidelity funds (2002) and is an employee of FMR. |
Thomas J. Simpson (45) |
| Year of Election or Appointment: 2000 Assistant Treasurer of Advisor International Capital Appreciation. Mr. Simpson is Assistant Treasurer of other Fidelity funds (2000) and an employee of FMR (1996). Prior to joining FMR, Mr. Simpson was Vice President and Fund Controller of Liberty Investment Services (1987-1995). |
Annual Report
Investment Adviser
Fidelity Management & Research Company
Boston, MA
Investment Sub-Advisers
FMR Co., Inc.
Fidelity Management & Research
(U.K.) Inc.
Fidelity Management & Research
(Far East) Inc.
Fidelity International
Investment Advisors
Fidelity Investments Japan Limited
Fidelity International Investment Advisors (U.K.) Limited
General Distributor
Fidelity Distributors Corporation
Boston, MA
Transfer and Shareholder
Servicing Agents
Fidelity Investments Institutional Operations Company, Inc.
Boston, MA
Custodian
Brown Brothers Harriman & Co.
Boston, MA
Annual Report
Fidelity Advisor Aggressive Growth Fund |
Fidelity Advisor Asset Allocation Fund |
Fidelity Advisor Balanced Fund |
Fidelity Advisor Biotechnology Fund |
Fidelity Advisor California Municipal Income Fund |
Fidelity Advisor Consumer Industries Fund |
Fidelity Advisor Cyclical Industries Fund |
Fidelity Advisor Developing Communications Fund |
Fidelity Advisor Diversified International Fund |
Fidelity Advisor Dividend Growth Fund |
Fidelity Advisor Dynamic Capital Appreciation Fund |
Fidelity Advisor Electronics Fund |
Fidelity Advisor Emerging Asia Fund |
Fidelity Advisor Emerging Markets Income Fund |
Fidelity Advisor Equity Growth Fund |
Fidelity Advisor Equity Income Fund |
Fidelity Advisor Equity Value Fund |
Fidelity Advisor Europe Capital Appreciation Fund |
Fidelity Advisor Fifty Fund |
Fidelity Advisor Financial Services Fund |
Fidelity Advisor Floating Rate High Income Fund |
Fidelity Advisor Freedom Income FundSM |
Fidelity Advisor Freedom 2010 FundSM |
Fidelity Advisor Freedom 2020 FundSM |
Fidelity Advisor Freedom 2030 FundSM |
Fidelity Advisor Freedom 2040 FundSM |
Fidelity Advisor Global Equity Fund |
Fidelity Advisor Government Investment Fund |
Fidelity Advisor Growth & Income Fund |
Fidelity Advisor Growth Opportunities |
Fidelity Advisor Health Care Fund |
Fidelity Advisor High Income Advantage Fund |
Fidelity Advisor High Income Fund |
Fidelity Advisor Inflation-Protected Bond Fund |
Fidelity Advisor Intermediate Bond Fund |
Fidelity Advisor International Capital Appreciation Fund |
Fidelity Advisor International Small Cap Fund |
Fidelity Advisor Investment Grade Bond Fund |
Fidelity Advisor Japan Fund |
Fidelity Advisor Korea Fund |
Fidelity Advisor Large Cap Fund |
Fidelity Advisor Latin America Fund |
Fidelity Advisor Leveraged Company Stock Fund |
Fidelity Advisor Mid Cap Fund |
Fidelity Advisor Mortgage Securities Fund |
Fidelity Advisor Municipal Income Fund |
Fidelity Advisor Natural Resources Fund |
Fidelity Advisor New Insights Fund |
Fidelity Advisor New York Municipal Income Fund |
Fidelity Advisor Overseas Fund |
Fidelity Advisor Real Estate Fund |
Fidelity Advisor Short Fixed-Income Fund |
Fidelity Advisor Short Intermediate Municipal Income Fund |
Fidelity Advisor Small Cap Fund |
Fidelity Advisor Strategic Growth Fund |
Fidelity Advisor Strategic Income Fund |
Fidelity Advisor Tax Managed
Stock Fund |
Fidelity Advisor Technology Fund |
Fidelity Advisor Telecommunications & Utilities Growth Fund |
Fidelity Advisor Value Leaders Fund |
Fidelity Advisor Value Strategies Fund |
Prime Fund |
Tax-Exempt Fund |
Treasury Fund |
(Fidelity Investment logo)(registered trademark)
Corporate Headquarters
82 Devonshire St., Boston, MA 02109
www.fidelity.com
AICAPI-UANN-1203
1.784755.100
Fidelity® Advisor
Japan
Fund - Class A, Class T, Class B
and Class C
Annual Report
October 31, 2003
(2_fidelity_logos) (Registered_Trademark)
Contents
Chairman's Message | <Click Here> | Ned Johnson's message to shareholders. |
Performance | <Click Here> | How the fund has done over time. |
Management's Discussion | <Click Here> | The manager's review of fund performance, strategy and outlook. |
Investment Changes | <Click Here> | A summary of major shifts in the fund's investments over the past six months. |
Investments | <Click Here> | A complete list of the fund's investments with their market values. |
Financial Statements | <Click Here> | Statements of assets and liabilities, operations, and changes in net assets,
as well as financial highlights. |
Notes | <Click Here> | Notes to the financial statements. |
Auditors' Opinion | <Click Here> | |
Trustees and Officers | <Click Here> | |
| | |
| | |
For a free copy of the fund's proxy voting guidelines call 1-877-208-0098 or visit the Securities and Exchange Commission (SEC)'s web site at www.sec.gov.
Third party marks appearing herein are the property of their respective owners.
All other marks appearing herein are registered or unregistered trademarks or service marks of FMR Corp. or an affiliated company.
(Recycle graphic) This report is printed on recycled paper using soy-based inks.
This report and the financial statements contained herein are submitted for the general information of the shareholders of the fund. This report is not authorized for distribution to prospective investors in the fund unless preceded or accompanied by an effective prospectus.
Mutual fund shares are not deposits or obligations of, or guaranteed by, any depository institution. Shares are not insured by the FDIC, Federal Reserve Board or any other agency, and are subject to investment risks, including possible loss of principal amount invested.
Neither the fund nor Fidelity Distributors Corporation is a bank.
For more information on any Fidelity Advisor fund, including charges and expenses, contact your investment professional for a free prospectus. Read it carefully before you invest or send money.
Annual Report
Chairman's Message
(photo_of_Edward_C_Johnson_3d)
Dear Shareholder:
Many of you have read or heard news stories recently that were critical of mutual funds and made allegations that the mutual fund industry has been less than forthright. I find these reports unsettling and not necessarily an accurate picture of the overall industry, and I would like you to know where we at Fidelity stand.
With specific regard to allegations that certain mutual fund companies were violating the Securities and Exchange Commission's forward pricing rules or were involved in so-called "market timing" activities, I want to say two things:
First, Fidelity does not have agreements that permit customers who buy fund shares after 4 p.m. to obtain the 4 p.m. price. This is not to say that someone could not deceive the company through fraudulent acts. But I underscore that we have no so-called "agreements" which would permit this illegal practice.
Second, Fidelity has been on record for years opposing predatory short-term trading which adversely affects other shareholders in a mutual fund. In fact, in the 1980s, we began charging a fee - which is returned to the fund and, therefore, to investors - to discourage this activity. What's more, several years ago we took the industry lead in developing a Fair Value Pricing Policy to prevent market timing on foreign securities in our funds. It is reasonable to assume that another structure can be developed that would alter the system to make it much more difficult for predatory traders to operate. This, however, will only be achieved through close cooperation among regulators, legislators and the industry.
Certainly no industry is perfect, and there have been instances of unethical and illegal activity from time to time within the mutual fund industry. When this occurs, confessed or convicted offenders should be dealt with appropriately. Clearly, every system can be improved. We applaud well thought out improvements by regulators, legislators and industry representatives that achieve the common goal of building and protecting the value of investors' holdings. But we remain concerned about the risk of over-regulation and the quick application of simplistic solutions to intricate problems.
For more than 57 years, Fidelity Investments has worked very hard to improve its products and service to justify your trust. When our family founded this company in 1946, we had only a few hundred customers. Many of them were family and friends. Today, we serve more than 18 million customers including individual investors and participants in retirement plans across America.
Let me close by saying that we do not take your trust in us for granted, and we realize that we must always work to improve all aspects of our service to you. In turn, we urge you to continue your active participation with your financial matters, so that your interests can be well served.
Annual Report
Best regards,
/s/Edward C. Johnson 3d
Edward C. Johnson 3d
Annual Report
Performance: The Bottom Line
Average annual total return reflects the change in the value of an investment, assuming reinvestment of the class' dividend income and capital gains (the profits earned upon the sale of securities that have grown in value) and assuming a constant rate of performance each year. During periods of reimbursement by Fidelity, a fund's total return will be greater than it would be had the reimbursement not occurred. The $10,000 table and the fund's returns do not reflect the deduction of taxes that a shareholder would pay on fund distributions or the redemption of fund shares. How a fund did yesterday is no guarantee of how it will do tomorrow. Returns may reflect the conversion of Class B shares to Class A shares after a maximum of seven years.
Average Annual Total Returns
Periods ended October 31, 2003 | | Past 1
year | Life of
fund A |
Class A (incl. 5.75% sales charge) | | 27.03% | 4.24% |
Class T (incl. 3.50% sales charge) | | 29.70% | 4.41% |
Class B (incl. contingent deferred sales charge) B | | 28.72% | 4.31% |
Class C (incl. contingent deferred sales charge) C | | 32.80% | 4.73% |
A From December 17, 1998.
B Class B shares' contingent deferred sales charges included in the past one year and life of fund total return figures are 5% and 2%, respectively.
C Class C shares' contingent deferred sales charge included in the past one year and life of fund total return figures are 1% and 0%, respectively.
Annual Report
$10,000 Over Life of Fund
Let's say hypothetically that $10,000 was invested in Fidelity® Advisor Japan Fund - Class T on December 17, 1998, when the fund started, and the current 3.50% sales charge was paid. The chart shows how the value of your investment would have grown, and also shows how the Tokyo Stock Exchange Stock Price (TOPIX) Index did over the same period.

Annual Report
Management's Discussion of Fund Performance
Comments from Dale Nicholls, Portfolio Manager of Fidelity® Advisor Japan Fund
Mirroring the U.S. rally, most international stock markets rebounded sharply during the 12-month period ending October 31, 2003. Encouraged by improved corporate earnings, favorable interest rates and the easing of geopolitical tensions, the Morgan Stanley Capital InternationalSM Europe, Australasia, Far East (MSCI® EAFE®) Index - a proxy for stock markets outside the United States and Canada - gained 27.39% during the past year. From a regional perspective, all 16 countries in the MSCI Europe index - which gained 24.56% - - had double-digit advances. Spain, Denmark and Sweden were among the region's best performers. In Japan, increased capital spending, exports and machinery orders helped the Tokyo Stock Exchange Stock Price Index (TOPIX) advance 36.39%. Following the SARS epidemic, other Asian markets also rebounded. For instance, the Hong Kong market, as measured by the Hang Seng Index, gained 34.51%. Emerging markets also fared well, particularly Latin America. The MSCI Emerging Markets Free Latin America index rose 59.75%. Canadian equities, as measured by the S&P/TSX Composite Index, also posted an impressive annual gain, advancing 50.66%.
For the 12 months ending October 31, 2003, the fund's Class A, Class T, Class B and Class C shares returned 34.78%, 34.41%, 33.72% and 33.80%, respectively, slightly trailing the TOPIX but about in line with the 33.74% return of the LipperSM Japanese Funds Average. Stock selection in the banking industry helped performance, as did an overweighting in the semiconductors and semiconductor equipment group. The fund was hurt by unfavorable stock selection in software and services, and a substantial underweighting in the surging capital goods group. Several of the top-10 contributors on both an absolute basis and compared with the index were banks - including UFJ Holdings and Mizuho Financial Group. Meanwhile, semiconductor capital equipment maker Tokyo Electron was helped by generally improving trends in the semiconductor market, and in particular by strong trends in the LCD - liquid crystal display - segment. Conversely, pharmaceutical stock Takeda Chemical hurt performance, as investors looked for more dynamic growth elsewhere in a strong market environment. The same can be said for transportation provider East Japan Railway and office equipment maker Ricoh.
The views expressed in this statement reflect those of the portfolio manager only through the end of the period of the report as stated on the cover and do not necessarily represent the views of Fidelity or any other person in the Fidelity organization. Any such views are subject to change at any time based upon market or other conditions and Fidelity disclaims any responsibility to update such views. These views may not be relied on as investment advice and, because investment decisions for a Fidelity fund are based on numerous factors, may not be relied on as an indication of trading intent on behalf of any Fidelity fund.
Annual Report
Investment Changes
Top Ten Stocks as of October 31, 2003 |
| % of fund's net
assets | % of fund's net assets
6 months ago |
Toyota Motor Corp. | 4.4 | 5.1 |
Nissan Motor Co. Ltd. | 2.5 | 3.1 |
Canon, Inc. | 2.5 | 4.0 |
NTT DoCoMo, Inc. | 2.2 | 4.1 |
Sumitomo Mitsui Financial Group, Inc. | 2.2 | 0.9 |
Mitsubishi Tokyo Financial Group, Inc. (MTFG) | 2.0 | 1.1 |
Takeda Chemical Industries Ltd. | 2.0 | 4.7 |
Konica Minolta Holdings, Inc. | 1.9 | 1.8 |
SFCG Co. Ltd. | 1.7 | 0.0 |
Mitsubishi Securities Co. Ltd. | 1.7 | 0.0 |
| 23.1 | |
Top Five Market Sectors as of October 31, 2003 |
| % of fund's net
assets | % of fund's net assets
6 months ago |
Consumer Discretionary | 25.7 | 25.0 |
Information Technology | 21.4 | 23.1 |
Financials | 19.4 | 12.4 |
Industrials | 9.6 | 7.4 |
Materials | 7.4 | 3.1 |
Asset Allocation (% of fund's net assets) |
As of October 31, 2003 | As of April 30, 2003 |
| Stocks 97.3% | | | Stocks 98.4% | |
| Short-Term
Investments and
Net Other Assets 2.7% | | | Short-Term
Investments and
Net Other Assets 1.6% | |

Annual Report
Investments October 31, 2003
Showing Percentage of Net Assets
Common Stocks - 95.9% |
| Shares | | Value (Note 1) |
CONSUMER DISCRETIONARY - 25.7% |
Auto Components - 2.2% |
Bridgestone Corp. | 23,000 | | $ 301,255 |
FCC Co. Ltd. | 4,500 | | 146,944 |
NOK Corp. | 10,000 | | 393,851 |
Toyoda Gosei Co. Ltd. | 8,000 | | 236,493 |
| | 1,078,543 |
Automobiles - 7.3% |
Honda Motor Co. Ltd. | 5,300 | | 212,530 |
Nissan Motor Co. Ltd. | 108,400 | | 1,225,462 |
Toyota Motor Corp. | 74,600 | | 2,164,144 |
| | 3,602,136 |
Hotels, Restaurants & Leisure - 1.7% |
H.I.S. Co. Ltd. | 16,500 | | 345,188 |
Skylark Co. Ltd. | 29,400 | | 484,295 |
| | 829,483 |
Household Durables - 6.1% |
D&M Holdings, Inc. (a) | 124,000 | | 496,271 |
Daito Trust Construction Co. | 24,000 | | 742,223 |
Matsushita Electric Industrial Co. Ltd. | 52,000 | | 682,240 |
Sanyo Electric Co. Ltd. | 105,000 | | 481,353 |
Sony Corp. | 18,100 | | 637,120 |
| | 3,039,207 |
Internet & Catalog Retail - 1.3% |
Nissen Co. Ltd. | 14,500 | | 271,034 |
Senshukai Co. Ltd. | 33,000 | | 404,321 |
| | 675,355 |
Leisure Equipment & Products - 1.3% |
Fuji Photo Film Co. Ltd. | 14,000 | | 412,589 |
Nidec Copal Corp. | 15,500 | | 259,414 |
| | 672,003 |
Media - 0.9% |
Fuji Television Network, Inc. | 62 | | 329,907 |
SKY Perfect Communications, Inc. (a) | 100 | | 121,885 |
| | 451,792 |
Multiline Retail - 1.6% |
Don Quijote Co. Ltd. | 11,300 | | 607,450 |
Hankyu Department Stores, Inc. | 23,000 | | 168,410 |
| | 775,860 |
Common Stocks - continued |
| Shares | | Value (Note 1) |
CONSUMER DISCRETIONARY - continued |
Specialty Retail - 3.3% |
Fast Retailing Co. Ltd. | 6,500 | | $ 394,943 |
Nishimatsuya Chain Co. Ltd. | 15,200 | | 456,249 |
Pal Co. Ltd. | 7,400 | | 333,182 |
USS Co. Ltd. | 6,140 | | 436,178 |
| | 1,620,552 |
TOTAL CONSUMER DISCRETIONARY | | 12,744,931 |
CONSUMER STAPLES - 3.7% |
Food & Staples Retailing - 2.5% |
FamilyMart Co. Ltd. | 24,800 | | 539,130 |
Ito Yokado Ltd. | 15,000 | | 551,210 |
York-Benimaru Co. Ltd. | 5,300 | | 127,752 |
| | 1,218,092 |
Household Products - 0.6% |
Uni-Charm Corp. | 6,500 | | 303,302 |
Tobacco - 0.6% |
Japan Tobacco, Inc. | 48 | | 320,466 |
TOTAL CONSUMER STAPLES | | 1,841,860 |
FINANCIALS - 18.0% |
Capital Markets - 3.9% |
JAFCO Co. Ltd. | 3,300 | | 282,154 |
Mitsubishi Securities Co. Ltd. | 74,000 | | 841,368 |
Nomura Holdings, Inc. | 47,000 | | 807,131 |
| | 1,930,653 |
Commercial Banks - 8.8% |
Mitsubishi Tokyo Financial Group, Inc. (MTFG) | 136 | | 998,240 |
Mitsui Trust Holdings, Inc. | 148,000 | | 787,520 |
Mizuho Financial Group, Inc. (a) | 324 | | 792,760 |
Sumitomo Mitsui Financial Group, Inc. | 219 | | 1,101,574 |
UFJ Holdings, Inc. (a) | 163 | | 696,835 |
| | 4,376,929 |
Consumer Finance - 3.3% |
Aeon Credit Service Ltd. | 9,700 | | 449,090 |
ORIX Corp. | 4,100 | | 344,961 |
SFCG Co. Ltd. | 5,940 | | 865,552 |
| | 1,659,603 |
Common Stocks - continued |
| Shares | | Value (Note 1) |
FINANCIALS - continued |
Diversified Financial Services - 0.2% |
Ricoh Leasing Co. Ltd. | 4,400 | | $ 82,045 |
Insurance - 1.3% |
Millea Holdings, Inc. | 52 | | 619,611 |
Real Estate - 0.5% |
Mitsubishi Estate Co. Ltd. | 26,000 | | 249,263 |
TOTAL FINANCIALS | | 8,918,104 |
HEALTH CARE - 4.4% |
Health Care Equipment & Supplies - 0.2% |
Japan Medical Dynamic Marketing, Inc. | 6,500 | | 91,641 |
Pharmaceuticals - 4.2% |
Fujisawa Pharmaceutical Co. Ltd. | 11,000 | | 227,124 |
Kyorin Pharmaceutical Co. Ltd. | 30,000 | | 451,610 |
Takeda Chemical Industries Ltd. | 27,700 | | 980,107 |
Yamanouchi Pharmaceutical Co. Ltd. | 17,900 | | 449,372 |
| | 2,108,213 |
TOTAL HEALTH CARE | | 2,199,854 |
INDUSTRIALS - 9.6% |
Air Freight & Logistics - 0.4% |
Yamato Transport Co. Ltd. | 16,000 | | 212,625 |
Commercial Services & Supplies - 3.3% |
Benesse Corp. | 6,000 | | 147,353 |
Meitec Corp. | 9,400 | | 336,020 |
Sumisho Lease Co. Ltd. | 26,200 | | 805,494 |
Toppan Printing Co. Ltd. | 36,000 | | 330,071 |
| | 1,618,938 |
Electrical Equipment - 1.5% |
Fujikura Ltd. | 29,000 | | 174,359 |
Furukawa Electric Co. Ltd. | 72,000 | | 272,440 |
Sumitomo Electric Industries Ltd. | 34,000 | | 292,250 |
| | 739,049 |
Machinery - 1.2% |
SMC Corp. | 2,400 | | 288,812 |
THK Co. Ltd. | 15,300 | | 310,342 |
| | 599,154 |
Common Stocks - continued |
| Shares | | Value (Note 1) |
INDUSTRIALS - continued |
Road & Rail - 1.4% |
East Japan Railway Co. | 152 | | $ 688,521 |
Trading Companies & Distributors - 1.8% |
Mitsui & Co. Ltd. | 49,000 | | 356,558 |
Sumitomo Corp. | 74,000 | | 513,571 |
| | 870,129 |
TOTAL INDUSTRIALS | | 4,728,416 |
INFORMATION TECHNOLOGY - 21.4% |
Computers & Peripherals - 0.9% |
Toshiba Corp. | 116,000 | | 465,308 |
Electronic Equipment & Instruments - 8.6% |
Citizen Electronics Co. Ltd. | 2,300 | | 215,481 |
Enplas Corp. | 2,900 | | 96,280 |
Hoya Corp. | 6,400 | | 579,225 |
Iriso Electronics Co. Ltd. | 14,000 | | 178,279 |
Japan Radio Co. Ltd. (a) | 50,000 | | 241,950 |
Keyence Corp. | 1,400 | | 307,913 |
Kyocera Corp. | 6,400 | | 385,374 |
Murata Manufacturing Co. Ltd. | 5,700 | | 324,040 |
Nichicon Corp. | 21,800 | | 253,415 |
Nidec Corp. | 4,000 | | 387,484 |
Nippon Electric Glass Co. Ltd. | 26,000 | | 477,715 |
Sankyo Seiki Manufacturing Co. Ltd. (a) | 41,000 | | 315,872 |
TDK Corp. | 7,200 | | 471,530 |
| | 4,234,558 |
IT Services - 1.1% |
Hitachi Information Systems Co. Ltd. | 4,400 | | 126,869 |
Nomura Research Institute Ltd. | 2,400 | | 241,222 |
NS Solutions Corp. | 2,600 | | 167,910 |
| | 536,001 |
Office Electronics - 5.4% |
Canon, Inc. | 25,000 | | 1,223,750 |
Konica Minolta Holdings, Inc. | 73,500 | | 966,050 |
Ricoh Co. Ltd. | 26,000 | | 493,087 |
| | 2,682,887 |
Semiconductors & Semiconductor Equipment - 4.9% |
Nikon Corp. (a) | 21,000 | | 318,801 |
Rohm Co. Ltd. | 4,200 | | 566,163 |
Common Stocks - continued |
| Shares | | Value (Note 1) |
INFORMATION TECHNOLOGY - continued |
Semiconductors & Semiconductor Equipment - continued |
Sanken Electric Co. Ltd. | 28,000 | | $ 310,460 |
Shinko Electric Industries Co.Ltd. | 5,000 | | 122,794 |
Tokyo Electron Ltd. | 7,300 | | 523,231 |
UMC Japan (a) | 420 | | 573,040 |
| | 2,414,489 |
Software - 0.5% |
Nintendo Co. Ltd. | 2,200 | | 169,893 |
Works Applications Co. Ltd. (a) | 18 | | 87,430 |
| | 257,323 |
TOTAL INFORMATION TECHNOLOGY | | 10,590,566 |
MATERIALS - 7.4% |
Chemicals - 5.2% |
Daicel Chemical Industries Ltd. | 93,000 | | 394,197 |
Hitachi Chemical Co. Ltd. | 26,500 | | 428,088 |
JSR Corp. | 25,000 | | 529,834 |
Kaneka Corp. | 28,000 | | 218,264 |
Mitsubishi Rayon Co. Ltd. | 79,000 | | 293,178 |
Shin-Etsu Chemical Co. Ltd. | 13,700 | | 509,669 |
Ube Industries Ltd. | 85,000 | | 182,463 |
| | 2,555,693 |
Metals & Mining - 2.2% |
Dowa Mining Co. Ltd. | 34,000 | | 183,700 |
Pacific Metals Co. Ltd. (a) | 82,000 | | 390,831 |
Sumitomo Metal Mining Co. Ltd. | 78,000 | | 534,946 |
| | 1,109,477 |
TOTAL MATERIALS | | 3,665,170 |
TELECOMMUNICATION SERVICES - 4.7% |
Diversified Telecommunication Services - 0.9% |
Nippon Telegraph & Telephone Corp. | 99 | | 445,104 |
Wireless Telecommunication Services - 3.8% |
KDDI Corp. | 144 | | 781,954 |
NTT DoCoMo, Inc. | 515 | | 1,114,881 |
| | 1,896,835 |
TOTAL TELECOMMUNICATION SERVICES | | 2,341,939 |
Common Stocks - continued |
| Shares | | Value (Note 1) |
UTILITIES - 1.0% |
Electric Utilities - 1.0% |
Tokyo Electric Power Co. | 23,700 | | $ 505,517 |
TOTAL COMMON STOCKS (Cost $42,503,863) | 47,536,357 |
Convertible Preferred Stocks - 1.4% |
| | | |
FINANCIALS - 1.4% |
Diversified Financial Services - 1.4% |
SMFG Finance (Cayman) Ltd. Mandatorily Exchangeable Preferred Stock Units 2.25% (c) | 15 | | 708,625 |
TOTAL CONVERTIBLE PREFERRED STOCKS (Cost $411,678) | 708,625 |
Money Market Funds - 5.1% |
| | | |
Fidelity Cash Central Fund, 1.07% (b)
(Cost $2,499,437) | 2,499,437 | | 2,499,437 |
TOTAL INVESTMENT PORTFOLIO - 102.4% (Cost $45,414,978) | | 50,744,419 |
NET OTHER ASSETS - (2.4)% | | (1,186,884) |
NET ASSETS - 100% | $ 49,557,535 |
Legend |
(a) Non-income producing |
(b) The rate quoted is the annualized seven-day yield of the fund at period end. A complete listing of the fund's holdings as of its most recent fiscal year end is available upon request. |
(c) Security exempt from registration under Rule 144A of the Securities Act of 1933. These securities may be resold in transactions exempt from registration, normally to qualified institutional buyers. At the period end, the value of these securities amounted to $708,625 or 1.4% of net assets. |
Other Information |
Purchases and sales of securities, other than short-term securities, aggregated $37,875,231 and $32,168,744, respectively. |
Income Tax Information |
At October 31, 2003, the fund had a capital loss carryforward of approximately $29,847,000 of which $2,859,000, $17,004,000 and $9,984,000 will expire on October 31, 2008, 2009 and 2010, respectively. |
See accompanying notes which are an integral part of the financial statements.
Annual Report
Financial Statements
Statement of Assets and Liabilities
| October 31, 2003 |
| | |
Assets | | |
Investment in securities, at value (including securities loaned of $686,879) (cost $45,414,978) - See accompanying schedule | | $ 50,744,419 |
Foreign currency held at value (cost $ 4,945) | | 5,076 |
Receivable for fund shares sold | | 211,313 |
Dividends receivable | | 125,023 |
Interest receivable | | 2,889 |
Prepaid expenses | | 177 |
Receivable from investment adviser for expense reductions | | 4,084 |
Other receivables | | 2,459 |
Total assets | | 51,095,440 |
| | |
Liabilities | | |
Payable for investments purchased | $ 644,699 | |
Payable for fund shares redeemed | 48,082 | |
Accrued management fee | 30,372 | |
Distribution fees payable | 27,693 | |
Other payables and accrued expenses | 50,374 | |
Collateral on securities loaned, at value | 736,685 | |
Total liabilities | | 1,537,905 |
| | |
Net Assets | | $ 49,557,535 |
Net Assets consist of: | | |
Paid in capital | | $ 74,902,838 |
Accumulated net investment loss | | (142,165) |
Accumulated undistributed net realized gain (loss) on investments and foreign currency transactions | | (30,533,373) |
Net unrealized appreciation (depreciation) on investments and assets and liabilities in foreign currencies | | 5,330,235 |
Net Assets | | $ 49,557,535 |
See accompanying notes which are an integral part of the financial statements.
Annual Report
Financial Statements - continued
Statement of Assets and Liabilities - continued
| October 31, 2003 |
| | |
Calculation of Maximum Offering Price
Class A:
Net Asset Value and redemption price per share
($8,695,239 ÷ 738,316 shares) | | $ 11.78 |
| | |
Maximum offering price per share (100/94.25 of $11.78) | | $ 12.50 |
Class T:
Net Asset Value and redemption price per share ($11,822,557 ÷ 1,012,049 shares) | | $ 11.68 |
| | |
Maximum offering price per share (100/96.50 of $11.68) | | $ 12.10 |
Class B:
Net Asset Value and offering price per share ($14,760,828 ÷ 1,288,163 shares) A | | $ 11.46 |
| | |
Class C:
Net Asset Value and offering price per share ($10,373,737 ÷ 900,573 shares) A | | $ 11.52 |
| | |
| | |
Institutional Class:
Net Asset Value, offering price and redemption price per share ($3,905,174 ÷ 327,838 shares) | | $ 11.91 |
A Redemption price per share is equal to net asset value less any applicable contingent deferred sales charge.
See accompanying notes which are an integral part of the financial statements.
Annual Report
Statement of Operations
| Year ended October 31, 2003 |
| | |
Investment Income | | |
Dividends | | $ 313,761 |
Interest | | 12,421 |
Security lending | | 35,777 |
| | 361,959 |
Less foreign taxes withheld | | (31,577) |
Total income | | 330,382 |
| | |
Expenses | | |
Management fee | $ 243,453 | |
Transfer agent fees | 171,510 | |
Distribution fees | 220,778 | |
Accounting fees and expenses | 66,331 | |
Non-interested trustees' compensation | 132 | |
Custodian fees and expenses | 56,114 | |
Registration fees | 55,857 | |
Audit | 54,186 | |
Legal | 1,334 | |
Miscellaneous | 2,865 | |
Total expenses before reductions | 872,560 | |
Expense reductions | (151,033) | 721,527 |
Net investment income (loss) | | (391,145) |
Realized and Unrealized Gain (Loss) Net realized gain (loss) on: | | |
Investment securities | 1,565,742 | |
Foreign currency transactions | (676) | |
Total net realized gain (loss) | | 1,565,066 |
Change in net unrealized appreciation (depreciation) on: Investment securities | 9,272,997 | |
Assets and liabilities in foreign currencies | 8,091 | |
Total change in net unrealized appreciation (depreciation) | | 9,281,088 |
Net gain (loss) | | 10,846,154 |
Net increase (decrease) in net assets resulting from operations | | $ 10,455,009 |
See accompanying notes which are an integral part of the financial statements.
Annual Report
Financial Statements - continued
Statement of Changes in Net Assets
| Year ended
October 31,
2003 | Year ended October 31,
2002 |
Increase (Decrease) in Net Assets | | |
Operations | | |
Net investment income (loss) | $ (391,145) | $ (653,050) |
Net realized gain (loss) | 1,565,066 | (9,499,258) |
Change in net unrealized appreciation (depreciation) | 9,281,088 | 3,943,300 |
Net increase (decrease) in net assets resulting
from operations | 10,455,009 | (6,209,008) |
Share transactions - net increase (decrease) | 5,652,788 | 2,604,541 |
Total increase (decrease) in net assets | 16,107,797 | (3,604,467) |
| | |
Net Assets | | |
Beginning of period | 33,449,738 | 37,054,205 |
End of period (including accumulated net investment loss of $142,165 and accumulated net investment loss of $0, respectively) | $ 49,557,535 | $ 33,449,738 |
See accompanying notes which are an integral part of the financial statements.
Annual Report
Financial Highlights - Class A
Years ended October 31, | 2003 | 2002 | 2001 | 2000 | 1999 F |
Selected Per-Share Data | | | | | |
Net asset value, beginning of period | $ 8.74 | $ 10.18 | $ 17.78 | $ 19.04 | $ 10.00 |
Income from Investment Operations | | | | | |
Net investment income (loss) E | (.07) | (.13) | (.15) | (.16) | (.13) |
Net realized and unrealized gain (loss) | 3.11 | (1.31) | (6.13) | (.76) | 9.17 |
Total from investment operations | 3.04 | (1.44) | (6.28) | (.92) | 9.04 |
Distributions from net investment income | - | - | (1.32) | (.04) | - |
Distributions in excess of net investment income | - | - | - | (.08) | - |
Distributions from net realized gain | - | - | - | (.22) | - |
Total distributions | - | - | (1.32) | (.34) | - |
Net asset value, end of period | $ 11.78 | $ 8.74 | $ 10.18 | $ 17.78 | $ 19.04 |
Total Return B,C,D | 34.78% | (14.15)% | (37.89)% | (5.07)% | 90.40% |
Ratios to Average Net Assets G | | | | | |
Expenses before expense
reductions | 2.20% | 2.13% | 1.88% | 1.44% | 2.43% A |
Expenses net of voluntary
waivers, if any | 1.75% | 1.94% | 1.88% | 1.44% | 2.02% A |
Expenses net of all reductions | 1.75% | 1.94% | 1.84% | 1.42% | 2.01% A |
Net investment income (loss) | (.76)% | (1.27)% | (1.10)% | (.76)% | (1.04)%A |
Supplemental Data | | | | | |
Net assets, end of period
(000 omitted) | $ 8,695 | $ 3,380 | $ 4,204 | $ 18,657 | $ 7,130 |
Portfolio turnover rate | 99% | 128% | 123% | 169% | 152% A |
A Annualized
B Total returns for periods of less than one year are not annualized.
C Total returns would have been lower had certain expenses not been reduced during the periods shown.
D Total returns do not include the effect of the sales charges.
E Calculated based on average shares outstanding during the period.
F For the period December 17, 1998 (commencement of operations) to October 31, 1999.
G Expense ratios reflect operating expenses of the class. Expenses before reductions do not reflect amounts reimbursed by the investment adviser or reductions from brokerage service arrangements or other expense offset arrangements and do not represent the amount paid by the class during periods when reimbursements or reductions occur. Expense ratios before reductions for start-up periods may not be representative of longer-term operating periods. Expenses net of any voluntary waivers reflect expenses after reimbursement by the investment adviser but prior to reductions from brokerage service arrangements or other expense offset arrangements. Expenses net of all reductions represent the net expenses paid by the class.
See accompanying notes which are an integral part of the financial statements.
Annual Report
Financial Highlights - Class T
Years ended October 31, | 2003 | 2002 | 2001 | 2000 | 1999 F |
Selected Per-Share Data | | | | | |
Net asset value, beginning of period | $ 8.69 | $ 10.17 | $ 17.72 | $ 19.01 | $ 10.00 |
Income from Investment Operations | | | | | |
Net investment income (loss) E | (.09) | (.15) | (.20) | (.21) | (.17) |
Net realized and unrealized gain (loss) | 3.08 | (1.33) | (6.14) | (.75) | 9.18 |
Total from investment operations | 2.99 | (1.48) | (6.34) | (.96) | 9.01 |
Distributions from net investment income | - | - | (1.21) | (.03) | - |
Distributions in excess of net investment income | - | - | - | (.08) | - |
Distributions from net realized gain | - | - | - | (.22) | - |
Total distributions | - | - | (1.21) | (.33) | - |
Net asset value, end of period | $ 11.68 | $ 8.69 | $ 10.17 | $ 17.72 | $ 19.01 |
Total Return B,C,D | 34.41% | (14.55)% | (38.16)% | (5.29)% | 90.10% |
Ratios to Average Net Assets G | | | | | |
Expenses before expense
reductions | 2.57% | 2.45% | 2.25% | 1.71% | 2.63% A |
Expenses net of voluntary
waivers, if any | 2.00% | 2.19% | 2.25% | 1.71% | 2.27% A |
Expenses net of all reductions | 2.00% | 2.18% | 2.21% | 1.69% | 2.26% A |
Net investment income (loss) | (1.01)% | (1.52)% | (1.48)% | (1.03)% | (1.29)% A |
Supplemental Data | | | | | |
Net assets, end of period
(000 omitted) | $ 11,823 | $ 7,731 | $ 10,363 | $ 29,840 | $ 25,682 |
Portfolio turnover rate | 99% | 128% | 123% | 169% | 152% A |
A Annualized
B Total returns for periods of less than one year are not annualized.
C Total returns would have been lower had certain expenses not been reduced during the periods shown.
D Total returns do not include the effect of the sales charges.
E Calculated based on average shares outstanding during the period.
F For the period December 17, 1998 (commencement of operations) to October 31, 1999.
G Expense ratios reflect operating expenses of the class. Expenses before reductions do not reflect amounts reimbursed by the investment adviser or reductions from brokerage service arrangements or other expense offset arrangements and do not represent the amount paid by the class during periods when reimbursements or reductions occur. Expense ratios before reductions for start-up periods may not be representative of longer-term operating periods. Expenses net of any voluntary waivers reflect expenses after reimbursement by the investment adviser but prior to reductions from brokerage service arrangements or other expense offset arrangements. Expenses net of all reductions represent the net expenses paid by the class.
See accompanying notes which are an integral part of the financial statements.
Annual Report
Financial Highlights - Class B
Years ended October 31, | 2003 | 2002 | 2001 | 2000 | 1999 F |
Selected Per-Share Data | | | | | |
Net asset value, beginning of period | $ 8.57 | $ 10.07 | $ 17.55 | $ 18.92 | $ 10.00 |
Income from Investment Operations | | | | | |
Net investment income (loss) E | (.14) | (.20) | (.26) | (.32) | (.23) |
Net realized and unrealized gain (loss) | 3.03 | (1.30) | (6.09) | (.74) | 9.15 |
Total from investment operations | 2.89 | (1.50) | (6.35) | (1.06) | 8.92 |
Distributions from net investment income | - | - | (1.13) | (.03) | - |
Distributions in excess of net investment income | - | - | - | (.06) | - |
Distributions from net realized gain | - | - | - | (.22) | - |
Total distributions | - | - | (1.13) | (.31) | - |
Net asset value, end of period | $ 11.46 | $ 8.57 | $ 10.07 | $ 17.55 | $ 18.92 |
Total Return B,C,D | 33.72% | (14.90)% | (38.44)% | (5.83)% | 89.20% |
Ratios to Average Net AssetsG | | | | | |
Expenses before expense
reductions | 3.03% | 2.90% | 2.74% | 2.25% | 3.18% A |
Expenses net of voluntary
waivers, if any | 2.50% | 2.69% | 2.74% | 2.25% | 2.78% A |
Expenses net of all reductions | 2.50% | 2.68% | 2.71% | 2.23% | 2.77% A |
Net investment income (loss) | (1.51)% | (2.02)% | (1.97)% | (1.57)% | (1.79)% A |
Supplemental Data | | | | | |
Net assets, end of period
(000 omitted) | $ 14,761 | $ 10,229 | $ 13,523 | $ 31,334 | $ 20,667 |
Portfolio turnover rate | 99% | 128% | 123% | 169% | 152% A |
A Annualized
B Total returns for periods of less than one year are not annualized.
C Total returns would have been lower had certain expenses not been reduced during the periods shown.
D Total returns do not include the effect of the contingent deferred sales charge.
E Calculated based on average shares outstanding during the period.
F For the period December 17, 1998 (commencement of operations) to October 31, 1999.
G Expense ratios reflect operating expenses of the class. Expenses before reductions do not reflect amounts reimbursed by the investment adviser or reductions from brokerage service arrangements or other expense offset arrangements and do not represent the amount paid by the class during periods when reimbursements or reductions occur. Expense ratios before reductions for start-up periods may not be representative of longer-term operating periods. Expenses net of any voluntary waivers reflect expenses after reimbursement by the investment adviser but prior to reductions from brokerage service arrangements or other expense offset arrangements. Expenses net of all reductions represent the net expenses paid by the class.
See accompanying notes which are an integral part of the financial statements.
Annual Report
Financial Highlights - Class C
Years ended October 31, | 2003 | 2002 | 2001 | 2000 | 1999 F |
Selected Per-Share Data | | | | | |
Net asset value, beginning of period | $ 8.61 | $ 10.13 | $ 17.58 | $ 18.93 | $ 10.00 |
Income from Investment Operations | | | | | |
Net investment income (loss) E | (.14) | (.20) | (.24) | (.31) | (.24) |
Net realized and unrealized gain (loss) | 3.05 | (1.32) | (6.10) | (.73) | 9.17 |
Total from investment operations | 2.91 | (1.52) | (6.34) | (1.04) | 8.93 |
Distributions from net investment income | - | - | (1.11) | (.03) | - |
Distributions in excess of net investment income | - | - | - | (.06) | - |
Distributions from net realized gain | - | - | - | (.22) | - |
Total distributions | - | - | (1.11) | (.31) | - |
Net asset value, end of period | $ 11.52 | $ 8.61 | $ 10.13 | $ 17.58 | $ 18.93 |
Total Return B,C,D | 33.80% | (15.00)% | (38.27)% | (5.72)% | 89.30% |
Ratios to Average Net Assets G | | | | | |
Expenses before expense
reductions | 2.82% | 2.72% | 2.59% | 2.16% | 3.11% A |
Expenses net of voluntary
waivers, if any | 2.50% | 2.67% | 2.59% | 2.16% | 2.78% A |
Expenses net of all reductions | 2.49% | 2.67% | 2.55% | 2.15% | 2.76% A |
Net investment income (loss) | (1.51)% | (2.00)% | (1.81)% | (1.49)% | (1.79)% A |
Supplemental Data | | | | | |
Net assets, end of period
(000 omitted) | $ 10,374 | $ 6,497 | $ 8,170 | $ 25,481 | $ 22,213 |
Portfolio turnover rate | 99% | 128% | 123% | 169% | 152% A |
A Annualized
B Total returns for periods of less than one year are not annualized.
C Total returns would have been lower had certain expenses not been reduced during the periods shown.
D Total returns do not include the effect of the contingent deferred sales charge.
E Calculated based on average shares outstanding during the period.
F For the period December 17, 1998 (commencement of operations) to October 31, 1999.
G Expense ratios reflect operating expenses of the class. Expenses before reductions do not reflect amounts reimbursed by the investment adviser or reductions from brokerage service arrangements or other expense offset arrangements and do not represent the amount paid by the class during periods when reimbursements or reductions occur. Expense ratios before reductions for start-up periods may not be representative of longer-term operating periods. Expenses net of any voluntary waivers reflect expenses after reimbursement by the investment adviser but prior to reductions from brokerage service arrangements or other expense offset arrangements. Expenses net of all reductions represent the net expenses paid by the class.
See accompanying notes which are an integral part of the financial statements.
Annual Report
Financial Highlights - Institutional Class
Years ended October 31, | 2003 | 2002 | 2001 | 2000 | 1999 E |
Selected Per-Share Data | | | | | |
Net asset value, beginning of period | $ 8.82 | $ 10.25 | $ 17.88 | $ 19.09 | $ 10.00 |
Income from Investment Operations | | | | | |
Net investment income (loss) D | (.05) | (.08) | (.10) | (.09) | (.10) |
Net realized and unrealized gain (loss) | 3.14 | (1.35) | (6.16) | (.77) | 9.19 |
Total from investment operations | 3.09 | (1.43) | (6.26) | (.86) | 9.09 |
Distributions from net investment income | - | - | (1.37) | (.04) | - |
Distributions in excess of net investment income | - | - | - | (.09) | - |
Distributions from net realized gain | - | - | - | (.22) | - |
Total distributions | - | - | (1.37) | (.35) | - |
Net asset value, end of period | $ 11.91 | $ 8.82 | $ 10.25 | $ 17.88 | $ 19.09 |
Total Return B,C | 35.03% | (13.95)% | (37.64)% | (4.75)% | 90.90% |
Ratios to Average Net Assets F | | | | | |
Expenses before expense
reductions | 1.67% | 1.52% | 1.48% | 1.13% | 2.15% A |
Expenses net of voluntary
waivers, if any | 1.50% | 1.51% | 1.48% | 1.13% | 1.77% A |
Expenses net of all reductions | 1.49% | 1.51% | 1.44% | 1.11% | 1.76% A |
Net investment income (loss) | (.51)% | (.84)% | (.70)% | (.45)% | (.78)% A |
Supplemental Data | | | | | |
Net assets, end of period
(000 omitted) | $ 3,905 | $ 5,612 | $ 795 | $ 2,746 | $ 2,986 |
Portfolio turnover rate | 99% | 128% | 123% | 169% | 152% A |
A Annualized
B Total returns for periods of less than one year are not annualized.
C Total returns would have been lower had certain expenses not been reduced during the periods shown.
D Calculated based on average shares outstanding during the period.
E For the period December 17, 1998 (commencement of operations) to October 31, 1999.
F Expense ratios reflect operating expenses of the class. Expenses before reductions do not reflect amounts reimbursed by the investment adviser or reductions from brokerage service arrangements or other expense offset arrangements and do not represent the amount paid by the class during periods when reimbursements or reductions occur. Expense ratios before reductions for start-up periods may not be representative of longer-term operating periods. Expenses net of any voluntary waivers reflect expenses after reimbursement by the investment adviser but prior to reductions from brokerage service arrangements or other expense offset arrangements. Expenses net of all reductions represent the net expenses paid by the class.
See accompanying notes which are an integral part of the financial statements.
Annual Report
Notes to Financial Statements
For the period ended October 31, 2003
1. Significant Accounting Policies.
Fidelity Advisor Japan Fund (the fund) is a fund of Fidelity Advisor Series VIII (the trust) and is authorized to issue an unlimited number of shares. The trust is registered under the Investment Company Act of 1940, as amended (the 1940 Act), as an open-end management investment company organized as a Massachusetts business trust.
The fund offers Class A, Class T, Class B, Class C and Institutional Class shares, each of which has equal rights as to assets and voting privileges. Each class has exclusive voting rights with respect to matters that affect that class. Class B shares will automatically convert to Class A shares after a holding period of seven years from the initial date of purchase. Investment income, realized and unrealized capital gains and losses, the common expenses of the fund, and certain fund-level expense reductions, if any, are allocated on a pro rata basis to each class based on the relative net assets of each class to the total net assets of the fund. Each class differs with respect to transfer agent and distribution and service plan fees incurred. Certain expense reductions also differ by class.
The financial statements have been prepared in conformity with accounting principles generally accepted in the United States of America, which require management to make certain estimates and assumptions at the date of the financial statements. The following summarizes the significant accounting policies of the fund:
Security Valuation. Net asset value per share (NAV calculation) is calculated as of the close of business of the New York Stock Exchange, normally 4:00 p.m. Eastern time. Equity securities for which market quotations are available are valued at the last sale price or official closing price (closing bid price or last evaluated quote if no sale has occurred) on the primary market or exchange on which they trade. If an event that is expected to materially affect the value of a security occurs after the close of an exchange or market on which that security trades, but prior to the NAV calculation, then that security will be fair valued taking the event into account. Securities (including restricted securities) for which market quotations are not readily available are valued at their fair value as determined in good faith under consistently applied procedures under the general supervision of the Board of Trustees. Price movements in futures contracts and ADRs, market and trading trends, the bid/ask quotes of brokers and off-exchange institutional trading may be reviewed in the course of making a good faith determination of a security's fair value. Short-term securities with remaining maturities of sixty days or less for which quotations are not readily available are valued on the basis of amortized cost. Investments in open-end investment companies are valued at their net asset value each business day.
Annual Report
Notes to Financial Statements - continued
1. Significant Accounting Policies - continued
Foreign Currency. The fund uses foreign currency contracts to facilitate transactions in foreign-denominated securities. Losses from these transactions may arise from changes in the value of the foreign currency or if the counterparties do not perform under the contracts' terms.
Foreign denominated assets, including investment securities, and liabilities are translated into U.S. dollars at the exchange rate at period end. Purchases and sales of investment securities, income and dividends received and expenses denominated in foreign currencies are translated into U.S. dollars at the exchange rate in effect on the transaction date.
The effects of exchange rate fluctuations on investments are included with the net realized and unrealized gain (loss) on investment securities. Other foreign currency transactions resulting in realized and unrealized gain (loss) are disclosed separately.
Investment Transactions and Income. Security transactions are accounted for as of trade date. Gains and losses on securities sold are determined on the basis of identified cost. Dividend income is recorded on the ex-dividend date, except for certain dividends from foreign securities where the ex-dividend date may have passed, which are recorded as soon as the fund is informed of the ex-dividend date. Non-cash dividends included in dividend income, if any, are recorded at the fair market value of the securities received. Interest income is accrued as earned. Interest income includes coupon interest and amortization of premium and accretion of discount on debt securities, which is accrued using the interest method. Investment income is recorded net of foreign taxes withheld where recovery of such taxes is uncertain.
Expenses. Most expenses of the trust can be directly attributed to a fund. Expenses which cannot be directly attributed are apportioned among the funds in the trust.
Income Tax Information and Distributions to Shareholders. Each year the fund intends to qualify as a regulated investment company by distributing all of its taxable income and realized gains under Subchapter M of the Internal Revenue Code. As a result, no provision for income taxes is required in the accompanying financial statements. Foreign taxes are provided for based on each fund's understanding of the tax rules and rates that exist in the foreign markets in which it invests. Income dividends and capital gain distributions are declared separately for each class. Distributions are recorded on the ex-dividend date.
Income and capital gain distributions are determined in accordance with income tax regulations, which may differ from generally accepted accounting principles. Capital accounts within the financial statements are adjusted for permanent and temporary book and tax differences. These adjustments have no impact on net assets or the results of operations. Temporary differences will reverse in a subsequent period. These differ
Annual Report
1. Significant Accounting Policies - continued
Income Tax Information and Distributions to Shareholders - continued
ences are primarily due to foreign currency transactions, passive foreign investment companies (PFIC), net operating losses, capital loss carryforwards and losses deferred due to wash sales.
The tax-basis components of distributable earnings and the federal tax cost as of period end were as follows:
Unrealized appreciation | $ 6,903,494 | | |
Unrealized depreciation | (2,401,441) | |
Net unrealized appreciation (depreciation) | 4,502,053 | |
Capital loss carryforward | (29,847,355) | |
| | |
Cost for federal income tax purposes | $ 46,242,366 | |
Short-Term Trading (Redemption) Fees. Shares purchased after March 31, 2004 and held in the fund less than 90 days will be subject to a short-term trading fee equal to 1.50% of the proceeds of the redeemed shares. The fee, which will be retained by the fund, is accounted for as an addition to paid in capital.
2. Operating Policies.
Repurchase Agreements. Fidelity Management & Research Company (FMR) has received an Exemptive Order from the Securities and Exchange Commission (the SEC) which permits the fund and other affiliated entities of FMR to transfer uninvested cash balances into joint trading accounts. These accounts are then invested in repurchase agreements that are collateralized by U.S. Treasury or Government obligations. The fund may also invest directly with institutions, in repurchase agreements that are collateralized by commercial paper obligations and corporate obligations. Collateral is held in segregated accounts with custodian banks and may be obtained in the event of a default of the counterparty. Collateral is marked-to-market daily and maintained at a value at least equal to the principal amount of the repurchase agreement (including accrued interest).
3. Purchases and Sales of Investments.
Information regarding purchases and sales of securities is included under the caption "Other Information" at the end of the fund's Schedule of Investments.
4. Fees and Other Transactions with Affiliates.
Management Fee. FMR and its affiliates provide the fund with investment management related services for which the fund pays a monthly management fee. The management fee is the sum of an individual fund fee rate that is based on an annual rate of .45% of the fund's average net assets and a group fee rate that averaged .28% during the
Annual Report
Notes to Financial Statements - continued
4. Fees and Other Transactions with Affiliates - continued
Management Fee - continued
period. The group fee rate is based upon the average net assets of all the mutual funds advised by FMR. The group fee rate decreases as assets under management increase and increases as assets under management decrease. For the period, the total annual management fee rate was .73% of the fund's average net assets.
Distribution and Service Plan. In accordance with Rule 12b-1 of the 1940 Act, the Fund has adopted separate Distribution and Service Plans for each class of shares. Certain classes pay Fidelity Distributors Corporation (FDC), an affiliate of FMR, separate Distribution and Service Fees, each of which is based on an annual percentage of each class' average net assets. Class A and Class T Plans also authorize the use of brokerage commissions to pay distribution expenses. This practice has been discontinued and no commissions incurred after June 30, 2003 have been used to pay distribution expenses. In addition, FDC may pay financial intermediaries for selling shares of the fund and providing shareholder support services. For the period, the Distribution and Service Fee rates, the total amounts paid to and retained by FDC and the amount of distribution expenses paid with brokerage commissions were as follows:
| Distribution
Fee | Service
Fee | Paid to
FDC | Retained
by FDC | Paid with
Commissions |
Class A | -% | .25% | $ 12,142 | $ - | $ - |
Class T | .25% | .25% | 38,942 | - | - |
Class B | .75% | .25% | 105,492 | 79,217 | - |
Class C | .75% | .25% | 64,202 | 12,914 | - |
| | | $ 220,778 | $ 92,131 | $ - |
Sales Load. FDC receives a front-end sales charge of up to 5.75% for selling Class A shares, and 3.50% for selling Class T shares of the fund. FDC receives the proceeds of contingent deferred sales charges levied on Class A, Class T, Class B, and Class C redemptions. These charges depend on the holding period. The deferred sales charges range from 5% to 1% for Class B, 1% for Class C, and .25% for certain purchases of Class A and Class T shares.
For the period, sales charge amounts retained by FDC were as follows:
| Retained
by FDC |
Class A | $ 18,186 |
Class T | 5,665 |
Class B* | 45,500 |
Class C* | 4,513 |
| $ 73,864 |
* When Class B and Class C shares are initially sold, FDC pays commissions from its own resources to financial intermediaries through which the sales are made.
Annual Report
4. Fees and Other Transactions with Affiliates - continued
Transfer Agent Fees. Fidelity Investments Institutional Operations Company, Inc. (FIIOC), an affiliate of FMR, is the transfer, dividend disbursing and shareholder servicing agent (collectively referred to as the transfer agent) for each class of the fund. FIIOC receives account fees and asset-based fees that vary according to the account size and type of account of the shareholders of the respective classes of the fund. FIIOC pays for typesetting, printing and mailing of all shareholder reports, except proxy statements. For the period, the following amounts were paid to FIIOC:
| Amount | % of
Average
Net Assets |
Class A | $ 25,167 | .51 |
Class T | 50,078 | .64 |
Class B | 62,791 | .59 |
Class C | 25,087 | .39 |
Institutional Class | 8,387 | .23 |
| $ 171,510 | |
Accounting and Security Lending Fees. Fidelity Service Company, Inc. (FSC), an affiliate of FMR, maintains the fund's accounting records and administers the security lending program. The security lending fee is based on the number and duration of lending transactions. The accounting fee is based on the level of average net assets for the month plus out-of-pocket expenses.
Central Funds. The fund may invest in affiliated Central Funds managed by Fidelity Investments Money Management, Inc. (FIMM), an affiliate of FMR. The Central Funds are open-end investment companies available only to investment companies and other accounts managed by FMR and its affiliates. The Central Funds seek preservation of capital and current income and do not pay a management fee. Income distributions earned by the fund are recorded as income in the accompanying financial statements and totaled $22,648 for the period.
5. Committed Line of Credit.
The fund participates with other funds managed by FMR in a $3.5 billion credit facility (the "line of credit") to be utilized for temporary or emergency purposes to fund shareholder redemptions or for other short-term liquidity purposes. The fund has agreed to pay commitment fees on its pro rata portion of the line of credit. During the period, there were no borrowings on this line of credit.
Annual Report
Notes to Financial Statements - continued
6. Security Lending.
The fund lends portfolio securities from time to time in order to earn additional income. The fund receives collateral (in the form of U.S. Treasury obligations, letters of credit and/or cash) against the loaned securities and maintains collateral in an amount not less than 100% of the market value of the loaned securities during the period of the loan. The market value of the loaned securities is determined at the close of business of the fund and any additional required collateral is delivered to the fund on the next business day. If the borrower defaults on its obligation to return the securities loaned because of insolvency or other reasons, a fund could experience delays and costs in recovering the securities loaned or in gaining access to the collateral. Cash collateral is invested in cash equivalents. The value of loaned securities and cash collateral at period end are disclosed on the fund's Statement of Assets and Liabilities.
7. Expense Reductions.
FMR agreed to reimburse the classes of the fund to the extent operating expenses exceeded certain levels of average net assets as noted in the table below. Some expenses, for example interest expense, are excluded from this reimbursement.
| Expense
Limitations | Reimbursement
from adviser |
Class A | 1.75% | $ 22,145 |
Class T | 2.00% | 45,285 |
Class B | 2.50% | 56,190 |
Class C | 2.50% | 21,001 |
Institutional Class | 1.50% | 6,334 |
| | $ 150,955 |
Many of the brokers with whom FMR places trades on behalf of the fund provided services to the fund in addition to trade execution. These services may include payments of expenses on behalf of the fund to support distribution of fund shares for Class A and Class T ("Distribution Expense Reduction") and to pay other fund expenses, such as transfer agent fees ("Other Expense Reduction") collectively referred to as "Brokerage Service Arrangements" in the accompanying table. Brokerage service arrangements generally benefits all shareholders of each class by reducing fund expenses. Each of Class A and Class T shareholders' Other Expense Reduction benefit is reduced by the amount of any Distribution Expense Reduction. In addition, through arrangements with the fund's custodian, credits realized as a result of uninvested cash balances were used to reduce the fund's expenses. All of the applicable expense reductions are noted in the table below.
Annual Report
7. Expense Reductions - continued
| Distribution
expense
reduction | Custody
expense
reduction |
Fund Level | $ - | $ 78 |
8. Other Information.
At the end of the period, one unaffiliated shareholder was the owner of record of 14% of the total outstanding shares of the fund.
9. Share Transactions.
Transactions for each class of shares were as follows:
| Shares | Dollars |
Years ended October 31, | 2003 | 2002 | 2003 | 2002 |
Class A | | | | |
Shares sold | 1,380,900 | 826,406 | $ 13,339,242 | $ 8,388,540 |
Shares redeemed | (1,029,447) | (852,350) | (9,797,319) | (8,637,459) |
Net increase (decrease) | 351,453 | (25,944) | $ 3,541,923 | $ (248,919) |
Class T | | | | |
Shares sold | 660,357 | 449,295 | $ 6,206,945 | $ 4,577,112 |
Shares redeemed | (537,620) | (578,673) | (4,681,650) | (5,722,371) |
Net increase (decrease) | 122,737 | (129,378) | $ 1,525,295 | $ (1,145,259) |
Class B | | | | |
Shares sold | 545,851 | 348,625 | $ 5,257,273 | $ 3,492,332 |
Shares redeemed | (451,855) | (496,772) | (4,150,331) | (4,768,111) |
Net increase (decrease) | 93,996 | (148,147) | $ 1,106,942 | $ (1,275,779) |
Class C | | | | |
Shares sold | 575,376 | 584,055 | $ 5,681,137 | $ 5,899,035 |
Shares redeemed | (429,211) | (636,330) | (3,930,775) | (6,259,305) |
Net increase (decrease) | 146,165 | (52,275) | $ 1,750,362 | $ (360,270) |
Institutional Class | | | | |
Shares sold | 1,332,309 | 2,143,103 | $ 12,611,093 | $ 22,491,520 |
Shares redeemed | (1,641,005) | (1,584,195) | (14,882,827) | (16,856,752) |
Net increase (decrease) | (308,696) | 558,908 | $ (2,271,734) | $ 5,634,768 |
Annual Report
Report of Independent Auditors
To the Trustees of Fidelity Advisor Series VIII and the Shareholders of Fidelity Advisor Japan Fund.
In our opinion, the accompanying statement of assets and liabilities, including the schedule of investments, and the related statements of operations and of changes in net assets and the financial highlights present fairly, in all material respects, the financial position of Fidelity Advisor Japan Fund (a fund of Fidelity Advisor Series VIII) at October 31, 2003 and the results of its operations, the changes in its net assets and the financial highlights for the periods indicated, in conformity with accounting principles generally accepted in the United States of America. These financial statements and financial highlights (hereafter referred to as "financial statements") are the responsibility of the Fidelity Advisor Japan Fund's management; our responsibility is to express an opinion on these financial statements based on our audits. We conducted our audits of these financial statements in accordance with auditing standards generally accepted in the United States of America which require that we plan and perform the audit to obtain reasonable assurance about whether the financial statements are free of material misstatement. An audit includes examining, on a test basis, evidence supporting the amounts and disclosures in the financial statements, assessing the accounting principles used and significant estimates made by management, and evaluating the overall financial statement presentation. We believe that our audits, which included confirmation of securities at October 31, 2003 by correspondence with the custodian and brokers, provide a reasonable basis for our opinion.
/s/PricewaterhouseCoopers LLP
PricewaterhouseCoopers LLP
Boston, Massachusetts
December 12, 2003
Annual Report
Trustees and Officers
The Trustees, Members of the Advisory Board, and executive officers of the trust and fund, as applicable, are listed below. The Board of Trustees governs the fund and is responsible for protecting the interests of shareholders. The Trustees are experienced executives who meet periodically throughout the year to oversee the fund's activities, review contractual arrangements with companies that provide services to the fund, and review the fund's performance. Except for William O. McCoy, each of the Trustees oversees 289 funds advised by FMR or an affiliate. Mr. McCoy oversees 291 funds advised by FMR or an affiliate.
The Trustees hold office without limit in time except that (a) any Trustee may resign; (b) any Trustee may be removed by written instrument, signed by at least two-thirds of the number of Trustees prior to such removal; (c) any Trustee who requests to be retired or who has become incapacitated by illness or injury may be retired by written instrument signed by a majority of the other Trustees; and (d) any Trustee may be removed at any special meeting of shareholders by a two-thirds vote of the outstanding voting securities of the trust. In any event, each non-interested Trustee shall retire not later than the last day of the calendar year in which his or her 72nd birthday occurs. The executive officers and Advisory Board Members hold office without limit in time, except that any officer and Advisory Board Member may resign or may be removed by a vote of a majority of the Trustees at any regular meeting or any special meeting of the Trustees. Except as indicated, each individual has held the office shown or other offices in the same company for the past five years.
The fund's Statement of Additional Information (SAI) includes more information about the Trustees. To request a free copy, call Fidelity at 1-877-208-0098.
Interested Trustees*:
Correspondence intended for each Trustee who is an "interested person" (as defined in the 1940 Act) may be sent to 82 Devonshire Street, Boston, Massachusetts 02109.
Name, Age; Principal Occupation |
Edward C. Johnson 3d (73)** |
| Year of Election or Appointment: 1983 Mr. Johnson is Chairman of the Board of Trustees. Mr. Johnson serves as Chief Executive Officer, Chairman, and a Director of FMR Corp.; a Director and Chairman of the Board and of the Executive Committee of FMR; Chairman and a Director of Fidelity Management & Research (Far East) Inc.; Chairman (1998) and a Director of Fidelity Investments Money Management, Inc.; and Chairman (2001) and a Director (2000) of FMR Co., Inc. |
Abigail P. Johnson (41)** |
| Year of Election or Appointment: 2001 Senior Vice President of Advisor Japan (2001). Ms. Johnson also serves as Senior Vice President of other Fidelity funds (2001). She is President and a Director of FMR (2001), Fidelity Investments Money Management, Inc. (2001), FMR Co., Inc. (2001), and a Director of FMR Corp. Previously, Ms. Johnson managed a number of Fidelity funds. |
Laura B. Cronin (49) |
| Year of Election or Appointment: 2003 Ms. Cronin is an Executive Vice President (2002) and Chief Financial Officer (2002) of FMR Corp. and is a member of the Fidelity Management Committee (2003). Previously, Ms. Cronin served as Vice President of Finance of FMR (1997-1999), and Chief Financial Officer of FMR (1999-2001), Fidelity Personal Investments (2001), and Fidelity Brokerage Company (2001-2002). |
Robert L. Reynolds (51) |
| Year of Election or Appointment: 2003 Mr. Reynolds is a Director (2003) and Chief Operating Officer (2002) of FMR Corp. and is the head of the Fidelity Management Committee (2003). He also serves on the Board at Fidelity Investments Canada, Ltd. (2000). Previously, Mr. Reynolds served as President of Fidelity Investments Institutional Retirement Group (1996-2000). |
* Trustees have been determined to be "Interested Trustees" by virtue of, among other things, their affiliation with the trust or various entities under common control with FMR.
** Edward C. Johnson 3d, Trustee, is Abigail P. Johnson's father.
Annual Report
Non-Interested Trustees:
Correspondence intended for each non-interested Trustee (that is, the Trustees other than the Interested Trustees) may be sent to Fidelity Investments, P.O. Box 55235, Boston, Massachusetts 02205-5235.
Name, Age; Principal Occupation |
J. Michael Cook (61) |
| Year of Election or Appointment: 2001 Prior to Mr. Cook's retirement in May 1999, he served as Chairman and Chief Executive Officer of Deloitte & Touche LLP (accounting/consulting), Chairman of the Deloitte & Touche Foundation, and a member of the Board of Deloitte Touche Tohmatsu. He currently serves as a Director of Comcast (telecommunications, 2002), International Flavors & Fragrances, Inc. (2000), Rockwell Automation (2000) and The Dow Chemical Company (2000). He is a Member of the Diversity Advisory Council of Marakon (2003) and the Advisory Board of the Directorship Search Group, Chairman Emeritus of the Board of Catalyst (a leading organization for the advancement of women in business), and is Chairman of the Accountability Advisory Council to the Comptroller General of the United States. He also serves as a Member of the Advisory Board of the Graduate School of Business of the University of Florida, his alma mater. |
Ralph F. Cox (71) |
| Year of Election or Appointment: 1991 Mr. Cox is President of RABAR Enterprises (management consulting for the petroleum industry). Prior to February 1994, he was President of Greenhill Petroleum Corporation (petroleum exploration and production). Until March 1990, Mr. Cox was President and Chief Operating Officer of Union Pacific Resources Company (exploration and production). He is a Director of CH2M Hill Companies (engineering), and Abraxas Petroleum (petroleum exploration and production, 1999). In addition, he is a member of advisory boards of Texas A&M University and the University of Texas at Austin. |
Phyllis Burke Davis (71) |
| Year of Election or Appointment: 1992 Mrs. Davis is retired from Avon Products, Inc. (consumer products) where she held various positions including Senior Vice President of Corporate Affairs and Group Vice President of U.S. product marketing, sales, distribution, and manufacturing. Mrs. Davis is a member of the Board of Directors of the Southampton Hospital in Southampton, N.Y. (1998). Previously, she served as a Director of BellSouth Corporation (telecommunications), Eaton Corporation (diversified industrial), the TJX Companies, Inc. (retail stores), Hallmark Cards, Inc., and Nabisco Brands, Inc. |
Robert M. Gates (60) |
| Year of Election or Appointment: 1997 Dr. Gates is President of Texas A&M University (2002). He was Director of the Central Intelligence Agency (CIA) from 1991 to 1993. From 1989 to 1991, Dr. Gates served as Assistant to the President of the United States and Deputy National Security Advisor. Dr. Gates is a Director of NACCO Industries, Inc. (mining and manufacturing), and
Parker Drilling Co., Inc. (drilling and rental tools for the energy industry, 2001). He also serves as a member of the Advisory Board of VoteHere.net (secure internet voting, 2001). Previously, Dr. Gates served
as a Director of LucasVarity PLC (automotive components and diesel engines), a Director of TRW Inc. (automotive, space, defense, and information technology), and Dean of the George Bush School of Government and Public Service at Texas A&M University (1999-2001). Dr. Gates also is a Trustee of the Forum for International Policy. |
Donald J. Kirk (70) |
| Year of Election or Appointment: 1987 Mr. Kirk is a Governor of the American Stock Exchange (2001), a
Trustee and former Chairman of the Board of Trustees of the Greenwich Hospital Association, a Director of the Yale-New Haven Health Services Corp. (1998), and a Director Emeritus and former Chairman of the Board of Directors of National Arts Strategies Inc. Mr. Kirk was an Executive-in-Residence (1995-2000) and a Professor (1987-1995) at Columbia University Graduate School of Business. Prior to 1987, he was Chairman of the Financial Accounting Standards Board. Previously, Mr. Kirk served as a Governor of the National Association of Securities Dealers, Inc. (1996-2002), a member and Vice Chairman of the Public Oversight Board of the American Institute of Certified Public Accountants' SEC Practice Section (1995-2002), a Director of General Re Corporation (reinsurance, 1987-1998) and as a Director of Valuation Research Corp. (appraisals and valuations). |
Marie L. Knowles (57) |
| Year of Election or Appointment: 2001 Prior to Ms. Knowles' retirement in June 2000, she served as Executive Vice President and Chief Financial Officer of Atlantic Richfield Company (ARCO) (diversified energy, 1996-2000). From 1993 to 1996, she was a Senior Vice President of ARCO and President of ARCO Transportation Company. She served as a Director of ARCO from 1996 to 1998. She currently serves as a Director of Phelps Dodge Corporation (copper mining and manufacturing), URS Corporation (multidisciplinary engineering, 1999), and McKesson Corporation (healthcare service, 2002). Ms. Knowles is a Trustee of the Brookings Institution and the Catalina Island Conservancy and also serves as a member of the Advisory Board for the School of Engineering of the University of Southern California. |
Ned C. Lautenbach (59) |
| Year of Election or Appointment: 2000 Mr. Lautenbach has been a partner of Clayton, Dubilier & Rice, Inc. (private equity investment firm) since September 1998. Previously, Mr. Lautenbach was with the International Business Machines Corporation (IBM) from 1968 until his retirement in 1998. He was most recently
Senior Vice President and Group Executive of Worldwide Sales and Services. From 1993 to 1995, he was Chairman of IBM World Trade Corporation, and from 1994 to 1998 was a member of IBM's Corporate Executive Committee. Mr. Lautenbach serves as Chairman and as a Director (1998) of Acterna Corporation (communications test equipment). He is also Co-Chairman of Covansys, Inc. (global provider of business and technology solutions, 2000). In addition, he is a Director of Eaton Corporation (diversified industrial) and the Philharmonic Center for the Arts in Naples, Florida (1999). He also is a member of the Council on Foreign Relations. |
Marvin L. Mann (70) |
| Year of Election or Appointment: 1993 Mr. Mann is Chairman of the non-interested Trustees (2001). He is Chairman Emeritus of Lexmark International, Inc. (computer peripherals) where he served as CEO until April 1998 and retired as Chairman May 1999, and remains a member of the Board. Prior to 1991, he held the positions of Vice President of International Business Machines Corporation (IBM) and President and General Manager of various IBM divisions and subsidiaries. Mr. Mann is a Board member of Imation Corp. (imaging and information storage) and Acterna Corporation (communications test equipment, 1999). He is also a member of the Director Services Committee of the Investment Company Institute. In addition, Mr. Mann is a member of the President's Cabinet at the University of Alabama and the Board of Visitors of the Culverhouse College of Commerce and Business Administration at the University of Alabama. |
William O. McCoy (70) |
| Year of Election or Appointment: 1997 Prior to his retirement in December 1994, Mr. McCoy was Vice Chairman of the Board of BellSouth Corporation (telecommunications) and President of BellSouth Enterprises. He is currently a Director of Liberty Corporation (holding company), Duke Realty Corporation (real estate), Progress Energy, Inc. (electric utility), and Acterna Corporation (communications test equipment, 1999). He is also a partner of Franklin Street Partners (private investment management firm) and a member of the Research Triangle Foundation Board. In addition, Mr. McCoy served as the Interim Chancellor (1999-2000) and a member of the Board of Visitors (1994-1998) for the University of North Carolina at Chapel Hill and currently serves on the Board of Directors of the University of North Carolina Health Care System and the Board of Visitors of the Kenan-Flagler Business School (University of North Carolina at Chapel Hill). He also served as Vice President of Finance for the University of North Carolina (16-school system, 1995-1998). |
William S. Stavropoulos (64) |
| Year of Election or Appointment: 2001 Mr. Stavropoulos is Chairman of the Board, President and CEO (2002), and Chairman of the Executive Committee (2000) and a Director of The Dow Chemical Company. Since joining The Dow Chemical Company in 1967, Mr. Stavropoulos served in numerous senior management positions, including President (1993-2000) and Chief Executive Officer (1995-2000). Currently, he is a Director of NCR Corporation (data warehousing and technology solutions), BellSouth Corporation (telecommunications), Chemical Financial Corporation, and Maersk Inc. (industrial conglomerate, 2002). He also serves as a member of the Board of Trustees of the American Enterprise Institute for Public Policy Research. In addition, Mr. Stavropoulos is a member of The Business Council, J.P. Morgan International Council, World Business Council for Sustainable Development, and the University of Notre Dame Advisory Council for the College of Science. |
Annual Report
Trustees and Officers - continued
Advisory Board Members and Executive Officers:
Correspondence intended for Dr. Heilmeier may be sent to Fidelity Investments, P.O. Box 55235, Boston, Massachusetts 02205-5235. Correspondence intended for each executive officer and Mr. Lynch may be sent to 82 Devonshire Street, Boston, Massachusetts 02109.
Name, Age; Principal Occupation |
George H. Heilmeier (67) |
| Year of Election or Appointment: 2003 Member of the Advisory Board of Fidelity Advisor Series VIII. Dr. Heilmeier is Chairman Emeritus of Telcordia Technologies (communication software and systems), where prior to his retirement, he served as company Chairman and Chief Executive Officer. He currently serves on the Boards of Directors of The Mitre Corporation (systems engineering and information technology support for the government), INET Technologies Inc. (telecommunications network surveillance, 2001) and Teletech Holdings (customer management services, 1998). He is Chairman of the General Motors Technology Advisory Committee and a Life Fellow of the IEEE (2000). Dr. Heilmeier is a member of the Defense Science Board and the National Security Agency Advisory Board. He is also a member of the National Academy of Engineering, the American Academy of Arts and Sciences and The Board of Overseers of the School of Engineering and Applied Science of the University of Pennsylvania. Previously, Dr. Heilmeier served as a Director of TRW Inc. (automotive, space, defense, and information technology, 1992-2002) and Compaq (1994-2002). |
Peter S. Lynch (60) |
| Year of Election or Appointment: 2003 Member of the Advisory Board of Fidelity Advisor Series VIII. Vice Chairman and a Director of FMR, and Vice Chairman (2001) and a Director (2000) of FMR Co., Inc. Previously, Mr. Lynch served as a Trustee of the Fidelity funds (1990-2003). Prior to May 31, 1990, he was a Director of FMR and Executive Vice President of FMR (a position he held until March 31, 1991), Vice President of Fidelity Magellan Fund and FMR Growth Group Leader, and Managing Director of FMR Corp. Mr. Lynch was also Vice President of Fidelity Investments Corporate Services. In addition, he serves as a Trustee of Boston College, Massachusetts Eye & Ear Infirmary, Historic Deerfield, John F. Kennedy Library, and the Museum of Fine Arts of Boston. |
Philip L. Bullen (44) |
| Year of Election or Appointment: 2001 Vice President of Advisor Japan. Mr. Bullen also serves as Vice President of certain Equity Funds (2001) and certain High Income Funds (2001). He is Senior Vice President of FMR (2001) and FMR Co., Inc. (2001), President and a Director of Fidelity Management & Research (Far East) Inc. (2001), President and a Director of Fidelity Management & Research (U.K.) Inc. (2002), and a Director of Strategic Advisers, Inc. (2002). Before joining Fidelity Investments, Mr. Bullen was President and Chief Investment Officer of Santander Global Advisors (1997-2000) and President and Chief Executive Officer of Boston's Baring Asset Management Inc. (1994-1997). |
Eric D. Roiter (54) |
| Year of Election or Appointment: 1998 Secretary of Advisor Japan. He also serves as Secretary of other Fidelity funds (1998); Vice President, General Counsel, and Clerk of FMR Co., Inc. (2001) and FMR (1998); Vice President and Clerk of FDC (1998); Assistant Clerk of Fidelity Management & Research (U.K.) Inc. (2001) and Fidelity Management & Research (Far East) Inc. (2001); and Assistant Secretary of Fidelity Investments Money Management Inc. (2001). Prior to joining Fidelity, Mr. Roiter was with the law firm of Debevoise & Plimpton, as an associate (1981-1984) and as a partner (1985-1997), and served as an Assistant General Counsel of the U.S. Securities and Exchange Commission (1979-1981). Mr. Roiter is an Adjunct Member, Faculty of Law, at Boston College Law School (2003). |
Stuart Fross (44) |
| Year of Election or Appointment: 2003 Assistant Secretary of Advisor Japan. Mr. Fross also serves as Assistant Secretary of other Fidelity funds (2003) and is an employee of FMR. |
Maria F. Dwyer (44) |
| Year of Election or Appointment: 2002 President and Treasurer of Advisor Japan. Ms. Dwyer also serves as President and Treasurer of other Fidelity funds (2002) and is a Vice President (1999) and an employee (1996) of FMR. Prior to joining Fidelity, Ms. Dwyer served as Director of Compliance for MFS Investment Management. |
Timothy F. Hayes (52) |
| Year of Election or Appointment: 2002 Chief Financial Officer of Advisor Japan. Mr. Hayes also serves as Chief Financial Officer of other Fidelity funds (2002). Recently he was appointed President of Fidelity Service Company (2003) where he also serves as a Director. Mr. Hayes also serves as President of Fidelity Investments Operations Group (FIOG, 2002), which includes Fidelity Pricing and Cash Management Services Group (FPCMS), where he was appointed President in 1998. Previously, Mr. Hayes served as Chief Financial Officer of Fidelity Investments Corporate Systems and Service Group (1998) and Fidelity Systems Company (1997-1998). |
John R. Hebble (45) |
| Year of Election or Appointment: 2003 Deputy Treasurer of Advisor Japan. Mr. Hebble also serves as Deputy Treasurer of other Fidelity funds (2003), and is an employee of FMR. Before joining Fidelity Investments, Mr. Hebble worked at Deutsche Asset Management where he served as Director of Fund Accounting (2002-2003) and Assistant Treasurer of the Scudder Funds (1998-2003). |
John H. Costello (57) |
| Year of Election or Appointment: 1998 Assistant Treasurer of Advisor Japan. Mr. Costello also serves as Assistant Treasurer of other Fidelity funds and is an employee of FMR. |
Francis V. Knox, Jr. (56) |
| Year of Election or Appointment: 2002 Assistant Treasurer of Advisor Japan. Mr. Knox also serves as Assistant Treasurer of other Fidelity funds (2002), and is a Vice President and an employee of FMR. Previously, Mr. Knox served as Vice President of Investment & Advisor Compliance (1990-2001), and Compliance Officer of Fidelity Management & Research (U.K.) Inc. (1992-2002), Fidelity Management & Research (Far East) Inc. (1991-2002), and FMR Corp. (1995-2002). |
Mark Osterheld (48) |
| Year of Election or Appointment: 2002 Assistant Treasurer of Advisor Japan. Mr. Osterheld also serves as Assistant Treasurer of other Fidelity funds (2002) and is an employee of FMR. |
Thomas J. Simpson (45) |
| Year of Election or Appointment: 2000 Assistant Treasurer of Advisor Japan. Mr. Simpson is Assistant Treasurer of other Fidelity funds (2000) and an employee of FMR (1996). Prior to joining FMR, Mr. Simpson was Vice President and Fund Controller of Liberty Investment Services (1987-1995). |
Annual Report
Annual Report
Annual Report
Annual Report
Annual Report
Investment Adviser
Fidelity Management & Research Company
Boston, MA
Investment Sub-Advisers
FMR Co., Inc.
Fidelity Management & Research
(U.K.) Inc.
Fidelity Management & Research
(Far East) Inc.
Fidelity International
Investment Advisors
Fidelity Investments Japan Limited
Fidelity International Investment Advisors (U.K.) Limited
General Distributor
Fidelity Distributors Corporation
Boston, MA
Transfer and Shareholder
Servicing Agents
Fidelity Investments Institutional Operations Company, Inc.
Boston, MA
Custodian
State Street Bank and Trust Company
Quincy, MA
Annual Report
Fidelity Advisor Aggressive Growth Fund |
Fidelity Advisor Asset Allocation Fund |
Fidelity Advisor Balanced Fund |
Fidelity Advisor Biotechnology Fund |
Fidelity Advisor California Municipal Income Fund |
Fidelity Advisor Consumer Industries Fund |
Fidelity Advisor Cyclical Industries Fund |
Fidelity Advisor Developing Communications Fund |
Fidelity Advisor Diversified International Fund |
Fidelity Advisor Dividend Growth Fund |
Fidelity Advisor Dynamic Capital Appreciation Fund |
Fidelity Advisor Electronics Fund |
Fidelity Advisor Emerging Asia Fund |
Fidelity Advisor Emerging Markets Income Fund |
Fidelity Advisor Equity Growth Fund |
Fidelity Advisor Equity Income Fund |
Fidelity Advisor Equity Value Fund |
Fidelity Advisor Europe Capital Appreciation Fund |
Fidelity Advisor Fifty Fund |
Fidelity Advisor Financial Services Fund |
Fidelity Advisor Floating Rate High Income Fund |
Fidelity Advisor Freedom Income FundSM |
Fidelity Advisor Freedom 2010 FundSM |
Fidelity Advisor Freedom 2020 FundSM |
Fidelity Advisor Freedom 2030 FundSM |
Fidelity Advisor Freedom 2040 FundSM |
Fidelity Advisor Global Equity Fund |
Fidelity Advisor Government Investment Fund |
Fidelity Advisor Growth & Income Fund |
Fidelity Advisor Growth Opportunities |
Fidelity Advisor Health Care Fund |
Fidelity Advisor High Income Advantage Fund |
Fidelity Advisor High Income Fund |
Fidelity Advisor Inflation-Protected Bond Fund |
Fidelity Advisor Intermediate Bond Fund |
Fidelity Advisor International Capital Appreciation Fund |
Fidelity Advisor International Small Cap Fund |
Fidelity Advisor Investment Grade Bond Fund |
Fidelity Advisor Japan Fund |
Fidelity Advisor Korea Fund |
Fidelity Advisor Large Cap Fund |
Fidelity Advisor Latin America Fund |
Fidelity Advisor Leveraged Company Stock Fund |
Fidelity Advisor Mid Cap Fund |
Fidelity Advisor Mortgage Securities Fund |
Fidelity Advisor Municipal Income Fund |
Fidelity Advisor Natural Resources Fund |
Fidelity Advisor New Insights Fund |
Fidelity Advisor New York Municipal Income Fund |
Fidelity Advisor Overseas Fund |
Fidelity Advisor Real Estate Fund |
Fidelity Advisor Short Fixed-Income Fund |
Fidelity Advisor Short Intermediate Municipal Income Fund |
Fidelity Advisor Small Cap Fund |
Fidelity Advisor Strategic Growth Fund |
Fidelity Advisor Strategic Income Fund |
Fidelity Advisor Tax Managed
Stock Fund |
Fidelity Advisor Technology Fund |
Fidelity Advisor Telecommunications & Utilities Growth Fund |
Fidelity Advisor Value Leaders Fund |
Fidelity Advisor Value Strategies Fund |
Prime Fund |
Tax-Exempt Fund |
Treasury Fund |
(Fidelity Investment logo)(registered trademark)
Corporate Headquarters
82 Devonshire St., Boston, MA 02109
www.fidelity.com
AJAF-UANN-1203
1.784756.100
Fidelity® Advisor
Japan
Fund - Institutional Class
Annual Report
October 31, 2003
(2_fidelity_logos) (Registered_Trademark)
Contents
Chairman's Message | <Click Here> | Ned Johnson's message to shareholders. |
Performance | <Click Here> | How the fund has done over time. |
Management's Discussion | <Click Here> | The manager's review of fund performance, strategy and outlook. |
Investment Changes | <Click Here> | A summary of major shifts in the fund's investments over the past six months. |
Investments | <Click Here> | A complete list of the fund's investments with their market values. |
Financial Statements | <Click Here> | Statements of assets and liabilities, operations, and changes in net assets,
as well as financial highlights. |
Notes | <Click Here> | Notes to the financial statements. |
Auditors' Opinion | <Click Here> | |
Trustees and Officers | <Click Here> | |
| | |
For a free copy of the fund's proxy voting guidelines call 1-877-208-0098 or visit the Securities and Exchange Commission (SEC)'s web site at www.sec.gov.
Third party marks appearing herein are the property of their respective owners.
All other marks appearing herein are registered or unregistered trademarks or service marks of FMR Corp. or an affiliated company.
(Recycle graphic) This report is printed on recycled paper using soy-based inks.
This report and the financial statements contained herein are submitted for the general information of the shareholders of the fund. This report is not authorized for distribution to prospective investors in the fund unless preceded or accompanied by an effective prospectus.
Mutual fund shares are not deposits or obligations of, or guaranteed by, any depository institution. Shares are not insured by the FDIC, Federal Reserve Board or any other agency, and are subject to investment risks, including possible loss of principal amount invested.
Neither the fund nor Fidelity Distributors Corporation is a bank.
For more information on any Fidelity Advisor fund, including charges and expenses, contact your investment professional for a free prospectus. Read it carefully before you invest or send money.
Annual Report
Chairman's Message
(photo_of_Edward_C_Johnson_3d)
Dear Shareholder:
Many of you have read or heard news stories recently that were critical of mutual funds and made allegations that the mutual fund industry has been less than forthright. I find these reports unsettling and not necessarily an accurate picture of the overall industry, and I would like you to know where we at Fidelity stand.
With specific regard to allegations that certain mutual fund companies were violating the Securities and Exchange Commission's forward pricing rules or were involved in so-called "market timing" activities, I want to say two things:
First, Fidelity does not have agreements that permit customers who buy fund shares after 4 p.m. to obtain the 4 p.m. price. This is not to say that someone could not deceive the company through fraudulent acts. But I underscore that we have no so-called "agreements" which would permit this illegal practice.
Second, Fidelity has been on record for years opposing predatory short-term trading which adversely affects other shareholders in a mutual fund. In fact, in the 1980s, we began charging a fee - which is returned to the fund and, therefore, to investors - to discourage this activity. What's more, several years ago we took the industry lead in developing a Fair Value Pricing Policy to prevent market timing on foreign securities in our funds. It is reasonable to assume that another structure can be developed that would alter the system to make it much more difficult for predatory traders to operate. This, however, will only be achieved through close cooperation among regulators, legislators and the industry.
Certainly no industry is perfect, and there have been instances of unethical and illegal activity from time to time within the mutual fund industry. When this occurs, confessed or convicted offenders should be dealt with appropriately. Clearly, every system can be improved. We applaud well thought out improvements by regulators, legislators and industry representatives that achieve the common goal of building and protecting the value of investors' holdings. But we remain concerned about the risk of over-regulation and the quick application of simplistic solutions to intricate problems.
For more than 57 years, Fidelity Investments has worked very hard to improve its products and service to justify your trust. When our family founded this company in 1946, we had only a few hundred customers. Many of them were family and friends. Today, we serve more than 18 million customers including individual investors and participants in retirement plans across America.
Let me close by saying that we do not take your trust in us for granted, and we realize that we must always work to improve all aspects of our service to you. In turn, we urge you to continue your active participation with your financial matters, so that your interests can be well served.
Annual Report
Best regards,
/s/Edward C. Johnson 3d
Edward C. Johnson 3d
Annual Report
Performance: The Bottom Line
Average annual total return reflects the change in the value of an investment, assuming reinvestment of the class' dividend income and capital gains (the profits earned upon the sale of securities that have grown in value) and assuming a constant rate of performance each year. During periods of reimbursement by Fidelity, a fund's total return will be greater than it would be had the reimbursement not occurred. The $10,000 table and the fund's returns do not reflect the deduction of taxes that a shareholder would pay on fund distributions or the redemption of fund shares. How a fund did yesterday is no guarantee of how it will do tomorrow.
Average Annual Total Returns
Periods ended October 31, 2003 | | Past 1
year | Life of
fund A |
Institutional Class | | 35.03% | 5.82% |
A From December 17, 1998.
$10,000 Over Life of Fund
Let's say hypothetically that $10,000 was invested in Fidelity® Advisor Japan Fund - Institutional Class on December 17, 1998, when the fund started. The chart shows how the value of your investment would have grown, and also shows how the Tokyo Stock Exchange Stock Price (TOPIX) Index did over the same period.

Annual Report
Management's Discussion of Fund Performance
Comments from Dale Nicholls, Portfolio Manager of Fidelity® Advisor Japan Fund
Mirroring the U.S. rally, most international stock markets rebounded sharply during the 12-month period ending October 31, 2003. Encouraged by improved corporate earnings, favorable interest rates and the easing of geopolitical tensions, the Morgan Stanley Capital InternationalSM Europe, Australasia, Far East (MSCI® EAFE®) Index - a proxy for stock markets outside the United States and Canada - gained 27.39% during the past year. From a regional perspective, all 16 countries in the MSCI Europe index - which gained 24.56% - - had double-digit advances. Spain, Denmark and Sweden were among the region's best performers. In Japan, increased capital spending, exports and machinery orders helped the Tokyo Stock Exchange Stock Price Index (TOPIX) advance 36.39%. Following the SARS epidemic, other Asian markets also rebounded. For instance, the Hong Kong market, as measured by the Hang Seng Index, gained 34.51%. Emerging markets also fared well, particularly Latin America. The MSCI Emerging Markets Free Latin America index rose 59.75%. Canadian equities, as measured by the S&P/TSX Composite Index, also posted an impressive annual gain, advancing 50.66%.
For the 12 months ending October 31, 2003, the fund's Institutional Class shares returned 35.03%, slightly trailing the TOPIX but beating the 33.74% return of the LipperSM Japanese Funds Average. Stock selection in the banking industry helped performance, as did an overweighting in the semiconductors and semiconductor equipment group. The fund was hurt by unfavorable stock selection in software and services, and a substantial underweighting in the surging capital goods group. Several of the top-10 contributors on both an absolute basis and compared with the index were banks - including UFJ Holdings and Mizuho Financial Group. Meanwhile, semiconductor capital equipment maker Tokyo Electron was helped by generally improving trends in the semiconductor market, and in particular by strong trends in the LCD - liquid crystal display - segment. Conversely, pharmaceutical stock Takeda Chemical hurt performance, as investors looked for more dynamic growth elsewhere in a strong market environment. The same can be said for transportation provider East Japan Railway and office equipment maker Ricoh.
The views expressed in this statement reflect those of the portfolio manager only through the end of the period of the report as stated on the cover and do not necessarily represent the views of Fidelity or any other person in the Fidelity organization. Any such views are subject to change at any time based upon market or other conditions and Fidelity disclaims any responsibility to update such views. These views may not be relied on as investment advice and, because investment decisions for a Fidelity fund are based on numerous factors, may not be relied on as an indication of trading intent on behalf of any Fidelity fund.
Annual Report
Investment Changes
Top Ten Stocks as of October 31, 2003 |
| % of fund's net
assets | % of fund's net assets
6 months ago |
Toyota Motor Corp. | 4.4 | 5.1 |
Nissan Motor Co. Ltd. | 2.5 | 3.1 |
Canon, Inc. | 2.5 | 4.0 |
NTT DoCoMo, Inc. | 2.2 | 4.1 |
Sumitomo Mitsui Financial Group, Inc. | 2.2 | 0.9 |
Mitsubishi Tokyo Financial Group, Inc. (MTFG) | 2.0 | 1.1 |
Takeda Chemical Industries Ltd. | 2.0 | 4.7 |
Konica Minolta Holdings, Inc. | 1.9 | 1.8 |
SFCG Co. Ltd. | 1.7 | 0.0 |
Mitsubishi Securities Co. Ltd. | 1.7 | 0.0 |
| 23.1 | |
Top Five Market Sectors as of October 31, 2003 |
| % of fund's net
assets | % of fund's net assets
6 months ago |
Consumer Discretionary | 25.7 | 25.0 |
Information Technology | 21.4 | 23.1 |
Financials | 19.4 | 12.4 |
Industrials | 9.6 | 7.4 |
Materials | 7.4 | 3.1 |
Asset Allocation (% of fund's net assets) |
As of October 31, 2003 | As of April 30, 2003 |
| Stocks 97.3% | | | Stocks 98.4% | |
| Short-Term
Investments and
Net Other Assets 2.7% | | | Short-Term
Investments and
Net Other Assets 1.6% | |

Annual Report
Investments October 31, 2003
Showing Percentage of Net Assets
Common Stocks - 95.9% |
| Shares | | Value (Note 1) |
CONSUMER DISCRETIONARY - 25.7% |
Auto Components - 2.2% |
Bridgestone Corp. | 23,000 | | $ 301,255 |
FCC Co. Ltd. | 4,500 | | 146,944 |
NOK Corp. | 10,000 | | 393,851 |
Toyoda Gosei Co. Ltd. | 8,000 | | 236,493 |
| | 1,078,543 |
Automobiles - 7.3% |
Honda Motor Co. Ltd. | 5,300 | | 212,530 |
Nissan Motor Co. Ltd. | 108,400 | | 1,225,462 |
Toyota Motor Corp. | 74,600 | | 2,164,144 |
| | 3,602,136 |
Hotels, Restaurants & Leisure - 1.7% |
H.I.S. Co. Ltd. | 16,500 | | 345,188 |
Skylark Co. Ltd. | 29,400 | | 484,295 |
| | 829,483 |
Household Durables - 6.1% |
D&M Holdings, Inc. (a) | 124,000 | | 496,271 |
Daito Trust Construction Co. | 24,000 | | 742,223 |
Matsushita Electric Industrial Co. Ltd. | 52,000 | | 682,240 |
Sanyo Electric Co. Ltd. | 105,000 | | 481,353 |
Sony Corp. | 18,100 | | 637,120 |
| | 3,039,207 |
Internet & Catalog Retail - 1.3% |
Nissen Co. Ltd. | 14,500 | | 271,034 |
Senshukai Co. Ltd. | 33,000 | | 404,321 |
| | 675,355 |
Leisure Equipment & Products - 1.3% |
Fuji Photo Film Co. Ltd. | 14,000 | | 412,589 |
Nidec Copal Corp. | 15,500 | | 259,414 |
| | 672,003 |
Media - 0.9% |
Fuji Television Network, Inc. | 62 | | 329,907 |
SKY Perfect Communications, Inc. (a) | 100 | | 121,885 |
| | 451,792 |
Multiline Retail - 1.6% |
Don Quijote Co. Ltd. | 11,300 | | 607,450 |
Hankyu Department Stores, Inc. | 23,000 | | 168,410 |
| | 775,860 |
Common Stocks - continued |
| Shares | | Value (Note 1) |
CONSUMER DISCRETIONARY - continued |
Specialty Retail - 3.3% |
Fast Retailing Co. Ltd. | 6,500 | | $ 394,943 |
Nishimatsuya Chain Co. Ltd. | 15,200 | | 456,249 |
Pal Co. Ltd. | 7,400 | | 333,182 |
USS Co. Ltd. | 6,140 | | 436,178 |
| | 1,620,552 |
TOTAL CONSUMER DISCRETIONARY | | 12,744,931 |
CONSUMER STAPLES - 3.7% |
Food & Staples Retailing - 2.5% |
FamilyMart Co. Ltd. | 24,800 | | 539,130 |
Ito Yokado Ltd. | 15,000 | | 551,210 |
York-Benimaru Co. Ltd. | 5,300 | | 127,752 |
| | 1,218,092 |
Household Products - 0.6% |
Uni-Charm Corp. | 6,500 | | 303,302 |
Tobacco - 0.6% |
Japan Tobacco, Inc. | 48 | | 320,466 |
TOTAL CONSUMER STAPLES | | 1,841,860 |
FINANCIALS - 18.0% |
Capital Markets - 3.9% |
JAFCO Co. Ltd. | 3,300 | | 282,154 |
Mitsubishi Securities Co. Ltd. | 74,000 | | 841,368 |
Nomura Holdings, Inc. | 47,000 | | 807,131 |
| | 1,930,653 |
Commercial Banks - 8.8% |
Mitsubishi Tokyo Financial Group, Inc. (MTFG) | 136 | | 998,240 |
Mitsui Trust Holdings, Inc. | 148,000 | | 787,520 |
Mizuho Financial Group, Inc. (a) | 324 | | 792,760 |
Sumitomo Mitsui Financial Group, Inc. | 219 | | 1,101,574 |
UFJ Holdings, Inc. (a) | 163 | | 696,835 |
| | 4,376,929 |
Consumer Finance - 3.3% |
Aeon Credit Service Ltd. | 9,700 | | 449,090 |
ORIX Corp. | 4,100 | | 344,961 |
SFCG Co. Ltd. | 5,940 | | 865,552 |
| | 1,659,603 |
Common Stocks - continued |
| Shares | | Value (Note 1) |
FINANCIALS - continued |
Diversified Financial Services - 0.2% |
Ricoh Leasing Co. Ltd. | 4,400 | | $ 82,045 |
Insurance - 1.3% |
Millea Holdings, Inc. | 52 | | 619,611 |
Real Estate - 0.5% |
Mitsubishi Estate Co. Ltd. | 26,000 | | 249,263 |
TOTAL FINANCIALS | | 8,918,104 |
HEALTH CARE - 4.4% |
Health Care Equipment & Supplies - 0.2% |
Japan Medical Dynamic Marketing, Inc. | 6,500 | | 91,641 |
Pharmaceuticals - 4.2% |
Fujisawa Pharmaceutical Co. Ltd. | 11,000 | | 227,124 |
Kyorin Pharmaceutical Co. Ltd. | 30,000 | | 451,610 |
Takeda Chemical Industries Ltd. | 27,700 | | 980,107 |
Yamanouchi Pharmaceutical Co. Ltd. | 17,900 | | 449,372 |
| | 2,108,213 |
TOTAL HEALTH CARE | | 2,199,854 |
INDUSTRIALS - 9.6% |
Air Freight & Logistics - 0.4% |
Yamato Transport Co. Ltd. | 16,000 | | 212,625 |
Commercial Services & Supplies - 3.3% |
Benesse Corp. | 6,000 | | 147,353 |
Meitec Corp. | 9,400 | | 336,020 |
Sumisho Lease Co. Ltd. | 26,200 | | 805,494 |
Toppan Printing Co. Ltd. | 36,000 | | 330,071 |
| | 1,618,938 |
Electrical Equipment - 1.5% |
Fujikura Ltd. | 29,000 | | 174,359 |
Furukawa Electric Co. Ltd. | 72,000 | | 272,440 |
Sumitomo Electric Industries Ltd. | 34,000 | | 292,250 |
| | 739,049 |
Machinery - 1.2% |
SMC Corp. | 2,400 | | 288,812 |
THK Co. Ltd. | 15,300 | | 310,342 |
| | 599,154 |
Common Stocks - continued |
| Shares | | Value (Note 1) |
INDUSTRIALS - continued |
Road & Rail - 1.4% |
East Japan Railway Co. | 152 | | $ 688,521 |
Trading Companies & Distributors - 1.8% |
Mitsui & Co. Ltd. | 49,000 | | 356,558 |
Sumitomo Corp. | 74,000 | | 513,571 |
| | 870,129 |
TOTAL INDUSTRIALS | | 4,728,416 |
INFORMATION TECHNOLOGY - 21.4% |
Computers & Peripherals - 0.9% |
Toshiba Corp. | 116,000 | | 465,308 |
Electronic Equipment & Instruments - 8.6% |
Citizen Electronics Co. Ltd. | 2,300 | | 215,481 |
Enplas Corp. | 2,900 | | 96,280 |
Hoya Corp. | 6,400 | | 579,225 |
Iriso Electronics Co. Ltd. | 14,000 | | 178,279 |
Japan Radio Co. Ltd. (a) | 50,000 | | 241,950 |
Keyence Corp. | 1,400 | | 307,913 |
Kyocera Corp. | 6,400 | | 385,374 |
Murata Manufacturing Co. Ltd. | 5,700 | | 324,040 |
Nichicon Corp. | 21,800 | | 253,415 |
Nidec Corp. | 4,000 | | 387,484 |
Nippon Electric Glass Co. Ltd. | 26,000 | | 477,715 |
Sankyo Seiki Manufacturing Co. Ltd. (a) | 41,000 | | 315,872 |
TDK Corp. | 7,200 | | 471,530 |
| | 4,234,558 |
IT Services - 1.1% |
Hitachi Information Systems Co. Ltd. | 4,400 | | 126,869 |
Nomura Research Institute Ltd. | 2,400 | | 241,222 |
NS Solutions Corp. | 2,600 | | 167,910 |
| | 536,001 |
Office Electronics - 5.4% |
Canon, Inc. | 25,000 | | 1,223,750 |
Konica Minolta Holdings, Inc. | 73,500 | | 966,050 |
Ricoh Co. Ltd. | 26,000 | | 493,087 |
| | 2,682,887 |
Semiconductors & Semiconductor Equipment - 4.9% |
Nikon Corp. (a) | 21,000 | | 318,801 |
Rohm Co. Ltd. | 4,200 | | 566,163 |
Common Stocks - continued |
| Shares | | Value (Note 1) |
INFORMATION TECHNOLOGY - continued |
Semiconductors & Semiconductor Equipment - continued |
Sanken Electric Co. Ltd. | 28,000 | | $ 310,460 |
Shinko Electric Industries Co.Ltd. | 5,000 | | 122,794 |
Tokyo Electron Ltd. | 7,300 | | 523,231 |
UMC Japan (a) | 420 | | 573,040 |
| | 2,414,489 |
Software - 0.5% |
Nintendo Co. Ltd. | 2,200 | | 169,893 |
Works Applications Co. Ltd. (a) | 18 | | 87,430 |
| | 257,323 |
TOTAL INFORMATION TECHNOLOGY | | 10,590,566 |
MATERIALS - 7.4% |
Chemicals - 5.2% |
Daicel Chemical Industries Ltd. | 93,000 | | 394,197 |
Hitachi Chemical Co. Ltd. | 26,500 | | 428,088 |
JSR Corp. | 25,000 | | 529,834 |
Kaneka Corp. | 28,000 | | 218,264 |
Mitsubishi Rayon Co. Ltd. | 79,000 | | 293,178 |
Shin-Etsu Chemical Co. Ltd. | 13,700 | | 509,669 |
Ube Industries Ltd. | 85,000 | | 182,463 |
| | 2,555,693 |
Metals & Mining - 2.2% |
Dowa Mining Co. Ltd. | 34,000 | | 183,700 |
Pacific Metals Co. Ltd. (a) | 82,000 | | 390,831 |
Sumitomo Metal Mining Co. Ltd. | 78,000 | | 534,946 |
| | 1,109,477 |
TOTAL MATERIALS | | 3,665,170 |
TELECOMMUNICATION SERVICES - 4.7% |
Diversified Telecommunication Services - 0.9% |
Nippon Telegraph & Telephone Corp. | 99 | | 445,104 |
Wireless Telecommunication Services - 3.8% |
KDDI Corp. | 144 | | 781,954 |
NTT DoCoMo, Inc. | 515 | | 1,114,881 |
| | 1,896,835 |
TOTAL TELECOMMUNICATION SERVICES | | 2,341,939 |
Common Stocks - continued |
| Shares | | Value (Note 1) |
UTILITIES - 1.0% |
Electric Utilities - 1.0% |
Tokyo Electric Power Co. | 23,700 | | $ 505,517 |
TOTAL COMMON STOCKS (Cost $42,503,863) | 47,536,357 |
Convertible Preferred Stocks - 1.4% |
| | | |
FINANCIALS - 1.4% |
Diversified Financial Services - 1.4% |
SMFG Finance (Cayman) Ltd. Mandatorily Exchangeable Preferred Stock Units 2.25% (c) | 15 | | 708,625 |
TOTAL CONVERTIBLE PREFERRED STOCKS (Cost $411,678) | 708,625 |
Money Market Funds - 5.1% |
| | | |
Fidelity Cash Central Fund, 1.07% (b)
(Cost $2,499,437) | 2,499,437 | | 2,499,437 |
TOTAL INVESTMENT PORTFOLIO - 102.4% (Cost $45,414,978) | | 50,744,419 |
NET OTHER ASSETS - (2.4)% | | (1,186,884) |
NET ASSETS - 100% | $ 49,557,535 |
Legend |
(a) Non-income producing |
(b) The rate quoted is the annualized seven-day yield of the fund at period end. A complete listing of the fund's holdings as of its most recent fiscal year end is available upon request. |
(c) Security exempt from registration under Rule 144A of the Securities Act of 1933. These securities may be resold in transactions exempt from registration, normally to qualified institutional buyers. At the period end, the value of these securities amounted to $708,625 or 1.4% of net assets. |
Other Information |
Purchases and sales of securities, other than short-term securities, aggregated $37,875,231 and $32,168,744, respectively. |
Income Tax Information |
At October 31, 2003, the fund had a capital loss carryforward of approximately $29,847,000 of which $2,859,000, $17,004,000 and $9,984,000 will expire on October 31, 2008, 2009 and 2010, respectively. |
See accompanying notes which are an integral part of the financial statements.
Annual Report
Financial Statements
Statement of Assets and Liabilities
| October 31, 2003 |
| | |
Assets | | |
Investment in securities, at value (including securities loaned of $686,879) (cost $45,414,978) - See accompanying schedule | | $ 50,744,419 |
Foreign currency held at value (cost $ 4,945) | | 5,076 |
Receivable for fund shares sold | | 211,313 |
Dividends receivable | | 125,023 |
Interest receivable | | 2,889 |
Prepaid expenses | | 177 |
Receivable from investment adviser for expense reductions | | 4,084 |
Other receivables | | 2,459 |
Total assets | | 51,095,440 |
| | |
Liabilities | | |
Payable for investments purchased | $ 644,699 | |
Payable for fund shares redeemed | 48,082 | |
Accrued management fee | 30,372 | |
Distribution fees payable | 27,693 | |
Other payables and accrued expenses | 50,374 | |
Collateral on securities loaned, at value | 736,685 | |
Total liabilities | | 1,537,905 |
| | |
Net Assets | | $ 49,557,535 |
Net Assets consist of: | | |
Paid in capital | | $ 74,902,838 |
Accumulated net investment loss | | (142,165) |
Accumulated undistributed net realized gain (loss) on investments and foreign currency transactions | | (30,533,373) |
Net unrealized appreciation (depreciation) on investments and assets and liabilities in foreign currencies | | 5,330,235 |
Net Assets | | $ 49,557,535 |
See accompanying notes which are an integral part of the financial statements.
Annual Report
Financial Statements - continued
Statement of Assets and Liabilities - continued
| October 31, 2003 |
| | |
Calculation of Maximum Offering Price
Class A:
Net Asset Value and redemption price per share
($8,695,239 ÷ 738,316 shares) | | $ 11.78 |
| | |
Maximum offering price per share (100/94.25 of $11.78) | | $ 12.50 |
Class T:
Net Asset Value and redemption price per share ($11,822,557 ÷ 1,012,049 shares) | | $ 11.68 |
| | |
Maximum offering price per share (100/96.50 of $11.68) | | $ 12.10 |
Class B:
Net Asset Value and offering price per share ($14,760,828 ÷ 1,288,163 shares) A | | $ 11.46 |
| | |
Class C:
Net Asset Value and offering price per share ($10,373,737 ÷ 900,573 shares) A | | $ 11.52 |
| | |
| | |
Institutional Class:
Net Asset Value, offering price and redemption price per share ($3,905,174 ÷ 327,838 shares) | | $ 11.91 |
A Redemption price per share is equal to net asset value less any applicable contingent deferred sales charge.
See accompanying notes which are an integral part of the financial statements.
Annual Report
Statement of Operations
| Year ended October 31, 2003 |
| | |
Investment Income | | |
Dividends | | $ 313,761 |
Interest | | 12,421 |
Security lending | | 35,777 |
| | 361,959 |
Less foreign taxes withheld | | (31,577) |
Total income | | 330,382 |
| | |
Expenses | | |
Management fee | $ 243,453 | |
Transfer agent fees | 171,510 | |
Distribution fees | 220,778 | |
Accounting fees and expenses | 66,331 | |
Non-interested trustees' compensation | 132 | |
Custodian fees and expenses | 56,114 | |
Registration fees | 55,857 | |
Audit | 54,186 | |
Legal | 1,334 | |
Miscellaneous | 2,865 | |
Total expenses before reductions | 872,560 | |
Expense reductions | (151,033) | 721,527 |
Net investment income (loss) | | (391,145) |
Realized and Unrealized Gain (Loss) Net realized gain (loss) on: | | |
Investment securities | 1,565,742 | |
Foreign currency transactions | (676) | |
Total net realized gain (loss) | | 1,565,066 |
Change in net unrealized appreciation (depreciation) on: Investment securities | 9,272,997 | |
Assets and liabilities in foreign currencies | 8,091 | |
Total change in net unrealized appreciation (depreciation) | | 9,281,088 |
Net gain (loss) | | 10,846,154 |
Net increase (decrease) in net assets resulting from operations | | $ 10,455,009 |
See accompanying notes which are an integral part of the financial statements.
Annual Report
Financial Statements - continued
Statement of Changes in Net Assets
| Year ended
October 31,
2003 | Year ended October 31,
2002 |
Increase (Decrease) in Net Assets | | |
Operations | | |
Net investment income (loss) | $ (391,145) | $ (653,050) |
Net realized gain (loss) | 1,565,066 | (9,499,258) |
Change in net unrealized appreciation (depreciation) | 9,281,088 | 3,943,300 |
Net increase (decrease) in net assets resulting
from operations | 10,455,009 | (6,209,008) |
Share transactions - net increase (decrease) | 5,652,788 | 2,604,541 |
Total increase (decrease) in net assets | 16,107,797 | (3,604,467) |
| | |
Net Assets | | |
Beginning of period | 33,449,738 | 37,054,205 |
End of period (including accumulated net investment loss of $142,165 and accumulated net investment loss of $0, respectively) | $ 49,557,535 | $ 33,449,738 |
See accompanying notes which are an integral part of the financial statements.
Annual Report
Financial Highlights - Class A
Years ended October 31, | 2003 | 2002 | 2001 | 2000 | 1999 F |
Selected Per-Share Data | | | | | |
Net asset value, beginning of period | $ 8.74 | $ 10.18 | $ 17.78 | $ 19.04 | $ 10.00 |
Income from Investment Operations | | | | | |
Net investment income (loss) E | (.07) | (.13) | (.15) | (.16) | (.13) |
Net realized and unrealized gain (loss) | 3.11 | (1.31) | (6.13) | (.76) | 9.17 |
Total from investment operations | 3.04 | (1.44) | (6.28) | (.92) | 9.04 |
Distributions from net investment income | - | - | (1.32) | (.04) | - |
Distributions in excess of net investment income | - | - | - | (.08) | - |
Distributions from net realized gain | - | - | - | (.22) | - |
Total distributions | - | - | (1.32) | (.34) | - |
Net asset value, end of period | $ 11.78 | $ 8.74 | $ 10.18 | $ 17.78 | $ 19.04 |
Total Return B,C,D | 34.78% | (14.15)% | (37.89)% | (5.07)% | 90.40% |
Ratios to Average Net Assets G | | | | | |
Expenses before expense
reductions | 2.20% | 2.13% | 1.88% | 1.44% | 2.43% A |
Expenses net of voluntary
waivers, if any | 1.75% | 1.94% | 1.88% | 1.44% | 2.02% A |
Expenses net of all reductions | 1.75% | 1.94% | 1.84% | 1.42% | 2.01% A |
Net investment income (loss) | (.76)% | (1.27)% | (1.10)% | (.76)% | (1.04)%A |
Supplemental Data | | | | | |
Net assets, end of period
(000 omitted) | $ 8,695 | $ 3,380 | $ 4,204 | $ 18,657 | $ 7,130 |
Portfolio turnover rate | 99% | 128% | 123% | 169% | 152% A |
A Annualized
B Total returns for periods of less than one year are not annualized.
C Total returns would have been lower had certain expenses not been reduced during the periods shown.
D Total returns do not include the effect of the sales charges.
E Calculated based on average shares outstanding during the period.
F For the period December 17, 1998 (commencement of operations) to October 31, 1999.
G Expense ratios reflect operating expenses of the class. Expenses before reductions do not reflect amounts reimbursed by the investment adviser or reductions from brokerage service arrangements or other expense offset arrangements and do not represent the amount paid by the class during periods when reimbursements or reductions occur. Expense ratios before reductions for start-up periods may not be representative of longer-term operating periods. Expenses net of any voluntary waivers reflect expenses after reimbursement by the investment adviser but prior to reductions from brokerage service arrangements or other expense offset arrangements. Expenses net of all reductions represent the net expenses paid by the class.
See accompanying notes which are an integral part of the financial statements.
Annual Report
Financial Highlights - Class T
Years ended October 31, | 2003 | 2002 | 2001 | 2000 | 1999 F |
Selected Per-Share Data | | | | | |
Net asset value, beginning of period | $ 8.69 | $ 10.17 | $ 17.72 | $ 19.01 | $ 10.00 |
Income from Investment Operations | | | | | |
Net investment income (loss) E | (.09) | (.15) | (.20) | (.21) | (.17) |
Net realized and unrealized gain (loss) | 3.08 | (1.33) | (6.14) | (.75) | 9.18 |
Total from investment operations | 2.99 | (1.48) | (6.34) | (.96) | 9.01 |
Distributions from net investment income | - | - | (1.21) | (.03) | - |
Distributions in excess of net investment income | - | - | - | (.08) | - |
Distributions from net realized gain | - | - | - | (.22) | - |
Total distributions | - | - | (1.21) | (.33) | - |
Net asset value, end of period | $ 11.68 | $ 8.69 | $ 10.17 | $ 17.72 | $ 19.01 |
Total Return B,C,D | 34.41% | (14.55)% | (38.16)% | (5.29)% | 90.10% |
Ratios to Average Net Assets G | | | | | |
Expenses before expense
reductions | 2.57% | 2.45% | 2.25% | 1.71% | 2.63% A |
Expenses net of voluntary
waivers, if any | 2.00% | 2.19% | 2.25% | 1.71% | 2.27% A |
Expenses net of all reductions | 2.00% | 2.18% | 2.21% | 1.69% | 2.26% A |
Net investment income (loss) | (1.01)% | (1.52)% | (1.48)% | (1.03)% | (1.29)% A |
Supplemental Data | | | | | |
Net assets, end of period
(000 omitted) | $ 11,823 | $ 7,731 | $ 10,363 | $ 29,840 | $ 25,682 |
Portfolio turnover rate | 99% | 128% | 123% | 169% | 152% A |
A Annualized
B Total returns for periods of less than one year are not annualized.
C Total returns would have been lower had certain expenses not been reduced during the periods shown.
D Total returns do not include the effect of the sales charges.
E Calculated based on average shares outstanding during the period.
F For the period December 17, 1998 (commencement of operations) to October 31, 1999.
G Expense ratios reflect operating expenses of the class. Expenses before reductions do not reflect amounts reimbursed by the investment adviser or reductions from brokerage service arrangements or other expense offset arrangements and do not represent the amount paid by the class during periods when reimbursements or reductions occur. Expense ratios before reductions for start-up periods may not be representative of longer-term operating periods. Expenses net of any voluntary waivers reflect expenses after reimbursement by the investment adviser but prior to reductions from brokerage service arrangements or other expense offset arrangements. Expenses net of all reductions represent the net expenses paid by the class.
See accompanying notes which are an integral part of the financial statements.
Annual Report
Financial Highlights - Class B
Years ended October 31, | 2003 | 2002 | 2001 | 2000 | 1999 F |
Selected Per-Share Data | | | | | |
Net asset value, beginning of period | $ 8.57 | $ 10.07 | $ 17.55 | $ 18.92 | $ 10.00 |
Income from Investment Operations | | | | | |
Net investment income (loss) E | (.14) | (.20) | (.26) | (.32) | (.23) |
Net realized and unrealized gain (loss) | 3.03 | (1.30) | (6.09) | (.74) | 9.15 |
Total from investment operations | 2.89 | (1.50) | (6.35) | (1.06) | 8.92 |
Distributions from net investment income | - | - | (1.13) | (.03) | - |
Distributions in excess of net investment income | - | - | - | (.06) | - |
Distributions from net realized gain | - | - | - | (.22) | - |
Total distributions | - | - | (1.13) | (.31) | - |
Net asset value, end of period | $ 11.46 | $ 8.57 | $ 10.07 | $ 17.55 | $ 18.92 |
Total Return B,C,D | 33.72% | (14.90)% | (38.44)% | (5.83)% | 89.20% |
Ratios to Average Net AssetsG | | | | | |
Expenses before expense
reductions | 3.03% | 2.90% | 2.74% | 2.25% | 3.18% A |
Expenses net of voluntary
waivers, if any | 2.50% | 2.69% | 2.74% | 2.25% | 2.78% A |
Expenses net of all reductions | 2.50% | 2.68% | 2.71% | 2.23% | 2.77% A |
Net investment income (loss) | (1.51)% | (2.02)% | (1.97)% | (1.57)% | (1.79)% A |
Supplemental Data | | | | | |
Net assets, end of period
(000 omitted) | $ 14,761 | $ 10,229 | $ 13,523 | $ 31,334 | $ 20,667 |
Portfolio turnover rate | 99% | 128% | 123% | 169% | 152% A |
A Annualized
B Total returns for periods of less than one year are not annualized.
C Total returns would have been lower had certain expenses not been reduced during the periods shown.
D Total returns do not include the effect of the contingent deferred sales charge.
E Calculated based on average shares outstanding during the period.
F For the period December 17, 1998 (commencement of operations) to October 31, 1999.
G Expense ratios reflect operating expenses of the class. Expenses before reductions do not reflect amounts reimbursed by the investment adviser or reductions from brokerage service arrangements or other expense offset arrangements and do not represent the amount paid by the class during periods when reimbursements or reductions occur. Expense ratios before reductions for start-up periods may not be representative of longer-term operating periods. Expenses net of any voluntary waivers reflect expenses after reimbursement by the investment adviser but prior to reductions from brokerage service arrangements or other expense offset arrangements. Expenses net of all reductions represent the net expenses paid by the class.
See accompanying notes which are an integral part of the financial statements.
Annual Report
Financial Highlights - Class C
Years ended October 31, | 2003 | 2002 | 2001 | 2000 | 1999 F |
Selected Per-Share Data | | | | | |
Net asset value, beginning of period | $ 8.61 | $ 10.13 | $ 17.58 | $ 18.93 | $ 10.00 |
Income from Investment Operations | | | | | |
Net investment income (loss) E | (.14) | (.20) | (.24) | (.31) | (.24) |
Net realized and unrealized gain (loss) | 3.05 | (1.32) | (6.10) | (.73) | 9.17 |
Total from investment operations | 2.91 | (1.52) | (6.34) | (1.04) | 8.93 |
Distributions from net investment income | - | - | (1.11) | (.03) | - |
Distributions in excess of net investment income | - | - | - | (.06) | - |
Distributions from net realized gain | - | - | - | (.22) | - |
Total distributions | - | - | (1.11) | (.31) | - |
Net asset value, end of period | $ 11.52 | $ 8.61 | $ 10.13 | $ 17.58 | $ 18.93 |
Total Return B,C,D | 33.80% | (15.00)% | (38.27)% | (5.72)% | 89.30% |
Ratios to Average Net Assets G | | | | | |
Expenses before expense
reductions | 2.82% | 2.72% | 2.59% | 2.16% | 3.11% A |
Expenses net of voluntary
waivers, if any | 2.50% | 2.67% | 2.59% | 2.16% | 2.78% A |
Expenses net of all reductions | 2.49% | 2.67% | 2.55% | 2.15% | 2.76% A |
Net investment income (loss) | (1.51)% | (2.00)% | (1.81)% | (1.49)% | (1.79)% A |
Supplemental Data | | | | | |
Net assets, end of period
(000 omitted) | $ 10,374 | $ 6,497 | $ 8,170 | $ 25,481 | $ 22,213 |
Portfolio turnover rate | 99% | 128% | 123% | 169% | 152% A |
A Annualized
B Total returns for periods of less than one year are not annualized.
C Total returns would have been lower had certain expenses not been reduced during the periods shown.
D Total returns do not include the effect of the contingent deferred sales charge.
E Calculated based on average shares outstanding during the period.
F For the period December 17, 1998 (commencement of operations) to October 31, 1999.
G Expense ratios reflect operating expenses of the class. Expenses before reductions do not reflect amounts reimbursed by the investment adviser or reductions from brokerage service arrangements or other expense offset arrangements and do not represent the amount paid by the class during periods when reimbursements or reductions occur. Expense ratios before reductions for start-up periods may not be representative of longer-term operating periods. Expenses net of any voluntary waivers reflect expenses after reimbursement by the investment adviser but prior to reductions from brokerage service arrangements or other expense offset arrangements. Expenses net of all reductions represent the net expenses paid by the class.
See accompanying notes which are an integral part of the financial statements.
Annual Report
Financial Highlights - Institutional Class
Years ended October 31, | 2003 | 2002 | 2001 | 2000 | 1999 E |
Selected Per-Share Data | | | | | |
Net asset value, beginning of period | $ 8.82 | $ 10.25 | $ 17.88 | $ 19.09 | $ 10.00 |
Income from Investment Operations | | | | | |
Net investment income (loss) D | (.05) | (.08) | (.10) | (.09) | (.10) |
Net realized and unrealized gain (loss) | 3.14 | (1.35) | (6.16) | (.77) | 9.19 |
Total from investment operations | 3.09 | (1.43) | (6.26) | (.86) | 9.09 |
Distributions from net investment income | - | - | (1.37) | (.04) | - |
Distributions in excess of net investment income | - | - | - | (.09) | - |
Distributions from net realized gain | - | - | - | (.22) | - |
Total distributions | - | - | (1.37) | (.35) | - |
Net asset value, end of period | $ 11.91 | $ 8.82 | $ 10.25 | $ 17.88 | $ 19.09 |
Total Return B,C | 35.03% | (13.95)% | (37.64)% | (4.75)% | 90.90% |
Ratios to Average Net Assets F | | | | | |
Expenses before expense
reductions | 1.67% | 1.52% | 1.48% | 1.13% | 2.15% A |
Expenses net of voluntary
waivers, if any | 1.50% | 1.51% | 1.48% | 1.13% | 1.77% A |
Expenses net of all reductions | 1.49% | 1.51% | 1.44% | 1.11% | 1.76% A |
Net investment income (loss) | (.51)% | (.84)% | (.70)% | (.45)% | (.78)% A |
Supplemental Data | | | | | |
Net assets, end of period
(000 omitted) | $ 3,905 | $ 5,612 | $ 795 | $ 2,746 | $ 2,986 |
Portfolio turnover rate | 99% | 128% | 123% | 169% | 152% A |
A Annualized
B Total returns for periods of less than one year are not annualized.
C Total returns would have been lower had certain expenses not been reduced during the periods shown.
D Calculated based on average shares outstanding during the period.
E For the period December 17, 1998 (commencement of operations) to October 31, 1999.
F Expense ratios reflect operating expenses of the class. Expenses before reductions do not reflect amounts reimbursed by the investment adviser or reductions from brokerage service arrangements or other expense offset arrangements and do not represent the amount paid by the class during periods when reimbursements or reductions occur. Expense ratios before reductions for start-up periods may not be representative of longer-term operating periods. Expenses net of any voluntary waivers reflect expenses after reimbursement by the investment adviser but prior to reductions from brokerage service arrangements or other expense offset arrangements. Expenses net of all reductions represent the net expenses paid by the class.
See accompanying notes which are an integral part of the financial statements.
Annual Report
Notes to Financial Statements
For the period ended October 31, 2003
1. Significant Accounting Policies.
Fidelity Advisor Japan Fund (the fund) is a fund of Fidelity Advisor Series VIII (the trust) and is authorized to issue an unlimited number of shares. The trust is registered under the Investment Company Act of 1940, as amended (the 1940 Act), as an open-end management investment company organized as a Massachusetts business trust.
The fund offers Class A, Class T, Class B, Class C and Institutional Class shares, each of which has equal rights as to assets and voting privileges. Each class has exclusive voting rights with respect to matters that affect that class. Class B shares will automatically convert to Class A shares after a holding period of seven years from the initial date of purchase. Investment income, realized and unrealized capital gains and losses, the common expenses of the fund, and certain fund-level expense reductions, if any, are allocated on a pro rata basis to each class based on the relative net assets of each class to the total net assets of the fund. Each class differs with respect to transfer agent and distribution and service plan fees incurred. Certain expense reductions also differ by class.
The financial statements have been prepared in conformity with accounting principles generally accepted in the United States of America, which require management to make certain estimates and assumptions at the date of the financial statements. The following summarizes the significant accounting policies of the fund:
Security Valuation. Net asset value per share (NAV calculation) is calculated as of the close of business of the New York Stock Exchange, normally 4:00 p.m. Eastern time. Equity securities for which market quotations are available are valued at the last sale price or official closing price (closing bid price or last evaluated quote if no sale has occurred) on the primary market or exchange on which they trade. If an event that is expected to materially affect the value of a security occurs after the close of an exchange or market on which that security trades, but prior to the NAV calculation, then that security will be fair valued taking the event into account. Securities (including restricted securities) for which market quotations are not readily available are valued at their fair value as determined in good faith under consistently applied procedures under the general supervision of the Board of Trustees. Price movements in futures contracts and ADRs, market and trading trends, the bid/ask quotes of brokers and off-exchange institutional trading may be reviewed in the course of making a good faith determination of a security's fair value. Short-term securities with remaining maturities of sixty days or less for which quotations are not readily available are valued on the basis of amortized cost. Investments in open-end investment companies are valued at their net asset value each business day.
Annual Report
Notes to Financial Statements - continued
1. Significant Accounting Policies - continued
Foreign Currency. The fund uses foreign currency contracts to facilitate transactions in foreign-denominated securities. Losses from these transactions may arise from changes in the value of the foreign currency or if the counterparties do not perform under the contracts' terms.
Foreign denominated assets, including investment securities, and liabilities are translated into U.S. dollars at the exchange rate at period end. Purchases and sales of investment securities, income and dividends received and expenses denominated in foreign currencies are translated into U.S. dollars at the exchange rate in effect on the transaction date.
The effects of exchange rate fluctuations on investments are included with the net realized and unrealized gain (loss) on investment securities. Other foreign currency transactions resulting in realized and unrealized gain (loss) are disclosed separately.
Investment Transactions and Income. Security transactions are accounted for as of trade date. Gains and losses on securities sold are determined on the basis of identified cost. Dividend income is recorded on the ex-dividend date, except for certain dividends from foreign securities where the ex-dividend date may have passed, which are recorded as soon as the fund is informed of the ex-dividend date. Non-cash dividends included in dividend income, if any, are recorded at the fair market value of the securities received. Interest income is accrued as earned. Interest income includes coupon interest and amortization of premium and accretion of discount on debt securities, which is accrued using the interest method. Investment income is recorded net of foreign taxes withheld where recovery of such taxes is uncertain.
Expenses. Most expenses of the trust can be directly attributed to a fund. Expenses which cannot be directly attributed are apportioned among the funds in the trust.
Income Tax Information and Distributions to Shareholders. Each year the fund intends to qualify as a regulated investment company by distributing all of its taxable income and realized gains under Subchapter M of the Internal Revenue Code. As a result, no provision for income taxes is required in the accompanying financial statements. Foreign taxes are provided for based on each fund's understanding of the tax rules and rates that exist in the foreign markets in which it invests. Income dividends and capital gain distributions are declared separately for each class. Distributions are recorded on the ex-dividend date.
Income and capital gain distributions are determined in accordance with income tax regulations, which may differ from generally accepted accounting principles. Capital accounts within the financial statements are adjusted for permanent and temporary book and tax differences. These adjustments have no impact on net assets or the results of operations. Temporary differences will reverse in a subsequent period. These differ
Annual Report
1. Significant Accounting Policies - continued
Income Tax Information and Distributions to Shareholders - continued
ences are primarily due to foreign currency transactions, passive foreign investment companies (PFIC), net operating losses, capital loss carryforwards and losses deferred due to wash sales.
The tax-basis components of distributable earnings and the federal tax cost as of period end were as follows:
Unrealized appreciation | $ 6,903,494 | | |
Unrealized depreciation | (2,401,441) | |
Net unrealized appreciation (depreciation) | 4,502,053 | |
Capital loss carryforward | (29,847,355) | |
| | |
Cost for federal income tax purposes | $ 46,242,366 | |
Short-Term Trading (Redemption) Fees. Shares purchased after March 31, 2004 and held in the fund less than 90 days will be subject to a short-term trading fee equal to 1.50% of the proceeds of the redeemed shares. The fee, which will be retained by the fund, is accounted for as an addition to paid in capital.
2. Operating Policies.
Repurchase Agreements. Fidelity Management & Research Company (FMR) has received an Exemptive Order from the Securities and Exchange Commission (the SEC) which permits the fund and other affiliated entities of FMR to transfer uninvested cash balances into joint trading accounts. These accounts are then invested in repurchase agreements that are collateralized by U.S. Treasury or Government obligations. The fund may also invest directly with institutions, in repurchase agreements that are collateralized by commercial paper obligations and corporate obligations. Collateral is held in segregated accounts with custodian banks and may be obtained in the event of a default of the counterparty. Collateral is marked-to-market daily and maintained at a value at least equal to the principal amount of the repurchase agreement (including accrued interest).
3. Purchases and Sales of Investments.
Information regarding purchases and sales of securities is included under the caption "Other Information" at the end of the fund's Schedule of Investments.
4. Fees and Other Transactions with Affiliates.
Management Fee. FMR and its affiliates provide the fund with investment management related services for which the fund pays a monthly management fee. The management fee is the sum of an individual fund fee rate that is based on an annual rate of .45% of the fund's average net assets and a group fee rate that averaged .28% during the
Annual Report
Notes to Financial Statements - continued
4. Fees and Other Transactions with Affiliates - continued
Management Fee - continued
period. The group fee rate is based upon the average net assets of all the mutual funds advised by FMR. The group fee rate decreases as assets under management increase and increases as assets under management decrease. For the period, the total annual management fee rate was .73% of the fund's average net assets.
Distribution and Service Plan. In accordance with Rule 12b-1 of the 1940 Act, the Fund has adopted separate Distribution and Service Plans for each class of shares. Certain classes pay Fidelity Distributors Corporation (FDC), an affiliate of FMR, separate Distribution and Service Fees, each of which is based on an annual percentage of each class' average net assets. Class A and Class T Plans also authorize the use of brokerage commissions to pay distribution expenses. This practice has been discontinued and no commissions incurred after June 30, 2003 have been used to pay distribution expenses. In addition, FDC may pay financial intermediaries for selling shares of the fund and providing shareholder support services. For the period, the Distribution and Service Fee rates, the total amounts paid to and retained by FDC and the amount of distribution expenses paid with brokerage commissions were as follows:
| Distribution
Fee | Service
Fee | Paid to
FDC | Retained
by FDC | Paid with
Commissions |
Class A | -% | .25% | $ 12,142 | $ - | $ - |
Class T | .25% | .25% | 38,942 | - | - |
Class B | .75% | .25% | 105,492 | 79,217 | - |
Class C | .75% | .25% | 64,202 | 12,914 | - |
| | | $ 220,778 | $ 92,131 | $ - |
Sales Load. FDC receives a front-end sales charge of up to 5.75% for selling Class A shares, and 3.50% for selling Class T shares of the fund. FDC receives the proceeds of contingent deferred sales charges levied on Class A, Class T, Class B, and Class C redemptions. These charges depend on the holding period. The deferred sales charges range from 5% to 1% for Class B, 1% for Class C, and .25% for certain purchases of Class A and Class T shares.
For the period, sales charge amounts retained by FDC were as follows:
| Retained
by FDC |
Class A | $ 18,186 |
Class T | 5,665 |
Class B* | 45,500 |
Class C* | 4,513 |
| $ 73,864 |
* When Class B and Class C shares are initially sold, FDC pays commissions from its own resources to financial intermediaries through which the sales are made.
Annual Report
4. Fees and Other Transactions with Affiliates - continued
Transfer Agent Fees. Fidelity Investments Institutional Operations Company, Inc. (FIIOC), an affiliate of FMR, is the transfer, dividend disbursing and shareholder servicing agent (collectively referred to as the transfer agent) for each class of the fund. FIIOC receives account fees and asset-based fees that vary according to the account size and type of account of the shareholders of the respective classes of the fund. FIIOC pays for typesetting, printing and mailing of all shareholder reports, except proxy statements. For the period, the following amounts were paid to FIIOC:
| Amount | % of
Average
Net Assets |
Class A | $ 25,167 | .51 |
Class T | 50,078 | .64 |
Class B | 62,791 | .59 |
Class C | 25,087 | .39 |
Institutional Class | 8,387 | .23 |
| $ 171,510 | |
Accounting and Security Lending Fees. Fidelity Service Company, Inc. (FSC), an affiliate of FMR, maintains the fund's accounting records and administers the security lending program. The security lending fee is based on the number and duration of lending transactions. The accounting fee is based on the level of average net assets for the month plus out-of-pocket expenses.
Central Funds. The fund may invest in affiliated Central Funds managed by Fidelity Investments Money Management, Inc. (FIMM), an affiliate of FMR. The Central Funds are open-end investment companies available only to investment companies and other accounts managed by FMR and its affiliates. The Central Funds seek preservation of capital and current income and do not pay a management fee. Income distributions earned by the fund are recorded as income in the accompanying financial statements and totaled $22,648 for the period.
5. Committed Line of Credit.
The fund participates with other funds managed by FMR in a $3.5 billion credit facility (the "line of credit") to be utilized for temporary or emergency purposes to fund shareholder redemptions or for other short-term liquidity purposes. The fund has agreed to pay commitment fees on its pro rata portion of the line of credit. During the period, there were no borrowings on this line of credit.
Annual Report
Notes to Financial Statements - continued
6. Security Lending.
The fund lends portfolio securities from time to time in order to earn additional income. The fund receives collateral (in the form of U.S. Treasury obligations, letters of credit and/or cash) against the loaned securities and maintains collateral in an amount not less than 100% of the market value of the loaned securities during the period of the loan. The market value of the loaned securities is determined at the close of business of the fund and any additional required collateral is delivered to the fund on the next business day. If the borrower defaults on its obligation to return the securities loaned because of insolvency or other reasons, a fund could experience delays and costs in recovering the securities loaned or in gaining access to the collateral. Cash collateral is invested in cash equivalents. The value of loaned securities and cash collateral at period end are disclosed on the fund's Statement of Assets and Liabilities.
7. Expense Reductions.
FMR agreed to reimburse the classes of the fund to the extent operating expenses exceeded certain levels of average net assets as noted in the table below. Some expenses, for example interest expense, are excluded from this reimbursement.
| Expense
Limitations | Reimbursement
from adviser |
Class A | 1.75% | $ 22,145 |
Class T | 2.00% | 45,285 |
Class B | 2.50% | 56,190 |
Class C | 2.50% | 21,001 |
Institutional Class | 1.50% | 6,334 |
| | $ 150,955 |
Many of the brokers with whom FMR places trades on behalf of the fund provided services to the fund in addition to trade execution. These services may include payments of expenses on behalf of the fund to support distribution of fund shares for Class A and Class T ("Distribution Expense Reduction") and to pay other fund expenses, such as transfer agent fees ("Other Expense Reduction") collectively referred to as "Brokerage Service Arrangements" in the accompanying table. Brokerage service arrangements generally benefits all shareholders of each class by reducing fund expenses. Each of Class A and Class T shareholders' Other Expense Reduction benefit is reduced by the amount of any Distribution Expense Reduction. In addition, through arrangements with the fund's custodian, credits realized as a result of uninvested cash balances were used to reduce the fund's expenses. All of the applicable expense reductions are noted in the table below.
Annual Report
7. Expense Reductions - continued
| Distribution
expense
reduction | Custody
expense
reduction |
Fund Level | $ - | $ 78 |
8. Other Information.
At the end of the period, one unaffiliated shareholder was the owner of record of 14% of the total outstanding shares of the fund.
9. Share Transactions.
Transactions for each class of shares were as follows:
| Shares | Dollars |
Years ended October 31, | 2003 | 2002 | 2003 | 2002 |
Class A | | | | |
Shares sold | 1,380,900 | 826,406 | $ 13,339,242 | $ 8,388,540 |
Shares redeemed | (1,029,447) | (852,350) | (9,797,319) | (8,637,459) |
Net increase (decrease) | 351,453 | (25,944) | $ 3,541,923 | $ (248,919) |
Class T | | | | |
Shares sold | 660,357 | 449,295 | $ 6,206,945 | $ 4,577,112 |
Shares redeemed | (537,620) | (578,673) | (4,681,650) | (5,722,371) |
Net increase (decrease) | 122,737 | (129,378) | $ 1,525,295 | $ (1,145,259) |
Class B | | | | |
Shares sold | 545,851 | 348,625 | $ 5,257,273 | $ 3,492,332 |
Shares redeemed | (451,855) | (496,772) | (4,150,331) | (4,768,111) |
Net increase (decrease) | 93,996 | (148,147) | $ 1,106,942 | $ (1,275,779) |
Class C | | | | |
Shares sold | 575,376 | 584,055 | $ 5,681,137 | $ 5,899,035 |
Shares redeemed | (429,211) | (636,330) | (3,930,775) | (6,259,305) |
Net increase (decrease) | 146,165 | (52,275) | $ 1,750,362 | $ (360,270) |
Institutional Class | | | | |
Shares sold | 1,332,309 | 2,143,103 | $ 12,611,093 | $ 22,491,520 |
Shares redeemed | (1,641,005) | (1,584,195) | (14,882,827) | (16,856,752) |
Net increase (decrease) | (308,696) | 558,908 | $ (2,271,734) | $ 5,634,768 |
Annual Report
Report of Independent Auditors
To the Trustees of Fidelity Advisor Series VIII and the Shareholders of Fidelity Advisor Japan Fund.
In our opinion, the accompanying statement of assets and liabilities, including the schedule of investments, and the related statements of operations and of changes in net assets and the financial highlights present fairly, in all material respects, the financial position of Fidelity Advisor Japan Fund (a fund of Fidelity Advisor Series VIII) at October 31, 2003 and the results of its operations, the changes in its net assets and the financial highlights for the periods indicated, in conformity with accounting principles generally accepted in the United States of America. These financial statements and financial highlights (hereafter referred to as "financial statements") are the responsibility of the Fidelity Advisor Japan Fund's management; our responsibility is to express an opinion on these financial statements based on our audits. We conducted our audits of these financial statements in accordance with auditing standards generally accepted in the United States of America which require that we plan and perform the audit to obtain reasonable assurance about whether the financial statements are free of material misstatement. An audit includes examining, on a test basis, evidence supporting the amounts and disclosures in the financial statements, assessing the accounting principles used and significant estimates made by management, and evaluating the overall financial statement presentation. We believe that our audits, which included confirmation of securities at October 31, 2003 by correspondence with the custodian and brokers, provide a reasonable basis for our opinion.
/s/PricewaterhouseCoopers LLP
PricewaterhouseCoopers LLP
Boston, Massachusetts
December 12, 2003
Annual Report
Trustees and Officers
The Trustees, Members of the Advisory Board, and executive officers of the trust and fund, as applicable, are listed below. The Board of Trustees governs the fund and is responsible for protecting the interests of shareholders. The Trustees are experienced executives who meet periodically throughout the year to oversee the fund's activities, review contractual arrangements with companies that provide services to the fund, and review the fund's performance. Except for William O. McCoy, each of the Trustees oversees 289 funds advised by FMR or an affiliate. Mr. McCoy oversees 291 funds advised by FMR or an affiliate.
The Trustees hold office without limit in time except that (a) any Trustee may resign; (b) any Trustee may be removed by written instrument, signed by at least two-thirds of the number of Trustees prior to such removal; (c) any Trustee who requests to be retired or who has become incapacitated by illness or injury may be retired by written instrument signed by a majority of the other Trustees; and (d) any Trustee may be removed at any special meeting of shareholders by a two-thirds vote of the outstanding voting securities of the trust. In any event, each non-interested Trustee shall retire not later than the last day of the calendar year in which his or her 72nd birthday occurs. The executive officers and Advisory Board Members hold office without limit in time, except that any officer and Advisory Board Member may resign or may be removed by a vote of a majority of the Trustees at any regular meeting or any special meeting of the Trustees. Except as indicated, each individual has held the office shown or other offices in the same company for the past five years.
The fund's Statement of Additional Information (SAI) includes more information about the Trustees. To request a free copy, call Fidelity at 1-877-208-0098.
Interested Trustees*:
Correspondence intended for each Trustee who is an "interested person" (as defined in the 1940 Act) may be sent to 82 Devonshire Street, Boston, Massachusetts 02109.
Name, Age; Principal Occupation |
Edward C. Johnson 3d (73)** |
| Year of Election or Appointment: 1983 Mr. Johnson is Chairman of the Board of Trustees. Mr. Johnson serves as Chief Executive Officer, Chairman, and a Director of FMR Corp.; a Director and Chairman of the Board and of the Executive Committee of FMR; Chairman and a Director of Fidelity Management & Research (Far East) Inc.; Chairman (1998) and a Director of Fidelity Investments Money Management, Inc.; and Chairman (2001) and a Director (2000) of FMR Co., Inc. |
Abigail P. Johnson (41)** |
| Year of Election or Appointment: 2001 Senior Vice President of Advisor Japan (2001). Ms. Johnson also serves as Senior Vice President of other Fidelity funds (2001). She is President and a Director of FMR (2001), Fidelity Investments Money Management, Inc. (2001), FMR Co., Inc. (2001), and a Director of FMR Corp. Previously, Ms. Johnson managed a number of Fidelity funds. |
Laura B. Cronin (49) |
| Year of Election or Appointment: 2003 Ms. Cronin is an Executive Vice President (2002) and Chief Financial Officer (2002) of FMR Corp. and is a member of the Fidelity Management Committee (2003). Previously, Ms. Cronin served as Vice President of Finance of FMR (1997-1999), and Chief Financial Officer of FMR (1999-2001), Fidelity Personal Investments (2001), and Fidelity Brokerage Company (2001-2002). |
Robert L. Reynolds (51) |
| Year of Election or Appointment: 2003 Mr. Reynolds is a Director (2003) and Chief Operating Officer (2002) of FMR Corp. and is the head of the Fidelity Management Committee (2003). He also serves on the Board at Fidelity Investments Canada, Ltd. (2000). Previously, Mr. Reynolds served as President of Fidelity Investments Institutional Retirement Group (1996-2000). |
* Trustees have been determined to be "Interested Trustees" by virtue of, among other things, their affiliation with the trust or various entities under common control with FMR.
** Edward C. Johnson 3d, Trustee, is Abigail P. Johnson's father.
Annual Report
Non-Interested Trustees:
Correspondence intended for each non-interested Trustee (that is, the Trustees other than the Interested Trustees) may be sent to Fidelity Investments, P.O. Box 55235, Boston, Massachusetts 02205-5235.
Name, Age; Principal Occupation |
J. Michael Cook (61) |
| Year of Election or Appointment: 2001 Prior to Mr. Cook's retirement in May 1999, he served as Chairman and Chief Executive Officer of Deloitte & Touche LLP (accounting/consulting), Chairman of the Deloitte & Touche Foundation, and a member of the Board of Deloitte Touche Tohmatsu. He currently serves as a Director of Comcast (telecommunications, 2002), International Flavors & Fragrances, Inc. (2000), Rockwell Automation (2000) and The Dow Chemical Company (2000). He is a Member of the Diversity Advisory Council of Marakon (2003) and the Advisory Board of the Directorship Search Group, Chairman Emeritus of the Board of Catalyst (a leading organization for the advancement of women in business), and is Chairman of the Accountability Advisory Council to the Comptroller General of the United States. He also serves as a Member of the Advisory Board of the Graduate School of Business of the University of Florida, his alma mater. |
Ralph F. Cox (71) |
| Year of Election or Appointment: 1991 Mr. Cox is President of RABAR Enterprises (management consulting for the petroleum industry). Prior to February 1994, he was President of Greenhill Petroleum Corporation (petroleum exploration and production). Until March 1990, Mr. Cox was President and Chief Operating Officer of Union Pacific Resources Company (exploration and production). He is a Director of CH2M Hill Companies (engineering), and Abraxas Petroleum (petroleum exploration and production, 1999). In addition, he is a member of advisory boards of Texas A&M University and the University of Texas at Austin. |
Phyllis Burke Davis (71) |
| Year of Election or Appointment: 1992 Mrs. Davis is retired from Avon Products, Inc. (consumer products) where she held various positions including Senior Vice President of Corporate Affairs and Group Vice President of U.S. product marketing, sales, distribution, and manufacturing. Mrs. Davis is a member of the Board of Directors of the Southampton Hospital in Southampton, N.Y. (1998). Previously, she served as a Director of BellSouth Corporation (telecommunications), Eaton Corporation (diversified industrial), the TJX Companies, Inc. (retail stores), Hallmark Cards, Inc., and Nabisco Brands, Inc. |
Robert M. Gates (60) |
| Year of Election or Appointment: 1997 Dr. Gates is President of Texas A&M University (2002). He was Director of the Central Intelligence Agency (CIA) from 1991 to 1993. From 1989 to 1991, Dr. Gates served as Assistant to the President of the United States and Deputy National Security Advisor. Dr. Gates is a Director of NACCO Industries, Inc. (mining and manufacturing), and
Parker Drilling Co., Inc. (drilling and rental tools for the energy industry, 2001). He also serves as a member of the Advisory Board of VoteHere.net (secure internet voting, 2001). Previously, Dr. Gates served
as a Director of LucasVarity PLC (automotive components and diesel engines), a Director of TRW Inc. (automotive, space, defense, and information technology), and Dean of the George Bush School of Government and Public Service at Texas A&M University (1999-2001). Dr. Gates also is a Trustee of the Forum for International Policy. |
Donald J. Kirk (70) |
| Year of Election or Appointment: 1987 Mr. Kirk is a Governor of the American Stock Exchange (2001), a
Trustee and former Chairman of the Board of Trustees of the Greenwich Hospital Association, a Director of the Yale-New Haven Health Services Corp. (1998), and a Director Emeritus and former Chairman of the Board of Directors of National Arts Strategies Inc. Mr. Kirk was an Executive-in-Residence (1995-2000) and a Professor (1987-1995) at Columbia University Graduate School of Business. Prior to 1987, he was Chairman of the Financial Accounting Standards Board. Previously, Mr. Kirk served as a Governor of the National Association of Securities Dealers, Inc. (1996-2002), a member and Vice Chairman of the Public Oversight Board of the American Institute of Certified Public Accountants' SEC Practice Section (1995-2002), a Director of General Re Corporation (reinsurance, 1987-1998) and as a Director of Valuation Research Corp. (appraisals and valuations). |
Marie L. Knowles (57) |
| Year of Election or Appointment: 2001 Prior to Ms. Knowles' retirement in June 2000, she served as Executive Vice President and Chief Financial Officer of Atlantic Richfield Company (ARCO) (diversified energy, 1996-2000). From 1993 to 1996, she was a Senior Vice President of ARCO and President of ARCO Transportation Company. She served as a Director of ARCO from 1996 to 1998. She currently serves as a Director of Phelps Dodge Corporation (copper mining and manufacturing), URS Corporation (multidisciplinary engineering, 1999), and McKesson Corporation (healthcare service, 2002). Ms. Knowles is a Trustee of the Brookings Institution and the Catalina Island Conservancy and also serves as a member of the Advisory Board for the School of Engineering of the University of Southern California. |
Ned C. Lautenbach (59) |
| Year of Election or Appointment: 2000 Mr. Lautenbach has been a partner of Clayton, Dubilier & Rice, Inc. (private equity investment firm) since September 1998. Previously, Mr. Lautenbach was with the International Business Machines Corporation (IBM) from 1968 until his retirement in 1998. He was most recently
Senior Vice President and Group Executive of Worldwide Sales and Services. From 1993 to 1995, he was Chairman of IBM World Trade Corporation, and from 1994 to 1998 was a member of IBM's Corporate Executive Committee. Mr. Lautenbach serves as Chairman and as a Director (1998) of Acterna Corporation (communications test equipment). He is also Co-Chairman of Covansys, Inc. (global provider of business and technology solutions, 2000). In addition, he is a Director of Eaton Corporation (diversified industrial) and the Philharmonic Center for the Arts in Naples, Florida (1999). He also is a member of the Council on Foreign Relations. |
Marvin L. Mann (70) |
| Year of Election or Appointment: 1993 Mr. Mann is Chairman of the non-interested Trustees (2001). He is Chairman Emeritus of Lexmark International, Inc. (computer peripherals) where he served as CEO until April 1998 and retired as Chairman May 1999, and remains a member of the Board. Prior to 1991, he held the positions of Vice President of International Business Machines Corporation (IBM) and President and General Manager of various IBM divisions and subsidiaries. Mr. Mann is a Board member of Imation Corp. (imaging and information storage) and Acterna Corporation (communications test equipment, 1999). He is also a member of the Director Services Committee of the Investment Company Institute. In addition, Mr. Mann is a member of the President's Cabinet at the University of Alabama and the Board of Visitors of the Culverhouse College of Commerce and Business Administration at the University of Alabama. |
William O. McCoy (70) |
| Year of Election or Appointment: 1997 Prior to his retirement in December 1994, Mr. McCoy was Vice Chairman of the Board of BellSouth Corporation (telecommunications) and President of BellSouth Enterprises. He is currently a Director of Liberty Corporation (holding company), Duke Realty Corporation (real estate), Progress Energy, Inc. (electric utility), and Acterna Corporation (communications test equipment, 1999). He is also a partner of Franklin Street Partners (private investment management firm) and a member of the Research Triangle Foundation Board. In addition, Mr. McCoy served as the Interim Chancellor (1999-2000) and a member of the Board of Visitors (1994-1998) for the University of North Carolina at Chapel Hill and currently serves on the Board of Directors of the University of North Carolina Health Care System and the Board of Visitors of the Kenan-Flagler Business School (University of North Carolina at Chapel Hill). He also served as Vice President of Finance for the University of North Carolina (16-school system, 1995-1998). |
William S. Stavropoulos (64) |
| Year of Election or Appointment: 2001 Mr. Stavropoulos is Chairman of the Board, President and CEO (2002), and Chairman of the Executive Committee (2000) and a Director of The Dow Chemical Company. Since joining The Dow Chemical Company in 1967, Mr. Stavropoulos served in numerous senior management positions, including President (1993-2000) and Chief Executive Officer (1995-2000). Currently, he is a Director of NCR Corporation (data warehousing and technology solutions), BellSouth Corporation (telecommunications), Chemical Financial Corporation, and Maersk Inc. (industrial conglomerate, 2002). He also serves as a member of the Board of Trustees of the American Enterprise Institute for Public Policy Research. In addition, Mr. Stavropoulos is a member of The Business Council, J.P. Morgan International Council, World Business Council for Sustainable Development, and the University of Notre Dame Advisory Council for the College of Science. |
Annual Report
Trustees and Officers - continued
Advisory Board Members and Executive Officers:
Correspondence intended for Dr. Heilmeier may be sent to Fidelity Investments, P.O. Box 55235, Boston, Massachusetts 02205-5235. Correspondence intended for each executive officer and Mr. Lynch may be sent to 82 Devonshire Street, Boston, Massachusetts 02109.
Name, Age; Principal Occupation |
George H. Heilmeier (67) |
| Year of Election or Appointment: 2003 Member of the Advisory Board of Fidelity Advisor Series VIII. Dr. Heilmeier is Chairman Emeritus of Telcordia Technologies (communication software and systems), where prior to his retirement, he served as company Chairman and Chief Executive Officer. He currently serves on the Boards of Directors of The Mitre Corporation (systems engineering and information technology support for the government), INET Technologies Inc. (telecommunications network surveillance, 2001) and Teletech Holdings (customer management services, 1998). He is Chairman of the General Motors Technology Advisory Committee and a Life Fellow of the IEEE (2000). Dr. Heilmeier is a member of the Defense Science Board and the National Security Agency Advisory Board. He is also a member of the National Academy of Engineering, the American Academy of Arts and Sciences and The Board of Overseers of the School of Engineering and Applied Science of the University of Pennsylvania. Previously, Dr. Heilmeier served as a Director of TRW Inc. (automotive, space, defense, and information technology, 1992-2002) and Compaq (1994-2002). |
Peter S. Lynch (60) |
| Year of Election or Appointment: 2003 Member of the Advisory Board of Fidelity Advisor Series VIII. Vice Chairman and a Director of FMR, and Vice Chairman (2001) and a Director (2000) of FMR Co., Inc. Previously, Mr. Lynch served as a Trustee of the Fidelity funds (1990-2003). Prior to May 31, 1990, he was a Director of FMR and Executive Vice President of FMR (a position he held until March 31, 1991), Vice President of Fidelity Magellan Fund and FMR Growth Group Leader, and Managing Director of FMR Corp. Mr. Lynch was also Vice President of Fidelity Investments Corporate Services. In addition, he serves as a Trustee of Boston College, Massachusetts Eye & Ear Infirmary, Historic Deerfield, John F. Kennedy Library, and the Museum of Fine Arts of Boston. |
Philip L. Bullen (44) |
| Year of Election or Appointment: 2001 Vice President of Advisor Japan. Mr. Bullen also serves as Vice President of certain Equity Funds (2001) and certain High Income Funds (2001). He is Senior Vice President of FMR (2001) and FMR Co., Inc. (2001), President and a Director of Fidelity Management & Research (Far East) Inc. (2001), President and a Director of Fidelity Management & Research (U.K.) Inc. (2002), and a Director of Strategic Advisers, Inc. (2002). Before joining Fidelity Investments, Mr. Bullen was President and Chief Investment Officer of Santander Global Advisors (1997-2000) and President and Chief Executive Officer of Boston's Baring Asset Management Inc. (1994-1997). |
Eric D. Roiter (54) |
| Year of Election or Appointment: 1998 Secretary of Advisor Japan. He also serves as Secretary of other Fidelity funds (1998); Vice President, General Counsel, and Clerk of FMR Co., Inc. (2001) and FMR (1998); Vice President and Clerk of FDC (1998); Assistant Clerk of Fidelity Management & Research (U.K.) Inc. (2001) and Fidelity Management & Research (Far East) Inc. (2001); and Assistant Secretary of Fidelity Investments Money Management Inc. (2001). Prior to joining Fidelity, Mr. Roiter was with the law firm of Debevoise & Plimpton, as an associate (1981-1984) and as a partner (1985-1997), and served as an Assistant General Counsel of the U.S. Securities and Exchange Commission (1979-1981). Mr. Roiter is an Adjunct Member, Faculty of Law, at Boston College Law School (2003). |
Stuart Fross (44) |
| Year of Election or Appointment: 2003 Assistant Secretary of Advisor Japan. Mr. Fross also serves as Assistant Secretary of other Fidelity funds (2003) and is an employee of FMR. |
Maria F. Dwyer (44) |
| Year of Election or Appointment: 2002 President and Treasurer of Advisor Japan. Ms. Dwyer also serves as President and Treasurer of other Fidelity funds (2002) and is a Vice President (1999) and an employee (1996) of FMR. Prior to joining Fidelity, Ms. Dwyer served as Director of Compliance for MFS Investment Management. |
Timothy F. Hayes (52) |
| Year of Election or Appointment: 2002 Chief Financial Officer of Advisor Japan. Mr. Hayes also serves as Chief Financial Officer of other Fidelity funds (2002). Recently he was appointed President of Fidelity Service Company (2003) where he also serves as a Director. Mr. Hayes also serves as President of Fidelity Investments Operations Group (FIOG, 2002), which includes Fidelity Pricing and Cash Management Services Group (FPCMS), where he was appointed President in 1998. Previously, Mr. Hayes served as Chief Financial Officer of Fidelity Investments Corporate Systems and Service Group (1998) and Fidelity Systems Company (1997-1998). |
John R. Hebble (45) |
| Year of Election or Appointment: 2003 Deputy Treasurer of Advisor Japan. Mr. Hebble also serves as Deputy Treasurer of other Fidelity funds (2003), and is an employee of FMR. Before joining Fidelity Investments, Mr. Hebble worked at Deutsche Asset Management where he served as Director of Fund Accounting (2002-2003) and Assistant Treasurer of the Scudder Funds (1998-2003). |
John H. Costello (57) |
| Year of Election or Appointment: 1998 Assistant Treasurer of Advisor Japan. Mr. Costello also serves as Assistant Treasurer of other Fidelity funds and is an employee of FMR. |
Francis V. Knox, Jr. (56) |
| Year of Election or Appointment: 2002 Assistant Treasurer of Advisor Japan. Mr. Knox also serves as Assistant Treasurer of other Fidelity funds (2002), and is a Vice President and an employee of FMR. Previously, Mr. Knox served as Vice President of Investment & Advisor Compliance (1990-2001), and Compliance Officer of Fidelity Management & Research (U.K.) Inc. (1992-2002), Fidelity Management & Research (Far East) Inc. (1991-2002), and FMR Corp. (1995-2002). |
Mark Osterheld (48) |
| Year of Election or Appointment: 2002 Assistant Treasurer of Advisor Japan. Mr. Osterheld also serves as Assistant Treasurer of other Fidelity funds (2002) and is an employee of FMR. |
Thomas J. Simpson (45) |
| Year of Election or Appointment: 2000 Assistant Treasurer of Advisor Japan. Mr. Simpson is Assistant Treasurer of other Fidelity funds (2000) and an employee of FMR (1996). Prior to joining FMR, Mr. Simpson was Vice President and Fund Controller of Liberty Investment Services (1987-1995). |
Annual Report
Investment Adviser
Fidelity Management & Research Company
Boston, MA
Investment Sub-Advisers
FMR Co., Inc.
Fidelity Management & Research
(U.K.) Inc.
Fidelity Management & Research
(Far East) Inc.
Fidelity International
Investment Advisors
Fidelity Investments Japan Limited
Fidelity International Investment Advisors (U.K.) Limited
General Distributor
Fidelity Distributors Corporation
Boston, MA
Transfer and Shareholder
Servicing Agents
Fidelity Investments Institutional Operations Company, Inc.
Boston, MA
Custodian
State Street Bank and Trust Company
Quincy, MA
(Fidelity Investment logo)(registered trademark)
Corporate Headquarters
82 Devonshire St., Boston, MA 02109
www.fidelity.com
AJAFI-UANN-1203
1.784757.100
Fidelity® Advisor
Korea
Fund - Class A, Class T, Class B
and Class C
Annual Report
October 31, 2003
(2_fidelity_logos) (Registered_Trademark)
Contents
Chairman's Message | <Click Here> | Ned Johnson's message to shareholders. |
Performance | <Click Here> | How the fund has done over time. |
Management's Discussion | <Click Here> | The manager's review of fund performance, strategy and outlook. |
Investment Changes | <Click Here> | A summary of major shifts in the fund's investments over the past six months. |
Investments | <Click Here> | A complete list of the fund's investments with their market values. |
Financial Statements | <Click Here> | Statements of assets and liabilities, operations, and changes in net assets,
as well as financial highlights. |
Notes | <Click Here> | Notes to the financial statements. |
Auditors' Opinion | <Click Here> | |
Trustees and Officers | <Click Here> | |
| | |
For a free copy of the fund's proxy voting guidelines call 1-877-208-0098 or visit the Securities and Exchange Commission (SEC)'s web site at www.sec.gov.
Third party marks appearing herein are the property of their respective owners.
All other marks appearing herein are registered or unregistered trademarks or service marks of FMR Corp. or an affiliated company.
(Recycle graphic) This report is printed on recycled paper using soy-based inks.
This report and the financial statements contained herein are submitted for the general information of the shareholders of the fund. This report is not authorized for distribution to prospective investors in the fund unless preceded or accompanied by an effective prospectus.
Mutual fund shares are not deposits or obligations of, or guaranteed by, any depository institution. Shares are not insured by the FDIC, Federal Reserve Board or any other agency, and are subject to investment risks, including possible loss of principal amount invested.
Neither the fund nor Fidelity Distributors Corporation is a bank.
For more information on any Fidelity Advisor fund, including charges and expenses, contact your investment professional for a free prospectus. Read it carefully before you invest or send money.
Annual Report
Chairman's Message
(photo_of_Edward_C_Johnson_3d)
Dear Shareholder:
Many of you have read or heard news stories recently that were critical of mutual funds and made allegations that the mutual fund industry has been less than forthright. I find these reports unsettling and not necessarily an accurate picture of the overall industry, and I would like you to know where we at Fidelity stand.
With specific regard to allegations that certain mutual fund companies were violating the Securities and Exchange Commission's forward pricing rules or were involved in so-called "market timing" activities, I want to say two things:
First, Fidelity does not have agreements that permit customers who buy fund shares after 4 p.m. to obtain the 4 p.m. price. This is not to say that someone could not deceive the company through fraudulent acts. But I underscore that we have no so-called "agreements" which would permit this illegal practice.
Second, Fidelity has been on record for years opposing predatory short-term trading which adversely affects other shareholders in a mutual fund. In fact, in the 1980s, we began charging a fee - which is returned to the fund and, therefore, to investors - to discourage this activity. What's more, several years ago we took the industry lead in developing a Fair Value Pricing Policy to prevent market timing on foreign securities in our funds. It is reasonable to assume that another structure can be developed that would alter the system to make it much more difficult for predatory traders to operate. This, however, will only be achieved through close cooperation among regulators, legislators and the industry.
Certainly no industry is perfect, and there have been instances of unethical and illegal activity from time to time within the mutual fund industry. When this occurs, confessed or convicted offenders should be dealt with appropriately. Clearly, every system can be improved. We applaud well thought out improvements by regulators, legislators and industry representatives that achieve the common goal of building and protecting the value of investors' holdings. But we remain concerned about the risk of over-regulation and the quick application of simplistic solutions to intricate problems.
For more than 57 years, Fidelity Investments has worked very hard to improve its products and service to justify your trust. When our family founded this company in 1946, we had only a few hundred customers. Many of them were family and friends. Today, we serve more than 18 million customers including individual investors and participants in retirement plans across America.
Let me close by saying that we do not take your trust in us for granted, and we realize that we must always work to improve all aspects of our service to you. In turn, we urge you to continue your active participation with your financial matters, so that your interests can be well served.
Annual Report
Best regards,
/s/Edward C. Johnson 3d
Edward C. Johnson 3d
Annual Report
Performance: The Bottom Line
Average annual total return reflects the change in the value of an investment, assuming reinvestment of the class' dividend income and capital gains (the profits earned upon the sale of securities that have grown in value) and assuming a constant rate of performance each year. During periods of reimbursement by Fidelity, a fund's total return will be greater than it would be had the reimbursement not occurred. The $10,000 table and the fund's returns do not reflect the deduction of taxes that a shareholder would pay on fund distributions or the redemption of fund shares. How a fund did yesterday is no guarantee of how it will do tomorrow. Returns may reflect the conversion of Class B shares to Class A shares after a maximum of seven years.
Average Annual Total Returns
Periods ended October 31, 2003 | | Past 1
year | Past 5
years | Life of
fund A |
Class A (incl. 5.75% sales charge) B | | 15.29% | 17.85% | -2.65% |
Class T (incl. 3.50% sales charge) C | | 17.65% | 18.17% | -2.51% |
Class B (incl. contingent deferred sales charge) D | | 16.40% | 18.42% | -2.30% |
Class C (incl. contingent deferred sales charge) E | | 20.37% | 18.64% | -2.29% |
A From October 31, 1994.
B Class A's 12b-1 fee may have ranged over time between 0.25% and 0.35%, as an equivalent amount of brokerage commissions of up to 0.10% of the class's average net assets may have been used to promote the sale of class shares. This practice has been discontinued and no commissions incurred after June 30, 2003 have been used to pay distribution expenses. Class A's 12b-1 plan currently authorizes a 0.25% 12b-1 fee. The initial offering of Class A shares took place on July 3, 2000. Returns between October 31, 1994 and June 30, 2000 are those of Fidelity Advisor Korea Fund, Inc., (the Closed-End Fund). On June 30, 2000, the Closed-End Fund reorganized as an open-end fund through a transfer of all its assets and liabilities to Fidelity Advisor Korea Fund (the fund). Shareholders of the Closed-End Fund received Class A shares of the fund in exchange for their shares of the Closed-End Fund. If Class A shares' total expenses had been reflected in the Closed-End Fund's performance, Class A's returns prior to July 3, 2000 may have been lower.
C Class T's 12b-1 fee may have ranged over time between 0.50% and 0.60%, as an equivalent amount of brokerage commissions of up to 0.10% of the class's average net assets may have been used to promote the sale of class shares. This practice has been discontinued and no commissions incurred after June 30, 2003 have been used to pay distribution expenses. Class T's 12b-1 plan currently authorizes a 0.50% 12b-1 fee. The initial offering of Class T shares took place on July 3, 2000. Returns between October 31, 1994 and June 30, 2000 are those of Fidelity Advisor Korea Fund, Inc., (the Closed-End Fund). On June 30, 2000, the Closed-End Fund reorganized as an open-end fund through a transfer of all of its assets and liabilities to the fund. Shareholders of the Closed-End Fund received Class A shares of the fund in exchange for their shares of the Closed-End Fund. If Class T shares' total expenses had been reflected in the Closed-End Fund's performance, Class T's returns prior to July 3, 2000 may have been lower.
Annual Report
D Class B shares bear a 1.00% 12b-1 fee that is reflected in returns after June 30, 2000. The initial offering of Class B shares took place on July 3, 2000. Returns between October 31, 1994 and June 30, 2000 are those of Fidelity Advisor Korea Fund, Inc., (the Closed-End Fund). On June 30, 2000, the Closed-End Fund reorganized as an open-end fund through a transfer of all of its assets and liabilities to the fund. Shareholders of the Closed-End Fund received Class A shares of the fund in exchange for their shares of the Closed-End Fund. If Class B shares' total expenses, including its 1.00% 12b-1 fee, had been reflected in the Closed-End Fund's performance, Class B's returns, prior to July 3, 2000 may have been lower. Class B shares' contingent deferred sales charges included in the past one year, past five year, and life of fund total return figures are 5%, 2%, and 0%, respectively.
E Class C shares bear a 1.00% 12b-1 fee that is reflected in returns after June 30, 2000. The initial offering of Class C shares took place on July 3, 2000. Returns between October 31, 1994 and June 30, 2000 are those of Fidelity Advisor Korea Fund, Inc., (the Closed-End Fund). On June 30, 2000, the Closed-End Fund reorganized as an open-end fund through a transfer of all of its assets and liabilities to the fund. Shareholders of the Closed-End Fund received Class A shares of the fund in exchange for their shares of the Closed-End Fund. If Class C shares' total expenses, including its 1.00% 12b-1 fee, had been reflected in the Closed-End Fund's performance, Class C's returns, prior to July 3, 2000 may have been lower. Class C shares' contingent deferred sales charge included in the past one year, past five year, and life of fund total return figures are 1%, 0%, and 0%, respectively.
$10,000 Over Life of Fund
Let's say hypothetically that $10,000 was invested in Fidelity Advisor Korea Fund - Class T on October 31, 1994, when the Closed-End Fund started, and the current 3.50% sales charge was paid. The chart shows how the value of your investment would have grown, and also shows how the Korea Composite Stock Price Index did over the same period.
Annual Report
Management's Discussion of Fund Performance
Comments from Agus Tandiono, Portfolio Manager of Fidelity® Advisor Korea Fund
Mirroring the U.S. rally, South Korea's Korea Composite Stock Price Index (KOSPI) rebounded sharply during the 12-month period ending October 31, 2003, returning 22.28%. The first half of the period was volatile, with weak domestic spending, concerns about North Korea's nuclear program, the Iraqi war and the discovery of accounting fraud at SK Global all weighing on share prices and driving the KOSPI down to a low of approximately 515 in March. By comparison, the second half of the period was relatively placid. A swift end to the regime of Saddam Hussein appeared to curb North Korea's belligerence, while worries about the accounting scandal faded. At the same time, South Korea's new president lowered interest rates and boosted the supplementary budget to stimulate the economy, while exports improved due to strengthening economies abroad, especially China. As a result, South Korean stocks began a sustained rally in mid-March that carried the index near the 800 level by the end of the period.
For the 12 months ending October 31, 2003, the fund's Class A, Class T, Class B and Class C shares performed about in line with the KOSPI, returning 22.32%, 21.91%, 21.40% and 21.37%, respectively. Meanwhile, the LipperSM Pacific Region ex Japan Funds Average posted a 37.16% return. Investor concerns about North Korea and SK Global primarily affected South Korean stocks, resulting in the fund's underperformance versus the Lipper average. Responding to improving conditions in the first half of the period, I gave the fund an overweighting in technology and increased its exposure to the banking industry. The fund's top contributor in absolute terms was Samsung Electronics, as rising prices for DRAM computer memory aided the stock. Also contributing to performance was Shinhan Financial Group, which became the country's second-largest bank as a result of acquiring Chohung Bank. SK Telecom was the fund's largest detractor, with most of the damage occurring in the first half of the period. The fund also was hurt by its position in Samsung Electro-Mechanics, which manufactures resistors. The stock fell in part because a price war with Japanese competitors dented profits.
The views expressed in this statement reflect those of the portfolio manager only through the end of the period of the report as stated on the cover and do not necessarily represent the views of Fidelity or any other person in the Fidelity organization. Any such views are subject to change at any time based upon market or other conditions and Fidelity disclaims any responsibility to update such views. These views may not be relied on as investment advice and, because investment decisions for a Fidelity fund are based on numerous factors, may not be relied on as an indication of trading intent on behalf of any Fidelity fund.
Annual Report
Investment Changes
Top Ten Stocks as of October 31, 2003 |
| % of fund's
net assets | % of fund's net assets
6 months ago |
Samsung Electronics Co. Ltd. | 23.9 | 21.4 |
Kookmin Bank | 8.6 | 8.2 |
SK Telecom Co. Ltd. | 8.3 | 4.3 |
Shinhan Financial Group Co. Ltd. | 5.6 | 4.5 |
Hyundai Motor Co. Ltd. | 4.4 | 4.2 |
KH Vatec Co. Ltd. | 3.1 | 2.0 |
POSCO | 3.0 | 3.5 |
Korea Electric Power Corp. | 2.5 | 3.4 |
Hana Bank | 2.3 | 0.5 |
Hyundai Mobis | 2.3 | 0.0 |
| 64.0 | |
Market Sectors as of October 31, 2003 |
| % of fund's
net assets | % of fund's net assets
6 months ago |
Information Technology | 34.7 | 30.4 |
Financials | 21.3 | 22.3 |
Consumer Discretionary | 14.7 | 17.6 |
Telecommunication Services | 9.9 | 10.6 |
Materials | 7.4 | 5.1 |
Consumer Staples | 4.6 | 5.5 |
Industrials | 3.6 | 1.5 |
Utilities | 2.5 | 3.4 |
Energy | 0.0 | 1.3 |
Asset Allocation (% of fund's net assets) |
As of October 31, 2003 | As of April 30, 2003 |
| Stocks 98.7% | | | Stocks 97.7% | |
| Short-Term
Investments and
Net Other Assets 1.3% | | | Short-Term
Investments and
Net Other Assets 2.3% | |

Annual Report
Investments October 31, 2003
Showing Percentage of Net Assets
Common Stocks - 98.7% |
| Shares | | Value (Note 1) |
CONSUMER DISCRETIONARY - 14.7% |
Auto Components - 2.3% |
Hyundai Mobis | 9,000 | | $ 347,528 |
Automobiles - 4.4% |
Hyundai Motor Co. Ltd. | 20,000 | | 666,666 |
Hotels, Restaurants & Leisure - 1.2% |
Kangwon Land, Inc. | 1,500 | | 189,480 |
Internet & Catalog Retail - 1.9% |
CJ Home Shopping | 4,000 | | 152,091 |
LG Home Shopping, Inc. | 2,800 | | 136,510 |
| | 288,601 |
Media - 2.5% |
Cheil Communications, Inc. | 1,800 | | 220,532 |
Plenus Entertainment, Inc. | 8,000 | | 161,555 |
| | 382,087 |
Multiline Retail - 2.0% |
Shinsegae Co. Ltd. | 1,500 | | 301,014 |
Textiles Apparel & Luxury Goods - 0.4% |
Handsome Co. Ltd. | 10,000 | | 69,624 |
TOTAL CONSUMER DISCRETIONARY | | 2,245,000 |
CONSUMER STAPLES - 4.6% |
Beverages - 1.3% |
Lotte Chilsung Beverage Co. Ltd. | 380 | | 192,649 |
Food & Staples Retailing - 1.8% |
Pulmuone Co. Ltd. | 6,000 | | 272,750 |
Food Products - 1.5% |
Nong Shim Co. Ltd. | 1,596 | | 233,298 |
TOTAL CONSUMER STAPLES | | 698,697 |
FINANCIALS - 21.3% |
Capital Markets - 1.2% |
Good Morning Shinhan Securities Co. (a) | 20,000 | | 82,805 |
LG Investment & Securities Co. Ltd. | 12,000 | | 105,957 |
| | 188,762 |
Commercial Banks - 17.0% |
Hana Bank | 20,000 | | 348,120 |
Kookmin Bank | 36,000 | | 1,314,068 |
Common Stocks - continued |
| Shares | | Value (Note 1) |
FINANCIALS - continued |
Commercial Banks - continued |
Korea Exchange Bank (a) | 20,000 | | $ 82,383 |
Shinhan Financial Group Co. Ltd. | 60,000 | | 861,850 |
| | 2,606,421 |
Consumer Finance - 0.7% |
LG Card Co. Ltd. | 10,000 | | 101,817 |
Diversified Financial Services - 0.5% |
Korea Exchange Bank Cred Service Co. Ltd. (a) | 15,000 | | 84,791 |
Insurance - 1.9% |
Samsung Fire & Marine Insurance Co. Ltd. | 5,000 | | 285,593 |
TOTAL FINANCIALS | | 3,267,384 |
INDUSTRIALS - 3.6% |
Airlines - 1.9% |
Korean Air Co. Ltd. | 22,000 | | 293,705 |
Industrial Conglomerates - 1.7% |
LG Chemical Investment Ltd. | 30,000 | | 252,218 |
TOTAL INDUSTRIALS | | 545,923 |
INFORMATION TECHNOLOGY - 34.7% |
Electronic Equipment & Instruments - 8.8% |
Dae Duck Electronics Co. Ltd. | 30,000 | | 276,299 |
Hankuk Electric Glass Co. Ltd. | 3,500 | | 214,406 |
KH Vatec Co. Ltd. | 10,160 | | 484,177 |
Samsung Electro-Mechanics Co. Ltd. | 8,000 | | 271,060 |
Samsung SDI Co. Ltd. | 1,000 | | 103,084 |
| | 1,349,026 |
Semiconductors & Semiconductor Equipment - 23.9% |
Samsung Electronics Co. Ltd. | 9,200 | | 3,653,569 |
Software - 2.0% |
NCsoft Corp. (a) | 5,700 | | 303,422 |
TOTAL INFORMATION TECHNOLOGY | | 5,306,017 |
MATERIALS - 7.4% |
Chemicals - 3.8% |
Hanwha Chemical Corp. (a) | 20,000 | | 138,910 |
Common Stocks - continued |
| Shares | | Value (Note 1) |
MATERIALS - continued |
Chemicals - continued |
Honam Petrochemical Corp. | 8,000 | | $ 320,405 |
LG Chemical Ltd. | 3,000 | | 120,406 |
| | 579,721 |
Construction Materials - 0.6% |
Hanil Cement Co. Ltd. | 2,000 | | 91,593 |
Metals & Mining - 3.0% |
POSCO | 4,000 | | 463,680 |
TOTAL MATERIALS | | 1,134,994 |
TELECOMMUNICATION SERVICES - 9.9% |
Diversified Telecommunication Services - 1.6% |
KT Corp. | 6,000 | | 238,783 |
Wireless Telecommunication Services - 8.3% |
SK Telecom Co. Ltd. | 7,200 | | 1,271,482 |
TOTAL TELECOMMUNICATION SERVICES | | 1,510,265 |
UTILITIES - 2.5% |
Electric Utilities - 2.5% |
Korea Electric Power Corp. | 20,000 | | 386,143 |
TOTAL COMMON STOCKS (Cost $9,549,688) | 15,094,423 |
Nonconvertible Bonds - 0.0% |
| Principal Amount | | |
FINANCIALS - 0.0% |
Commercial Banks - 0.0% |
Shinhan Bank 0% 12/2/48 | KRW | 64,930,000 | | 104 |
TOTAL NONCONVERTIBLE BONDS (Cost $5,382) | 104 |
Money Market Funds - 3.2% |
| Shares | | Value (Note 1) |
Fidelity Cash Central Fund, 1.07% (b)
(Cost $496,078) | 496,078 | | $ 496,078 |
TOTAL INVESTMENT PORTFOLIO - 101.9% (Cost $10,051,148) | | 15,590,605 |
NET OTHER ASSETS - (1.9)% | | (296,857) |
NET ASSETS - 100% | $ 15,293,748 |
Currency Abbreviations |
KRW | - | Korean won |
Legend |
(a) Non-income producing |
(b) The rate quoted is the annualized seven-day yield of the fund at period end. A complete listing of the fund's holdings as of its most recent fiscal year end is available upon request. |
Other Information |
Purchases and sales of securities, other than short-term securities, aggregated $18,494,494 and $24,366,662, respectively. |
The fund placed a portion of its portfolio transactions with brokerage firms which are affiliates of the investment adviser. The commissions paid to these affiliated firms were $47 for the period. |
Income Tax Information |
At October 31, 2003, the fund had a capital loss carryforward of approximately $13,718,000 of which $89,000, $12,115,000 and $1,514,000 will expire on October 31, 2005, 2006 and 2009, respectively. |
See accompanying notes which are an integral part of the financial statements.
Annual Report
Financial Statements
Statement of Assets and Liabilities
| October 31, 2003 |
| | |
Assets | | |
Investment in securities, at value (cost $10,051,148) - See accompanying schedule | | $ 15,590,605 |
Receivable for investments sold | | 118,155 |
Receivable for fund shares sold | | 85,197 |
Dividends receivable | | 7,937 |
Interest receivable | | 189 |
Prepaid expenses | | 77 |
Receivable from investment adviser for expense reductions | | 8,533 |
Total assets | | 15,810,693 |
| | |
Liabilities | | |
Payable for investments purchased | $ 364,985 | |
Payable for fund shares redeemed | 66,394 | |
Accrued management fee | 10,474 | |
Distribution fees payable | 4,402 | |
Other payables and accrued expenses | 70,690 | |
Total liabilities | | 516,945 |
| | |
Net Assets | | $ 15,293,748 |
Net Assets consist of: | | |
Paid in capital | | $ 23,521,362 |
Undistributed net investment income | | 2,115 |
Accumulated undistributed net realized gain (loss) on investments and foreign currency transactions | | (13,761,921) |
Net unrealized appreciation (depreciation) on investments and assets and liabilities in foreign currencies | | 5,532,192 |
Net Assets | | $ 15,293,748 |
See accompanying notes which are an integral part of the financial statements.
Annual Report
Financial Statements - continued
Statement of Assets and Liabilities - continued
| October 31, 2003 |
| | |
Calculation of Maximum Offering Price
Class A:
Net Asset Value and redemption price per share ($12,187,098 ÷ 1,101,069 shares) | | $ 11.07 |
| | |
Maximum offering price per share (100/94.25 of $11.07) | | $ 11.75 |
Class T:
Net Asset Value and redemption price per share ($1,222,933 ÷ 111,554 shares) | | $ 10.96 |
| | |
Maximum offering price per share (100/96.50 of $10.96) | | $ 11.36 |
Class B:
Net Asset Value and offering price per share ($1,175,098 ÷ 109,032 shares) A | | $ 10.78 |
| | |
Class C:
Net Asset Value and offering price per share ($531,304 ÷ 49,250 shares) A | | $ 10.79 |
| | |
| | |
Institutional Class:
Net Asset Value, offering price and redemption price per share ($177,315 ÷ 15,883 shares) | | $ 11.16 |
A Redemption price per share is equal to net asset value less any applicable contingent deferred sales charge.
See accompanying notes which are an integral part of the financial statements.
Annual Report
Statement of Operations
| Year ended October 31, 2003 |
| | |
Investment Income | | |
Dividends | | $ 371,744 |
Interest | | 4,536 |
| | 376,280 |
Less foreign taxes withheld | | (61,351) |
Total income | | 314,929 |
| | |
Expenses | | |
Management fee | $ 123,517 | |
Transfer agent fees | 68,470 | |
Distribution fees | 51,500 | |
Accounting fees and expenses | 61,565 | |
Non-interested trustees' compensation | 62 | |
Custodian fees and expenses | 34,204 | |
Registration fees | 48,991 | |
Audit | 66,904 | |
Legal | 875 | |
Miscellaneous | 147 | |
Total expenses before reductions | 456,235 | |
Expense reductions | (145,184) | 311,051 |
Net investment income (loss) | | 3,878 |
Realized and Unrealized Gain (Loss) Net realized gain (loss) on: | | |
Investment securities | 3,611,178 | |
Foreign currency transactions | (93,543) | |
Total net realized gain (loss) | | 3,517,635 |
Change in net unrealized appreciation (depreciation) on: Investment securities | (747,728) | |
Assets and liabilities in foreign currencies | (8,204) | |
Total change in net unrealized appreciation (depreciation) | | (755,932) |
Net gain (loss) | | 2,761,703 |
Net increase (decrease) in net assets resulting from operations | | $ 2,765,581 |
See accompanying notes which are an integral part of the financial statements.
Annual Report
Financial Statements - continued
Statement of Changes in Net Assets
| Year ended
October 31,
2003 | Year ended
October 31,
2002 |
Increase (Decrease) in Net Assets | | |
Operations | | |
Net investment income (loss) | $ 3,878 | $ (248,639) |
Net realized gain (loss) | 3,517,635 | 4,062,190 |
Change in net unrealized appreciation (depreciation) | (755,932) | 577,380 |
Net increase (decrease) in net assets resulting
from operations | 2,765,581 | 4,390,931 |
Share transactions - net increase (decrease) | (6,380,457) | 1,965,578 |
Total increase (decrease) in net assets | (3,614,876) | 6,356,509 |
| | |
Net Assets | | |
Beginning of period | 18,908,624 | 12,552,115 |
End of period (including undistributed net investment income of $2,115 and undistributed net investment income of $1,030, respectively) | $ 15,293,748 | $ 18,908,624 |
See accompanying notes which are an integral part of the financial statements.
Annual Report
Financial Highlights - Class A
Years ended October 31, | 2003 | 2002 | 2001 | 2000 K | 2000 G, J | 1999 J |
Selected Per-Share Data | | | | | |
Net asset value, beginning of period | $ 9.05 | $ 6.70 | $ 7.38 | $ 8.99 | $ 10.78 | $ 3.67 |
Income from Investment Operations | | | | | | |
Net investment income (loss) E | .01 | (.11) | -L | (.01) | (.09) | (.04) |
Net realized and unrealized gain (loss) | 2.01 | 2.46 | (.69) | (1.62) | (1.97) | 7.15 |
Total from investment operations | 2.02 | 2.35 | (.69) | (1.63) | (2.06) | 7.11 |
Redemption fees added to paid in capital E | - | - | .01 | .02 | .27 | - |
Net asset value, end of period | $ 11.07 | $ 9.05 | $ 6.70 | $ 7.38 | $ 8.99 | $ 10.78 I |
Total Return B, C, D | 22.32% | 35.07% | (9.21)% | (17.91)% | (16.60)% | 193.73% |
Ratios to Average Net Assets F | | | | | |
Expenses before expense reductions | 2.85% | 2.48% | 3.31% | 2.31% A | 1.97% | 1.75% |
Expenses net of voluntary waivers, if any | 2.00% | 2.08% | 2.10% | 2.10% A | 1.91% | 1.75% |
Expenses net of all
reductions | 2.00% | 2.06% | 2.08% | 2.10% A | 1.89% | 1.61% H |
Net investment income (loss) | .12% | (1.10)% | (.04)% | (1.71)% A | (.73)% | (.42)% |
Supplemental Data | | | | | |
Net assets, end of period (000 omitted) | $ 12,187 | $ 11,946 | $ 11,747 | $ 19,279 | $ 25,017 | $ 60,601 |
Portfolio turnover rate | 127% | 60% | 36% | 121% A | 39% | 58% |
A Annualized B Total returns for periods of less than one year are not annualized. C Total returns would have been lower had certain expenses not been reduced during the periods shown. D Total returns do not include the effect of the sales charges. E Calculated based on average shares outstanding during the period. F Expense ratios reflect operating expenses of the class. Expenses before reductions do not reflect amounts reimbursed by the investment adviser or reductions from brokerage service arrangements or other expense offset arrangements and do not represent the amount paid by the class during periods when reimbursements or reductions occur. Expenses net of any voluntary waivers reflect expenses after reimbursement by the investment adviser but prior to reductions from brokerage service arrangements or other expense offset arrangements. Expenses net of all reductions represent the net expenses paid by the class. G Prior to July 3, 2000, the fund operated as a closed-end investment company. Shares of the fund existing at the time of its conversion to an open-ended management company were exchanged for Class A shares. H Includes reimbursement of $.01 per share from the custodian for an adjustment to prior period's fees. I The fund incurred expenses of $.01 per share in connection with its repurchase offer which were offset by redemption fees collected as part of the repurchase offer. J For the year ended September 30. K One month ended October 31. L Amount represents less than $.01 per-share.
See accompanying notes which are an integral part of the financial statements.
Annual Report
Financial Highlights - Class T
Years ended October 31, | 2003 | 2002 | 2001 | 2000I | 2000F |
Selected Per-Share Data | | | | | |
Net asset value, beginning of period | $ 8.99 | $ 6.67 | $ 7.37 | $ 8.99 | $ 12.58 |
Income from Investment Operations | | | | | |
Net investment income (loss)E | (.01) | (.14) | (.02) | (.01) | (.03) |
Net realized and unrealized gain (loss) | 1.98 | 2.46 | (.69) | (1.62)H | (3.87)H |
Total from investment operations | 1.97 | 2.32 | (.71) | (1.63) | (3.90) |
Redemption fees added to paid
in capitalE | - | - | .01 | .01H | .31H |
Net asset value, end of period | $ 10.96 | $ 8.99 | $ 6.67 | $ 7.37 | $ 8.99 |
Total ReturnB,C,D | 21.91% | 34.78% | (9.50)% | (18.02)% | (28.54)% |
Ratios to Average Net AssetsG | | | | |
Expenses before expense
reductions | 3.74% | 3.02% | 4.22% | 2.50%A | 2.55%A |
Expenses net of voluntary
waivers, if any | 2.25% | 2.33% | 2.35% | 2.35%A | 2.35%A |
Expenses net of all reductions | 2.25% | 2.31% | 2.33% | 2.35%A | 2.32%A |
Net investment income (loss) | (.13)% | (1.35)% | (.29)% | (1.96)%A | (1.16)%A |
Supplemental Data | | | | | |
Net assets, end of period
(000 omitted) | $ 1,223 | $ 2,718 | $ 343 | $ 473 | $ 108 |
Portfolio turnover rate | 127% | 60% | 36% | 121%A | 39% |
A Annualized B Total returns for periods of less than one year are not annualized. C Total returns would have been lower had certain expenses not been reduced during the periods shown. D Total returns do not include the effect of the sales charges. E Calculated based on average shares outstanding during the period. F For the period July 3, 2000 (commencement of sale of shares) to September 30, 2000. G Expense ratios reflect operating expenses of the class. Expenses before reductions do not reflect amounts reimbursed by the investment adviser or reductions from brokerage service arrangements or other expense offset arrangements and do not represent the amount paid by the class during periods when reimbursements or reductions occur. Expense ratios before start-up periods may not be representative of longer-term operating periods. Expenses net of any voluntary waivers reflect expenses after reimbursement by the investment adviser but prior to reductions from brokerage service arrangements or other expense offset arrangements. Expenses net of all reductions represent the net expenses paid by the class. HPer share amounts have been reclassified to permit comparison with current year presentation. I One month ended October 31.
See accompanying notes which are an integral part of the financial statements.
Annual Report
Financial Highlights - Class B
Years ended October 31, | 2003 | 2002 | 2001 | 2000I | 2000F |
Selected Per-Share Data | | | | | |
Net asset value, beginning of period | $ 8.88 | $ 6.62 | $ 7.36 | $ 8.98 | $ 12.58 |
Income from Investment Operations | | | | | |
Net investment income (loss)E | (.06) | (.19) | (.05) | (.02) | (.04) |
Net realized and unrealized gain (loss) | 1.96 | 2.45 | (.69) | (1.62)H | (3.89)H |
Total from investment operations | 1.90 | 2.26 | (.74) | (1.64) | (3.93) |
Redemption fees added to paid
in capitalE | - | - | -J | .02H | .33H |
Net asset value, end of period | $ 10.78 | $ 8.88 | $ 6.62 | $ 7.36 | $ 8.98 |
Total ReturnB,C,D | 21.40% | 34.14% | (10.05)% | (18.04)% | (28.62)% |
Ratios to Average Net AssetsG | | | | |
Expenses before expense
reductions | 4.08% | 3.48% | 4.66% | 2.96%A | 3.03%A |
Expenses net of voluntary
waivers, if any | 2.75% | 2.83% | 2.85% | 2.85%A | 2.85%A |
Expenses net of all reductions | 2.75% | 2.81% | 2.83% | 2.85%A | 2.83%A |
Net investment income (loss) | (.63)% | (1.85)% | (.79)% | (2.45)%A | (1.67)%A |
Supplemental Data | | | | | |
Net assets, end of period
(000 omitted) | $ 1,175 | $ 1,313 | $ 282 | $ 83 | $ 80 |
Portfolio turnover rate | 127% | 60% | 36% | 121%A | 39% |
A Annualized B Total returns for periods of less than one year are not annualized. C Total returns would have been lower had certain expenses not been reduced during the periods shown. D Total returns do not include the effect of the contingent deferred sales charge. E Calculated based on average shares outstanding during the period. F For the period July 3, 2000 (commencement of sale of shares) to September 30, 2000. G Expense ratios reflect operating expenses of the class. Expenses before reductions do not reflect amounts reimbursed by the investment adviser or reductions from brokerage service arrangements or other expense offset arrangements and do not represent the amount paid by the class during periods when reimbursements or reductions occur. Expense ratios before start-up periods may not be representative of longer-term operating periods. Expenses net of any voluntary waivers reflect expenses after reimbursement by the investment adviser but prior to reductions from brokerage service arrangements or other expense offset arrangements. Expenses net of all reductions represent the net expenses paid by the class. HPer share amounts have been reclassified to permit comparison with current year presentation. I One month ended October 31. JAmount represents less than $.01 per-share.
See accompanying notes which are an integral part of the financial statements.
Annual Report
Financial Highlights - Class C
Years ended October 31, | 2003 | 2002 | 2001 | 2000I | 2000F |
Selected Per-Share Data | | | | | |
Net asset value, beginning of period | $ 8.89 | $ 6.62 | $ 7.36 | $ 8.98 | $ 12.58 |
Income from Investment Operations | | | | | |
Net investment income (loss)E | (.06) | (.19) | (.06) | (.02) | (.04) |
Net realized and unrealized gain (loss) | 1.96 | 2.46 | (.69) | (1.62)H | (3.89)H |
Total from investment operations | 1.90 | 2.27 | (.75) | (1.64) | (3.93) |
Redemption fees added to paid
in capitalE | - | - | .01 | .02H | .33H |
Net asset value, end of period | $ 10.79 | $ 8.89 | $ 6.62 | $ 7.36 | $ 8.98 |
Total ReturnB,C,D | 21.37% | 34.29% | (10.05)% | (18.04)% | (28.62)% |
Ratios to Average Net AssetsG | | | | |
Expenses before expense
reductions | 3.82% | 3.35% | 4.41% | 2.91%A | 3.01%A |
Expenses net of voluntary waivers, if any | 2.75% | 2.83% | 2.85% | 2.85%A | 2.85%A |
Expenses net of all reductions | 2.75% | 2.81% | 2.83% | 2.85%A | 2.82%A |
Net investment income (loss) | (.63)% | (1.85)% | (.79)% | (2.46)%A | (1.66)%A |
Supplemental Data | | | | | |
Net assets, end of period
(000 omitted) | $ 531 | $ 804 | $ 127 | $ 82 | $ 90 |
Portfolio turnover rate | 127% | 60% | 36% | 121%A | 39% |
A Annualized B Total returns for periods of less than one year are not annualized. C Total returns would have been lower had certain expenses not been reduced during the periods shown. D Total returns do not include the effect of the contingent deferred sales charge. E Calculated based on average shares outstanding during the period. F For the period July 3, 2000 (commencement of sale of shares) to September 30, 2000. G Expense ratios reflect operating expenses of the class. Expenses before reductions do not reflect amounts reimbursed by the investment adviser or reductions from brokerage service arrangements or other expense offset arrangements and do not represent the amount paid by the class during periods when reimbursements or reductions occur. Expense ratios before start-up periods may not be representative of longer-term operating periods. Expenses net of any voluntary waivers reflect expenses after reimbursement by the investment adviser but prior to reductions from brokerage service arrangements or other expense offset arrangements. Expenses net of all reductions represent the net expenses paid by the class. HPer share amounts have been reclassified to permit comparison with current year presentation. I One month ended October 31.
See accompanying notes which are an integral part of the financial statements.
Annual Report
Financial Highlights - Institutional Class
Years ended October 31, | 2003 | 2002 | 2001 | 2000H | 2000E |
Selected Per-Share Data | | | | | |
Net asset value, beginning of period | $ 9.11 | $ 6.72 | $ 7.39 | $ 8.99 | $ 12.58 |
Income from Investment Operations | | | | | |
Net investment income (loss)D | .04 | (.08) | .01 | (.01) | (.01) |
Net realized and unrealized gain (loss) | 2.01 | 2.47 | (.69) | (1.63)G | (3.67)G |
Total from investment operations | 2.05 | 2.39 | (.68) | (1.64) | (3.68) |
Redemption fees added to paid in capitalD | - | - | .01 | .04G | .09G |
Net asset value, end of period | $ 11.16 | $ 9.11 | $ 6.72 | $ 7.39 | $ 8.99 |
Total ReturnB,C | 22.50% | 35.57% | (9.07)% | (17.80)% | (28.54)% |
Ratios to Average Net AssetsF | | | | |
Expenses before expense
reductions | 3.11% | 2.22% | 3.08% | 1.77%A | 2.54%A |
Expenses net of voluntary
waivers, if any | 1.75% | 1.81% | 1.85% | 1.77%A | 1.85%A |
Expenses net of all reductions | 1.75% | 1.80% | 1.83% | 1.77%A | 1.84%A |
Net investment income (loss) | .38% | (.84)% | .21% | (1.38)%A | (.68)%A |
Supplemental Data | | | | | |
Net assets, end of period
(000 omitted) | $ 177 | $ 2,127 | $ 53 | $ 59 | $ 71 |
Portfolio turnover rate | 127% | 60% | 36% | 121%A | 39% |
A Annualized B Total returns for periods of less than one year are not annualized. C Total returns would have been lower had certain expenses not been reduced during the periods shown. D Calculated based on average shares outstanding during the period. E For the period July 3, 2000 (commencement of sale of shares) to September 30, 2000. F Expense ratios reflect operating expenses of the class. Expenses before reductions do not reflect amounts reimbursed by the investment adviser or reductions from brokerage service arrangements or other expense offset arrangements and do not represent the amount paid by the class during periods when reimbursements or reductions occur. Expense ratios before start-up periods may not be representative of longer-term operating periods. Expenses net of any voluntary waivers reflect expenses after reimbursement by the investment adviser but prior to reductions from brokerage service arrangements or other expense offset arrangements. Expenses net of all reductions represent the net expenses paid by the class. GPer share amounts have been reclassified to permit comparison with current year presentation. H One month ended October 31.
See accompanying notes which are an integral part of the financial statements.
Annual Report
Notes to Financial Statements
For the period ended October 31, 2003
1. Significant Accounting Policies.
Fidelity Advisor Korea Fund (the fund) is a fund of Fidelity Advisor Series VIII (the trust) and is authorized to issue an unlimited number of shares. The trust is registered under the Investment Company Act of 1940, as amended (the 1940 Act), as an open-end management investment company organized as a Massachusetts business trust.
The fund offers Class A, Class T, Class B, Class C and Institutional Class shares, each of which has equal rights as to assets and voting privileges. Each class has exclusive voting rights with respect to matters that affect that class. Class B shares will automatically convert to Class A shares after a holding period of seven years from the initial date of purchase. Investment income, realized and unrealized capital gains and losses, the common expenses of the fund, and certain fund-level expense reductions, if any, are allocated on a pro rata basis to each class based on the relative net assets of each class to the total net assets of the fund. Each class differs with respect to transfer agent and distribution and service plan fees incurred. Certain expense reductions also differ by class.
The fund's investments in emerging markets can be subject to social, economic, regulatory, and political uncertainties and can be extremely volatile.
The financial statements have been prepared in conformity with accounting principles generally accepted in the United States of America, which require management to make certain estimates and assumptions at the date of the financial statements. The following summarizes the significant accounting policies of the fund:
Security Valuation. Net asset value per share (NAV calculation) is calculated as of the close of business of the New York Stock Exchange, normally 4:00 p.m. Eastern time. Equity securities for which market quotations are available are valued at the last sale price or official closing price (closing bid price or last evaluated quote if no sale has occurred) on the primary market or exchange on which they trade. Debt securities for which quotations are readily available are valued at their most recent bid prices (sales prices if the principal market is an exchange) in the principal market in which such securities are normally traded, as determined by recognized dealers in such securities, or securities are valued on the basis of information provided by a pricing service. Pricing services use valuation matrices that incorporate both dealer-supplied valuations and valuation models. If an event that is expected to materially affect the value of a security occurs after the close of an exchange or market on which that security trades, but prior to the NAV calculation, then that security will be fair valued taking the event into account. Securities (including restricted securities) for which market quotations are not readily available are valued at their fair value as determined in good faith under consistently applied procedures under the general supervision of the Board of Trustees. Price movements in futures contracts and ADRs, market and trading trends, the bid/ask quotes of brokers and off-exchange institutional trading may be reviewed in the course of making a good faith determination of a security's fair value. Short-term securities with
Annual Report
Notes to Financial Statements - continued
1. Significant Accounting Policies - continued
Annual Report
Security Valuation - continued
remaining maturities of sixty days or less for which quotations are not readily available are valued on the basis of amortized cost. Investments in open-end investment companies are valued at their net asset value each business day.
Foreign Currency. The fund uses foreign currency contracts to facilitate transactions in foreign-denominated securities. Losses from these transactions may arise from changes in the value of the foreign currency or if the counterparties do not perform under the contracts' terms.
Foreign denominated assets, including investment securities, and liabilities are translated into U.S. dollars at the exchange rate at period end. Purchases and sales of investment securities, income and dividends received and expenses denominated in foreign currencies are translated into U.S. dollars at the exchange rate in effect on the transaction date.
The effects of exchange rate fluctuations on investments are included with the net realized and unrealized gain (loss) on investment securities. Other foreign currency transactions resulting in realized and unrealized gain (loss) are disclosed separately.
Investment Transactions and Income. Security transactions are accounted for as of trade date. Gains and losses on securities sold are determined on the basis of identified cost. Dividend income is recorded on the ex-dividend date, except for certain dividends from foreign securities where the ex-dividend date may have passed, which are recorded as soon as the fund is informed of the ex-dividend date. Non-cash dividends included in dividend income, if any, are recorded at the fair market value of the securities received. Interest income is accrued as earned. Interest income includes coupon interest and amortization of premium and accretion of discount on debt securities, which is accrued using the interest method. Investment income is recorded net of foreign taxes withheld where recovery of such taxes is uncertain.
Expenses. Most expenses of the trust can be directly attributed to a fund. Expenses which cannot be directly attributed are apportioned among the funds in the trust.
Income Tax Information and Distributions to Shareholders. Each year the fund intends to qualify as a regulated investment company by distributing all of its taxable income and realized gains under Subchapter M of the Internal Revenue Code. As a result, no provision for income taxes is required in the accompanying financial statements. Foreign taxes are provided for based on each fund's understanding of the tax rules and rates that exist in the foreign markets in which it invests. Income dividends and capital gain distributions are declared separately for each class. Distributions are recorded on the ex-dividend date.
Annual Report
Notes to Financial Statements - continued
1. Significant Accounting Policies - continued
Income Tax Information and Distributions to Shareholders - continued
Income and capital gain distributions are determined in accordance with income tax regulations, which may differ from generally accepted accounting principles. Capital accounts within the financial statements are adjusted for permanent and temporary book and tax differences. These adjustments have no impact on net assets or the results of operations. Temporary differences will reverse in a subsequent period. These differences are primarily due to foreign currency transactions, passive foreign investment companies (PFIC), net operating losses, capital loss carryforwards and losses deferred due to wash sales.
The tax-basis components of distributable earnings and the federal tax cost as of period end were as follows:
Unrealized appreciation | $ 5,837,134 | | |
Unrealized depreciation | (347,049) | |
Net unrealized appreciation (depreciation) | 5,490,085 | |
Capital loss carryforward | (13,717,699) | |
| | |
Cost for federal income tax purposes | $ 10,100,520 | |
Short-Term Trading (Redemption) Fees. Shares purchased after March 31, 2004 and held in the fund less than 90 days will be subject to a short-term trading fee equal to 1.50% of the proceeds of the redeemed shares. The fee, which will be retained by the fund, is accounted for as an addition to paid in capital.
2. Operating Policies.
Repurchase Agreements. Fidelity Management & Research Company (FMR) has received an Exemptive Order from the Securities and Exchange Commission (the SEC) which permits the fund and other affiliated entities of FMR to transfer uninvested cash balances into joint trading accounts. These accounts are then invested in repurchase agreements that are collateralized by U.S. Treasury or Government obligations. The fund may also invest directly with institutions, in repurchase agreements that are collateralized by commercial paper obligations and corporate obligations. Collateral is held in segregated accounts with custodian banks and may be obtained in the event of a default of the counterparty. Collateral is marked-to-market daily and maintained at a value at least equal to the principal amount of the repurchase agreement (including accrued interest).
Annual Report
3. Purchases and Sales of Investments.
Information regarding purchases and sales of securities is included under the caption "Other Information" at the end of the fund's Schedule of Investments.
4. Fees and Other Transactions with Affiliates.
Management Fee. FMR and its affiliates provide the fund with investment management related services for which the fund pays a monthly management fee. The management fee is the sum of an individual fund fee rate that is based on an annual rate of .55% of the fund's average net assets and a group fee rate that averaged .28% during the period. The group fee rate is based upon the average net assets of all the mutual funds advised by FMR. The group fee rate decreases as assets under management increase and increases as assets under management decrease. For the period, the total annual management fee rate was .83% of the fund's average net assets.
Distribution and Service Plan. In accordance with Rule 12b-1 of the 1940 Act, the Fund has adopted separate Distribution and Service Plans for each class of shares. Certain classes pay Fidelity Distributors Corporation (FDC), an affiliate of FMR, separate Distribution and Service Fees, each of which is based on an annual percentage of each class' average net assets. Class A and Class T Plans also authorize the use of brokerage commissions to pay distribution expenses. This practice has been discontinued and no commissions incurred after June 30, 2003 have been used to pay distribution expenses. In addition, FDC may pay financial intermediaries for selling shares of the fund and providing shareholder support services. For the period, the Distribution and Service Fee rates, the total amounts paid to and retained by FDC and the amount of distribution expenses paid with brokerage commissions were as follows:
| Distribution
Fee | Service
Fee | Paid to
FDC | Retained
by FDC | Paid with
Commissions |
Class A | - | .25% | $ 27,617 | $ 8,896 | $ - |
Class T | .25% | .25% | 6,833 | 49 | - |
Class B | .75% | .25% | 11,052 | 8,305 | - |
Class C | .75% | .25% | 5,998 | 2,894 | - |
| | | $ 51,500 | $ 20,144 | $ - |
Sales Load. FDC receives a front-end sales charge of up to 5.75% for selling Class A shares, and 3.50% for selling Class T shares of the fund. FDC receives the proceeds of contingent deferred sales charges levied on Class A, Class T, Class B, and Class C redemptions. These charges depend on the holding period. The deferred sales charges range from 5% to 1% for Class B, 1% for Class C, and .25% for certain purchases of Class A and Class T shares.
Annual Report
Notes to Financial Statements - continued
4. Fees and Other Transactions with Affiliates - continued
Sales Load - continued
For the period, sales charge amounts retained by FDC were as follows:
| Retained
by FDC | |
Class A | $ 3,163 | |
Class T | 919 | |
Class B* | 7,246 | |
Class C* | 3,322 | |
| $ 14,650 | |
* When Class B and Class C shares are initially sold, FDC pays commissions from its own resources to financial intermediaries through
which the sales are made.
Transfer Agent Fees. Fidelity Investments Institutional Operations Company, Inc. (FIIOC), an affiliate of FMR, is the transfer, dividend disbursing and shareholder servicing agent (collectively referred to as the transfer agent) for each class of the fund. FIIOC receives account fees and asset-based fees that vary according to the account size and type of account of the shareholders of the respective classes of the fund. FIIOC pays for typesetting, printing and mailing of all shareholder reports, except proxy statements. For the period, the following amounts were paid to FIIOC:
| Amount | % of
Average
Net Assets |
Class A | $ 36,980 | .33 |
Class T | 13,247 | .97 |
Class B | 8,955 | .81 |
Class C | 3,317 | .55 |
Institutional Class | 5,971 | .84 |
| $ 68,470 | |
Accounting Fees. Fidelity Service Company, Inc. (FSC), an affiliate of FMR, maintains the fund's accounting records. The fee is based on the level of average net assets for the month plus out-of-pocket expenses.
Central Funds. The fund may invest in affiliated Central Funds managed by Fidelity Investments Money Management, Inc. (FIMM), an affiliate of FMR. The Central Funds are open-end investment companies available only to investment companies and other accounts managed by FMR and its affiliates. The Central Funds seek preservation of capital and current income and do not pay a management fee. Income distributions earned by the fund are recorded as income in the accompanying financial statements and totaled $3,348 for the period.
Annual Report
4. Fees and Other Transactions with Affiliates - continued
Brokerage Commissions. The fund placed a portion of its portfolio transactions with brokerage firms which are affiliates of the investment adviser. The commissions paid to these affiliated firms are shown under the caption "Other Information" at the end of the fund's Schedule of Investments.
5. Committed Line of Credit.
The fund participates with other funds managed by FMR in a $3.5 billion credit facility (the "line of credit") to be utilized for temporary or emergency purposes to fund shareholder redemptions or for other short-term liquidity purposes. The fund has agreed to pay commitment fees on its pro rata portion of the line of credit. During the period, there were no borrowings on this line of credit.
6. Expense Reductions.
FMR agreed to reimburse the classes of the fund to the extent operating expenses exceeded certain levels of average net assets as noted in the table below. Some expenses, for example interest expense, are excluded from this reimbursement.
| Expense
Limitations | Reimbursement
from adviser |
Class A | 2.00% | $ 94,189 |
Class T | 2.25% | 20,294 |
Class B | 2.75% | 14,627 |
Class C | 2.75% | 6,424 |
Institutional Class | 1.75% | 9,650 |
| | $ 145,184 |
7. Other Information.
At the end of the period, FMR or its affiliates were the owners of record of 22% of the total outstanding shares of the fund and one unaffiliated shareholder was the owner of record of 11% of the total outstanding shares of the fund.
Annual Report
Notes to Financial Statements - continued
8. Share Transactions.
Transactions for each class of shares were as follows:
| Shares | Dollars |
Years ended October 31, | 2003 | 2002 | 2003 | 2002 |
Class A | | | | |
Shares sold | 317,514 | 503,075 | $ 2,906,744 | $ 5,160,102 |
Shares redeemed | (535,903) | (937,603) | (4,813,185) | (9,464,840) |
Net increase (decrease) | (218,389) | (434,528) | $ (1,906,441) | $ (4,304,738) |
Class T | | | | |
Shares sold | 147,380 | 552,081 | $ 1,320,524 | $ 5,487,903 |
Shares redeemed | (338,262) | (301,065) | (3,064,555) | (3,081,636) |
Net increase (decrease) | (190,882) | 251,016 | $ (1,744,031) | $ 2,406,267 |
Class B | | | | |
Shares sold | 79,802 | 214,610 | $ 710,423 | $ 2,265,960 |
Shares redeemed | (118,643) | (109,289) | (1,044,873) | (1,066,238) |
Net increase (decrease) | (38,841) | 105,321 | $ (334,450) | $ 1,199,722 |
Class C | | | | |
Shares sold | 226,057 | 360,034 | $ 1,972,745 | $ 3,540,761 |
Shares redeemed | (267,241) | (288,759) | (2,338,950) | (2,784,028) |
Net increase (decrease) | (41,184) | 71,275 | $ (366,205) | $ 756,733 |
Institutional Class | | | | |
Shares sold | 614,424 | 868,246 | $ 5,805,729 | $ 8,515,527 |
Shares redeemed | (832,130) | (642,607) | (7,835,059) | (6,607,933) |
Net increase (decrease) | (217,706) | 225,639 | $ (2,029,330) | $ 1,907,594 |
Annual Report
Independent Auditors Report
To the Trustees of Fidelity Advisor Series VIII and the Shareholders of Fidelity
Advisor Korea Fund.
In our opinion, the accompanying statement of assets and liabilities, including the schedule of investments, and the related statements of operations and of changes in net assets and the financial highlights present fairly, in all material respects, the financial position of Fidelity Advisor Korea Fund (a fund of Fidelity Advisor Series VIII) at October 31, 2003 and the results of its operations, the changes in its net assets and the financial highlights for the periods indicated, in conformity with accounting principles generally accepted in the United States of America. These financial statements and financial highlights (hereafter referred to as "financial statements") are the responsibility of the Fidelity Advisor Korea Fund's management; our responsibility is to express an opinion on these financial statements based on our audits. We conducted our audits of these financial statements in accordance with auditing standards generally accepted in the United States of America which require that we plan and perform the audit to obtain reasonable assurance about whether the financial statements are free of material misstatement. An audit includes examining, on a test basis, evidence supporting the amounts and disclosures in the financial statements, assessing the accounting principles used and significant estimates made by management, and evaluating the overall financial statement presentation. We believe that our audits, which included confirmation of securities at October 31, 2003 by correspondence with the custodian and brokers, provide a reasonable basis for our opinion.
/s/PricewaterhouseCoopers LLP
PricewaterhouseCoopers LLP
Boston, Massachusetts
December 12, 2003
Annual Report
Trustees and Officers
The Trustees, Members of the Advisory Board, and executive officers of the trust and fund, as applicable, are listed below. The Board of Trustees governs the fund and is responsible for protecting the interests of shareholders. The Trustees are experienced executives who meet periodically throughout the year to oversee the fund's activities, review contractual arrangements with companies that provide services to the fund, and review the fund's performance. Except for William O. McCoy, each of the Trustees oversees 289 funds advised by FMR or an affiliate. Mr. McCoy oversees 291 funds advised by FMR or an affiliate.
The Trustees hold office without limit in time except that (a) any Trustee may resign; (b) any Trustee may be removed by written instrument, signed by at least two-thirds of the number of Trustees prior to such removal; (c) any Trustee who requests to be retired or who has become incapacitated by illness or injury may be retired by written instrument signed by a majority of the other Trustees; and (d) any Trustee may be removed at any special meeting of shareholders by a two-thirds vote of the outstanding voting securities of the trust. In any event, each non-interested Trustee shall retire not later than the last day of the calendar year in which his or her 72nd birthday occurs. The executive officers and Advisory Board Members hold office without limit in time, except that any officer and Advisory Board Member may resign or may be removed by a vote of a majority of the Trustees at any regular meeting or any special meeting of the Trustees. Except as indicated, each individual has held the office shown or other offices in the same company for the past five years.
The fund's Statement of Additional Information (SAI) includes more information about the Trustees. To request a free copy, call Fidelity at 1-877-208-0098.
Interested Trustees*:
Correspondence intended for each Trustee who is an "interested person" (as defined in the 1940 Act) may be sent to 82 Devonshire Street, Boston, Massachusetts 02109.
Name, Age; Principal Occupation |
Edward C. Johnson 3d (73)** |
| Year of Election or Appointment: 1983 Mr. Johnson is Chairman of the Board of Trustees. Mr. Johnson serves as Chief Executive Officer, Chairman, and a Director of FMR Corp.; a Director and Chairman of the Board and of the Executive Committee of FMR; Chairman and a Director of Fidelity Management & Research (Far East) Inc.; Chairman (1998) and a Director of Fidelity Investments Money Management, Inc.; and Chairman (2001) and a Director (2000) of FMR Co., Inc. |
Abigail P. Johnson (41)** |
| Year of Election or Appointment: 2001 Senior Vice President of Advisor Korea (2001). Ms. Johnson also serves as Senior Vice President of other Fidelity funds (2001). She is President and a Director of FMR (2001), Fidelity Investments Money Management, Inc. (2001), FMR Co., Inc. (2001), and a Director of FMR Corp. Previously, Ms. Johnson managed a number of Fidelity funds. |
Laura B. Cronin (49) |
| Year of Election or Appointment: 2003 Ms. Cronin is an Executive Vice President (2002) and Chief Financial Officer (2002) of FMR Corp. and is a member of the Fidelity Management Committee (2003). Previously, Ms. Cronin served as Vice President of Finance of FMR (1997-1999), and Chief Financial Officer of FMR (1999-2001), Fidelity Personal Investments (2001), and Fidelity Brokerage Company (2001-2002). |
Robert L. Reynolds (51) |
| Year of Election or Appointment: 2003 Mr. Reynolds is a Director (2003) and Chief Operating Officer (2002) of FMR Corp. and is the head of the Fidelity Management Committee (2003). He also serves on the Board at Fidelity Investments Canada, Ltd. (2000). Previously, Mr. Reynolds served as President of Fidelity Investments Institutional Retirement Group (1996-2000). |
* Trustees have been determined to be "Interested Trustees" by virtue of, among other things, their affiliation with the trust or various entities under common control with FMR.
** Edward C. Johnson 3d, Trustee, is Abigail P. Johnson's father.
Annual Report
Non-Interested Trustees:
Correspondence intended for each non-interested Trustee (that is, the Trustees other than the Interested Trustees) may be sent to Fidelity Investments, P.O. Box 55235, Boston, Massachusetts 02205-5235.
Name, Age; Principal Occupation |
J. Michael Cook (61) |
| Year of Election or Appointment: 2001 Prior to Mr. Cook's retirement in May 1999, he served as Chairman and Chief Executive Officer of Deloitte & Touche LLP (accounting/consulting), Chairman of the Deloitte & Touche Foundation, and a member of the Board of Deloitte Touche Tohmatsu. He currently serves as a Director of Comcast (telecommunications, 2002), International Flavors & Fragrances, Inc. (2000), Rockwell Automation (2000) and The Dow Chemical Company (2000). He is a Member of the Diversity Advisory Council of Marakon (2003) and the Advisory Board of the Directorship Search Group, Chairman Emeritus of the Board of Catalyst (a leading organization for the advancement of women in business), and is Chairman of the Accountability Advisory Council to the Comptroller General of the United States. He also serves as a Member of the Advisory Board of the Graduate School of Business of the University of Florida, his alma mater. |
Ralph F. Cox (71) |
| Year of Election or Appointment: 1991 Mr. Cox is President of RABAR Enterprises (management consulting for the petroleum industry). Prior to February 1994, he was President of Greenhill Petroleum Corporation (petroleum exploration and production). Until March 1990, Mr. Cox was President and Chief Operating Officer of Union Pacific Resources Company (exploration and production). He is a Director of CH2M Hill Companies (engineering), and Abraxas Petroleum (petroleum exploration and production, 1999). In addition, he is a member of advisory boards of Texas A&M University and the University of Texas at Austin. |
Phyllis Burke Davis (71) |
| Year of Election or Appointment: 1992 Mrs. Davis is retired from Avon Products, Inc. (consumer products) where she held various positions including Senior Vice President of Corporate Affairs and Group Vice President of U.S. product marketing, sales, distribution, and manufacturing. Mrs. Davis is a member of the Board of Directors of the Southampton Hospital in Southampton, N.Y. (1998). Previously, she served as a Director of BellSouth Corporation (telecommunications), Eaton Corporation (diversified industrial), the TJX Companies, Inc. (retail stores), Hallmark Cards, Inc., and Nabisco Brands, Inc. |
Robert M. Gates (60) |
| Year of Election or Appointment: 1997 Dr. Gates is President of Texas A&M University (2002). He was Director of the Central Intelligence Agency (CIA) from 1991 to 1993. From 1989 to 1991, Dr. Gates served as Assistant to the President of the United States and Deputy National Security Advisor. Dr. Gates is a Director of NACCO Industries, Inc. (mining and manufacturing), and Parker Drilling Co., Inc. (drilling and rental tools for the energy industry, 2001). He also serves as a member of the Advisory Board of VoteHere.net (secure internet voting, 2001). Previously, Dr. Gates served as a Director of LucasVarity PLC (automotive components and diesel engines), a Director of TRW Inc. (automotive, space, defense, and information technology), and Dean of the George Bush School of Government and Public Service at Texas A&M University (1999-2001). Dr. Gates also is a Trustee of the Forum for International Policy. |
Donald J. Kirk (70) |
| Year of Election or Appointment: 1987 Mr. Kirk is a Governor of the American Stock Exchange (2001), a Trustee and former Chairman of the Board of Trustees of the Greenwich Hospital Association, a Director of the Yale-New Haven Health Services Corp. (1998), and a Director Emeritus and former Chairman of the Board of Directors of National Arts Strategies Inc. Mr. Kirk was an Executive-in-Residence (1995-2000) and a Professor (1987-1995) at Columbia University Graduate School of Business. Prior to 1987, he was Chairman of the Financial Accounting Standards Board. Previously, Mr. Kirk served as a Governor of the National Association of Securities Dealers, Inc. (1996-2002), a member and Vice Chairman of the Public Oversight Board of the American Institute of Certified Public Accountants' SEC Practice Section (1995-2002), a Director of General Re Corporation (reinsurance, 1987-1998) and as a Director of Valuation Research Corp. (appraisals and valuations). |
Marie L. Knowles (57) |
| Year of Election or Appointment: 2001 Prior to Ms. Knowles' retirement in June 2000, she served as Executive Vice President and Chief Financial Officer of Atlantic Richfield Company (ARCO) (diversified energy, 1996-2000). From 1993 to 1996, she was a Senior Vice President of ARCO and President of ARCO Transportation Company. She served as a Director of ARCO from 1996 to 1998. She currently serves as a Director of Phelps Dodge Corporation (copper mining and manufacturing), URS Corporation (multidisciplinary engineering, 1999), and McKesson Corporation (healthcare service, 2002). Ms. Knowles is a Trustee of the Brookings Institution and the Catalina Island Conservancy and also serves as a member of the Advisory Board for the School of Engineering of the University of Southern California. |
Ned C. Lautenbach (59) |
| Year of Election or Appointment: 2000 Mr. Lautenbach has been a partner of Clayton, Dubilier & Rice, Inc. (private equity investment firm) since September 1998. Previously, Mr. Lautenbach was with the International Business Machines Corporation (IBM) from 1968 until his retirement in 1998. He was most recently Senior Vice President and Group Executive of Worldwide Sales and Services. From 1993 to 1995, he was Chairman of IBM World Trade Corporation, and from 1994 to 1998 was a member of IBM's Corporate Executive Committee. Mr. Lautenbach serves as Chairman and as a Director (1998) of Acterna Corporation (communications test equipment). He is also Co-Chairman of Covansys, Inc. (global provider of business and technology solutions, 2000). In addition, he is a Director of Eaton Corporation (diversified industrial) and the Philharmonic Center for the Arts in Naples, Florida (1999). He also is a member of the Council on Foreign Relations. |
Marvin L. Mann (70) |
| Year of Election or Appointment: 1993 Mr. Mann is Chairman of the non-interested Trustees (2001). He is Chairman Emeritus of Lexmark International, Inc. (computer peripherals) where he served as CEO until April 1998 and retired as Chairman May 1999, and remains a member of the Board. Prior to 1991, he held the positions of Vice President of International Business Machines Corporation (IBM) and President and General Manager of various IBM divisions and subsidiaries. Mr. Mann is a Board member of Imation Corp. (imaging and information storage) and Acterna Corporation (communications test equipment, 1999). He is also a member of the Director Services Committee of the Investment Company Institute. In addition, Mr. Mann is a member of the President's Cabinet at the University of Alabama and the Board of Visitors of the Culverhouse College of Commerce and Business Administration at the University of Alabama. |
William O. McCoy (70) |
| Year of Election or Appointment: 1997 Prior to his retirement in December 1994, Mr. McCoy was Vice Chairman of the Board of BellSouth Corporation (telecommunications) and President of BellSouth Enterprises. He is currently a Director of Liberty Corporation (holding company), Duke Realty Corporation (real estate), Progress Energy, Inc. (electric utility), and Acterna Corporation (communications test equipment, 1999). He is also a partner of Franklin Street Partners (private investment management firm) and a member of the Research Triangle Foundation Board. In addition, Mr. McCoy served as the Interim Chancellor (1999-2000) and a member of the Board of Visitors (1994-1998) for the University of North Carolina at Chapel Hill and currently serves on the Board of Directors of the University of North Carolina Health Care System and the Board of Visitors of the Kenan-Flagler Business School (University of North Carolina at Chapel Hill). He also served as Vice President of Finance for the University of North Carolina (16-school system, 1995-1998). |
William S. Stavropoulos (64) |
| Year of Election or Appointment: 2001 Mr. Stavropoulos is Chairman of the Board, President and CEO (2002), and Chairman of the Executive Committee (2000) and a Director of The Dow Chemical Company. Since joining The Dow Chemical Company in 1967, Mr. Stavropoulos served in numerous senior management positions, including President (1993-2000) and Chief Executive Officer (1995-2000). Currently, he is a Director of NCR Corporation (data warehousing and technology solutions), BellSouth Corporation (telecommunications), Chemical Financial Corporation, and Maersk Inc. (industrial conglomerate, 2002). He also serves as a member of the Board of Trustees of the American Enterprise Institute for Public Policy Research. In addition, Mr. Stavropoulos is a member of The Business Council, J.P. Morgan International Council, World Business Council for Sustainable Development, and the University of Notre Dame Advisory Council for the College of Science. |
Annual Report
Trustees and Officers - continued
Advisory Board Members and Executive Officers:
Correspondence intended for Dr. Heilmeier may be sent to Fidelity Investments, P.O. Box 55235, Boston, Massachusetts 02205-5235. Correspondence intended for each executive officer and Mr. Lynch may be sent to 82 Devonshire Street, Boston, Massachusetts 02109.
Name, Age; Principal Occupation |
George H. Heilmeier (67) |
| Year of Election or Appointment: 2003 Member of the Advisory Board of Fidelity Advisor Series VIII. Dr. Heilmeier is Chairman Emeritus of Telcordia Technologies (communication software and systems), where prior to his retirement, he served as company Chairman and Chief Executive Officer. He currently serves on the Boards of Directors of The Mitre Corporation (systems engineering and information technology support for the government), INET Technologies Inc. (telecommunications network surveillance, 2001) and Teletech Holdings (customer management services, 1998). He is Chairman of the General Motors Technology Advisory Committee and a Life Fellow of the IEEE (2000). Dr. Heilmeier is a member of the Defense Science Board and the National Security Agency Advisory Board. He is also a member of the National Academy of Engineering, the American Academy of Arts and Sciences and The Board of Overseers of the School of Engineering and Applied Science of the University of Pennsylvania. Previously, Dr. Heilmeier served as a Director of TRW Inc. (automotive, space, defense, and information technology, 1992-2002) and Compaq (1994-2002). |
Peter S. Lynch (60) |
| Year of Election or Appointment: 2003 Member of the Advisory Board of Fidelity Advisor Series VIII. Vice Chairman and a Director of FMR, and Vice Chairman (2001) and a Director (2000) of FMR Co., Inc. Previously, Mr. Lynch served as a Trustee of the Fidelity funds (1990-2003). Prior to May 31, 1990, he was a Director of FMR and Executive Vice President of FMR (a position he held until March 31, 1991), Vice President of Fidelity® Magellan® Fund and FMR Growth Group Leader, and Managing Director of FMR Corp. Mr. Lynch was also Vice President of Fidelity Investments Corporate Services. In addition, he serves as a Trustee of Boston College, Massachusetts Eye & Ear Infirmary, Historic Deerfield, John F. Kennedy Library, and the Museum of Fine Arts of Boston. |
Philip L. Bullen (44) |
| Year of Election or Appointment: 2001 Vice President of Advisor Korea. Mr. Bullen also serves as Vice President of certain Equity Funds (2001) and certain High Income Funds (2001). He is Senior Vice President of FMR (2001) and FMR Co., Inc. (2001), President and a Director of Fidelity Management & Research (Far East) Inc. (2001), President and a Director of Fidelity Management & Research (U.K.) Inc. (2002), and a Director of Strategic Advisers, Inc. (2002). Before joining Fidelity Investments, Mr. Bullen was President and Chief Investment Officer of Santander Global Advisors (1997-2000) and President and Chief Executive Officer of Boston's Baring Asset Management Inc. (1994-1997). |
Eric D. Roiter (54) |
| Year of Election or Appointment: 1998 Secretary of Advisor Korea. He also serves as Secretary of other Fidelity funds (1998); Vice President, General Counsel, and Clerk of FMR Co., Inc. (2001) and FMR (1998); Vice President and Clerk of FDC (1998); Assistant Clerk of Fidelity Management & Research (U.K.) Inc. (2001) and Fidelity Management & Research (Far East) Inc. (2001); and Assistant Secretary of Fidelity Investments Money Management Inc. (2001). Prior to joining Fidelity, Mr. Roiter was with the law firm of Debevoise & Plimpton, as an associate (1981-1984) and as a partner (1985-1997), and served as an Assistant General Counsel of the U.S. Securities and Exchange Commission (1979-1981). Mr. Roiter is an Adjunct Member, Faculty of Law, at Boston College Law School (2003). |
Stuart Fross (44) |
| Year of Election or Appointment: 2003 Assistant Secretary of Advisor Korea. Mr. Fross also serves as Assistant Secretary of other Fidelity funds (2003) and is an employee of FMR. |
Maria F. Dwyer (44) |
| Year of Election or Appointment: 2002 President and Treasurer of Advisor Korea. Ms. Dwyer also serves as President and Treasurer of other Fidelity funds (2002) and is a Vice President (1999) and an employee (1996) of FMR. Prior to joining Fidelity, Ms. Dwyer served as Director of Compliance for MFS Investment Management. |
Timothy F. Hayes (52) |
| Year of Election or Appointment: 2002 Chief Financial Officer of Advisor Korea. Mr. Hayes also serves as Chief Financial Officer of other Fidelity funds (2002). Recently he was appointed President of Fidelity Service Company (2003) where he also serves as a Director. Mr. Hayes also serves as President of Fidelity Investments Operations Group (FIOG, 2002), which includes Fidelity Pricing and Cash Management Services Group (FPCMS), where he was appointed President in 1998. Previously, Mr. Hayes served as Chief Financial Officer of Fidelity Investments Corporate Systems and Service Group (1998) and Fidelity Systems Company (1997-1998). |
John R. Hebble (45) |
| Year of Election or Appointment: 2003 Deputy Treasurer of Advisor Korea. Mr. Hebble also serves as Deputy Treasurer of other Fidelity funds (2003), and is an employee of FMR. Before joining Fidelity Investments, Mr. Hebble worked at Deutsche Asset Management where he served as Director of Fund Accounting (2002-2003) and Assistant Treasurer of the Scudder Funds (1998-2003). |
John H. Costello (57) |
| Year of Election or Appointment: 1994 Assistant Treasurer of Advisor Korea. Mr. Costello also serves as Assistant Treasurer of other Fidelity funds and is an employee of FMR. |
Francis V. Knox, Jr. (56) |
| Year of Election or Appointment: 2002 Assistant Treasurer of Advisor Korea. Mr. Knox also serves as Assistant Treasurer of other Fidelity funds (2002), and is a Vice President and an employee of FMR. Previously, Mr. Knox served as Vice President of Investment & Advisor Compliance (1990-2001), and Compliance Officer of Fidelity Management & Research (U.K.) Inc. (1992-2002), Fidelity Management & Research (Far East) Inc. (1991-2002), and FMR Corp. (1995-2002). |
Mark Osterheld (48) |
| Year of Election or Appointment: 2002 Assistant Treasurer of Advisor Korea. Mr. Osterheld also serves as Assistant Treasurer of other Fidelity funds (2002) and is an employee of FMR. |
Thomas J. Simpson (45) |
| Year of Election or Appointment: 2000 Assistant Treasurer of Advisor Korea. Mr. Simpson is Assistant Treasurer of other Fidelity funds (2000) and an employee of FMR (1996). Prior to joining FMR, Mr. Simpson was Vice President and Fund Controller of Liberty Investment Services (1987-1995). |
Annual Report
Annual Report
Annual Report
Annual Report
Annual Report
Annual Report
Annual Report
Investment Adviser
Fidelity Management & Research Company
Boston, MA
Investment Sub-Advisers
FMR Co., Inc.
Fidelity Management & Research
(U.K.) Inc.
Fidelity Management & Research
(Far East) Inc.
Fidelity International
Investment Advisors
Fidelity Investments Japan Limited
Fidelity International Investment Advisors (U.K.) Limited
General Distributor
Fidelity Distributors Corporation
Boston, MA
Transfer and Shareholder
Servicing Agents
Fidelity Investments Institutional Operations Company, Inc.
Boston, MA
Custodian
JPMorgan Chase Bank
New York, NY
Annual Report
Fidelity Advisor Aggressive Growth Fund |
Fidelity Advisor Asset Allocation Fund |
Fidelity Advisor Balanced Fund |
Fidelity Advisor Biotechnology Fund |
Fidelity Advisor California Municipal Income Fund |
Fidelity Advisor Consumer Industries Fund |
Fidelity Advisor Cyclical Industries Fund |
Fidelity Advisor Developing Communications Fund |
Fidelity Advisor Diversified International Fund |
Fidelity Advisor Dividend Growth Fund |
Fidelity Advisor Dynamic Capital Appreciation Fund |
Fidelity Advisor Electronics Fund |
Fidelity Advisor Emerging Asia Fund |
Fidelity Advisor Emerging Markets Income Fund |
Fidelity Advisor Equity Growth Fund |
Fidelity Advisor Equity Income Fund |
Fidelity Advisor Equity Value Fund |
Fidelity Advisor Europe Capital Appreciation Fund |
Fidelity Advisor Fifty Fund |
Fidelity Advisor Financial Services Fund |
Fidelity Advisor Floating Rate High Income Fund |
Fidelity Advisor Freedom Income FundSM |
Fidelity Advisor Freedom 2010 FundSM |
Fidelity Advisor Freedom 2020 FundSM |
Fidelity Advisor Freedom 2030 FundSM |
Fidelity Advisor Freedom 2040 FundSM |
Fidelity Advisor Global Equity Fund |
Fidelity Advisor Government Investment Fund |
Fidelity Advisor Growth & Income Fund |
Fidelity Advisor Growth Opportunities |
Fidelity Advisor Health Care Fund |
Fidelity Advisor High Income Advantage Fund |
Fidelity Advisor High Income Fund |
Fidelity Advisor Inflation-Protected Bond Fund |
Fidelity Advisor Intermediate Bond Fund |
Fidelity Advisor International Capital Appreciation Fund |
Fidelity Advisor International Small Cap Fund |
Fidelity Advisor Investment Grade Bond Fund |
Fidelity Advisor Japan Fund |
Fidelity Advisor Korea Fund |
Fidelity Advisor Large Cap Fund |
Fidelity Advisor Latin America Fund |
Fidelity Advisor Leveraged Company Stock Fund |
Fidelity Advisor Mid Cap Fund |
Fidelity Advisor Mortgage Securities Fund |
Fidelity Advisor Municipal Income Fund |
Fidelity Advisor Natural Resources Fund |
Fidelity Advisor New Insights Fund |
Fidelity Advisor New York Municipal Income Fund |
Fidelity Advisor Overseas Fund |
Fidelity Advisor Real Estate Fund |
Fidelity Advisor Short Fixed-Income Fund |
Fidelity Advisor Short Intermediate Municipal Income Fund |
Fidelity Advisor Small Cap Fund |
Fidelity Advisor Strategic Growth Fund |
Fidelity Advisor Strategic Income Fund |
Fidelity Advisor Tax Managed Stock Fund |
Fidelity Advisor Technology Fund |
Fidelity Advisor Telecommunications & Utilities Growth Fund |
Fidelity Advisor Value Leaders Fund |
Fidelity Advisor Value Strategies Fund |
Prime Fund |
Tax-Exempt Fund |
Treasury Fund |
(Fidelity Investment logo)(registered trademark)
Corporate Headquarters
82 Devonshire St., Boston, MA 02109
www.fidelity.com
AKOR-UANN-1203
1.784758.100
Fidelity® Advisor
Korea
Fund - Institutional Class
Annual Report
October 31, 2003
(2_fidelity_logos) (Registered_Trademark)
Contents
Chairman's Message | <Click Here> | Ned Johnson's message to shareholders. |
Performance | <Click Here> | How the fund has done over time. |
Management's Discussion | <Click Here> | The manager's review of fund performance, strategy and outlook. |
Investment Changes | <Click Here> | A summary of major shifts in the fund's investments over the past six months. |
Investments | <Click Here> | A complete list of the fund's investments with their market values. |
Financial Statements | <Click Here> | Statements of assets and liabilities, operations, and changes in net assets,
as well as financial highlights. |
Notes | <Click Here> | Notes to the financial statements. |
Auditors' Opinion | <Click Here> | |
Trustees and Officers | <Click Here> | |
| | |
| | |
For a free copy of the fund's proxy voting guidelines call 1-877-208-0098 or visit the Securities and Exchange Commission (SEC)'s web site at www.sec.gov.
Third party marks appearing herein are the property of their respective owners.
All other marks appearing herein are registered or unregistered trademarks or service marks of FMR Corp. or an affiliated company.
(Recycle graphic) This report is printed on recycled paper using soy-based inks.
This report and the financial statements contained herein are submitted for the general information of the shareholders of the fund. This report is not authorized for distribution to prospective investors in the fund unless preceded or accompanied by an effective prospectus.
Mutual fund shares are not deposits or obligations of, or guaranteed by, any depository institution. Shares are not insured by the FDIC, Federal Reserve Board or any other agency, and are subject to investment risks, including possible loss of principal amount invested.
Neither the fund nor Fidelity Distributors Corporation is a bank.
For more information on any Fidelity Advisor fund, including charges and expenses, contact your investment professional for a free prospectus. Read it carefully before you invest or send money.
Annual Report
Chairman's Message
(photo_of_Edward_C_Johnson_3d)
Dear Shareholder:
Many of you have read or heard news stories recently that were critical of mutual funds and made allegations that the mutual fund industry has been less than forthright. I find these reports unsettling and not necessarily an accurate picture of the overall industry, and I would like you to know where we at Fidelity stand.
With specific regard to allegations that certain mutual fund companies were violating the Securities and Exchange Commission's forward pricing rules or were involved in so-called "market timing" activities, I want to say two things:
First, Fidelity does not have agreements that permit customers who buy fund shares after 4 p.m. to obtain the 4 p.m. price. This is not to say that someone could not deceive the company through fraudulent acts. But I underscore that we have no so-called "agreements" which would permit this illegal practice.
Second, Fidelity has been on record for years opposing predatory short-term trading which adversely affects other shareholders in a mutual fund. In fact, in the 1980s, we began charging a fee - which is returned to the fund and, therefore, to investors - to discourage this activity. What's more, several years ago we took the industry lead in developing a Fair Value Pricing Policy to prevent market timing on foreign securities in our funds. It is reasonable to assume that another structure can be developed that would alter the system to make it much more difficult for predatory traders to operate. This, however, will only be achieved through close cooperation among regulators, legislators and the industry.
Certainly no industry is perfect, and there have been instances of unethical and illegal activity from time to time within the mutual fund industry. When this occurs, confessed or convicted offenders should be dealt with appropriately. Clearly, every system can be improved. We applaud well thought out improvements by regulators, legislators and industry representatives that achieve the common goal of building and protecting the value of investors' holdings. But we remain concerned about the risk of over-regulation and the quick application of simplistic solutions to intricate problems.
For more than 57 years, Fidelity Investments has worked very hard to improve its products and service to justify your trust. When our family founded this company in 1946, we had only a few hundred customers. Many of them were family and friends. Today, we serve more than 18 million customers including individual investors and participants in retirement plans across America.
Let me close by saying that we do not take your trust in us for granted, and we realize that we must always work to improve all aspects of our service to you. In turn, we urge you to continue your active participation with your financial matters, so that your interests can be well served.
Annual Report
Best regards,
/s/Edward C. Johnson 3d
Edward C. Johnson 3d
Annual Report
Performance: The Bottom Line
Average annual total return reflects the change in the value of an investment, assuming reinvestment of the class' dividend income and capital gains (the profits earned upon the sale of securities that have grown in value) and assuming a constant rate of performance each year. During periods of reimbursement by Fidelity, a fund's total return will be greater than it would be had the reimbursement not occurred. The $10,000 table and the fund's returns do not reflect the deduction of taxes that a shareholder would pay on fund distributions or the redemption of fund shares. How a fund did yesterday is no guarantee of how it will do tomorrow.
Average Annual Total Returns
Periods ended October 31, 2003 | | Past 1
year | Past 5
years | Life of
fund A |
Institutional Class B | | 22.50% | 19.45% | -1.92% |
A From October 31, 1994.
B Institutional Class shares are sold to eligible investors without a sales load or 12b-1 fee. The initial offering of Institutional Class shares took place on July 3, 2000. Returns between October 31, 1994 and June 30, 2000 are those of Fidelity Advisor Korea Fund, Inc., (the Closed-End Fund). On June 30, 2000, the Closed-End Fund reorganized as an open-end fund through a transfer of all of its assets and liabilities to Fidelity Advisor Korea Fund (the fund). Shareholders of the Closed-End Fund received Class A shares of the fund in exchange for their shares of the Closed-End fund. If the effect of Institutional Class expenses was reflected, returns may be lower than shown because Institutional Class shares of the fund may have higher total expenses than the Closed-End Fund.
$10,000 Over Life of Fund
Let's say hypothetically that $10,000 was invested in Fidelity Advisor Korea Fund - Institutional Class on October 31, 1994, when the Closed-End Fund started. The chart shows how the value of your investment would have grown, and also shows how the Korea Composite Stock Price Index did over the same period.
Annual Report
Annual Report
Management's Discussion of Fund Performance
Comments from Agus Tandiono, Portfolio Manager of Fidelity® Advisor Korea Fund
Mirroring the U.S. rally, the Korea Composite Stock Price Index (KOSPI) rebounded sharply during the 12-month period ending October 31, 2003, returning 22.28%. The first half of the period was volatile, with weak domestic spending, concerns about North Korea's nuclear program, the Iraqi war and the discovery of accounting fraud at SK Global all weighing on share prices and driving the KOSPI down to a low of approximately 515 in March. By comparison, the second half of the period was relatively placid. A swift end to the regime of Saddam Hussein appeared to curb North Korea's belligerence, while worries about the accounting scandal faded. At the same time, South Korea's new president lowered interest rates and boosted the supplementary budget to stimulate the economy, while exports improved due to strengthening economies abroad, especially China. As a result, South Korean stocks began a sustained rally in mid-March that carried the index near the 800 level by the end of the period.
For the 12 months ending October 31, 2003, the fund's Institutional Class shares performed about in line with the KOSPI, returning 22.50%. Meanwhile, the LipperSM Pacific Region ex Japan Funds Average posted a 37.16% return. Investor concerns about North Korea and SK Global primarily affected South Korean stocks, resulting in the fund's underperformance versus the Lipper average. Responding to improving conditions in the first half of the period, I gave the fund an overweighting in technology and increased its exposure to the banking industry. The fund's top contributor in absolute terms was Samsung Electronics, as rising prices for DRAM computer memory aided the stock. Also contributing to performance was Shinhan Financial Group, which became the country's second-largest bank as a result of acquiring Chohung Bank. SK Telecom was the fund's largest detractor, with most of the damage occurring in the first half of the period. The fund also was hurt by its position in Samsung Electro-Mechanics, which manufactures resistors. The stock fell in part because a price war with Japanese competitors dented profits.
The views expressed in this statement reflect those of the portfolio manager only through the end of the period of the report as stated on the cover and do not necessarily represent the views of Fidelity or any other person in the Fidelity organization. Any such views are subject to change at any time based upon market or other conditions and Fidelity disclaims any responsibility to update such views. These views may not be relied on as investment advice and, because investment decisions for a Fidelity fund are based on numerous factors, may not be relied on as an indication of trading intent on behalf of any Fidelity fund.
Annual Report
Investment Changes
Top Ten Stocks as of October 31, 2003 |
| % of fund's
net assets | % of fund's net assets
6 months ago |
Samsung Electronics Co. Ltd. | 23.9 | 21.4 |
Kookmin Bank | 8.6 | 8.2 |
SK Telecom Co. Ltd. | 8.3 | 4.3 |
Shinhan Financial Group Co. Ltd. | 5.6 | 4.5 |
Hyundai Motor Co. Ltd. | 4.4 | 4.2 |
KH Vatec Co. Ltd. | 3.1 | 2.0 |
POSCO | 3.0 | 3.5 |
Korea Electric Power Corp. | 2.5 | 3.4 |
Hana Bank | 2.3 | 0.5 |
Hyundai Mobis | 2.3 | 0.0 |
| 64.0 | |
Market Sectors as of October 31, 2003 |
| % of fund's
net assets | % of fund's net assets
6 months ago |
Information Technology | 34.7 | 30.4 |
Financials | 21.3 | 22.3 |
Consumer Discretionary | 14.7 | 17.6 |
Telecommunication Services | 9.9 | 10.6 |
Materials | 7.4 | 5.1 |
Consumer Staples | 4.6 | 5.5 |
Industrials | 3.6 | 1.5 |
Utilities | 2.5 | 3.4 |
Energy | 0.0 | 1.3 |
Asset Allocation (% of fund's net assets) |
As of October 31, 2003 | As of April 30, 2003 |
| Stocks 98.7% | | | Stocks 97.7% | |
| Short-Term
Investments and
Net Other Assets 1.3% | | | Short-Term
Investments and
Net Other Assets 2.3% | |

Annual Report
Investments October 31, 2003
Showing Percentage of Net Assets
Common Stocks - 98.7% |
| Shares | | Value (Note 1) |
CONSUMER DISCRETIONARY - 14.7% |
Auto Components - 2.3% |
Hyundai Mobis | 9,000 | | $ 347,528 |
Automobiles - 4.4% |
Hyundai Motor Co. Ltd. | 20,000 | | 666,666 |
Hotels, Restaurants & Leisure - 1.2% |
Kangwon Land, Inc. | 1,500 | | 189,480 |
Internet & Catalog Retail - 1.9% |
CJ Home Shopping | 4,000 | | 152,091 |
LG Home Shopping, Inc. | 2,800 | | 136,510 |
| | 288,601 |
Media - 2.5% |
Cheil Communications, Inc. | 1,800 | | 220,532 |
Plenus Entertainment, Inc. | 8,000 | | 161,555 |
| | 382,087 |
Multiline Retail - 2.0% |
Shinsegae Co. Ltd. | 1,500 | | 301,014 |
Textiles Apparel & Luxury Goods - 0.4% |
Handsome Co. Ltd. | 10,000 | | 69,624 |
TOTAL CONSUMER DISCRETIONARY | | 2,245,000 |
CONSUMER STAPLES - 4.6% |
Beverages - 1.3% |
Lotte Chilsung Beverage Co. Ltd. | 380 | | 192,649 |
Food & Staples Retailing - 1.8% |
Pulmuone Co. Ltd. | 6,000 | | 272,750 |
Food Products - 1.5% |
Nong Shim Co. Ltd. | 1,596 | | 233,298 |
TOTAL CONSUMER STAPLES | | 698,697 |
FINANCIALS - 21.3% |
Capital Markets - 1.2% |
Good Morning Shinhan Securities Co. (a) | 20,000 | | 82,805 |
LG Investment & Securities Co. Ltd. | 12,000 | | 105,957 |
| | 188,762 |
Commercial Banks - 17.0% |
Hana Bank | 20,000 | | 348,120 |
Kookmin Bank | 36,000 | | 1,314,068 |
Common Stocks - continued |
| Shares | | Value (Note 1) |
FINANCIALS - continued |
Commercial Banks - continued |
Korea Exchange Bank (a) | 20,000 | | $ 82,383 |
Shinhan Financial Group Co. Ltd. | 60,000 | | 861,850 |
| | 2,606,421 |
Consumer Finance - 0.7% |
LG Card Co. Ltd. | 10,000 | | 101,817 |
Diversified Financial Services - 0.5% |
Korea Exchange Bank Cred Service Co. Ltd. (a) | 15,000 | | 84,791 |
Insurance - 1.9% |
Samsung Fire & Marine Insurance Co. Ltd. | 5,000 | | 285,593 |
TOTAL FINANCIALS | | 3,267,384 |
INDUSTRIALS - 3.6% |
Airlines - 1.9% |
Korean Air Co. Ltd. | 22,000 | | 293,705 |
Industrial Conglomerates - 1.7% |
LG Chemical Investment Ltd. | 30,000 | | 252,218 |
TOTAL INDUSTRIALS | | 545,923 |
INFORMATION TECHNOLOGY - 34.7% |
Electronic Equipment & Instruments - 8.8% |
Dae Duck Electronics Co. Ltd. | 30,000 | | 276,299 |
Hankuk Electric Glass Co. Ltd. | 3,500 | | 214,406 |
KH Vatec Co. Ltd. | 10,160 | | 484,177 |
Samsung Electro-Mechanics Co. Ltd. | 8,000 | | 271,060 |
Samsung SDI Co. Ltd. | 1,000 | | 103,084 |
| | 1,349,026 |
Semiconductors & Semiconductor Equipment - 23.9% |
Samsung Electronics Co. Ltd. | 9,200 | | 3,653,569 |
Software - 2.0% |
NCsoft Corp. (a) | 5,700 | | 303,422 |
TOTAL INFORMATION TECHNOLOGY | | 5,306,017 |
MATERIALS - 7.4% |
Chemicals - 3.8% |
Hanwha Chemical Corp. (a) | 20,000 | | 138,910 |
Common Stocks - continued |
| Shares | | Value (Note 1) |
MATERIALS - continued |
Chemicals - continued |
Honam Petrochemical Corp. | 8,000 | | $ 320,405 |
LG Chemical Ltd. | 3,000 | | 120,406 |
| | 579,721 |
Construction Materials - 0.6% |
Hanil Cement Co. Ltd. | 2,000 | | 91,593 |
Metals & Mining - 3.0% |
POSCO | 4,000 | | 463,680 |
TOTAL MATERIALS | | 1,134,994 |
TELECOMMUNICATION SERVICES - 9.9% |
Diversified Telecommunication Services - 1.6% |
KT Corp. | 6,000 | | 238,783 |
Wireless Telecommunication Services - 8.3% |
SK Telecom Co. Ltd. | 7,200 | | 1,271,482 |
TOTAL TELECOMMUNICATION SERVICES | | 1,510,265 |
UTILITIES - 2.5% |
Electric Utilities - 2.5% |
Korea Electric Power Corp. | 20,000 | | 386,143 |
TOTAL COMMON STOCKS (Cost $9,549,688) | 15,094,423 |
Nonconvertible Bonds - 0.0% |
| Principal Amount | | |
FINANCIALS - 0.0% |
Commercial Banks - 0.0% |
Shinhan Bank 0% 12/2/48 | KRW | 64,930,000 | | 104 |
TOTAL NONCONVERTIBLE BONDS (Cost $5,382) | 104 |
Money Market Funds - 3.2% |
| Shares | | Value (Note 1) |
Fidelity Cash Central Fund, 1.07% (b)
(Cost $496,078) | 496,078 | | $ 496,078 |
TOTAL INVESTMENT PORTFOLIO - 101.9% (Cost $10,051,148) | | 15,590,605 |
NET OTHER ASSETS - (1.9)% | | (296,857) |
NET ASSETS - 100% | $ 15,293,748 |
Currency Abbreviations |
KRW | - | Korean won |
Legend |
(a) Non-income producing |
(b) The rate quoted is the annualized seven-day yield of the fund at period end. A complete listing of the fund's holdings as of its most recent fiscal year end is available upon request. |
Other Information |
Purchases and sales of securities, other than short-term securities, aggregated $18,494,494 and $24,366,662, respectively. |
The fund placed a portion of its portfolio transactions with brokerage firms which are affiliates of the investment adviser. The commissions paid to these affiliated firms were $47 for the period. |
Income Tax Information |
At October 31, 2003, the fund had a capital loss carryforward of approximately $13,718,000 of which $89,000, $12,115,000 and $1,514,000 will expire on October 31, 2005, 2006 and 2009, respectively. |
See accompanying notes which are an integral part of the financial statements.
Annual Report
Financial Statements
Statement of Assets and Liabilities
| October 31, 2003 |
| | |
Assets | | |
Investment in securities, at value (cost $10,051,148) - See accompanying schedule | | $ 15,590,605 |
Receivable for investments sold | | 118,155 |
Receivable for fund shares sold | | 85,197 |
Dividends receivable | | 7,937 |
Interest receivable | | 189 |
Prepaid expenses | | 77 |
Receivable from investment adviser for expense reductions | | 8,533 |
Total assets | | 15,810,693 |
| | |
Liabilities | | |
Payable for investments purchased | $ 364,985 | |
Payable for fund shares redeemed | 66,394 | |
Accrued management fee | 10,474 | |
Distribution fees payable | 4,402 | |
Other payables and accrued expenses | 70,690 | |
Total liabilities | | 516,945 |
| | |
Net Assets | | $ 15,293,748 |
Net Assets consist of: | | |
Paid in capital | | $ 23,521,362 |
Undistributed net investment income | | 2,115 |
Accumulated undistributed net realized gain (loss) on investments and foreign currency transactions | | (13,761,921) |
Net unrealized appreciation (depreciation) on investments and assets and liabilities in foreign currencies | | 5,532,192 |
Net Assets | | $ 15,293,748 |
See accompanying notes which are an integral part of the financial statements.
Annual Report
Financial Statements - continued
Statement of Assets and Liabilities - continued
| October 31, 2003 |
| | |
Calculation of Maximum Offering Price
Class A:
Net Asset Value and redemption price per share ($12,187,098 ÷ 1,101,069 shares) | | $ 11.07 |
| | |
Maximum offering price per share (100/94.25 of $11.07) | | $ 11.75 |
Class T:
Net Asset Value and redemption price per share ($1,222,933 ÷ 111,554 shares) | | $ 10.96 |
| | |
Maximum offering price per share (100/96.50 of $10.96) | | $ 11.36 |
Class B:
Net Asset Value and offering price per share ($1,175,098 ÷ 109,032 shares) A | | $ 10.78 |
| | |
Class C:
Net Asset Value and offering price per share ($531,304 ÷ 49,250 shares) A | | $ 10.79 |
| | |
| | |
Institutional Class:
Net Asset Value, offering price and redemption price per share ($177,315 ÷ 15,883 shares) | | $ 11.16 |
A Redemption price per share is equal to net asset value less any applicable contingent deferred sales charge.
See accompanying notes which are an integral part of the financial statements.
Annual Report
Statement of Operations
| Year ended October 31, 2003 |
| | |
Investment Income | | |
Dividends | | $ 371,744 |
Interest | | 4,536 |
| | 376,280 |
Less foreign taxes withheld | | (61,351) |
Total income | | 314,929 |
| | |
Expenses | | |
Management fee | $ 123,517 | |
Transfer agent fees | 68,470 | |
Distribution fees | 51,500 | |
Accounting fees and expenses | 61,565 | |
Non-interested trustees' compensation | 62 | |
Custodian fees and expenses | 34,204 | |
Registration fees | 48,991 | |
Audit | 66,904 | |
Legal | 875 | |
Miscellaneous | 147 | |
Total expenses before reductions | 456,235 | |
Expense reductions | (145,184) | 311,051 |
Net investment income (loss) | | 3,878 |
Realized and Unrealized Gain (Loss) Net realized gain (loss) on: | | |
Investment securities | 3,611,178 | |
Foreign currency transactions | (93,543) | |
Total net realized gain (loss) | | 3,517,635 |
Change in net unrealized appreciation (depreciation) on: Investment securities | (747,728) | |
Assets and liabilities in foreign currencies | (8,204) | |
Total change in net unrealized appreciation (depreciation) | | (755,932) |
Net gain (loss) | | 2,761,703 |
Net increase (decrease) in net assets resulting from operations | | $ 2,765,581 |
See accompanying notes which are an integral part of the financial statements.
Annual Report
Financial Statements - continued
Statement of Changes in Net Assets
| Year ended
October 31,
2003 | Year ended
October 31,
2002 |
Increase (Decrease) in Net Assets | | |
Operations | | |
Net investment income (loss) | $ 3,878 | $ (248,639) |
Net realized gain (loss) | 3,517,635 | 4,062,190 |
Change in net unrealized appreciation (depreciation) | (755,932) | 577,380 |
Net increase (decrease) in net assets resulting
from operations | 2,765,581 | 4,390,931 |
Share transactions - net increase (decrease) | (6,380,457) | 1,965,578 |
Total increase (decrease) in net assets | (3,614,876) | 6,356,509 |
| | |
Net Assets | | |
Beginning of period | 18,908,624 | 12,552,115 |
End of period (including undistributed net investment income of $2,115 and undistributed net investment income of $1,030, respectively) | $ 15,293,748 | $ 18,908,624 |
See accompanying notes which are an integral part of the financial statements.
Annual Report
Financial Highlights - Class A
Years ended October 31, | 2003 | 2002 | 2001 | 2000 K | 2000 G, J | 1999 J |
Selected Per-Share Data | | | | | |
Net asset value, beginning of period | $ 9.05 | $ 6.70 | $ 7.38 | $ 8.99 | $ 10.78 | $ 3.67 |
Income from Investment Operations | | | | | | |
Net investment income (loss) E | .01 | (.11) | -L | (.01) | (.09) | (.04) |
Net realized and unrealized gain (loss) | 2.01 | 2.46 | (.69) | (1.62) | (1.97) | 7.15 |
Total from investment operations | 2.02 | 2.35 | (.69) | (1.63) | (2.06) | 7.11 |
Redemption fees added to paid in capital E | - | - | .01 | .02 | .27 | - |
Net asset value, end of period | $ 11.07 | $ 9.05 | $ 6.70 | $ 7.38 | $ 8.99 | $ 10.78 I |
Total Return B, C, D | 22.32% | 35.07% | (9.21)% | (17.91)% | (16.60)% | 193.73% |
Ratios to Average Net Assets F | | | | | |
Expenses before expense reductions | 2.85% | 2.48% | 3.31% | 2.31% A | 1.97% | 1.75% |
Expenses net of voluntary waivers, if any | 2.00% | 2.08% | 2.10% | 2.10% A | 1.91% | 1.75% |
Expenses net of all
reductions | 2.00% | 2.06% | 2.08% | 2.10% A | 1.89% | 1.61% H |
Net investment income (loss) | .12% | (1.10)% | (.04)% | (1.71)% A | (.73)% | (.42)% |
Supplemental Data | | | | | |
Net assets, end of period (000 omitted) | $ 12,187 | $ 11,946 | $ 11,747 | $ 19,279 | $ 25,017 | $ 60,601 |
Portfolio turnover rate | 127% | 60% | 36% | 121% A | 39% | 58% |
A Annualized B Total returns for periods of less than one year are not annualized. C Total returns would have been lower had certain expenses not been reduced during the periods shown. D Total returns do not include the effect of the sales charges. E Calculated based on average shares outstanding during the period. F Expense ratios reflect operating expenses of the class. Expenses before reductions do not reflect amounts reimbursed by the investment adviser or reductions from brokerage service arrangements or other expense offset arrangements and do not represent the amount paid by the class during periods when reimbursements or reductions occur. Expenses net of any voluntary waivers reflect expenses after reimbursement by the investment adviser but prior to reductions from brokerage service arrangements or other expense offset arrangements. Expenses net of all reductions represent the net expenses paid by the class. G Prior to July 3, 2000, the fund operated as a closed-end investment company. Shares of the fund existing at the time of its conversion to an open-ended management company were exchanged for Class A shares. H Includes reimbursement of $.01 per share from the custodian for an adjustment to prior period's fees. I The fund incurred expenses of $.01 per share in connection with its repurchase offer which were offset by redemption fees collected as part of the repurchase offer. J For the year ended September 30. K One month ended October 31. L Amount represents less than $.01 per-share.
See accompanying notes which are an integral part of the financial statements.
Annual Report
Financial Highlights - Class T
Years ended October 31, | 2003 | 2002 | 2001 | 2000I | 2000F |
Selected Per-Share Data | | | | | |
Net asset value, beginning of period | $ 8.99 | $ 6.67 | $ 7.37 | $ 8.99 | $ 12.58 |
Income from Investment Operations | | | | | |
Net investment income (loss)E | (.01) | (.14) | (.02) | (.01) | (.03) |
Net realized and unrealized gain (loss) | 1.98 | 2.46 | (.69) | (1.62)H | (3.87)H |
Total from investment operations | 1.97 | 2.32 | (.71) | (1.63) | (3.90) |
Redemption fees added to paid
in capitalE | - | - | .01 | .01H | .31H |
Net asset value, end of period | $ 10.96 | $ 8.99 | $ 6.67 | $ 7.37 | $ 8.99 |
Total ReturnB,C,D | 21.91% | 34.78% | (9.50)% | (18.02)% | (28.54)% |
Ratios to Average Net AssetsG | | | | |
Expenses before expense
reductions | 3.74% | 3.02% | 4.22% | 2.50%A | 2.55%A |
Expenses net of voluntary
waivers, if any | 2.25% | 2.33% | 2.35% | 2.35%A | 2.35%A |
Expenses net of all reductions | 2.25% | 2.31% | 2.33% | 2.35%A | 2.32%A |
Net investment income (loss) | (.13)% | (1.35)% | (.29)% | (1.96)%A | (1.16)%A |
Supplemental Data | | | | | |
Net assets, end of period
(000 omitted) | $ 1,223 | $ 2,718 | $ 343 | $ 473 | $ 108 |
Portfolio turnover rate | 127% | 60% | 36% | 121%A | 39% |
A Annualized B Total returns for periods of less than one year are not annualized. C Total returns would have been lower had certain expenses not been reduced during the periods shown. D Total returns do not include the effect of the sales charges. E Calculated based on average shares outstanding during the period. F For the period July 3, 2000 (commencement of sale of shares) to September 30, 2000. G Expense ratios reflect operating expenses of the class. Expenses before reductions do not reflect amounts reimbursed by the investment adviser or reductions from brokerage service arrangements or other expense offset arrangements and do not represent the amount paid by the class during periods when reimbursements or reductions occur. Expense ratios before start-up periods may not be representative of longer-term operating periods. Expenses net of any voluntary waivers reflect expenses after reimbursement by the investment adviser but prior to reductions from brokerage service arrangements or other expense offset arrangements. Expenses net of all reductions represent the net expenses paid by the class. HPer share amounts have been reclassified to permit comparison with current year presentation. I One month ended October 31.
See accompanying notes which are an integral part of the financial statements.
Annual Report
Financial Highlights - Class B
Years ended October 31, | 2003 | 2002 | 2001 | 2000I | 2000F |
Selected Per-Share Data | | | | | |
Net asset value, beginning of period | $ 8.88 | $ 6.62 | $ 7.36 | $ 8.98 | $ 12.58 |
Income from Investment Operations | | | | | |
Net investment income (loss)E | (.06) | (.19) | (.05) | (.02) | (.04) |
Net realized and unrealized gain (loss) | 1.96 | 2.45 | (.69) | (1.62)H | (3.89)H |
Total from investment operations | 1.90 | 2.26 | (.74) | (1.64) | (3.93) |
Redemption fees added to paid
in capitalE | - | - | -J | .02H | .33H |
Net asset value, end of period | $ 10.78 | $ 8.88 | $ 6.62 | $ 7.36 | $ 8.98 |
Total ReturnB,C,D | 21.40% | 34.14% | (10.05)% | (18.04)% | (28.62)% |
Ratios to Average Net AssetsG | | | | |
Expenses before expense
reductions | 4.08% | 3.48% | 4.66% | 2.96%A | 3.03%A |
Expenses net of voluntary
waivers, if any | 2.75% | 2.83% | 2.85% | 2.85%A | 2.85%A |
Expenses net of all reductions | 2.75% | 2.81% | 2.83% | 2.85%A | 2.83%A |
Net investment income (loss) | (.63)% | (1.85)% | (.79)% | (2.45)%A | (1.67)%A |
Supplemental Data | | | | | |
Net assets, end of period
(000 omitted) | $ 1,175 | $ 1,313 | $ 282 | $ 83 | $ 80 |
Portfolio turnover rate | 127% | 60% | 36% | 121%A | 39% |
A Annualized B Total returns for periods of less than one year are not annualized. C Total returns would have been lower had certain expenses not been reduced during the periods shown. D Total returns do not include the effect of the contingent deferred sales charge. E Calculated based on average shares outstanding during the period. F For the period July 3, 2000 (commencement of sale of shares) to September 30, 2000. G Expense ratios reflect operating expenses of the class. Expenses before reductions do not reflect amounts reimbursed by the investment adviser or reductions from brokerage service arrangements or other expense offset arrangements and do not represent the amount paid by the class during periods when reimbursements or reductions occur. Expense ratios before start-up periods may not be representative of longer-term operating periods. Expenses net of any voluntary waivers reflect expenses after reimbursement by the investment adviser but prior to reductions from brokerage service arrangements or other expense offset arrangements. Expenses net of all reductions represent the net expenses paid by the class. HPer share amounts have been reclassified to permit comparison with current year presentation. I One month ended October 31. JAmount represents less than $.01 per-share.
See accompanying notes which are an integral part of the financial statements.
Annual Report
Financial Highlights - Class C
Years ended October 31, | 2003 | 2002 | 2001 | 2000I | 2000F |
Selected Per-Share Data | | | | | |
Net asset value, beginning of period | $ 8.89 | $ 6.62 | $ 7.36 | $ 8.98 | $ 12.58 |
Income from Investment Operations | | | | | |
Net investment income (loss)E | (.06) | (.19) | (.06) | (.02) | (.04) |
Net realized and unrealized gain (loss) | 1.96 | 2.46 | (.69) | (1.62)H | (3.89)H |
Total from investment operations | 1.90 | 2.27 | (.75) | (1.64) | (3.93) |
Redemption fees added to paid
in capitalE | - | - | .01 | .02H | .33H |
Net asset value, end of period | $ 10.79 | $ 8.89 | $ 6.62 | $ 7.36 | $ 8.98 |
Total ReturnB,C,D | 21.37% | 34.29% | (10.05)% | (18.04)% | (28.62)% |
Ratios to Average Net AssetsG | | | | |
Expenses before expense
reductions | 3.82% | 3.35% | 4.41% | 2.91%A | 3.01%A |
Expenses net of voluntary waivers, if any | 2.75% | 2.83% | 2.85% | 2.85%A | 2.85%A |
Expenses net of all reductions | 2.75% | 2.81% | 2.83% | 2.85%A | 2.82%A |
Net investment income (loss) | (.63)% | (1.85)% | (.79)% | (2.46)%A | (1.66)%A |
Supplemental Data | | | | | |
Net assets, end of period
(000 omitted) | $ 531 | $ 804 | $ 127 | $ 82 | $ 90 |
Portfolio turnover rate | 127% | 60% | 36% | 121%A | 39% |
A Annualized B Total returns for periods of less than one year are not annualized. C Total returns would have been lower had certain expenses not been reduced during the periods shown. D Total returns do not include the effect of the contingent deferred sales charge. E Calculated based on average shares outstanding during the period. F For the period July 3, 2000 (commencement of sale of shares) to September 30, 2000. G Expense ratios reflect operating expenses of the class. Expenses before reductions do not reflect amounts reimbursed by the investment adviser or reductions from brokerage service arrangements or other expense offset arrangements and do not represent the amount paid by the class during periods when reimbursements or reductions occur. Expense ratios before start-up periods may not be representative of longer-term operating periods. Expenses net of any voluntary waivers reflect expenses after reimbursement by the investment adviser but prior to reductions from brokerage service arrangements or other expense offset arrangements. Expenses net of all reductions represent the net expenses paid by the class. HPer share amounts have been reclassified to permit comparison with current year presentation. I One month ended October 31.
See accompanying notes which are an integral part of the financial statements.
Annual Report
Financial Highlights - Institutional Class
Years ended October 31, | 2003 | 2002 | 2001 | 2000H | 2000E |
Selected Per-Share Data | | | | | |
Net asset value, beginning of period | $ 9.11 | $ 6.72 | $ 7.39 | $ 8.99 | $ 12.58 |
Income from Investment Operations | | | | | |
Net investment income (loss)D | .04 | (.08) | .01 | (.01) | (.01) |
Net realized and unrealized gain (loss) | 2.01 | 2.47 | (.69) | (1.63)G | (3.67)G |
Total from investment operations | 2.05 | 2.39 | (.68) | (1.64) | (3.68) |
Redemption fees added to paid in capitalD | - | - | .01 | .04G | .09G |
Net asset value, end of period | $ 11.16 | $ 9.11 | $ 6.72 | $ 7.39 | $ 8.99 |
Total ReturnB,C | 22.50% | 35.57% | (9.07)% | (17.80)% | (28.54)% |
Ratios to Average Net AssetsF | | | | |
Expenses before expense
reductions | 3.11% | 2.22% | 3.08% | 1.77%A | 2.54%A |
Expenses net of voluntary
waivers, if any | 1.75% | 1.81% | 1.85% | 1.77%A | 1.85%A |
Expenses net of all reductions | 1.75% | 1.80% | 1.83% | 1.77%A | 1.84%A |
Net investment income (loss) | .38% | (.84)% | .21% | (1.38)%A | (.68)%A |
Supplemental Data | | | | | |
Net assets, end of period
(000 omitted) | $ 177 | $ 2,127 | $ 53 | $ 59 | $ 71 |
Portfolio turnover rate | 127% | 60% | 36% | 121%A | 39% |
A Annualized B Total returns for periods of less than one year are not annualized. C Total returns would have been lower had certain expenses not been reduced during the periods shown. D Calculated based on average shares outstanding during the period. E For the period July 3, 2000 (commencement of sale of shares) to September 30, 2000. F Expense ratios reflect operating expenses of the class. Expenses before reductions do not reflect amounts reimbursed by the investment adviser or reductions from brokerage service arrangements or other expense offset arrangements and do not represent the amount paid by the class during periods when reimbursements or reductions occur. Expense ratios before start-up periods may not be representative of longer-term operating periods. Expenses net of any voluntary waivers reflect expenses after reimbursement by the investment adviser but prior to reductions from brokerage service arrangements or other expense offset arrangements. Expenses net of all reductions represent the net expenses paid by the class. GPer share amounts have been reclassified to permit comparison with current year presentation. H One month ended October 31.
See accompanying notes which are an integral part of the financial statements.
Annual Report
Notes to Financial Statements
For the period ended October 31, 2003
1. Significant Accounting Policies.
Fidelity Advisor Korea Fund (the fund) is a fund of Fidelity Advisor Series VIII (the trust) and is authorized to issue an unlimited number of shares. The trust is registered under the Investment Company Act of 1940, as amended (the 1940 Act), as an open-end management investment company organized as a Massachusetts business trust.
The fund offers Class A, Class T, Class B, Class C and Institutional Class shares, each of which has equal rights as to assets and voting privileges. Each class has exclusive voting rights with respect to matters that affect that class. Class B shares will automatically convert to Class A shares after a holding period of seven years from the initial date of purchase. Investment income, realized and unrealized capital gains and losses, the common expenses of the fund, and certain fund-level expense reductions, if any, are allocated on a pro rata basis to each class based on the relative net assets of each class to the total net assets of the fund. Each class differs with respect to transfer agent and distribution and service plan fees incurred. Certain expense reductions also differ by class.
The fund's investments in emerging markets can be subject to social, economic, regulatory, and political uncertainties and can be extremely volatile.
The financial statements have been prepared in conformity with accounting principles generally accepted in the United States of America, which require management to make certain estimates and assumptions at the date of the financial statements. The following summarizes the significant accounting policies of the fund:
Security Valuation. Net asset value per share (NAV calculation) is calculated as of the close of business of the New York Stock Exchange, normally 4:00 p.m. Eastern time. Equity securities for which market quotations are available are valued at the last sale price or official closing price (closing bid price or last evaluated quote if no sale has occurred) on the primary market or exchange on which they trade. Debt securities for which quotations are readily available are valued at their most recent bid prices (sales prices if the principal market is an exchange) in the principal market in which such securities are normally traded, as determined by recognized dealers in such securities, or securities are valued on the basis of information provided by a pricing service. Pricing services use valuation matrices that incorporate both dealer-supplied valuations and valuation models. If an event that is expected to materially affect the value of a security occurs after the close of an exchange or market on which that security trades, but prior to the NAV calculation, then that security will be fair valued taking the event into account. Securities (including restricted securities) for which market quotations are not readily available are valued at their fair value as determined in good faith under consistently applied procedures under the general supervision of the Board of Trustees. Price movements in futures contracts and ADRs, market and trading trends, the bid/ask quotes of brokers and off-exchange institutional trading may be reviewed in the course of making a good faith determination of a security's fair value. Short-term securities with
Annual Report
Notes to Financial Statements - continued
1. Significant Accounting Policies - continued
Annual Report
Security Valuation - continued
remaining maturities of sixty days or less for which quotations are not readily available are valued on the basis of amortized cost. Investments in open-end investment companies are valued at their net asset value each business day.
Foreign Currency. The fund uses foreign currency contracts to facilitate transactions in foreign-denominated securities. Losses from these transactions may arise from changes in the value of the foreign currency or if the counterparties do not perform under the contracts' terms.
Foreign denominated assets, including investment securities, and liabilities are translated into U.S. dollars at the exchange rate at period end. Purchases and sales of investment securities, income and dividends received and expenses denominated in foreign currencies are translated into U.S. dollars at the exchange rate in effect on the transaction date.
The effects of exchange rate fluctuations on investments are included with the net realized and unrealized gain (loss) on investment securities. Other foreign currency transactions resulting in realized and unrealized gain (loss) are disclosed separately.
Investment Transactions and Income. Security transactions are accounted for as of trade date. Gains and losses on securities sold are determined on the basis of identified cost. Dividend income is recorded on the ex-dividend date, except for certain dividends from foreign securities where the ex-dividend date may have passed, which are recorded as soon as the fund is informed of the ex-dividend date. Non-cash dividends included in dividend income, if any, are recorded at the fair market value of the securities received. Interest income is accrued as earned. Interest income includes coupon interest and amortization of premium and accretion of discount on debt securities, which is accrued using the interest method. Investment income is recorded net of foreign taxes withheld where recovery of such taxes is uncertain.
Expenses. Most expenses of the trust can be directly attributed to a fund. Expenses which cannot be directly attributed are apportioned among the funds in the trust.
Income Tax Information and Distributions to Shareholders. Each year the fund intends to qualify as a regulated investment company by distributing all of its taxable income and realized gains under Subchapter M of the Internal Revenue Code. As a result, no provision for income taxes is required in the accompanying financial statements. Foreign taxes are provided for based on each fund's understanding of the tax rules and rates that exist in the foreign markets in which it invests. Income dividends and capital gain distributions are declared separately for each class. Distributions are recorded on the ex-dividend date.
Annual Report
Notes to Financial Statements - continued
1. Significant Accounting Policies - continued
Income Tax Information and Distributions to Shareholders - continued
Income and capital gain distributions are determined in accordance with income tax regulations, which may differ from generally accepted accounting principles. Capital accounts within the financial statements are adjusted for permanent and temporary book and tax differences. These adjustments have no impact on net assets or the results of operations. Temporary differences will reverse in a subsequent period. These differences are primarily due to foreign currency transactions, passive foreign investment companies (PFIC), net operating losses, capital loss carryforwards and losses deferred due to wash sales.
The tax-basis components of distributable earnings and the federal tax cost as of period end were as follows:
Unrealized appreciation | $ 5,837,134 | | |
Unrealized depreciation | (347,049) | |
Net unrealized appreciation (depreciation) | 5,490,085 | |
Capital loss carryforward | (13,717,699) | |
| | |
Cost for federal income tax purposes | $ 10,100,520 | |
Short-Term Trading (Redemption) Fees. Shares purchased after March 31, 2004 and held in the fund less than 90 days will be subject to a short-term trading fee equal to 1.50% of the proceeds of the redeemed shares. The fee, which will be retained by the fund, is accounted for as an addition to paid in capital.
2. Operating Policies.
Repurchase Agreements. Fidelity Management & Research Company (FMR) has received an Exemptive Order from the Securities and Exchange Commission (the SEC) which permits the fund and other affiliated entities of FMR to transfer uninvested cash balances into joint trading accounts. These accounts are then invested in repurchase agreements that are collateralized by U.S. Treasury or Government obligations. The fund may also invest directly with institutions, in repurchase agreements that are collateralized by commercial paper obligations and corporate obligations. Collateral is held in segregated accounts with custodian banks and may be obtained in the event of a default of the counterparty. Collateral is marked-to-market daily and maintained at a value at least equal to the principal amount of the repurchase agreement (including accrued interest).
Annual Report
3. Purchases and Sales of Investments.
Information regarding purchases and sales of securities is included under the caption "Other Information" at the end of the fund's Schedule of Investments.
4. Fees and Other Transactions with Affiliates.
Management Fee. FMR and its affiliates provide the fund with investment management related services for which the fund pays a monthly management fee. The management fee is the sum of an individual fund fee rate that is based on an annual rate of .55% of the fund's average net assets and a group fee rate that averaged .28% during the period. The group fee rate is based upon the average net assets of all the mutual funds advised by FMR. The group fee rate decreases as assets under management increase and increases as assets under management decrease. For the period, the total annual management fee rate was .83% of the fund's average net assets.
Distribution and Service Plan. In accordance with Rule 12b-1 of the 1940 Act, the Fund has adopted separate Distribution and Service Plans for each class of shares. Certain classes pay Fidelity Distributors Corporation (FDC), an affiliate of FMR, separate Distribution and Service Fees, each of which is based on an annual percentage of each class' average net assets. Class A and Class T Plans also authorize the use of brokerage commissions to pay distribution expenses. This practice has been discontinued and no commissions incurred after June 30, 2003 have been used to pay distribution expenses. In addition, FDC may pay financial intermediaries for selling shares of the fund and providing shareholder support services. For the period, the Distribution and Service Fee rates, the total amounts paid to and retained by FDC and the amount of distribution expenses paid with brokerage commissions were as follows:
| Distribution
Fee | Service
Fee | Paid to
FDC | Retained
by FDC | Paid with
Commissions |
Class A | - | .25% | $ 27,617 | $ 8,896 | $ - |
Class T | .25% | .25% | 6,833 | 49 | - |
Class B | .75% | .25% | 11,052 | 8,305 | - |
Class C | .75% | .25% | 5,998 | 2,894 | - |
| | | $ 51,500 | $ 20,144 | $ - |
Sales Load. FDC receives a front-end sales charge of up to 5.75% for selling Class A shares, and 3.50% for selling Class T shares of the fund. FDC receives the proceeds of contingent deferred sales charges levied on Class A, Class T, Class B, and Class C redemptions. These charges depend on the holding period. The deferred sales charges range from 5% to 1% for Class B, 1% for Class C, and .25% for certain purchases of Class A and Class T shares.
Annual Report
Notes to Financial Statements - continued
4. Fees and Other Transactions with Affiliates - continued
Sales Load - continued
For the period, sales charge amounts retained by FDC were as follows:
| Retained
by FDC | |
Class A | $ 3,163 | |
Class T | 919 | |
Class B* | 7,246 | |
Class C* | 3,322 | |
| $ 14,650 | |
* When Class B and Class C shares are initially sold, FDC pays commissions from its own resources to financial intermediaries through
which the sales are made.
Transfer Agent Fees. Fidelity Investments Institutional Operations Company, Inc. (FIIOC), an affiliate of FMR, is the transfer, dividend disbursing and shareholder servicing agent (collectively referred to as the transfer agent) for each class of the fund. FIIOC receives account fees and asset-based fees that vary according to the account size and type of account of the shareholders of the respective classes of the fund. FIIOC pays for typesetting, printing and mailing of all shareholder reports, except proxy statements. For the period, the following amounts were paid to FIIOC:
| Amount | % of
Average
Net Assets |
Class A | $ 36,980 | .33 |
Class T | 13,247 | .97 |
Class B | 8,955 | .81 |
Class C | 3,317 | .55 |
Institutional Class | 5,971 | .84 |
| $ 68,470 | |
Accounting Fees. Fidelity Service Company, Inc. (FSC), an affiliate of FMR, maintains the fund's accounting records. The fee is based on the level of average net assets for the month plus out-of-pocket expenses.
Central Funds. The fund may invest in affiliated Central Funds managed by Fidelity Investments Money Management, Inc. (FIMM), an affiliate of FMR. The Central Funds are open-end investment companies available only to investment companies and other accounts managed by FMR and its affiliates. The Central Funds seek preservation of capital and current income and do not pay a management fee. Income distributions earned by the fund are recorded as income in the accompanying financial statements and totaled $3,348 for the period.
Annual Report
4. Fees and Other Transactions with Affiliates - continued
Brokerage Commissions. The fund placed a portion of its portfolio transactions with brokerage firms which are affiliates of the investment adviser. The commissions paid to these affiliated firms are shown under the caption "Other Information" at the end of the fund's Schedule of Investments.
5. Committed Line of Credit.
The fund participates with other funds managed by FMR in a $3.5 billion credit facility (the "line of credit") to be utilized for temporary or emergency purposes to fund shareholder redemptions or for other short-term liquidity purposes. The fund has agreed to pay commitment fees on its pro rata portion of the line of credit. During the period, there were no borrowings on this line of credit.
6. Expense Reductions.
FMR agreed to reimburse the classes of the fund to the extent operating expenses exceeded certain levels of average net assets as noted in the table below. Some expenses, for example interest expense, are excluded from this reimbursement.
| Expense
Limitations | Reimbursement
from adviser |
Class A | 2.00% | $ 94,189 |
Class T | 2.25% | 20,294 |
Class B | 2.75% | 14,627 |
Class C | 2.75% | 6,424 |
Institutional Class | 1.75% | 9,650 |
| | $ 145,184 |
7. Other Information.
At the end of the period, FMR or its affiliates were the owners of record of 22% of the total outstanding shares of the fund and one unaffiliated shareholder was the owner of record of 11% of the total outstanding shares of the fund.
Annual Report
Notes to Financial Statements - continued
8. Share Transactions.
Transactions for each class of shares were as follows:
| Shares | Dollars |
Years ended October 31, | 2003 | 2002 | 2003 | 2002 |
Class A | | | | |
Shares sold | 317,514 | 503,075 | $ 2,906,744 | $ 5,160,102 |
Shares redeemed | (535,903) | (937,603) | (4,813,185) | (9,464,840) |
Net increase (decrease) | (218,389) | (434,528) | $ (1,906,441) | $ (4,304,738) |
Class T | | | | |
Shares sold | 147,380 | 552,081 | $ 1,320,524 | $ 5,487,903 |
Shares redeemed | (338,262) | (301,065) | (3,064,555) | (3,081,636) |
Net increase (decrease) | (190,882) | 251,016 | $ (1,744,031) | $ 2,406,267 |
Class B | | | | |
Shares sold | 79,802 | 214,610 | $ 710,423 | $ 2,265,960 |
Shares redeemed | (118,643) | (109,289) | (1,044,873) | (1,066,238) |
Net increase (decrease) | (38,841) | 105,321 | $ (334,450) | $ 1,199,722 |
Class C | | | | |
Shares sold | 226,057 | 360,034 | $ 1,972,745 | $ 3,540,761 |
Shares redeemed | (267,241) | (288,759) | (2,338,950) | (2,784,028) |
Net increase (decrease) | (41,184) | 71,275 | $ (366,205) | $ 756,733 |
Institutional Class | | | | |
Shares sold | 614,424 | 868,246 | $ 5,805,729 | $ 8,515,527 |
Shares redeemed | (832,130) | (642,607) | (7,835,059) | (6,607,933) |
Net increase (decrease) | (217,706) | 225,639 | $ (2,029,330) | $ 1,907,594 |
Annual Report
Independent Auditors Report
To the Trustees of Fidelity Advisor Series VIII and the Shareholders of Fidelity
Advisor Korea Fund.
In our opinion, the accompanying statement of assets and liabilities, including the schedule of investments, and the related statements of operations and of changes in net assets and the financial highlights present fairly, in all material respects, the financial position of Fidelity Advisor Korea Fund (a fund of Fidelity Advisor Series VIII) at October 31, 2003 and the results of its operations, the changes in its net assets and the financial highlights for the periods indicated, in conformity with accounting principles generally accepted in the United States of America. These financial statements and financial highlights (hereafter referred to as "financial statements") are the responsibility of the Fidelity Advisor Korea Fund's management; our responsibility is to express an opinion on these financial statements based on our audits. We conducted our audits of these financial statements in accordance with auditing standards generally accepted in the United States of America which require that we plan and perform the audit to obtain reasonable assurance about whether the financial statements are free of material misstatement. An audit includes examining, on a test basis, evidence supporting the amounts and disclosures in the financial statements, assessing the accounting principles used and significant estimates made by management, and evaluating the overall financial statement presentation. We believe that our audits, which included confirmation of securities at October 31, 2003 by correspondence with the custodian and brokers, provide a reasonable basis for our opinion.
/s/PricewaterhouseCoopers LLP
PricewaterhouseCoopers LLP
Boston, Massachusetts
December 12, 2003
Annual Report
Trustees and Officers
The Trustees, Members of the Advisory Board, and executive officers of the trust and fund, as applicable, are listed below. The Board of Trustees governs the fund and is responsible for protecting the interests of shareholders. The Trustees are experienced executives who meet periodically throughout the year to oversee the fund's activities, review contractual arrangements with companies that provide services to the fund, and review the fund's performance. Except for William O. McCoy, each of the Trustees oversees 289 funds advised by FMR or an affiliate. Mr. McCoy oversees 291 funds advised by FMR or an affiliate.
The Trustees hold office without limit in time except that (a) any Trustee may resign; (b) any Trustee may be removed by written instrument, signed by at least two-thirds of the number of Trustees prior to such removal; (c) any Trustee who requests to be retired or who has become incapacitated by illness or injury may be retired by written instrument signed by a majority of the other Trustees; and (d) any Trustee may be removed at any special meeting of shareholders by a two-thirds vote of the outstanding voting securities of the trust. In any event, each non-interested Trustee shall retire not later than the last day of the calendar year in which his or her 72nd birthday occurs. The executive officers and Advisory Board Members hold office without limit in time, except that any officer and Advisory Board Member may resign or may be removed by a vote of a majority of the Trustees at any regular meeting or any special meeting of the Trustees. Except as indicated, each individual has held the office shown or other offices in the same company for the past five years.
The fund's Statement of Additional Information (SAI) includes more information about the Trustees. To request a free copy, call Fidelity at 1-877-208-0098.
Interested Trustees*:
Correspondence intended for each Trustee who is an "interested person" (as defined in the 1940 Act) may be sent to 82 Devonshire Street, Boston, Massachusetts 02109.
Name, Age; Principal Occupation |
Edward C. Johnson 3d (73)** |
| Year of Election or Appointment: 1983 Mr. Johnson is Chairman of the Board of Trustees. Mr. Johnson serves as Chief Executive Officer, Chairman, and a Director of FMR Corp.; a Director and Chairman of the Board and of the Executive Committee of FMR; Chairman and a Director of Fidelity Management & Research (Far East) Inc.; Chairman (1998) and a Director of Fidelity Investments Money Management, Inc.; and Chairman (2001) and a Director (2000) of FMR Co., Inc. |
Abigail P. Johnson (41)** |
| Year of Election or Appointment: 2001 Senior Vice President of Advisor Korea (2001). Ms. Johnson also serves as Senior Vice President of other Fidelity funds (2001). She is President and a Director of FMR (2001), Fidelity Investments Money Management, Inc. (2001), FMR Co., Inc. (2001), and a Director of FMR Corp. Previously, Ms. Johnson managed a number of Fidelity funds. |
Laura B. Cronin (49) |
| Year of Election or Appointment: 2003 Ms. Cronin is an Executive Vice President (2002) and Chief Financial Officer (2002) of FMR Corp. and is a member of the Fidelity Management Committee (2003). Previously, Ms. Cronin served as Vice President of Finance of FMR (1997-1999), and Chief Financial Officer of FMR (1999-2001), Fidelity Personal Investments (2001), and Fidelity Brokerage Company (2001-2002). |
Robert L. Reynolds (51) |
| Year of Election or Appointment: 2003 Mr. Reynolds is a Director (2003) and Chief Operating Officer (2002) of FMR Corp. and is the head of the Fidelity Management Committee (2003). He also serves on the Board at Fidelity Investments Canada, Ltd. (2000). Previously, Mr. Reynolds served as President of Fidelity Investments Institutional Retirement Group (1996-2000). |
* Trustees have been determined to be "Interested Trustees" by virtue of, among other things, their affiliation with the trust or various entities under common control with FMR.
** Edward C. Johnson 3d, Trustee, is Abigail P. Johnson's father.
Annual Report
Non-Interested Trustees:
Correspondence intended for each non-interested Trustee (that is, the Trustees other than the Interested Trustees) may be sent to Fidelity Investments, P.O. Box 55235, Boston, Massachusetts 02205-5235.
Name, Age; Principal Occupation |
J. Michael Cook (61) |
| Year of Election or Appointment: 2001 Prior to Mr. Cook's retirement in May 1999, he served as Chairman and Chief Executive Officer of Deloitte & Touche LLP (accounting/consulting), Chairman of the Deloitte & Touche Foundation, and a member of the Board of Deloitte Touche Tohmatsu. He currently serves as a Director of Comcast (telecommunications, 2002), International Flavors & Fragrances, Inc. (2000), Rockwell Automation (2000) and The Dow Chemical Company (2000). He is a Member of the Diversity Advisory Council of Marakon (2003) and the Advisory Board of the Directorship Search Group, Chairman Emeritus of the Board of Catalyst (a leading organization for the advancement of women in business), and is Chairman of the Accountability Advisory Council to the Comptroller General of the United States. He also serves as a Member of the Advisory Board of the Graduate School of Business of the University of Florida, his alma mater. |
Ralph F. Cox (71) |
| Year of Election or Appointment: 1991 Mr. Cox is President of RABAR Enterprises (management consulting for the petroleum industry). Prior to February 1994, he was President of Greenhill Petroleum Corporation (petroleum exploration and production). Until March 1990, Mr. Cox was President and Chief Operating Officer of Union Pacific Resources Company (exploration and production). He is a Director of CH2M Hill Companies (engineering), and Abraxas Petroleum (petroleum exploration and production, 1999). In addition, he is a member of advisory boards of Texas A&M University and the University of Texas at Austin. |
Phyllis Burke Davis (71) |
| Year of Election or Appointment: 1992 Mrs. Davis is retired from Avon Products, Inc. (consumer products) where she held various positions including Senior Vice President of Corporate Affairs and Group Vice President of U.S. product marketing, sales, distribution, and manufacturing. Mrs. Davis is a member of the Board of Directors of the Southampton Hospital in Southampton, N.Y. (1998). Previously, she served as a Director of BellSouth Corporation (telecommunications), Eaton Corporation (diversified industrial), the TJX Companies, Inc. (retail stores), Hallmark Cards, Inc., and Nabisco Brands, Inc. |
Robert M. Gates (60) |
| Year of Election or Appointment: 1997 Dr. Gates is President of Texas A&M University (2002). He was Director of the Central Intelligence Agency (CIA) from 1991 to 1993. From 1989 to 1991, Dr. Gates served as Assistant to the President of the United States and Deputy National Security Advisor. Dr. Gates is a Director of NACCO Industries, Inc. (mining and manufacturing), and Parker Drilling Co., Inc. (drilling and rental tools for the energy industry, 2001). He also serves as a member of the Advisory Board of VoteHere.net (secure internet voting, 2001). Previously, Dr. Gates served as a Director of LucasVarity PLC (automotive components and diesel engines), a Director of TRW Inc. (automotive, space, defense, and information technology), and Dean of the George Bush School of Government and Public Service at Texas A&M University (1999-2001). Dr. Gates also is a Trustee of the Forum for International Policy. |
Donald J. Kirk (70) |
| Year of Election or Appointment: 1987 Mr. Kirk is a Governor of the American Stock Exchange (2001), a Trustee and former Chairman of the Board of Trustees of the Greenwich Hospital Association, a Director of the Yale-New Haven Health Services Corp. (1998), and a Director Emeritus and former Chairman of the Board of Directors of National Arts Strategies Inc. Mr. Kirk was an Executive-in-Residence (1995-2000) and a Professor (1987-1995) at Columbia University Graduate School of Business. Prior to 1987, he was Chairman of the Financial Accounting Standards Board. Previously, Mr. Kirk served as a Governor of the National Association of Securities Dealers, Inc. (1996-2002), a member and Vice Chairman of the Public Oversight Board of the American Institute of Certified Public Accountants' SEC Practice Section (1995-2002), a Director of General Re Corporation (reinsurance, 1987-1998) and as a Director of Valuation Research Corp. (appraisals and valuations). |
Marie L. Knowles (57) |
| Year of Election or Appointment: 2001 Prior to Ms. Knowles' retirement in June 2000, she served as Executive Vice President and Chief Financial Officer of Atlantic Richfield Company (ARCO) (diversified energy, 1996-2000). From 1993 to 1996, she was a Senior Vice President of ARCO and President of ARCO Transportation Company. She served as a Director of ARCO from 1996 to 1998. She currently serves as a Director of Phelps Dodge Corporation (copper mining and manufacturing), URS Corporation (multidisciplinary engineering, 1999), and McKesson Corporation (healthcare service, 2002). Ms. Knowles is a Trustee of the Brookings Institution and the Catalina Island Conservancy and also serves as a member of the Advisory Board for the School of Engineering of the University of Southern California. |
Ned C. Lautenbach (59) |
| Year of Election or Appointment: 2000 Mr. Lautenbach has been a partner of Clayton, Dubilier & Rice, Inc. (private equity investment firm) since September 1998. Previously, Mr. Lautenbach was with the International Business Machines Corporation (IBM) from 1968 until his retirement in 1998. He was most recently Senior Vice President and Group Executive of Worldwide Sales and Services. From 1993 to 1995, he was Chairman of IBM World Trade Corporation, and from 1994 to 1998 was a member of IBM's Corporate Executive Committee. Mr. Lautenbach serves as Chairman and as a Director (1998) of Acterna Corporation (communications test equipment). He is also Co-Chairman of Covansys, Inc. (global provider of business and technology solutions, 2000). In addition, he is a Director of Eaton Corporation (diversified industrial) and the Philharmonic Center for the Arts in Naples, Florida (1999). He also is a member of the Council on Foreign Relations. |
Marvin L. Mann (70) |
| Year of Election or Appointment: 1993 Mr. Mann is Chairman of the non-interested Trustees (2001). He is Chairman Emeritus of Lexmark International, Inc. (computer peripherals) where he served as CEO until April 1998 and retired as Chairman May 1999, and remains a member of the Board. Prior to 1991, he held the positions of Vice President of International Business Machines Corporation (IBM) and President and General Manager of various IBM divisions and subsidiaries. Mr. Mann is a Board member of Imation Corp. (imaging and information storage) and Acterna Corporation (communications test equipment, 1999). He is also a member of the Director Services Committee of the Investment Company Institute. In addition, Mr. Mann is a member of the President's Cabinet at the University of Alabama and the Board of Visitors of the Culverhouse College of Commerce and Business Administration at the University of Alabama. |
William O. McCoy (70) |
| Year of Election or Appointment: 1997 Prior to his retirement in December 1994, Mr. McCoy was Vice Chairman of the Board of BellSouth Corporation (telecommunications) and President of BellSouth Enterprises. He is currently a Director of Liberty Corporation (holding company), Duke Realty Corporation (real estate), Progress Energy, Inc. (electric utility), and Acterna Corporation (communications test equipment, 1999). He is also a partner of Franklin Street Partners (private investment management firm) and a member of the Research Triangle Foundation Board. In addition, Mr. McCoy served as the Interim Chancellor (1999-2000) and a member of the Board of Visitors (1994-1998) for the University of North Carolina at Chapel Hill and currently serves on the Board of Directors of the University of North Carolina Health Care System and the Board of Visitors of the Kenan-Flagler Business School (University of North Carolina at Chapel Hill). He also served as Vice President of Finance for the University of North Carolina (16-school system, 1995-1998). |
William S. Stavropoulos (64) |
| Year of Election or Appointment: 2001 Mr. Stavropoulos is Chairman of the Board, President and CEO (2002), and Chairman of the Executive Committee (2000) and a Director of The Dow Chemical Company. Since joining The Dow Chemical Company in 1967, Mr. Stavropoulos served in numerous senior management positions, including President (1993-2000) and Chief Executive Officer (1995-2000). Currently, he is a Director of NCR Corporation (data warehousing and technology solutions), BellSouth Corporation (telecommunications), Chemical Financial Corporation, and Maersk Inc. (industrial conglomerate, 2002). He also serves as a member of the Board of Trustees of the American Enterprise Institute for Public Policy Research. In addition, Mr. Stavropoulos is a member of The Business Council, J.P. Morgan International Council, World Business Council for Sustainable Development, and the University of Notre Dame Advisory Council for the College of Science. |
Annual Report
Trustees and Officers - continued
Advisory Board Members and Executive Officers:
Correspondence intended for Dr. Heilmeier may be sent to Fidelity Investments, P.O. Box 55235, Boston, Massachusetts 02205-5235. Correspondence intended for each executive officer and Mr. Lynch may be sent to 82 Devonshire Street, Boston, Massachusetts 02109.
Name, Age; Principal Occupation |
George H. Heilmeier (67) |
| Year of Election or Appointment: 2003 Member of the Advisory Board of Fidelity Advisor Series VIII. Dr. Heilmeier is Chairman Emeritus of Telcordia Technologies (communication software and systems), where prior to his retirement, he served as company Chairman and Chief Executive Officer. He currently serves on the Boards of Directors of The Mitre Corporation (systems engineering and information technology support for the government), INET Technologies Inc. (telecommunications network surveillance, 2001) and Teletech Holdings (customer management services, 1998). He is Chairman of the General Motors Technology Advisory Committee and a Life Fellow of the IEEE (2000). Dr. Heilmeier is a member of the Defense Science Board and the National Security Agency Advisory Board. He is also a member of the National Academy of Engineering, the American Academy of Arts and Sciences and The Board of Overseers of the School of Engineering and Applied Science of the University of Pennsylvania. Previously, Dr. Heilmeier served as a Director of TRW Inc. (automotive, space, defense, and information technology, 1992-2002) and Compaq (1994-2002). |
Peter S. Lynch (60) |
| Year of Election or Appointment: 2003 Member of the Advisory Board of Fidelity Advisor Series VIII. Vice Chairman and a Director of FMR, and Vice Chairman (2001) and a Director (2000) of FMR Co., Inc. Previously, Mr. Lynch served as a Trustee of the Fidelity funds (1990-2003). Prior to May 31, 1990, he was a Director of FMR and Executive Vice President of FMR (a position he held until March 31, 1991), Vice President of Fidelity® Magellan® Fund and FMR Growth Group Leader, and Managing Director of FMR Corp. Mr. Lynch was also Vice President of Fidelity Investments Corporate Services. In addition, he serves as a Trustee of Boston College, Massachusetts Eye & Ear Infirmary, Historic Deerfield, John F. Kennedy Library, and the Museum of Fine Arts of Boston. |
Philip L. Bullen (44) |
| Year of Election or Appointment: 2001 Vice President of Advisor Korea. Mr. Bullen also serves as Vice President of certain Equity Funds (2001) and certain High Income Funds (2001). He is Senior Vice President of FMR (2001) and FMR Co., Inc. (2001), President and a Director of Fidelity Management & Research (Far East) Inc. (2001), President and a Director of Fidelity Management & Research (U.K.) Inc. (2002), and a Director of Strategic Advisers, Inc. (2002). Before joining Fidelity Investments, Mr. Bullen was President and Chief Investment Officer of Santander Global Advisors (1997-2000) and President and Chief Executive Officer of Boston's Baring Asset Management Inc. (1994-1997). |
Eric D. Roiter (54) |
| Year of Election or Appointment: 1998 Secretary of Advisor Korea. He also serves as Secretary of other Fidelity funds (1998); Vice President, General Counsel, and Clerk of FMR Co., Inc. (2001) and FMR (1998); Vice President and Clerk of FDC (1998); Assistant Clerk of Fidelity Management & Research (U.K.) Inc. (2001) and Fidelity Management & Research (Far East) Inc. (2001); and Assistant Secretary of Fidelity Investments Money Management Inc. (2001). Prior to joining Fidelity, Mr. Roiter was with the law firm of Debevoise & Plimpton, as an associate (1981-1984) and as a partner (1985-1997), and served as an Assistant General Counsel of the U.S. Securities and Exchange Commission (1979-1981). Mr. Roiter is an Adjunct Member, Faculty of Law, at Boston College Law School (2003). |
Stuart Fross (44) |
| Year of Election or Appointment: 2003 Assistant Secretary of Advisor Korea. Mr. Fross also serves as Assistant Secretary of other Fidelity funds (2003) and is an employee of FMR. |
Maria F. Dwyer (44) |
| Year of Election or Appointment: 2002 President and Treasurer of Advisor Korea. Ms. Dwyer also serves as President and Treasurer of other Fidelity funds (2002) and is a Vice President (1999) and an employee (1996) of FMR. Prior to joining Fidelity, Ms. Dwyer served as Director of Compliance for MFS Investment Management. |
Timothy F. Hayes (52) |
| Year of Election or Appointment: 2002 Chief Financial Officer of Advisor Korea. Mr. Hayes also serves as Chief Financial Officer of other Fidelity funds (2002). Recently he was appointed President of Fidelity Service Company (2003) where he also serves as a Director. Mr. Hayes also serves as President of Fidelity Investments Operations Group (FIOG, 2002), which includes Fidelity Pricing and Cash Management Services Group (FPCMS), where he was appointed President in 1998. Previously, Mr. Hayes served as Chief Financial Officer of Fidelity Investments Corporate Systems and Service Group (1998) and Fidelity Systems Company (1997-1998). |
John R. Hebble (45) |
| Year of Election or Appointment: 2003 Deputy Treasurer of Advisor Korea. Mr. Hebble also serves as Deputy Treasurer of other Fidelity funds (2003), and is an employee of FMR. Before joining Fidelity Investments, Mr. Hebble worked at Deutsche Asset Management where he served as Director of Fund Accounting (2002-2003) and Assistant Treasurer of the Scudder Funds (1998-2003). |
John H. Costello (57) |
| Year of Election or Appointment: 1994 Assistant Treasurer of Advisor Korea. Mr. Costello also serves as Assistant Treasurer of other Fidelity funds and is an employee of FMR. |
Francis V. Knox, Jr. (56) |
| Year of Election or Appointment: 2002 Assistant Treasurer of Advisor Korea. Mr. Knox also serves as Assistant Treasurer of other Fidelity funds (2002), and is a Vice President and an employee of FMR. Previously, Mr. Knox served as Vice President of Investment & Advisor Compliance (1990-2001), and Compliance Officer of Fidelity Management & Research (U.K.) Inc. (1992-2002), Fidelity Management & Research (Far East) Inc. (1991-2002), and FMR Corp. (1995-2002). |
Mark Osterheld (48) |
| Year of Election or Appointment: 2002 Assistant Treasurer of Advisor Korea. Mr. Osterheld also serves as Assistant Treasurer of other Fidelity funds (2002) and is an employee of FMR. |
Thomas J. Simpson (45) |
| Year of Election or Appointment: 2000 Assistant Treasurer of Advisor Korea. Mr. Simpson is Assistant Treasurer of other Fidelity funds (2000) and an employee of FMR (1996). Prior to joining FMR, Mr. Simpson was Vice President and Fund Controller of Liberty Investment Services (1987-1995). |
Annual Report
Annual Report
Investment Adviser
Fidelity Management & Research Company
Boston, MA
Investment Sub-Advisers
FMR Co., Inc.
Fidelity Management & Research
(U.K.) Inc.
Fidelity Management & Research
(Far East) Inc.
Fidelity International
Investment Advisors
Fidelity Investments Japan Limited
Fidelity International Investment Advisors (U.K.) Limited
General Distributor
Fidelity Distributors Corporation
Boston, MA
Transfer and Shareholder
Servicing Agents
Fidelity Investments Institutional Operations Company, Inc.
Boston, MA
Custodian
JPMorgan Chase Bank
New York, NY
Annual Report
Fidelity Advisor Aggressive Growth Fund |
Fidelity Advisor Asset Allocation Fund |
Fidelity Advisor Balanced Fund |
Fidelity Advisor Biotechnology Fund |
Fidelity Advisor California Municipal Income Fund |
Fidelity Advisor Consumer Industries Fund |
Fidelity Advisor Cyclical Industries Fund |
Fidelity Advisor Developing Communications Fund |
Fidelity Advisor Diversified International Fund |
Fidelity Advisor Dividend Growth Fund |
Fidelity Advisor Dynamic Capital Appreciation Fund |
Fidelity Advisor Electronics Fund |
Fidelity Advisor Emerging Asia Fund |
Fidelity Advisor Emerging Markets Income Fund |
Fidelity Advisor Equity Growth Fund |
Fidelity Advisor Equity Income Fund |
Fidelity Advisor Equity Value Fund |
Fidelity Advisor Europe Capital Appreciation Fund |
Fidelity Advisor Fifty Fund |
Fidelity Advisor Financial Services Fund |
Fidelity Advisor Floating Rate High Income Fund |
Fidelity Advisor Freedom Income FundSM |
Fidelity Advisor Freedom 2010 FundSM |
Fidelity Advisor Freedom 2020 FundSM |
Fidelity Advisor Freedom 2030 FundSM |
Fidelity Advisor Freedom 2040 FundSM |
Fidelity Advisor Global Equity Fund |
Fidelity Advisor Government Investment Fund |
Fidelity Advisor Growth & Income Fund |
Fidelity Advisor Growth Opportunities |
Fidelity Advisor Health Care Fund |
Fidelity Advisor High Income Advantage Fund |
Fidelity Advisor High Income Fund |
Fidelity Advisor Inflation-Protected Bond Fund |
Fidelity Advisor Intermediate Bond Fund |
Fidelity Advisor International Capital Appreciation Fund |
Fidelity Advisor International Small Cap Fund |
Fidelity Advisor Investment Grade Bond Fund |
Fidelity Advisor Japan Fund |
Fidelity Advisor Korea Fund |
Fidelity Advisor Large Cap Fund |
Fidelity Advisor Latin America Fund |
Fidelity Advisor Leveraged Company Stock Fund |
Fidelity Advisor Mid Cap Fund |
Fidelity Advisor Mortgage Securities Fund |
Fidelity Advisor Municipal Income Fund |
Fidelity Advisor Natural Resources Fund |
Fidelity Advisor New Insights Fund |
Fidelity Advisor New York Municipal Income Fund |
Fidelity Advisor Overseas Fund |
Fidelity Advisor Real Estate Fund |
Fidelity Advisor Short Fixed-Income Fund |
Fidelity Advisor Short Intermediate Municipal Income Fund |
Fidelity Advisor Small Cap Fund |
Fidelity Advisor Strategic Growth Fund |
Fidelity Advisor Strategic Income Fund |
Fidelity Advisor Tax Managed
Stock Fund |
Fidelity Advisor Technology Fund |
Fidelity Advisor Telecommunications & Utilities Growth Fund |
Fidelity Advisor Value Leaders Fund |
Fidelity Advisor Value Strategies Fund |
Prime Fund |
Tax-Exempt Fund |
Treasury Fund |
(Fidelity Investment logo)(registered trademark)
Corporate Headquarters
82 Devonshire St., Boston, MA 02109
www.fidelity.com
AKORI-UANN-1203
1.784759.100
Fidelity® Advisor
Latin America
Fund - Class A, Class T, Class B
and Class C
Annual Report
October 31, 2003
(2_fidelity_logos) (Registered_Trademark)
Contents
Chairman's Message | <Click Here> | Ned Johnson's message to shareholders. |
Performance | <Click Here> | How the fund has done over time. |
Management's Discussion | <Click Here> | The manager's review of fund performance, strategy and outlook. |
Investment Changes | <Click Here> | A summary of major shifts in the fund's investments over the past six months. |
Investments | <Click Here> | A complete list of the fund's investments with their market values. |
Financial Statements | <Click Here> | Statements of assets and liabilities, operations, and changes in net assets,
as well as financial highlights. |
Notes | <Click Here> | Notes to the financial statements. |
Auditors' Opinion | <Click Here> | |
Trustees and Officers | <Click Here> | |
Distributions | <Click Here> | |
For a free copy of the fund's proxy voting guidelines call 1-877-208-0098 or visit the Securities and Exchange Commission (SEC)'s web site at www.sec.gov.
Standard & Poor's, S&P and S&P 500 are registered service marks of The McGraw-Hill Companies, Inc. and have been licensed for use by Fidelity Distributors Corporation.
Other third party marks appearing herein are the property of their respective owners.
All other marks appearing herein are registered or unregistered trademarks or service marks of FMR Corp. or an affiliated company.
(Recycle graphic) This report is printed on recycled paper using soy-based inks.
This report and the financial statements contained herein are submitted for the general information of the shareholders of the fund. This report is not authorized for distribution to prospective investors in the fund unless preceded or accompanied by an effective prospectus.
Mutual fund shares are not deposits or obligations of, or guaranteed by, any depository institution. Shares are not insured by the FDIC, Federal Reserve Board or any other agency, and are subject to investment risks, including possible loss of principal amount invested.
Neither the fund nor Fidelity Distributors Corporation is a bank.
For more information on any Fidelity Advisor fund, including charges and expenses, contact your investment professional for a free prospectus. Read it carefully before you invest or send money.
Annual Report
Chairman's Message
(photo_of_Edward_C_Johnson_3d)
Dear Shareholder:
Many of you have read or heard news stories recently that were critical of mutual funds and made allegations that the mutual fund industry has been less than forthright. I find these reports unsettling and not necessarily an accurate picture of the overall industry, and I would like you to know where we at Fidelity stand.
With specific regard to allegations that certain mutual fund companies were violating the Securities and Exchange Commission's forward pricing rules or were involved in so-called "market timing" activities, I want to say two things:
First, Fidelity does not have agreements that permit customers who buy fund shares after 4 p.m. to obtain the 4 p.m. price. This is not to say that someone could not deceive the company through fraudulent acts. But I underscore that we have no so-called "agreements" which would permit this illegal practice.
Second, Fidelity has been on record for years opposing predatory short-term trading which adversely affects other shareholders in a mutual fund. In fact, in the 1980s, we began charging a fee - which is returned to the fund and, therefore, to investors - to discourage this activity. What's more, several years ago we took the industry lead in developing a Fair Value Pricing Policy to prevent market timing on foreign securities in our funds. It is reasonable to assume that another structure can be developed that would alter the system to make it much more difficult for predatory traders to operate. This, however, will only be achieved through close cooperation among regulators, legislators and the industry.
Certainly no industry is perfect, and there have been instances of unethical and illegal activity from time to time within the mutual fund industry. When this occurs, confessed or convicted offenders should be dealt with appropriately. Clearly, every system can be improved. We applaud well thought out improvements by regulators, legislators and industry representatives that achieve the common goal of building and protecting the value of investors' holdings. But we remain concerned about the risk of over-regulation and the quick application of simplistic solutions to intricate problems.
For more than 57 years, Fidelity Investments has worked very hard to improve its products and service to justify your trust. When our family founded this company in 1946, we had only a few hundred customers. Many of them were family and friends. Today, we serve more than 18 million customers including individual investors and participants in retirement plans across America.
Let me close by saying that we do not take your trust in us for granted, and we realize that we must always work to improve all aspects of our service to you. In turn, we urge you to continue your active participation with your financial matters, so that your interests can be well served.
Annual Report
Best regards,
/s/Edward C. Johnson 3d
Edward C. Johnson 3d
Annual Report
Performance: The Bottom Line
Average annual total return reflects the change in the value of an investment, assuming reinvestment of the class' dividend income and capital gains (the profits earned upon the sale of securities that have grown in value) and assuming a constant rate of performance each year. During periods of reimbursement by Fidelity, a fund's total return will be greater than it would be had the reimbursement not occurred. The $10,000 table and the fund's returns do not reflect the deduction of taxes that a shareholder would pay on fund distributions or the redemption of fund shares. How a fund did yesterday is no guarantee of how it will do tomorrow. Returns may reflect the conversion of Class B shares to Class A shares after a maximum of seven years.
Average Annual Total Returns
Periods ended October 31, 2003 | | Past 1
year | Life of
fundA |
Class A (incl. 5.75% sales charge) | | 43.53% | 4.01% |
Class T (incl. 3.50% sales charge) | | 46.74% | 4.30% |
Class B (incl. contingent deferred sales charge) B | | 46.35% | 4.23% |
Class C (incl. contingent deferred sales charge) C | | 50.23% | 4.53% |
A From December 21, 1998.
B Class B shares' contingent deferred sales charges included in the past one year and life of fund total return figures are 5% and 2%, respectively.
C Class C shares' contingent deferred sales charge included in the past one year, and life of fund total return figures are 1%, and 0%, respectively.
Annual Report
$10,000 Over Life of Fund
Let's say hypothetically that $10,000 was invested in Fidelity Advisor Latin America Fund - - Class T on December 21, 1998, when the fund started, and the current 3.50% sales charge was paid. The chart shows how the value of your investment would have grown, and also shows how the MSCI EMF - Latin America Index did over the same period.

Annual Report
Management's Discussion of Fund Performance
Comments from Claudio Brocado, Portfolio Manager of Fidelity® Advisor Latin America Fund
Mirroring the U.S. rally, most international stock markets rebounded sharply during the 12-month period ending October 31, 2003. Encouraged by improved corporate earnings, favorable interest rates and the easing of geopolitical tensions, the Morgan Stanley Capital InternationalSM Europe, Australasia, Far East (MSCI® EAFE®) Index - a proxy for stock markets outside the United States and Canada - gained 27.39% during the past year. From a regional perspective, all 16 countries in the MSCI Europe index - which gained 24.56% - - had double-digit advances. Spain, Denmark and Sweden were among the region's best performers. In Japan, increased capital spending, exports and machinery orders helped the Tokyo Stock Exchange Stock Price Index (TOPIX) advance 36.39%. Following the SARS epidemic, other Asian markets also rebounded. For instance, the Hong Kong market, as measured by the Hang Seng Index, gained 34.51%. Emerging markets also fared well, particularly Latin America. The MSCI Emerging Markets Free-Latin America Index rose 59.75%. Canadian equities, as measured by the S&P/TSX Composite Index, also posted an impressive annual gain, advancing 50.66%.
For the 12 months that ended October 31, 2003, the fund's Class A, Class T, Class B and Class C shares returned 52.29%, 52.06%, 51.35% and 51.23%, respectively. The Morgan Stanley Capital International Emerging Markets Free-Latin America Index gained 59.75% and the LipperSM Latin American Funds Average gained 49.10% for the same time period. The fund was aided by overweighting Brazil relative to other Latin American markets, as Brazil outperformed expectations on the basis of a recovering currency, declining interest rates, and implementation of positive policies and reforms by newly elected President Lula da Silva. Strong stock selection, including positions in Brazilian companies such as Telebras, Petrobras and Usiminas, as well as America Movil in Mexico, moved the fund ahead of its peer group. The fund lagged the index partly because we didn't own some illiquid, infrequently traded stocks that are held in the index. Also, underweighting Chile, which had surprisingly strong performance, held back returns. Underweighting Vale do Rio (CVRD) and Copec, both outperforming stocks with high valuations, as well as overweighting Telefonos de Mexico (Telmex), a defensive stock that lagged other, higher-growth stocks, also hurt.
The views expressed in this statement reflect those of the portfolio manager only through the end of the period of the report as stated on the cover and do not necessarily represent the views of Fidelity or any other person in the Fidelity organization. Any such views are subject to change at any time based upon market or other conditions and Fidelity disclaims any responsibility to update such views. These views may not be relied on as investment advice and, because investment decisions for a Fidelity fund are based on numerous factors, may not be relied on as an indication of trading intent on behalf of any Fidelity fund
Annual Report
Investment Changes
Top Five Stocks as of October 31, 2003 |
| % of fund's
net assets | % of fund's net assets
6 months ago |
Telefonos de Mexico SA de CV sponsored ADR (Mexico, Diversified Telecommunication Services) | 9.9 | 11.2 |
America Movil SA de CV sponsored ADR (Mexico, Wireless Telecommunication Services) | 9.1 | 7.6 |
Petroleo Brasileiro SA Petrobras (Brazil, Oil & Gas) | 8.9 | 6.7 |
Grupo Televisa SA de CV sponsored ADR (Mexico, Media) | 5.2 | 4.7 |
Cemex SA de CV sponsored ADR (Mexico, Construction Materials) | 5.1 | 4.0 |
| 38.2 | |
Top Five Market Sectors as of October 31, 2003 |
| % of fund's
net assets | % of fund's net assets
6 months ago |
Telecommunication Services | 29.8 | 25.6 |
Materials | 18.0 | 15.9 |
Consumer Staples | 13.0 | 11.5 |
Energy | 12.8 | 12.1 |
Financials | 11.2 | 14.0 |
Top Five Countries as of October 31, 2003 |
(excluding cash equivalents) | % of fund's
net assets | % of fund's net assets
6 months ago |
Brazil | 50.8 | 44.3 |
Mexico | 41.4 | 41.4 |
Chile | 2.3 | 2.1 |
United States of America | 1.7 | 0.0 |
Luxembourg | 1.1 | 1.1 |
Percentages are adjusted for the effect of open futures contracts, if applicable. |
Asset Allocation (% of fund's net assets) |
As of October 31, 2003 | As of April 30, 2003 |
| Stocks 98.3% | | | Stocks 93.0% | |
 | Short-Term
Investments and
Net Other Assets 1.7% | | | Short-Term
Investments and
Net Other Assets 7.0% | |

Annual Report
Investments October 31, 2003
Showing Percentage of Net Assets
Common Stocks - 97.1% |
| Shares | | Value (Note 1) |
Argentina - 0.7% |
Inversiones y Representacions SA sponsored GDR (a) | 500 | | $ 5,200 |
Petrobras Energia Participaciones SA sponsored ADR (a) | 3,577 | | 32,908 |
TOTAL ARGENTINA | | 38,108 |
Brazil - 49.6% |
Aracruz Celulose SA sponsored ADR | 1,555 | | 43,696 |
Banco Bradesco SA: | | | |
(PN) | 27,074,800 | | 114,382 |
sponsored ADR | 200 | | 4,198 |
Banco Itau Holding Financeira SA: | | | |
(PN) | 1,955,200 | | 160,290 |
sponsored ADR | 100 | | 4,085 |
Brasil Telecom Participacoes SA sponsored ADR | 2,000 | | 73,040 |
Caemi Mineracao E Metalurgia (a) | 200,500 | | 58,684 |
Centrais Electricas Brasileiras (Electrobras) SA (PN-B) | 7,335,900 | | 96,353 |
Companhia Brasileira de Distribuicao Grupo Pao de Acucar sponsored ADR | 3,333 | | 67,093 |
Companhia de Bebidas das Americas (AmBev) sponsored ADR | 8,300 | | 175,960 |
Companhia Energetica Minas Gerais (CEMIG) (PN) | 3,682,179 | | 54,568 |
Companhia Paranaense de Energia-Copel sponsored ADR (a) | 4,200 | | 15,498 |
Companhia Vale do Rio Doce: | | | |
(PN-A) | 2,000 | | 80,098 |
sponsored: | | | |
ADR | 1,200 | | 54,900 |
ADR (non-vtg.) | 2,800 | | 113,120 |
Embraer - Empresa Brasileira de Aeronautica SA sponsored ADR | 4,640 | | 120,408 |
Gerdau SA sponsored ADR | 4,290 | | 62,462 |
Petroleo Brasileiro SA Petrobras: | | | |
(PN) | 5,100 | | 112,088 |
sponsored: | | | |
ADR | 4,700 | | 110,450 |
ADR (non-vtg.) | 15,700 | | 341,632 |
Siderurgica Nacional Compania ADR | 1,800 | | 74,250 |
Tele Norte Leste Participacoes SA ADR | 11,102 | | 157,315 |
Telebras sponsored ADR | 4,600 | | 158,424 |
Uniao de Bancos Brasileiros SA (Unibanco) GDR | 5,000 | | 110,550 |
Usinas Siderurgicas de Minas Gerais SA (Usiminas) (PN-A) | 14,600 | | 116,841 |
Votorantim Celulose e Papel SA: | | | |
(PN) | 584,400 | | 31,804 |
sponsored ADR | 100 | | 2,738 |
TOTAL BRAZIL | | 2,514,927 |
Common Stocks - continued |
| Shares | | Value (Note 1) |
Chile - 2.3% |
Banco Santander Chile sponsored ADR | 1,656 | | $ 39,347 |
Enersis SA sponsored ADR | 9,000 | | 62,280 |
Vina Concha y Toro SA sponsored ADR | 291 | | 14,041 |
TOTAL CHILE | | 115,668 |
Luxembourg - 1.1% |
Tenaris SA sponsored ADR | 1,984 | | 53,965 |
Mexico - 41.4% |
America Movil SA de CV sponsored ADR | 19,400 | | 461,720 |
Cemex SA de CV sponsored ADR | 10,863 | | 260,712 |
Consorcio ARA SA de CV (a) | 11,900 | | 32,551 |
Fomento Economico Mexicano SA de CV sponsored ADR | 3,186 | | 113,804 |
Grupo Bimbo SA de CV Series A | 9,900 | | 15,409 |
Grupo Financiero BBVA Bancomer SA Series B (a) | 149,200 | | 126,607 |
Grupo Modelo SA de CV Series C | 30,000 | | 75,990 |
Grupo Televisa SA de CV sponsored ADR | 6,757 | | 261,834 |
Industrias Penoles SA de CV | 4,500 | | 12,763 |
Telefonos de Mexico SA de CV sponsored ADR | 15,662 | | 503,533 |
TV Azteca SA de CV sponsored ADR | 5,200 | | 42,068 |
Wal-Mart de Mexico SA de CV Series C | 73,405 | | 191,399 |
TOTAL MEXICO | | 2,098,390 |
United States of America - 1.7% |
NII Holdings, Inc. Class B (a) | 1,100 | | 84,799 |
Venezuela - 0.3% |
Compania Anonima Nacional Telefono de Venezuela sponsored ADR | 1,200 | | 17,952 |
TOTAL COMMON STOCKS (Cost $4,062,634) | 4,923,809 |
Nonconvertible Preferred Stocks - 1.2% |
| | | |
Brazil - 1.2% |
Telemar Norte Leste SA Series A
(Cost $62,084) | 3,037,300 | | 61,996 |
Money Market Funds - 3.0% |
| Shares | | Value (Note 1) |
Fidelity Cash Central Fund, 1.07% (b)
(Cost $152,081) | 152,081 | | $ 152,081 |
TOTAL INVESTMENT PORTFOLIO - 101.3% (Cost $4,276,799) | | 5,137,886 |
NET OTHER ASSETS - (1.3)% | | (66,877) |
NET ASSETS - 100% | $ 5,071,009 |
Legend |
(a) Non-income producing |
(b) The rate quoted is the annualized seven-day yield of the fund at period end. A complete listing of the fund's holdings as of its most recent fiscal year end is available upon request. |
Other Information |
Purchases and sales of securities, other than short-term securities, aggregated $2,880,051 and $2,479,725, respectively. |
The fund placed a portion of its portfolio transactions with brokerage firms which are affiliates of the investment adviser. The commissions paid to these affiliated firms were $404 for the period. |
Income Tax Information |
At October 31, 2003, the fund had a capital loss carryforward of approximately $919,000 of which $578,000 and $341,000 will expire on October 31, 2009 and 2010, respectively. |
See accompanying notes which are an integral part of the financial statements.
Annual Report
Financial Statements
Statement of Assets and Liabilities
| October 31, 2003 |
| | |
Assets | | |
Investment in securities, at value (cost $4,276,799) - See accompanying schedule | | $ 5,137,886 |
Receivable for fund shares sold | | 29,959 |
Dividends receivable | | 11,069 |
Interest receivable | | 102 |
Prepaid expenses | | 22 |
Receivable from investment adviser for expense reductions | | 8,935 |
Total assets | | 5,187,973 |
| | |
Liabilities | | |
Payable to custodian bank | $ 41,220 | |
Payable for investments purchased | 36,661 | |
Payable for fund shares redeemed | 2,051 | |
Accrued management fee | 2,971 | |
Distribution fees payable | 2,810 | |
Other payables and accrued expenses | 31,251 | |
Total liabilities | | 116,964 |
| | |
Net Assets | | $ 5,071,009 |
Net Assets consist of: | | |
Paid in capital | | $ 5,156,200 |
Undistributed net investment income | | 10,342 |
Accumulated undistributed net realized gain (loss) on investments and foreign currency transactions | | (956,601) |
Net unrealized appreciation (depreciation) on investments and assets and liabilities in foreign currencies | | 861,068 |
Net Assets | | $ 5,071,009 |
See accompanying notes which are an integral part of the financial statements.
Annual Report
Financial Statements - continued
Statement of Assets and Liabilities - continued
| October 31, 2003 |
| | |
Calculation of Maximum Offering Price
Class A:
Net Asset Value and redemption price per share
($917,730 ÷ 73,452 shares) | | $ 12.49 |
| | |
Maximum offering price per share (100/94.25 of $12.49) | | $ 13.25 |
Class T:
Net Asset Value and redemption price per share ($1,315,236 ÷ 105,748 shares) | | $ 12.44 |
| | |
Maximum offering price per share (100/96.50 of $12.44) | | $ 12.89 |
Class B:
Net Asset Value and offering price per share ($1,513,392 ÷ 123,168 shares) A | | $ 12.29 |
| | |
Class C:
Net Asset Value and offering price per share ($1,114,267 ÷ 90,947 shares) A | | $ 12.25 |
| | |
Institutional Class:
Net Asset Value, offering price and redemption price per share ($210,384 ÷ 16,640 shares) | | $ 12.64 |
A Redemption price per share is equal to net asset value less any applicable contingent deferred sales charge.
See accompanying notes which are an integral part of the financial statements.
Annual Report
Statement of Operations
| Year ended October 31, 2003 |
| | |
Investment Income | | |
Dividends | | $ 135,716 |
Interest | | 1,295 |
| | 137,011 |
Less foreign taxes withheld | | (10,704) |
Total income | | 126,307 |
| | |
Expenses | | |
Management fee | $ 28,440 | |
Transfer agent fees | 26,296 | |
Distribution fees | 25,673 | |
Accounting fees and expenses | 61,389 | |
Non-interested trustees' compensation | 16 | |
Custodian fees and expenses | 13,121 | |
Registration fees | 52,003 | |
Audit | 45,375 | |
Legal | 130 | |
Miscellaneous | 895 | |
Total expenses before reductions | 253,338 | |
Expense reductions | (158,521) | 94,817 |
Net investment income (loss) | | 31,490 |
Realized and Unrealized Gain (Loss) Net realized gain (loss) on: | | |
Investment securities | 267,893 | |
Foreign currency transactions | (12,183) | |
Total net realized gain (loss) | | 255,710 |
Change in net unrealized appreciation (depreciation) on: Investment securities | 1,350,609 | |
Assets and liabilities in foreign currencies | 4,313 | |
Total change in net unrealized appreciation (depreciation) | | 1,354,922 |
Net gain (loss) | | 1,610,632 |
Net increase (decrease) in net assets resulting from operations | | $ 1,642,122 |
See accompanying notes which are an integral part of the financial statements.
Annual Report
Financial Statements - continued
Statement of Changes in Net Assets
| Year ended
October 31,
2003 | Year ended
October 31,
2002 |
Increase (Decrease) in Net Assets | | |
Operations | | |
Net investment income (loss) | $ 31,490 | $ 18,075 |
Net realized gain (loss) | 255,710 | (355,318) |
Change in net unrealized appreciation (depreciation) | 1,354,922 | (156,942) |
Net increase (decrease) in net assets resulting
from operations | 1,642,122 | (494,185) |
Distributions to shareholders from net investment income | (15,776) | (31,879) |
Share transactions - net increase (decrease) | 396,070 | (201,312) |
Total increase (decrease) in net assets | 2,022,416 | (727,376) |
| | |
Net Assets | | |
Beginning of period | 3,048,593 | 3,775,969 |
End of period (including undistributed net investment income of $10,342 and undistributed net investment income of $6,810, respectively) | $ 5,071,009 | $ 3,048,593 |
See accompanying notes which are an integral part of the financial statements.
Annual Report
Financial Highlights - Class A
Years ended October 31, | 2003 | 2002 | 2001 | 2000 | 1999G |
Selected Per-Share Data | | | | | |
Net asset value, beginning of period | $ 8.29 | $ 9.62 | $ 13.26 | $ 11.64 | $ 10.00 |
Income from Investment Operations | | | | | |
Net investment income (loss)E | .12 | .09 | .14F | (.07) | .05 |
Net realized and unrealized gain (loss) | 4.17 | (1.30) | (3.70) | 1.69 | 1.59 |
Total from investment operations | 4.29 | (1.21) | (3.56) | 1.62 | 1.64 |
Distributions from net investment income | (.09) | (.12) | - | - | - |
Distributions from net realized gain | - | - | (.08) | - | - |
Total distributions | (.09) | (.12) | (.08) | - | - |
Net asset value, end of period | $ 12.49 | $ 8.29 | $ 9.62 | $ 13.26 | $ 11.64 |
Total ReturnB,C,D | 52.29% | (12.87)% | (26.97)% | 13.92% | 16.40% |
Ratios to Average Net AssetsH | | | | |
Expenses before
expense reductions | 5.92% | 5.99% | 4.96% | 3.95% | 8.60%A |
Expenses net of voluntary waivers, if any | 2.02% | 2.15% | 2.11% | 2.06% | 2.01%A |
Expenses net of all reductions | 2.02% | 2.12% | 2.05% | 2.04% | 1.99%A |
Net investment income (loss) | 1.22% | .86% | 1.22% | (.50)% | .50%A |
Supplemental Data | | | | | |
Net assets, end of period
(000 omitted) | $ 918 | $ 428 | $ 546 | $ 921 | $ 756 |
Portfolio turnover rate | 67% | 132% | 111% | 52% | 50%A |
A Annualized
B Total returns for periods of less than one year are not annualized.
C Total returns would have been lower had certain expenses not been reduced during the periods shown.
D Total returns do not include the effect of the sales charges.
E Calculated based on average shares outstanding during the period.
F Investment income per share reflects a special dividend which amounted to $.06 per share.
G For the period December 21, 1998 (commencement of operations) to October 31, 1999.
H Expense ratios reflect operating expenses of the class. Expenses before reductions do not reflect amounts reimbursed by the investment adviser or reductions from brokerage service arrangements or other expense offset arrangements and do not represent the amount paid by the class during periods when reimbursements or reductions occur. Expense ratios before reductions for start-up periods may not be representative of longer-term operating periods. Expenses net of any voluntary waivers reflect expenses after reimbursement by the investment adviser but prior to reductions from brokerage service arrangements or other expense offset arrangements. Expenses net of all reductions represent the net expenses paid by the class.
See accompanying notes which are an integral part of the financial statements.
Annual Report
Financial Highlights - Class T
Years ended October 31, | 2003 | 2002 | 2001 | 2000 | 1999G |
Selected Per-Share Data | | | | | |
Net asset value, beginning of period | $ 8.24 | $ 9.57 | $ 13.21 | $ 11.62 | $ 10.00 |
Income from Investment Operations | | | | | |
Net investment income (loss)E | .10 | .06 | .11F | (.11) | .02 |
Net realized and unrealized gain (loss) | 4.16 | (1.30) | (3.67) | 1.70 | 1.60 |
Total from investment operations | 4.26 | (1.24) | (3.56) | 1.59 | 1.62 |
Distributions from net investment income | (.06) | (.09) | - | - | - |
Distributions from net realized gain | - | - | (.08) | - | - |
Total distributions | (.06) | (.09) | (.08) | - | - |
Net asset value, end of period | $ 12.44 | $ 8.24 | $ 9.57 | $ 13.21 | $ 11.62 |
Total ReturnB,C,D | 52.06% | (13.18)% | (27.07)% | 13.68% | 16.20% |
Ratios to Average Net AssetsH | | | | |
Expenses before
expense reductions | 6.58% | 6.65% | 5.48% | 4.26% | 8.92%A |
Expenses net of voluntary waivers, if any | 2.27% | 2.40% | 2.36% | 2.32% | 2.26%A |
Expenses net of all reductions | 2.27% | 2.37% | 2.30% | 2.30% | 2.24%A |
Net investment income (loss) | .97% | .61% | .97% | (.75)% | .25%A |
Supplemental Data | | | | | |
Net assets, end of period
(000 omitted) | $ 1,315 | $ 836 | $ 1,124 | $ 2,041 | $ 1,065 |
Portfolio turnover rate | 67% | 132% | 111% | 52% | 50%A |
A Annualized
B Total returns for periods of less than one year are not annualized.
C Total returns would have been lower had certain expenses not been reduced during the periods shown.
D Total returns do not include the effect of the sales charges.
E Calculated based on average shares outstanding during the period.
F Investment income per share reflects a special dividend which amounted to $.06 per share.
G For the period December 21, 1998 (commencement of operations) to October 31, 1999.
H Expense ratios reflect operating expenses of the class. Expenses before reductions do not reflect amounts reimbursed by the investment adviser or reductions from brokerage service arrangements or other expense offset arrangements and do not represent the amount paid by the class during periods when reimbursements or reductions occur. Expense ratios before reductions for start-up periods may not be representative of longer-term operating periods. Expenses net of any voluntary waivers reflect expenses after reimbursement by the investment adviser but prior to reductions from brokerage service arrangements or other expense offset arrangements. Expenses net of all reductions represent the net expenses paid by the class.
See accompanying notes which are an integral part of the financial statements.
Annual Report
Financial Highlights - Class B
Years ended October 31, | 2003 | 2002 | 2001 | 2000 | 1999G |
Selected Per-Share Data | | | | | |
Net asset value, beginning of period | $ 8.13 | $ 9.44 | $ 13.08 | $ 11.58 | $ 10.00 |
Income from Investment Operations | | | | | |
Net investment income (loss)E | .05 | .01 | .05F | (.18) | (.02) |
Net realized and unrealized gain (loss) | 4.12 | (1.28) | (3.61) | 1.68 | 1.60 |
Total from investment operations | 4.17 | (1.27) | (3.56) | 1.50 | 1.58 |
Distributions from net investment income | (.01) | (.04) | - | - | - |
Distributions from net realized gain | - | - | (.08) | - | - |
Total distributions | (.01) | (.04) | (.08) | - | - |
Net asset value, end of period | $ 12.29 | $ 8.13 | $ 9.44 | $ 13.08 | $ 11.58 |
Total ReturnB,C,D | 51.35% | (13.56)% | (27.34)% | 12.95% | 15.80% |
Ratios to Average Net AssetsH | | | | |
Expenses before expense
reductions | 6.80% | 6.90% | 5.81% | 4.78% | 9.44%A |
Expenses net of voluntary waivers, if any | 2.77% | 2.90% | 2.86% | 2.82% | 2.76%A |
Expenses net of all reductions | 2.77% | 2.87% | 2.80% | 2.80% | 2.74%A |
Net investment income (loss) | .47% | .11% | .46% | (1.25)% | (.25)%A |
Supplemental Data | | | | | |
Net assets, end of period (000 omitted) | $ 1,513 | $ 814 | $ 1,003 | $ 1,659 | $ 912 |
Portfolio turnover rate | 67% | 132% | 111% | 52% | 50%A |
A Annualized
B Total returns for periods of less than one year are not annualized.
C Total returns would have been lower had certain expenses not been reduced during the periods shown.
D Total returns do not include the effect of the contingent deferred sales charge.
E Calculated based on average shares outstanding during the period.
F Investment income per share reflects a special dividend which amounted to $.06 per share.
G For the period December 21, 1998 (commencement of operations) to October 31, 1999.
H Expense ratios reflect operating expenses of the class. Expenses before reductions do not reflect amounts reimbursed by the investment adviser or reductions from brokerage service arrangements or other expense offset arrangements and do not represent the amount paid by the class during periods when reimbursements or reductions occur. Expense ratios before reductions for start-up periods may not be representative of longer-term operating periods. Expenses net of any voluntary waivers reflect expenses after reimbursement by the investment adviser but prior to reductions from brokerage service arrangements or other expense offset arrangements. Expenses net of all reductions represent the net expenses paid by the class.
See accompanying notes which are an integral part of the financial statements.
Annual Report
Financial Highlights - Class C
Years ended October 31, | 2003 | 2002 | 2001 | 2000 | 1999G |
Selected Per-Share Data | | | | | |
Net asset value, beginning of period | $ 8.11 | $ 9.43 | $ 13.07 | $ 11.57 | $ 10.00 |
Income from Investment Operations | | | | | |
Net investment income (loss)E | .05 | .01 | .06F | (.18) | (.02) |
Net realized and unrealized gain (loss) | 4.10 | (1.28) | (3.62) | 1.68 | 1.59 |
Total from investment operations | 4.15 | (1.27) | (3.56) | 1.50 | 1.57 |
Distributions from net investment income | (.01) | (.05) | - | - | - |
Distributions from net realized gain | - | - | (.08) | - | - |
Total distributions | (.01) | (.05) | (.08) | - | - |
Net asset value, end of period | $ 12.25 | $ 8.11 | $ 9.43 | $ 13.07 | $ 11.57 |
Total ReturnB,C,D | 51.23% | (13.60)% | (27.36)% | 12.96% | 15.70% |
Ratios to Average Net AssetsH | | | | | |
Expenses before expense
reductions | 6.85% | 6.88% | 5.82% | 4.76% | 9.42%A |
Expenses net of voluntary waivers, if any | 2.77% | 2.90% | 2.86% | 2.82% | 2.76%A |
Expenses net of all reductions | 2.77% | 2.87% | 2.79% | 2.80% | 2.74%A |
Net investment income (loss) | .47% | .11% | .47% | (1.25)% | (.25)%A |
Supplemental Data | | | | | |
Net assets, end of period (000 omitted) | $ 1,114 | $ 686 | $ 759 | $ 1,165 | $ 708 |
Portfolio turnover rate | 67% | 132% | 111% | 52% | 50%A |
A Annualized
B Total returns for periods of less than one year are not annualized.
C Total returns would have been lower had certain expenses not been reduced during the periods shown.
D Total returns do not include the effect of the contingent deferred sales charge.
E Calculated based on average shares outstanding during the period.
F Investment income per share reflects a special dividend which amounted to $.06 per share.
G For the period December 21, 1998 (commencement of operations) to October 31, 1999.
H Expense ratios reflect operating expenses of the class. Expenses before reductions do not reflect amounts reimbursed by the investment adviser or reductions from brokerage service arrangements or other expense offset arrangements and do not represent the amount paid by the class during periods when reimbursements or reductions occur. Expense ratios before reductions for start-up periods may not be representative of longer-term operating periods. Expenses net of any voluntary waivers reflect expenses after reimbursement by the investment adviser but prior to reductions from brokerage service arrangements or other expense offset arrangements. Expenses net of all reductions represent the net expenses paid by the class.
See accompanying notes which are an integral part of the financial statements.
Annual Report
Financial Highlights - Institutional Class
Years ended October 31, | 2003 | 2002 | 2001 | 2000 | 1999F |
Selected Per-Share Data | | | | | |
Net asset value, beginning of period | $ 8.35 | $ 9.69 | $ 13.32 | $ 11.67 | $ 10.00 |
Income from Investment Operations | | | | | |
Net investment income (loss)D | .14 | .11 | .17E | (.04) | .07 |
Net realized and unrealized gain (loss) | 4.24 | (1.30) | (3.72) | 1.69 | 1.60 |
Total from investment operations | 4.38 | (1.19) | (3.55) | 1.65 | 1.67 |
Distributions from net investment income | (.09) | (.15) | - | - | - |
Distributions from net realized gain | - | - | (.08) | - | - |
Total distributions | (.09) | (.15) | (.08) | - | - |
Net asset value, end of period | $ 12.64 | $ 8.35 | $ 9.69 | $ 13.32 | $ 11.67 |
Total ReturnB,C | 52.99% | (12.65)% | (26.77)% | 14.14% | 16.70% |
Ratios to Average Net AssetsG | | | | |
Expenses before expense
reductions | 5.40% | 5.49% | 4.54% | 3.56% | 8.32%A |
Expenses net of voluntary waivers, if any | 1.77% | 1.90% | 1.86% | 1.81% | 1.76%A |
Expenses net of all reductions | 1.77% | 1.87% | 1.80% | 1.79% | 1.74%A |
Net investment income (loss) | 1.47% | 1.11% | 1.46% | (.25) % | .75%A |
Supplemental Data | | | | | |
Net assets, end of period (000 omitted) | $ 210 | $ 285 | $ 344 | $ 524 | $ 472 |
Portfolio turnover rate | 67% | 132% | 111% | 52% | 50%A |
A Annualized
B Total returns for periods of less than one year are not annualized.
C Total returns would have been lower had certain expenses not been reduced during the periods shown.
D Calculated based on average shares outstanding during the period.
E Investment income per share reflects a special dividend which amounted to $.06 per share.
F For the period December 21, 1998 (commencement of operations) to October 31, 1999.
G Expense ratios reflect operating expenses of the class. Expenses before reductions do not reflect amounts reimbursed by the investment adviser or reductions from brokerage service arrangements or other expense offset arrangements and do not represent the amount paid by the class during periods when reimbursements or reductions occur. Expense ratios before reductions for start-up periods may not be representative of longer-term operating periods. Expenses net of any voluntary waivers reflect expenses after reimbursement by the investment adviser but prior to reductions from brokerage service arrangements or other expense offset arrangements. Expenses net of all reductions represent the net expenses paid by the class.
See accompanying notes which are an integral part of the financial statements.
Annual Report
Notes to Financial Statements
For the period ended October 31, 2003
1. Significant Accounting Policies.
Fidelity Advisor Latin America Fund (the fund) is a fund of Fidelity Advisor Series VIII (the trust) and is authorized to issue an unlimited number of shares. The trust is registered under the Investment Company Act of 1940, as amended (the 1940 Act), as an open-end management investment company organized as a Massachusetts business trust.
The fund offers Class A, Class T, Class B, Class C, and Institutional Class shares, each of which has equal rights as to assets and voting privileges. Each class has exclusive voting rights with respect to matters that affect that class. Class B shares will automatically convert to Class A shares after a holding period of seven years from the initial date of purchase. Investment income, realized and unrealized capital gains and losses, the common expenses of the fund, and certain fund-level expense reductions, if any, are allocated on a pro rata basis to each class based on the relative net assets of each class to the total net assets of the fund. Each class differs with respect to transfer agent and distribution and service plan fees incurred. Certain expense reductions also differ by class.
The fund's investments in emerging markets can be subject to social, economic, regulatory, and political uncertainties and can be extremely volatile.
The financial statements have been prepared in conformity with accounting principles generally accepted in the United States of America, which require management to make certain estimates and assumptions at the date of the financial statements. The following summarizes the significant accounting policies of the fund:
Security Valuation. Net asset value per share (NAV calculation) is calculated as of the close of business of the New York Stock Exchange, normally 4:00 p.m. Eastern time. Equity securities for which market quotations are available are valued at the last sale price or official closing price (closing bid price or last evaluated quote if no sale has occurred) on the primary market or exchange on which they trade. If an event that is expected to materially affect the value of a security occurs after the close of an exchange or market on which that security trades, but prior to the NAV calculation, then that security will be fair valued taking the event into account. Securities (including restricted securities) for which market quotations are not readily available are valued at their fair value as determined in good faith under consistently applied procedures under the general supervision of the Board of Trustees. Price movements in futures contracts and ADRs, market and trading trends, the bid/ask quotes of brokers and off-exchange institutional trading may be reviewed in the course of making a good faith determination of a security's fair value. Short-term securities with remaining maturities of sixty days or less for which quotations are not readily available are valued on the basis of amortized cost. Investments in open-end investment companies are valued at their net asset value each business day.
Annual Report
Notes to Financial Statements - continued
1. Significant Accounting Policies - continued
Foreign Currency. The fund uses foreign currency contracts to facilitate transactions in foreign-denominated securities. Losses from these transactions may arise from changes in the value of the foreign currency or if the counterparties do not perform under the contracts' terms.
Foreign denominated assets, including investment securities, and liabilities are translated into U.S. dollars at the exchange rate at period end. Purchases and sales of investment securities, income and dividends received and expenses denominated in foreign currencies are translated into U.S. dollars at the exchange rate in effect on the transaction date.
The effects of exchange rate fluctuations on investments are included with the net realized and unrealized gain (loss) on investment securities. Other foreign currency transactions resulting in realized and unrealized gain (loss) are disclosed separately.
Investment Transactions and Income. Security transactions are accounted for as of trade date. Gains and losses on securities sold are determined on the basis of identified cost. Dividend income is recorded on the ex-dividend date, except for certain dividends from foreign securities where the ex-dividend date may have passed, which are recorded as soon as the fund is informed of the ex-dividend date. Non-cash dividends included in dividend income, if any, are recorded at the fair market value of the securities received. Interest income is accrued as earned. Interest income includes coupon interest and amortization of premium and accretion of discount on debt securities, which is accrued using the interest method. Investment income is recorded net of foreign taxes withheld where recovery of such taxes is uncertain.
Expenses. Most expenses of the trust can be directly attributed to a fund. Expenses which cannot be directly attributed are apportioned among the funds in the trust.
Income Tax Information and Distributions to Shareholders. Each year the fund intends to qualify as a regulated investment company by distributing all of its taxable income and realized gains under Subchapter M of the Internal Revenue Code. As a result, no provision for income taxes is required in the accompanying financial statements. Foreign taxes are provided for based on each fund's understanding of the tax rules and rates that exist in the foreign markets in which it invests. Income dividends and capital gain distributions are declared separately for each class. Distributions are recorded on the ex-dividend date.
Income and capital gain distributions are determined in accordance with income tax regulations, which may differ from generally accepted accounting principles. Capital accounts within the financial statements are adjusted for permanent and temporary book and tax differences. These adjustments have no impact on net assets or the results
Annual Report
1. Significant Accounting Policies - continued
Income Tax Information and Distributions to Shareholders - continued
of operations. Temporary differences will reverse in a subsequent period. These differences are primarily due to foreign currency transactions, capital loss carryforwards and losses deferred due to wash sales.
The tax-basis components of distributable earnings and the federal tax cost as of period end were as follows:
Unrealized appreciation | $ 934,752 | |
Unrealized depreciation | (110,966) | |
Net unrealized appreciation (depreciation) | 823,786 | |
Undistributed ordinary income | 10,342 | |
Capital loss carryforward | (919,319) | |
Cost for federal income tax purposes | $ 4,314,100 | |
The tax character of distributions paid was as follows:
| October 31,
2003 | October 31,
2002 |
Ordinary Income | $ 15,776 | $ 31,879 |
Short-Term Trading (Redemption) Fees. Shares purchased on or after March 31, 2004 and held in the fund less than 90 days will be subject to a short-term trading fee equal to 1.50% of the proceeds of the redeemed shares. The fee, which will be retained by the fund, is accounted for as an addition to paid in capital.
2. Operating Policies.
Repurchase Agreements. Fidelity Management & Research Company (FMR) has received an Exemptive Order from the Securities and Exchange Commission (the SEC) which permits the fund and other affiliated entities of FMR to transfer uninvested cash balances into joint trading accounts. These accounts are then invested in repurchase agreements that are collateralized by U.S. Treasury or Government obligations. The fund may also invest directly with institutions, in repurchase agreements that are collateralized by commercial paper obligations and corporate obligations. Collateral is held in segregated accounts with custodian banks and may be obtained in the event of a default of the counterparty. Collateral is marked-to-market daily and maintained at a value at least equal to the principal amount of the repurchase agreement (including accrued interest).
Annual Report
Notes to Financial Statements - continued
3. Purchases and Sales of Investments.
Information regarding purchases and sales of securities is included under the caption "Other Information" at the end of the fund's Schedule of Investments.
4. Fees and Other Transactions with Affiliates.
Management Fee. FMR and its affiliates provide the fund with investment management related services for which the fund pays a monthly management fee. The management fee is the sum of an individual fund fee rate that is based on an annual rate of .45% of the fund's average net assets and a group fee rate that averaged .28% during the period. The group fee rate is based upon the average net assets of all the mutual funds advised by FMR. The group fee rate decreases as assets under management increase and increases as assets under management decrease. For the period, the total annual management fee rate was .73% of the fund's average net assets.
Distribution and Service Plan. In accordance with Rule 12b-1 of the 1940 Act, the Fund has adopted separate Distribution and Service Plans for each class of shares. Certain classes pay Fidelity Distributors Corporation (FDC), an affiliate of FMR, separate Distribution and Service Fees, each of which is based on an annual percentage of each class' average net assets. Class A and Class T Plans also authorize the use of brokerage commissions to pay distribution expenses. This practice has been discontinued and no commissions incurred after June 30, 2003 have been used to pay distribution expenses. In addition, FDC may pay financial intermediaries for selling shares of the fund and providing shareholder support services. For the period, the Distribution and Service Fee rates, the total amounts paid to and retained by FDC and the amount of distribution expenses paid with brokerage commissions were as follows:
| Distribution
Fee | Service
Fee | Paid to
FDC | Retained
by FDC | Paid with
Commissions |
Class A | - | .25% | $ 1,684 | $ 473 | $ - |
Class T | .25% | .25% | 5,034 | 657 | - |
Class B | .75% | .25% | 10,767 | 8,471 | - |
Class C | .75% | .25% | 8,188 | 3,385 | - |
| | | $ 25,673 | $ 12,986 | $ - |
Sales Load. FDC receives a front-end sales charge of up to 5.75% for selling Class A shares, and 3.50% for selling Class T shares of the fund. FDC receives the proceeds of contingent deferred sales charges levied on Class A, Class T, Class B, and Class C redemptions. These charges depend on the holding period. The deferred sales charges range from 5% to 1% for Class B, 1% for Class C, and .25% for certain purchases of Class A and Class T shares.
Annual Report
4. Fees and Other Transactions with Affiliates - continued
Sales Load - continued
For the period, sales charge amounts retained by FDC were as follows:
| Retained
by FDC |
Class A | $ 283 |
Class T | 468 |
Class B* | 3,524 |
Class C* | 657 |
| $ 4,932 |
* When Class B and Class C shares are initially sold, FDC pays commissions from its own resources to financial intermediaries through which the sales
are made.
Transfer Agent Fees. Fidelity Investments Institutional Operations Company, Inc. (FIIOC), an affiliate of FMR, is the transfer, dividend disbursing and shareholder servicing agent (collectively referred to as the transfer agent) for each class of the fund. FIIOC receives account fees and asset-based fees that vary according to the account size and type of account of the shareholders of the respective classes of the fund. FIIOC pays for typesetting, printing and mailing of all shareholder reports, except proxy statements. For the period, the following amounts were paid to FIIOC:
| Amount | % of
Average
Net Assets |
Class A | $ 3,478 | .51 |
Class T | 9,333 | .92 |
Class B | 6,986 | .64 |
Class C | 5,751 | .70 |
Institutional Class | 748 | .24 |
| $ 26,296 | |
Accounting Fees. Fidelity Service Company, Inc. (FSC), an affiliate of FMR, maintains the fund's accounting records. The fee is based on the level of average net assets for the month plus out-of-pocket expenses.
Central Funds. The fund may invest in affiliated Central Funds managed by Fidelity Investments Money Management, Inc. (FIMM), an affiliate of FMR. The Central Funds are open-end investment companies available only to investment companies and other accounts managed by FMR and its affiliates. The Central Funds seek preservation of capital and current income and do not pay a management fee. Income distributions earned by the fund are recorded as income in the accompanying financial statements and totaled $1,223 for the period.
Annual Report
Notes to Financial Statements - continued
4. Fees and Other Transactions with Affiliates - continued
Brokerage Commissions. The fund placed a portion of its portfolio transactions with brokerage firms which are affiliates of the investment adviser. The commissions paid to these affiliated firms are shown under the caption "Other Information" at the end of the fund's Schedule of Investments.
5. Committed Line of Credit.
The fund participates with other funds managed by FMR in a $3.5 billion credit facility (the "line of credit") to be utilized for temporary or emergency purposes to fund shareholder redemptions or for other short-term liquidity purposes. The fund has agreed to pay commitment fees on its pro rata portion of the line of credit. During the period, there were no borrowings on this line of credit.
6. Expense Reductions.
FMR agreed to reimburse the classes of the fund to the extent operating expenses exceeded certain levels of average net assets as noted in the table below. Some expenses, for example interest expense, are excluded from this reimbursement.
| Expense
Limitations | Reimbursement
from adviser |
| | |
Class A | 2.00% | $ 26,482 |
Class T | 2.25% | 43,639 |
Class B | 2.75% | 43,679 |
Class C | 2.75% | 33,603 |
Institutional Class | 1.75% | 11,118 |
| | $ 158,521 |
7. Other Information.
At the end of the period, FMR or its affiliates were the owners of record of 22% of the total outstanding shares of the fund.
Annual Report
8. Distributions to Shareholders.
Distributions to shareholders of each class were as follows:
| Years ended October 31, |
| 2003 | 2002 |
From net investment income | | |
Class A | $ 4,772 | $ 7,589 |
Class T | 6,047 | 10,635 |
Class B | 1,047 | 4,189 |
Class C | 844 | 4,139 |
Institutional Class | 3,066 | 5,327 |
Total | $ 15,776 | $ 31,879 |
9. Share Transactions.
Transactions for each class of shares were as follows:
| Shares | Dollars |
| Years ended October 31, | Years ended October 31, |
| 2003 | 2002 | 2003 | 2002 |
Class A | | | | |
Shares sold | 109,782 | 22,373 | $ 1,122,639 | $ 238,302 |
Reinvestment of distributions | 545 | 613 | 4,552 | 6,665 |
Shares redeemed | (88,522) | (28,099) | (924,690) | (283,276) |
Net increase (decrease) | 21,805 | (5,113) | $ 202,501 | $ (38,309) |
Class T | | | | |
Shares sold | 24,645 | 18,573 | $ 244,830 | $ 199,995 |
Reinvestment of distributions | 697 | 886 | 5,809 | 9,606 |
Shares redeemed | (20,992) | (35,507) | (197,995) | (370,145) |
Net increase (decrease) | 4,350 | (16,048) | $ 52,644 | $ (160,544) |
Class B | | | | |
Shares sold | 43,421 | 33,046 | $ 457,257 | $ 330,985 |
Reinvestment of distributions | 123 | 382 | 1,015 | 4,097 |
Shares redeemed | (20,525) | (39,558) | (220,237) | (370,618) |
Net increase (decrease) | 23,019 | (6,130) | $ 238,035 | $ (35,536) |
Class C | | | | |
Shares sold | 28,484 | 26,445 | $ 299,810 | $ 278,879 |
Reinvestment of distributions | 101 | 351 | 836 | 3,758 |
Shares redeemed | (22,180) | (22,821) | (218,153) | (232,848) |
Net increase (decrease) | 6,405 | 3,975 | $ 82,493 | $ 49,789 |
Institutional Class | | | | |
Shares sold | 109,911 | 9 | $ 1,110,748 | $ 100 |
Reinvestment of distributions | 356 | 478 | 3,005 | 5,226 |
Shares redeemed | (127,691) | (1,935) | (1,293,356) | (22,038) |
Net increase (decrease) | (17,424) | (1,448) | $ (179,603) | $ (16,712) |
Annual Report
Report of Independent Auditors
To the Trustees of Fidelity Advisor Series VIII and the Shareholders of Fidelity Advisor Latin America Fund.
In our opinion, the accompanying statement of assets and liabilities, including the schedule of investments, and the related statements of operations and of changes in net assets and the financial highlights present fairly, in all material respects, the financial position of Fidelity Advisor Latin America Fund (a fund of Fidelity Advisor Series VIII) at October 31, 2003 and the results of its operations, the changes in its net assets and the financial highlights for the periods indicated, in conformity with accounting principles generally accepted in the United States of America. These financial statements and financial highlights (hereafter referred to as "financial statements") are the responsibility of the Fidelity Advisor Latin America Fund's management; our responsibility is to express an opinion on these financial statements based on our audits. We conducted our audits of these financial statements in accordance with auditing standards generally accepted in the United States of America which require that we plan and perform the audit to obtain reasonable assurance about whether the financial statements are free of material misstatement. An audit includes examining, on a test basis, evidence supporting the amounts and disclosures in the financial statements, assessing the accounting principles used and significant estimates made by management, and evaluating the overall financial statement presentation. We believe that our audits, which included confirmation of securities at October 31, 2003 by correspondence with the custodian and brokers, provide a reasonable basis for our opinion.
/s/PricewaterhouseCoopers LLP
PricewaterhouseCoopers LLP
Boston, Massachusetts
December 12, 2003
Annual Report
Trustees and Officers
The Trustees, Members of the Advisory Board, and executive officers of the trust and fund, as applicable, are listed below. The Board of Trustees governs the fund and is responsible for protecting the interests of shareholders. The Trustees are experienced executives who meet periodically throughout the year to oversee the fund's activities, review contractual arrangements with companies that provide services to the fund, and review the fund's performance. Except for William O. McCoy, each of the Trustees oversees 289 funds advised by FMR or an affiliate. Mr. McCoy oversees 291 funds advised by FMR or an affiliate.
The Trustees hold office without limit in time except that (a) any Trustee may resign; (b) any Trustee may be removed by written instrument, signed by at least two-thirds of the number of Trustees prior to such removal; (c) any Trustee who requests to be retired or who has become incapacitated by illness or injury may be retired by written instrument signed by a majority of the other Trustees; and (d) any Trustee may be removed at any special meeting of shareholders by a two-thirds vote of the outstanding voting securities of the trust. In any event, each non-interested Trustee shall retire not later than the last day of the calendar year in which his or her 72nd birthday occurs. The executive officers and Advisory Board Members hold office without limit in time, except that any officer and Advisory Board Member may resign or may be removed by a vote of a majority of the Trustees at any regular meeting or any special meeting of the Trustees. Except as indicated, each individual has held the office shown or other offices in the same company for the past five years.
The fund's Statement of Additional Information (SAI) includes more information about the Trustees. To request a free copy, call Fidelity at 1-877-208-0098.
Interested Trustees*:
Correspondence intended for each Trustee who is an "interested person" (as defined in the 1940 Act) may be sent to 82 Devonshire Street, Boston, Massachusetts 02109.
Name, Age; Principal Occupation |
Edward C. Johnson 3d (73)** |
| Year of Election or Appointment: 1983 Mr. Johnson is Chairman of the Board of Trustees. Mr. Johnson serves as Chief Executive Officer, Chairman, and a Director of FMR Corp.; a Director and Chairman of the Board and of the Executive Committee of FMR; Chairman and a Director of Fidelity Management & Research (Far East) Inc.; Chairman (1998) and a Director of Fidelity Investments Money Management, Inc.; and Chairman (2001) and a Director (2000) of FMR Co., Inc. |
Abigail P. Johnson (41)** |
| Year of Election or Appointment: 2001 Senior Vice President of Advisor Latin America (2001). Ms. Johnson also serves as Senior Vice President of other Fidelity funds (2001). She is President and a Director of FMR (2001), Fidelity Investments Money Management, Inc. (2001), FMR Co., Inc. (2001), and a Director of FMR Corp. Previously, Ms. Johnson managed a number of Fidelity funds. |
Laura B. Cronin (49) |
| Year of Election or Appointment: 2003 Ms. Cronin is an Executive Vice President (2002) and Chief Financial Officer (2002) of FMR Corp. and is a member of the Fidelity Management Committee (2003). Previously, Ms. Cronin served as Vice President of Finance of FMR (1997-1999), and Chief Financial Officer of FMR (1999-2001), Fidelity Personal Investments (2001), and Fidelity Brokerage Company (2001-2002). |
Robert L. Reynolds (51) |
| Year of Election or Appointment: 2003 Mr. Reynolds is a Director (2003) and Chief Operating Officer (2002) of FMR Corp. and is the head of the Fidelity Management Committee (2003). He also serves on the Board at Fidelity Investments Canada, Ltd. (2000). Previously, Mr. Reynolds served as President of Fidelity Investments Institutional Retirement Group (1996-2000). |
* Trustees have been determined to be "Interested Trustees" by virtue of, among other things, their affiliation with the trust or various entities under common control with FMR.
** Edward C. Johnson 3d, Trustee, is Abigail P. Johnson's father.
Annual Report
Non-Interested Trustees:
Correspondence intended for each non-interested Trustee (that is, the Trustees other than the Interested Trustees) may be sent to Fidelity Investments, P.O. Box 55235, Boston, Massachusetts 02205-5235.
Name, Age; Principal Occupation |
J. Michael Cook (61) |
| Year of Election or Appointment: 2001 Prior to Mr. Cook's retirement in May 1999, he served as Chairman and Chief Executive Officer of Deloitte & Touche LLP (accounting/consulting), Chairman of the Deloitte & Touche Foundation, and a member of the Board of Deloitte Touche Tohmatsu. He currently serves as a Director of Comcast (telecommunications, 2002), International Flavors & Fragrances, Inc. (2000), Rockwell Automation (2000) and The Dow Chemical Company (2000). He is a Member of the Diversity Advisory Council of Marakon (2003) and the Advisory Board of the Directorship Search Group, Chairman Emeritus of the Board of Catalyst (a leading organization for the advancement of women in business), and is Chairman of the Accountability Advisory Council to the Comptroller General of the United States. He also serves as a Member of the Advisory Board of the Graduate School of Business of the University of Florida, his alma mater. |
Ralph F. Cox (71) |
| Year of Election or Appointment: 1991 Mr. Cox is President of RABAR Enterprises (management consulting for the petroleum industry). Prior to February 1994, he was President of Greenhill Petroleum Corporation (petroleum exploration and production). Until March 1990, Mr. Cox was President and Chief Operating Officer of Union Pacific Resources Company (exploration and production). He is a Director of CH2M Hill Companies (engineering), and Abraxas Petroleum (petroleum exploration and production, 1999). In addition, he is a member of advisory boards of Texas A&M University and the University of Texas at Austin. |
Phyllis Burke Davis (71) |
| Year of Election or Appointment: 1992 Mrs. Davis is retired from Avon Products, Inc. (consumer products) where she held various positions including Senior Vice President of Corporate Affairs and Group Vice President of U.S. product marketing, sales, distribution, and manufacturing. Mrs. Davis is a member of the Board of Directors of the Southampton Hospital in Southampton, N.Y. (1998). Previously, she served as a Director of BellSouth Corporation (telecommunications), Eaton Corporation (diversified industrial), the TJX Companies, Inc. (retail stores), Hallmark Cards, Inc., and Nabisco Brands, Inc. |
Robert M. Gates (60) |
| Year of Election or Appointment: 1997 Dr. Gates is President of Texas A&M University (2002). He was Director of the Central Intelligence Agency (CIA) from 1991 to 1993. From 1989 to 1991, Dr. Gates served as Assistant to the President of the United States and Deputy National Security Advisor. Dr. Gates is a Director of NACCO Industries, Inc. (mining and manufacturing), and Parker Drilling Co., Inc. (drilling and rental tools for the energy industry, 2001). He also serves as a member of the Advisory Board of VoteHere.net (secure internet voting, 2001). Previously, Dr. Gates served as a Director of LucasVarity PLC (automotive components and diesel engines), a Director of TRW Inc. (automotive, space, defense, and information technology), and Dean of the George Bush School of Government and Public Service at Texas A&M University (1999-2001). Dr. Gates also is a Trustee of the Forum for International Policy. |
Donald J. Kirk (70) |
| Year of Election or Appointment: 1987 Mr. Kirk is a Governor of the American Stock Exchange (2001), a Trustee and former Chairman of the Board of Trustees of the Greenwich Hospital Association, a Director of the Yale-New Haven Health Services Corp. (1998), and a Director Emeritus and former Chairman of the Board of Directors of National Arts Strategies Inc. Mr. Kirk was an Executive-in-Residence (1995-2000) and a Professor (1987-1995) at Columbia University Graduate School of Business. Prior to 1987, he was Chairman of the Financial Accounting Standards Board. Previously, Mr. Kirk served as a Governor of the National Association of Securities Dealers, Inc. (1996-2002), a member and Vice Chairman of the Public Oversight Board of the American Institute of Certified Public Accountants' SEC Practice Section (1995-2002), a Director of General Re Corporation (reinsurance, 1987-1998) and as a Director of Valuation Research Corp. (appraisals and valuations). |
Marie L. Knowles (57) |
| Year of Election or Appointment: 2001 Prior to Ms. Knowles' retirement in June 2000, she served as Executive Vice President and Chief Financial Officer of Atlantic Richfield Company (ARCO) (diversified energy, 1996-2000). From 1993 to 1996, she was a Senior Vice President of ARCO and President of ARCO Transportation Company. She served as a Director of ARCO from 1996 to 1998. She currently serves as a Director of Phelps Dodge Corporation (copper mining and manufacturing), URS Corporation (multidisciplinary engineering, 1999), and McKesson Corporation (healthcare service, 2002). Ms. Knowles is a Trustee of the Brookings Institution and the Catalina Island Conservancy and also serves as a member of the Advisory Board for the School of Engineering of the University of Southern California. |
Ned C. Lautenbach (59) |
| Year of Election or Appointment: 2000 Mr. Lautenbach has been a partner of Clayton, Dubilier & Rice, Inc. (private equity investment firm) since September 1998. Previously, Mr. Lautenbach was with the International Business Machines Corporation (IBM) from 1968 until his retirement in 1998. He was most recently Senior Vice President and Group Executive of Worldwide Sales and Services. From 1993 to 1995, he was Chairman of IBM World Trade Corporation, and from 1994 to 1998 was a member of IBM's Corporate Executive Committee. Mr. Lautenbach serves as Chairman and as a Director (1998) of Acterna Corporation (communications test equipment). He is also Co-Chairman of Covansys, Inc. (global provider of business and technology solutions, 2000). In addition, he is a Director of Eaton Corporation (diversified industrial) and the Philharmonic Center for the Arts in Naples, Florida (1999). He also is a member of the Council on Foreign Relations. |
Marvin L. Mann (70) |
| Year of Election or Appointment: 1993 Mr. Mann is Chairman of the non-interested Trustees (2001). He is Chairman Emeritus of Lexmark International, Inc. (computer peripherals) where he served as CEO until April 1998 and retired as Chairman May 1999, and remains a member of the Board. Prior to 1991, he held the positions of Vice President of International Business Machines Corporation (IBM) and President and General Manager of various IBM divisions and subsidiaries. Mr. Mann is a Board member of Imation Corp. (imaging and information storage) and Acterna Corporation (communications test equipment, 1999). He is also a member of the Director Services Committee of the Investment Company Institute. In addition, Mr. Mann is a member of the President's Cabinet at the University of Alabama and the Board of Visitors of the Culverhouse College of Commerce and Business Administration at the University of Alabama. |
William O. McCoy (70) |
| Year of Election or Appointment: 1997 Prior to his retirement in December 1994, Mr. McCoy was Vice Chairman of the Board of BellSouth Corporation (telecommunications) and President of BellSouth Enterprises. He is currently a Director of Liberty Corporation (holding company), Duke Realty Corporation (real estate), Progress Energy, Inc. (electric utility), and Acterna Corporation (communications test equipment, 1999). He is also a partner of Franklin Street Partners (private investment management firm) and a member of the Research Triangle Foundation Board. In addition, Mr. McCoy served as the Interim Chancellor (1999-2000) and a member of the Board of Visitors (1994-1998) for the University of North Carolina at Chapel Hill and currently serves on the Board of Directors of the University of North Carolina Health Care System and the Board of Visitors of the Kenan-Flagler Business School (University of North Carolina at Chapel Hill). He also served as Vice President of Finance for the University of North Carolina (16-school system, 1995-1998). |
William S. Stavropoulos (64) |
| Year of Election or Appointment: 2001 Mr. Stavropoulos is Chairman of the Board, President and CEO (2002), and Chairman of the Executive Committee (2000) and a Director of The Dow Chemical Company. Since joining The Dow Chemical Company in 1967, Mr. Stavropoulos served in numerous senior management positions, including President (1993-2000) and Chief Executive Officer (1995-2000). Currently, he is a Director of NCR Corporation (data warehousing and technology solutions), BellSouth Corporation (telecommunications), Chemical Financial Corporation, and Maersk Inc. (industrial conglomerate, 2002). He also serves as a member of the Board of Trustees of the American Enterprise Institute for Public Policy Research. In addition, Mr. Stavropoulos is a member of The Business Council, J.P. Morgan International Council, World Business Council for Sustainable Development, and the University of Notre Dame Advisory Council for the College of Science. |
Annual Report
Trustees and Officers - continued
Advisory Board Members and Executive Officers:
Correspondence intended for Dr. Heilmeier may be sent to Fidelity Investments, P.O. Box 55235, Boston, Massachusetts 02205-5235. Correspondence intended for each executive officer and Mr. Lynch may be sent to 82 Devonshire Street, Boston, Massachusetts 02109.
Name, Age; Principal Occupation |
George H. Heilmeier (67) |
| Year of Election or Appointment: 2003 Member of the Advisory Board of Fidelity Advisor Series VIII. Dr. Heilmeier is Chairman Emeritus of Telcordia Technologies (communication software and systems), where prior to his retirement, he served as company Chairman and Chief Executive Officer. He currently serves on the Boards of Directors of The Mitre Corporation (systems engineering and information technology support for the government), INET Technologies Inc. (telecommunications network surveillance, 2001) and Teletech Holdings (customer management services, 1998). He is Chairman of the General Motors Technology Advisory Committee and a Life Fellow of the IEEE (2000). Dr. Heilmeier is a member of the Defense Science Board and the National Security Agency Advisory Board. He is also a member of the National Academy of Engineering, the American Academy of Arts and Sciences and The Board of Overseers of the School of Engineering and Applied Science of the University of Pennsylvania. Previously, Dr. Heilmeier served as a Director of TRW Inc. (automotive, space, defense, and information technology, 1992-2002) and Compaq (1994-2002). |
Peter S. Lynch (60) |
| Year of Election or Appointment: 2003 Member of the Advisory Board of Fidelity Advisor Series VIII. Vice Chairman and a Director of FMR, and Vice Chairman (2001) and a Director (2000) of FMR Co., Inc. Previously, Mr. Lynch served as a Trustee of the Fidelity funds (1990-2003). Prior to May 31, 1990, he was a Director of FMR and Executive Vice President of FMR (a position he held until March 31, 1991), Vice President of Fidelity® Magellan® Fund and FMR Growth Group Leader, and Managing Director of FMR Corp. Mr. Lynch was also Vice President of Fidelity Investments Corporate Services. In addition, he serves as a Trustee of Boston College, Massachusetts Eye & Ear Infirmary, Historic Deerfield, John F. Kennedy Library, and the Museum of Fine Arts of Boston. |
Philip L. Bullen (44) |
| Year of Election or Appointment: 2001 Vice President of Advisor Latin America. Mr. Bullen also serves as Vice President of certain Equity Funds (2001) and certain High Income Funds (2001). He is Senior Vice President of FMR (2001) and FMR Co., Inc. (2001), President and a Director of Fidelity Management & Research (Far East) Inc. (2001), President and a Director of Fidelity Management & Research (U.K.) Inc. (2002), and a Director of Strategic Advisers, Inc. (2002). Before joining Fidelity Investments, Mr. Bullen was President and Chief Investment Officer of Santander Global Advisors (1997-2000) and President and Chief Executive Officer of Boston's Baring Asset Management Inc. (1994-1997). |
Eric D. Roiter (54) |
| Year of Election or Appointment: 1998 Secretary of Advisor Latin America. He also serves as Secretary of other Fidelity funds (1998); Vice President, General Counsel, and Clerk of FMR Co., Inc. (2001) and FMR (1998); Vice President and Clerk of FDC (1998); Assistant Clerk of Fidelity Management & Research (U.K.) Inc. (2001) and Fidelity Management & Research (Far East) Inc. (2001); and Assistant Secretary of Fidelity Investments Money Management Inc. (2001). Prior to joining Fidelity, Mr. Roiter was with the law firm of Debevoise & Plimpton, as an associate (1981-1984) and as a partner (1985-1997), and served as an Assistant General Counsel of the U.S. Securities and Exchange Commission (1979-1981). Mr. Roiter is an Adjunct Member, Faculty of Law, at Boston College Law School (2003). |
Stuart Fross (44) |
| Year of Election or Appointment: 2003 Assistant Secretary of Advisor Latin America. Mr. Fross also serves as Assistant Secretary of other Fidelity funds (2003) and is an employee of FMR. |
Maria F. Dwyer (44) |
| Year of Election or Appointment: 2002 President and Treasurer of Advisor Latin America. Ms. Dwyer also serves as President and Treasurer of other Fidelity funds (2002) and is a Vice President (1999) and an employee (1996) of FMR. Prior to joining Fidelity, Ms. Dwyer served as Director of Compliance for MFS Investment Management. |
Timothy F. Hayes (52) |
| Year of Election or Appointment: 2002 Chief Financial Officer of Advisor Latin America. Mr. Hayes also serves as Chief Financial Officer of other Fidelity funds (2002). Recently he was appointed President of Fidelity Service Company (2003) where he also serves as a Director. Mr. Hayes also serves as President of Fidelity Investments Operations Group (FIOG, 2002), which includes Fidelity Pricing and Cash Management Services Group (FPCMS), where he was appointed President in 1998. Previously, Mr. Hayes served as Chief Financial Officer of Fidelity Investments Corporate Systems and Service Group (1998) and Fidelity Systems Company (1997-1998). |
John R. Hebble (45) |
| Year of Election or Appointment: 2003 Deputy Treasurer of Advisor Latin America. Mr. Hebble also serves as Deputy Treasurer of other Fidelity funds (2003), and is an employee of FMR. Before joining Fidelity Investments, Mr. Hebble worked at Deutsche Asset Management where he served as Director of Fund Accounting (2002-2003) and Assistant Treasurer of the Scudder Funds (1998-2003). |
John H. Costello (57) |
| Year of Election or Appointment: 1998 Assistant Treasurer of Advisor Latin America. Mr. Costello also serves as Assistant Treasurer of other Fidelity funds and is an employee of FMR. |
Francis V. Knox, Jr. (56) |
| Year of Election or Appointment: 2002 Assistant Treasurer of Advisor Latin America. Mr. Knox also serves as Assistant Treasurer of other Fidelity funds (2002), and is a Vice President and an employee of FMR. Previously, Mr. Knox served as Vice President of Investment & Advisor Compliance (1990-2001), and Compliance Officer of Fidelity Management & Research (U.K.) Inc. (1992-2002), Fidelity Management & Research (Far East) Inc. (1991-2002), and FMR Corp. (1995-2002). |
Mark Osterheld (48) |
| Year of Election or Appointment: 2002 Assistant Treasurer of Advisor Latin America. Mr. Osterheld also serves as Assistant Treasurer of other Fidelity funds (2002) and is an employee of FMR. |
Thomas J. Simpson (45) |
| Year of Election or Appointment: 2000 Assistant Treasurer of Advisor Latin America. Mr. Simpson is Assistant Treasurer of other Fidelity funds (2000) and an employee of FMR (1996). Prior to joining FMR, Mr. Simpson was Vice President and Fund Controller of Liberty Investment Services (1987-1995). |
Annual Report
Distributions
The amounts per share which represent income derived from sources within, and taxes paid to, foreign countries or possessions of the United States are as follows:
| Pay Date | Income | Taxes |
Class A | 12/9/02 | $.112 | $.022 |
Class T | 12/9/02 | $.082 | $.022 |
Class B | 12/9/02 | $.032 | $.022 |
Class C | 12/9/02 | $.032 | $.022 |
The fund will notify shareholders in January 2004 of amounts for use in preparing 2003 income tax returns.
Annual Report
Investment Adviser
Fidelity Management & Research Company
Boston, MA
Investment Sub-Advisers
FMR Co., Inc.
Fidelity Management & Research
(U.K.) Inc.
Fidelity Management & Research
(Far East) Inc.
Fidelity International
Investment Advisors
Fidelity Investments Japan Limited
Fidelity International Investment Advisors (U.K.) Limited
General Distributor
Fidelity Distributors Corporation
Boston, MA
Transfer and Shareholder
Servicing Agents
Fidelity Investments Institutional Operations Company, Inc.
Boston, MA
Custodian
State Street Bank and Trust Company
Quincy, MA
(Fidelity Investment logo)(registered trademark)
Corporate Headquarters
82 Devonshire St., Boston, MA 02109
www.fidelity.com
ALAF-UANN-1203
1.784760.100
Fidelity® Advisor
Latin America
Fund - Institutional Class
Annual Report
October 31, 2003
(2_fidelity_logos) (Registered_Trademark)
Contents
Chairman's Message | <Click Here> | Ned Johnson's message to shareholders. |
Performance | <Click Here> | How the fund has done over time. |
Management's Discussion | <Click Here> | The manager's review of fund performance, strategy and outlook. |
Investment Changes | <Click Here> | A summary of major shifts in the fund's investments over the past six months. |
Investments | <Click Here> | A complete list of the fund's investments with their market values. |
Financial Statements | <Click Here> | Statements of assets and liabilities, operations, and changes in net assets,
as well as financial highlights. |
Notes | <Click Here> | Notes to the financial statements. |
Auditors' Opinion | <Click Here> | |
Trustees and Officers | <Click Here> | |
Distributions | <Click Here> | |
| | |
For a free copy of the fund's proxy voting guidelines call 1-877-208-0098 or visit the Securities and Exchange Commission (SEC)'s web site at www.sec.gov.
Standard & Poor's, S&P and S&P 500 are registered service marks of The McGraw-Hill Companies, Inc. and have been licensed for use by Fidelity Distributors Corporation.
Other third party marks appearing herein are the property of their respective owners.
All other marks appearing herein are registered or unregistered trademarks or service marks of FMR Corp. or an affiliated company.
(Recycle graphic) This report is printed on recycled paper using soy-based inks.
Annual Report
This report and the financial statements contained herein are submitted for the general information of the shareholders of the fund. This report is not authorized for distribution to prospective investors in the fund unless preceded or accompanied by an effective prospectus.
Mutual fund shares are not deposits or obligations of, or guaranteed by, any depository institution. Shares are not insured by the FDIC, Federal Reserve Board or any other agency, and are subject to investment risks, including possible loss of principal amount invested.
Neither the fund nor Fidelity Distributors Corporation is a bank.
For more information on any Fidelity Advisor fund, including charges and expenses, contact your investment professional for a free prospectus. Read it carefully before you invest or send money.
Annual Report
Chairman's Message
(photo_of_Edward_C_Johnson_3d)
Dear Shareholder:
Many of you have read or heard news stories recently that were critical of mutual funds and made allegations that the mutual fund industry has been less than forthright. I find these reports unsettling and not necessarily an accurate picture of the overall industry, and I would like you to know where we at Fidelity stand.
With specific regard to allegations that certain mutual fund companies were violating the Securities and Exchange Commission's forward pricing rules or were involved in so-called "market timing" activities, I want to say two things:
First, Fidelity does not have agreements that permit customers who buy fund shares after 4 p.m. to obtain the 4 p.m. price. This is not to say that someone could not deceive the company through fraudulent acts. But I underscore that we have no so-called "agreements" which would permit this illegal practice.
Second, Fidelity has been on record for years opposing predatory short-term trading which adversely affects other shareholders in a mutual fund. In fact, in the 1980s, we began charging a fee - which is returned to the fund and, therefore, to investors - to discourage this activity. What's more, several years ago we took the industry lead in developing a Fair Value Pricing Policy to prevent market timing on foreign securities in our funds. It is reasonable to assume that another structure can be developed that would alter the system to make it much more difficult for predatory traders to operate. This, however, will only be achieved through close cooperation among regulators, legislators and the industry.
Certainly no industry is perfect, and there have been instances of unethical and illegal activity from time to time within the mutual fund industry. When this occurs, confessed or convicted offenders should be dealt with appropriately. Clearly, every system can be improved. We applaud well thought out improvements by regulators, legislators and industry representatives that achieve the common goal of building and protecting the value of investors' holdings. But we remain concerned about the risk of over-regulation and the quick application of simplistic solutions to intricate problems.
For more than 57 years, Fidelity Investments has worked very hard to improve its products and service to justify your trust. When our family founded this company in 1946, we had only a few hundred customers. Many of them were family and friends. Today, we serve more than 18 million customers including individual investors and participants in retirement plans across America.
Let me close by saying that we do not take your trust in us for granted, and we realize that we must always work to improve all aspects of our service to you. In turn, we urge you to continue your active participation with your financial matters, so that your interests can be well served.
Annual Report
Best regards,
/s/Edward C. Johnson 3d
Edward C. Johnson 3d
Annual Report
Performance: The Bottom Line
Average annual total return reflects the change in the value of an investment, assuming reinvestment of the class' dividend income and capital gains (the profits earned upon the sale of securities that have grown in value) and assuming a constant rate of performance each year. During periods of reimbursement by Fidelity, a fund's total return will be greater than it would be had the reimbursement not occurred. The $10,000 table and the fund's returns do not reflect the deduction of taxes that a shareholder would pay on fund distributions or the redemption of fund shares. How a fund did yesterday is no guarantee of how it will do tomorrow.
Average Annual Total Returns
Periods ended October 31, 2003 | | Past 1
year | Life of
fundA |
Institutional Class | | 52.99% | 5.60% |
A From December 21, 1998.
$10,000 Over Life of Fund
Let's say hypothetically that $10,000 was invested in Fidelity® Advisor Latin America Fund - Institutional Class on December 21, 1998, when the fund started. The chart shows how the value of your investment would have grown, and also shows how the MSCI® EMF - Latin America Index did over the same period.
Annual Report
Management's Discussion of Fund Performance
Comments from Claudio Brocado, Portfolio Manager of Fidelity® Advisor Latin America Fund
Mirroring the U.S. rally, most international stock markets rebounded sharply during the 12-month period ending October 31, 2003. Encouraged by improved corporate earnings, favorable interest rates and the easing of geopolitical tensions, the Morgan Stanley Capital InternationalSM Europe, Australasia, Far East (MSCI® EAFE®) Index - a proxy for stock markets outside the United States and Canada - gained 27.39% during the past year. From a regional perspective, all 16 countries in the MSCI Europe index - which gained 24.56% - had double-digit advances. Spain, Denmark and Sweden were among the region's best performers. In Japan, increased capital spending, exports and machinery orders helped the Tokyo Stock Exchange Stock Price Index (TOPIX) advance 36.39%. Following the SARS epidemic, other Asian markets also rebounded. For instance, the Hong Kong market, as measured by the Hang Seng Index, gained 34.51%. Emerging markets also fared well, particularly Latin America. The MSCI Emerging Markets Free-Latin America Index rose 59.75%. Canadian equities, as measured by the S&P/TSX Composite Index, also posted an impressive annual gain, advancing 50.66%.
For the 12 months that ended October 31, 2003, the fund's Institutional Class shares returned 52.99%, while the Morgan Stanley Capital International Emerging Markets Free-Latin America Index and the LipperSM Latin American Funds Average gained 59.75% and 49.10%, respectively. The fund was aided by overweighting Brazil relative to other Latin American markets, as Brazil outperformed expectations on the basis of a recovering currency, declining interest rates, and implementation of positive policies and reforms by newly elected President Lula da Silva. Strong stock selection, including positions in Brazilian companies such as Telebras, Petrobras and Usiminas, as well as America Movil in Mexico, moved the fund ahead of its peer group. The fund lagged the index partly because we didn't own some illiquid, infrequently traded stocks that are held in the index. Also, underweighting Chile, which had surprisingly strong performance, held back returns. Underweighting Vale do Rio (CVRD) and Copec, both outperforming stocks with high valuations, as well as overweighting Telefonos de Mexico (Telmex), a defensive stock that lagged other, higher-growth stocks, also hurt.
The views expressed in this statement reflect those of the portfolio manager only through the end of the period of the report as stated on the cover and do not necessarily represent the views of Fidelity or any other person in the Fidelity organization. Any such views are subject to change at any time based upon market or other conditions and Fidelity disclaims any responsibility to update such views. These views may not be relied on as investment advice and, because investment decisions for a Fidelity fund are based on numerous factors, may not be relied on as an indication of trading intent on behalf of any Fidelity fund
Annual Report
Investment Changes
Top Five Stocks as of October 31, 2003 |
| % of fund's
net assets | % of fund's net assets
6 months ago |
Telefonos de Mexico SA de CV sponsored ADR (Mexico, Diversified Telecommunication Services) | 9.9 | 11.2 |
America Movil SA de CV sponsored ADR (Mexico, Wireless Telecommunication Services) | 9.1 | 7.6 |
Petroleo Brasileiro SA Petrobras (Brazil, Oil & Gas) | 8.9 | 6.7 |
Grupo Televisa SA de CV sponsored ADR (Mexico, Media) | 5.2 | 4.7 |
Cemex SA de CV sponsored ADR (Mexico, Construction Materials) | 5.1 | 4.0 |
| 38.2 | |
Top Five Market Sectors as of October 31, 2003 |
| % of fund's
net assets | % of fund's net assets
6 months ago |
Telecommunication Services | 29.8 | 25.6 |
Materials | 18.0 | 15.9 |
Consumer Staples | 13.0 | 11.5 |
Energy | 12.8 | 12.1 |
Financials | 11.2 | 14.0 |
Top Five Countries as of October 31, 2003 |
(excluding cash equivalents) | % of fund's
net assets | % of fund's net assets
6 months ago |
Brazil | 50.8 | 44.3 |
Mexico | 41.4 | 41.4 |
Chile | 2.3 | 2.1 |
United States of America | 1.7 | 0.0 |
Luxembourg | 1.1 | 1.1 |
Percentages are adjusted for the effect of open futures contracts, if applicable. |
Asset Allocation (% of fund's net assets) |
As of October 31, 2003 | As of April 30, 2003 |
 | Stocks 98.3% | | | Stocks 93.0% | |
 | Short-Term
Investments and
Net Other Assets 1.7% | | | Short-Term
Investments and
Net Other Assets 7.0% | |

Annual Report
Investments October 31, 2003
Showing Percentage of Net Assets
Common Stocks - 97.1% |
| Shares | | Value (Note 1) |
Argentina - 0.7% |
Inversiones y Representacions SA sponsored GDR (a) | 500 | | $ 5,200 |
Petrobras Energia Participaciones SA sponsored ADR (a) | 3,577 | | 32,908 |
TOTAL ARGENTINA | | 38,108 |
Brazil - 49.6% |
Aracruz Celulose SA sponsored ADR | 1,555 | | 43,696 |
Banco Bradesco SA: | | | |
(PN) | 27,074,800 | | 114,382 |
sponsored ADR | 200 | | 4,198 |
Banco Itau Holding Financeira SA: | | | |
(PN) | 1,955,200 | | 160,290 |
sponsored ADR | 100 | | 4,085 |
Brasil Telecom Participacoes SA sponsored ADR | 2,000 | | 73,040 |
Caemi Mineracao E Metalurgia (a) | 200,500 | | 58,684 |
Centrais Electricas Brasileiras (Electrobras) SA (PN-B) | 7,335,900 | | 96,353 |
Companhia Brasileira de Distribuicao Grupo Pao de Acucar sponsored ADR | 3,333 | | 67,093 |
Companhia de Bebidas das Americas (AmBev) sponsored ADR | 8,300 | | 175,960 |
Companhia Energetica Minas Gerais (CEMIG) (PN) | 3,682,179 | | 54,568 |
Companhia Paranaense de Energia-Copel sponsored ADR (a) | 4,200 | | 15,498 |
Companhia Vale do Rio Doce: | | | |
(PN-A) | 2,000 | | 80,098 |
sponsored: | | | |
ADR | 1,200 | | 54,900 |
ADR (non-vtg.) | 2,800 | | 113,120 |
Embraer - Empresa Brasileira de Aeronautica SA sponsored ADR | 4,640 | | 120,408 |
Gerdau SA sponsored ADR | 4,290 | | 62,462 |
Petroleo Brasileiro SA Petrobras: | | | |
(PN) | 5,100 | | 112,088 |
sponsored: | | | |
ADR | 4,700 | | 110,450 |
ADR (non-vtg.) | 15,700 | | 341,632 |
Siderurgica Nacional Compania ADR | 1,800 | | 74,250 |
Tele Norte Leste Participacoes SA ADR | 11,102 | | 157,315 |
Telebras sponsored ADR | 4,600 | | 158,424 |
Uniao de Bancos Brasileiros SA (Unibanco) GDR | 5,000 | | 110,550 |
Usinas Siderurgicas de Minas Gerais SA (Usiminas) (PN-A) | 14,600 | | 116,841 |
Votorantim Celulose e Papel SA: | | | |
(PN) | 584,400 | | 31,804 |
sponsored ADR | 100 | | 2,738 |
TOTAL BRAZIL | | 2,514,927 |
Common Stocks - continued |
| Shares | | Value (Note 1) |
Chile - 2.3% |
Banco Santander Chile sponsored ADR | 1,656 | | $ 39,347 |
Enersis SA sponsored ADR | 9,000 | | 62,280 |
Vina Concha y Toro SA sponsored ADR | 291 | | 14,041 |
TOTAL CHILE | | 115,668 |
Luxembourg - 1.1% |
Tenaris SA sponsored ADR | 1,984 | | 53,965 |
Mexico - 41.4% |
America Movil SA de CV sponsored ADR | 19,400 | | 461,720 |
Cemex SA de CV sponsored ADR | 10,863 | | 260,712 |
Consorcio ARA SA de CV (a) | 11,900 | | 32,551 |
Fomento Economico Mexicano SA de CV sponsored ADR | 3,186 | | 113,804 |
Grupo Bimbo SA de CV Series A | 9,900 | | 15,409 |
Grupo Financiero BBVA Bancomer SA Series B (a) | 149,200 | | 126,607 |
Grupo Modelo SA de CV Series C | 30,000 | | 75,990 |
Grupo Televisa SA de CV sponsored ADR | 6,757 | | 261,834 |
Industrias Penoles SA de CV | 4,500 | | 12,763 |
Telefonos de Mexico SA de CV sponsored ADR | 15,662 | | 503,533 |
TV Azteca SA de CV sponsored ADR | 5,200 | | 42,068 |
Wal-Mart de Mexico SA de CV Series C | 73,405 | | 191,399 |
TOTAL MEXICO | | 2,098,390 |
United States of America - 1.7% |
NII Holdings, Inc. Class B (a) | 1,100 | | 84,799 |
Venezuela - 0.3% |
Compania Anonima Nacional Telefono de Venezuela sponsored ADR | 1,200 | | 17,952 |
TOTAL COMMON STOCKS (Cost $4,062,634) | 4,923,809 |
Nonconvertible Preferred Stocks - 1.2% |
| | | |
Brazil - 1.2% |
Telemar Norte Leste SA Series A
(Cost $62,084) | 3,037,300 | | 61,996 |
Money Market Funds - 3.0% |
| Shares | | Value (Note 1) |
Fidelity Cash Central Fund, 1.07% (b)
(Cost $152,081) | 152,081 | | $ 152,081 |
TOTAL INVESTMENT PORTFOLIO - 101.3% (Cost $4,276,799) | | 5,137,886 |
NET OTHER ASSETS - (1.3)% | | (66,877) |
NET ASSETS - 100% | $ 5,071,009 |
Legend |
(a) Non-income producing |
(b) The rate quoted is the annualized seven-day yield of the fund at period end. A complete listing of the fund's holdings as of its most recent fiscal year end is available upon request. |
Other Information |
Purchases and sales of securities, other than short-term securities, aggregated $2,880,051 and $2,479,725, respectively. |
The fund placed a portion of its portfolio transactions with brokerage firms which are affiliates of the investment adviser. The commissions paid to these affiliated firms were $404 for the period. |
Income Tax Information |
At October 31, 2003, the fund had a capital loss carryforward of approximately $919,000 of which $578,000 and $341,000 will expire on October 31, 2009 and 2010, respectively. |
See accompanying notes which are an integral part of the financial statements.
Annual Report
Financial Statements
Statement of Assets and Liabilities
| October 31, 2003 |
| | |
Assets | | |
Investment in securities, at value (cost $4,276,799) - See accompanying schedule | | $ 5,137,886 |
Receivable for fund shares sold | | 29,959 |
Dividends receivable | | 11,069 |
Interest receivable | | 102 |
Prepaid expenses | | 22 |
Receivable from investment adviser for expense reductions | | 8,935 |
Total assets | | 5,187,973 |
| | |
Liabilities | | |
Payable to custodian bank | $ 41,220 | |
Payable for investments purchased | 36,661 | |
Payable for fund shares redeemed | 2,051 | |
Accrued management fee | 2,971 | |
Distribution fees payable | 2,810 | |
Other payables and accrued expenses | 31,251 | |
Total liabilities | | 116,964 |
| | |
Net Assets | | $ 5,071,009 |
Net Assets consist of: | | |
Paid in capital | | $ 5,156,200 |
Undistributed net investment income | | 10,342 |
Accumulated undistributed net realized gain (loss) on investments and foreign currency transactions | | (956,601) |
Net unrealized appreciation (depreciation) on investments and assets and liabilities in foreign currencies | | 861,068 |
Net Assets | | $ 5,071,009 |
See accompanying notes which are an integral part of the financial statements.
Annual Report
Financial Statements - continued
Statement of Assets and Liabilities - continued
| October 31, 2003 |
| | |
Calculation of Maximum Offering Price
Class A:
Net Asset Value and redemption price per share
($917,730 ÷ 73,452 shares) | | $ 12.49 |
| | |
Maximum offering price per share (100/94.25 of $12.49) | | $ 13.25 |
Class T:
Net Asset Value and redemption price per share ($1,315,236 ÷ 105,748 shares) | | $ 12.44 |
| | |
Maximum offering price per share (100/96.50 of $12.44) | | $ 12.89 |
Class B:
Net Asset Value and offering price per share ($1,513,392 ÷ 123,168 shares) A | | $ 12.29 |
| | |
Class C:
Net Asset Value and offering price per share ($1,114,267 ÷ 90,947 shares) A | | $ 12.25 |
| | |
Institutional Class:
Net Asset Value, offering price and redemption price per share ($210,384 ÷ 16,640 shares) | | $ 12.64 |
A Redemption price per share is equal to net asset value less any applicable contingent deferred sales charge.
See accompanying notes which are an integral part of the financial statements.
Annual Report
Statement of Operations
| Year ended October 31, 2003 |
| | |
Investment Income | | |
Dividends | | $ 135,716 |
Interest | | 1,295 |
| | 137,011 |
Less foreign taxes withheld | | (10,704) |
Total income | | 126,307 |
| | |
Expenses | | |
Management fee | $ 28,440 | |
Transfer agent fees | 26,296 | |
Distribution fees | 25,673 | |
Accounting fees and expenses | 61,389 | |
Non-interested trustees' compensation | 16 | |
Custodian fees and expenses | 13,121 | |
Registration fees | 52,003 | |
Audit | 45,375 | |
Legal | 130 | |
Miscellaneous | 895 | |
Total expenses before reductions | 253,338 | |
Expense reductions | (158,521) | 94,817 |
Net investment income (loss) | | 31,490 |
Realized and Unrealized Gain (Loss) Net realized gain (loss) on: | | |
Investment securities | 267,893 | |
Foreign currency transactions | (12,183) | |
Total net realized gain (loss) | | 255,710 |
Change in net unrealized appreciation (depreciation) on: Investment securities | 1,350,609 | |
Assets and liabilities in foreign currencies | 4,313 | |
Total change in net unrealized appreciation (depreciation) | | 1,354,922 |
Net gain (loss) | | 1,610,632 |
Net increase (decrease) in net assets resulting from operations | | $ 1,642,122 |
See accompanying notes which are an integral part of the financial statements.
Annual Report
Financial Statements - continued
Statement of Changes in Net Assets
| Year ended
October 31,
2003 | Year ended
October 31,
2002 |
Increase (Decrease) in Net Assets | | |
Operations | | |
Net investment income (loss) | $ 31,490 | $ 18,075 |
Net realized gain (loss) | 255,710 | (355,318) |
Change in net unrealized appreciation (depreciation) | 1,354,922 | (156,942) |
Net increase (decrease) in net assets resulting
from operations | 1,642,122 | (494,185) |
Distributions to shareholders from net investment income | (15,776) | (31,879) |
Share transactions - net increase (decrease) | 396,070 | (201,312) |
Total increase (decrease) in net assets | 2,022,416 | (727,376) |
| | |
Net Assets | | |
Beginning of period | 3,048,593 | 3,775,969 |
End of period (including undistributed net investment income of $10,342 and undistributed net investment income of $6,810, respectively) | $ 5,071,009 | $ 3,048,593 |
See accompanying notes which are an integral part of the financial statements.
Annual Report
Financial Highlights - Class A
Years ended October 31, | 2003 | 2002 | 2001 | 2000 | 1999G |
Selected Per-Share Data | | | | | |
Net asset value, beginning of period | $ 8.29 | $ 9.62 | $ 13.26 | $ 11.64 | $ 10.00 |
Income from Investment Operations | | | | | |
Net investment income (loss)E | .12 | .09 | .14F | (.07) | .05 |
Net realized and unrealized gain (loss) | 4.17 | (1.30) | (3.70) | 1.69 | 1.59 |
Total from investment operations | 4.29 | (1.21) | (3.56) | 1.62 | 1.64 |
Distributions from net investment income | (.09) | (.12) | - | - | - |
Distributions from net realized gain | - | - | (.08) | - | - |
Total distributions | (.09) | (.12) | (.08) | - | - |
Net asset value, end of period | $ 12.49 | $ 8.29 | $ 9.62 | $ 13.26 | $ 11.64 |
Total ReturnB,C,D | 52.29% | (12.87)% | (26.97)% | 13.92% | 16.40% |
Ratios to Average Net AssetsH | | | | |
Expenses before
expense reductions | 5.92% | 5.99% | 4.96% | 3.95% | 8.60%A |
Expenses net of voluntary waivers, if any | 2.02% | 2.15% | 2.11% | 2.06% | 2.01%A |
Expenses net of all reductions | 2.02% | 2.12% | 2.05% | 2.04% | 1.99%A |
Net investment income (loss) | 1.22% | .86% | 1.22% | (.50)% | .50%A |
Supplemental Data | | | | | |
Net assets, end of period
(000 omitted) | $ 918 | $ 428 | $ 546 | $ 921 | $ 756 |
Portfolio turnover rate | 67% | 132% | 111% | 52% | 50%A |
A Annualized
B Total returns for periods of less than one year are not annualized.
C Total returns would have been lower had certain expenses not been reduced during the periods shown.
D Total returns do not include the effect of the sales charges.
E Calculated based on average shares outstanding during the period.
F Investment income per share reflects a special dividend which amounted to $.06 per share.
G For the period December 21, 1998 (commencement of operations) to October 31, 1999.
H Expense ratios reflect operating expenses of the class. Expenses before reductions do not reflect amounts reimbursed by the investment adviser or reductions from brokerage service arrangements or other expense offset arrangements and do not represent the amount paid by the class during periods when reimbursements or reductions occur. Expense ratios before reductions for start-up periods may not be representative of longer-term operating periods. Expenses net of any voluntary waivers reflect expenses after reimbursement by the investment adviser but prior to reductions from brokerage service arrangements or other expense offset arrangements. Expenses net of all reductions represent the net expenses paid by the class.
See accompanying notes which are an integral part of the financial statements.
Annual Report
Financial Highlights - Class T
Years ended October 31, | 2003 | 2002 | 2001 | 2000 | 1999G |
Selected Per-Share Data | | | | | |
Net asset value, beginning of period | $ 8.24 | $ 9.57 | $ 13.21 | $ 11.62 | $ 10.00 |
Income from Investment Operations | | | | | |
Net investment income (loss)E | .10 | .06 | .11F | (.11) | .02 |
Net realized and unrealized gain (loss) | 4.16 | (1.30) | (3.67) | 1.70 | 1.60 |
Total from investment operations | 4.26 | (1.24) | (3.56) | 1.59 | 1.62 |
Distributions from net investment income | (.06) | (.09) | - | - | - |
Distributions from net realized gain | - | - | (.08) | - | - |
Total distributions | (.06) | (.09) | (.08) | - | - |
Net asset value, end of period | $ 12.44 | $ 8.24 | $ 9.57 | $ 13.21 | $ 11.62 |
Total ReturnB,C,D | 52.06% | (13.18)% | (27.07)% | 13.68% | 16.20% |
Ratios to Average Net AssetsH | | | | |
Expenses before
expense reductions | 6.58% | 6.65% | 5.48% | 4.26% | 8.92%A |
Expenses net of voluntary waivers, if any | 2.27% | 2.40% | 2.36% | 2.32% | 2.26%A |
Expenses net of all reductions | 2.27% | 2.37% | 2.30% | 2.30% | 2.24%A |
Net investment income (loss) | .97% | .61% | .97% | (.75)% | .25%A |
Supplemental Data | | | | | |
Net assets, end of period
(000 omitted) | $ 1,315 | $ 836 | $ 1,124 | $ 2,041 | $ 1,065 |
Portfolio turnover rate | 67% | 132% | 111% | 52% | 50%A |
A Annualized
B Total returns for periods of less than one year are not annualized.
C Total returns would have been lower had certain expenses not been reduced during the periods shown.
D Total returns do not include the effect of the sales charges.
E Calculated based on average shares outstanding during the period.
F Investment income per share reflects a special dividend which amounted to $.06 per share.
G For the period December 21, 1998 (commencement of operations) to October 31, 1999.
H Expense ratios reflect operating expenses of the class. Expenses before reductions do not reflect amounts reimbursed by the investment adviser or reductions from brokerage service arrangements or other expense offset arrangements and do not represent the amount paid by the class during periods when reimbursements or reductions occur. Expense ratios before reductions for start-up periods may not be representative of longer-term operating periods. Expenses net of any voluntary waivers reflect expenses after reimbursement by the investment adviser but prior to reductions from brokerage service arrangements or other expense offset arrangements. Expenses net of all reductions represent the net expenses paid by the class.
See accompanying notes which are an integral part of the financial statements.
Annual Report
Financial Highlights - Class B
Years ended October 31, | 2003 | 2002 | 2001 | 2000 | 1999G |
Selected Per-Share Data | | | | | |
Net asset value, beginning of period | $ 8.13 | $ 9.44 | $ 13.08 | $ 11.58 | $ 10.00 |
Income from Investment Operations | | | | | |
Net investment income (loss)E | .05 | .01 | .05F | (.18) | (.02) |
Net realized and unrealized gain (loss) | 4.12 | (1.28) | (3.61) | 1.68 | 1.60 |
Total from investment operations | 4.17 | (1.27) | (3.56) | 1.50 | 1.58 |
Distributions from net investment income | (.01) | (.04) | - | - | - |
Distributions from net realized gain | - | - | (.08) | - | - |
Total distributions | (.01) | (.04) | (.08) | - | - |
Net asset value, end of period | $ 12.29 | $ 8.13 | $ 9.44 | $ 13.08 | $ 11.58 |
Total ReturnB,C,D | 51.35% | (13.56)% | (27.34)% | 12.95% | 15.80% |
Ratios to Average Net AssetsH | | | | |
Expenses before expense
reductions | 6.80% | 6.90% | 5.81% | 4.78% | 9.44%A |
Expenses net of voluntary waivers, if any | 2.77% | 2.90% | 2.86% | 2.82% | 2.76%A |
Expenses net of all reductions | 2.77% | 2.87% | 2.80% | 2.80% | 2.74%A |
Net investment income (loss) | .47% | .11% | .46% | (1.25)% | (.25)%A |
Supplemental Data | | | | | |
Net assets, end of period (000 omitted) | $ 1,513 | $ 814 | $ 1,003 | $ 1,659 | $ 912 |
Portfolio turnover rate | 67% | 132% | 111% | 52% | 50%A |
A Annualized
B Total returns for periods of less than one year are not annualized.
C Total returns would have been lower had certain expenses not been reduced during the periods shown.
D Total returns do not include the effect of the contingent deferred sales charge.
E Calculated based on average shares outstanding during the period.
F Investment income per share reflects a special dividend which amounted to $.06 per share.
G For the period December 21, 1998 (commencement of operations) to October 31, 1999.
H Expense ratios reflect operating expenses of the class. Expenses before reductions do not reflect amounts reimbursed by the investment adviser or reductions from brokerage service arrangements or other expense offset arrangements and do not represent the amount paid by the class during periods when reimbursements or reductions occur. Expense ratios before reductions for start-up periods may not be representative of longer-term operating periods. Expenses net of any voluntary waivers reflect expenses after reimbursement by the investment adviser but prior to reductions from brokerage service arrangements or other expense offset arrangements. Expenses net of all reductions represent the net expenses paid by the class.
See accompanying notes which are an integral part of the financial statements.
Annual Report
Financial Highlights - Class C
Years ended October 31, | 2003 | 2002 | 2001 | 2000 | 1999G |
Selected Per-Share Data | | | | | |
Net asset value, beginning of period | $ 8.11 | $ 9.43 | $ 13.07 | $ 11.57 | $ 10.00 |
Income from Investment Operations | | | | | |
Net investment income (loss)E | .05 | .01 | .06F | (.18) | (.02) |
Net realized and unrealized gain (loss) | 4.10 | (1.28) | (3.62) | 1.68 | 1.59 |
Total from investment operations | 4.15 | (1.27) | (3.56) | 1.50 | 1.57 |
Distributions from net investment income | (.01) | (.05) | - | - | - |
Distributions from net realized gain | - | - | (.08) | - | - |
Total distributions | (.01) | (.05) | (.08) | - | - |
Net asset value, end of period | $ 12.25 | $ 8.11 | $ 9.43 | $ 13.07 | $ 11.57 |
Total ReturnB,C,D | 51.23% | (13.60)% | (27.36)% | 12.96% | 15.70% |
Ratios to Average Net AssetsH | | | | | |
Expenses before expense
reductions | 6.85% | 6.88% | 5.82% | 4.76% | 9.42%A |
Expenses net of voluntary waivers, if any | 2.77% | 2.90% | 2.86% | 2.82% | 2.76%A |
Expenses net of all reductions | 2.77% | 2.87% | 2.79% | 2.80% | 2.74%A |
Net investment income (loss) | .47% | .11% | .47% | (1.25)% | (.25)%A |
Supplemental Data | | | | | |
Net assets, end of period (000 omitted) | $ 1,114 | $ 686 | $ 759 | $ 1,165 | $ 708 |
Portfolio turnover rate | 67% | 132% | 111% | 52% | 50%A |
A Annualized
B Total returns for periods of less than one year are not annualized.
C Total returns would have been lower had certain expenses not been reduced during the periods shown.
D Total returns do not include the effect of the contingent deferred sales charge.
E Calculated based on average shares outstanding during the period.
F Investment income per share reflects a special dividend which amounted to $.06 per share.
G For the period December 21, 1998 (commencement of operations) to October 31, 1999.
H Expense ratios reflect operating expenses of the class. Expenses before reductions do not reflect amounts reimbursed by the investment adviser or reductions from brokerage service arrangements or other expense offset arrangements and do not represent the amount paid by the class during periods when reimbursements or reductions occur. Expense ratios before reductions for start-up periods may not be representative of longer-term operating periods. Expenses net of any voluntary waivers reflect expenses after reimbursement by the investment adviser but prior to reductions from brokerage service arrangements or other expense offset arrangements. Expenses net of all reductions represent the net expenses paid by the class.
See accompanying notes which are an integral part of the financial statements.
Annual Report
Financial Highlights - Institutional Class
Years ended October 31, | 2003 | 2002 | 2001 | 2000 | 1999F |
Selected Per-Share Data | | | | | |
Net asset value, beginning of period | $ 8.35 | $ 9.69 | $ 13.32 | $ 11.67 | $ 10.00 |
Income from Investment Operations | | | | | |
Net investment income (loss)D | .14 | .11 | .17E | (.04) | .07 |
Net realized and unrealized gain (loss) | 4.24 | (1.30) | (3.72) | 1.69 | 1.60 |
Total from investment operations | 4.38 | (1.19) | (3.55) | 1.65 | 1.67 |
Distributions from net investment income | (.09) | (.15) | - | - | - |
Distributions from net realized gain | - | - | (.08) | - | - |
Total distributions | (.09) | (.15) | (.08) | - | - |
Net asset value, end of period | $ 12.64 | $ 8.35 | $ 9.69 | $ 13.32 | $ 11.67 |
Total ReturnB,C | 52.99% | (12.65)% | (26.77)% | 14.14% | 16.70% |
Ratios to Average Net AssetsG | | | | |
Expenses before expense
reductions | 5.40% | 5.49% | 4.54% | 3.56% | 8.32%A |
Expenses net of voluntary waivers, if any | 1.77% | 1.90% | 1.86% | 1.81% | 1.76%A |
Expenses net of all reductions | 1.77% | 1.87% | 1.80% | 1.79% | 1.74%A |
Net investment income (loss) | 1.47% | 1.11% | 1.46% | (.25) % | .75%A |
Supplemental Data | | | | | |
Net assets, end of period (000 omitted) | $ 210 | $ 285 | $ 344 | $ 524 | $ 472 |
Portfolio turnover rate | 67% | 132% | 111% | 52% | 50%A |
A Annualized
B Total returns for periods of less than one year are not annualized.
C Total returns would have been lower had certain expenses not been reduced during the periods shown.
D Calculated based on average shares outstanding during the period.
E Investment income per share reflects a special dividend which amounted to $.06 per share.
F For the period December 21, 1998 (commencement of operations) to October 31, 1999.
G Expense ratios reflect operating expenses of the class. Expenses before reductions do not reflect amounts reimbursed by the investment adviser or reductions from brokerage service arrangements or other expense offset arrangements and do not represent the amount paid by the class during periods when reimbursements or reductions occur. Expense ratios before reductions for start-up periods may not be representative of longer-term operating periods. Expenses net of any voluntary waivers reflect expenses after reimbursement by the investment adviser but prior to reductions from brokerage service arrangements or other expense offset arrangements. Expenses net of all reductions represent the net expenses paid by the class.
See accompanying notes which are an integral part of the financial statements.
Annual Report
Notes to Financial Statements
For the period ended October 31, 2003
1. Significant Accounting Policies.
Fidelity Advisor Latin America Fund (the fund) is a fund of Fidelity Advisor Series VIII (the trust) and is authorized to issue an unlimited number of shares. The trust is registered under the Investment Company Act of 1940, as amended (the 1940 Act), as an open-end management investment company organized as a Massachusetts business trust.
The fund offers Class A, Class T, Class B, Class C, and Institutional Class shares, each of which has equal rights as to assets and voting privileges. Each class has exclusive voting rights with respect to matters that affect that class. Class B shares will automatically convert to Class A shares after a holding period of seven years from the initial date of purchase. Investment income, realized and unrealized capital gains and losses, the common expenses of the fund, and certain fund-level expense reductions, if any, are allocated on a pro rata basis to each class based on the relative net assets of each class to the total net assets of the fund. Each class differs with respect to transfer agent and distribution and service plan fees incurred. Certain expense reductions also differ by class.
The fund's investments in emerging markets can be subject to social, economic, regulatory, and political uncertainties and can be extremely volatile.
The financial statements have been prepared in conformity with accounting principles generally accepted in the United States of America, which require management to make certain estimates and assumptions at the date of the financial statements. The following summarizes the significant accounting policies of the fund:
Security Valuation. Net asset value per share (NAV calculation) is calculated as of the close of business of the New York Stock Exchange, normally 4:00 p.m. Eastern time. Equity securities for which market quotations are available are valued at the last sale price or official closing price (closing bid price or last evaluated quote if no sale has occurred) on the primary market or exchange on which they trade. If an event that is expected to materially affect the value of a security occurs after the close of an exchange or market on which that security trades, but prior to the NAV calculation, then that security will be fair valued taking the event into account. Securities (including restricted securities) for which market quotations are not readily available are valued at their fair value as determined in good faith under consistently applied procedures under the general supervision of the Board of Trustees. Price movements in futures contracts and ADRs, market and trading trends, the bid/ask quotes of brokers and off-exchange institutional trading may be reviewed in the course of making a good faith determination of a security's fair value. Short-term securities with remaining maturities of sixty days or less for which quotations are not readily available are valued on the basis of amortized cost. Investments in open-end investment companies are valued at their net asset value each business day.
Annual Report
Notes to Financial Statements - continued
1. Significant Accounting Policies - continued
Foreign Currency. The fund uses foreign currency contracts to facilitate transactions in foreign-denominated securities. Losses from these transactions may arise from changes in the value of the foreign currency or if the counterparties do not perform under the contracts' terms.
Foreign denominated assets, including investment securities, and liabilities are translated into U.S. dollars at the exchange rate at period end. Purchases and sales of investment securities, income and dividends received and expenses denominated in foreign currencies are translated into U.S. dollars at the exchange rate in effect on the transaction date.
The effects of exchange rate fluctuations on investments are included with the net realized and unrealized gain (loss) on investment securities. Other foreign currency transactions resulting in realized and unrealized gain (loss) are disclosed separately.
Investment Transactions and Income. Security transactions are accounted for as of trade date. Gains and losses on securities sold are determined on the basis of identified cost. Dividend income is recorded on the ex-dividend date, except for certain dividends from foreign securities where the ex-dividend date may have passed, which are recorded as soon as the fund is informed of the ex-dividend date. Non-cash dividends included in dividend income, if any, are recorded at the fair market value of the securities received. Interest income is accrued as earned. Interest income includes coupon interest and amortization of premium and accretion of discount on debt securities, which is accrued using the interest method. Investment income is recorded net of foreign taxes withheld where recovery of such taxes is uncertain.
Expenses. Most expenses of the trust can be directly attributed to a fund. Expenses which cannot be directly attributed are apportioned among the funds in the trust.
Income Tax Information and Distributions to Shareholders. Each year the fund intends to qualify as a regulated investment company by distributing all of its taxable income and realized gains under Subchapter M of the Internal Revenue Code. As a result, no provision for income taxes is required in the accompanying financial statements. Foreign taxes are provided for based on each fund's understanding of the tax rules and rates that exist in the foreign markets in which it invests. Income dividends and capital gain distributions are declared separately for each class. Distributions are recorded on the ex-dividend date.
Income and capital gain distributions are determined in accordance with income tax regulations, which may differ from generally accepted accounting principles. Capital accounts within the financial statements are adjusted for permanent and temporary book and tax differences. These adjustments have no impact on net assets or the results
Annual Report
1. Significant Accounting Policies - continued
Income Tax Information and Distributions to Shareholders - continued
of operations. Temporary differences will reverse in a subsequent period. These differences are primarily due to foreign currency transactions, capital loss carryforwards and losses deferred due to wash sales.
The tax-basis components of distributable earnings and the federal tax cost as of period end were as follows:
Unrealized appreciation | $ 934,752 | |
Unrealized depreciation | (110,966) | |
Net unrealized appreciation (depreciation) | 823,786 | |
Undistributed ordinary income | 10,342 | |
Capital loss carryforward | (919,319) | |
Cost for federal income tax purposes | $ 4,314,100 | |
The tax character of distributions paid was as follows:
| October 31,
2003 | October 31,
2002 |
Ordinary Income | $ 15,776 | $ 31,879 |
Short-Term Trading (Redemption) Fees. Shares purchased on or after March 31, 2004 and held in the fund less than 90 days will be subject to a short-term trading fee equal to 1.50% of the proceeds of the redeemed shares. The fee, which will be retained by the fund, is accounted for as an addition to paid in capital.
2. Operating Policies.
Repurchase Agreements. Fidelity Management & Research Company (FMR) has received an Exemptive Order from the Securities and Exchange Commission (the SEC) which permits the fund and other affiliated entities of FMR to transfer uninvested cash balances into joint trading accounts. These accounts are then invested in repurchase agreements that are collateralized by U.S. Treasury or Government obligations. The fund may also invest directly with institutions, in repurchase agreements that are collateralized by commercial paper obligations and corporate obligations. Collateral is held in segregated accounts with custodian banks and may be obtained in the event of a default of the counterparty. Collateral is marked-to-market daily and maintained at a value at least equal to the principal amount of the repurchase agreement (including accrued interest).
Annual Report
Notes to Financial Statements - continued
3. Purchases and Sales of Investments.
Information regarding purchases and sales of securities is included under the caption "Other Information" at the end of the fund's Schedule of Investments.
4. Fees and Other Transactions with Affiliates.
Management Fee. FMR and its affiliates provide the fund with investment management related services for which the fund pays a monthly management fee. The management fee is the sum of an individual fund fee rate that is based on an annual rate of .45% of the fund's average net assets and a group fee rate that averaged .28% during the period. The group fee rate is based upon the average net assets of all the mutual funds advised by FMR. The group fee rate decreases as assets under management increase and increases as assets under management decrease. For the period, the total annual management fee rate was .73% of the fund's average net assets.
Distribution and Service Plan. In accordance with Rule 12b-1 of the 1940 Act, the Fund has adopted separate Distribution and Service Plans for each class of shares. Certain classes pay Fidelity Distributors Corporation (FDC), an affiliate of FMR, separate Distribution and Service Fees, each of which is based on an annual percentage of each class' average net assets. Class A and Class T Plans also authorize the use of brokerage commissions to pay distribution expenses. This practice has been discontinued and no commissions incurred after June 30, 2003 have been used to pay distribution expenses. In addition, FDC may pay financial intermediaries for selling shares of the fund and providing shareholder support services. For the period, the Distribution and Service Fee rates, the total amounts paid to and retained by FDC and the amount of distribution expenses paid with brokerage commissions were as follows:
| Distribution
Fee | Service
Fee | Paid to
FDC | Retained
by FDC | Paid with
Commissions |
Class A | - | .25% | $ 1,684 | $ 473 | $ - |
Class T | .25% | .25% | 5,034 | 657 | - |
Class B | .75% | .25% | 10,767 | 8,471 | - |
Class C | .75% | .25% | 8,188 | 3,385 | - |
| | | $ 25,673 | $ 12,986 | $ - |
Sales Load. FDC receives a front-end sales charge of up to 5.75% for selling Class A shares, and 3.50% for selling Class T shares of the fund. FDC receives the proceeds of contingent deferred sales charges levied on Class A, Class T, Class B, and Class C redemptions. These charges depend on the holding period. The deferred sales charges range from 5% to 1% for Class B, 1% for Class C, and .25% for certain purchases of Class A and Class T shares.
Annual Report
4. Fees and Other Transactions with Affiliates - continued
Sales Load - continued
For the period, sales charge amounts retained by FDC were as follows:
| Retained
by FDC |
Class A | $ 283 |
Class T | 468 |
Class B* | 3,524 |
Class C* | 657 |
| $ 4,932 |
* When Class B and Class C shares are initially sold, FDC pays commissions from its own resources to financial intermediaries through which the sales
are made.
Transfer Agent Fees. Fidelity Investments Institutional Operations Company, Inc. (FIIOC), an affiliate of FMR, is the transfer, dividend disbursing and shareholder servicing agent (collectively referred to as the transfer agent) for each class of the fund. FIIOC receives account fees and asset-based fees that vary according to the account size and type of account of the shareholders of the respective classes of the fund. FIIOC pays for typesetting, printing and mailing of all shareholder reports, except proxy statements. For the period, the following amounts were paid to FIIOC:
| Amount | % of
Average
Net Assets |
Class A | $ 3,478 | .51 |
Class T | 9,333 | .92 |
Class B | 6,986 | .64 |
Class C | 5,751 | .70 |
Institutional Class | 748 | .24 |
| $ 26,296 | |
Accounting Fees. Fidelity Service Company, Inc. (FSC), an affiliate of FMR, maintains the fund's accounting records. The fee is based on the level of average net assets for the month plus out-of-pocket expenses.
Central Funds. The fund may invest in affiliated Central Funds managed by Fidelity Investments Money Management, Inc. (FIMM), an affiliate of FMR. The Central Funds are open-end investment companies available only to investment companies and other accounts managed by FMR and its affiliates. The Central Funds seek preservation of capital and current income and do not pay a management fee. Income distributions earned by the fund are recorded as income in the accompanying financial statements and totaled $1,223 for the period.
Annual Report
Notes to Financial Statements - continued
4. Fees and Other Transactions with Affiliates - continued
Brokerage Commissions. The fund placed a portion of its portfolio transactions with brokerage firms which are affiliates of the investment adviser. The commissions paid to these affiliated firms are shown under the caption "Other Information" at the end of the fund's Schedule of Investments.
5. Committed Line of Credit.
The fund participates with other funds managed by FMR in a $3.5 billion credit facility (the "line of credit") to be utilized for temporary or emergency purposes to fund shareholder redemptions or for other short-term liquidity purposes. The fund has agreed to pay commitment fees on its pro rata portion of the line of credit. During the period, there were no borrowings on this line of credit.
6. Expense Reductions.
FMR agreed to reimburse the classes of the fund to the extent operating expenses exceeded certain levels of average net assets as noted in the table below. Some expenses, for example interest expense, are excluded from this reimbursement.
| Expense
Limitations | Reimbursement
from adviser |
| | |
Class A | 2.00% | $ 26,482 |
Class T | 2.25% | 43,639 |
Class B | 2.75% | 43,679 |
Class C | 2.75% | 33,603 |
Institutional Class | 1.75% | 11,118 |
| | $ 158,521 |
7. Other Information.
At the end of the period, FMR or its affiliates were the owners of record of 22% of the total outstanding shares of the fund.
Annual Report
8. Distributions to Shareholders.
Distributions to shareholders of each class were as follows:
| Years ended October 31, |
| 2003 | 2002 |
From net investment income | | |
Class A | $ 4,772 | $ 7,589 |
Class T | 6,047 | 10,635 |
Class B | 1,047 | 4,189 |
Class C | 844 | 4,139 |
Institutional Class | 3,066 | 5,327 |
Total | $ 15,776 | $ 31,879 |
9. Share Transactions.
Transactions for each class of shares were as follows:
| Shares | Dollars |
| Years ended October 31, | Years ended October 31, |
| 2003 | 2002 | 2003 | 2002 |
Class A | | | | |
Shares sold | 109,782 | 22,373 | $ 1,122,639 | $ 238,302 |
Reinvestment of distributions | 545 | 613 | 4,552 | 6,665 |
Shares redeemed | (88,522) | (28,099) | (924,690) | (283,276) |
Net increase (decrease) | 21,805 | (5,113) | $ 202,501 | $ (38,309) |
Class T | | | | |
Shares sold | 24,645 | 18,573 | $ 244,830 | $ 199,995 |
Reinvestment of distributions | 697 | 886 | 5,809 | 9,606 |
Shares redeemed | (20,992) | (35,507) | (197,995) | (370,145) |
Net increase (decrease) | 4,350 | (16,048) | $ 52,644 | $ (160,544) |
Class B | | | | |
Shares sold | 43,421 | 33,046 | $ 457,257 | $ 330,985 |
Reinvestment of distributions | 123 | 382 | 1,015 | 4,097 |
Shares redeemed | (20,525) | (39,558) | (220,237) | (370,618) |
Net increase (decrease) | 23,019 | (6,130) | $ 238,035 | $ (35,536) |
Class C | | | | |
Shares sold | 28,484 | 26,445 | $ 299,810 | $ 278,879 |
Reinvestment of distributions | 101 | 351 | 836 | 3,758 |
Shares redeemed | (22,180) | (22,821) | (218,153) | (232,848) |
Net increase (decrease) | 6,405 | 3,975 | $ 82,493 | $ 49,789 |
Institutional Class | | | | |
Shares sold | 109,911 | 9 | $ 1,110,748 | $ 100 |
Reinvestment of distributions | 356 | 478 | 3,005 | 5,226 |
Shares redeemed | (127,691) | (1,935) | (1,293,356) | (22,038) |
Net increase (decrease) | (17,424) | (1,448) | $ (179,603) | $ (16,712) |
Annual Report
Report of Independent Auditors
To the Trustees of Fidelity Advisor Series VIII and the Shareholders of Fidelity Advisor Latin America Fund.
In our opinion, the accompanying statement of assets and liabilities, including the schedule of investments, and the related statements of operations and of changes in net assets and the financial highlights present fairly, in all material respects, the financial position of Fidelity Advisor Latin America Fund (a fund of Fidelity Advisor Series VIII) at October 31, 2003 and the results of its operations, the changes in its net assets and the financial highlights for the periods indicated, in conformity with accounting principles generally accepted in the United States of America. These financial statements and financial highlights (hereafter referred to as "financial statements") are the responsibility of the Fidelity Advisor Latin America Fund's management; our responsibility is to express an opinion on these financial statements based on our audits. We conducted our audits of these financial statements in accordance with auditing standards generally accepted in the United States of America which require that we plan and perform the audit to obtain reasonable assurance about whether the financial statements are free of material misstatement. An audit includes examining, on a test basis, evidence supporting the amounts and disclosures in the financial statements, assessing the accounting principles used and significant estimates made by management, and evaluating the overall financial statement presentation. We believe that our audits, which included confirmation of securities at October 31, 2003 by correspondence with the custodian and brokers, provide a reasonable basis for our opinion.
/s/PricewaterhouseCoopers LLP
PricewaterhouseCoopers LLP
Boston, Massachusetts
December 12, 2003
Annual Report
Trustees and Officers
The Trustees, Members of the Advisory Board, and executive officers of the trust and fund, as applicable, are listed below. The Board of Trustees governs the fund and is responsible for protecting the interests of shareholders. The Trustees are experienced executives who meet periodically throughout the year to oversee the fund's activities, review contractual arrangements with companies that provide services to the fund, and review the fund's performance. Except for William O. McCoy, each of the Trustees oversees 289 funds advised by FMR or an affiliate. Mr. McCoy oversees 291 funds advised by FMR or an affiliate.
The Trustees hold office without limit in time except that (a) any Trustee may resign; (b) any Trustee may be removed by written instrument, signed by at least two-thirds of the number of Trustees prior to such removal; (c) any Trustee who requests to be retired or who has become incapacitated by illness or injury may be retired by written instrument signed by a majority of the other Trustees; and (d) any Trustee may be removed at any special meeting of shareholders by a two-thirds vote of the outstanding voting securities of the trust. In any event, each non-interested Trustee shall retire not later than the last day of the calendar year in which his or her 72nd birthday occurs. The executive officers and Advisory Board Members hold office without limit in time, except that any officer and Advisory Board Member may resign or may be removed by a vote of a majority of the Trustees at any regular meeting or any special meeting of the Trustees. Except as indicated, each individual has held the office shown or other offices in the same company for the past five years.
The fund's Statement of Additional Information (SAI) includes more information about the Trustees. To request a free copy, call Fidelity at 1-877-208-0098.
Interested Trustees*:
Correspondence intended for each Trustee who is an "interested person" (as defined in the 1940 Act) may be sent to 82 Devonshire Street, Boston, Massachusetts 02109.
Name, Age; Principal Occupation |
Edward C. Johnson 3d (73)** |
| Year of Election or Appointment: 1983 Mr. Johnson is Chairman of the Board of Trustees. Mr. Johnson serves as Chief Executive Officer, Chairman, and a Director of FMR Corp.; a Director and Chairman of the Board and of the Executive Committee of FMR; Chairman and a Director of Fidelity Management & Research (Far East) Inc.; Chairman (1998) and a Director of Fidelity Investments Money Management, Inc.; and Chairman (2001) and a Director (2000) of FMR Co., Inc. |
Abigail P. Johnson (41)** |
| Year of Election or Appointment: 2001 Senior Vice President of Advisor Latin America (2001). Ms. Johnson also serves as Senior Vice President of other Fidelity funds (2001). She is President and a Director of FMR (2001), Fidelity Investments Money Management, Inc. (2001), FMR Co., Inc. (2001), and a Director of FMR Corp. Previously, Ms. Johnson managed a number of Fidelity funds. |
Laura B. Cronin (49) |
| Year of Election or Appointment: 2003 Ms. Cronin is an Executive Vice President (2002) and Chief Financial Officer (2002) of FMR Corp. and is a member of the Fidelity Management Committee (2003). Previously, Ms. Cronin served as Vice President of Finance of FMR (1997-1999), and Chief Financial Officer of FMR (1999-2001), Fidelity Personal Investments (2001), and Fidelity Brokerage Company (2001-2002). |
Robert L. Reynolds (51) |
| Year of Election or Appointment: 2003 Mr. Reynolds is a Director (2003) and Chief Operating Officer (2002) of FMR Corp. and is the head of the Fidelity Management Committee (2003). He also serves on the Board at Fidelity Investments Canada, Ltd. (2000). Previously, Mr. Reynolds served as President of Fidelity Investments Institutional Retirement Group (1996-2000). |
* Trustees have been determined to be "Interested Trustees" by virtue of, among other things, their affiliation with the trust or various entities under common control with FMR.
** Edward C. Johnson 3d, Trustee, is Abigail P. Johnson's father.
Annual Report
Non-Interested Trustees:
Correspondence intended for each non-interested Trustee (that is, the Trustees other than the Interested Trustees) may be sent to Fidelity Investments, P.O. Box 55235, Boston, Massachusetts 02205-5235.
Name, Age; Principal Occupation |
J. Michael Cook (61) |
| Year of Election or Appointment: 2001 Prior to Mr. Cook's retirement in May 1999, he served as Chairman and Chief Executive Officer of Deloitte & Touche LLP (accounting/consulting), Chairman of the Deloitte & Touche Foundation, and a member of the Board of Deloitte Touche Tohmatsu. He currently serves as a Director of Comcast (telecommunications, 2002), International Flavors & Fragrances, Inc. (2000), Rockwell Automation (2000) and The Dow Chemical Company (2000). He is a Member of the Diversity Advisory Council of Marakon (2003) and the Advisory Board of the Directorship Search Group, Chairman Emeritus of the Board of Catalyst (a leading organization for the advancement of women in business), and is Chairman of the Accountability Advisory Council to the Comptroller General of the United States. He also serves as a Member of the Advisory Board of the Graduate School of Business of the University of Florida, his alma mater. |
Ralph F. Cox (71) |
| Year of Election or Appointment: 1991 Mr. Cox is President of RABAR Enterprises (management consulting for the petroleum industry). Prior to February 1994, he was President of Greenhill Petroleum Corporation (petroleum exploration and production). Until March 1990, Mr. Cox was President and Chief Operating Officer of Union Pacific Resources Company (exploration and production). He is a Director of CH2M Hill Companies (engineering), and Abraxas Petroleum (petroleum exploration and production, 1999). In addition, he is a member of advisory boards of Texas A&M University and the University of Texas at Austin. |
Phyllis Burke Davis (71) |
| Year of Election or Appointment: 1992 Mrs. Davis is retired from Avon Products, Inc. (consumer products) where she held various positions including Senior Vice President of Corporate Affairs and Group Vice President of U.S. product marketing, sales, distribution, and manufacturing. Mrs. Davis is a member of the Board of Directors of the Southampton Hospital in Southampton, N.Y. (1998). Previously, she served as a Director of BellSouth Corporation (telecommunications), Eaton Corporation (diversified industrial), the TJX Companies, Inc. (retail stores), Hallmark Cards, Inc., and Nabisco Brands, Inc. |
Robert M. Gates (60) |
| Year of Election or Appointment: 1997 Dr. Gates is President of Texas A&M University (2002). He was Director of the Central Intelligence Agency (CIA) from 1991 to 1993. From 1989 to 1991, Dr. Gates served as Assistant to the President of the United States and Deputy National Security Advisor. Dr. Gates is a Director of NACCO Industries, Inc. (mining and manufacturing), and Parker Drilling Co., Inc. (drilling and rental tools for the energy industry, 2001). He also serves as a member of the Advisory Board of VoteHere.net (secure internet voting, 2001). Previously, Dr. Gates served as a Director of LucasVarity PLC (automotive components and diesel engines), a Director of TRW Inc. (automotive, space, defense, and information technology), and Dean of the George Bush School of Government and Public Service at Texas A&M University (1999-2001). Dr. Gates also is a Trustee of the Forum for International Policy. |
Donald J. Kirk (70) |
| Year of Election or Appointment: 1987 Mr. Kirk is a Governor of the American Stock Exchange (2001), a Trustee and former Chairman of the Board of Trustees of the Greenwich Hospital Association, a Director of the Yale-New Haven Health Services Corp. (1998), and a Director Emeritus and former Chairman of the Board of Directors of National Arts Strategies Inc. Mr. Kirk was an Executive-in-Residence (1995-2000) and a Professor (1987-1995) at Columbia University Graduate School of Business. Prior to 1987, he was Chairman of the Financial Accounting Standards Board. Previously, Mr. Kirk served as a Governor of the National Association of Securities Dealers, Inc. (1996-2002), a member and Vice Chairman of the Public Oversight Board of the American Institute of Certified Public Accountants' SEC Practice Section (1995-2002), a Director of General Re Corporation (reinsurance, 1987-1998) and as a Director of Valuation Research Corp. (appraisals and valuations). |
Marie L. Knowles (57) |
| Year of Election or Appointment: 2001 Prior to Ms. Knowles' retirement in June 2000, she served as Executive Vice President and Chief Financial Officer of Atlantic Richfield Company (ARCO) (diversified energy, 1996-2000). From 1993 to 1996, she was a Senior Vice President of ARCO and President of ARCO Transportation Company. She served as a Director of ARCO from 1996 to 1998. She currently serves as a Director of Phelps Dodge Corporation (copper mining and manufacturing), URS Corporation (multidisciplinary engineering, 1999), and McKesson Corporation (healthcare service, 2002). Ms. Knowles is a Trustee of the Brookings Institution and the Catalina Island Conservancy and also serves as a member of the Advisory Board for the School of Engineering of the University of Southern California. |
Ned C. Lautenbach (59) |
| Year of Election or Appointment: 2000 Mr. Lautenbach has been a partner of Clayton, Dubilier & Rice, Inc. (private equity investment firm) since September 1998. Previously, Mr. Lautenbach was with the International Business Machines Corporation (IBM) from 1968 until his retirement in 1998. He was most recently Senior Vice President and Group Executive of Worldwide Sales and Services. From 1993 to 1995, he was Chairman of IBM World Trade Corporation, and from 1994 to 1998 was a member of IBM's Corporate Executive Committee. Mr. Lautenbach serves as Chairman and as a Director (1998) of Acterna Corporation (communications test equipment). He is also Co-Chairman of Covansys, Inc. (global provider of business and technology solutions, 2000). In addition, he is a Director of Eaton Corporation (diversified industrial) and the Philharmonic Center for the Arts in Naples, Florida (1999). He also is a member of the Council on Foreign Relations. |
Marvin L. Mann (70) |
| Year of Election or Appointment: 1993 Mr. Mann is Chairman of the non-interested Trustees (2001). He is Chairman Emeritus of Lexmark International, Inc. (computer peripherals) where he served as CEO until April 1998 and retired as Chairman May 1999, and remains a member of the Board. Prior to 1991, he held the positions of Vice President of International Business Machines Corporation (IBM) and President and General Manager of various IBM divisions and subsidiaries. Mr. Mann is a Board member of Imation Corp. (imaging and information storage) and Acterna Corporation (communications test equipment, 1999). He is also a member of the Director Services Committee of the Investment Company Institute. In addition, Mr. Mann is a member of the President's Cabinet at the University of Alabama and the Board of Visitors of the Culverhouse College of Commerce and Business Administration at the University of Alabama. |
William O. McCoy (70) |
| Year of Election or Appointment: 1997 Prior to his retirement in December 1994, Mr. McCoy was Vice Chairman of the Board of BellSouth Corporation (telecommunications) and President of BellSouth Enterprises. He is currently a Director of Liberty Corporation (holding company), Duke Realty Corporation (real estate), Progress Energy, Inc. (electric utility), and Acterna Corporation (communications test equipment, 1999). He is also a partner of Franklin Street Partners (private investment management firm) and a member of the Research Triangle Foundation Board. In addition, Mr. McCoy served as the Interim Chancellor (1999-2000) and a member of the Board of Visitors (1994-1998) for the University of North Carolina at Chapel Hill and currently serves on the Board of Directors of the University of North Carolina Health Care System and the Board of Visitors of the Kenan-Flagler Business School (University of North Carolina at Chapel Hill). He also served as Vice President of Finance for the University of North Carolina (16-school system, 1995-1998). |
William S. Stavropoulos (64) |
| Year of Election or Appointment: 2001 Mr. Stavropoulos is Chairman of the Board, President and CEO (2002), and Chairman of the Executive Committee (2000) and a Director of The Dow Chemical Company. Since joining The Dow Chemical Company in 1967, Mr. Stavropoulos served in numerous senior management positions, including President (1993-2000) and Chief Executive Officer (1995-2000). Currently, he is a Director of NCR Corporation (data warehousing and technology solutions), BellSouth Corporation (telecommunications), Chemical Financial Corporation, and Maersk Inc. (industrial conglomerate, 2002). He also serves as a member of the Board of Trustees of the American Enterprise Institute for Public Policy Research. In addition, Mr. Stavropoulos is a member of The Business Council, J.P. Morgan International Council, World Business Council for Sustainable Development, and the University of Notre Dame Advisory Council for the College of Science. |
Annual Report
Trustees and Officers - continued
Advisory Board Members and Executive Officers:
Correspondence intended for Dr. Heilmeier may be sent to Fidelity Investments, P.O. Box 55235, Boston, Massachusetts 02205-5235. Correspondence intended for each executive officer and Mr. Lynch may be sent to 82 Devonshire Street, Boston, Massachusetts 02109.
Name, Age; Principal Occupation |
George H. Heilmeier (67) |
| Year of Election or Appointment: 2003 Member of the Advisory Board of Fidelity Advisor Series VIII. Dr. Heilmeier is Chairman Emeritus of Telcordia Technologies (communication software and systems), where prior to his retirement, he served as company Chairman and Chief Executive Officer. He currently serves on the Boards of Directors of The Mitre Corporation (systems engineering and information technology support for the government), INET Technologies Inc. (telecommunications network surveillance, 2001) and Teletech Holdings (customer management services, 1998). He is Chairman of the General Motors Technology Advisory Committee and a Life Fellow of the IEEE (2000). Dr. Heilmeier is a member of the Defense Science Board and the National Security Agency Advisory Board. He is also a member of the National Academy of Engineering, the American Academy of Arts and Sciences and The Board of Overseers of the School of Engineering and Applied Science of the University of Pennsylvania. Previously, Dr. Heilmeier served as a Director of TRW Inc. (automotive, space, defense, and information technology, 1992-2002) and Compaq (1994-2002). |
Peter S. Lynch (60) |
| Year of Election or Appointment: 2003 Member of the Advisory Board of Fidelity Advisor Series VIII. Vice Chairman and a Director of FMR, and Vice Chairman (2001) and a Director (2000) of FMR Co., Inc. Previously, Mr. Lynch served as a Trustee of the Fidelity funds (1990-2003). Prior to May 31, 1990, he was a Director of FMR and Executive Vice President of FMR (a position he held until March 31, 1991), Vice President of Fidelity® Magellan® Fund and FMR Growth Group Leader, and Managing Director of FMR Corp. Mr. Lynch was also Vice President of Fidelity Investments Corporate Services. In addition, he serves as a Trustee of Boston College, Massachusetts Eye & Ear Infirmary, Historic Deerfield, John F. Kennedy Library, and the Museum of Fine Arts of Boston. |
Philip L. Bullen (44) |
| Year of Election or Appointment: 2001 Vice President of Advisor Latin America. Mr. Bullen also serves as Vice President of certain Equity Funds (2001) and certain High Income Funds (2001). He is Senior Vice President of FMR (2001) and FMR Co., Inc. (2001), President and a Director of Fidelity Management & Research (Far East) Inc. (2001), President and a Director of Fidelity Management & Research (U.K.) Inc. (2002), and a Director of Strategic Advisers, Inc. (2002). Before joining Fidelity Investments, Mr. Bullen was President and Chief Investment Officer of Santander Global Advisors (1997-2000) and President and Chief Executive Officer of Boston's Baring Asset Management Inc. (1994-1997). |
Eric D. Roiter (54) |
| Year of Election or Appointment: 1998 Secretary of Advisor Latin America. He also serves as Secretary of other Fidelity funds (1998); Vice President, General Counsel, and Clerk of FMR Co., Inc. (2001) and FMR (1998); Vice President and Clerk of FDC (1998); Assistant Clerk of Fidelity Management & Research (U.K.) Inc. (2001) and Fidelity Management & Research (Far East) Inc. (2001); and Assistant Secretary of Fidelity Investments Money Management Inc. (2001). Prior to joining Fidelity, Mr. Roiter was with the law firm of Debevoise & Plimpton, as an associate (1981-1984) and as a partner (1985-1997), and served as an Assistant General Counsel of the U.S. Securities and Exchange Commission (1979-1981). Mr. Roiter is an Adjunct Member, Faculty of Law, at Boston College Law School (2003). |
Stuart Fross (44) |
| Year of Election or Appointment: 2003 Assistant Secretary of Advisor Latin America. Mr. Fross also serves as Assistant Secretary of other Fidelity funds (2003) and is an employee of FMR. |
Maria F. Dwyer (44) |
| Year of Election or Appointment: 2002 President and Treasurer of Advisor Latin America. Ms. Dwyer also serves as President and Treasurer of other Fidelity funds (2002) and is a Vice President (1999) and an employee (1996) of FMR. Prior to joining Fidelity, Ms. Dwyer served as Director of Compliance for MFS Investment Management. |
Timothy F. Hayes (52) |
| Year of Election or Appointment: 2002 Chief Financial Officer of Advisor Latin America. Mr. Hayes also serves as Chief Financial Officer of other Fidelity funds (2002). Recently he was appointed President of Fidelity Service Company (2003) where he also serves as a Director. Mr. Hayes also serves as President of Fidelity Investments Operations Group (FIOG, 2002), which includes Fidelity Pricing and Cash Management Services Group (FPCMS), where he was appointed President in 1998. Previously, Mr. Hayes served as Chief Financial Officer of Fidelity Investments Corporate Systems and Service Group (1998) and Fidelity Systems Company (1997-1998). |
John R. Hebble (45) |
| Year of Election or Appointment: 2003 Deputy Treasurer of Advisor Latin America. Mr. Hebble also serves as Deputy Treasurer of other Fidelity funds (2003), and is an employee of FMR. Before joining Fidelity Investments, Mr. Hebble worked at Deutsche Asset Management where he served as Director of Fund Accounting (2002-2003) and Assistant Treasurer of the Scudder Funds (1998-2003). |
John H. Costello (57) |
| Year of Election or Appointment: 1998 Assistant Treasurer of Advisor Latin America. Mr. Costello also serves as Assistant Treasurer of other Fidelity funds and is an employee of FMR. |
Francis V. Knox, Jr. (56) |
| Year of Election or Appointment: 2002 Assistant Treasurer of Advisor Latin America. Mr. Knox also serves as Assistant Treasurer of other Fidelity funds (2002), and is a Vice President and an employee of FMR. Previously, Mr. Knox served as Vice President of Investment & Advisor Compliance (1990-2001), and Compliance Officer of Fidelity Management & Research (U.K.) Inc. (1992-2002), Fidelity Management & Research (Far East) Inc. (1991-2002), and FMR Corp. (1995-2002). |
Mark Osterheld (48) |
| Year of Election or Appointment: 2002 Assistant Treasurer of Advisor Latin America. Mr. Osterheld also serves as Assistant Treasurer of other Fidelity funds (2002) and is an employee of FMR. |
Thomas J. Simpson (45) |
| Year of Election or Appointment: 2000 Assistant Treasurer of Advisor Latin America. Mr. Simpson is Assistant Treasurer of other Fidelity funds (2000) and an employee of FMR (1996). Prior to joining FMR, Mr. Simpson was Vice President and Fund Controller of Liberty Investment Services (1987-1995). |
Annual Report
Distributions
The amounts per share which represent income derived from sources within, and taxes paid to, foreign countries or possessions of the United States are as follows:
| Pay Date | Income | Taxes |
Institutional Class | 12/9/02 | $.112 | $.022 |
The fund will notify shareholders in January 2004 of amounts for use in preparing 2003 income tax returns.
Annual Report
Annual Report
Annual Report
Investment Adviser
Fidelity Management & Research Company
Boston, MA
Investment Sub-Advisers
FMR Co., Inc.
Fidelity Management & Research
(U.K.) Inc.
Fidelity Management & Research
(Far East) Inc.
Fidelity International
Investment Advisors
Fidelity Investments Japan Limited
Fidelity International Investment Advisors (U.K.) Limited
General Distributor
Fidelity Distributors Corporation
Boston, MA
Transfer and Shareholder
Servicing Agents
Fidelity Investments Institutional Operations Company, Inc.
Boston, MA
Custodian
State Street Bank and Trust Company
Quincy, MA
Annual Report
Fidelity Advisor Aggressive Growth Fund |
Fidelity Advisor Asset Allocation Fund |
Fidelity Advisor Balanced Fund |
Fidelity Advisor Biotechnology Fund |
Fidelity Advisor California Municipal Income Fund |
Fidelity Advisor Consumer Industries Fund |
Fidelity Advisor Cyclical Industries Fund |
Fidelity Advisor Developing Communications Fund |
Fidelity Advisor Diversified International Fund |
Fidelity Advisor Dividend Growth Fund |
Fidelity Advisor Dynamic Capital Appreciation Fund |
Fidelity Advisor Electronics Fund |
Fidelity Advisor Emerging Asia Fund |
Fidelity Advisor Emerging Markets Income Fund |
Fidelity Advisor Equity Growth Fund |
Fidelity Advisor Equity Income Fund |
Fidelity Advisor Equity Value Fund |
Fidelity Advisor Europe Capital Appreciation Fund |
Fidelity Advisor Fifty Fund |
Fidelity Advisor Financial Services Fund |
Fidelity Advisor Floating Rate High Income Fund |
Fidelity Advisor Freedom Income FundSM |
Fidelity Advisor Freedom 2010 FundSM |
Fidelity Advisor Freedom 2020 FundSM |
Fidelity Advisor Freedom 2030 FundSM |
Fidelity Advisor Freedom 2040 FundSM |
Fidelity Advisor Global Equity Fund |
Fidelity Advisor Government Investment Fund |
Fidelity Advisor Growth & Income Fund |
Fidelity Advisor Growth Opportunities |
Fidelity Advisor Health Care Fund |
Fidelity Advisor High Income Advantage Fund |
Fidelity Advisor High Income Fund |
Fidelity Advisor Inflation-Protected Bond Fund |
Fidelity Advisor Intermediate Bond Fund |
Fidelity Advisor International Capital Appreciation Fund |
Fidelity Advisor International Small Cap Fund |
Fidelity Advisor Investment Grade Bond Fund |
Fidelity Advisor Japan Fund |
Fidelity Advisor Korea Fund |
Fidelity Advisor Large Cap Fund |
Fidelity Advisor Latin America Fund |
Fidelity Advisor Leveraged Company Stock Fund |
Fidelity Advisor Mid Cap Fund |
Fidelity Advisor Mortgage Securities Fund |
Fidelity Advisor Municipal Income Fund |
Fidelity Advisor Natural Resources Fund |
Fidelity Advisor New Insights Fund |
Fidelity Advisor New York Municipal Income Fund |
Fidelity Advisor Overseas Fund |
Fidelity Advisor Real Estate Fund |
Fidelity Advisor Short Fixed-Income Fund |
Fidelity Advisor Short Intermediate Municipal Income Fund |
Fidelity Advisor Small Cap Fund |
Fidelity Advisor Strategic Growth Fund |
Fidelity Advisor Strategic Income Fund |
Fidelity Advisor Tax Managed
Stock Fund |
Fidelity Advisor Technology Fund |
Fidelity Advisor Telecommunications & Utilities Growth Fund |
Fidelity Advisor Value Leaders Fund |
Fidelity Advisor Value Strategies Fund |
Prime Fund |
Tax-Exempt Fund |
Treasury Fund |
(Fidelity Investment logo)(registered trademark)
Corporate Headquarters
82 Devonshire St., Boston, MA 02109
www.fidelity.com
ALAFI-UANN-1203
1.784761.100
Fidelity® Advisor
Overseas
Fund - Class A, Class T, Class B and Class C
Annual Report
October 31, 2003
(2_fidelity_logos) (Registered_Trademark)
Contents
Chairman's Message | <Click Here> | Ned Johnson's message to shareholders. |
Performance | <Click Here> | How the fund has done over time. |
Management's Discussion | <Click Here> | The manager's review of fund performance, strategy and outlook. |
Investment Changes | <Click Here> | A summary of major shifts in the fund's investments over the past six months. |
Investments | <Click Here> | A complete list of the fund's investments with their market values. |
Financial Statements | <Click Here> | Statements of assets and liabilities, operations, and changes in net assets,
as well as financial highlights. |
Notes | <Click Here> | Notes to the financial statements. |
Auditors' Opinion | <Click Here> | |
Trustees and Officers | <Click Here> | |
| | |
For a free copy of the fund's proxy voting guidelines call 1-877-208-0098 or visit the Securities and Exchange Commission (SEC)'s web site at www.sec.gov.
Third party marks appearing herein are the property of their respective owners.
All other marks appearing herein are registered or unregistered trademarks or service marks of FMR Corp. or an affiliated company.
(Recycle graphic) This report is printed on recycled paper using soy-based inks.
This report and the financial statements contained herein are submitted for the general information of the shareholders of the fund. This report is not authorized for distribution to prospective investors in the fund unless preceded or accompanied by an effective prospectus.
Mutual fund shares are not deposits or obligations of, or guaranteed by, any depository institution. Shares are not insured by the FDIC, Federal Reserve Board or any other agency, and are subject to investment risks, including possible loss of principal amount invested.
Neither the fund nor Fidelity Distributors Corporation is a bank.
For more information on any Fidelity Advisor fund, including charges and expenses, contact your investment professional for a free prospectus. Read it carefully before you invest or send money.
Annual Report
Chairman's Message
(photo_of_Edward_C_Johnson_3d)
Dear Shareholder:
Many of you have read or heard news stories recently that were critical of mutual funds and made allegations that the mutual fund industry has been less than forthright. I find these reports unsettling and not necessarily an accurate picture of the overall industry, and I would like you to know where we at Fidelity stand.
With specific regard to allegations that certain mutual fund companies were violating the Securities and Exchange Commission's forward pricing rules or were involved in so-called "market timing" activities, I want to say two things:
First, Fidelity does not have agreements that permit customers who buy fund shares after 4 p.m. to obtain the 4 p.m. price. This is not to say that someone could not deceive the company through fraudulent acts. But I underscore that we have no so-called "agreements" which would permit this illegal practice.
Second, Fidelity has been on record for years opposing predatory short-term trading which adversely affects other shareholders in a mutual fund. In fact, in the 1980s, we began charging a fee - which is returned to the fund and, therefore, to investors - to discourage this activity. What's more, several years ago we took the industry lead in developing a Fair Value Pricing Policy to prevent market timing on foreign securities in our funds. It is reasonable to assume that another structure can be developed that would alter the system to make it much more difficult for predatory traders to operate. This, however, will only be achieved through close cooperation among regulators, legislators and the industry.
Certainly no industry is perfect, and there have been instances of unethical and illegal activity from time to time within the mutual fund industry. When this occurs, confessed or convicted offenders should be dealt with appropriately. Clearly, every system can be improved. We applaud well thought out improvements by regulators, legislators and industry representatives that achieve the common goal of building and protecting the value of investors' holdings. But we remain concerned about the risk of over-regulation and the quick application of simplistic solutions to intricate problems.
For more than 57 years, Fidelity Investments has worked very hard to improve its products and service to justify your trust. When our family founded this company in 1946, we had only a few hundred customers. Many of them were family and friends. Today, we serve more than 18 million customers including individual investors and participants in retirement plans across America.
Let me close by saying that we do not take your trust in us for granted, and we realize that we must always work to improve all aspects of our service to you. In turn, we urge you to continue your active participation with your financial matters, so that your interests can be well served.
Annual Report
Best regards,
/s/Edward C. Johnson 3d
Edward C. Johnson 3d
Annual Report
Performance: The Bottom Line
Average annual total return reflects the change in the value of an investment, assuming reinvestment of the class' dividend income and capital gains (the profits earned upon the sale of securities that have grown in value) and assuming a constant rate of performance each year. During periods of reimbursement by Fidelity, a fund's total return will be greater than it would be had the reimbursement not occurred. The $10,000 table and the fund's returns do not reflect the deduction of taxes that a shareholder would pay on fund distributions or the redemption of fund shares. How a fund did yesterday is no guarantee of how it will do tomorrow. Returns may reflect the conversion of Class B shares to Class A shares after a maximum of seven years.
Average Annual Total Returns
Periods ended October 31, 2003 | | Past 1
year | Past 5
years | Past 10
years |
Class A (incl. 5.75%
sales charge)A | | 23.36% | -0.01% | 3.84% |
Class T (incl. 3.50%
sales charge) | | 26.11% | 0.29% | 3.99% |
Class B (incl. contingent
deferred sales charge)B | | 24.51% | -0.01% | 3.93% |
Class C (incl. contingent
deferred sales charge)C | | 28.69% | 0.42% | 3.84% |
A Class A's 12b-1 fee may have ranged over time between 0.25% and 0.35%, as an equivalent amount of brokerage commissions of up to 0.10% of the class's average net assets may have been used to promote the sale of class shares. This practice has been discontinued and no commissions incurred after June 30, 2003 have been used to pay distribution expenses. Class A's 12b-1 plan currently authorizes a 0.25% 12b-1 fee. The initial offering of Class A shares took place on September 3, 1996. Returns prior to September 3, 1996 are those of Class T, the original class of the fund, and reflect a 0.50% 12b-1 fee (0.65% prior to January 1, 1996).
B Class B shares bear a 1.00% 12b-1 fee that is reflected in returns after July 3, 1995. The initial offering of Class B shares took place on July 3, 1995. Returns prior to July 3, 1995 are those of Class T, the original class of the fund, and reflect a 0.65% 12b-1 fee. Had Class B shares' 12b-1 fee been reflected, returns prior to July 3, 1995 would have been lower. Class B shares' contingent deferred sales charges included in the past one year, past five year, and past 10 year total return figures are 5%, 2%, and 0%, respectively.
C Class C shares bear a 1.00% 12b-1 fee that is reflected in returns after July 3, 1995. The initial offering of Class C shares took place on November 3, 1997. Returns between July 3, 1995 and November 3, 1997 are those of Class B shares and reflect Class B shares' 1.00% 12b-1 fee. Returns prior to July 3, 1995 are those of Class T, the original class of the fund, and reflect a 0.65% 12b-1 fee. Had Class C shares' 12b-1 fee been reflected, returns prior to July 3, 1995 would have been lower. Class C shares' contingent deferred sales charge included in the past one year, past five year, and past 10 year total return figures are 1%, 0%, and 0%, respectively.
Annual Report
$10,000 Over 10 Years
Let's say hypothetically that $10,000 was invested in Fidelity® Advisor Overseas Fund - Class T on October 31, 1993, and the current 3.50% sales charge was paid. The chart shows how the value of your investment would have grown, and also shows how the MSCI® EAFE® Index did over the same period.
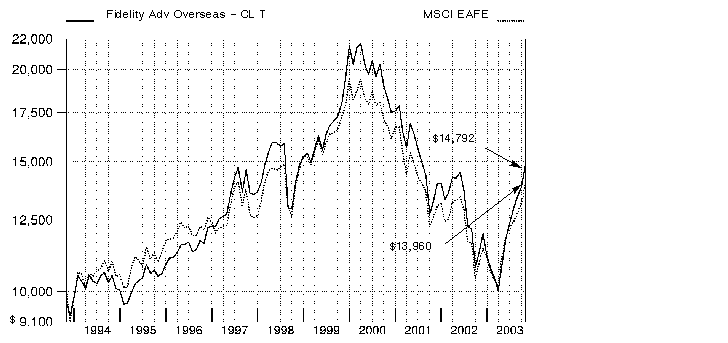
Annual Report
Management's Discussion of Fund Performance
Comments from Rick Mace, Portfolio Manager of Fidelity Advisor Overseas Fund
Mirroring the U.S. rally, most international stock markets rebounded sharply during the 12-month period ending October 31, 2003. Encouraged by improved corporate earnings, favorable interest rates and the easing of geopolitical tensions, the Morgan Stanley Capital InternationalSM Europe, Australasia, Far East (MSCI EAFE) Index - a proxy for stock markets outside the United States and Canada - gained 27.39% during the past year. From a regional perspective, all 16 countries in the MSCI Europe index - which gained 24.56% - had double-digit advances. Spain, Denmark and Sweden were among the region's best performers. In Japan, increased capital spending, exports and machinery orders helped the Tokyo Stock Exchange Stock Price Index (TOPIX) advance 36.39%. Following the SARS epidemic, other Asian markets also rebounded. For instance, the Hong Kong market, as measured by the Hang Seng Index, gained 34.51%. Emerging markets also fared well, particularly Latin America. The MSCI Emerging Markets Free Latin America Index rose 59.75%. Canadian equities, as measured by the S&P/TSX Composite Index, also posted an impressive annual gain, advancing 50.66%.
For the 12 months ending October 31, 2003, Fidelity Advisor Overseas Fund's Class A, Class T, Class B and Class C shares were up 30.88%, 30.68%, 29.51% and 29.69%, respectively. These returns topped the LipperSM International Funds Average, which rose 24.51%, as well as the MSCI EAFE index. Good stock selection and an overweighting in diversified financials made a significant contribution to the fund's solid relative performance. Large positions in strong-performing Japanese brokerage stocks, such as Nikko Cordial and Nomura Holdings, were particularly helpful. Elsewhere, an overweighting in the information technology sector was rewarding, as the tech sector rebounded from an extended period of weakness. The fund's holdings in the semiconductor area - including Infineon Technologies of Germany and ASML of the Netherlands - - were noteworthy contributors. On the down side, weak stock picking in the consumer staples sector hurt the fund's results, with a position in Dutch food giant Unilever being its biggest detractor. A U.S. federal investigation into alleged accounting misdeeds caused the fund's positions in Dutch supermarket retailer Ahold to tumble. The fund's underweighting of strong-performing capital goods stocks also held back its relative return.
The views expressed in this statement reflect those of the portfolio manager only through the end of the period of the report as stated on the cover and do not necessarily represent the views of Fidelity or any other person in the Fidelity organization. Any such views are subject to change at any time based upon market or other conditions and Fidelity disclaims any responsibility to update such views. These views may not be relied on as investment advice and, because investment decisions for a Fidelity fund are based on numerous factors, may not be relied on as an indication of trading intent on behalf of any Fidelity fund.
Annual Report
Investment Changes
Top Five Stocks as of October 31, 2003 |
| % of fund's
net assets | % of fund's net assets
6 months ago |
ASML Holding NV (Netherlands,
Semiconductors & Semiconductor Equipment) | 2.6 | 1.6 |
Samsung Electronics Co. Ltd. (Korea (South), Semiconductors & Semiconductor Equipment) | 2.5 | 1.8 |
Total SA Series B (France, Oil & Gas) | 2.4 | 2.3 |
Novartis AG (Reg.)
(Switzerland, Pharmaceuticals) | 2.3 | 2.0 |
Allianz AG (Reg.) (Germany, Insurance) | 2.2 | 1.2 |
| 12.0 | |
Top Five Market Sectors as of October 31, 2003 |
| % of fund's
net assets | % of fund's net assets
6 months ago |
Financials | 26.0 | 28.7 |
Information Technology | 17.6 | 17.9 |
Energy | 10.1 | 10.5 |
Consumer Discretionary | 9.7 | 9.5 |
Health Care | 9.0 | 10.1 |
Top Five Countries as of October 31, 2003 |
(excluding cash equivalents) | % of fund's
net assets | % of fund's net assets
6 months ago |
Japan | 17.7 | 20.2 |
United Kingdom | 15.4 | 14.8 |
Germany | 8.4 | 7.1 |
France | 7.4 | 8.4 |
Switzerland | 6.6 | 8.1 |
Percentages are adjusted for the effect of open futures contracts, if applicable. |
Asset Allocation (% of fund's net assets) |
As of October 31, 2003 | As of April 30, 2003 |
| Stocks 89.9% | | | Stocks and Investment Companies 96.2% | |
 | Bonds 0.6% | | | Bonds 0.5% | |
| Short-Term
Investments and
Net Other Assets 9.5% | | | Short-Term
Investments and
Net Other Assets 3.3% | |

Annual Report
Investments October 31, 2003
Showing Percentage of Net Assets
Common Stocks - 89.3% |
| Shares | | Value (Note 1) (000s) |
Australia - 0.5% |
News Corp. Ltd. sponsored ADR | 221,200 | | $ 6,525 |
Bermuda - 0.0% |
Golar LNG Ltd. (a) | 51,800 | | 601 |
Brazil - 0.8% |
Banco Bradesco SA sponsored ADR | 51,700 | | 1,085 |
Banco Itau Holding Financeira SA (PN) | 14,812,000 | | 1,214 |
Brasil Telecom Participacoes SA sponsored ADR | 28,700 | | 1,048 |
Companhia Vale do Rio Doce sponsored ADR | 42,900 | | 1,963 |
Embraer - Empresa Brasileira de Aeronautica SA
sponsored ADR | 54,800 | | 1,422 |
Tele Norte Leste Participacoes SA ADR | 84,200 | | 1,193 |
Telebras sponsored ADR | 74,200 | | 2,555 |
TOTAL BRAZIL | | 10,480 |
Canada - 3.7% |
Biovail Corp. (a) | 170,700 | | 4,107 |
Canadian Natural Resources Ltd. | 111,500 | | 4,735 |
EnCana Corp. | 235,900 | | 8,100 |
Inmet Mining Corp. (a) | 158,300 | | 1,434 |
Kinross Gold Corp. (a)(e) | 264,100 | | 2,165 |
Kinross Gold Corp. (a) | 612,100 | | 5,018 |
Petro-Canada | 49,700 | | 2,003 |
Precision Drilling Corp. (a) | 102,300 | | 4,024 |
Talisman Energy, Inc. | 369,600 | | 18,050 |
TOTAL CANADA | | 49,636 |
Cayman Islands - 0.4% |
Noble Corp. (a) | 151,500 | | 5,201 |
China - 0.5% |
Byd Co. Ltd. (H Shares) | 541,000 | | 1,411 |
China Telecom Corp. Ltd. (H Shares) | 14,714,000 | | 4,879 |
PICC Property & Casualty Co. Ltd. (H Shares) | 302,000 | | 71 |
TOTAL CHINA | | 6,361 |
Denmark - 1.2% |
Coloplast AS Series B | 35,100 | | 2,943 |
Danske Bank AS | 484,900 | | 9,748 |
Novo Nordisk AS Series B | 87,100 | | 3,122 |
TOTAL DENMARK | | 15,813 |
Common Stocks - continued |
| Shares | | Value (Note 1) (000s) |
Finland - 1.5% |
Nokia Corp. | 1,212,400 | | $ 20,599 |
France - 7.4% |
Accor SA | 70,600 | | 2,767 |
Alcatel SA sponsored ADR (a) | 681,700 | | 8,985 |
AXA SA | 476,060 | | 8,989 |
BNP Paribas SA | 279,281 | | 14,624 |
Credit Agricole SA | 90,700 | | 1,920 |
Credit Agricole SA rights 11/7/03 (a) | 90,700 | | 21 |
France Telecom SA (a) | 214,000 | | 5,161 |
L'Oreal SA | 52,300 | | 3,853 |
Pernod-Ricard | 64,400 | | 6,192 |
Suez SA (France) | 99,400 | | 1,589 |
Television Francaise 1 SA | 154,400 | | 4,615 |
Total SA Series B | 210,397 | | 32,851 |
Vivendi Universal SA sponsored ADR (a) | 406,900 | | 8,557 |
TOTAL FRANCE | | 100,124 |
Germany - 7.8% |
Allianz AG (Reg.) | 277,500 | | 29,646 |
Altana AG sponsored ADR | 50,800 | | 3,190 |
BASF AG | 165,600 | | 7,570 |
Deutsche Boerse AG | 388,682 | | 21,532 |
Deutsche Telekom AG sponsored ADR (a) | 504,600 | | 7,877 |
Fresenius Medical Care AG | 134,400 | | 7,637 |
Infineon Technologies AG (a) | 237,700 | | 3,492 |
Muenchener Rueckversicherungs-Gesellschaft AG: | | | |
rights 11/10/03 (a) | 165,700 | | 1,365 |
(Reg.) | 165,700 | | 19,693 |
SAP AG sponsored ADR | 94,200 | | 3,442 |
TOTAL GERMANY | | 105,444 |
Greece - 0.1% |
Greek Organization of Football Prognostics SA | 67,640 | | 831 |
Hong Kong - 2.1% |
Cheung Kong Holdings Ltd. | 192,000 | | 1,601 |
China Mobile (Hong Kong) Ltd. | 1,309,250 | | 3,710 |
Hong Kong Exchanges & Clearing Ltd. | 1,588,000 | | 3,456 |
Hutchison Whampoa Ltd. | 1,404,700 | | 10,898 |
Sun Hung Kai Properties Ltd. | 188,000 | | 1,592 |
Techtronic Industries Co. | 2,754,000 | | 7,589 |
TOTAL HONG KONG | | 28,846 |
Common Stocks - continued |
| Shares | | Value (Note 1) (000s) |
India - 1.9% |
Cipla Ltd. | 102,900 | | $ 2,949 |
Dr. Reddy's Laboratories Ltd. | 124,200 | | 3,275 |
Housing Development Finance Corp. Ltd. | 661,300 | | 7,586 |
Infosys Technologies Ltd. | 69,816 | | 7,304 |
Satyam Computer Services Ltd. | 729,100 | | 4,924 |
TOTAL INDIA | | 26,038 |
Indonesia - 0.1% |
PT Bank Rakyat Indonesia (a)(f) | 7,911,500 | | 815 |
Italy - 1.3% |
Banca Intesa Spa | 892,775 | | 3,005 |
ENI Spa | 247,750 | | 3,919 |
Telecom Italia Spa | 2,151,017 | | 5,594 |
Unicredito Italiano Spa | 1,091,600 | | 5,359 |
TOTAL ITALY | | 17,877 |
Japan - 17.7% |
Advantest Corp. | 10,700 | | 797 |
Aeon Credit Service Ltd. | 16,000 | | 741 |
Canon, Inc. | 186,000 | | 9,105 |
Daikin Industries Ltd. | 58,000 | | 1,237 |
Daiwa Securities Group, Inc. | 1,502,000 | | 10,984 |
FamilyMart Co. Ltd. | 169,300 | | 3,680 |
Ito Yokado Ltd. | 419,400 | | 15,412 |
JAFCO Co. Ltd. | 102,400 | | 8,755 |
KDDI Corp. | 1,639 | | 8,900 |
Konica Minolta Holdings, Inc. | 204,000 | | 2,681 |
Kyocera Corp. | 101,500 | | 6,112 |
Kyorin Pharmaceutical Co. Ltd. | 85,000 | | 1,280 |
Matsushita Electric Industrial Co. Ltd. | 488,200 | | 6,405 |
Millea Holdings, Inc. | 437 | | 5,207 |
Mitsubishi Tokyo Financial Group, Inc. (MTFG) | 1,063 | | 7,802 |
Mizuho Financial Group, Inc. (a) | 1,306 | | 3,196 |
Murata Manufacturing Co. Ltd. | 170,400 | | 9,687 |
Nikko Cordial Corp. | 2,997,000 | | 16,165 |
Nikon Corp. (a) | 176,000 | | 2,672 |
Nitto Denko Corp. | 36,000 | | 1,889 |
Nomura Holdings, Inc. | 1,353,000 | | 23,235 |
ORIX Corp. | 77,200 | | 6,495 |
Rohm Co. Ltd. | 92,200 | | 12,429 |
Seiyu Ltd. (a) | 609,000 | | 1,966 |
Shin-Etsu Chemical Co. Ltd. | 147,100 | | 5,472 |
Common Stocks - continued |
| Shares | | Value (Note 1) (000s) |
Japan - continued |
SMC Corp. | 12,900 | | $ 1,552 |
Sony Corp. | 107,700 | | 3,791 |
Sumitomo Electric Industries Ltd. | 417,000 | | 3,584 |
Sumitomo Mitsui Financial Group, Inc. | 1,692 | | 8,511 |
TDK Corp. | 84,000 | | 5,501 |
Tokyo Electron Ltd. | 214,500 | | 15,374 |
Toshiba Corp. | 884,000 | | 3,546 |
Toyota Motor Corp. | 622,900 | | 18,070 |
UFJ Holdings, Inc. (a) | 954 | | 4,078 |
Uny Co. Ltd. | 253,000 | | 2,633 |
TOTAL JAPAN | | 238,944 |
Korea (South) - 2.8% |
Kookmin Bank | 112,580 | | 4,109 |
Samsung Electronics Co. Ltd. | 84,030 | | 33,371 |
TOTAL KOREA (SOUTH) | | 37,480 |
Mexico - 0.3% |
Grupo Televisa SA de CV sponsored ADR | 109,300 | | 4,235 |
Netherlands - 6.5% |
Aegon NV | 109,300 | | 1,428 |
ASML Holding NV (a) | 1,980,900 | | 34,771 |
ING Groep NV (Certificaten Van Aandelen) | 723,346 | | 15,075 |
Koninklijke Ahold NV (a) | 365,900 | | 3,086 |
Koninklijke KPN NV (a) | 606,500 | | 4,595 |
Koninklijke Philips Electronics NV | 274,400 | | 7,365 |
Unilever NV (NY Shares) | 237,900 | | 13,953 |
VNU NV | 270,300 | | 8,204 |
TOTAL NETHERLANDS | | 88,477 |
Netherlands Antilles - 0.3% |
Schlumberger Ltd. (NY Shares) | 79,800 | | 3,748 |
Portugal - 0.2% |
Banco Comercial Portugues SA (Reg.) | 1,352,600 | | 2,601 |
Russia - 0.7% |
JSC MMC 'Norilsk Nickel' sponsored ADR | 45,800 | | 2,347 |
Lukoil Oil Co. sponsored ADR | 11,500 | | 935 |
OAO Gazprom sponsored ADR | 40,200 | | 965 |
YUKOS Corp. sponsored ADR | 106,161 | | 4,905 |
TOTAL RUSSIA | | 9,152 |
Common Stocks - continued |
| Shares | | Value (Note 1) (000s) |
South Africa - 0.1% |
Harmony Gold Mining Co. Ltd. sponsored ADR | 141,800 | | $ 2,144 |
Spain - 2.6% |
Actividades de Construccion y Servicios SA (ACS) | 28,000 | | 1,175 |
Altadis SA (Spain) | 257,500 | | 6,223 |
Antena 3 Television SA (a) | 1,736 | | 57 |
Banco Popular Espanol SA (Reg.) | 133,700 | | 6,928 |
Banco Santander Central Hispano SA | 894,860 | | 8,552 |
Inditex SA | 123,800 | | 2,549 |
Telefonica SA | 793,754 | | 9,895 |
TOTAL SPAIN | | 35,379 |
Sweden - 1.6% |
Hennes & Mauritz AB (H&M) (B Shares) | 78,800 | | 1,665 |
Securitas AB (B Shares) | 258,200 | | 3,165 |
Telefonaktiebolaget LM Ericsson ADR (a) | 951,000 | | 16,243 |
TOTAL SWEDEN | | 21,073 |
Switzerland - 6.6% |
Compagnie Financiere Richemont unit | 231,020 | | 5,178 |
Credit Suisse Group (Reg.) | 552,032 | | 19,374 |
Novartis AG (Reg.) | 793,950 | | 30,464 |
Roche Holding AG (participation certificate) | 186,300 | | 15,356 |
UBS AG (Reg.) | 244,404 | | 14,949 |
Zurich Financial Services AG | 27,470 | | 3,504 |
TOTAL SWITZERLAND | | 88,825 |
Taiwan - 1.4% |
Compal Electronics, Inc. | 763,000 | | 1,158 |
Hon Hai Precision Industries Co. Ltd. | 600,200 | | 2,689 |
Taiwan Semiconductor Manufacturing Co. Ltd. (a) | 3,691,854 | | 7,290 |
United Microelectronics Corp. (a) | 8,532,000 | | 7,820 |
TOTAL TAIWAN | | 18,957 |
Turkey - 0.0% |
Turkcell Iletisim Hizmet AS sponsored ADR (a) | 37,900 | | 720 |
United Kingdom - 14.8% |
3i Group PLC | 661,516 | | 6,949 |
Abbey National PLC | 552,400 | | 5,267 |
AstraZeneca PLC (United Kingdom) | 380,300 | | 18,133 |
Astro All Asia Networks PLC (a) | 591,800 | | 735 |
Aviva PLC | 211,200 | | 1,730 |
BHP Billiton PLC | 819,100 | | 6,422 |
Common Stocks - continued |
| Shares | | Value (Note 1) (000s) |
United Kingdom - continued |
BOC Group PLC | 204,700 | | $ 2,787 |
BP PLC | 3,501,500 | | 24,732 |
Carlton Communications PLC | 990,000 | | 3,623 |
Centrica PLC | 714,600 | | 2,234 |
Dixons Group PLC | 2,016,600 | | 4,638 |
GlaxoSmithKline PLC | 697,269 | | 15,092 |
Hilton Group PLC | 1,182,300 | | 3,886 |
HSBC Holdings PLC (United Kingdom) (Reg.) | 1,109,390 | | 16,656 |
Kesa Electricals PLC | 807,314 | | 3,338 |
Lloyds TSB Group PLC | 421,400 | | 2,922 |
Man Group PLC | 339,200 | | 8,328 |
Marks & Spencer Group PLC | 1,032,500 | | 5,034 |
mmO2 PLC (a) | 2,221,800 | | 2,409 |
Pearson PLC | 198,100 | | 2,048 |
Prudential PLC | 423,200 | | 3,279 |
Reckitt Benckiser PLC | 212,000 | | 4,454 |
Reed Elsevier PLC | 380,300 | | 2,951 |
Rio Tinto PLC (Reg.) | 230,100 | | 5,698 |
Royal Bank of Scotland Group PLC | 179,200 | | 4,794 |
Shire Pharmaceuticals Group PLC sponsored ADR (a) | 161,400 | | 3,696 |
Smith & Nephew PLC | 482,600 | | 3,829 |
Tesco PLC | 1,583,581 | | 6,339 |
Unilever PLC sponsored ADR | 114,000 | | 3,899 |
Vodafone Group PLC | 10,540,716 | | 22,294 |
William Hill PLC | 148,600 | | 854 |
Yell Group PLC (a) | 331,600 | | 1,613 |
TOTAL UNITED KINGDOM | | 200,663 |
United States of America - 4.4% |
Baker Hughes, Inc. | 160,600 | | 4,539 |
ENSCO International, Inc. | 208,400 | | 5,491 |
Fox Entertainment Group, Inc. Class A (a) | 97,400 | | 2,698 |
Grant Prideco, Inc. (a) | 306,200 | | 3,472 |
Micron Technology, Inc. (a) | 191,000 | | 2,739 |
Motorola, Inc. | 989,200 | | 13,384 |
Nabors Industries Ltd. (a) | 30,400 | | 1,149 |
NTL, Inc. (a) | 193,100 | | 11,920 |
Pride International, Inc. (a) | 27,900 | | 457 |
Smith International, Inc. (a) | 20,000 | | 745 |
Synthes-Stratec, Inc. | 3,119 | | 2,852 |
Transocean, Inc. (a) | 176,300 | | 3,383 |
Common Stocks - continued |
| Shares | | Value (Note 1) (000s) |
United States of America - continued |
Tyco International Ltd. | 159,900 | | $ 3,339 |
Weatherford International Ltd. (a) | 91,000 | | 3,162 |
TOTAL UNITED STATES OF AMERICA | | 59,330 |
TOTAL COMMON STOCKS (Cost $1,119,498) | 1,206,919 |
Nonconvertible Preferred Stocks - 0.6% |
| | | |
Germany - 0.6% |
Fresenius Medical Care AG | 97,260 | | 3,977 |
Porsche AG (non-vtg.) | 9,300 | | 4,552 |
TOTAL NONCONVERTIBLE PREFERRED STOCKS (Cost $7,772) | 8,529 |
Nonconvertible Bonds - 0.6% |
| Principal Amount (000s) | | |
United Kingdom - 0.6% |
Telewest Communications PLC yankee: | | | | |
0% 4/15/09 (c)(d) | | $ 1,335 | | 591 |
0% 2/1/10 (c)(d) | | 500 | | 201 |
9.875% 2/1/10 (c) | | 3,435 | | 1,769 |
Telewest PLC: | | | | |
11% 10/1/07 (c) | | 6,625 | | 3,578 |
yankee 9.625% 10/1/06 (c) | | 2,365 | | 1,253 |
TOTAL NONCONVERTIBLE BONDS (Cost $6,769) | 7,392 |
Money Market Funds - 14.1% |
| Shares | | Value (Note 1) (000s) |
Fidelity Cash Central Fund, 1.07% (b) | 136,867,942 | | $ 136,868 |
Fidelity Securities Lending Cash Central Fund, 1.09% (b) | 53,385,653 | | 53,386 |
TOTAL MONEY MARKET FUNDS (Cost $190,254) | 190,254 |
TOTAL INVESTMENT PORTFOLIO - 104.6% (Cost $1,324,293) | | 1,413,094 |
NET OTHER ASSETS - (4.6)% | | (61,750) |
NET ASSETS - 100% | $ 1,351,344 |
Legend |
(a) Non-income producing |
(b) The rate quoted is the annualized seven-day yield of the fund at period end. A complete listing of the fund's holdings as of its most recent fiscal year end is available upon request. |
(c) Non-income producing - issuer filed for bankruptcy or is in default of interest payments. |
(d) Debt obligation initially issued in zero coupon form which converts to coupon form at a specified rate and date. The rate shown is the rate at period end. |
(e) Security exempt from registration under Rule 144A of the Securities Act of 1933. These securities may be resold in transactions exempt from registration, normally to qualified institutional buyers. At the period end, the value of these securities amounted to $2,165,000 or 0.2% of net assets. |
(f) Security or a portion of the security purchased on a delayed delivery or when-issued basis. |
Other Information |
Purchases and sales of securities, other than short-term securities, aggregated $1,041,025,000 and $1,225,544,000, respectively. |
The fund placed a portion of its portfolio transactions with brokerage firms which are affiliates of the investment adviser. The commissions paid to these affiliated firms were $1,000 for the period. |
The fund participated in the interfund lending program as a borrower. The average daily loan balance during the period for which loans were outstanding amounted to $6,560,000. At period end there were no interfund loans outstanding. |
Income Tax Information |
At October 31, 2003, the fund had a capital loss carryforward of approximately $356,453,000 of which $211,472,000 and $144,981,000 will expire on October 31, 2009 and 2010, respectively. |
See accompanying notes which are an integral part of the financial statements.
Annual Report
Financial Statements
Statement of Assets and Liabilities
Amounts in thousands (except per-share amounts) | October 31, 2003 |
| | |
Assets | | |
Investment in securities, at value (including securities loaned of $51,163) (cost $1,324,293) - See accompanying schedule | | $ 1,413,094 |
Cash | | 672 |
Foreign currency held at value (cost $10,193) | | 10,334 |
Receivable for investments sold | | 45 |
Receivable for fund shares sold | | 1,768 |
Dividends receivable | | 1,526 |
Interest receivable | | 54 |
Prepaid expenses | | 6 |
Other receivables | | 34 |
Total assets | | 1,427,533 |
| | |
Liabilities | | |
Payable for investments purchased
Regular delivery | $ 16,877 | |
Delayed delivery | 823 | |
Payable for fund shares redeemed | 2,094 | |
Accrued management fee | 716 | |
Distribution fees payable | 557 | |
Other payables and accrued expenses | 1,736 | |
Collateral on securities loaned, at value | 53,386 | |
Total liabilities | | 76,189 |
| | |
Net Assets | | $ 1,351,344 |
Net Assets consist of: | | |
Paid in capital | | $ 1,633,744 |
Undistributed net investment income | | 5,713 |
Accumulated undistributed net realized gain (loss) on investments and foreign currency transactions | | (375,619) |
Net unrealized appreciation (depreciation) on investments and assets and liabilities in foreign currencies | | 87,506 |
Net Assets | | $ 1,351,344 |
See accompanying notes which are an integral part of the financial statements.
Annual Report
Financial Statements - continued
Statement of Assets and Liabilities - continued
Amounts in thousands (except per-share amounts) | October 31, 2003 |
| | |
Calculation of Maximum Offering Price
Class A:
Net Asset Value and redemption price per share
($68,329 ÷ 4,743 shares) | | $ 14.41 |
| | |
Maximum offering price per share (100/94.25 of $14.41) | | $ 15.29 |
Class T:
Net Asset Value and redemption price per share ($1,113,576 ÷ 76,239 shares) | | $ 14.61 |
| | |
Maximum offering price per share (100/96.50 of $14.61) | | $ 15.14 |
Class B:
Net Asset Value and offering price per share
($59,322 ÷ 4,275.49 shares) A | | $ 13.87 |
| | |
Class C:
Net Asset Value and offering price per share
($40,630 ÷ 2,879 shares) A | | $ 14.11 |
| | |
Institutional Class:
Net Asset Value, offering price and redemption price per share ($69,487 ÷ 4,760 shares) | | $ 14.60 |
A Redemption price per share is equal to net asset value less any applicable contingent deferred sales charge.
See accompanying notes which are an integral part of the financial statements.
Annual Report
Statement of Operations
Amounts in thousands | Year ended October 31, 2003 |
| | |
Investment Income | | |
Dividends | | $ 19,818 |
Interest | | 962 |
Security lending | | 682 |
| | 21,462 |
Less foreign taxes withheld | | (2,065) |
Total income | | 19,397 |
| | |
Expenses | | |
Management fee
Basic fee | $ 8,201 | |
Performance adjustment | (1,614) | |
Transfer agent fees | 3,203 | |
Distribution fees | 5,645 | |
Accounting fees and expenses | 591 | |
Non-interested trustees' compensation | 4 | |
Custodian fees and expenses | 421 | |
Registration fees | 96 | |
Audit | 71 | |
Legal | 46 | |
Interest | 1 | |
Miscellaneous | 21 | |
Total expenses before reductions | 16,686 | |
Expense reductions | (494) | 16,192 |
Net investment income (loss) | | 3,205 |
Realized and Unrealized Gain (Loss) Net realized gain (loss) on: | | |
Investment securities (net of foreign taxes of $463) | 63,118 | |
Foreign currency transactions | 30 | |
Total net realized gain (loss) | | 63,148 |
Change in net unrealized appreciation (depreciation) on: Investment securities (net of deferred foreign taxes of $1,458) | 254,170 | |
Assets and liabilities in foreign currencies | 222 | |
Total change in net unrealized appreciation (depreciation) | | 254,392 |
Net gain (loss) | | 317,540 |
Net increase (decrease) in net assets resulting from operations | | $ 320,745 |
See accompanying notes which are an integral part of the financial statements.
Annual Report
Financial Statements - continued
Statement of Changes in Net Assets
Amounts in thousands | Year ended
October 31,
2003 | Year ended
October 31,
2002 |
Increase (Decrease) in Net Assets | | |
Operations | | |
Net investment income (loss) | $ 3,205 | $ (934) |
Net realized gain (loss) | 63,148 | (146,183) |
Change in net unrealized appreciation (depreciation) | 254,392 | (54,978) |
Net increase (decrease) in net assets resulting
from operations | 320,745 | (202,095) |
Share transactions - net increase (decrease) | (95,223) | (103,769) |
Total increase (decrease) in net assets | 225,522 | (305,864) |
| | |
Net Assets | | |
Beginning of period | 1,125,822 | 1,431,686 |
End of period (including undistributed net investment income of $5,713 and distributions in excess of net investment income of $1,032, respectively) | $ 1,351,344 | $ 1,125,822 |
See accompanying notes which are an integral part of the financial statements.
Annual Report
Financial Highlights - Class A
Years ended October 31, | 2003 | 2002 | 2001 | 2000 | 1999 |
Selected Per-Share Data | | | | | |
Net asset value,
beginning of period | $ 11.01 | $ 12.90 | $ 19.88 | $ 20.59 | $ 16.32 |
Income from Investment Operations | | | | | |
Net investment income (loss) C | .05 | .01 | .06 | .06 D | .10 |
Net realized and
unrealized gain (loss) | 3.35 | (1.90) | (4.89) | .38 | 4.42 |
Total from investment operations | 3.40 | (1.89) | (4.83) | .44 | 4.52 |
Distributions from net investment income | - | - | (.43) | (.08) | (.11) |
Distributions in excess of
net investment income | - | - | - | (.09) | - |
Distributions from
net realized gain | - | - | (1.72) | (.98) | (.14) |
Total distributions | - | - | (2.15) | (1.15) | (.25) |
Net asset value, end of period | $ 14.41 | $ 11.01 | $ 12.90 | $ 19.88 | $ 20.59 |
Total Return A, B | 30.88% | (14.65)% | (27.16)% | 1.78% | 28.05% |
Ratios to Average Net Assets E | | | | |
Expenses before
expense reductions | 1.34% | 1.56% | 1.46% | 1.49% | 1.55% |
Expenses net of voluntary waivers, if any | 1.34% | 1.56% | 1.46% | 1.49% | 1.55% |
Expenses net of
all reductions | 1.30% | 1.52% | 1.41% | 1.46% | 1.52% |
Net investment income (loss) | .43% | .07% | .40% | .28% | .57% |
Supplemental Data | | | | | |
Net assets,
end of period (in millions) | $ 68 | $ 44 | $ 46 | $ 44 | $ 23 |
Portfolio turnover rate | 99% | 73% | 99% | 132% | 85% |
A Total returns would have been lower had certain expenses not been reduced during the periods shown.
B Total returns do not include the effect of the sales charges.
C Calculated based on average shares outstanding during the period.
D Investment income per share reflects a special dividend which amounted to $.04 per share.
E Expense ratios reflect operating expenses of the class. Expenses before reductions do not reflect amounts reimbursed by the investment adviser or reductions from brokerage service arrangements or other expense offset arrangements and do not represent the amount paid by the class during periods when reimbursements or reductions occur. Expenses net of any voluntary waivers reflect expenses after reimbursement by the investment adviser but prior to reductions from brokerage service arrangements or other expense offset arrangements. Expenses net of all reductions represent the net expenses paid by the class.
See accompanying notes which are an integral part of the financial statements.
Annual Report
Financial Highlights - Class T
Years ended October 31, | 2003 | 2002 | 2001 | 2000 | 1999 |
Selected Per-Share Data | | | | | |
Net asset value,
beginning of period | $ 11.18 | $ 13.11 | $ 20.13 | $ 20.83 | $ 16.48 |
Income from Investment Operations | | | | | |
Net investment income (loss) C | .04 | (.01) | .04 | .02 D | .07 |
Net realized and
unrealized gain (loss) | 3.39 | (1.92) | (4.99) | .39 | 4.46 |
Total from investment operations | 3.43 | (1.93) | (4.95) | .41 | 4.53 |
Distributions from net investment income | - | - | (.35) | (.06) | (.04) |
Distributions in excess of
net investment income | - | - | - | (.07) | - |
Distributions from
net realized gain | - | - | (1.72) | (.98) | (.14) |
Total distributions | - | - | (2.07) | (1.11) | (.18) |
Net asset value, end of period | $ 14.61 | $ 11.18 | $ 13.11 | $ 20.13 | $ 20.83 |
Total Return A, B | 30.68% | (14.72)% | (27.33)% | 1.62% | 27.74% |
Ratios to Average Net Assets E | | | | |
Expenses before
expense reductions | 1.46% | 1.68% | 1.62% | 1.67% | 1.72% |
Expenses net of voluntary waivers, if any | 1.46% | 1.68% | 1.62% | 1.67% | 1.72% |
Expenses net of
all reductions | 1.42% | 1.64% | 1.57% | 1.65% | 1.69% |
Net investment income (loss) | .31% | (.05) % | .24% | .10% | .39% |
Supplemental Data | | | | | |
Net assets,
end of period (in millions) | $ 1,114 | $ 928 | $ 1,185 | $ 1,678 | $ 1,480 |
Portfolio turnover rate | 99% | 73% | 99% | 132% | 85% |
A Total returns would have been lower had certain expenses not been reduced during the periods shown.
B Total returns do not include the effect of the sales charges.
C Calculated based on average shares outstanding during the period.
D Investment income per share reflects a special dividend which amounted to $.04 per share.
E Expense ratios reflect operating expenses of the class. Expenses before reductions do not reflect amounts reimbursed by the investment adviser or reductions from brokerage service arrangements or other expense offset arrangements and do not represent the amount paid by the class during periods when reimbursements or reductions occur. Expenses net of any voluntary waivers reflect expenses after reimbursement by the investment adviser but prior to reductions from brokerage service arrangements or other expense offset arrangements. Expenses net of all reductions represent the net expenses paid by the class.
See accompanying notes which are an integral part of the financial statements.
Annual Report
Financial Highlights - Class B
Years ended October 31, | 2003 | 2002 | 2001 | 2000 | 1999 |
Selected Per-Share Data | | | | | |
Net asset value,
beginning of period | $ 10.71 | $ 12.63 | $ 19.49 | $ 20.25 | $ 16.08 |
Income from Investment Operations | | | | | |
Net investment income (loss) C | (.06) | (.08) | (.06) | (.11) D | (.03) |
Net realized and
unrealized gain (loss) | 3.22 | (1.84) | (4.83) | .39 | 4.34 |
Total from investment operations | 3.16 | (1.92) | (4.89) | .28 | 4.31 |
Distributions from net investment income | - | - | (.25) | (.03) | - |
Distributions in excess of
net investment income | - | - | - | (.03) | - |
Distributions from
net realized gain | - | - | (1.72) | (.98) | (.14) |
Total distributions | - | - | (1.97) | (1.04) | (.14) |
Net asset value, end of period | $ 13.87 | $ 10.71 | $ 12.63 | $ 19.49 | $ 20.25 |
Total Return A, B | 29.51% | (15.20)% | (27.83)% | 1.02% | 27.00% |
Ratios to Average Net Assets E | | | | |
Expenses before
expense reductions | 2.27% | 2.43% | 2.27% | 2.27% | 2.30% |
Expenses net of voluntary waivers, if any | 2.27% | 2.30% | 2.27% | 2.27% | 2.29% |
Expenses net of
all reductions | 2.22% | 2.26% | 2.23% | 2.25% | 2.26% |
Net investment income (loss) | (.49)% | (.66)% | (.42)% | (.50)% | (.18)% |
Supplemental Data | | | | | |
Net assets,
end of period (in millions) | $ 59 | $ 53 | $ 80 | $ 125 | $ 89 |
Portfolio turnover rate | 99% | 73% | 99% | 132% | 85% |
A Total returns would have been lower had certain expenses not been reduced during the periods shown.
B Total returns do not include the effect of the contingent deferred sales charge.
C Calculated based on average shares outstanding during the period.
D Investment income per share reflects a special dividend which amounted to $.04 per share.
E Expense ratios reflect operating expenses of the class. Expenses before reductions do not reflect amounts reimbursed by the investment adviser or reductions from brokerage service arrangements or other expense offset arrangements and do not represent the amount paid by the class during periods when reimbursements or reductions occur. Expenses net of any voluntary waivers reflect expenses after reimbursement by the investment adviser but prior to reductions from brokerage service arrangements or other expense offset arrangements. Expenses net of all reductions represent the net expenses paid by the class.
See accompanying notes which are an integral part of the financial statements.
Annual Report
Financial Highlights - Class C
Years ended October 31, | 2003 | 2002 | 2001 | 2000 | 1999 |
Selected Per-Share Data | | | | | |
Net asset value,
beginning of period | $ 10.88 | $ 12.84 | $ 19.80 | $ 20.58 | $ 16.37 |
Income from Investment Operations | | | | | |
Net investment income (loss) C | (.05) | (.08) | (.05) | (.10) D | (.02) |
Net realized and
unrealized gain (loss) | 3.28 | (1.88) | (4.89) | .39 | 4.43 |
Total from investment operations | 3.23 | (1.96) | (4.94) | .29 | 4.41 |
Distributions from net investment income | - | - | (.30) | (.04) | (.06) |
Distributions in excess of
net investment income | - | - | - | (.05) | - |
Distributions from
net realized gain | - | - | (1.72) | (.98) | (.14) |
Total distributions | - | - | (2.02) | (1.07) | (.20) |
Net asset value, end of period | $ 14.11 | $ 10.88 | $ 12.84 | $ 19.80 | $ 20.58 |
Total Return A, B | 29.69% | (15.26)% | (27.70)% | 1.05% | 27.21% |
Ratios to Average Net Assets E | | | | |
Expenses before
expense reductions | 2.17% | 2.34% | 2.19% | 2.22% | 2.25% |
Expenses net of voluntary waivers, if any | 2.17% | 2.30% | 2.19% | 2.22% | 2.25% |
Expenses net of
all reductions | 2.13% | 2.26% | 2.14% | 2.20% | 2.22% |
Net investment income (loss) | (.40)% | (.66)% | (.34)% | (.45)% | (.13)% |
Supplemental Data | | | | | |
Net assets,
end of period (in millions) | $ 41 | $ 36 | $ 52 | $ 76 | $ 35 |
Portfolio turnover rate | 99% | 73% | 99% | 132% | 85% |
A Total returns would have been lower had certain expenses not been reduced during the periods shown.
B Total returns do not include the effect of the contingent deferred sales charge.
C Calculated based on average shares outstanding during the period.
D Investment income per share reflects a special dividend which amounted to $.04 per share.
E Expense ratios reflect operating expenses of the class. Expenses before reductions do not reflect amounts reimbursed by the investment adviser or reductions from brokerage service arrangements or other expense offset arrangements and do not represent the amount paid by the class during periods when reimbursements or reductions occur. Expenses net of any voluntary waivers reflect expenses after reimbursement by the investment adviser but prior to reductions from brokerage service arrangements or other expense offset arrangements. Expenses net of all reductions represent the net expenses paid by the class.
See accompanying notes which are an integral part of the financial statements.
Annual Report
Financial Highlights - Institutional Class
Years ended October 31, | 2003 | 2002 | 2001 | 2000 | 1999 |
Selected Per-Share Data | | | | | |
Net asset value,
beginning of period | $ 11.11 | $ 12.97 | $ 19.95 | $ 20.62 | $ 16.36 |
Income from Investment Operations | | | | | |
Net investment income (loss) B | .10 | .06 | .12 | .14 C | .17 |
Net realized and
unrealized gain (loss) | 3.39 | (1.92) | (4.91) | .38 | 4.39 |
Total from investment operations | 3.49 | (1.86) | (4.79) | .52 | 4.56 |
Distributions from net investment income | - | - | (.47) | (.10) | (.16) |
Distributions in excess of
net investment income | - | - | - | (.11) | - |
Distributions from
net realized gain | - | - | (1.72) | (.98) | (.14) |
Total distributions | - | - | (2.19) | (1.19) | (.30) |
Net asset value, end of period | $ 14.60 | $ 11.11 | $ 12.97 | $ 19.95 | $ 20.62 |
Total Return A | 31.41% | (14.34)% | (26.89)% | 2.18% | 28.30% |
Ratios to Average Net Assets D | | | | |
Expenses before
expense reductions | .93% | 1.14% | 1.06% | 1.13% | 1.18% |
Expenses net of voluntary waivers, if any | .93% | 1.14% | 1.06% | 1.13% | 1.18% |
Expenses net of
all reductions | .89% | 1.10% | 1.02% | 1.11% | 1.15% |
Net investment income (loss) | .84% | .49% | .79% | .63% | .94% |
Supplemental Data | | | | | |
Net assets,
end of period (in millions) | $ 69 | $ 63 | $ 69 | $ 90 | $ 90 |
Portfolio turnover rate | 99% | 73% | 99% | 132% | 85% |
A Total returns would have been lower had certain expenses not been reduced during the periods shown.
B Calculated based on average shares outstanding during the period.
C Investment income per share reflects a special dividend which amounted to $.04 per share.
D Expense ratios reflect operating expenses of the class. Expenses before reductions do not reflect amounts reimbursed by the investment adviser or reductions from brokerage service arrangements or other expense offset arrangements and do not represent the amount paid by the class during periods when reimbursements or reductions occur. Expenses net of any voluntary waivers reflect expenses after reimbursement by the investment adviser but prior to reductions from brokerage service arrangements or other expense offset arrangements. Expenses net of all reductions represent the net expenses paid by the class.
See accompanying notes which are an integral part of the financial statements.
Annual Report
Notes to Financial Statements
For the period ended October 31, 2003
(Amounts in thousands except ratios)
1. Significant Accounting Policies.
Fidelity Advisor Overseas Fund (the fund) is a fund of Fidelity Advisor Series VIII (the trust) and is authorized to issue an unlimited number of shares. The trust is registered under the Investment Company Act of 1940, as amended (the 1940 Act), as an open-end management investment company organized as a Massachusetts business trust.
The fund offers Class A, Class T, Class B, Class C, and Institutional Class shares, each of which has equal rights as to assets and voting privileges. Each class has exclusive voting rights with respect to matters that affect that class. Class B shares will automatically convert to Class A shares after a holding period of seven years from the initial date of purchase. Investment income, realized and unrealized capital gains and losses, the common expenses of the fund, and certain fund-level expense reductions, if any, are allocated on a pro rata basis to each class based on the relative net assets of each class to the total net assets of the fund. Each class differs with respect to transfer agent and distribution and service plan fees incurred. Certain expense reductions also differ by class.
The fund's investments in emerging markets can be subject to social, economic, regulatory, and political uncertainties and can be extremely volatile. The financial statements have been prepared in conformity with accounting principles generally accepted in the United States of America, which require management to make certain estimates and assumptions at the date of the financial statements. The following summarizes the significant accounting policies of the fund:
Security Valuation. Net asset value per share (NAV calculation) is calculated as of the close of business of the New York Stock Exchange, normally 4:00 p.m. Eastern time. Equity securities for which market quotations are available are valued at the last sale price or official closing price (closing bid price or last evaluated quote if no sale has occurred) on the primary market or exchange on which they trade. Debt securities for which quotations are readily available are valued at their most recent bid prices (sales prices if the principal market is an exchange) in the principal market in which such securities are normally traded, as determined by recognized dealers in such securities, or securities are valued on the basis of information provided by a pricing service. Pricing services use valuation matrices that incorporate both dealer-supplied valuations and valuation models. If an event that is expected to materially affect the value of a security occurs after the close of an exchange or market on which that security trades, but prior to the NAV calculation, then that security will be fair valued taking the event into account. Securities (including restricted securities) for which market quotations are not readily available are valued at their fair value as determined in good faith under consistently applied procedures under the general supervision of the Board of Trustees. Price movements in futures contracts and ADRs, market and trading trends, the bid/ask quotes of brokers and off-exchange institutional trading may be reviewed in the course of making a good faith determination of a security's fair value. Short-term securities with
Annual Report
Notes to Financial Statements - continued
(Amounts in thousands except ratios)
1. Significant Accounting Policies - continued
Annual Report
Security Valuation - continued
remaining maturities of sixty days or less for which quotations are not readily available are valued on the basis of amortized cost. Investments in open-end investment companies are valued at their net asset value each business day.
Foreign Currency. The fund uses foreign currency contracts to facilitate transactions in foreign-denominated securities. Losses from these transactions may arise from changes in the value of the foreign currency or if the counterparties do not perform under the contracts' terms.
Foreign denominated assets, including investment securities, and liabilities are translated into U.S. dollars at the exchange rate at period end. Purchases and sales of investment securities, income and dividends received and expenses denominated in foreign currencies are translated into U.S. dollars at the exchange rate in effect on the transaction date.
The effects of exchange rate fluctuations on investments are included with the net realized and unrealized gain (loss) on investment securities. Other foreign currency transactions resulting in realized and unrealized gain (loss) are disclosed separately.
Investment Transactions and Income. Security transactions are accounted for as of trade date. Gains and losses on securities sold are determined on the basis of identified cost. Dividend income is recorded on the ex-dividend date, except for certain dividends from foreign securities where the ex-dividend date may have passed, which are recorded as soon as the fund is informed of the ex-dividend date. Non-cash dividends included in dividend income, if any, are recorded at the fair market value of the securities received. Interest income is accrued as earned. Interest income includes coupon interest and amortization of premium and accretion of discount on debt securities, which is accrued using the interest method. Investment income is recorded net of foreign taxes withheld where recovery of such taxes is uncertain. Debt obligations may be placed on non-accrual status and related interest income may be reduced by ceasing current accruals and writing off interest receivables when the collection of all or a portion of interest has become doubtful based on consistently applied procedures. A debt obligation is removed from non-accrual status when the issuer resumes interest payments or when collectibility of interest is reasonably assured.
Expenses. Most expenses of the trust can be directly attributed to a fund. Expenses which cannot be directly attributed are apportioned among the funds in the trust.
Income Tax Information and Distributions to Shareholders. Each year the fund intends to qualify as a regulated investment company by distributing all of its taxable income and realized gains under Subchapter M of the Internal Revenue Code. As a result, no provision for income taxes is required in the accompanying financial statements.
Annual Report
Notes to Financial Statements - continued
(Amounts in thousands except ratios)
1. Significant Accounting Policies - continued
Annual Report
Income Tax Information and Distributions to Shareholders - continued
Foreign taxes are provided for based on each fund's understanding of the tax rules and rates that exist in the foreign markets in which it invests. Income dividends and capital gain distributions are declared separately for each class. Distributions are recorded on the ex-dividend date.
Income and capital gain distributions are determined in accordance with income tax regulations, which may differ from generally accepted accounting principles. In addition, the fund will treat a portion of the proceeds from shares redeemed as a distribution from net investment income and realized gain for income tax purposes. Capital accounts within the financial statements are adjusted for permanent and temporary book and tax differences. These adjustments have no impact on net assets or the results of operations. Temporary differences will reverse in a subsequent period. These differences are primarily due to foreign currency transactions, passive foreign investment companies (PFIC), market discount, capital loss carryforwards and losses deferred due to wash sales.
The tax-basis components of distributable earnings and the federal tax cost as of period end were as follows:
Unrealized appreciation | $ 157,832 | | |
Unrealized depreciation | (92,965) | |
Net unrealized appreciation (depreciation) | 64,867 | |
Undistributed ordinary income | 9,186 | |
Capital loss carryforward | (356,453) | |
Cost for federal income tax purposes | $ 1,348,227 | |
Short-Term Trading (Redemption) Fees. Shares purchased after March 31, 2004 and held in the fund less than 30 days will be subject to a short-term trading fee equal to 1.00% of the proceeds of the redeemed shares. The fee, which will be retained by the fund, is accounted for as an addition to paid in capital.
2. Operating Policies.
Repurchase Agreements. Fidelity Management & Research Company (FMR) has received an Exemptive Order from the Securities and Exchange Commission (the SEC) which permits the fund and other affiliated entities of FMR to transfer uninvested cash balances into joint trading accounts. These accounts are then invested in repurchase agreements that are collateralized by U.S. Treasury or Government obligations. The fund may also invest directly with institutions, in repurchase agreements that are collateralized by commercial paper obligations and corporate obligations. Collateral is held in segregated accounts with custodian banks and may be obtained in the event of a default of the
Annual Report
Notes to Financial Statements - continued
(Amounts in thousands except ratios)
2. Operating Policies - continued
Annual Report
Repurchase Agreements - continued
counterparty. Collateral is marked-to-market daily and maintained at a value at least equal to the principal amount of the repurchase agreement (including accrued interest).
Delayed Delivery Transactions and When-Issued Securities. The fund may purchase or sell securities on a delayed delivery or when-issued basis. Payment and delivery may take place after the customary settlement period for that security. The price of the underlying securities and the date when the securities will be delivered and paid for are fixed at the time the transaction is negotiated. During the time a delayed delivery sell is outstanding, the contract is marked-to-market daily and equivalent deliverable securities are held for the transaction. The value of the securities purchased on a delayed delivery or when-issued basis are identified as such in the fund's Schedule of Investments. The fund may receive compensation for interest forgone in the purchase of a delayed delivery or when-issued security. With respect to purchase commitments, the fund identifies securities as segregated in its records with a value at least equal to the amount of the commitment. Losses may arise due to changes in the value of the underlying securities or if the counterparty does not perform under the contract, or if the issuer does not issue the securities due to political, economic, or other factors.
Restricted Securities. The fund may invest in securities that are subject to legal or contractual restrictions on resale. These securities generally may be resold in transactions exempt from registration or to the public if the securities are registered. Disposal of these securities may involve time-consuming negotiations and expense, and prompt sale at an acceptable price may be difficult. Information regarding restricted securities is included at the end of the fund's Schedule of Investments.
3. Purchases and Sales of Investments.
Information regarding purchases and sales of securities is included under the caption "Other Information" at the end of the fund's Schedule of Investments.
4. Fees and Other Transactions with Affiliates.
Management Fee. FMR and its affiliates provide the fund with investment management related services for which the fund pays a monthly management fee. The management fee is the sum of an individual fund fee rate that is based on an annual rate of .45% of the fund's average net assets and a group fee rate that averaged .28% during the period. The group fee rate is based upon the average net assets of all the mutual funds advised by FMR. The group fee rate decreases as assets under management increase and increases as assets under management decrease. In addition, the management fee is subject to a performance adjustment (up to a maximum of ± .20% of the fund's average
Annual Report
Notes to Financial Statements - continued
(Amounts in thousands except ratios)
4. Fees and Other Transactions with Affiliates - continued
Annual Report
Management Fee - continued
net assets over a 36 month performance period). The upward or downward adjustment to the management fee is based on the investment performance of the asset-weighted return of all classes as compared to an appropriate benchmark index. For the period, the total annual management fee rate, including the performance adjustment, was .59% of the fund's average net assets.
Distribution and Service Plan. In accordance with Rule 12b-1 of the 1940 Act, the Fund has adopted separate Distribution and Service Plans for each class of shares. Certain classes pay Fidelity Distributors Corporation (FDC), an affiliate of FMR, separate Distribution and Service Fees, each of which is based on an annual percentage of each class' average net assets. Class A and Class T Plans also authorize the use of brokerage commissions to pay distribution expenses. This practice has been discontinued and no commissions incurred after June 30, 2003 have been used to pay distribution expenses. In addition, FDC may pay financial intermediaries for selling shares of the fund and providing shareholder support services. For the period, the Distribution and Service Fee rates, the total amounts paid to and retained by FDC and the amount of distribution expenses paid with brokerage commissions were as follows:
| Distribution Fee | Service
Fee | Paid to
FDC | Retained
by FDC | Paid with
Commissions |
Class A | - | .25% | $ 136 | $ - | $ 2 |
Class T | .25% | .25% | 4,641 | 26 | 45 |
Class B | .75% | .25% | 512 | 384 | - |
Class C | .75% | .25% | 356 | 18 | - |
| | | $ 5,645 | $ 428 | $ 47 |
Sales Load. FDC receives a front-end sales charge of up to 5.75% for selling Class A shares, and 3.50% for selling Class T shares of the fund. FDC receives the proceeds of contingent deferred sales charges levied on Class A, Class T, Class B, and Class C redemptions. These charges depend on the holding period. The deferred sales charges range from 5% to 1% for Class B, 1% for Class C, and .25% for certain purchases of Class A and Class T shares.
For the period, sales charge amounts retained by FDC were as follows:
| Retained
by FDC | |
Class A | $ 12 | |
Class T | 19 | |
Class B* | 123 | |
Class C* | 24 | |
| $ 178 | |
Annual Report
Notes to Financial Statements - continued
(Amounts in thousands except ratios)
* When Class B and Class C shares are initially sold, FDC pays commissions from its own resources to financial intermediaries through
which the sales are made.
Annual Report
4. Fees and Other Transactions with Affiliates - continued
Transfer Agent Fees. Fidelity Investments Institutional Operations Company, Inc. (FIIOC), an affiliate of FMR, is the transfer, dividend disbursing and shareholder servicing agent (collectively referred to as the transfer agent) for each class of the fund. FIIOC receives account fees and asset-based fees that vary according to the account size and type of account of the shareholders of the respective classes of the fund. FIIOC pays for typesetting, printing and mailing of all shareholder reports, except proxy statements. For the period, the following amounts were paid to FIIOC:
| Amount | % of
Average Net Assets |
Class A | $ 208 | .39 |
Class T | 2,393 | .26 |
Class B | 293 | .57 |
Class C | 169 | .47 |
Institutional Class | 140 | .23 |
| $ 3,203 | |
Accounting and Security Lending Fees. Fidelity Service Company, Inc. (FSC), an affiliate of FMR, maintains the fund's accounting records and administers the security lending program. The security lending fee is based on the number and duration of lending transactions. The accounting fee is based on the level of average net assets for the month plus out-of-pocket expenses.
Central Funds. The fund may invest in affiliated Central Funds managed by Fidelity Investments Money Management, Inc. (FIMM), an affiliate of FMR. The Central Funds are open-end investment companies available only to investment companies and other accounts managed by FMR and its affiliates. The Central Funds seek preservation of capital and current income and do not pay a management fee. Income distributions earned by the fund are recorded as income in the accompanying financial statements and totaled $650 for the period.
Brokerage Commissions. The fund placed a portion of its portfolio transactions with brokerage firms which are affiliates of the investment adviser. The commissions paid to these affiliated firms are shown under the caption "Other Information" at the end of the fund's Schedule of Investments.
Interfund Lending Program. Pursuant to an Exemptive Order issued by the SEC, the fund, along with other registered investment companies having management contracts with FMR, may participate in an interfund lending program. This program provides an alternative credit facility allowing the funds to borrow from, or lend money to, other participating funds. Information regarding the fund's participation in the program is included under the caption "Other Information" at the end of the fund's Schedule of Investments.
Annual Report
Notes to Financial Statements - continued
(Amounts in thousands except ratios)
5. Committed Line of Credit.
The fund participates with other funds managed by FMR in a $3.5 billion credit facility (the "line of credit") to be utilized for temporary or emergency purposes to fund shareholder redemptions or for other short-term liquidity purposes. The fund has agreed to pay commitment fees on its pro rata portion of the line of credit. During the period, there were no borrowings on this line of credit.
6. Security Lending.
The fund lends portfolio securities from time to time in order to earn additional income. The fund receives collateral (in the form of U.S. Treasury obligations, letters of credit and/or cash) against the loaned securities and maintains collateral in an amount not less than 100% of the market value of the loaned securities during the period of the loan. The market value of the loaned securities is determined at the close of business of the fund and any additional required collateral is delivered to the fund on the next business day. If the borrower defaults on its obligation to return the securities loaned because of insolvency or other reasons, a fund could experience delays and costs in recovering the securities loaned or in gaining access to the collateral. Cash collateral is invested in cash equivalents. The value of loaned securities and cash collateral at period end are disclosed on the fund's Statement of Assets and Liabilities.
7. Expense Reductions.
Many of the brokers with whom FMR places trades on behalf of the fund provided services to the fund in addition to trade execution. These services may include payments of expenses on behalf of the fund to support distribution of fund shares for Class A and Class T ("Distribution Expense Reduction") and to pay other fund expenses, such as transfer agent fees ("Other Expense Reduction") collectively referred to as "Brokerage Service Arrangements" in the accompanying table. Brokerage service arrangements generally benefits all shareholders of each class by reducing fund expenses. Each of Class A and Class T shareholders' Other Expense Reduction benefit is reduced by the amount of any Distribution Expense Reduction. In addition, through arrangements with the fund's custodian, credits realized as a result of uninvested cash balances were used to reduce the fund's expenses. All of the applicable expense reductions are noted in the table below.
| Brokerage Service Arrangements | |
| Distribution
expense reduction | Other
expense reduction | Custody
expense reduction |
| | | |
Fund Level | $ - | $ 446 | $ 1 |
Class A | 2 | - | - |
Class T | 45 | - | - |
| $ 47 | $ 446 | $ 1 |
8. Other Information.
At the end of the period, one unaffiliated shareholder was the owner of record of 26% of the total outstanding shares of the fund.
9. Share Transactions.
Transactions for each class of shares were as follows:
| Shares | Dollars |
Years ended October 31, | 2003 | 2002 | 2003 | 2002 |
Class A | | | | |
Shares sold | 12,415 | 9,250 | $ 145,269 | $ 120,262 |
Shares redeemed | (11,712) | (8,748) | (137,635) | (114,908) |
Net increase (decrease) | 703 | 502 | $ 7,634 | $ 5,354 |
Class T | | | | |
Shares sold | 40,894 | 34,800 | $ 489,390 | $ 449,377 |
Shares redeemed | (47,699) | (42,125) | (568,651) | (538,683) |
Net increase (decrease) | (6,805) | (7,325) | $ (79,261) | $ (89,306) |
Class B | | | | |
Shares sold | 460 | 738 | $ 5,148 | $ 9,282 |
Shares redeemed | (1,176) | (2,060) | (12,818) | (25,749) |
Net increase (decrease) | (716) | (1,322) | $ (7,670) | $ (16,467) |
Class C | | | | |
Shares sold | 1,424 | 967 | $ 16,568 | $ 12,444 |
Shares redeemed | (1,891) | (1,683) | (21,771) | (21,549) |
Net increase (decrease) | (467) | (716) | $ (5,203) | $ (9,105) |
Institutional Class | | | | |
Shares sold | 7,107 | 5,939 | $ 81,168 | $ 77,765 |
Shares redeemed | (8,025) | (5,590) | (91,891) | (72,010) |
Net increase (decrease) | (918) | 349 | $ (10,723) | $ 5,755 |
Annual Report
Report of Independent Auditors
To the Trustees of Fidelity Advisor Series VIII and the Shareholders of Fidelity Advisor Overseas Fund.
In our opinion, the accompanying statement of assets and liabilities, including the schedule of investments, and the related statements of operations and of changes in net assets and the financial highlights present fairly, in all material respects, the financial position of Fidelity Advisor Overseas Fund (a fund of Fidelity Advisor Series VIII) at October 31, 2003 and the results of its operations, the changes in its net assets and the financial highlights for the periods indicated, in conformity with accounting principles generally accepted in the United States of America. These financial statements and financial highlights (hereafter referred to as "financial statements") are the responsibility of the Fidelity Advisor Overseas Fund's management; our responsibility is to express an opinion on these financial statements based on our audits. We conducted our audits of these financial statements in accordance with auditing standards generally accepted in the United States of America which require that we plan and perform the audit to obtain reasonable assurance about whether the financial statements are free of material misstatement. An audit includes examining, on a test basis, evidence supporting the amounts and disclosures in the financial statements, assessing the accounting principles used and significant estimates made by management, and evaluating the overall financial statement presentation. We believe that our audits, which included confirmation of securities at October 31, 2003 by correspondence with the custodian and brokers, provide a reasonable basis for our opinion.
/s/PricewaterhouseCoopers LLP
PricewaterhouseCoopers LLP
Boston, Massachusetts
December 12, 2003
Annual Report
Trustees and Officers
The Trustees, Members of the Advisory Board, and executive officers of the trust and fund, as applicable, are listed below. The Board of Trustees governs the fund and is responsible for protecting the interests of shareholders. The Trustees are experienced executives who meet periodically throughout the year to oversee the fund's activities, review contractual arrangements with companies that provide services to the fund, and review the fund's performance. Except for William O. McCoy, each of the Trustees oversees 289 funds advised by FMR or an affiliate. Mr. McCoy oversees 291 funds advised by FMR or an affiliate.
The Trustees hold office without limit in time except that (a) any Trustee may resign; (b) any Trustee may be removed by written instrument, signed by at least two-thirds of the number of Trustees prior to such removal; (c) any Trustee who requests to be retired or who has become incapacitated by illness or injury may be retired by written instrument signed by a majority of the other Trustees; and (d) any Trustee may be removed at any special meeting of shareholders by a two-thirds vote of the outstanding voting securities of the trust. In any event, each non-interested Trustee shall retire not later than the last day of the calendar year in which his or her 72nd birthday occurs. The executive officers and Advisory Board Members hold office without limit in time, except that any officer and Advisory Board Member may resign or may be removed by a vote of a majority of the Trustees at any regular meeting or any special meeting of the Trustees. Except as indicated, each individual has held the office shown or other offices in the same company for the past five years.
The fund's Statement of Additional Information (SAI) includes more information about the Trustees. To request a free copy, call Fidelity at 1-877-208-0098.
Interested Trustees*:
Correspondence intended for each Trustee who is an "interested person" (as defined in the 1940 Act) may be sent to 82 Devonshire Street, Boston, Massachusetts 02109.
Name, Age; Principal Occupation |
Edward C. Johnson 3d (73)** |
| Year of Election or Appointment: 1983 Mr. Johnson is Chairman of the Board of Trustees. Mr. Johnson serves as Chief Executive Officer, Chairman, and a Director of FMR Corp.; a Director and Chairman of the Board and of the Executive Committee of FMR; Chairman and a Director of Fidelity Management & Research (Far East) Inc.; Chairman (1998) and a Director of Fidelity Investments Money Management, Inc.; and Chairman (2001) and a Director (2000) of FMR Co., Inc. |
Abigail P. Johnson (41)** |
| Year of Election or Appointment: 2001 Senior Vice President of Advisor Overseas (2001). Ms. Johnson also serves as Senior Vice President of other Fidelity funds (2001). She is President and a Director of FMR (2001), Fidelity Investments Money Management, Inc. (2001), FMR Co., Inc. (2001), and a Director of FMR Corp. Previously, Ms. Johnson managed a number of Fidelity funds. |
Laura B. Cronin (49) |
| Year of Election or Appointment: 2003 Ms. Cronin is an Executive Vice President (2002) and Chief Financial Officer (2002) of FMR Corp. and is a member of the Fidelity Management Committee (2003). Previously, Ms. Cronin served as Vice President of Finance of FMR (1997-1999), and Chief Financial Officer of FMR (1999-2001), Fidelity Personal Investments (2001), and Fidelity Brokerage Company (2001-2002). |
Robert L. Reynolds (51) |
| Year of Election or Appointment: 2003 Mr. Reynolds is a Director (2003) and Chief Operating Officer (2002) of FMR Corp. and is the head of the Fidelity Management Committee (2003). He also serves on the Board at Fidelity Investments Canada, Ltd. (2000). Previously, Mr. Reynolds served as President of Fidelity Investments Institutional Retirement Group (1996-2000). |
* Trustees have been determined to be "Interested Trustees" by virtue of, among other things, their affiliation with the trust or various entities under common control with FMR.
** Edward C. Johnson 3d, Trustee, is Abigail P. Johnson's father.
Annual Report
Non-Interested Trustees:
Correspondence intended for each non-interested Trustee (that is, the Trustees other than the Interested Trustees) may be sent to Fidelity Investments, P.O. Box 55235, Boston, Massachusetts 02205-5235.
Name, Age; Principal Occupation |
J. Michael Cook (61) |
| Year of Election or Appointment: 2001 Prior to Mr. Cook's retirement in May 1999, he served as Chairman and Chief Executive Officer of Deloitte & Touche LLP (accounting/consulting), Chairman of the Deloitte & Touche Foundation, and a member of the Board of Deloitte Touche Tohmatsu. He currently serves as a Director of Comcast (telecommunications, 2002), International Flavors & Fragrances, Inc. (2000), Rockwell Automation (2000) and The Dow Chemical Company (2000). He is a Member of the Diversity Advisory Council of Marakon (2003) and the Advisory Board of the Directorship Search Group, Chairman Emeritus of the Board of Catalyst (a leading organization for the advancement of women in business), and is Chairman of the Accountability Advisory Council to the Comptroller General of the United States. He also serves as a Member of the Advisory Board of the Graduate School of Business of the University of Florida, his alma mater. |
Ralph F. Cox (71) |
| Year of Election or Appointment: 1991 Mr. Cox is President of RABAR Enterprises (management consulting for the petroleum industry). Prior to February 1994, he was President of Greenhill Petroleum Corporation (petroleum exploration and production). Until March 1990, Mr. Cox was President and Chief Operating Officer of Union Pacific Resources Company (exploration and production). He is a Director of CH2M Hill Companies (engineering), and Abraxas Petroleum (petroleum exploration and production, 1999). In addition, he is a member of advisory boards of Texas A&M University and the University of Texas at Austin. |
Phyllis Burke Davis (71) |
| Year of Election or Appointment: 1992 Mrs. Davis is retired from Avon Products, Inc. (consumer products) where she held various positions including Senior Vice President of Corporate Affairs and Group Vice President of U.S. product marketing, sales, distribution, and manufacturing. Mrs. Davis is a member of the Board of Directors of the Southampton Hospital in Southampton, N.Y. (1998). Previously, she served as a Director of BellSouth Corporation (telecommunications), Eaton Corporation (diversified industrial), the TJX Companies, Inc. (retail stores), Hallmark Cards, Inc., and Nabisco Brands, Inc. |
Robert M. Gates (60) |
| Year of Election or Appointment: 1997 Dr. Gates is President of Texas A&M University (2002). He was Director of the Central Intelligence Agency (CIA) from 1991 to 1993. From 1989 to 1991, Dr. Gates served as Assistant to the President of the United States and Deputy National Security Advisor. Dr. Gates is a Director of NACCO Industries, Inc. (mining and manufacturing), and Parker Drilling Co., Inc. (drilling and rental tools for the energy industry, 2001). He also serves as a member of the Advisory Board of VoteHere.net (secure internet voting, 2001). Previously, Dr. Gates served as a Director of LucasVarity PLC (automotive components and diesel engines), a Director of TRW Inc. (automotive, space, defense, and information technology), and Dean of the George Bush School of Government and Public Service at Texas A&M University (1999-2001). Dr. Gates also is a Trustee of the Forum for International Policy. |
Donald J. Kirk (70) |
| Year of Election or Appointment: 1987 Mr. Kirk is a Governor of the American Stock Exchange (2001), a Trustee and former Chairman of the Board of Trustees of the Greenwich Hospital Association, a Director of the Yale-New Haven Health Services Corp. (1998), and a Director Emeritus and former Chairman of the Board of Directors of National Arts Strategies Inc. Mr. Kirk was an Executive-in-Residence (1995-2000) and a Professor (1987-1995) at Columbia University Graduate School of Business. Prior to 1987, he was Chairman of the Financial Accounting Standards Board. Previously, Mr. Kirk served as a Governor of the National Association of Securities Dealers, Inc. (1996-2002), a member and Vice Chairman of the Public Oversight Board of the American Institute of Certified Public Accountants' SEC Practice Section (1995-2002), a Director of General Re Corporation (reinsurance, 1987-1998) and as a Director of Valuation Research Corp. (appraisals and valuations). |
Marie L. Knowles (57) |
| Year of Election or Appointment: 2001 Prior to Ms. Knowles' retirement in June 2000, she served as Executive Vice President and Chief Financial Officer of Atlantic Richfield Company (ARCO) (diversified energy, 1996-2000). From 1993 to 1996, she was a Senior Vice President of ARCO and President of ARCO Transportation Company. She served as a Director of ARCO from 1996 to 1998. She currently serves as a Director of Phelps Dodge Corporation (copper mining and manufacturing), URS Corporation (multidisciplinary engineering, 1999), and McKesson Corporation (healthcare service, 2002). Ms. Knowles is a Trustee of the Brookings Institution and the Catalina Island Conservancy and also serves as a member of the Advisory Board for the School of Engineering of the University of Southern California. |
Ned C. Lautenbach (59) |
| Year of Election or Appointment: 2000 Mr. Lautenbach has been a partner of Clayton, Dubilier & Rice, Inc. (private equity investment firm) since September 1998. Previously, Mr. Lautenbach was with the International Business Machines Corporation (IBM) from 1968 until his retirement in 1998. He was most recently Senior Vice President and Group Executive of Worldwide Sales and Services. From 1993 to 1995, he was Chairman of IBM World Trade Corporation, and from 1994 to 1998 was a member of IBM's Corporate Executive Committee. Mr. Lautenbach serves as Chairman and as a Director (1998) of Acterna Corporation (communications test equipment). He is also Co-Chairman of Covansys, Inc. (global provider of business and technology solutions, 2000). In addition, he is a Director of Eaton Corporation (diversified industrial) and the Philharmonic Center for the Arts in Naples, Florida (1999). He also is a member of the Council on Foreign Relations. |
Marvin L. Mann (70) |
| Year of Election or Appointment: 1993 Mr. Mann is Chairman of the non-interested Trustees (2001). He is Chairman Emeritus of Lexmark International, Inc. (computer peripherals) where he served as CEO until April 1998 and retired as Chairman May 1999, and remains a member of the Board. Prior to 1991, he held the positions of Vice President of International Business Machines Corporation (IBM) and President and General Manager of various IBM divisions and subsidiaries. Mr. Mann is a Board member of Imation Corp. (imaging and information storage) and Acterna Corporation (communications test equipment, 1999). He is also a member of the Director Services Committee of the Investment Company Institute. In addition, Mr. Mann is a member of the President's Cabinet at the University of Alabama and the Board of Visitors of the Culverhouse College of Commerce and Business Administration at the University of Alabama. |
William O. McCoy (70) |
| Year of Election or Appointment: 1997 Prior to his retirement in December 1994, Mr. McCoy was Vice Chairman of the Board of BellSouth Corporation (telecommunications) and President of BellSouth Enterprises. He is currently a Director of Liberty Corporation (holding company), Duke Realty Corporation (real estate), Progress Energy, Inc. (electric utility), and Acterna Corporation (communications test equipment, 1999). He is also a partner of Franklin Street Partners (private investment management firm) and a member of the Research Triangle Foundation Board. In addition, Mr. McCoy served as the Interim Chancellor (1999-2000) and a member of the Board of Visitors (1994-1998) for the University of North Carolina at Chapel Hill and currently serves on the Board of Directors of the University of North Carolina Health Care System and the Board of Visitors of the Kenan-Flagler Business School (University of North Carolina at Chapel Hill). He also served as Vice President of Finance for the University of North Carolina (16-school system, 1995-1998). |
William S. Stavropoulos (64) |
| Year of Election or Appointment: 2001 Mr. Stavropoulos is Chairman of the Board, President and CEO (2002), and Chairman of the Executive Committee (2000) and a Director of The Dow Chemical Company. Since joining The Dow Chemical Company in 1967, Mr. Stavropoulos served in numerous senior management positions, including President (1993-2000) and Chief Executive Officer (1995-2000). Currently, he is a Director of NCR Corporation (data warehousing and technology solutions), BellSouth Corporation (telecommunications), Chemical Financial Corporation, and Maersk Inc. (industrial conglomerate, 2002). He also serves as a member of the Board of Trustees of the American Enterprise Institute for Public Policy Research. In addition, Mr. Stavropoulos is a member of The Business Council, J.P. Morgan International Council, World Business Council for Sustainable Development, and the University of Notre Dame Advisory Council for the College of Science. |
Annual Report
Trustees and Officers - continued
Advisory Board Members and Executive Officers:
Correspondence intended for Dr. Heilmeier may be sent to Fidelity Investments, P.O. Box 55235, Boston, Massachusetts 02205-5235. Correspondence intended for each executive officer and Mr. Lynch may be sent to 82 Devonshire Street, Boston, Massachusetts 02109.
Name, Age; Principal Occupation |
George H. Heilmeier (67) |
| Year of Election or Appointment: 2003 Member of the Advisory Board of Fidelity Advisor Series VIII. Dr. Heilmeier is Chairman Emeritus of Telcordia Technologies (communication software and systems), where prior to his retirement, he served as company Chairman and Chief Executive Officer. He currently serves on the Boards of Directors of The Mitre Corporation (systems engineering and information technology support for the government), INET Technologies Inc. (telecommunications network surveillance, 2001) and Teletech Holdings (customer management services, 1998). He is Chairman of the General Motors Technology Advisory Committee and a Life Fellow of the IEEE (2000). Dr. Heilmeier is a member of the Defense Science Board and the National Security Agency Advisory Board. He is also a member of the National Academy of Engineering, the American Academy of Arts and Sciences and The Board of Overseers of the School of Engineering and Applied Science of the University of Pennsylvania. Previously, Dr. Heilmeier served as a Director of TRW Inc. (automotive, space, defense, and information technology, 1992-2002) and Compaq (1994-2002). |
Peter S. Lynch (60) |
| Year of Election or Appointment: 2003 Member of the Advisory Board of Fidelity Advisor Series VIII. Vice Chairman and a Director of FMR, and Vice Chairman (2001) and a Director (2000) of FMR Co., Inc. Previously, Mr. Lynch served as a Trustee of the Fidelity funds (1990-2003). Prior to May 31, 1990, he was a Director of FMR and Executive Vice President of FMR (a position he held until March 31, 1991), Vice President of Fidelity® Magellan® Fund and FMR Growth Group Leader, and Managing Director of FMR Corp. Mr. Lynch was also Vice President of Fidelity Investments Corporate Services. In addition, he serves as a Trustee of Boston College, Massachusetts Eye & Ear Infirmary, Historic Deerfield, John F. Kennedy Library, and the Museum of Fine Arts of Boston. |
Philip L. Bullen (44) |
| Year of Election or Appointment: 2001 Vice President of Advisor Overseas. Mr. Bullen also serves as Vice President of certain Equity Funds (2001) and certain High Income Funds (2001). He is Senior Vice President of FMR (2001) and FMR Co., Inc. (2001), President and a Director of Fidelity Management & Research (Far East) Inc. (2001), President and a Director of Fidelity Management & Research (U.K.) Inc. (2002), and a Director of Strategic Advisers, Inc. (2002). Before joining Fidelity Investments, Mr. Bullen was President and Chief Investment Officer of Santander Global Advisors (1997-2000) and President and Chief Executive Officer of Boston's Baring Asset Management Inc. (1994-1997). |
Richard R. Mace, Jr. (41) |
| Year of Election or Appointment: 1996 Vice President of Advisor Overseas. Mr. Mace is also Vice President of other funds advised by FMR. |
Eric D. Roiter (54) |
| Year of Election or Appointment: 1998 Secretary of Advisor Overseas. He also serves as Secretary of other Fidelity funds (1998); Vice President, General Counsel, and Clerk of FMR Co., Inc. (2001) and FMR (1998); Vice President and Clerk of FDC (1998); Assistant Clerk of Fidelity Management & Research (U.K.) Inc. (2001) and Fidelity Management & Research (Far East) Inc. (2001); and Assistant Secretary of Fidelity Investments Money Management Inc. (2001). Prior to joining Fidelity, Mr. Roiter was with the law firm of Debevoise & Plimpton, as an associate (1981-1984) and as a partner (1985-1997), and served as an Assistant General Counsel of the U.S. Securities and Exchange Commission (1979-1981). Mr. Roiter is an Adjunct Member, Faculty of Law, at Boston College Law School (2003). |
Stuart Fross (44) |
| Year of Election or Appointment: 2003 Assistant Secretary of Advisor Overseas. Mr. Fross also serves as Assistant Secretary of other Fidelity funds (2003) and is an employee of FMR. |
Maria F. Dwyer (44) |
| Year of Election or Appointment: 2002 President and Treasurer of Advisor Overseas. Ms. Dwyer also serves as President and Treasurer of other Fidelity funds (2002) and is a Vice President (1999) and an employee (1996) of FMR. Prior to joining Fidelity, Ms. Dwyer served as Director of Compliance for MFS Investment Management. |
Timothy F. Hayes (52) |
| Year of Election or Appointment: 2002 Chief Financial Officer of Advisor Overseas. Mr. Hayes also serves as Chief Financial Officer of other Fidelity funds (2002). Recently he was appointed President of Fidelity Service Company (2003) where he also serves as a Director. Mr. Hayes also serves as President of Fidelity Investments Operations Group (FIOG, 2002), which includes Fidelity Pricing and Cash Management Services Group (FPCMS), where he was appointed President in 1998. Previously, Mr. Hayes served as Chief Financial Officer of Fidelity Investments Corporate Systems and Service Group (1998) and Fidelity Systems Company (1997-1998). |
John R. Hebble (45) |
| Year of Election or Appointment: 2003 Deputy Treasurer of Advisor Overseas. Mr. Hebble also serves as Deputy Treasurer of other Fidelity funds (2003), and is an employee of FMR. Before joining Fidelity Investments, Mr. Hebble worked at Deutsche Asset Management where he served as Director of Fund Accounting (2002-2003) and Assistant Treasurer of the Scudder Funds (1998-2003). |
John H. Costello (57) |
| Year of Election or Appointment: 1990 Assistant Treasurer of Advisor Overseas. Mr. Costello also serves as Assistant Treasurer of other Fidelity funds and is an employee of FMR. |
Francis V. Knox, Jr. (56) |
| Year of Election or Appointment: 2002 Assistant Treasurer of Advisor Overseas. Mr. Knox also serves as Assistant Treasurer of other Fidelity funds (2002), and is a Vice President and an employee of FMR. Previously, Mr. Knox served as Vice President of Investment & Advisor Compliance (1990-2001), and Compliance Officer of Fidelity Management & Research (U.K.) Inc. (1992-2002), Fidelity Management & Research (Far East) Inc. (1991-2002), and FMR Corp. (1995-2002). |
Mark Osterheld (48) |
| Year of Election or Appointment: 2002 Assistant Treasurer of Advisor Overseas. Mr. Osterheld also serves as Assistant Treasurer of other Fidelity funds (2002) and is an employee of FMR. |
Thomas J. Simpson (45) |
| Year of Election or Appointment: 2000 Assistant Treasurer of Advisor Overseas. Mr. Simpson is Assistant Treasurer of other Fidelity funds (2000) and an employee of FMR (1996). Prior to joining FMR, Mr. Simpson was Vice President and Fund Controller of Liberty Investment Services (1987-1995). |
Annual Report
Annual Report
Annual Report
Investment Adviser
Fidelity Management & Research Company
Boston, MA
Investment Sub-Advisers
FMR Co., Inc.
Fidelity Management & Research
(U.K.) Inc.
Fidelity Management & Research
(Far East) Inc.
Fidelity International
Investment Advisors
Fidelity Investments Japan Limited
Fidelity International Investment Advisors (U.K.) Limited
General Distributor
Fidelity Distributors Corporation
Boston, MA
Transfer and Shareholder
Servicing Agents
Fidelity Investments Institutional Operations Company, Inc.
Boston, MA
Custodian
JPMorgan Chase Bank
New York, NY
Annual Report
Fidelity Advisor Aggressive Growth Fund |
Fidelity Advisor Asset Allocation Fund |
Fidelity Advisor Balanced Fund |
Fidelity Advisor Biotechnology Fund |
Fidelity Advisor California Municipal Income Fund |
Fidelity Advisor Consumer Industries Fund |
Fidelity Advisor Cyclical Industries Fund |
Fidelity Advisor Developing Communications Fund |
Fidelity Advisor Diversified International Fund |
Fidelity Advisor Dividend Growth Fund |
Fidelity Advisor Dynamic Capital Appreciation Fund |
Fidelity Advisor Electronics Fund |
Fidelity Advisor Emerging Asia Fund |
Fidelity Advisor Emerging Markets Income Fund |
Fidelity Advisor Equity Growth Fund |
Fidelity Advisor Equity Income Fund |
Fidelity Advisor Equity Value Fund |
Fidelity Advisor Europe Capital Appreciation Fund |
Fidelity Advisor Fifty Fund |
Fidelity Advisor Financial Services Fund |
Fidelity Advisor Floating Rate High Income Fund |
Fidelity Advisor Freedom Income FundSM |
Fidelity Advisor Freedom 2010 FundSM |
Fidelity Advisor Freedom 2020 FundSM |
Fidelity Advisor Freedom 2030 FundSM |
Fidelity Advisor Freedom 2040 FundSM |
Fidelity Advisor Global Equity Fund |
Fidelity Advisor Government Investment Fund |
Fidelity Advisor Growth & Income Fund |
Fidelity Advisor Growth Opportunities |
Fidelity Advisor Health Care Fund |
Fidelity Advisor High Income Advantage Fund |
Fidelity Advisor High Income Fund |
Fidelity Advisor Inflation-Protected Bond Fund |
Fidelity Advisor Intermediate Bond Fund |
Fidelity Advisor International Capital Appreciation Fund |
Fidelity Advisor International Small Cap Fund |
Fidelity Advisor Investment Grade Bond Fund |
Fidelity Advisor Japan Fund |
Fidelity Advisor Korea Fund |
Fidelity Advisor Large Cap Fund |
Fidelity Advisor Latin America Fund |
Fidelity Advisor Leveraged Company Stock Fund |
Fidelity Advisor Mid Cap Fund |
Fidelity Advisor Mortgage Securities Fund |
Fidelity Advisor Municipal Income Fund |
Fidelity Advisor Natural Resources Fund |
Fidelity Advisor New Insights Fund |
Fidelity Advisor New York Municipal Income Fund |
Fidelity Advisor Overseas Fund |
Fidelity Advisor Real Estate Fund |
Fidelity Advisor Short Fixed-Income Fund |
Fidelity Advisor Short Intermediate Municipal Income Fund |
Fidelity Advisor Small Cap Fund |
Fidelity Advisor Strategic Growth Fund |
Fidelity Advisor Strategic Income Fund |
Fidelity Advisor Tax Managed Stock Fund |
Fidelity Advisor Technology Fund |
Fidelity Advisor Telecommunications & Utilities Growth Fund |
Fidelity Advisor Value Leaders Fund |
Fidelity Advisor Value Strategies Fund |
Prime Fund |
Tax-Exempt Fund |
Treasury Fund |
(Fidelity Investment logo)(registered trademark)
Corporate Headquarters
82 Devonshire St., Boston, MA 02109
www.fidelity.com
OS-UANN-1203
1.784767.100
Fidelity® Advisor
Overseas
Fund - Institutional Class
Annual Report
October 31, 2003
(2_fidelity_logos) (Registered_Trademark)
Contents
Chairman's Message | <Click Here> | Ned Johnson's message to shareholders. |
Performance | <Click Here> | How the fund has done over time. |
Management's Discussion | <Click Here> | The manager's review of fund performance, strategy and outlook. |
Investment Changes | <Click Here> | A summary of major shifts in the fund's investments over the past six months. |
Investments | <Click Here> | A complete list of the fund's investments with their market values. |
Financial Statements | <Click Here> | Statements of assets and liabilities, operations, and changes in net assets,
as well as financial highlights. |
Notes | <Click Here> | Notes to the financial statements. |
Auditors' Opinion | <Click Here> | |
Trustees and Officers | <Click Here> | |
| | |
For a free copy of the fund's proxy voting guidelines call 1-877-208-0098 or visit the Securities and Exchange Commission (SEC)'s web site at www.sec.gov.
Third party marks appearing herein are the property of their respective owners.
All other marks appearing herein are registered or unregistered trademarks or service marks of FMR Corp. or an affiliated company.
(Recycle graphic) This report is printed on recycled paper using soy-based inks.
This report and the financial statements contained herein are submitted for the general information of the shareholders of the fund. This report is not authorized for distribution to prospective investors in the fund unless preceded or accompanied by an effective prospectus.
Mutual fund shares are not deposits or obligations of, or guaranteed by, any depository institution. Shares are not insured by the FDIC, Federal Reserve Board or any other agency, and are subject to investment risks, including possible loss of principal amount invested.
Neither the fund nor Fidelity Distributors Corporation is a bank.
For more information on any Fidelity Advisor fund, including charges and expenses, contact your investment professional for a free prospectus. Read it carefully before you invest or send money.
Annual Report
Chairman's Message
(photo_of_Edward_C_Johnson_3d)
Dear Shareholder:
Many of you have read or heard news stories recently that were critical of mutual funds and made allegations that the mutual fund industry has been less than forthright. I find these reports unsettling and not necessarily an accurate picture of the overall industry, and I would like you to know where we at Fidelity stand.
With specific regard to allegations that certain mutual fund companies were violating the Securities and Exchange Commission's forward pricing rules or were involved in so-called "market timing" activities, I want to say two things:
First, Fidelity does not have agreements that permit customers who buy fund shares after 4 p.m. to obtain the 4 p.m. price. This is not to say that someone could not deceive the company through fraudulent acts. But I underscore that we have no so-called "agreements" which would permit this illegal practice.
Second, Fidelity has been on record for years opposing predatory short-term trading which adversely affects other shareholders in a mutual fund. In fact, in the 1980s, we began charging a fee - which is returned to the fund and, therefore, to investors - to discourage this activity. What's more, several years ago we took the industry lead in developing a Fair Value Pricing Policy to prevent market timing on foreign securities in our funds. It is reasonable to assume that another structure can be developed that would alter the system to make it much more difficult for predatory traders to operate. This, however, will only be achieved through close cooperation among regulators, legislators and the industry.
Certainly no industry is perfect, and there have been instances of unethical and illegal activity from time to time within the mutual fund industry. When this occurs, confessed or convicted offenders should be dealt with appropriately. Clearly, every system can be improved. We applaud well thought out improvements by regulators, legislators and industry representatives that achieve the common goal of building and protecting the value of investors' holdings. But we remain concerned about the risk of over-regulation and the quick application of simplistic solutions to intricate problems.
For more than 57 years, Fidelity Investments has worked very hard to improve its products and service to justify your trust. When our family founded this company in 1946, we had only a few hundred customers. Many of them were family and friends. Today, we serve more than 18 million customers including individual investors and participants in retirement plans across America.
Let me close by saying that we do not take your trust in us for granted, and we realize that we must always work to improve all aspects of our service to you. In turn, we urge you to continue your active participation with your financial matters, so that your interests can be well served.
Annual Report
Best regards,
/s/Edward C. Johnson 3d
Edward C. Johnson 3d
Annual Report
Performance: The Bottom Line
Average annual total return reflects the change in the value of an investment, assuming reinvestment of the class' dividend income and capital gains (the profits earned upon the sale of securities that have grown in value) and assuming a constant rate of performance each year. During periods of reimbursement by Fidelity, a fund's total return will be greater than it would be had the reimbursement not occurred. The $10,000 table and the fund's returns do not reflect the deduction of taxes that a shareholder would pay on fund distributions or the redemption of fund shares. How a fund did yesterday is no guarantee of how it will do tomorrow.
Average Annual Total Returns
Periods ended October 31, 2003 | | Past 1
year | Past 5
years | Past 10
years |
Institutional Class A | | 31.41% | 1.53% | 4.77% |
A Institutional Class shares are sold to eligible investors without a sales load or 12b-1 fee. The initial offering of Institutional Class shares took place on July 3, 1995. Returns prior to July 3, 1995 are those of Class T, the original class of the fund, and reflect a 0.65% 12b-1 fee.
$10,000 Over 10 Years
Let's say hypothetically that $10,000 was invested in Fidelity® Advisor Overseas Fund - Institutional Class on October 31, 1993. The chart shows how the value of your investment would have grown, and also shows how the MSCI® EAFE® Index did over the same period.
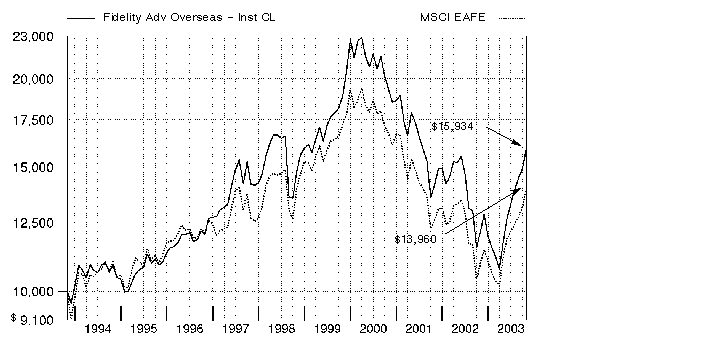
Annual Report
Management's Discussion of Fund Performance
Comments from Rick Mace, Portfolio Manager of Fidelity Advisor Overseas Fund
Mirroring the U.S. rally, most international stock markets rebounded sharply during the 12-month period ending October 31, 2003. Encouraged by improved corporate earnings, favorable interest rates and the easing of geopolitical tensions, the Morgan Stanley Capital InternationalSM Europe, Australasia, Far East (MSCI EAFE) Index - a proxy for stock markets outside the United States and Canada - gained 27.39% during the past year. From a regional perspective, all 16 countries in the MSCI Europe index - which gained 24.56% - had double-digit advances. Spain, Denmark and Sweden were among the region's best performers. In Japan, increased capital spending, exports and machinery orders helped the Tokyo Stock Exchange Stock Price Index (TOPIX) advance 36.39%. Following the SARS epidemic, other Asian markets also rebounded. For instance, the Hong Kong market, as measured by the Hang Seng Index, gained 34.51%. Emerging markets also fared well, particularly Latin America. The MSCI Emerging Markets Free Latin America Index rose 59.75%. Canadian equities, as measured by the S&P/TSX Composite Index, also posted an impressive annual gain, advancing 50.66%.
For the 12 months ending October 31, 2003, Fidelity Advisor Overseas Fund's Institutional Class shares were up 31.41%. This return topped the LipperSM International Funds Average, which rose 24.51%, as well as the MSCI EAFE index. Good stock selection and an overweighting in diversified financial stocks made a significant contribution to the fund's solid performance relative to its benchmarks. In particular, large positions in strong-performing Japanese brokerage stocks, such as Nikko Cordial and Nomura Holdings, were helpful. Elsewhere, the fund's overweighting in the information technology sector was rewarding, as the tech sector rebounded from an extended period of weakness. The fund's holdings in the semiconductor area - including Infineon Technologies of Germany and ASML of the Netherlands - were noteworthy contributors. On the down side, weak stock picking in the consumer staples sector hurt the fund's results, with a position in Dutch food giant Unilever being its biggest detractor. A U.S. federal investigation into alleged accounting misdeeds caused the fund's positions in Dutch supermarket retailer Ahold to tumble. The fund's underweighting of strong-performing capital goods stocks also held back its relative return.
The views expressed in this statement reflect those of the portfolio manager only through the end of the period of the report as stated on the cover and do not necessarily represent the views of Fidelity or any other person in the Fidelity organization. Any such views are subject to change at any time based upon market or other conditions and Fidelity disclaims any responsibility to update such views. These views may not be relied on as investment advice and, because investment decisions for a Fidelity fund are based on numerous factors, may not be relied on as an indication of trading intent on behalf of any Fidelity fund.
Annual Report
Investment Changes
Top Five Stocks as of October 31, 2003 |
| % of fund's
net assets | % of fund's net assets
6 months ago |
ASML Holding NV (Netherlands,
Semiconductors & Semiconductor Equipment) | 2.6 | 1.6 |
Samsung Electronics Co. Ltd. (Korea (South), Semiconductors & Semiconductor Equipment) | 2.5 | 1.8 |
Total SA Series B (France, Oil & Gas) | 2.4 | 2.3 |
Novartis AG (Reg.)
(Switzerland, Pharmaceuticals) | 2.3 | 2.0 |
Allianz AG (Reg.) (Germany, Insurance) | 2.2 | 1.2 |
| 12.0 | |
Top Five Market Sectors as of October 31, 2003 |
| % of fund's
net assets | % of fund's net assets
6 months ago |
Financials | 26.0 | 28.7 |
Information Technology | 17.6 | 17.9 |
Energy | 10.1 | 10.5 |
Consumer Discretionary | 9.7 | 9.5 |
Health Care | 9.0 | 10.1 |
Top Five Countries as of October 31, 2003 |
(excluding cash equivalents) | % of fund's
net assets | % of fund's net assets
6 months ago |
Japan | 17.7 | 20.2 |
United Kingdom | 15.4 | 14.8 |
Germany | 8.4 | 7.1 |
France | 7.4 | 8.4 |
Switzerland | 6.6 | 8.1 |
Percentages are adjusted for the effect of open futures contracts, if applicable. |
Asset Allocation (% of fund's net assets) |
As of October 31, 2003 | As of April 30, 2003 |
| Stocks 89.9% | | | Stocks and Investment Companies 96.2% | |
| Bonds 0.6% | | | Bonds 0.5% | |
| Short-Term
Investments and
Net Other Assets 9.5% | | | Short-Term
Investments and
Net Other Assets 3.3% | |

Annual Report
Investments October 31, 2003
Showing Percentage of Net Assets
Common Stocks - 89.3% |
| Shares | | Value (Note 1) (000s) |
Australia - 0.5% |
News Corp. Ltd. sponsored ADR | 221,200 | | $ 6,525 |
Bermuda - 0.0% |
Golar LNG Ltd. (a) | 51,800 | | 601 |
Brazil - 0.8% |
Banco Bradesco SA sponsored ADR | 51,700 | | 1,085 |
Banco Itau Holding Financeira SA (PN) | 14,812,000 | | 1,214 |
Brasil Telecom Participacoes SA sponsored ADR | 28,700 | | 1,048 |
Companhia Vale do Rio Doce sponsored ADR | 42,900 | | 1,963 |
Embraer - Empresa Brasileira de Aeronautica SA
sponsored ADR | 54,800 | | 1,422 |
Tele Norte Leste Participacoes SA ADR | 84,200 | | 1,193 |
Telebras sponsored ADR | 74,200 | | 2,555 |
TOTAL BRAZIL | | 10,480 |
Canada - 3.7% |
Biovail Corp. (a) | 170,700 | | 4,107 |
Canadian Natural Resources Ltd. | 111,500 | | 4,735 |
EnCana Corp. | 235,900 | | 8,100 |
Inmet Mining Corp. (a) | 158,300 | | 1,434 |
Kinross Gold Corp. (a)(e) | 264,100 | | 2,165 |
Kinross Gold Corp. (a) | 612,100 | | 5,018 |
Petro-Canada | 49,700 | | 2,003 |
Precision Drilling Corp. (a) | 102,300 | | 4,024 |
Talisman Energy, Inc. | 369,600 | | 18,050 |
TOTAL CANADA | | 49,636 |
Cayman Islands - 0.4% |
Noble Corp. (a) | 151,500 | | 5,201 |
China - 0.5% |
Byd Co. Ltd. (H Shares) | 541,000 | | 1,411 |
China Telecom Corp. Ltd. (H Shares) | 14,714,000 | | 4,879 |
PICC Property & Casualty Co. Ltd. (H Shares) | 302,000 | | 71 |
TOTAL CHINA | | 6,361 |
Denmark - 1.2% |
Coloplast AS Series B | 35,100 | | 2,943 |
Danske Bank AS | 484,900 | | 9,748 |
Novo Nordisk AS Series B | 87,100 | | 3,122 |
TOTAL DENMARK | | 15,813 |
Common Stocks - continued |
| Shares | | Value (Note 1) (000s) |
Finland - 1.5% |
Nokia Corp. | 1,212,400 | | $ 20,599 |
France - 7.4% |
Accor SA | 70,600 | | 2,767 |
Alcatel SA sponsored ADR (a) | 681,700 | | 8,985 |
AXA SA | 476,060 | | 8,989 |
BNP Paribas SA | 279,281 | | 14,624 |
Credit Agricole SA | 90,700 | | 1,920 |
Credit Agricole SA rights 11/7/03 (a) | 90,700 | | 21 |
France Telecom SA (a) | 214,000 | | 5,161 |
L'Oreal SA | 52,300 | | 3,853 |
Pernod-Ricard | 64,400 | | 6,192 |
Suez SA (France) | 99,400 | | 1,589 |
Television Francaise 1 SA | 154,400 | | 4,615 |
Total SA Series B | 210,397 | | 32,851 |
Vivendi Universal SA sponsored ADR (a) | 406,900 | | 8,557 |
TOTAL FRANCE | | 100,124 |
Germany - 7.8% |
Allianz AG (Reg.) | 277,500 | | 29,646 |
Altana AG sponsored ADR | 50,800 | | 3,190 |
BASF AG | 165,600 | | 7,570 |
Deutsche Boerse AG | 388,682 | | 21,532 |
Deutsche Telekom AG sponsored ADR (a) | 504,600 | | 7,877 |
Fresenius Medical Care AG | 134,400 | | 7,637 |
Infineon Technologies AG (a) | 237,700 | | 3,492 |
Muenchener Rueckversicherungs-Gesellschaft AG: | | | |
rights 11/10/03 (a) | 165,700 | | 1,365 |
(Reg.) | 165,700 | | 19,693 |
SAP AG sponsored ADR | 94,200 | | 3,442 |
TOTAL GERMANY | | 105,444 |
Greece - 0.1% |
Greek Organization of Football Prognostics SA | 67,640 | | 831 |
Hong Kong - 2.1% |
Cheung Kong Holdings Ltd. | 192,000 | | 1,601 |
China Mobile (Hong Kong) Ltd. | 1,309,250 | | 3,710 |
Hong Kong Exchanges & Clearing Ltd. | 1,588,000 | | 3,456 |
Hutchison Whampoa Ltd. | 1,404,700 | | 10,898 |
Sun Hung Kai Properties Ltd. | 188,000 | | 1,592 |
Techtronic Industries Co. | 2,754,000 | | 7,589 |
TOTAL HONG KONG | | 28,846 |
Common Stocks - continued |
| Shares | | Value (Note 1) (000s) |
India - 1.9% |
Cipla Ltd. | 102,900 | | $ 2,949 |
Dr. Reddy's Laboratories Ltd. | 124,200 | | 3,275 |
Housing Development Finance Corp. Ltd. | 661,300 | | 7,586 |
Infosys Technologies Ltd. | 69,816 | | 7,304 |
Satyam Computer Services Ltd. | 729,100 | | 4,924 |
TOTAL INDIA | | 26,038 |
Indonesia - 0.1% |
PT Bank Rakyat Indonesia (a)(f) | 7,911,500 | | 815 |
Italy - 1.3% |
Banca Intesa Spa | 892,775 | | 3,005 |
ENI Spa | 247,750 | | 3,919 |
Telecom Italia Spa | 2,151,017 | | 5,594 |
Unicredito Italiano Spa | 1,091,600 | | 5,359 |
TOTAL ITALY | | 17,877 |
Japan - 17.7% |
Advantest Corp. | 10,700 | | 797 |
Aeon Credit Service Ltd. | 16,000 | | 741 |
Canon, Inc. | 186,000 | | 9,105 |
Daikin Industries Ltd. | 58,000 | | 1,237 |
Daiwa Securities Group, Inc. | 1,502,000 | | 10,984 |
FamilyMart Co. Ltd. | 169,300 | | 3,680 |
Ito Yokado Ltd. | 419,400 | | 15,412 |
JAFCO Co. Ltd. | 102,400 | | 8,755 |
KDDI Corp. | 1,639 | | 8,900 |
Konica Minolta Holdings, Inc. | 204,000 | | 2,681 |
Kyocera Corp. | 101,500 | | 6,112 |
Kyorin Pharmaceutical Co. Ltd. | 85,000 | | 1,280 |
Matsushita Electric Industrial Co. Ltd. | 488,200 | | 6,405 |
Millea Holdings, Inc. | 437 | | 5,207 |
Mitsubishi Tokyo Financial Group, Inc. (MTFG) | 1,063 | | 7,802 |
Mizuho Financial Group, Inc. (a) | 1,306 | | 3,196 |
Murata Manufacturing Co. Ltd. | 170,400 | | 9,687 |
Nikko Cordial Corp. | 2,997,000 | | 16,165 |
Nikon Corp. (a) | 176,000 | | 2,672 |
Nitto Denko Corp. | 36,000 | | 1,889 |
Nomura Holdings, Inc. | 1,353,000 | | 23,235 |
ORIX Corp. | 77,200 | | 6,495 |
Rohm Co. Ltd. | 92,200 | | 12,429 |
Seiyu Ltd. (a) | 609,000 | | 1,966 |
Shin-Etsu Chemical Co. Ltd. | 147,100 | | 5,472 |
Common Stocks - continued |
| Shares | | Value (Note 1) (000s) |
Japan - continued |
SMC Corp. | 12,900 | | $ 1,552 |
Sony Corp. | 107,700 | | 3,791 |
Sumitomo Electric Industries Ltd. | 417,000 | | 3,584 |
Sumitomo Mitsui Financial Group, Inc. | 1,692 | | 8,511 |
TDK Corp. | 84,000 | | 5,501 |
Tokyo Electron Ltd. | 214,500 | | 15,374 |
Toshiba Corp. | 884,000 | | 3,546 |
Toyota Motor Corp. | 622,900 | | 18,070 |
UFJ Holdings, Inc. (a) | 954 | | 4,078 |
Uny Co. Ltd. | 253,000 | | 2,633 |
TOTAL JAPAN | | 238,944 |
Korea (South) - 2.8% |
Kookmin Bank | 112,580 | | 4,109 |
Samsung Electronics Co. Ltd. | 84,030 | | 33,371 |
TOTAL KOREA (SOUTH) | | 37,480 |
Mexico - 0.3% |
Grupo Televisa SA de CV sponsored ADR | 109,300 | | 4,235 |
Netherlands - 6.5% |
Aegon NV | 109,300 | | 1,428 |
ASML Holding NV (a) | 1,980,900 | | 34,771 |
ING Groep NV (Certificaten Van Aandelen) | 723,346 | | 15,075 |
Koninklijke Ahold NV (a) | 365,900 | | 3,086 |
Koninklijke KPN NV (a) | 606,500 | | 4,595 |
Koninklijke Philips Electronics NV | 274,400 | | 7,365 |
Unilever NV (NY Shares) | 237,900 | | 13,953 |
VNU NV | 270,300 | | 8,204 |
TOTAL NETHERLANDS | | 88,477 |
Netherlands Antilles - 0.3% |
Schlumberger Ltd. (NY Shares) | 79,800 | | 3,748 |
Portugal - 0.2% |
Banco Comercial Portugues SA (Reg.) | 1,352,600 | | 2,601 |
Russia - 0.7% |
JSC MMC 'Norilsk Nickel' sponsored ADR | 45,800 | | 2,347 |
Lukoil Oil Co. sponsored ADR | 11,500 | | 935 |
OAO Gazprom sponsored ADR | 40,200 | | 965 |
YUKOS Corp. sponsored ADR | 106,161 | | 4,905 |
TOTAL RUSSIA | | 9,152 |
Common Stocks - continued |
| Shares | | Value (Note 1) (000s) |
South Africa - 0.1% |
Harmony Gold Mining Co. Ltd. sponsored ADR | 141,800 | | $ 2,144 |
Spain - 2.6% |
Actividades de Construccion y Servicios SA (ACS) | 28,000 | | 1,175 |
Altadis SA (Spain) | 257,500 | | 6,223 |
Antena 3 Television SA (a) | 1,736 | | 57 |
Banco Popular Espanol SA (Reg.) | 133,700 | | 6,928 |
Banco Santander Central Hispano SA | 894,860 | | 8,552 |
Inditex SA | 123,800 | | 2,549 |
Telefonica SA | 793,754 | | 9,895 |
TOTAL SPAIN | | 35,379 |
Sweden - 1.6% |
Hennes & Mauritz AB (H&M) (B Shares) | 78,800 | | 1,665 |
Securitas AB (B Shares) | 258,200 | | 3,165 |
Telefonaktiebolaget LM Ericsson ADR (a) | 951,000 | | 16,243 |
TOTAL SWEDEN | | 21,073 |
Switzerland - 6.6% |
Compagnie Financiere Richemont unit | 231,020 | | 5,178 |
Credit Suisse Group (Reg.) | 552,032 | | 19,374 |
Novartis AG (Reg.) | 793,950 | | 30,464 |
Roche Holding AG (participation certificate) | 186,300 | | 15,356 |
UBS AG (Reg.) | 244,404 | | 14,949 |
Zurich Financial Services AG | 27,470 | | 3,504 |
TOTAL SWITZERLAND | | 88,825 |
Taiwan - 1.4% |
Compal Electronics, Inc. | 763,000 | | 1,158 |
Hon Hai Precision Industries Co. Ltd. | 600,200 | | 2,689 |
Taiwan Semiconductor Manufacturing Co. Ltd. (a) | 3,691,854 | | 7,290 |
United Microelectronics Corp. (a) | 8,532,000 | | 7,820 |
TOTAL TAIWAN | | 18,957 |
Turkey - 0.0% |
Turkcell Iletisim Hizmet AS sponsored ADR (a) | 37,900 | | 720 |
United Kingdom - 14.8% |
3i Group PLC | 661,516 | | 6,949 |
Abbey National PLC | 552,400 | | 5,267 |
AstraZeneca PLC (United Kingdom) | 380,300 | | 18,133 |
Astro All Asia Networks PLC (a) | 591,800 | | 735 |
Aviva PLC | 211,200 | | 1,730 |
BHP Billiton PLC | 819,100 | | 6,422 |
Common Stocks - continued |
| Shares | | Value (Note 1) (000s) |
United Kingdom - continued |
BOC Group PLC | 204,700 | | $ 2,787 |
BP PLC | 3,501,500 | | 24,732 |
Carlton Communications PLC | 990,000 | | 3,623 |
Centrica PLC | 714,600 | | 2,234 |
Dixons Group PLC | 2,016,600 | | 4,638 |
GlaxoSmithKline PLC | 697,269 | | 15,092 |
Hilton Group PLC | 1,182,300 | | 3,886 |
HSBC Holdings PLC (United Kingdom) (Reg.) | 1,109,390 | | 16,656 |
Kesa Electricals PLC | 807,314 | | 3,338 |
Lloyds TSB Group PLC | 421,400 | | 2,922 |
Man Group PLC | 339,200 | | 8,328 |
Marks & Spencer Group PLC | 1,032,500 | | 5,034 |
mmO2 PLC (a) | 2,221,800 | | 2,409 |
Pearson PLC | 198,100 | | 2,048 |
Prudential PLC | 423,200 | | 3,279 |
Reckitt Benckiser PLC | 212,000 | | 4,454 |
Reed Elsevier PLC | 380,300 | | 2,951 |
Rio Tinto PLC (Reg.) | 230,100 | | 5,698 |
Royal Bank of Scotland Group PLC | 179,200 | | 4,794 |
Shire Pharmaceuticals Group PLC sponsored ADR (a) | 161,400 | | 3,696 |
Smith & Nephew PLC | 482,600 | | 3,829 |
Tesco PLC | 1,583,581 | | 6,339 |
Unilever PLC sponsored ADR | 114,000 | | 3,899 |
Vodafone Group PLC | 10,540,716 | | 22,294 |
William Hill PLC | 148,600 | | 854 |
Yell Group PLC (a) | 331,600 | | 1,613 |
TOTAL UNITED KINGDOM | | 200,663 |
United States of America - 4.4% |
Baker Hughes, Inc. | 160,600 | | 4,539 |
ENSCO International, Inc. | 208,400 | | 5,491 |
Fox Entertainment Group, Inc. Class A (a) | 97,400 | | 2,698 |
Grant Prideco, Inc. (a) | 306,200 | | 3,472 |
Micron Technology, Inc. (a) | 191,000 | | 2,739 |
Motorola, Inc. | 989,200 | | 13,384 |
Nabors Industries Ltd. (a) | 30,400 | | 1,149 |
NTL, Inc. (a) | 193,100 | | 11,920 |
Pride International, Inc. (a) | 27,900 | | 457 |
Smith International, Inc. (a) | 20,000 | | 745 |
Synthes-Stratec, Inc. | 3,119 | | 2,852 |
Transocean, Inc. (a) | 176,300 | | 3,383 |
Common Stocks - continued |
| Shares | | Value (Note 1) (000s) |
United States of America - continued |
Tyco International Ltd. | 159,900 | | $ 3,339 |
Weatherford International Ltd. (a) | 91,000 | | 3,162 |
TOTAL UNITED STATES OF AMERICA | | 59,330 |
TOTAL COMMON STOCKS (Cost $1,119,498) | 1,206,919 |
Nonconvertible Preferred Stocks - 0.6% |
| | | |
Germany - 0.6% |
Fresenius Medical Care AG | 97,260 | | 3,977 |
Porsche AG (non-vtg.) | 9,300 | | 4,552 |
TOTAL NONCONVERTIBLE PREFERRED STOCKS (Cost $7,772) | 8,529 |
Nonconvertible Bonds - 0.6% |
| Principal Amount (000s) | | |
United Kingdom - 0.6% |
Telewest Communications PLC yankee: | | | | |
0% 4/15/09 (c)(d) | | $ 1,335 | | 591 |
0% 2/1/10 (c)(d) | | 500 | | 201 |
9.875% 2/1/10 (c) | | 3,435 | | 1,769 |
Telewest PLC: | | | | |
11% 10/1/07 (c) | | 6,625 | | 3,578 |
yankee 9.625% 10/1/06 (c) | | 2,365 | | 1,253 |
TOTAL NONCONVERTIBLE BONDS (Cost $6,769) | 7,392 |
Money Market Funds - 14.1% |
| Shares | | Value (Note 1) (000s) |
Fidelity Cash Central Fund, 1.07% (b) | 136,867,942 | | $ 136,868 |
Fidelity Securities Lending Cash Central Fund, 1.09% (b) | 53,385,653 | | 53,386 |
TOTAL MONEY MARKET FUNDS (Cost $190,254) | 190,254 |
TOTAL INVESTMENT PORTFOLIO - 104.6% (Cost $1,324,293) | | 1,413,094 |
NET OTHER ASSETS - (4.6)% | | (61,750) |
NET ASSETS - 100% | $ 1,351,344 |
Legend |
(a) Non-income producing |
(b) The rate quoted is the annualized seven-day yield of the fund at period end. A complete listing of the fund's holdings as of its most recent fiscal year end is available upon request. |
(c) Non-income producing - issuer filed for bankruptcy or is in default of interest payments. |
(d) Debt obligation initially issued in zero coupon form which converts to coupon form at a specified rate and date. The rate shown is the rate at period end. |
(e) Security exempt from registration under Rule 144A of the Securities Act of 1933. These securities may be resold in transactions exempt from registration, normally to qualified institutional buyers. At the period end, the value of these securities amounted to $2,165,000 or 0.2% of net assets. |
(f) Security or a portion of the security purchased on a delayed delivery or when-issued basis. |
Other Information |
Purchases and sales of securities, other than short-term securities, aggregated $1,041,025,000 and $1,225,544,000, respectively. |
The fund placed a portion of its portfolio transactions with brokerage firms which are affiliates of the investment adviser. The commissions paid to these affiliated firms were $1,000 for the period. |
The fund participated in the interfund lending program as a borrower. The average daily loan balance during the period for which loans were outstanding amounted to $6,560,000. At period end there were no interfund loans outstanding. |
Income Tax Information |
At October 31, 2003, the fund had a capital loss carryforward of approximately $356,453,000 of which $211,472,000 and $144,981,000 will expire on October 31, 2009 and 2010, respectively. |
See accompanying notes which are an integral part of the financial statements.
Annual Report
Financial Statements
Statement of Assets and Liabilities
Amounts in thousands (except per-share amounts) | October 31, 2003 |
| | |
Assets | | |
Investment in securities, at value (including securities loaned of $51,163) (cost $1,324,293) - See accompanying schedule | | $ 1,413,094 |
Cash | | 672 |
Foreign currency held at value (cost $10,193) | | 10,334 |
Receivable for investments sold | | 45 |
Receivable for fund shares sold | | 1,768 |
Dividends receivable | | 1,526 |
Interest receivable | | 54 |
Prepaid expenses | | 6 |
Other receivables | | 34 |
Total assets | | 1,427,533 |
| | |
Liabilities | | |
Payable for investments purchased
Regular delivery | $ 16,877 | |
Delayed delivery | 823 | |
Payable for fund shares redeemed | 2,094 | |
Accrued management fee | 716 | |
Distribution fees payable | 557 | |
Other payables and accrued expenses | 1,736 | |
Collateral on securities loaned, at value | 53,386 | |
Total liabilities | | 76,189 |
| | |
Net Assets | | $ 1,351,344 |
Net Assets consist of: | | |
Paid in capital | | $ 1,633,744 |
Undistributed net investment income | | 5,713 |
Accumulated undistributed net realized gain (loss) on investments and foreign currency transactions | | (375,619) |
Net unrealized appreciation (depreciation) on investments and assets and liabilities in foreign currencies | | 87,506 |
Net Assets | | $ 1,351,344 |
See accompanying notes which are an integral part of the financial statements.
Annual Report
Financial Statements - continued
Statement of Assets and Liabilities - continued
Amounts in thousands (except per-share amounts) | October 31, 2003 |
| | |
Calculation of Maximum Offering Price
Class A:
Net Asset Value and redemption price per share
($68,329 ÷ 4,743 shares) | | $ 14.41 |
| | |
Maximum offering price per share (100/94.25 of $14.41) | | $ 15.29 |
Class T:
Net Asset Value and redemption price per share ($1,113,576 ÷ 76,239 shares) | | $ 14.61 |
| | |
Maximum offering price per share (100/96.50 of $14.61) | | $ 15.14 |
Class B:
Net Asset Value and offering price per share
($59,322 ÷ 4,275.49 shares) A | | $ 13.87 |
| | |
Class C:
Net Asset Value and offering price per share
($40,630 ÷ 2,879 shares) A | | $ 14.11 |
| | |
Institutional Class:
Net Asset Value, offering price and redemption price per share ($69,487 ÷ 4,760 shares) | | $ 14.60 |
A Redemption price per share is equal to net asset value less any applicable contingent deferred sales charge.
See accompanying notes which are an integral part of the financial statements.
Annual Report
Statement of Operations
Amounts in thousands | Year ended October 31, 2003 |
| | |
Investment Income | | |
Dividends | | $ 19,818 |
Interest | | 962 |
Security lending | | 682 |
| | 21,462 |
Less foreign taxes withheld | | (2,065) |
Total income | | 19,397 |
| | |
Expenses | | |
Management fee
Basic fee | $ 8,201 | |
Performance adjustment | (1,614) | |
Transfer agent fees | 3,203 | |
Distribution fees | 5,645 | |
Accounting fees and expenses | 591 | |
Non-interested trustees' compensation | 4 | |
Custodian fees and expenses | 421 | |
Registration fees | 96 | |
Audit | 71 | |
Legal | 46 | |
Interest | 1 | |
Miscellaneous | 21 | |
Total expenses before reductions | 16,686 | |
Expense reductions | (494) | 16,192 |
Net investment income (loss) | | 3,205 |
Realized and Unrealized Gain (Loss) Net realized gain (loss) on: | | |
Investment securities (net of foreign taxes of $463) | 63,118 | |
Foreign currency transactions | 30 | |
Total net realized gain (loss) | | 63,148 |
Change in net unrealized appreciation (depreciation) on: Investment securities (net of deferred foreign taxes of $1,458) | 254,170 | |
Assets and liabilities in foreign currencies | 222 | |
Total change in net unrealized appreciation (depreciation) | | 254,392 |
Net gain (loss) | | 317,540 |
Net increase (decrease) in net assets resulting from operations | | $ 320,745 |
See accompanying notes which are an integral part of the financial statements.
Annual Report
Financial Statements - continued
Statement of Changes in Net Assets
Amounts in thousands | Year ended
October 31,
2003 | Year ended
October 31,
2002 |
Increase (Decrease) in Net Assets | | |
Operations | | |
Net investment income (loss) | $ 3,205 | $ (934) |
Net realized gain (loss) | 63,148 | (146,183) |
Change in net unrealized appreciation (depreciation) | 254,392 | (54,978) |
Net increase (decrease) in net assets resulting
from operations | 320,745 | (202,095) |
Share transactions - net increase (decrease) | (95,223) | (103,769) |
Total increase (decrease) in net assets | 225,522 | (305,864) |
| | |
Net Assets | | |
Beginning of period | 1,125,822 | 1,431,686 |
End of period (including undistributed net investment income of $5,713 and distributions in excess of net investment income of $1,032, respectively) | $ 1,351,344 | $ 1,125,822 |
See accompanying notes which are an integral part of the financial statements.
Annual Report
Financial Highlights - Class A
Years ended October 31, | 2003 | 2002 | 2001 | 2000 | 1999 |
Selected Per-Share Data | | | | | |
Net asset value,
beginning of period | $ 11.01 | $ 12.90 | $ 19.88 | $ 20.59 | $ 16.32 |
Income from Investment Operations | | | | | |
Net investment income (loss) C | .05 | .01 | .06 | .06 D | .10 |
Net realized and
unrealized gain (loss) | 3.35 | (1.90) | (4.89) | .38 | 4.42 |
Total from investment operations | 3.40 | (1.89) | (4.83) | .44 | 4.52 |
Distributions from net investment income | - | - | (.43) | (.08) | (.11) |
Distributions in excess of
net investment income | - | - | - | (.09) | - |
Distributions from
net realized gain | - | - | (1.72) | (.98) | (.14) |
Total distributions | - | - | (2.15) | (1.15) | (.25) |
Net asset value, end of period | $ 14.41 | $ 11.01 | $ 12.90 | $ 19.88 | $ 20.59 |
Total Return A, B | 30.88% | (14.65)% | (27.16)% | 1.78% | 28.05% |
Ratios to Average Net Assets E | | | | |
Expenses before
expense reductions | 1.34% | 1.56% | 1.46% | 1.49% | 1.55% |
Expenses net of voluntary waivers, if any | 1.34% | 1.56% | 1.46% | 1.49% | 1.55% |
Expenses net of
all reductions | 1.30% | 1.52% | 1.41% | 1.46% | 1.52% |
Net investment income (loss) | .43% | .07% | .40% | .28% | .57% |
Supplemental Data | | | | | |
Net assets,
end of period (in millions) | $ 68 | $ 44 | $ 46 | $ 44 | $ 23 |
Portfolio turnover rate | 99% | 73% | 99% | 132% | 85% |
A Total returns would have been lower had certain expenses not been reduced during the periods shown.
B Total returns do not include the effect of the sales charges.
C Calculated based on average shares outstanding during the period.
D Investment income per share reflects a special dividend which amounted to $.04 per share.
E Expense ratios reflect operating expenses of the class. Expenses before reductions do not reflect amounts reimbursed by the investment adviser or reductions from brokerage service arrangements or other expense offset arrangements and do not represent the amount paid by the class during periods when reimbursements or reductions occur. Expenses net of any voluntary waivers reflect expenses after reimbursement by the investment adviser but prior to reductions from brokerage service arrangements or other expense offset arrangements. Expenses net of all reductions represent the net expenses paid by the class.
See accompanying notes which are an integral part of the financial statements.
Annual Report
Financial Highlights - Class T
Years ended October 31, | 2003 | 2002 | 2001 | 2000 | 1999 |
Selected Per-Share Data | | | | | |
Net asset value,
beginning of period | $ 11.18 | $ 13.11 | $ 20.13 | $ 20.83 | $ 16.48 |
Income from Investment Operations | | | | | |
Net investment income (loss) C | .04 | (.01) | .04 | .02 D | .07 |
Net realized and
unrealized gain (loss) | 3.39 | (1.92) | (4.99) | .39 | 4.46 |
Total from investment operations | 3.43 | (1.93) | (4.95) | .41 | 4.53 |
Distributions from net investment income | - | - | (.35) | (.06) | (.04) |
Distributions in excess of
net investment income | - | - | - | (.07) | - |
Distributions from
net realized gain | - | - | (1.72) | (.98) | (.14) |
Total distributions | - | - | (2.07) | (1.11) | (.18) |
Net asset value, end of period | $ 14.61 | $ 11.18 | $ 13.11 | $ 20.13 | $ 20.83 |
Total Return A, B | 30.68% | (14.72)% | (27.33)% | 1.62% | 27.74% |
Ratios to Average Net Assets E | | | | |
Expenses before
expense reductions | 1.46% | 1.68% | 1.62% | 1.67% | 1.72% |
Expenses net of voluntary waivers, if any | 1.46% | 1.68% | 1.62% | 1.67% | 1.72% |
Expenses net of
all reductions | 1.42% | 1.64% | 1.57% | 1.65% | 1.69% |
Net investment income (loss) | .31% | (.05) % | .24% | .10% | .39% |
Supplemental Data | | | | | |
Net assets,
end of period (in millions) | $ 1,114 | $ 928 | $ 1,185 | $ 1,678 | $ 1,480 |
Portfolio turnover rate | 99% | 73% | 99% | 132% | 85% |
A Total returns would have been lower had certain expenses not been reduced during the periods shown.
B Total returns do not include the effect of the sales charges.
C Calculated based on average shares outstanding during the period.
D Investment income per share reflects a special dividend which amounted to $.04 per share.
E Expense ratios reflect operating expenses of the class. Expenses before reductions do not reflect amounts reimbursed by the investment adviser or reductions from brokerage service arrangements or other expense offset arrangements and do not represent the amount paid by the class during periods when reimbursements or reductions occur. Expenses net of any voluntary waivers reflect expenses after reimbursement by the investment adviser but prior to reductions from brokerage service arrangements or other expense offset arrangements. Expenses net of all reductions represent the net expenses paid by the class.
See accompanying notes which are an integral part of the financial statements.
Annual Report
Financial Highlights - Class B
Years ended October 31, | 2003 | 2002 | 2001 | 2000 | 1999 |
Selected Per-Share Data | | | | | |
Net asset value,
beginning of period | $ 10.71 | $ 12.63 | $ 19.49 | $ 20.25 | $ 16.08 |
Income from Investment Operations | | | | | |
Net investment income (loss) C | (.06) | (.08) | (.06) | (.11) D | (.03) |
Net realized and
unrealized gain (loss) | 3.22 | (1.84) | (4.83) | .39 | 4.34 |
Total from investment operations | 3.16 | (1.92) | (4.89) | .28 | 4.31 |
Distributions from net investment income | - | - | (.25) | (.03) | - |
Distributions in excess of
net investment income | - | - | - | (.03) | - |
Distributions from
net realized gain | - | - | (1.72) | (.98) | (.14) |
Total distributions | - | - | (1.97) | (1.04) | (.14) |
Net asset value, end of period | $ 13.87 | $ 10.71 | $ 12.63 | $ 19.49 | $ 20.25 |
Total Return A, B | 29.51% | (15.20)% | (27.83)% | 1.02% | 27.00% |
Ratios to Average Net Assets E | | | | |
Expenses before
expense reductions | 2.27% | 2.43% | 2.27% | 2.27% | 2.30% |
Expenses net of voluntary waivers, if any | 2.27% | 2.30% | 2.27% | 2.27% | 2.29% |
Expenses net of
all reductions | 2.22% | 2.26% | 2.23% | 2.25% | 2.26% |
Net investment income (loss) | (.49)% | (.66)% | (.42)% | (.50)% | (.18)% |
Supplemental Data | | | | | |
Net assets,
end of period (in millions) | $ 59 | $ 53 | $ 80 | $ 125 | $ 89 |
Portfolio turnover rate | 99% | 73% | 99% | 132% | 85% |
A Total returns would have been lower had certain expenses not been reduced during the periods shown.
B Total returns do not include the effect of the contingent deferred sales charge.
C Calculated based on average shares outstanding during the period.
D Investment income per share reflects a special dividend which amounted to $.04 per share.
E Expense ratios reflect operating expenses of the class. Expenses before reductions do not reflect amounts reimbursed by the investment adviser or reductions from brokerage service arrangements or other expense offset arrangements and do not represent the amount paid by the class during periods when reimbursements or reductions occur. Expenses net of any voluntary waivers reflect expenses after reimbursement by the investment adviser but prior to reductions from brokerage service arrangements or other expense offset arrangements. Expenses net of all reductions represent the net expenses paid by the class.
See accompanying notes which are an integral part of the financial statements.
Annual Report
Financial Highlights - Class C
Years ended October 31, | 2003 | 2002 | 2001 | 2000 | 1999 |
Selected Per-Share Data | | | | | |
Net asset value,
beginning of period | $ 10.88 | $ 12.84 | $ 19.80 | $ 20.58 | $ 16.37 |
Income from Investment Operations | | | | | |
Net investment income (loss) C | (.05) | (.08) | (.05) | (.10) D | (.02) |
Net realized and
unrealized gain (loss) | 3.28 | (1.88) | (4.89) | .39 | 4.43 |
Total from investment operations | 3.23 | (1.96) | (4.94) | .29 | 4.41 |
Distributions from net investment income | - | - | (.30) | (.04) | (.06) |
Distributions in excess of
net investment income | - | - | - | (.05) | - |
Distributions from
net realized gain | - | - | (1.72) | (.98) | (.14) |
Total distributions | - | - | (2.02) | (1.07) | (.20) |
Net asset value, end of period | $ 14.11 | $ 10.88 | $ 12.84 | $ 19.80 | $ 20.58 |
Total Return A, B | 29.69% | (15.26)% | (27.70)% | 1.05% | 27.21% |
Ratios to Average Net Assets E | | | | |
Expenses before
expense reductions | 2.17% | 2.34% | 2.19% | 2.22% | 2.25% |
Expenses net of voluntary waivers, if any | 2.17% | 2.30% | 2.19% | 2.22% | 2.25% |
Expenses net of
all reductions | 2.13% | 2.26% | 2.14% | 2.20% | 2.22% |
Net investment income (loss) | (.40)% | (.66)% | (.34)% | (.45)% | (.13)% |
Supplemental Data | | | | | |
Net assets,
end of period (in millions) | $ 41 | $ 36 | $ 52 | $ 76 | $ 35 |
Portfolio turnover rate | 99% | 73% | 99% | 132% | 85% |
A Total returns would have been lower had certain expenses not been reduced during the periods shown.
B Total returns do not include the effect of the contingent deferred sales charge.
C Calculated based on average shares outstanding during the period.
D Investment income per share reflects a special dividend which amounted to $.04 per share.
E Expense ratios reflect operating expenses of the class. Expenses before reductions do not reflect amounts reimbursed by the investment adviser or reductions from brokerage service arrangements or other expense offset arrangements and do not represent the amount paid by the class during periods when reimbursements or reductions occur. Expenses net of any voluntary waivers reflect expenses after reimbursement by the investment adviser but prior to reductions from brokerage service arrangements or other expense offset arrangements. Expenses net of all reductions represent the net expenses paid by the class.
See accompanying notes which are an integral part of the financial statements.
Annual Report
Financial Highlights - Institutional Class
Years ended October 31, | 2003 | 2002 | 2001 | 2000 | 1999 |
Selected Per-Share Data | | | | | |
Net asset value,
beginning of period | $ 11.11 | $ 12.97 | $ 19.95 | $ 20.62 | $ 16.36 |
Income from Investment Operations | | | | | |
Net investment income (loss) B | .10 | .06 | .12 | .14 C | .17 |
Net realized and
unrealized gain (loss) | 3.39 | (1.92) | (4.91) | .38 | 4.39 |
Total from investment operations | 3.49 | (1.86) | (4.79) | .52 | 4.56 |
Distributions from net investment income | - | - | (.47) | (.10) | (.16) |
Distributions in excess of
net investment income | - | - | - | (.11) | - |
Distributions from
net realized gain | - | - | (1.72) | (.98) | (.14) |
Total distributions | - | - | (2.19) | (1.19) | (.30) |
Net asset value, end of period | $ 14.60 | $ 11.11 | $ 12.97 | $ 19.95 | $ 20.62 |
Total Return A | 31.41% | (14.34)% | (26.89)% | 2.18% | 28.30% |
Ratios to Average Net Assets D | | | | |
Expenses before
expense reductions | .93% | 1.14% | 1.06% | 1.13% | 1.18% |
Expenses net of voluntary waivers, if any | .93% | 1.14% | 1.06% | 1.13% | 1.18% |
Expenses net of
all reductions | .89% | 1.10% | 1.02% | 1.11% | 1.15% |
Net investment income (loss) | .84% | .49% | .79% | .63% | .94% |
Supplemental Data | | | | | |
Net assets,
end of period (in millions) | $ 69 | $ 63 | $ 69 | $ 90 | $ 90 |
Portfolio turnover rate | 99% | 73% | 99% | 132% | 85% |
A Total returns would have been lower had certain expenses not been reduced during the periods shown.
B Calculated based on average shares outstanding during the period.
C Investment income per share reflects a special dividend which amounted to $.04 per share.
D Expense ratios reflect operating expenses of the class. Expenses before reductions do not reflect amounts reimbursed by the investment adviser or reductions from brokerage service arrangements or other expense offset arrangements and do not represent the amount paid by the class during periods when reimbursements or reductions occur. Expenses net of any voluntary waivers reflect expenses after reimbursement by the investment adviser but prior to reductions from brokerage service arrangements or other expense offset arrangements. Expenses net of all reductions represent the net expenses paid by the class.
See accompanying notes which are an integral part of the financial statements.
Annual Report
Notes to Financial Statements
For the period ended October 31, 2003
(Amounts in thousands except ratios)
1. Significant Accounting Policies.
Fidelity Advisor Overseas Fund (the fund) is a fund of Fidelity Advisor Series VIII (the trust) and is authorized to issue an unlimited number of shares. The trust is registered under the Investment Company Act of 1940, as amended (the 1940 Act), as an open-end management investment company organized as a Massachusetts business trust.
The fund offers Class A, Class T, Class B, Class C, and Institutional Class shares, each of which has equal rights as to assets and voting privileges. Each class has exclusive voting rights with respect to matters that affect that class. Class B shares will automatically convert to Class A shares after a holding period of seven years from the initial date of purchase. Investment income, realized and unrealized capital gains and losses, the common expenses of the fund, and certain fund-level expense reductions, if any, are allocated on a pro rata basis to each class based on the relative net assets of each class to the total net assets of the fund. Each class differs with respect to transfer agent and distribution and service plan fees incurred. Certain expense reductions also differ by class.
The fund's investments in emerging markets can be subject to social, economic, regulatory, and political uncertainties and can be extremely volatile. The financial statements have been prepared in conformity with accounting principles generally accepted in the United States of America, which require management to make certain estimates and assumptions at the date of the financial statements. The following summarizes the significant accounting policies of the fund:
Security Valuation. Net asset value per share (NAV calculation) is calculated as of the close of business of the New York Stock Exchange, normally 4:00 p.m. Eastern time. Equity securities for which market quotations are available are valued at the last sale price or official closing price (closing bid price or last evaluated quote if no sale has occurred) on the primary market or exchange on which they trade. Debt securities for which quotations are readily available are valued at their most recent bid prices (sales prices if the principal market is an exchange) in the principal market in which such securities are normally traded, as determined by recognized dealers in such securities, or securities are valued on the basis of information provided by a pricing service. Pricing services use valuation matrices that incorporate both dealer-supplied valuations and valuation models. If an event that is expected to materially affect the value of a security occurs after the close of an exchange or market on which that security trades, but prior to the NAV calculation, then that security will be fair valued taking the event into account. Securities (including restricted securities) for which market quotations are not readily available are valued at their fair value as determined in good faith under consistently applied procedures under the general supervision of the Board of Trustees. Price movements in futures contracts and ADRs, market and trading trends, the bid/ask quotes of brokers and off-exchange institutional trading may be reviewed in the course of making a good faith determination of a security's fair value. Short-term securities with
Annual Report
Notes to Financial Statements - continued
(Amounts in thousands except ratios)
1. Significant Accounting Policies - continued
Annual Report
Security Valuation - continued
remaining maturities of sixty days or less for which quotations are not readily available are valued on the basis of amortized cost. Investments in open-end investment companies are valued at their net asset value each business day.
Foreign Currency. The fund uses foreign currency contracts to facilitate transactions in foreign-denominated securities. Losses from these transactions may arise from changes in the value of the foreign currency or if the counterparties do not perform under the contracts' terms.
Foreign denominated assets, including investment securities, and liabilities are translated into U.S. dollars at the exchange rate at period end. Purchases and sales of investment securities, income and dividends received and expenses denominated in foreign currencies are translated into U.S. dollars at the exchange rate in effect on the transaction date.
The effects of exchange rate fluctuations on investments are included with the net realized and unrealized gain (loss) on investment securities. Other foreign currency transactions resulting in realized and unrealized gain (loss) are disclosed separately.
Investment Transactions and Income. Security transactions are accounted for as of trade date. Gains and losses on securities sold are determined on the basis of identified cost. Dividend income is recorded on the ex-dividend date, except for certain dividends from foreign securities where the ex-dividend date may have passed, which are recorded as soon as the fund is informed of the ex-dividend date. Non-cash dividends included in dividend income, if any, are recorded at the fair market value of the securities received. Interest income is accrued as earned. Interest income includes coupon interest and amortization of premium and accretion of discount on debt securities, which is accrued using the interest method. Investment income is recorded net of foreign taxes withheld where recovery of such taxes is uncertain. Debt obligations may be placed on non-accrual status and related interest income may be reduced by ceasing current accruals and writing off interest receivables when the collection of all or a portion of interest has become doubtful based on consistently applied procedures. A debt obligation is removed from non-accrual status when the issuer resumes interest payments or when collectibility of interest is reasonably assured.
Expenses. Most expenses of the trust can be directly attributed to a fund. Expenses which cannot be directly attributed are apportioned among the funds in the trust.
Income Tax Information and Distributions to Shareholders. Each year the fund intends to qualify as a regulated investment company by distributing all of its taxable income and realized gains under Subchapter M of the Internal Revenue Code. As a result, no provision for income taxes is required in the accompanying financial statements.
Annual Report
Notes to Financial Statements - continued
(Amounts in thousands except ratios)
1. Significant Accounting Policies - continued
Annual Report
Income Tax Information and Distributions to Shareholders - continued
Foreign taxes are provided for based on each fund's understanding of the tax rules and rates that exist in the foreign markets in which it invests. Income dividends and capital gain distributions are declared separately for each class. Distributions are recorded on the ex-dividend date.
Income and capital gain distributions are determined in accordance with income tax regulations, which may differ from generally accepted accounting principles. In addition, the fund will treat a portion of the proceeds from shares redeemed as a distribution from net investment income and realized gain for income tax purposes. Capital accounts within the financial statements are adjusted for permanent and temporary book and tax differences. These adjustments have no impact on net assets or the results of operations. Temporary differences will reverse in a subsequent period. These differences are primarily due to foreign currency transactions, passive foreign investment companies (PFIC), market discount, capital loss carryforwards and losses deferred due to wash sales.
The tax-basis components of distributable earnings and the federal tax cost as of period end were as follows:
Unrealized appreciation | $ 157,832 | | |
Unrealized depreciation | (92,965) | |
Net unrealized appreciation (depreciation) | 64,867 | |
Undistributed ordinary income | 9,186 | |
Capital loss carryforward | (356,453) | |
Cost for federal income tax purposes | $ 1,348,227 | |
Short-Term Trading (Redemption) Fees. Shares purchased after March 31, 2004 and held in the fund less than 30 days will be subject to a short-term trading fee equal to 1.00% of the proceeds of the redeemed shares. The fee, which will be retained by the fund, is accounted for as an addition to paid in capital.
2. Operating Policies.
Repurchase Agreements. Fidelity Management & Research Company (FMR) has received an Exemptive Order from the Securities and Exchange Commission (the SEC) which permits the fund and other affiliated entities of FMR to transfer uninvested cash balances into joint trading accounts. These accounts are then invested in repurchase agreements that are collateralized by U.S. Treasury or Government obligations. The fund may also invest directly with institutions, in repurchase agreements that are collateralized by commercial paper obligations and corporate obligations. Collateral is held in segregated accounts with custodian banks and may be obtained in the event of a default of the
Annual Report
Notes to Financial Statements - continued
(Amounts in thousands except ratios)
2. Operating Policies - continued
Annual Report
Repurchase Agreements - continued
counterparty. Collateral is marked-to-market daily and maintained at a value at least equal to the principal amount of the repurchase agreement (including accrued interest).
Delayed Delivery Transactions and When-Issued Securities. The fund may purchase or sell securities on a delayed delivery or when-issued basis. Payment and delivery may take place after the customary settlement period for that security. The price of the underlying securities and the date when the securities will be delivered and paid for are fixed at the time the transaction is negotiated. During the time a delayed delivery sell is outstanding, the contract is marked-to-market daily and equivalent deliverable securities are held for the transaction. The value of the securities purchased on a delayed delivery or when-issued basis are identified as such in the fund's Schedule of Investments. The fund may receive compensation for interest forgone in the purchase of a delayed delivery or when-issued security. With respect to purchase commitments, the fund identifies securities as segregated in its records with a value at least equal to the amount of the commitment. Losses may arise due to changes in the value of the underlying securities or if the counterparty does not perform under the contract, or if the issuer does not issue the securities due to political, economic, or other factors.
Restricted Securities. The fund may invest in securities that are subject to legal or contractual restrictions on resale. These securities generally may be resold in transactions exempt from registration or to the public if the securities are registered. Disposal of these securities may involve time-consuming negotiations and expense, and prompt sale at an acceptable price may be difficult. Information regarding restricted securities is included at the end of the fund's Schedule of Investments.
3. Purchases and Sales of Investments.
Information regarding purchases and sales of securities is included under the caption "Other Information" at the end of the fund's Schedule of Investments.
4. Fees and Other Transactions with Affiliates.
Management Fee. FMR and its affiliates provide the fund with investment management related services for which the fund pays a monthly management fee. The management fee is the sum of an individual fund fee rate that is based on an annual rate of .45% of the fund's average net assets and a group fee rate that averaged .28% during the period. The group fee rate is based upon the average net assets of all the mutual funds advised by FMR. The group fee rate decreases as assets under management increase and increases as assets under management decrease. In addition, the management fee is subject to a performance adjustment (up to a maximum of ± .20% of the fund's average
Annual Report
Notes to Financial Statements - continued
(Amounts in thousands except ratios)
4. Fees and Other Transactions with Affiliates - continued
Annual Report
Management Fee - continued
net assets over a 36 month performance period). The upward or downward adjustment to the management fee is based on the investment performance of the asset-weighted return of all classes as compared to an appropriate benchmark index. For the period, the total annual management fee rate, including the performance adjustment, was .59% of the fund's average net assets.
Distribution and Service Plan. In accordance with Rule 12b-1 of the 1940 Act, the Fund has adopted separate Distribution and Service Plans for each class of shares. Certain classes pay Fidelity Distributors Corporation (FDC), an affiliate of FMR, separate Distribution and Service Fees, each of which is based on an annual percentage of each class' average net assets. Class A and Class T Plans also authorize the use of brokerage commissions to pay distribution expenses. This practice has been discontinued and no commissions incurred after June 30, 2003 have been used to pay distribution expenses. In addition, FDC may pay financial intermediaries for selling shares of the fund and providing shareholder support services. For the period, the Distribution and Service Fee rates, the total amounts paid to and retained by FDC and the amount of distribution expenses paid with brokerage commissions were as follows:
| Distribution Fee | Service
Fee | Paid to
FDC | Retained
by FDC | Paid with
Commissions |
Class A | - | .25% | $ 136 | $ - | $ 2 |
Class T | .25% | .25% | 4,641 | 26 | 45 |
Class B | .75% | .25% | 512 | 384 | - |
Class C | .75% | .25% | 356 | 18 | - |
| | | $ 5,645 | $ 428 | $ 47 |
Sales Load. FDC receives a front-end sales charge of up to 5.75% for selling Class A shares, and 3.50% for selling Class T shares of the fund. FDC receives the proceeds of contingent deferred sales charges levied on Class A, Class T, Class B, and Class C redemptions. These charges depend on the holding period. The deferred sales charges range from 5% to 1% for Class B, 1% for Class C, and .25% for certain purchases of Class A and Class T shares.
For the period, sales charge amounts retained by FDC were as follows:
| Retained
by FDC | |
Class A | $ 12 | |
Class T | 19 | |
Class B* | 123 | |
Class C* | 24 | |
| $ 178 | |
Annual Report
Notes to Financial Statements - continued
(Amounts in thousands except ratios)
* When Class B and Class C shares are initially sold, FDC pays commissions from its own resources to financial intermediaries through
which the sales are made.
Annual Report
4. Fees and Other Transactions with Affiliates - continued
Transfer Agent Fees. Fidelity Investments Institutional Operations Company, Inc. (FIIOC), an affiliate of FMR, is the transfer, dividend disbursing and shareholder servicing agent (collectively referred to as the transfer agent) for each class of the fund. FIIOC receives account fees and asset-based fees that vary according to the account size and type of account of the shareholders of the respective classes of the fund. FIIOC pays for typesetting, printing and mailing of all shareholder reports, except proxy statements. For the period, the following amounts were paid to FIIOC:
| Amount | % of
Average Net Assets |
Class A | $ 208 | .39 |
Class T | 2,393 | .26 |
Class B | 293 | .57 |
Class C | 169 | .47 |
Institutional Class | 140 | .23 |
| $ 3,203 | |
Accounting and Security Lending Fees. Fidelity Service Company, Inc. (FSC), an affiliate of FMR, maintains the fund's accounting records and administers the security lending program. The security lending fee is based on the number and duration of lending transactions. The accounting fee is based on the level of average net assets for the month plus out-of-pocket expenses.
Central Funds. The fund may invest in affiliated Central Funds managed by Fidelity Investments Money Management, Inc. (FIMM), an affiliate of FMR. The Central Funds are open-end investment companies available only to investment companies and other accounts managed by FMR and its affiliates. The Central Funds seek preservation of capital and current income and do not pay a management fee. Income distributions earned by the fund are recorded as income in the accompanying financial statements and totaled $650 for the period.
Brokerage Commissions. The fund placed a portion of its portfolio transactions with brokerage firms which are affiliates of the investment adviser. The commissions paid to these affiliated firms are shown under the caption "Other Information" at the end of the fund's Schedule of Investments.
Interfund Lending Program. Pursuant to an Exemptive Order issued by the SEC, the fund, along with other registered investment companies having management contracts with FMR, may participate in an interfund lending program. This program provides an alternative credit facility allowing the funds to borrow from, or lend money to, other participating funds. Information regarding the fund's participation in the program is included under the caption "Other Information" at the end of the fund's Schedule of Investments.
Annual Report
Notes to Financial Statements - continued
(Amounts in thousands except ratios)
5. Committed Line of Credit.
The fund participates with other funds managed by FMR in a $3.5 billion credit facility (the "line of credit") to be utilized for temporary or emergency purposes to fund shareholder redemptions or for other short-term liquidity purposes. The fund has agreed to pay commitment fees on its pro rata portion of the line of credit. During the period, there were no borrowings on this line of credit.
6. Security Lending.
The fund lends portfolio securities from time to time in order to earn additional income. The fund receives collateral (in the form of U.S. Treasury obligations, letters of credit and/or cash) against the loaned securities and maintains collateral in an amount not less than 100% of the market value of the loaned securities during the period of the loan. The market value of the loaned securities is determined at the close of business of the fund and any additional required collateral is delivered to the fund on the next business day. If the borrower defaults on its obligation to return the securities loaned because of insolvency or other reasons, a fund could experience delays and costs in recovering the securities loaned or in gaining access to the collateral. Cash collateral is invested in cash equivalents. The value of loaned securities and cash collateral at period end are disclosed on the fund's Statement of Assets and Liabilities.
7. Expense Reductions.
Many of the brokers with whom FMR places trades on behalf of the fund provided services to the fund in addition to trade execution. These services may include payments of expenses on behalf of the fund to support distribution of fund shares for Class A and Class T ("Distribution Expense Reduction") and to pay other fund expenses, such as transfer agent fees ("Other Expense Reduction") collectively referred to as "Brokerage Service Arrangements" in the accompanying table. Brokerage service arrangements generally benefits all shareholders of each class by reducing fund expenses. Each of Class A and Class T shareholders' Other Expense Reduction benefit is reduced by the amount of any Distribution Expense Reduction. In addition, through arrangements with the fund's custodian, credits realized as a result of uninvested cash balances were used to reduce the fund's expenses. All of the applicable expense reductions are noted in the table below.
| Brokerage Service Arrangements | |
| Distribution
expense reduction | Other
expense reduction | Custody
expense reduction |
| | | |
Fund Level | $ - | $ 446 | $ 1 |
Class A | 2 | - | - |
Class T | 45 | - | - |
| $ 47 | $ 446 | $ 1 |
8. Other Information.
At the end of the period, one unaffiliated shareholder was the owner of record of 26% of the total outstanding shares of the fund.
9. Share Transactions.
Transactions for each class of shares were as follows:
| Shares | Dollars |
Years ended October 31, | 2003 | 2002 | 2003 | 2002 |
Class A | | | | |
Shares sold | 12,415 | 9,250 | $ 145,269 | $ 120,262 |
Shares redeemed | (11,712) | (8,748) | (137,635) | (114,908) |
Net increase (decrease) | 703 | 502 | $ 7,634 | $ 5,354 |
Class T | | | | |
Shares sold | 40,894 | 34,800 | $ 489,390 | $ 449,377 |
Shares redeemed | (47,699) | (42,125) | (568,651) | (538,683) |
Net increase (decrease) | (6,805) | (7,325) | $ (79,261) | $ (89,306) |
Class B | | | | |
Shares sold | 460 | 738 | $ 5,148 | $ 9,282 |
Shares redeemed | (1,176) | (2,060) | (12,818) | (25,749) |
Net increase (decrease) | (716) | (1,322) | $ (7,670) | $ (16,467) |
Class C | | | | |
Shares sold | 1,424 | 967 | $ 16,568 | $ 12,444 |
Shares redeemed | (1,891) | (1,683) | (21,771) | (21,549) |
Net increase (decrease) | (467) | (716) | $ (5,203) | $ (9,105) |
Institutional Class | | | | |
Shares sold | 7,107 | 5,939 | $ 81,168 | $ 77,765 |
Shares redeemed | (8,025) | (5,590) | (91,891) | (72,010) |
Net increase (decrease) | (918) | 349 | $ (10,723) | $ 5,755 |
Annual Report
Report of Independent Auditors
To the Trustees of Fidelity Advisor Series VIII and the Shareholders of Fidelity Advisor Overseas Fund.
In our opinion, the accompanying statement of assets and liabilities, including the schedule of investments, and the related statements of operations and of changes in net assets and the financial highlights present fairly, in all material respects, the financial position of Fidelity Advisor Overseas Fund (a fund of Fidelity Advisor Series VIII) at October 31, 2003 and the results of its operations, the changes in its net assets and the financial highlights for the periods indicated, in conformity with accounting principles generally accepted in the United States of America. These financial statements and financial highlights (hereafter referred to as "financial statements") are the responsibility of the Fidelity Advisor Overseas Fund's management; our responsibility is to express an opinion on these financial statements based on our audits. We conducted our audits of these financial statements in accordance with auditing standards generally accepted in the United States of America which require that we plan and perform the audit to obtain reasonable assurance about whether the financial statements are free of material misstatement. An audit includes examining, on a test basis, evidence supporting the amounts and disclosures in the financial statements, assessing the accounting principles used and significant estimates made by management, and evaluating the overall financial statement presentation. We believe that our audits, which included confirmation of securities at October 31, 2003 by correspondence with the custodian and brokers, provide a reasonable basis for our opinion.
/s/PricewaterhouseCoopers LLP
PricewaterhouseCoopers LLP
Boston, Massachusetts
December 12, 2003
Annual Report
Trustees and Officers
The Trustees, Members of the Advisory Board, and executive officers of the trust and fund, as applicable, are listed below. The Board of Trustees governs the fund and is responsible for protecting the interests of shareholders. The Trustees are experienced executives who meet periodically throughout the year to oversee the fund's activities, review contractual arrangements with companies that provide services to the fund, and review the fund's performance. Except for William O. McCoy, each of the Trustees oversees 289 funds advised by FMR or an affiliate. Mr. McCoy oversees 291 funds advised by FMR or an affiliate.
The Trustees hold office without limit in time except that (a) any Trustee may resign; (b) any Trustee may be removed by written instrument, signed by at least two-thirds of the number of Trustees prior to such removal; (c) any Trustee who requests to be retired or who has become incapacitated by illness or injury may be retired by written instrument signed by a majority of the other Trustees; and (d) any Trustee may be removed at any special meeting of shareholders by a two-thirds vote of the outstanding voting securities of the trust. In any event, each non-interested Trustee shall retire not later than the last day of the calendar year in which his or her 72nd birthday occurs. The executive officers and Advisory Board Members hold office without limit in time, except that any officer and Advisory Board Member may resign or may be removed by a vote of a majority of the Trustees at any regular meeting or any special meeting of the Trustees. Except as indicated, each individual has held the office shown or other offices in the same company for the past five years.
The fund's Statement of Additional Information (SAI) includes more information about the Trustees. To request a free copy, call Fidelity at 1-877-208-0098.
Interested Trustees*:
Correspondence intended for each Trustee who is an "interested person" (as defined in the 1940 Act) may be sent to 82 Devonshire Street, Boston, Massachusetts 02109.
Name, Age; Principal Occupation |
Edward C. Johnson 3d (73)** |
| Year of Election or Appointment: 1983 Mr. Johnson is Chairman of the Board of Trustees. Mr. Johnson serves as Chief Executive Officer, Chairman, and a Director of FMR Corp.; a Director and Chairman of the Board and of the Executive Committee of FMR; Chairman and a Director of Fidelity Management & Research (Far East) Inc.; Chairman (1998) and a Director of Fidelity Investments Money Management, Inc.; and Chairman (2001) and a Director (2000) of FMR Co., Inc. |
Abigail P. Johnson (41)** |
| Year of Election or Appointment: 2001 Senior Vice President of Advisor Overseas (2001). Ms. Johnson also serves as Senior Vice President of other Fidelity funds (2001). She is President and a Director of FMR (2001), Fidelity Investments Money Management, Inc. (2001), FMR Co., Inc. (2001), and a Director of FMR Corp. Previously, Ms. Johnson managed a number of Fidelity funds. |
Laura B. Cronin (49) |
| Year of Election or Appointment: 2003 Ms. Cronin is an Executive Vice President (2002) and Chief Financial Officer (2002) of FMR Corp. and is a member of the Fidelity Management Committee (2003). Previously, Ms. Cronin served as Vice President of Finance of FMR (1997-1999), and Chief Financial Officer of FMR (1999-2001), Fidelity Personal Investments (2001), and Fidelity Brokerage Company (2001-2002). |
Robert L. Reynolds (51) |
| Year of Election or Appointment: 2003 Mr. Reynolds is a Director (2003) and Chief Operating Officer (2002) of FMR Corp. and is the head of the Fidelity Management Committee (2003). He also serves on the Board at Fidelity Investments Canada, Ltd. (2000). Previously, Mr. Reynolds served as President of Fidelity Investments Institutional Retirement Group (1996-2000). |
* Trustees have been determined to be "Interested Trustees" by virtue of, among other things, their affiliation with the trust or various entities under common control with FMR.
** Edward C. Johnson 3d, Trustee, is Abigail P. Johnson's father.
Annual Report
Non-Interested Trustees:
Correspondence intended for each non-interested Trustee (that is, the Trustees other than the Interested Trustees) may be sent to Fidelity Investments, P.O. Box 55235, Boston, Massachusetts 02205-5235.
Name, Age; Principal Occupation |
J. Michael Cook (61) |
| Year of Election or Appointment: 2001 Prior to Mr. Cook's retirement in May 1999, he served as Chairman and Chief Executive Officer of Deloitte & Touche LLP (accounting/consulting), Chairman of the Deloitte & Touche Foundation, and a member of the Board of Deloitte Touche Tohmatsu. He currently serves as a Director of Comcast (telecommunications, 2002), International Flavors & Fragrances, Inc. (2000), Rockwell Automation (2000) and The Dow Chemical Company (2000). He is a Member of the Diversity Advisory Council of Marakon (2003) and the Advisory Board of the Directorship Search Group, Chairman Emeritus of the Board of Catalyst (a leading organization for the advancement of women in business), and is Chairman of the Accountability Advisory Council to the Comptroller General of the United States. He also serves as a Member of the Advisory Board of the Graduate School of Business of the University of Florida, his alma mater. |
Ralph F. Cox (71) |
| Year of Election or Appointment: 1991 Mr. Cox is President of RABAR Enterprises (management consulting for the petroleum industry). Prior to February 1994, he was President of Greenhill Petroleum Corporation (petroleum exploration and production). Until March 1990, Mr. Cox was President and Chief Operating Officer of Union Pacific Resources Company (exploration and production). He is a Director of CH2M Hill Companies (engineering), and Abraxas Petroleum (petroleum exploration and production, 1999). In addition, he is a member of advisory boards of Texas A&M University and the University of Texas at Austin. |
Phyllis Burke Davis (71) |
| Year of Election or Appointment: 1992 Mrs. Davis is retired from Avon Products, Inc. (consumer products) where she held various positions including Senior Vice President of Corporate Affairs and Group Vice President of U.S. product marketing, sales, distribution, and manufacturing. Mrs. Davis is a member of the Board of Directors of the Southampton Hospital in Southampton, N.Y. (1998). Previously, she served as a Director of BellSouth Corporation (telecommunications), Eaton Corporation (diversified industrial), the TJX Companies, Inc. (retail stores), Hallmark Cards, Inc., and Nabisco Brands, Inc. |
Robert M. Gates (60) |
| Year of Election or Appointment: 1997 Dr. Gates is President of Texas A&M University (2002). He was Director of the Central Intelligence Agency (CIA) from 1991 to 1993. From 1989 to 1991, Dr. Gates served as Assistant to the President of the United States and Deputy National Security Advisor. Dr. Gates is a Director of NACCO Industries, Inc. (mining and manufacturing), and Parker Drilling Co., Inc. (drilling and rental tools for the energy industry, 2001). He also serves as a member of the Advisory Board of VoteHere.net (secure internet voting, 2001). Previously, Dr. Gates served as a Director of LucasVarity PLC (automotive components and diesel engines), a Director of TRW Inc. (automotive, space, defense, and information technology), and Dean of the George Bush School of Government and Public Service at Texas A&M University (1999-2001). Dr. Gates also is a Trustee of the Forum for International Policy. |
Donald J. Kirk (70) |
| Year of Election or Appointment: 1987 Mr. Kirk is a Governor of the American Stock Exchange (2001), a Trustee and former Chairman of the Board of Trustees of the Greenwich Hospital Association, a Director of the Yale-New Haven Health Services Corp. (1998), and a Director Emeritus and former Chairman of the Board of Directors of National Arts Strategies Inc. Mr. Kirk was an Executive-in-Residence (1995-2000) and a Professor (1987-1995) at Columbia University Graduate School of Business. Prior to 1987, he was Chairman of the Financial Accounting Standards Board. Previously, Mr. Kirk served as a Governor of the National Association of Securities Dealers, Inc. (1996-2002), a member and Vice Chairman of the Public Oversight Board of the American Institute of Certified Public Accountants' SEC Practice Section (1995-2002), a Director of General Re Corporation (reinsurance, 1987-1998) and as a Director of Valuation Research Corp. (appraisals and valuations). |
Marie L. Knowles (57) |
| Year of Election or Appointment: 2001 Prior to Ms. Knowles' retirement in June 2000, she served as Executive Vice President and Chief Financial Officer of Atlantic Richfield Company (ARCO) (diversified energy, 1996-2000). From 1993 to 1996, she was a Senior Vice President of ARCO and President of ARCO Transportation Company. She served as a Director of ARCO from 1996 to 1998. She currently serves as a Director of Phelps Dodge Corporation (copper mining and manufacturing), URS Corporation (multidisciplinary engineering, 1999), and McKesson Corporation (healthcare service, 2002). Ms. Knowles is a Trustee of the Brookings Institution and the Catalina Island Conservancy and also serves as a member of the Advisory Board for the School of Engineering of the University of Southern California. |
Ned C. Lautenbach (59) |
| Year of Election or Appointment: 2000 Mr. Lautenbach has been a partner of Clayton, Dubilier & Rice, Inc. (private equity investment firm) since September 1998. Previously, Mr. Lautenbach was with the International Business Machines Corporation (IBM) from 1968 until his retirement in 1998. He was most recently Senior Vice President and Group Executive of Worldwide Sales and Services. From 1993 to 1995, he was Chairman of IBM World Trade Corporation, and from 1994 to 1998 was a member of IBM's Corporate Executive Committee. Mr. Lautenbach serves as Chairman and as a Director (1998) of Acterna Corporation (communications test equipment). He is also Co-Chairman of Covansys, Inc. (global provider of business and technology solutions, 2000). In addition, he is a Director of Eaton Corporation (diversified industrial) and the Philharmonic Center for the Arts in Naples, Florida (1999). He also is a member of the Council on Foreign Relations. |
Marvin L. Mann (70) |
| Year of Election or Appointment: 1993 Mr. Mann is Chairman of the non-interested Trustees (2001). He is Chairman Emeritus of Lexmark International, Inc. (computer peripherals) where he served as CEO until April 1998 and retired as Chairman May 1999, and remains a member of the Board. Prior to 1991, he held the positions of Vice President of International Business Machines Corporation (IBM) and President and General Manager of various IBM divisions and subsidiaries. Mr. Mann is a Board member of Imation Corp. (imaging and information storage) and Acterna Corporation (communications test equipment, 1999). He is also a member of the Director Services Committee of the Investment Company Institute. In addition, Mr. Mann is a member of the President's Cabinet at the University of Alabama and the Board of Visitors of the Culverhouse College of Commerce and Business Administration at the University of Alabama. |
William O. McCoy (70) |
| Year of Election or Appointment: 1997 Prior to his retirement in December 1994, Mr. McCoy was Vice Chairman of the Board of BellSouth Corporation (telecommunications) and President of BellSouth Enterprises. He is currently a Director of Liberty Corporation (holding company), Duke Realty Corporation (real estate), Progress Energy, Inc. (electric utility), and Acterna Corporation (communications test equipment, 1999). He is also a partner of Franklin Street Partners (private investment management firm) and a member of the Research Triangle Foundation Board. In addition, Mr. McCoy served as the Interim Chancellor (1999-2000) and a member of the Board of Visitors (1994-1998) for the University of North Carolina at Chapel Hill and currently serves on the Board of Directors of the University of North Carolina Health Care System and the Board of Visitors of the Kenan-Flagler Business School (University of North Carolina at Chapel Hill). He also served as Vice President of Finance for the University of North Carolina (16-school system, 1995-1998). |
William S. Stavropoulos (64) |
| Year of Election or Appointment: 2001 Mr. Stavropoulos is Chairman of the Board, President and CEO (2002), and Chairman of the Executive Committee (2000) and a Director of The Dow Chemical Company. Since joining The Dow Chemical Company in 1967, Mr. Stavropoulos served in numerous senior management positions, including President (1993-2000) and Chief Executive Officer (1995-2000). Currently, he is a Director of NCR Corporation (data warehousing and technology solutions), BellSouth Corporation (telecommunications), Chemical Financial Corporation, and Maersk Inc. (industrial conglomerate, 2002). He also serves as a member of the Board of Trustees of the American Enterprise Institute for Public Policy Research. In addition, Mr. Stavropoulos is a member of The Business Council, J.P. Morgan International Council, World Business Council for Sustainable Development, and the University of Notre Dame Advisory Council for the College of Science. |
Annual Report
Trustees and Officers - continued
Advisory Board Members and Executive Officers:
Correspondence intended for Dr. Heilmeier may be sent to Fidelity Investments, P.O. Box 55235, Boston, Massachusetts 02205-5235. Correspondence intended for each executive officer and Mr. Lynch may be sent to 82 Devonshire Street, Boston, Massachusetts 02109.
Name, Age; Principal Occupation |
George H. Heilmeier (67) |
| Year of Election or Appointment: 2003 Member of the Advisory Board of Fidelity Advisor Series VIII. Dr. Heilmeier is Chairman Emeritus of Telcordia Technologies (communication software and systems), where prior to his retirement, he served as company Chairman and Chief Executive Officer. He currently serves on the Boards of Directors of The Mitre Corporation (systems engineering and information technology support for the government), INET Technologies Inc. (telecommunications network surveillance, 2001) and Teletech Holdings (customer management services, 1998). He is Chairman of the General Motors Technology Advisory Committee and a Life Fellow of the IEEE (2000). Dr. Heilmeier is a member of the Defense Science Board and the National Security Agency Advisory Board. He is also a member of the National Academy of Engineering, the American Academy of Arts and Sciences and The Board of Overseers of the School of Engineering and Applied Science of the University of Pennsylvania. Previously, Dr. Heilmeier served as a Director of TRW Inc. (automotive, space, defense, and information technology, 1992-2002) and Compaq (1994-2002). |
Peter S. Lynch (60) |
| Year of Election or Appointment: 2003 Member of the Advisory Board of Fidelity Advisor Series VIII. Vice Chairman and a Director of FMR, and Vice Chairman (2001) and a Director (2000) of FMR Co., Inc. Previously, Mr. Lynch served as a Trustee of the Fidelity funds (1990-2003). Prior to May 31, 1990, he was a Director of FMR and Executive Vice President of FMR (a position he held until March 31, 1991), Vice President of Fidelity® Magellan® Fund and FMR Growth Group Leader, and Managing Director of FMR Corp. Mr. Lynch was also Vice President of Fidelity Investments Corporate Services. In addition, he serves as a Trustee of Boston College, Massachusetts Eye & Ear Infirmary, Historic Deerfield, John F. Kennedy Library, and the Museum of Fine Arts of Boston. |
Philip L. Bullen (44) |
| Year of Election or Appointment: 2001 Vice President of Advisor Overseas. Mr. Bullen also serves as Vice President of certain Equity Funds (2001) and certain High Income Funds (2001). He is Senior Vice President of FMR (2001) and FMR Co., Inc. (2001), President and a Director of Fidelity Management & Research (Far East) Inc. (2001), President and a Director of Fidelity Management & Research (U.K.) Inc. (2002), and a Director of Strategic Advisers, Inc. (2002). Before joining Fidelity Investments, Mr. Bullen was President and Chief Investment Officer of Santander Global Advisors (1997-2000) and President and Chief Executive Officer of Boston's Baring Asset Management Inc. (1994-1997). |
Richard R. Mace, Jr. (41) |
| Year of Election or Appointment: 1996 Vice President of Advisor Overseas. Mr. Mace is also Vice President of other funds advised by FMR. |
Eric D. Roiter (54) |
| Year of Election or Appointment: 1998 Secretary of Advisor Overseas. He also serves as Secretary of other Fidelity funds (1998); Vice President, General Counsel, and Clerk of FMR Co., Inc. (2001) and FMR (1998); Vice President and Clerk of FDC (1998); Assistant Clerk of Fidelity Management & Research (U.K.) Inc. (2001) and Fidelity Management & Research (Far East) Inc. (2001); and Assistant Secretary of Fidelity Investments Money Management Inc. (2001). Prior to joining Fidelity, Mr. Roiter was with the law firm of Debevoise & Plimpton, as an associate (1981-1984) and as a partner (1985-1997), and served as an Assistant General Counsel of the U.S. Securities and Exchange Commission (1979-1981). Mr. Roiter is an Adjunct Member, Faculty of Law, at Boston College Law School (2003). |
Stuart Fross (44) |
| Year of Election or Appointment: 2003 Assistant Secretary of Advisor Overseas. Mr. Fross also serves as Assistant Secretary of other Fidelity funds (2003) and is an employee of FMR. |
Maria F. Dwyer (44) |
| Year of Election or Appointment: 2002 President and Treasurer of Advisor Overseas. Ms. Dwyer also serves as President and Treasurer of other Fidelity funds (2002) and is a Vice President (1999) and an employee (1996) of FMR. Prior to joining Fidelity, Ms. Dwyer served as Director of Compliance for MFS Investment Management. |
Timothy F. Hayes (52) |
| Year of Election or Appointment: 2002 Chief Financial Officer of Advisor Overseas. Mr. Hayes also serves as Chief Financial Officer of other Fidelity funds (2002). Recently he was appointed President of Fidelity Service Company (2003) where he also serves as a Director. Mr. Hayes also serves as President of Fidelity Investments Operations Group (FIOG, 2002), which includes Fidelity Pricing and Cash Management Services Group (FPCMS), where he was appointed President in 1998. Previously, Mr. Hayes served as Chief Financial Officer of Fidelity Investments Corporate Systems and Service Group (1998) and Fidelity Systems Company (1997-1998). |
John R. Hebble (45) |
| Year of Election or Appointment: 2003 Deputy Treasurer of Advisor Overseas. Mr. Hebble also serves as Deputy Treasurer of other Fidelity funds (2003), and is an employee of FMR. Before joining Fidelity Investments, Mr. Hebble worked at Deutsche Asset Management where he served as Director of Fund Accounting (2002-2003) and Assistant Treasurer of the Scudder Funds (1998-2003). |
John H. Costello (57) |
| Year of Election or Appointment: 1990 Assistant Treasurer of Advisor Overseas. Mr. Costello also serves as Assistant Treasurer of other Fidelity funds and is an employee of FMR. |
Francis V. Knox, Jr. (56) |
| Year of Election or Appointment: 2002 Assistant Treasurer of Advisor Overseas. Mr. Knox also serves as Assistant Treasurer of other Fidelity funds (2002), and is a Vice President and an employee of FMR. Previously, Mr. Knox served as Vice President of Investment & Advisor Compliance (1990-2001), and Compliance Officer of Fidelity Management & Research (U.K.) Inc. (1992-2002), Fidelity Management & Research (Far East) Inc. (1991-2002), and FMR Corp. (1995-2002). |
Mark Osterheld (48) |
| Year of Election or Appointment: 2002 Assistant Treasurer of Advisor Overseas. Mr. Osterheld also serves as Assistant Treasurer of other Fidelity funds (2002) and is an employee of FMR. |
Thomas J. Simpson (45) |
| Year of Election or Appointment: 2000 Assistant Treasurer of Advisor Overseas. Mr. Simpson is Assistant Treasurer of other Fidelity funds (2000) and an employee of FMR (1996). Prior to joining FMR, Mr. Simpson was Vice President and Fund Controller of Liberty Investment Services (1987-1995). |
Annual Report
Annual Report
Annual Report
Annual Report
Annual Report
Annual Report
Investment Adviser
Fidelity Management & Research Company
Boston, MA
Investment Sub-Advisers
FMR Co., Inc.
Fidelity Management & Research
(U.K.) Inc.
Fidelity Management & Research
(Far East) Inc.
Fidelity International
Investment Advisors
Fidelity Investments Japan Limited
Fidelity International Investment Advisors (U.K.) Limited
General Distributor
Fidelity Distributors Corporation
Boston, MA
Transfer and Shareholder
Servicing Agents
Fidelity Investments Institutional Operations Company, Inc.
Boston, MA
Custodian
JPMorgan Chase Bank
New York, NY
Annual Report
Fidelity Advisor Aggressive Growth Fund |
Fidelity Advisor Asset Allocation Fund |
Fidelity Advisor Balanced Fund |
Fidelity Advisor Biotechnology Fund |
Fidelity Advisor California Municipal Income Fund |
Fidelity Advisor Consumer Industries Fund |
Fidelity Advisor Cyclical Industries Fund |
Fidelity Advisor Developing Communications Fund |
Fidelity Advisor Diversified International Fund |
Fidelity Advisor Dividend Growth Fund |
Fidelity Advisor Dynamic Capital Appreciation Fund |
Fidelity Advisor Electronics Fund |
Fidelity Advisor Emerging Asia Fund |
Fidelity Advisor Emerging Markets Income Fund |
Fidelity Advisor Equity Growth Fund |
Fidelity Advisor Equity Income Fund |
Fidelity Advisor Equity Value Fund |
Fidelity Advisor Europe Capital Appreciation Fund |
Fidelity Advisor Fifty Fund |
Fidelity Advisor Financial Services Fund |
Fidelity Advisor Floating Rate High Income Fund |
Fidelity Advisor Freedom Income FundSM |
Fidelity Advisor Freedom 2010 FundSM |
Fidelity Advisor Freedom 2020 FundSM |
Fidelity Advisor Freedom 2030 FundSM |
Fidelity Advisor Freedom 2040 FundSM |
Fidelity Advisor Global Equity Fund |
Fidelity Advisor Government Investment Fund |
Fidelity Advisor Growth & Income Fund |
Fidelity Advisor Growth Opportunities |
Fidelity Advisor Health Care Fund |
Fidelity Advisor High Income Advantage Fund |
Fidelity Advisor High Income Fund |
Fidelity Advisor Inflation-Protected Bond Fund |
Fidelity Advisor Intermediate Bond Fund |
Fidelity Advisor International Capital Appreciation Fund |
Fidelity Advisor International Small Cap Fund |
Fidelity Advisor Investment Grade Bond Fund |
Fidelity Advisor Japan Fund |
Fidelity Advisor Korea Fund |
Fidelity Advisor Large Cap Fund |
Fidelity Advisor Latin America Fund |
Fidelity Advisor Leveraged Company Stock Fund |
Fidelity Advisor Mid Cap Fund |
Fidelity Advisor Mortgage Securities Fund |
Fidelity Advisor Municipal Income Fund |
Fidelity Advisor Natural Resources Fund |
Fidelity Advisor New Insights Fund |
Fidelity Advisor New York Municipal Income Fund |
Fidelity Advisor Overseas Fund |
Fidelity Advisor Real Estate Fund |
Fidelity Advisor Short Fixed-Income Fund |
Fidelity Advisor Short Intermediate Municipal Income Fund |
Fidelity Advisor Small Cap Fund |
Fidelity Advisor Strategic Growth Fund |
Fidelity Advisor Strategic Income Fund |
Fidelity Advisor Tax Managed Stock Fund |
Fidelity Advisor Technology Fund |
Fidelity Advisor Telecommunications & Utilities Growth Fund |
Fidelity Advisor Value Leaders Fund |
Fidelity Advisor Value Strategies Fund |
Prime Fund |
Tax-Exempt Fund |
Treasury Fund |
(Fidelity Investment logo)(registered trademark)
Corporate Headquarters
82 Devonshire St., Boston, MA 02109
www.fidelity.com
OSI-UANN-1203
1.784768.100
Fidelity® Advisor
Value Leaders
Fund - Class A, Class T, Class B
and Class C
Annual Report
October 31, 2003
(2_fidelity_logos) (Registered_Trademark)
Contents
Chairman's Message | <Click Here> | Ned Johnson's message to shareholders. |
Performance | <Click Here> | How the fund has done over time. |
Investment Summary | <Click Here> | A summary of the fund's investments. |
Investments | <Click Here> | A complete list of the fund's investments with their market values. |
Financial Statements | <Click Here> | Statements of assets and liabilities, operations, and changes in net assets,
as well as financial highlights. |
Notes | <Click Here> | Notes to the financial statements. |
Auditors' Opinion | <Click Here> | |
Trustees and Officers | <Click Here> | |
For a free copy of the fund's proxy voting guidelines call 1-877-208-0098 or visit the Securities and Exchange Commission (SEC)'s web site at www.sec.gov.
Third party marks appearing herein are the property of their respective owners.
All other marks appearing herein are registered or unregistered trademarks or service marks of FMR Corp. or an affiliated company.
(Recycle graphic) This report is printed on recycled paper using soy-based inks.
This report and the financial statements contained herein are submitted for the general information of the shareholders of the fund. This report is not authorized for distribution to prospective investors in the fund unless preceded or accompanied by an effective prospectus.
Mutual fund shares are not deposits or obligations of, or guaranteed by, any depository institution. Shares are not insured by the FDIC, Federal Reserve Board or any other agency, and are subject to investment risks, including possible loss of principal amount invested.
Neither the fund nor Fidelity Distributors Corporation is a bank.
For more information on any Fidelity Advisor fund, including charges and expenses, contact your investment professional for a free prospectus. Read it carefully before you invest or send money.
Annual Report
Chairman's Message
(photo_of_Edward_C_Johnson_3d)
Dear Shareholder:
Many of you have read or heard news stories recently that were critical of mutual funds and made allegations that the mutual fund industry has been less than forthright. I find these reports unsettling and not necessarily an accurate picture of the overall industry, and I would like you to know where we at Fidelity stand.
With specific regard to allegations that certain mutual fund companies were violating the Securities and Exchange Commission's forward pricing rules or were involved in so-called "market timing" activities, I want to say two things:
First, Fidelity does not have agreements that permit customers who buy fund shares after 4 p.m. to obtain the 4 p.m. price. This is not to say that someone could not deceive the company through fraudulent acts. But I underscore that we have no so-called "agreements" which would permit this illegal practice.
Second, Fidelity has been on record for years opposing predatory short-term trading which adversely affects other shareholders in a mutual fund. In fact, in the 1980s, we began charging a fee - which is returned to the fund and, therefore, to investors - to discourage this activity. What's more, several years ago we took the industry lead in developing a Fair Value Pricing Policy to prevent market timing on foreign securities in our funds. It is reasonable to assume that another structure can be developed that would alter the system to make it much more difficult for predatory traders to operate. This, however, will only be achieved through close cooperation among regulators, legislators and the industry.
Certainly no industry is perfect, and there have been instances of unethical and illegal activity from time to time within the mutual fund industry. When this occurs, confessed or convicted offenders should be dealt with appropriately. Clearly, every system can be improved. We applaud well thought out improvements by regulators, legislators and industry representatives that achieve the common goal of building and protecting the value of investors' holdings. But we remain concerned about the risk of over-regulation and the quick application of simplistic solutions to intricate problems.
For more than 57 years, Fidelity Investments has worked very hard to improve its products and service to justify your trust. When our family founded this company in 1946, we had only a few hundred customers. Many of them were family and friends. Today, we serve more than 18 million customers including individual investors and participants in retirement plans across America.
Let me close by saying that we do not take your trust in us for granted, and we realize that we must always work to improve all aspects of our service to you. In turn, we urge you to continue your active participation with your financial matters, so that your interests can be well served.
Annual Report
Best regards,
/s/Edward C. Johnson 3d
Edward C. Johnson 3d
Annual Report
Performance: The Bottom Line
Average annual total return reflects the change in the value of an investment, assuming reinvestment of the fund's dividend income and capital gains (the profits earned upon the sale of securities that have grown in value) and assuming a constant rate of performance each year. How a fund did yesterday is no guarantee of how it will do tomorrow. Returns may reflect the conversion of Class B shares to Class A shares after a maximum of seven years.
Average Annual Total Returns
Average annual total returns take Fidelity® Advisor Value Leaders - Class T cumulative total return and show you what would have happened if Fidelity Advisor Value Leaders - Class T shares had performed at a constant rate each year. These numbers will be reported once the fund is a year old. In addition, the growth of the hypothetical $10,000 investment in the fund will appear in the fund's next annual report.
Annual Report
Investment Summary
Top Ten Stocks as of October 31, 2003 |
| % of fund's
net assets |
Citigroup, Inc. | 3.4 |
Bank of America Corp. | 2.5 |
American International Group, Inc. | 2.4 |
Verizon Communications, Inc. | 2.2 |
Bank One Corp. | 2.1 |
Tyco International Ltd. | 2.0 |
Morgan Stanley | 2.0 |
Merck & Co., Inc. | 2.0 |
Merrill Lynch & Co., Inc. | 1.8 |
Exxon Mobil Corp. | 1.8 |
| 22.2 |
Top Five Market Sectors as of October 31, 2003 |
| % of fund's
net assets |
Financials | 29.4 |
Consumer Discretionary | 13.6 |
Industrials | 11.3 |
Information Technology | 10.9 |
Energy | 9.8 |
Asset Allocation (% of fund's net assets) |
As of October 31, 2003 * |
| Stocks 101.2% |
 | Short-Term Investments
and Net Other Assets** (1.2)% |
 | |
* Foreign investments 3.7% |
** Short term Investments and Net Other Assets are not included in the pie chart. |

Annual Report
Investments October 31, 2003
Showing Percentage of Net Assets
Common Stocks - 101.2% |
| Shares | | Value (Note 1) |
CONSUMER DISCRETIONARY - 13.6% |
Auto Components - 0.0% |
LKQ Corp. (a) | 100 | | $ 1,730 |
Automobiles - 0.1% |
Harley-Davidson, Inc. | 100 | | 4,741 |
Hotels, Restaurants & Leisure - 2.3% |
Darden Restaurants, Inc. | 500 | | 10,475 |
Hilton Hotels Corp. | 800 | | 12,672 |
McDonald's Corp. | 3,600 | | 90,036 |
Outback Steakhouse, Inc. | 200 | | 8,400 |
Six Flags, Inc. (a) | 2,800 | | 16,576 |
| | 138,159 |
Household Durables - 1.5% |
KB Home | 600 | | 41,094 |
Leggett & Platt, Inc. | 500 | | 10,445 |
Sony Corp. sponsored ADR | 600 | | 21,120 |
Techtronic Industries Co. | 6,000 | | 16,534 |
| | 89,193 |
Leisure Equipment & Products - 0.3% |
Eastman Kodak Co. | 400 | | 9,772 |
MarineMax, Inc. (a) | 300 | | 5,736 |
| | 15,508 |
Media - 6.3% |
Cablevision Systems Corp. - NY Group Class A (a) | 700 | | 14,140 |
Clear Channel Communications, Inc. | 920 | | 37,554 |
Comcast Corp. Class A (a) | 500 | | 16,960 |
Emmis Communications Corp. Class A (a) | 700 | | 15,526 |
Fox Entertainment Group, Inc. Class A (a) | 900 | | 24,930 |
General Motors Corp. Class H (a) | 1,500 | | 24,645 |
Liberty Media Corp. Class A (a) | 2,600 | | 26,234 |
Reader's Digest Association, Inc. (non-vtg.) | 600 | | 8,838 |
Time Warner, Inc. (a) | 5,400 | | 82,566 |
Viacom, Inc. Class B (non-vtg.) | 1,300 | | 51,831 |
Walt Disney Co. | 3,000 | | 67,920 |
| | 371,144 |
Multiline Retail - 0.7% |
Kohl's Corp. (a) | 250 | | 14,018 |
Nordstrom, Inc. | 500 | | 15,245 |
Saks, Inc. (a) | 700 | | 9,730 |
ShopKo Stores, Inc. (a) | 300 | | 4,644 |
| | 43,637 |
Common Stocks - continued |
| Shares | | Value (Note 1) |
CONSUMER DISCRETIONARY - continued |
Specialty Retail - 2.2% |
AutoNation, Inc. (a) | 400 | | $ 7,480 |
AutoZone, Inc. (a) | 100 | | 9,610 |
CarMax, Inc. (a) | 320 | | 10,083 |
Home Depot, Inc. | 1,700 | | 63,019 |
Lowe's Companies, Inc. | 200 | | 11,786 |
Select Comfort Corp. (a) | 200 | | 6,260 |
Sonic Automotive, Inc. Class A | 800 | | 18,160 |
| | 126,398 |
Textiles Apparel & Luxury Goods - 0.2% |
Reebok International Ltd. | 300 | | 11,685 |
TOTAL CONSUMER DISCRETIONARY | | 802,195 |
CONSUMER STAPLES - 4.9% |
Beverages - 0.4% |
The Coca-Cola Co. | 560 | | 25,984 |
Food & Staples Retailing - 0.6% |
CVS Corp. | 400 | | 14,072 |
Safeway, Inc. (a) | 1,100 | | 23,210 |
| | 37,282 |
Food Products - 0.4% |
Del Monte Foods Co. (a) | 500 | | 4,755 |
Interstate Bakeries Corp. | 400 | | 5,872 |
Tyson Foods, Inc. Class A | 800 | | 11,416 |
| | 22,043 |
Household Products - 1.9% |
Colgate-Palmolive Co. | 400 | | 21,276 |
Procter & Gamble Co. | 900 | | 88,461 |
| | 109,737 |
Personal Products - 0.9% |
Avon Products, Inc. | 300 | | 20,388 |
Gillette Co. | 1,080 | | 34,452 |
| | 54,840 |
Tobacco - 0.7% |
Altria Group, Inc. | 880 | | 40,920 |
TOTAL CONSUMER STAPLES | | 290,806 |
Common Stocks - continued |
| Shares | | Value (Note 1) |
ENERGY - 9.8% |
Energy Equipment & Services - 2.9% |
Baker Hughes, Inc. | 500 | | $ 14,130 |
ENSCO International, Inc. | 1,810 | | 47,694 |
National-Oilwell, Inc. (a) | 400 | | 7,628 |
Pride International, Inc. (a) | 1,100 | | 18,018 |
Smith International, Inc. (a) | 600 | | 22,338 |
Transocean, Inc. (a) | 400 | | 7,676 |
Weatherford International Ltd. (a) | 1,630 | | 56,643 |
| | 174,127 |
Oil & Gas - 6.9% |
Amerada Hess Corp. | 200 | | 10,324 |
Apache Corp. | 400 | | 27,888 |
BP PLC sponsored ADR | 400 | | 16,952 |
Burlington Resources, Inc. | 1,100 | | 53,504 |
ChevronTexaco Corp. | 1,340 | | 99,562 |
ConocoPhillips | 800 | | 45,720 |
EnCana Corp. | 200 | | 6,867 |
Exxon Mobil Corp. | 2,900 | | 106,082 |
Murphy Oil Corp. | 120 | | 7,078 |
Occidental Petroleum Corp. | 500 | | 17,630 |
Valero Energy Corp. | 300 | | 12,810 |
| | 404,417 |
TOTAL ENERGY | | 578,544 |
FINANCIALS - 29.4% |
Capital Markets - 7.3% |
Bank of New York Co., Inc. | 1,700 | | 53,023 |
Bear Stearns Companies, Inc. | 300 | | 22,875 |
J.P. Morgan Chase & Co. | 2,200 | | 78,980 |
Lehman Brothers Holdings, Inc. | 600 | | 43,200 |
Merrill Lynch & Co., Inc. | 1,800 | | 106,560 |
Morgan Stanley | 2,200 | | 120,714 |
National Financial Partners Corp. | 100 | | 2,710 |
| | 428,062 |
Commercial Banks - 8.4% |
Bank of America Corp. | 1,950 | | 147,674 |
Bank One Corp. | 2,900 | | 123,105 |
Banknorth Group, Inc. | 400 | | 12,528 |
Fifth Third Bancorp | 500 | | 28,980 |
FleetBoston Financial Corp. | 1,600 | | 64,624 |
Common Stocks - continued |
| Shares | | Value (Note 1) |
FINANCIALS - continued |
Commercial Banks - continued |
Valley National Bancorp | 600 | | $ 17,550 |
Wachovia Corp. | 400 | | 18,348 |
Wells Fargo & Co. | 1,500 | | 84,480 |
| | 497,289 |
Consumer Finance - 0.5% |
MBNA Corp. | 1,200 | | 29,700 |
Diversified Financial Services - 4.1% |
CIT Group, Inc. | 800 | | 26,896 |
Citigroup, Inc. | 4,200 | | 199,078 |
Deutsche Boerse AG | 285 | | 15,788 |
| | 241,762 |
Insurance - 6.0% |
ACE Ltd. | 400 | | 14,400 |
AFLAC, Inc. | 500 | | 18,240 |
Allianz AG sponsored ADR | 600 | | 6,474 |
Allstate Corp. | 600 | | 23,700 |
AMBAC Financial Group, Inc. | 310 | | 21,929 |
American International Group, Inc. | 2,300 | | 139,909 |
Conseco, Inc. (a) | 800 | | 16,320 |
Hartford Financial Services Group, Inc. | 500 | | 27,450 |
Montpelier Re Holdings Ltd. | 100 | | 3,312 |
Nationwide Financial Services, Inc. Class A | 200 | | 6,794 |
The Chubb Corp. | 200 | | 13,362 |
Travelers Property Casualty Corp. Class B | 1,900 | | 31,103 |
UnumProvident Corp. | 1,100 | | 18,007 |
XL Capital Ltd. Class A | 200 | | 13,900 |
| | 354,900 |
Real Estate - 0.6% |
Apartment Investment & Management Co. Class A | 200 | | 8,180 |
iStar Financial, Inc. | 500 | | 19,030 |
Manufactured Home Communities, Inc. | 150 | | 5,700 |
| | 32,910 |
Thrifts & Mortgage Finance - 2.5% |
Fannie Mae | 460 | | 32,977 |
Freddie Mac | 400 | | 22,452 |
Golden West Financial Corp., Delaware | 120 | | 12,052 |
New York Community Bancorp, Inc. | 400 | | 14,480 |
Common Stocks - continued |
| Shares | | Value (Note 1) |
FINANCIALS - continued |
Thrifts & Mortgage Finance - continued |
Sovereign Bancorp, Inc. | 2,900 | | $ 60,349 |
The PMI Group, Inc. | 200 | | 7,646 |
| | 149,956 |
TOTAL FINANCIALS | | 1,734,579 |
HEALTH CARE - 7.3% |
Biotechnology - 0.3% |
Alkermes, Inc. (a) | 600 | | 7,782 |
Cephalon, Inc. (a) | 200 | | 9,392 |
| | 17,174 |
Health Care Equipment & Supplies - 1.8% |
Bausch & Lomb, Inc. | 300 | | 14,448 |
Baxter International, Inc. | 2,140 | | 56,881 |
Edwards Lifesciences Corp. (a) | 200 | | 5,800 |
Fisher Scientific International, Inc. (a) | 300 | | 12,075 |
St. Jude Medical, Inc. (a) | 300 | | 17,448 |
| | 106,652 |
Health Care Providers & Services - 0.9% |
HealthSouth Corp. (a) | 3,100 | | 8,773 |
IMS Health, Inc. | 300 | | 7,059 |
PacifiCare Health Systems, Inc. (a) | 150 | | 8,925 |
UnitedHealth Group, Inc. | 500 | | 25,440 |
WebMD Corp. (a) | 596 | | 4,643 |
| | 54,840 |
Pharmaceuticals - 4.3% |
Angiotech Pharmaceuticals, Inc. (a) | 100 | | 4,582 |
AstraZeneca PLC sponsored ADR | 200 | | 9,536 |
Biovail Corp. (a) | 200 | | 4,812 |
Eli Lilly & Co. | 100 | | 6,662 |
Forest Laboratories, Inc. (a) | 600 | | 30,006 |
Johnson & Johnson | 300 | | 15,099 |
Merck & Co., Inc. | 2,700 | | 119,475 |
Schering-Plough Corp. | 3,940 | | 60,164 |
| | 250,336 |
TOTAL HEALTH CARE | | 429,002 |
Common Stocks - continued |
| Shares | | Value (Note 1) |
INDUSTRIALS - 11.3% |
Aerospace & Defense - 2.9% |
BE Aerospace, Inc. (a) | 1,100 | | $ 6,204 |
Boeing Co. | 300 | | 11,547 |
Bombardier, Inc. Class B (sub. vtg.) | 2,600 | | 11,674 |
Goodrich Corp. | 300 | | 8,286 |
Honeywell International, Inc. | 1,000 | | 30,610 |
Lockheed Martin Corp. | 1,200 | | 55,632 |
Northrop Grumman Corp. | 200 | | 17,880 |
United Defense Industries, Inc. (a) | 200 | | 6,480 |
United Technologies Corp. | 300 | | 25,407 |
| | 173,720 |
Air Freight & Logistics - 0.1% |
Expeditors International of Washington, Inc. | 160 | | 6,006 |
Airlines - 0.8% |
AirTran Holdings, Inc. (a) | 600 | | 9,726 |
Northwest Airlines Corp. (a) | 800 | | 10,952 |
Ryanair Holdings PLC sponsored ADR (a) | 200 | | 10,300 |
Southwest Airlines Co. | 800 | | 15,520 |
| | 46,498 |
Building Products - 0.7% |
Masco Corp. | 1,200 | | 33,000 |
Trex Co., Inc. (a) | 200 | | 7,400 |
| | 40,400 |
Commercial Services & Supplies - 1.6% |
Cintas Corp. | 600 | | 25,596 |
Copart, Inc. (a) | 500 | | 6,235 |
IKON Office Solutions, Inc. | 900 | | 7,560 |
Monster Worldwide, Inc. (a) | 400 | | 10,188 |
Republic Services, Inc. | 200 | | 4,650 |
Robert Half International, Inc. (a) | 900 | | 21,249 |
Waste Management, Inc. | 700 | | 18,144 |
| | 93,622 |
Construction & Engineering - 0.3% |
Chicago Bridge & Iron Co. NV | 200 | | 5,450 |
Granite Construction, Inc. | 600 | | 11,994 |
| | 17,444 |
Industrial Conglomerates - 2.9% |
3M Co. | 420 | | 33,125 |
General Electric Co. | 180 | | 5,222 |
Common Stocks - continued |
| Shares | | Value (Note 1) |
INDUSTRIALS - continued |
Industrial Conglomerates - continued |
Textron, Inc. | 200 | | $ 9,938 |
Tyco International Ltd. | 5,800 | | 121,104 |
| | 169,389 |
Machinery - 1.2% |
Caterpillar, Inc. | 160 | | 11,725 |
Cummins, Inc. | 100 | | 4,740 |
Eaton Corp. | 100 | | 10,024 |
Manitowoc Co., Inc. | 600 | | 13,020 |
Parker Hannifin Corp. | 400 | | 20,388 |
Timken Co. | 500 | | 8,390 |
| | 68,287 |
Road & Rail - 0.6% |
CSX Corp. | 250 | | 7,955 |
Overnite Corp. | 200 | | 4,432 |
Union Pacific Corp. | 400 | | 25,040 |
| | 37,427 |
Trading Companies & Distributors - 0.2% |
W.W. Grainger, Inc. | 270 | | 12,361 |
TOTAL INDUSTRIALS | | 665,154 |
INFORMATION TECHNOLOGY - 10.9% |
Communications Equipment - 1.7% |
Cisco Systems, Inc. (a) | 600 | | 12,588 |
Motorola, Inc. | 4,600 | | 62,238 |
Scientific-Atlanta, Inc. | 200 | | 5,920 |
Sonus Networks, Inc. (a) | 200 | | 1,642 |
Telefonaktiebolaget LM Ericsson ADR (a) | 1,000 | | 17,080 |
| | 99,468 |
Computers & Peripherals - 3.0% |
Hewlett-Packard Co. | 4,200 | | 93,702 |
International Business Machines Corp. | 320 | | 28,634 |
SanDisk Corp. (a) | 280 | | 22,568 |
Seagate Technology | 350 | | 8,043 |
Sun Microsystems, Inc. (a) | 6,300 | | 24,948 |
| | 177,895 |
Electronic Equipment & Instruments - 1.7% |
Agilent Technologies, Inc. (a) | 1,400 | | 34,888 |
Amphenol Corp. Class A (a) | 200 | | 11,750 |
Common Stocks - continued |
| Shares | | Value (Note 1) |
INFORMATION TECHNOLOGY - continued |
Electronic Equipment & Instruments - continued |
Celestica, Inc. (sub. vtg.) (a) | 500 | | $ 7,091 |
PerkinElmer, Inc. | 600 | | 10,806 |
Tech Data Corp. (a) | 200 | | 6,584 |
Thermo Electron Corp. (a) | 500 | | 10,990 |
Waters Corp. (a) | 500 | | 15,715 |
| | 97,824 |
Internet Software & Services - 0.1% |
Ariba, Inc. (a) | 2,600 | | 8,450 |
IT Services - 0.9% |
Affiliated Computer Services, Inc. Class A (a) | 190 | | 9,297 |
Computer Sciences Corp. (a) | 350 | | 13,867 |
First Data Corp. | 500 | | 17,850 |
The BISYS Group, Inc. (a) | 900 | | 12,870 |
| | 53,884 |
Office Electronics - 0.2% |
Xerox Corp. (a) | 1,200 | | 12,600 |
Semiconductors & Semiconductor Equipment - 2.1% |
Agere Systems, Inc. Class B (a) | 3,300 | | 11,187 |
Applied Materials, Inc. (a) | 800 | | 18,696 |
Cabot Microelectronics Corp. (a) | 400 | | 22,800 |
Intel Corp. | 520 | | 17,186 |
MEMC Electronic Materials, Inc. (a) | 400 | | 4,480 |
Micron Technology, Inc. (a) | 600 | | 8,604 |
National Semiconductor Corp. (a) | 200 | | 8,126 |
Samsung Electronics Co. Ltd. | 28 | | 11,120 |
Texas Instruments, Inc. | 800 | | 23,136 |
| | 125,335 |
Software - 1.2% |
Autodesk, Inc. | 500 | | 9,625 |
BEA Systems, Inc. (a) | 300 | | 4,170 |
Microsoft Corp. | 1,300 | | 33,995 |
Network Associates, Inc. (a) | 1,300 | | 18,109 |
Vastera, Inc. (a) | 1,200 | | 4,440 |
| | 70,339 |
TOTAL INFORMATION TECHNOLOGY | | 645,795 |
Common Stocks - continued |
| Shares | | Value (Note 1) |
MATERIALS - 5.1% |
Chemicals - 2.0% |
Dow Chemical Co. | 1,500 | | $ 56,535 |
E.I. du Pont de Nemours & Co. | 400 | | 16,160 |
Lyondell Chemical Co. | 700 | | 10,010 |
Olin Corp. | 500 | | 8,705 |
Praxair, Inc. | 400 | | 27,832 |
| | 119,242 |
Containers & Packaging - 0.5% |
Ball Corp. | 100 | | 5,620 |
Owens-Illinois, Inc. (a) | 1,600 | | 19,680 |
Smurfit-Stone Container Corp. (a) | 400 | | 6,200 |
| | 31,500 |
Metals & Mining - 1.6% |
Alcoa, Inc. | 900 | | 28,413 |
Companhia Vale do Rio Doce sponsored ADR | 200 | | 9,150 |
Freeport-McMoRan Copper & Gold, Inc. Class B | 200 | | 7,750 |
Massey Energy Co. | 1,300 | | 18,070 |
Newmont Mining Corp. Holding Co. | 150 | | 6,567 |
Nucor Corp. | 400 | | 21,932 |
| | 91,882 |
Paper & Forest Products - 1.0% |
Bowater, Inc. | 400 | | 16,332 |
Georgia-Pacific Corp. | 200 | | 5,256 |
International Paper Co. | 900 | | 35,415 |
| | 57,003 |
TOTAL MATERIALS | | 299,627 |
TELECOMMUNICATION SERVICES - 5.2% |
Diversified Telecommunication Services - 4.3% |
Citizens Communications Co. (a) | 1,300 | | 16,185 |
Covad Communications Group, Inc. (a) | 2,200 | | 9,636 |
NTL, Inc. (a) | 600 | | 37,038 |
Qwest Communications International, Inc. (a) | 1,200 | | 4,236 |
SBC Communications, Inc. | 1,700 | | 40,766 |
TELUS Corp. (non-vtg.) | 840 | | 14,710 |
Verizon Communications, Inc. | 3,900 | | 131,040 |
| | 253,611 |
Wireless Telecommunication Services - 0.9% |
At Road, Inc. (a) | 700 | | 9,030 |
Common Stocks - continued |
| Shares | | Value (Note 1) |
TELECOMMUNICATION SERVICES - continued |
Wireless Telecommunication Services - continued |
Crown Castle International Corp. (a) | 1,800 | | $ 22,788 |
Nextel Communications, Inc. Class A (a) | 900 | | 21,780 |
| | 53,598 |
TOTAL TELECOMMUNICATION SERVICES | | 307,209 |
UTILITIES - 3.7% |
Electric Utilities - 3.3% |
Allegheny Energy, Inc. (a) | 600 | | 6,348 |
Edison International (a) | 200 | | 3,942 |
Entergy Corp. | 500 | | 26,950 |
Exelon Corp. | 200 | | 12,690 |
FirstEnergy Corp. | 1,000 | | 34,390 |
FPL Group, Inc. | 200 | | 12,748 |
PG&E Corp. (a) | 1,000 | | 24,450 |
Southern Co. | 1,200 | | 35,760 |
Texas Genco Holdings, Inc. | 200 | | 5,980 |
TXU Corp. | 1,100 | | 25,102 |
Xcel Energy, Inc. | 600 | | 9,840 |
| | 198,200 |
Multi-Utilities & Unregulated Power - 0.4% |
AES Corp. (a) | 1,800 | | 15,750 |
Reliant Resources, Inc. (a) | 1,200 | | 5,940 |
| | 21,690 |
TOTAL UTILITIES | | 219,890 |
TOTAL COMMON STOCKS (Cost $5,743,703) | 5,972,801 |
Cash Equivalents - 0.9% |
| Maturity Amount | | Value
(Note 1) |
Investments in repurchase agreements (Collateralized by U.S. Treasury Obligations, in a joint trading account at 1%, dated 10/31/03 due 11/3/03)
(Cost $50,000) | 50,004 | | $ 50,000 |
TOTAL INVESTMENT PORTFOLIO - 102.1% (Cost $5,793,703) | | 6,022,801 |
NET OTHER ASSETS - (2.1)% | | (121,652) |
NET ASSETS - 100% | $ 5,901,149 |
Legend |
(a) Non-income producing |
Other Information |
Purchases and sales of securities, other than short-term securities, aggregated $7,920,613 and $2,165,242, respectively. |
The fund placed a portion of its portfolio transactions with brokerage firms which are affiliates of the investment adviser. The commissions paid to these affiliated firms were $434 for the period. |
See accompanying notes which are an integral part of the financial statements.
Annual Report
Financial Statements
Statement of Assets and Liabilities
| October 31, 2003 |
| | |
Assets | | |
Investment in securities, at value (including repurchase agreements of $50,000) (cost $5,793,703) - See accompanying schedule | | $ 6,022,801 |
Cash | | 525 |
Receivable for investments sold | | 115,577 |
Receivable for fund shares sold | | 1,245 |
Dividends receivable | | 6,681 |
Prepaid expenses | | 52,613 |
Receivable from investment adviser for expense reductions | | 17,371 |
Total assets | | 6,216,813 |
| | |
Liabilities | | |
Payable for investments purchased | $ 189,904 | |
Accrued management fee | 2,808 | |
Distribution fees payable | 2,666 | |
Other payables and accrued expenses | 120,286 | |
Total liabilities | | 315,664 |
| | |
Net Assets | | $ 5,901,149 |
Net Assets consist of: | | |
Paid in capital | | $ 5,688,745 |
Accumulated undistributed net realized gain (loss) on investments and foreign currency transactions | | (16,694) |
Net unrealized appreciation (depreciation) on investments | | 229,098 |
Net Assets | | $ 5,901,149 |
See accompanying notes which are an integral part of the financial statements.
Annual Report
Financial Statements - continued
Statement of Assets and Liabilities - continued
| October 31, 2003 |
| | |
Calculation of Maximum Offering Price
Class A:
Net Asset Value and redemption price per share
($1,122,665 ÷ 108,230 shares) | | $ 10.37 |
| | |
Maximum offering price per share (100/94.25 of $10.37) | | $ 11.00 |
Class T:
Net Asset Value and redemption price per share ($1,545,737 ÷ 149,157 shares) | | $ 10.36 |
| | |
Maximum offering price per share (100/96.50 of $10.36) | | $ 10.74 |
Class B:
Net Asset Value and offering price per share ($1,125,245 ÷ 108,790 shares) A | | $ 10.34 |
| | |
Class C:
Net Asset Value and offering price per share ($1,069,194 ÷ 103,373 shares) A | | $ 10.34 |
| | |
Institutional Class:
Net Asset Value, offering price and redemption price per share ($1,038,308 ÷ 100,001 shares) | | $ 10.38 |
A Redemption price per share is equal to net asset value less any applicable contingent deferred sales charge.
See accompanying notes which are an integral part of the financial statements.
Annual Report
Statement of Operations
| June 17, 2003 (commencement of operations) to October 31, 2003 |
| | |
Investment Income | | |
Dividends | | $ 33,101 |
Interest | | 839 |
Total income | | 33,940 |
| | |
Expenses | | |
Management fee | $ 11,336 | |
Transfer agent fees | 3,917 | |
Distribution fees | 10,732 | |
Accounting fees and expenses | 23,185 | |
Non-interested trustees' compensation | 7 | |
Custodian fees and expenses | 7,116 | |
Registration fees | 35,356 | |
Audit | 25,692 | |
Total expenses before reductions | 117,341 | |
Expense reductions | (76,377) | 40,964 |
Net investment income (loss) | | (7,024) |
Realized and Unrealized Gain (Loss) Net realized gain (loss) on: | | |
Investment securities | (11,493) | |
Foreign currency transactions | (55) | |
Total net realized gain (loss) | | (11,548) |
Change in net unrealized appreciation (depreciation) on investment securities | | 229,098 |
Net gain (loss) | | 217,550 |
Net increase (decrease) in net assets resulting from operations | | $ 210,526 |
See accompanying notes which are an integral part of the financial statements.
Annual Report
Financial Statements - continued
Statement of Changes in Net Assets
| June 17, 2003
(commencement of
operations) to
October 31, 2003 |
Increase (Decrease) in Net Assets | |
Operations | |
Net investment income (loss) | $ (7,024) |
Net realized gain (loss) | (11,548) |
Change in net unrealized appreciation (depreciation) | 229,098 |
Net increase (decrease) in net assets resulting from operations | 210,526 |
Share transactions - net increase (decrease) | 5,690,623 |
Total increase (decrease) in net assets | 5,901,149 |
| |
Net Assets | |
Beginning of period | - |
End of period | $ 5,901,149 |
See accompanying notes which are an integral part of the financial statements.
Annual Report
Financial Highlights - Class A
Years ended October 31, | 2003 F |
Selected Per-Share Data | |
Net asset value, beginning of period | $ 10.00 |
Income from Investment Operations | |
Net investment income (loss) E | - H |
Net realized and unrealized gain (loss) | .37 |
Total from investment operations | .37 |
Net asset value, end of period | $ 10.37 |
Total Return B, C, D | 3.70% |
Ratios to Average Net AssetsG | |
Expenses before expense reductions | 5.52% A |
Expenses net of voluntary waivers, if any | 1.75% A |
Expenses net of all reductions | 1.73% A |
Net investment income (loss) | (.05)% A |
Supplemental Data | |
Net assets, end of period (000 omitted) | $ 1,123 |
Portfolio turnover rate | 108% A |
A Annualized
B Total returns for periods of less than one year are not annualized.
C Total returns would have been lower had certain expenses not been reduced during the periods shown.
D Total returns do not include the effect of the sales charges.
E Calculated based on average shares outstanding during the period.
F For the period June 17, 2003 (commencement of operations) to October 31, 2003.
G Expense ratios reflect operating expenses of the class. Expenses before reductions do not reflect amounts reimbursed by the investment adviser or reductions from brokerage service arrangements or other expense offset arrangements and do not represent the amount paid by the class during periods when reimbursements or reductions occur. Expense ratios before reductions for start-up periods may not be representative of longer-term operating periods. Expenses net of any voluntary waivers reflect expenses after reimbursement by the investment adviser but prior to reductions from brokerage service arrangements or other expense offset arrangements. Expenses net of all reductions represent the net expenses paid by the class.
H Amount represents less than .01 per-share.
See accompanying notes which are an integral part of the financial statements.
Annual Report
Financial Highlights - Class T
Years ended October 31, | 2003 F |
Selected Per-Share Data | |
Net asset value, beginning of period | $ 10.00 |
Income from Investment Operations | |
Net investment income (loss) E | (.01) |
Net realized and unrealized gain (loss) | .37 |
Total from investment operations | .36 |
Net asset value, end of period | $ 10.36 |
Total Return B, C, D | 3.60% |
Ratios to Average Net Assets G | |
Expenses before expense reductions | 5.77% A |
Expenses net of voluntary waivers, if any | 2.00% A |
Expenses net of all reductions | 1.98% A |
Net investment income (loss) | (.30)% A |
Supplemental Data | |
Net assets, end of period (000 omitted) | $ 1,546 |
Portfolio turnover rate | 108% A |
A Annualized
B Total returns for periods of less than one year are not annualized.
C Total returns would have been lower had certain expenses not been reduced during the periods shown.
D Total returns do not include the effect of the sales charges.
E Calculated based on average shares outstanding during the period.
F For the period June 17, 2003 (commencement of operations) to October 31, 2003.
G Expense ratios reflect operating expenses of the class. Expenses before reductions do not reflect amounts reimbursed by the investment adviser or reductions from brokerage service arrangements or other expense offset arrangements and do not represent the amount paid by the class during periods when reimbursements or reductions occur. Expense ratios before reductions for start-up periods may not be representative of longer-term operating periods. Expenses net of any voluntary waivers reflect expenses after reimbursement by the investment adviser but prior to reductions from brokerage service arrangements or other expense offset arrangements. Expenses net of all reductions represent the net expenses paid by the class.
See accompanying notes which are an integral part of the financial statements.
Annual Report
Financial Highlights - Class B
Years ended October 31, | 2003 F |
Selected Per-Share Data | |
Net asset value, beginning of period | $ 10.00 |
Income from Investment Operations | |
Net investment income (loss) E | (.03) |
Net realized and unrealized gain (loss) | .37 |
Total from investment operations | .34 |
Net asset value, end of period | $ 10.34 |
Total Return B, C, D | 3.40% |
Ratios to Average Net Assets G | |
Expenses before expense reductions | 6.24% A |
Expenses net of voluntary waivers, if any | 2.50% A |
Expenses net of all reductions | 2.48% A |
Net investment income (loss) | (.80)% A |
Supplemental Data | |
Net assets, end of period (000 omitted) | $ 1,125 |
Portfolio turnover rate | 108% A |
A Annualized
B Total returns for periods of less than one year are not annualized.
C Total returns would have been lower had certain expenses not been reduced during the periods shown.
D Total returns do not include the effect of the contingent deferred sales charge.
E Calculated based on average shares outstanding during the period.
F For the period June 17, 2003 (commencement of operations) to October 31, 2003.
G Expense ratios reflect operating expenses of the class. Expenses before reductions do not reflect amounts reimbursed by the investment adviser or reductions from brokerage service arrangements or other expense offset arrangements and do not represent the amount paid by the class during periods when reimbursements or reductions occur. Expense ratios before reductions for start-up periods may not be representative of longer-term operating periods. Expenses net of any voluntary waivers reflect expenses after reimbursement by the investment adviser but prior to reductions from brokerage service arrangements or other expense offset arrangements. Expenses net of all reductions represent the net expenses paid by the class.
See accompanying notes which are an integral part of the financial statements.
Annual Report
Financial Highlights - Class C
Years ended October 31, | 2003 F |
Selected Per-Share Data | |
Net asset value, beginning of period | $ 10.00 |
Income from Investment Operations | |
Net investment income (loss) E | (.03) |
Net realized and unrealized gain (loss) | .37 |
Total from investment operations | .34 |
Net asset value, end of period | $ 10.34 |
Total Return B, C, D | 3.40% |
Ratios to Average Net Assets G | |
Expenses before expense reductions | 6.24% A |
Expenses net of voluntary waivers, if any | 2.50% A |
Expenses net of all reductions | 2.48% A |
Net investment income (loss) | (.80)% A |
Supplemental Data | |
Net assets, end of period (000 omitted) | $ 1,069 |
Portfolio turnover rate | 108% A |
A Annualized
B Total returns for periods of less than one year are not annualized.
C Total returns would have been lower had certain expenses not been reduced during the periods shown.
D Total returns do not include the effect of the contingent deferred sales charge.
E Calculated based on average shares outstanding during the period.
F For the period June 17, 2003 (commencement of operations) to October 31, 2003.
G Expense ratios reflect operating expenses of the class. Expenses before reductions do not reflect amounts reimbursed by the investment adviser or reductions from brokerage service arrangements or other expense offset arrangements and do not represent the amount paid by the class during periods when reimbursements or reductions occur. Expense ratios before reductions for start-up periods may not be representative of longer-term operating periods. Expenses net of any voluntary waivers reflect expenses after reimbursement by the investment adviser but prior to reductions from brokerage service arrangements or other expense offset arrangements. Expenses net of all reductions represent the net expenses paid by the class.
See accompanying notes which are an integral part of the financial statements.
Annual Report
Financial Highlights - Institutional Class
Years ended October 31, | 2003 E |
Selected Per-Share Data | |
Net asset value, beginning of period | $ 10.00 |
Income from Investment Operations | |
Net investment income (loss) D | .01 |
Net realized and unrealized gain (loss) | .37 |
Total from investment operations | .38 |
Net asset value, end of period | $ 10.38 |
Total Return B, C | 3.80% |
Ratios to Average Net Assets F | |
Expenses before expense reductions | 5.27% A |
Expenses net of voluntary waivers, if any | 1.50% A |
Expenses net of all reductions | 1.48% A |
Net investment income (loss) | .20% A |
Supplemental Data | |
Net assets, end of period (000 omitted) | $ 1,038 |
Portfolio turnover rate | 108% A |
A Annualized
B Total returns for periods of less than one year are not annualized.
C Total returns would have been lower had certain expenses not been reduced during the periods shown.
D Calculated based on average shares outstanding during the period.
E For the period June 17, 2003 (commencement of operations) to October 31, 2003.
F Expense ratios reflect operating expenses of the class. Expenses before reductions do not reflect amounts reimbursed by the investment adviser or reductions from brokerage service arrangements or other expense offset arrangements and do not represent the amount paid by the class during periods when reimbursements or reductions occur. Expense ratios before reductions for start-up periods may not be representative of longer-term operating periods. Expenses net of any voluntary waivers reflect expenses after reimbursement by the investment adviser but prior to reductions from brokerage service arrangements or other expense offset arrangements. Expenses net of all reductions represent the net expenses paid by the class.
See accompanying notes which are an integral part of the financial statements.
Annual Report
Notes to Financial Statements
For the period ended October 31, 2003
1. Significant Accounting Policies.
Fidelity Advisor Value Leaders Fund (the fund) is a fund of Fidelity Advisor Series VIII (the trust) and is authorized to issue an unlimited number of shares. The trust is registered under the Investment Company Act of 1940, as amended (the 1940 Act), as an open-end management investment company organized as a Massachusetts business trust.
The fund offers Class A, Class T, Class B, Class C, and Institutional Class shares, each of which has equal rights as to assets and voting privileges. Each class has exclusive voting rights with respect to matters that affect that class. Class B shares will automatically convert to Class A shares after a holding period of seven years from the initial date of purchase. Investment income, realized and unrealized capital gains and losses, the common expenses of the fund, and certain fund-level expense reductions, if any, are allocated on a pro rata basis to each class based on the relative net assets of each class to the total net assets of the fund. Each class differs with respect to transfer agent and distribution and service plan fees incurred. Certain expense reductions also differ by class.
The financial statements have been prepared in conformity with accounting principles generally accepted in the United States of America, which require management to make certain estimates and assumptions at the date of the financial statements. The following summarizes the significant accounting policies of the fund:
Security Valuation. Net asset value per share (NAV calculation) is calculated as of the close of business of the New York Stock Exchange, normally 4:00 p.m. Eastern time. Equity securities for which market quotations are available are valued at the last sale price or official closing price (closing bid price or last evaluated quote if no sale has occurred) on the primary market or exchange on which they trade. If an event that is expected to materially affect the value of a security occurs after the close of an exchange or market on which that security trades, but prior to the NAV calculation, then that security will be fair valued taking the event into account. Securities (including restricted securities) for which market quotations are not readily available are valued at their fair value as determined in good faith under consistently applied procedures under the general supervision of the Board of Trustees. Price movements in futures contracts and ADRs, market and trading trends, the bid/ask quotes of brokers and off-exchange institutional trading may be reviewed in the course of making a good faith determination of a security's fair value. Short-term securities with remaining maturities of sixty days or less for which quotations are not readily available are valued on the basis of amortized cost. Investments in open-end investment companies are valued at their net asset value each business day.
Foreign Currency. The fund uses foreign currency contracts to facilitate transactions in foreign-denominated securities. Losses from these transactions may arise from changes in the value of the foreign currency or if the counterparties do not perform under the contracts' terms.
Annual Report
Notes to Financial Statements - continued
1. Significant Accounting Policies - continued
Annual Report
Foreign Currency - continued
Foreign denominated assets, including investment securities, and liabilities are translated into U.S. dollars at the exchange rate at period end. Purchases and sales of investment securities, income and dividends received and expenses denominated in foreign currencies are translated into U.S. dollars at the exchange rate in effect on the transaction date.
The effects of exchange rate fluctuations on investments are included with the net realized and unrealized gain (loss) on investment securities. Other foreign currency transactions resulting in realized and unrealized gain (loss) are disclosed separately.
Investment Transactions and Income. Security transactions are accounted for as of trade date. Gains and losses on securities sold are determined on the basis of identified cost. Dividend income is recorded on the ex-dividend date, except for certain dividends from foreign securities where the ex-dividend date may have passed, which are recorded as soon as the fund is informed of the ex-dividend date. Non-cash dividends included in dividend income, if any, are recorded at the fair market value of the securities received. The fund estimates the components of distributions received from Real Estate Investment Trusts (REITs). Distributions received in excess of income are recorded as a reduction of cost of investments and/or realized gain. Interest income is accrued as earned. Interest income includes coupon interest and amortization of premium and accretion of discount on debt securities, which is accrued using the interest method.. Investment income is recorded net of foreign taxes withheld where recovery of such taxes is uncertain.
Expenses. Most expenses of the trust can be directly attributed to a fund. Expenses which cannot be directly attributed are apportioned among the funds in the trust.
Income Tax Information and Distributions to Shareholders. Each year the fund intends to qualify as a regulated investment company by distributing all of its taxable income and realized gains under Subchapter M of the Internal Revenue Code. As a result, no provision for income taxes is required in the accompanying financial statements. Foreign taxes are provided for based on each fund's understanding of the tax rules and rates that exist in the foreign markets in which it invests. Income dividends and capital gain distributions are declared separately for each class. Distributions are recorded on the ex-dividend date.
Income and capital gain distributions are determined in accordance with income tax regulations, which may differ from generally accepted accounting principles. Capital accounts within the financial statements are adjusted for permanent and temporary book and tax differences. These adjustments have no impact on net assets or the results of operations. Temporary differences will reverse in a subsequent period. These differences are primarily due to foreign currency transactions, net operating losses and losses deferred due to wash sales.
Annual Report
Notes to Financial Statements - continued
1. Significant Accounting Policies - continued
Annual Report
Income Tax Information and Distributions to Shareholders - continued
The tax-basis components of distributable earnings and the federal tax cost as of period end were as follows:
Unrealized appreciation | $ 391,047 | | |
Unrealized depreciation | (178,644) | |
Net unrealized appreciation (depreciation) | 212,403 | |
Cost for federal income tax purposes | $ 5,810,398 | |
2. Operating Policies.
Repurchase Agreements. Fidelity Management & Research Company (FMR) has received an Exemptive Order from the Securities and Exchange Commission (the SEC) which permits the fund and other affiliated entities of FMR to transfer uninvested cash balances into joint trading accounts. These accounts are then invested in repurchase agreements that are collateralized by U.S. Treasury or Government obligations. The fund may also invest directly with institutions, in repurchase agreements that are collateralized by commercial paper obligations and corporate obligations. Collateral is held in segregated accounts with custodian banks and may be obtained in the event of a default of the counterparty. Collateral is marked-to-market daily and maintained at a value at least equal to the principal amount of the repurchase agreement (including accrued interest).
3. Purchases and Sales of Investments.
Information regarding purchases and sales of securities is included under the caption "Other Information" at the end of the fund's Schedule of Investments.
4. Fees and Other Transactions with Affiliates.
Management Fee. FMR and its affiliates provide the fund with investment management related services for which the fund pays a monthly management fee. The management fee is the sum of an individual fund fee rate that is based on an annual rate of .30% of the fund's average net assets and a group fee rate that averaged .28% during the period. The group fee rate is based upon the average net assets of all the mutual funds advised by FMR. The group fee rate decreases as assets under management increase and increases as assets under management decrease. For the period, the total annualized management fee rate was .58% of the fund's average net assets.
Distribution and Service Plan. In accordance with Rule 12b-1 of the 1940 Act, the Fund has adopted separate Distribution and Service Plans for each class of shares, except for the Institutional Class. Certain classes pay Fidelity Distributors Corporation
Annual Report
Notes to Financial Statements - continued
4. Fees and Other Transactions with Affiliates - continued
Distribution and Service Plan - continued
(FDC), an affiliate of FMR, separate Distribution and Service Fees, each of which is based on an annual percentage of each class' average net assets. Class A and Class T Plans also authorize the use of brokerage commissions to pay distribution expenses. This practice has been discontinued and no commissions incurred after June 30, 2003 have been used to pay distribution expenses. In addition, FDC may pay financial intermediaries for selling shares of the fund and providing shareholder support services. For the period, the Distribution and Service Fee rates, the total amounts paid to and retained by FDC and the amount of distribution expenses paid with brokerage commissions were as follows:
| Distribution
Fee | Service
Fee | Paid to
FDC | Retained
by FDC |
Class A | - | .25% | $ 956 | $ 926 |
Class T | .25% | .25% | 2,226 | 1,839 |
Class B | .75% | .25% | 3,817 | 3,787 |
Class C | .75% | .25% | 3,733 | 3,720 |
| | | $ 10,732 | $ 10,272 |
Sales Load. FDC receives a front-end sales charge of up to 5.75% for selling Class A shares, and 3.50% for selling Class T shares of the fund. FDC receives the proceeds of contingent deferred sales charges levied on Class A, Class T, Class B, and Class C redemptions. These charges depend on the holding period. The deferred sales charges range from 5% to 1% for Class B, 1% for Class C, and .25% for certain purchases of Class A and Class T shares.
For the period, sales charge amounts retained by FDC were as follows:
| Retained
by FDC | |
Class A | $ 358 | |
Class T | 559 | |
Class B* | - | |
Class C* | - | |
| $ 917 | |
* When Class B and Class C shares are initially sold, FDC pays commissions from its own resources to financial intermediaries through which the sales
are made.
Annual Report
4. Fees and Other Transactions with Affiliates - continued
Transfer Agent Fees. Fidelity Investments Institutional Operations Company, Inc. (FIIOC), an affiliate of FMR, is the transfer, dividend disbursing and shareholder servicing agent (collectively referred to as the transfer agent) for each class of the fund. FIIOC receives account fees and asset-based fees that vary according to the account size and type of account of the shareholders of the respective classes of the fund. FIIOC pays for typesetting, printing and mailing of all shareholder reports, except proxy statements. For the period, the following amounts were paid to FIIOC:
| Amount | % of
Average
Net Assets* |
Class A | $ 777 | .20 |
Class T | 957 | .21 |
Class B | 765 | .19 |
Class C | 715 | .19 |
Institutional Class | 703 | .18 |
| $ 3,917 | |
* Annualized
Accounting Fees. Fidelity Service Company, Inc. (FSC), an affiliate of FMR, maintains the fund's accounting records. The fee is based on the level of average net assets for the month plus out-of-pocket expenses.
Brokerage Commissions. The fund placed a portion of its portfolio transactions with brokerage firms which are affiliates of the investment adviser. The commissions paid to these affiliated firms are shown under the caption "Other Information" at the end of the fund's Schedule of Investments.
Annual Report
Notes to Financial Statements - continued
5. Expense Reductions.
FMR agreed to reimburse the classes of the fund to the extent operating expenses exceeded certain levels of average net assets as noted in the table below. Some expenses, for example interest expense, are excluded from this reimbursement.
| Expense
Limitations | Reimbursement
from adviser |
| | |
Class A | 1.75% | $ 14,917 |
Class T | 2.00% | 17,442 |
Class B | 2.50% | 14,783 |
Class C | 2.50% | 14,415 |
Institutional Class | 1.50% | 14,440 |
| | $ 75,997 |
Many of the brokers with whom FMR places trades on behalf of the fund provided services to the fund in addition to trade execution. These services may include payments of expenses on behalf of the fund to support distribution of fund shares for Class A and Class T ("Distribution Expense Reduction") and to pay other fund expenses, such as transfer agent fees ("Other Expense Reduction") collectively referred to as "Brokerage Service Arrangements" in the accompanying table. Brokerage service arrangements generally benefits all shareholders of each class by reducing fund expenses. Each of Class A and Class T shareholders' Other Expense Reduction benefit is reduced by the amount of any Distribution Expense Reduction. In addition, through arrangements with the fund's custodian, credits realized as a result of uninvested cash balances were used to reduce the fund's expenses. All of the applicable expense reductions are noted in the table below.
| Brokerage Service Arrangements | |
| Distribution
expense
reduction | Other
expense
reduction | Custody
expense
reduction |
| | | |
Fund Level | $ - | $ 349 | $ 31 |
Annual Report
6. Other Information.
At the end of the period, FMR or its affiliates were the owners of record of 88% of the total outstanding shares of the fund.
7. Share Transactions.
Transactions for each class of shares were as follows:
| Shares | Dollars |
| June 17, 2003 (commencement of operations) to October 31, 2003 | June 17, 2003 (commencement of operations) to October 31, 2003 |
Class A | | |
Shares sold | 108,230 | $ 1,082,566 |
Net increase (decrease) | 108,230 | $ 1,082,566 |
Class T | | |
Shares sold | 150,758 | $ 1,501,803 |
Shares redeemed | (1,601) | (15,902) |
Net increase (decrease) | 149,157 | $ 1,485,901 |
Class B | | |
Shares sold | 108,790 | $ 1,088,261 |
Net increase (decrease) | 108,790 | $ 1,088,261 |
Class C | | |
Shares sold | 103,373 | $ 1,033,885 |
Net increase (decrease) | 103,373 | $ 1,033,885 |
Institutional Class | | |
Shares sold | 100,001 | $ 1,000,010 |
Net increase (decrease) | 100,001 | $ 1,000,010 |
Annual Report
Report of Independent Auditors
To the Trustees of Fidelity Advisor Series VIII and the Shareholders of Fidelity Advisor Value Leaders Fund.
In our opinion, the accompanying statement of assets and liabilities, including the schedule of investments, and the related statements of operations and of changes in net assets and the financial highlights present fairly, in all material respects, the financial position of Fidelity Advisor Value Leaders Fund (a fund of Fidelity Advisor Series VIII) at October 31, 2003 and the results of its operations, the changes in its net assets and the financial highlights for the period indicated, in conformity with accounting principles generally accepted in the United States of America. These financial statements and financial highlights (hereafter referred to as "financial statements") are the responsibility of the Fidelity Advisor Value Leaders Fund's management; our responsibility is to express an opinion on these financial statements based on our audits. We conducted our audit of these financial statements in accordance with auditing standards generally accepted in the United States of America which require that we plan and perform the audit to obtain reasonable assurance about whether the financial statements are free of material misstatement. An audit includes examining, on a test basis, evidence supporting the amounts and disclosures in the financial statements, assessing the accounting principles used and significant estimates made by management, and evaluating the overall financial statement presentation. We believe that our audit, which included confirmation of securities at October 31, 2003 by correspondence with the custodian and brokers, provides a reasonable basis for our opinion.
/s/PricewaterhouseCoopers LLP
PricewaterhouseCoopers LLP
Boston, Massachusetts
December 11, 2003
Annual Report
Trustees and Officers
The Trustees, Members of the Advisory Board, and executive officers of the trust and fund, as applicable, are listed below. The Board of Trustees governs the fund and is responsible for protecting the interests of shareholders. The Trustees are experienced executives who meet periodically throughout the year to oversee the fund's activities, review contractual arrangements with companies that provide services to the fund, and review the fund's performance. Except for William O. McCoy, each of the Trustees oversees 289 funds advised by FMR or an affiliate. Mr. McCoy oversees 291 funds advised by FMR or an affiliate.
The Trustees hold office without limit in time except that (a) any Trustee may resign; (b) any Trustee may be removed by written instrument, signed by at least two-thirds of the number of Trustees prior to such removal; (c) any Trustee who requests to be retired or who has become incapacitated by illness or injury may be retired by written instrument signed by a majority of the other Trustees; and (d) any Trustee may be removed at any special meeting of shareholders by a two-thirds vote of the outstanding voting securities of the trust. In any event, each non-interested Trustee shall retire not later than the last day of the calendar year in which his or her 72nd birthday occurs. The executive officers and Advisory Board Members hold office without limit in time, except that any officer and Advisory Board Member may resign or may be removed by a vote of a majority of the Trustees at any regular meeting or any special meeting of the Trustees. Except as indicated, each individual has held the office shown or other offices in the same company for the past five years.
The fund's Statement of Additional Information (SAI) includes more information about the Trustees. To request a free copy, call Fidelity at 1-877-208-0098.
Interested Trustees*:
Correspondence intended for each Trustee who is an "interested person" (as defined in the 1940 Act) may be sent to 82 Devonshire Street, Boston, Massachusetts 02109.
Name, Age; Principal Occupation |
Edward C. Johnson 3d (73)** |
| Year of Election or Appointment: 1983 Mr. Johnson is Chairman of the Board of Trustees. Mr. Johnson serves as Chief Executive Officer, Chairman, and a Director of FMR Corp.; a Director and Chairman of the Board and of the Executive Committee of FMR; Chairman and a Director of Fidelity Management & Research (Far East) Inc.; Chairman (1998) and a Director of Fidelity Investments Money Management, Inc.; and Chairman (2001) and a Director (2000) of FMR Co., Inc. |
Abigail P. Johnson (41)** |
| Year of Election or Appointment: 2001 Senior Vice President of Advisor Value Leaders (2003). Ms. Johnson also serves as Senior Vice President of other Fidelity funds (2001). She is President and a Director of FMR (2001), Fidelity Investments Money Management, Inc. (2001), FMR Co., Inc. (2001), and a Director of FMR Corp. Previously, Ms. Johnson managed a number of Fidelity funds. |
Laura B. Cronin (49) |
| Year of Election or Appointment: 2003 Ms. Cronin is an Executive Vice President (2002) and Chief Financial Officer (2002) of FMR Corp. and is a member of the Fidelity Management Committee (2003). Previously, Ms. Cronin served as Vice President of Finance of FMR (1997-1999), and Chief Financial Officer of FMR (1999-2001), Fidelity Personal Investments (2001), and Fidelity Brokerage Company (2001-2002). |
Robert L. Reynolds (51) |
| Year of Election or Appointment: 2003 Mr. Reynolds is a Director (2003) and Chief Operating Officer (2002) of FMR Corp. and is the head of the Fidelity Management Committee (2003). He also serves on the Board at Fidelity Investments Canada, Ltd. (2000). Previously, Mr. Reynolds served as President of Fidelity Investments Institutional Retirement Group (1996-2000). |
* Trustees have been determined to be "Interested Trustees" by virtue of, among other things, their affiliation with the trust or various entities under common control with FMR.
** Edward C. Johnson 3d, Trustee, is Abigail P. Johnson's father.
Annual Report
Non-Interested Trustees:
Correspondence intended for each non-interested Trustee (that is, the Trustees other than the Interested Trustees) may be sent to Fidelity Investments, P.O. Box 55235, Boston, Massachusetts 02205-5235.
Name, Age; Principal Occupation |
J. Michael Cook (61) |
| Year of Election or Appointment: 2001 Prior to Mr. Cook's retirement in May 1999, he served as Chairman and Chief Executive Officer of Deloitte & Touche LLP (accounting/consulting), Chairman of the Deloitte & Touche Foundation, and a member of the Board of Deloitte Touche Tohmatsu. He currently serves as a Director of Comcast (telecommunications, 2002), International Flavors & Fragrances, Inc. (2000), Rockwell Automation (2000) and The Dow Chemical Company (2000). He is a Member of the Diversity Advisory Council of Marakon (2003) and the Advisory Board of the Directorship Search Group, Chairman Emeritus of the Board of Catalyst (a leading organization for the advancement of women in business), and is Chairman of the Accountability Advisory Council to the Comptroller General of the United States. He also serves as a Member of the Advisory Board of the Graduate School of Business of the University of Florida, his alma mater. |
Ralph F. Cox (71) |
| Year of Election or Appointment: 1991 Mr. Cox is President of RABAR Enterprises (management consulting for the petroleum industry). Prior to February 1994, he was President of Greenhill Petroleum Corporation (petroleum exploration and production). Until March 1990, Mr. Cox was President and Chief Operating Officer of Union Pacific Resources Company (exploration and production). He is a Director of CH2M Hill Companies (engineering), and Abraxas Petroleum (petroleum exploration and production, 1999). In addition, he is a member of advisory boards of Texas A&M University and the University of Texas at Austin. |
Phyllis Burke Davis (71) |
| Year of Election or Appointment: 1992 Mrs. Davis is retired from Avon Products, Inc. (consumer products) where she held various positions including Senior Vice President of Corporate Affairs and Group Vice President of U.S. product marketing, sales, distribution, and manufacturing. Mrs. Davis is a member of the Board of Directors of the Southampton Hospital in Southampton, N.Y. (1998). Previously, she served as a Director of BellSouth Corporation (telecommunications), Eaton Corporation (diversified industrial), the TJX Companies, Inc. (retail stores), Hallmark Cards, Inc., and Nabisco Brands, Inc. |
Robert M. Gates (60) |
| Year of Election or Appointment: 1997 Dr. Gates is President of Texas A&M University (2002). He was Director of the Central Intelligence Agency (CIA) from 1991 to 1993. From 1989 to 1991, Dr. Gates served as Assistant to the President of the United States and Deputy National Security Advisor. Dr. Gates is a Director of NACCO Industries, Inc. (mining and manufacturing), and Parker Drilling Co., Inc. (drilling and rental tools for the energy industry, 2001). He also serves as a member of the Advisory Board of VoteHere.net (secure internet voting, 2001). Previously, Dr. Gates served as a Director of LucasVarity PLC (automotive components and diesel engines), a Director of TRW Inc. (automotive, space, defense, and information technology), and Dean of the George Bush School of Government and Public Service at Texas A&M University (1999-2001). Dr. Gates also is a Trustee of the Forum for International Policy. |
Donald J. Kirk (70) |
| Year of Election or Appointment: 1987 Mr. Kirk is a Governor of the American Stock Exchange (2001), a Trustee and former Chairman of the Board of Trustees of the Greenwich Hospital Association, a Director of the Yale-New Haven Health Services Corp. (1998), and a Director Emeritus and former Chairman of the Board of Directors of National Arts Strategies Inc. Mr. Kirk was an Executive-in-Residence (1995-2000) and a Professor (1987-1995) at Columbia University Graduate School of Business. Prior to 1987, he was Chairman of the Financial Accounting Standards Board. Previously, Mr. Kirk served as a Governor of the National Association of Securities Dealers, Inc. (1996-2002), a member and Vice Chairman of the Public Oversight Board of the American Institute of Certified Public Accountants' SEC Practice Section (1995-2002), a Director of General Re Corporation (reinsurance, 1987-1998) and as a Director of Valuation Research Corp. (appraisals and valuations). |
Marie L. Knowles (57) |
| Year of Election or Appointment: 2001 Prior to Ms. Knowles' retirement in June 2000, she served as Executive Vice President and Chief Financial Officer of Atlantic Richfield Company (ARCO) (diversified energy, 1996-2000). From 1993 to 1996, she was a Senior Vice President of ARCO and President of ARCO Transportation Company. She served as a Director of ARCO from 1996 to 1998. She currently serves as a Director of Phelps Dodge Corporation (copper mining and manufacturing), URS Corporation (multidisciplinary engineering, 1999), and McKesson Corporation (healthcare service, 2002). Ms. Knowles is a Trustee of the Brookings Institution and the Catalina Island Conservancy and also serves as a member of the Advisory Board for the School of Engineering of the University of Southern California. |
Ned C. Lautenbach (59) |
| Year of Election or Appointment: 2000 Mr. Lautenbach has been a partner of Clayton, Dubilier & Rice, Inc. (private equity investment firm) since September 1998. Previously, Mr. Lautenbach was with the International Business Machines Corporation (IBM) from 1968 until his retirement in 1998. He was most recently Senior Vice President and Group Executive of Worldwide Sales and Services. From 1993 to 1995, he was Chairman of IBM World Trade Corporation, and from 1994 to 1998 was a member of IBM's Corporate Executive Committee. Mr. Lautenbach serves as Chairman and as a Director (1998) of Acterna Corporation (communications test equipment). He is also Co-Chairman of Covansys, Inc. (global provider of business and technology solutions, 2000). In addition, he is a Director of Eaton Corporation (diversified industrial) and the Philharmonic Center for the Arts in Naples, Florida (1999). He also is a member of the Council on Foreign Relations. |
Marvin L. Mann (70) |
| Year of Election or Appointment: 1993 Mr. Mann is Chairman of the non-interested Trustees (2001). He is Chairman Emeritus of Lexmark International, Inc. (computer peripherals) where he served as CEO until April 1998 and retired as Chairman May 1999, and remains a member of the Board. Prior to 1991, he held the positions of Vice President of International Business Machines Corporation (IBM) and President and General Manager of various IBM divisions and subsidiaries. Mr. Mann is a Board member of Imation Corp. (imaging and information storage) and Acterna Corporation (communications test equipment, 1999). He is also a member of the Director Services Committee of the Investment Company Institute. In addition, Mr. Mann is a member of the President's Cabinet at the University of Alabama and the Board of Visitors of the Culverhouse College of Commerce and Business Administration at the University of Alabama. |
William O. McCoy (70) |
| Year of Election or Appointment: 1997 Prior to his retirement in December 1994, Mr. McCoy was Vice Chairman of the Board of BellSouth Corporation (telecommunications) and President of BellSouth Enterprises. He is currently a Director of Liberty Corporation (holding company), Duke Realty Corporation (real estate), Progress Energy, Inc. (electric utility), and Acterna Corporation (communications test equipment, 1999). He is also a partner of Franklin Street Partners (private investment management firm) and a member of the Research Triangle Foundation Board. In addition, Mr. McCoy served as the Interim Chancellor (1999-2000) and a member of the Board of Visitors (1994-1998) for the University of North Carolina at Chapel Hill and currently serves on the Board of Directors of the University of North Carolina Health Care System and the Board of Visitors of the Kenan-Flagler Business School (University of North Carolina at Chapel Hill). He also served as Vice President of Finance for the University of North Carolina (16-school system, 1995-1998). |
William S. Stavropoulos (64) |
| Year of Election or Appointment: 2001 Mr. Stavropoulos is Chairman of the Board, President and CEO (2002), and Chairman of the Executive Committee (2000) and a Director of The Dow Chemical Company. Since joining The Dow Chemical Company in 1967, Mr. Stavropoulos served in numerous senior management positions, including President (1993-2000) and Chief Executive Officer (1995-2000). Currently, he is a Director of NCR Corporation (data warehousing and technology solutions), BellSouth Corporation (telecommunications), Chemical Financial Corporation, and Maersk Inc. (industrial conglomerate, 2002). He also serves as a member of the Board of Trustees of the American Enterprise Institute for Public Policy Research. In addition, Mr. Stavropoulos is a member of The Business Council, J.P. Morgan International Council, World Business Council for Sustainable Development, and the University of Notre Dame Advisory Council for the College of Science. |
Annual Report
Trustees and Officers - continued
Advisory Board Members and Executive Officers:
Correspondence intended for Dr. Heilmeier may be sent to Fidelity Investments, P.O. Box 55235, Boston, Massachusetts 02205-5235. Correspondence intended for each executive officer and Mr. Lynch may be sent to 82 Devonshire Street, Boston, Massachusetts 02109.
Name, Age; Principal Occupation |
George H. Heilmeier (67) |
| Year of Election or Appointment: 2003 Member of the Advisory Board of Fidelity Advisor Series VIII. Dr. Heilmeier is Chairman Emeritus of Telcordia Technologies (communication software and systems), where prior to his retirement, he served as company Chairman and Chief Executive Officer. He currently serves on the Boards of Directors of The Mitre Corporation (systems engineering and information technology support for the government), INET Technologies Inc. (telecommunications network surveillance, 2001) and Teletech Holdings (customer management services, 1998). He is Chairman of the General Motors Technology Advisory Committee and a Life Fellow of the IEEE (2000). Dr. Heilmeier is a member of the Defense Science Board and the National Security Agency Advisory Board. He is also a member of the National Academy of Engineering, the American Academy of Arts and Sciences and The Board of Overseers of the School of Engineering and Applied Science of the University of Pennsylvania. Previously, Dr. Heilmeier served as a Director of TRW Inc. (automotive, space, defense, and information technology, 1992-2002) and Compaq (1994-2002). |
Peter S. Lynch (60) |
| Year of Election or Appointment: 2003 Member of the Advisory Board of Fidelity Advisor Series VIII. Vice Chairman and a Director of FMR, and Vice Chairman (2001) and a Director (2000) of FMR Co., Inc. Previously, Mr. Lynch served as a Trustee of the Fidelity funds (1990-2003). Prior to May 31, 1990, he was a Director of FMR and Executive Vice President of FMR (a position he held until March 31, 1991), Vice President of Fidelity® Magellan® Fund and FMR Growth Group Leader, and Managing Director of FMR Corp. Mr. Lynch was also Vice President of Fidelity Investments Corporate Services. In addition, he serves as a Trustee of Boston College, Massachusetts Eye & Ear Infirmary, Historic Deerfield, John F. Kennedy Library, and the Museum of Fine Arts of Boston. |
Bart A. Grenier (44) |
| Year of Election or Appointment: 2003 Vice President of Advisor Value Leaders. Mr. Grenier also serves as Vice President of certain Equity Funds (2001), a position he previously held from 1999 to 2000, and Vice President of certain High Income Funds (2002). He is Senior Vice President of FMR (1999) and FMR Co., Inc. (2001), and President and Director of Strategic Advisers, Inc. (2002). He also heads Fidelity's Asset Allocation Group (2000), Fidelity's Growth and Income Group (2001), Fidelity's Value Group (2001), and Fidelity's High Income Division (2001). Previously, Mr. Grenier served as President of Fidelity Ventures (2000), Vice President of certain High Income Funds (1997-2000), High Income Division Head (1997-2000), Group Leader of the Income-Growth and Asset Allocation-Income Groups (1996-2000), and Assistant Equity Division Head (1997-2000). |
Eric D. Roiter (54) |
| Year of Election or Appointment: 2003 Secretary of Advisor Value Leaders. He also serves as Secretary of other Fidelity funds (1998); Vice President, General Counsel, and Clerk of FMR Co., Inc. (2001) and FMR (1998); Vice President and Clerk of FDC (1998); Assistant Clerk of Fidelity Management & Research (U.K.) Inc. (2001) and Fidelity Management & Research (Far East) Inc. (2001); and Assistant Secretary of Fidelity Investments Money Management Inc. (2001). Prior to joining Fidelity, Mr. Roiter was with the law firm of Debevoise & Plimpton, as an associate (1981-1984) and as a partner (1985-1997), and served as an Assistant General Counsel of the U.S. Securities and Exchange Commission (1979-1981). Mr. Roiter is an Adjunct Member, Faculty of Law, at Boston College Law School (2003). |
Stuart Fross (44) |
| Year of Election or Appointment: 2003 Assistant Secretary of Advisor Value Leaders. Mr. Fross also serves as Assistant Secretary of other Fidelity funds (2003) and is an employee of FMR. |
Maria F. Dwyer (44) |
| Year of Election or Appointment: 2003 President and Treasurer of Advisor Value Leaders. Ms. Dwyer also serves as President and Treasurer of other Fidelity funds (2002) and is a Vice President (1999) and an employee (1996) of FMR. Prior to joining Fidelity, Ms. Dwyer served as Director of Compliance for MFS Investment Management. |
Timothy F. Hayes (52) |
| Year of Election or Appointment: 2003 Chief Financial Officer of Advisor Value Leaders. Mr. Hayes also serves as Chief Financial Officer of other Fidelity funds (2002). Recently he was appointed President of Fidelity Service Company (2003) where he also serves as a Director. Mr. Hayes also serves as President of Fidelity Investments Operations Group (FIOG, 2002), which includes Fidelity Pricing and Cash Management Services Group (FPCMS), where he was appointed President in 1998. Previously, Mr. Hayes served as Chief Financial Officer of Fidelity Investments Corporate Systems and Service Group (1998) and Fidelity Systems Company (1997-1998). |
John R. Hebble (45) |
| Year of Election or Appointment: 2003 Deputy Treasurer of Advisor Value Leaders. Mr. Hebble also serves as Deputy Treasurer of other Fidelity funds (2003), and is an employee of FMR. Before joining Fidelity Investments, Mr. Hebble worked at Deutsche Asset Management where he served as Director of Fund Accounting (2002-2003) and Assistant Treasurer of the Scudder Funds (1998-2003). |
John H. Costello (57) |
| Year of Election or Appointment: 2003 Assistant Treasurer of Advisor Value Leaders. Mr. Costello also serves as Assistant Treasurer of other Fidelity funds and is an employee of FMR. |
Francis V. Knox, Jr. (56) |
| Year of Election or Appointment: 2003 Assistant Treasurer of Advisor Value Leaders. Mr. Knox also serves as Assistant Treasurer of other Fidelity funds (2002), and is a Vice President and an employee of FMR. Previously, Mr. Knox served as Vice President of Investment & Advisor Compliance (1990-2001), and Compliance Officer of Fidelity Management & Research (U.K.) Inc. (1992-2002), Fidelity Management & Research (Far East) Inc. (1991-2002), and FMR Corp. (1995-2002). |
Mark Osterheld (48) |
| Year of Election or Appointment: 2003 Assistant Treasurer of Advisor Value Leaders. Mr. Osterheld also serves as Assistant Treasurer of other Fidelity funds (2002) and is an employee of FMR. |
Thomas J. Simpson (45) |
| Year of Election or Appointment: 2003 Assistant Treasurer of Advisor Value Leaders. Mr. Simpson is Assistant Treasurer of other Fidelity funds (2000) and an employee of FMR (1996). Prior to joining FMR, Mr. Simpson was Vice President and Fund Controller of Liberty Investment Services (1987-1995). |
Annual Report
Annual Report
Annual Report
Annual Report
Investment Adviser
Fidelity Management & Research Company
Boston, MA
Investment Sub-Advisers
FMR Co., Inc.
Fidelity Management & Research
(U.K.) Inc.
Fidelity Management & Research
(Far East) Inc.
Fidelity International
Investment Advisors
Fidelity Investments Japan Limited
Fidelity International Investment Advisors (U.K.) Limited
General Distributor
Fidelity Distributors Corporation
Boston, MA
Transfer and Shareholder
Servicing Agents
Fidelity Investments Institutional Operations Company, Inc.
Boston, MA
Custodian
State Street Bank and Trust Company
Quincy, MA
Annual Report
Fidelity Advisor Aggressive Growth Fund |
Fidelity Advisor Asset Allocation Fund |
Fidelity Advisor Balanced Fund |
Fidelity Advisor Biotechnology Fund |
Fidelity Advisor California Municipal Income Fund |
Fidelity Advisor Consumer Industries Fund |
Fidelity Advisor Cyclical Industries Fund |
Fidelity Advisor Developing Communications Fund |
Fidelity Advisor Diversified International Fund |
Fidelity Advisor Dividend Growth Fund |
Fidelity Advisor Dynamic Capital Appreciation Fund |
Fidelity Advisor Electronics Fund |
Fidelity Advisor Emerging Asia Fund |
Fidelity Advisor Emerging Markets Income Fund |
Fidelity Advisor Equity Growth Fund |
Fidelity Advisor Equity Income Fund |
Fidelity Advisor Equity Value Fund |
Fidelity Advisor Europe Capital Appreciation Fund |
Fidelity Advisor Fifty Fund |
Fidelity Advisor Financial Services Fund |
Fidelity Advisor Floating Rate High Income Fund |
Fidelity Advisor Freedom Income FundSM |
Fidelity Advisor Freedom 2010 FundSM |
Fidelity Advisor Freedom 2020 FundSM |
Fidelity Advisor Freedom 2030 FundSM |
Fidelity Advisor Freedom 2040 FundSM |
Fidelity Advisor Global Equity Fund |
Fidelity Advisor Government Investment Fund |
Fidelity Advisor Growth & Income Fund |
Fidelity Advisor Growth Opportunities |
Fidelity Advisor Health Care Fund |
Fidelity Advisor High Income Advantage Fund |
Fidelity Advisor High Income Fund |
Fidelity Advisor Inflation-Protected Bond Fund |
Fidelity Advisor Intermediate Bond Fund |
Fidelity Advisor International Capital Appreciation Fund |
Fidelity Advisor International Small Cap Fund |
Fidelity Advisor Investment Grade Bond Fund |
Fidelity Advisor Japan Fund |
Fidelity Advisor Korea Fund |
Fidelity Advisor Large Cap Fund |
Fidelity Advisor Latin America Fund |
Fidelity Advisor Leveraged Company Stock Fund |
Fidelity Advisor Mid Cap Fund |
Fidelity Advisor Mortgage Securities Fund |
Fidelity Advisor Municipal Income Fund |
Fidelity Advisor Natural Resources Fund |
Fidelity Advisor New Insights Fund |
Fidelity Advisor New York Municipal Income Fund |
Fidelity Advisor Overseas Fund |
Fidelity Advisor Real Estate Fund |
Fidelity Advisor Short Fixed-Income Fund |
Fidelity Advisor Short Intermediate Municipal Income Fund |
Fidelity Advisor Small Cap Fund |
Fidelity Advisor Strategic Growth Fund |
Fidelity Advisor Strategic Income Fund |
Fidelity Advisor Tax Managed Stock Fund |
Fidelity Advisor Technology Fund |
Fidelity Advisor Telecommunications & Utilities Growth Fund |
Fidelity Advisor Value Leaders Fund |
Fidelity Advisor Value Strategies Fund |
Prime Fund |
Tax-Exempt Fund |
Treasury Fund |
(Fidelity Investment logo)(registered trademark)
Corporate Headquarters
82 Devonshire St., Boston, MA 02109
www.fidelity.com
AVLF-UANN-1203
1.793576.100
Fidelity® Advisor
Value Leaders
Fund - Institutional Class
Annual Report
October 31, 2003
(2_fidelity_logos) (Registered_Trademark)
Contents
Chairman's Message | <Click Here> | Ned Johnson's message to shareholders. |
Performance | <Click Here> | How the fund has done over time. |
Investment Summary | <Click Here> | A summary of the fund's investments. |
Investments | <Click Here> | A complete list of the fund's investments with their market values. |
Financial Statements | <Click Here> | Statements of assets and liabilities, operations, and changes in net assets,
as well as financial highlights. |
Notes | <Click Here> | Notes to the financial statements. |
Auditors' Opinion | <Click Here> | |
Trustees and Officers | <Click Here> | |
For a free copy of the fund's proxy voting guidelines call 1-877-208-0098 or visit the Securities and Exchange Commission (SEC)'s web site at www.sec.gov.
Third party marks appearing herein are the property of their respective owners.
All other marks appearing herein are registered or unregistered trademarks or service marks of FMR Corp. or an affiliated company.
(Recycle graphic) This report is printed on recycled paper using soy-based inks.
This report and the financial statements contained herein are submitted for the general information of the shareholders of the fund. This report is not authorized for distribution to prospective investors in the fund unless preceded or accompanied by an effective prospectus.
Mutual fund shares are not deposits or obligations of, or guaranteed by, any depository institution. Shares are not insured by the FDIC, Federal Reserve Board or any other agency, and are subject to investment risks, including possible loss of principal amount invested.
Neither the fund nor Fidelity Distributors Corporation is a bank.
For more information on any Fidelity Advisor fund, including charges and expenses, contact your investment professional for a free prospectus. Read it carefully before you invest or send money.
Annual Report
Chairman's Message
(photo_of_Edward_C_Johnson_3d)
Dear Shareholder:
Many of you have read or heard news stories recently that were critical of mutual funds and made allegations that the mutual fund industry has been less than forthright. I find these reports unsettling and not necessarily an accurate picture of the overall industry, and I would like you to know where we at Fidelity stand.
With specific regard to allegations that certain mutual fund companies were violating the Securities and Exchange Commission's forward pricing rules or were involved in so-called "market timing" activities, I want to say two things:
First, Fidelity does not have agreements that permit customers who buy fund shares after 4 p.m. to obtain the 4 p.m. price. This is not to say that someone could not deceive the company through fraudulent acts. But I underscore that we have no so-called "agreements" which would permit this illegal practice.
Second, Fidelity has been on record for years opposing predatory short-term trading which adversely affects other shareholders in a mutual fund. In fact, in the 1980s, we began charging a fee - which is returned to the fund and, therefore, to investors - to discourage this activity. What's more, several years ago we took the industry lead in developing a Fair Value Pricing Policy to prevent market timing on foreign securities in our funds. It is reasonable to assume that another structure can be developed that would alter the system to make it much more difficult for predatory traders to operate. This, however, will only be achieved through close cooperation among regulators, legislators and the industry.
Certainly no industry is perfect, and there have been instances of unethical and illegal activity from time to time within the mutual fund industry. When this occurs, confessed or convicted offenders should be dealt with appropriately. Clearly, every system can be improved. We applaud well thought out improvements by regulators, legislators and industry representatives that achieve the common goal of building and protecting the value of investors' holdings. But we remain concerned about the risk of over-regulation and the quick application of simplistic solutions to intricate problems.
For more than 57 years, Fidelity Investments has worked very hard to improve its products and service to justify your trust. When our family founded this company in 1946, we had only a few hundred customers. Many of them were family and friends. Today, we serve more than 18 million customers including individual investors and participants in retirement plans across America.
Let me close by saying that we do not take your trust in us for granted, and we realize that we must always work to improve all aspects of our service to you. In turn, we urge you to continue your active participation with your financial matters, so that your interests can be well served.
Annual Report
Best regards,
/s/Edward C. Johnson 3d
Edward C. Johnson 3d
Annual Report
Performance: The Bottom Line
Average annual total return reflects the change in the value of an investment, assuming reinvestment of the fund's dividend income and capital gains (the profits earned upon the sale of securities that have grown in value) and assuming a constant rate of performance each year. How a fund did yesterday is no guarantee of how it will do tomorrow. Returns may reflect the conversion of Class B shares to Class A shares after a maximum of seven years.
Average Annual Total Returns
Average annual total returns take Fidelity® Advisor Value Leaders - Institutional Class cumulative total return and show you what would have happened if Fidelity Advisor Value Leaders - Institutional Class shares had performed at a constant rate each year. These numbers will be reported once the fund is a year old. In addition, the growth of the hypothetical $10,000 investment in the fund will appear in the fund's next annual report.
Annual Report
Investment Summary
Top Ten Stocks as of October 31, 2003 |
| % of fund's
net assets |
Citigroup, Inc. | 3.4 |
Bank of America Corp. | 2.5 |
American International Group, Inc. | 2.4 |
Verizon Communications, Inc. | 2.2 |
Bank One Corp. | 2.1 |
Tyco International Ltd. | 2.0 |
Morgan Stanley | 2.0 |
Merck & Co., Inc. | 2.0 |
Merrill Lynch & Co., Inc. | 1.8 |
Exxon Mobil Corp. | 1.8 |
| 22.2 |
Top Five Market Sectors as of October 31, 2003 |
| % of fund's
net assets |
Financials | 29.4 |
Consumer Discretionary | 13.6 |
Industrials | 11.3 |
Information Technology | 10.9 |
Energy | 9.8 |
Asset Allocation (% of fund's net assets) |
As of October 31, 2003 * |
| Stocks 101.2% |
| Short-Term Investments
and Net Other Assets** (1.2)% |
| |
* Foreign investments 3.7% |
** Short term Investments and Net Other Assets are not included in the pie chart. |

Annual Report
Investments October 31, 2003
Showing Percentage of Net Assets
Common Stocks - 101.2% |
| Shares | | Value (Note 1) |
CONSUMER DISCRETIONARY - 13.6% |
Auto Components - 0.0% |
LKQ Corp. (a) | 100 | | $ 1,730 |
Automobiles - 0.1% |
Harley-Davidson, Inc. | 100 | | 4,741 |
Hotels, Restaurants & Leisure - 2.3% |
Darden Restaurants, Inc. | 500 | | 10,475 |
Hilton Hotels Corp. | 800 | | 12,672 |
McDonald's Corp. | 3,600 | | 90,036 |
Outback Steakhouse, Inc. | 200 | | 8,400 |
Six Flags, Inc. (a) | 2,800 | | 16,576 |
| | 138,159 |
Household Durables - 1.5% |
KB Home | 600 | | 41,094 |
Leggett & Platt, Inc. | 500 | | 10,445 |
Sony Corp. sponsored ADR | 600 | | 21,120 |
Techtronic Industries Co. | 6,000 | | 16,534 |
| | 89,193 |
Leisure Equipment & Products - 0.3% |
Eastman Kodak Co. | 400 | | 9,772 |
MarineMax, Inc. (a) | 300 | | 5,736 |
| | 15,508 |
Media - 6.3% |
Cablevision Systems Corp. - NY Group Class A (a) | 700 | | 14,140 |
Clear Channel Communications, Inc. | 920 | | 37,554 |
Comcast Corp. Class A (a) | 500 | | 16,960 |
Emmis Communications Corp. Class A (a) | 700 | | 15,526 |
Fox Entertainment Group, Inc. Class A (a) | 900 | | 24,930 |
General Motors Corp. Class H (a) | 1,500 | | 24,645 |
Liberty Media Corp. Class A (a) | 2,600 | | 26,234 |
Reader's Digest Association, Inc. (non-vtg.) | 600 | | 8,838 |
Time Warner, Inc. (a) | 5,400 | | 82,566 |
Viacom, Inc. Class B (non-vtg.) | 1,300 | | 51,831 |
Walt Disney Co. | 3,000 | | 67,920 |
| | 371,144 |
Multiline Retail - 0.7% |
Kohl's Corp. (a) | 250 | | 14,018 |
Nordstrom, Inc. | 500 | | 15,245 |
Saks, Inc. (a) | 700 | | 9,730 |
ShopKo Stores, Inc. (a) | 300 | | 4,644 |
| | 43,637 |
Common Stocks - continued |
| Shares | | Value (Note 1) |
CONSUMER DISCRETIONARY - continued |
Specialty Retail - 2.2% |
AutoNation, Inc. (a) | 400 | | $ 7,480 |
AutoZone, Inc. (a) | 100 | | 9,610 |
CarMax, Inc. (a) | 320 | | 10,083 |
Home Depot, Inc. | 1,700 | | 63,019 |
Lowe's Companies, Inc. | 200 | | 11,786 |
Select Comfort Corp. (a) | 200 | | 6,260 |
Sonic Automotive, Inc. Class A | 800 | | 18,160 |
| | 126,398 |
Textiles Apparel & Luxury Goods - 0.2% |
Reebok International Ltd. | 300 | | 11,685 |
TOTAL CONSUMER DISCRETIONARY | | 802,195 |
CONSUMER STAPLES - 4.9% |
Beverages - 0.4% |
The Coca-Cola Co. | 560 | | 25,984 |
Food & Staples Retailing - 0.6% |
CVS Corp. | 400 | | 14,072 |
Safeway, Inc. (a) | 1,100 | | 23,210 |
| | 37,282 |
Food Products - 0.4% |
Del Monte Foods Co. (a) | 500 | | 4,755 |
Interstate Bakeries Corp. | 400 | | 5,872 |
Tyson Foods, Inc. Class A | 800 | | 11,416 |
| | 22,043 |
Household Products - 1.9% |
Colgate-Palmolive Co. | 400 | | 21,276 |
Procter & Gamble Co. | 900 | | 88,461 |
| | 109,737 |
Personal Products - 0.9% |
Avon Products, Inc. | 300 | | 20,388 |
Gillette Co. | 1,080 | | 34,452 |
| | 54,840 |
Tobacco - 0.7% |
Altria Group, Inc. | 880 | | 40,920 |
TOTAL CONSUMER STAPLES | | 290,806 |
Common Stocks - continued |
| Shares | | Value (Note 1) |
ENERGY - 9.8% |
Energy Equipment & Services - 2.9% |
Baker Hughes, Inc. | 500 | | $ 14,130 |
ENSCO International, Inc. | 1,810 | | 47,694 |
National-Oilwell, Inc. (a) | 400 | | 7,628 |
Pride International, Inc. (a) | 1,100 | | 18,018 |
Smith International, Inc. (a) | 600 | | 22,338 |
Transocean, Inc. (a) | 400 | | 7,676 |
Weatherford International Ltd. (a) | 1,630 | | 56,643 |
| | 174,127 |
Oil & Gas - 6.9% |
Amerada Hess Corp. | 200 | | 10,324 |
Apache Corp. | 400 | | 27,888 |
BP PLC sponsored ADR | 400 | | 16,952 |
Burlington Resources, Inc. | 1,100 | | 53,504 |
ChevronTexaco Corp. | 1,340 | | 99,562 |
ConocoPhillips | 800 | | 45,720 |
EnCana Corp. | 200 | | 6,867 |
Exxon Mobil Corp. | 2,900 | | 106,082 |
Murphy Oil Corp. | 120 | | 7,078 |
Occidental Petroleum Corp. | 500 | | 17,630 |
Valero Energy Corp. | 300 | | 12,810 |
| | 404,417 |
TOTAL ENERGY | | 578,544 |
FINANCIALS - 29.4% |
Capital Markets - 7.3% |
Bank of New York Co., Inc. | 1,700 | | 53,023 |
Bear Stearns Companies, Inc. | 300 | | 22,875 |
J.P. Morgan Chase & Co. | 2,200 | | 78,980 |
Lehman Brothers Holdings, Inc. | 600 | | 43,200 |
Merrill Lynch & Co., Inc. | 1,800 | | 106,560 |
Morgan Stanley | 2,200 | | 120,714 |
National Financial Partners Corp. | 100 | | 2,710 |
| | 428,062 |
Commercial Banks - 8.4% |
Bank of America Corp. | 1,950 | | 147,674 |
Bank One Corp. | 2,900 | | 123,105 |
Banknorth Group, Inc. | 400 | | 12,528 |
Fifth Third Bancorp | 500 | | 28,980 |
FleetBoston Financial Corp. | 1,600 | | 64,624 |
Common Stocks - continued |
| Shares | | Value (Note 1) |
FINANCIALS - continued |
Commercial Banks - continued |
Valley National Bancorp | 600 | | $ 17,550 |
Wachovia Corp. | 400 | | 18,348 |
Wells Fargo & Co. | 1,500 | | 84,480 |
| | 497,289 |
Consumer Finance - 0.5% |
MBNA Corp. | 1,200 | | 29,700 |
Diversified Financial Services - 4.1% |
CIT Group, Inc. | 800 | | 26,896 |
Citigroup, Inc. | 4,200 | | 199,078 |
Deutsche Boerse AG | 285 | | 15,788 |
| | 241,762 |
Insurance - 6.0% |
ACE Ltd. | 400 | | 14,400 |
AFLAC, Inc. | 500 | | 18,240 |
Allianz AG sponsored ADR | 600 | | 6,474 |
Allstate Corp. | 600 | | 23,700 |
AMBAC Financial Group, Inc. | 310 | | 21,929 |
American International Group, Inc. | 2,300 | | 139,909 |
Conseco, Inc. (a) | 800 | | 16,320 |
Hartford Financial Services Group, Inc. | 500 | | 27,450 |
Montpelier Re Holdings Ltd. | 100 | | 3,312 |
Nationwide Financial Services, Inc. Class A | 200 | | 6,794 |
The Chubb Corp. | 200 | | 13,362 |
Travelers Property Casualty Corp. Class B | 1,900 | | 31,103 |
UnumProvident Corp. | 1,100 | | 18,007 |
XL Capital Ltd. Class A | 200 | | 13,900 |
| | 354,900 |
Real Estate - 0.6% |
Apartment Investment & Management Co. Class A | 200 | | 8,180 |
iStar Financial, Inc. | 500 | | 19,030 |
Manufactured Home Communities, Inc. | 150 | | 5,700 |
| | 32,910 |
Thrifts & Mortgage Finance - 2.5% |
Fannie Mae | 460 | | 32,977 |
Freddie Mac | 400 | | 22,452 |
Golden West Financial Corp., Delaware | 120 | | 12,052 |
New York Community Bancorp, Inc. | 400 | | 14,480 |
Common Stocks - continued |
| Shares | | Value (Note 1) |
FINANCIALS - continued |
Thrifts & Mortgage Finance - continued |
Sovereign Bancorp, Inc. | 2,900 | | $ 60,349 |
The PMI Group, Inc. | 200 | | 7,646 |
| | 149,956 |
TOTAL FINANCIALS | | 1,734,579 |
HEALTH CARE - 7.3% |
Biotechnology - 0.3% |
Alkermes, Inc. (a) | 600 | | 7,782 |
Cephalon, Inc. (a) | 200 | | 9,392 |
| | 17,174 |
Health Care Equipment & Supplies - 1.8% |
Bausch & Lomb, Inc. | 300 | | 14,448 |
Baxter International, Inc. | 2,140 | | 56,881 |
Edwards Lifesciences Corp. (a) | 200 | | 5,800 |
Fisher Scientific International, Inc. (a) | 300 | | 12,075 |
St. Jude Medical, Inc. (a) | 300 | | 17,448 |
| | 106,652 |
Health Care Providers & Services - 0.9% |
HealthSouth Corp. (a) | 3,100 | | 8,773 |
IMS Health, Inc. | 300 | | 7,059 |
PacifiCare Health Systems, Inc. (a) | 150 | | 8,925 |
UnitedHealth Group, Inc. | 500 | | 25,440 |
WebMD Corp. (a) | 596 | | 4,643 |
| | 54,840 |
Pharmaceuticals - 4.3% |
Angiotech Pharmaceuticals, Inc. (a) | 100 | | 4,582 |
AstraZeneca PLC sponsored ADR | 200 | | 9,536 |
Biovail Corp. (a) | 200 | | 4,812 |
Eli Lilly & Co. | 100 | | 6,662 |
Forest Laboratories, Inc. (a) | 600 | | 30,006 |
Johnson & Johnson | 300 | | 15,099 |
Merck & Co., Inc. | 2,700 | | 119,475 |
Schering-Plough Corp. | 3,940 | | 60,164 |
| | 250,336 |
TOTAL HEALTH CARE | | 429,002 |
Common Stocks - continued |
| Shares | | Value (Note 1) |
INDUSTRIALS - 11.3% |
Aerospace & Defense - 2.9% |
BE Aerospace, Inc. (a) | 1,100 | | $ 6,204 |
Boeing Co. | 300 | | 11,547 |
Bombardier, Inc. Class B (sub. vtg.) | 2,600 | | 11,674 |
Goodrich Corp. | 300 | | 8,286 |
Honeywell International, Inc. | 1,000 | | 30,610 |
Lockheed Martin Corp. | 1,200 | | 55,632 |
Northrop Grumman Corp. | 200 | | 17,880 |
United Defense Industries, Inc. (a) | 200 | | 6,480 |
United Technologies Corp. | 300 | | 25,407 |
| | 173,720 |
Air Freight & Logistics - 0.1% |
Expeditors International of Washington, Inc. | 160 | | 6,006 |
Airlines - 0.8% |
AirTran Holdings, Inc. (a) | 600 | | 9,726 |
Northwest Airlines Corp. (a) | 800 | | 10,952 |
Ryanair Holdings PLC sponsored ADR (a) | 200 | | 10,300 |
Southwest Airlines Co. | 800 | | 15,520 |
| | 46,498 |
Building Products - 0.7% |
Masco Corp. | 1,200 | | 33,000 |
Trex Co., Inc. (a) | 200 | | 7,400 |
| | 40,400 |
Commercial Services & Supplies - 1.6% |
Cintas Corp. | 600 | | 25,596 |
Copart, Inc. (a) | 500 | | 6,235 |
IKON Office Solutions, Inc. | 900 | | 7,560 |
Monster Worldwide, Inc. (a) | 400 | | 10,188 |
Republic Services, Inc. | 200 | | 4,650 |
Robert Half International, Inc. (a) | 900 | | 21,249 |
Waste Management, Inc. | 700 | | 18,144 |
| | 93,622 |
Construction & Engineering - 0.3% |
Chicago Bridge & Iron Co. NV | 200 | | 5,450 |
Granite Construction, Inc. | 600 | | 11,994 |
| | 17,444 |
Industrial Conglomerates - 2.9% |
3M Co. | 420 | | 33,125 |
General Electric Co. | 180 | | 5,222 |
Common Stocks - continued |
| Shares | | Value (Note 1) |
INDUSTRIALS - continued |
Industrial Conglomerates - continued |
Textron, Inc. | 200 | | $ 9,938 |
Tyco International Ltd. | 5,800 | | 121,104 |
| | 169,389 |
Machinery - 1.2% |
Caterpillar, Inc. | 160 | | 11,725 |
Cummins, Inc. | 100 | | 4,740 |
Eaton Corp. | 100 | | 10,024 |
Manitowoc Co., Inc. | 600 | | 13,020 |
Parker Hannifin Corp. | 400 | | 20,388 |
Timken Co. | 500 | | 8,390 |
| | 68,287 |
Road & Rail - 0.6% |
CSX Corp. | 250 | | 7,955 |
Overnite Corp. | 200 | | 4,432 |
Union Pacific Corp. | 400 | | 25,040 |
| | 37,427 |
Trading Companies & Distributors - 0.2% |
W.W. Grainger, Inc. | 270 | | 12,361 |
TOTAL INDUSTRIALS | | 665,154 |
INFORMATION TECHNOLOGY - 10.9% |
Communications Equipment - 1.7% |
Cisco Systems, Inc. (a) | 600 | | 12,588 |
Motorola, Inc. | 4,600 | | 62,238 |
Scientific-Atlanta, Inc. | 200 | | 5,920 |
Sonus Networks, Inc. (a) | 200 | | 1,642 |
Telefonaktiebolaget LM Ericsson ADR (a) | 1,000 | | 17,080 |
| | 99,468 |
Computers & Peripherals - 3.0% |
Hewlett-Packard Co. | 4,200 | | 93,702 |
International Business Machines Corp. | 320 | | 28,634 |
SanDisk Corp. (a) | 280 | | 22,568 |
Seagate Technology | 350 | | 8,043 |
Sun Microsystems, Inc. (a) | 6,300 | | 24,948 |
| | 177,895 |
Electronic Equipment & Instruments - 1.7% |
Agilent Technologies, Inc. (a) | 1,400 | | 34,888 |
Amphenol Corp. Class A (a) | 200 | | 11,750 |
Common Stocks - continued |
| Shares | | Value (Note 1) |
INFORMATION TECHNOLOGY - continued |
Electronic Equipment & Instruments - continued |
Celestica, Inc. (sub. vtg.) (a) | 500 | | $ 7,091 |
PerkinElmer, Inc. | 600 | | 10,806 |
Tech Data Corp. (a) | 200 | | 6,584 |
Thermo Electron Corp. (a) | 500 | | 10,990 |
Waters Corp. (a) | 500 | | 15,715 |
| | 97,824 |
Internet Software & Services - 0.1% |
Ariba, Inc. (a) | 2,600 | | 8,450 |
IT Services - 0.9% |
Affiliated Computer Services, Inc. Class A (a) | 190 | | 9,297 |
Computer Sciences Corp. (a) | 350 | | 13,867 |
First Data Corp. | 500 | | 17,850 |
The BISYS Group, Inc. (a) | 900 | | 12,870 |
| | 53,884 |
Office Electronics - 0.2% |
Xerox Corp. (a) | 1,200 | | 12,600 |
Semiconductors & Semiconductor Equipment - 2.1% |
Agere Systems, Inc. Class B (a) | 3,300 | | 11,187 |
Applied Materials, Inc. (a) | 800 | | 18,696 |
Cabot Microelectronics Corp. (a) | 400 | | 22,800 |
Intel Corp. | 520 | | 17,186 |
MEMC Electronic Materials, Inc. (a) | 400 | | 4,480 |
Micron Technology, Inc. (a) | 600 | | 8,604 |
National Semiconductor Corp. (a) | 200 | | 8,126 |
Samsung Electronics Co. Ltd. | 28 | | 11,120 |
Texas Instruments, Inc. | 800 | | 23,136 |
| | 125,335 |
Software - 1.2% |
Autodesk, Inc. | 500 | | 9,625 |
BEA Systems, Inc. (a) | 300 | | 4,170 |
Microsoft Corp. | 1,300 | | 33,995 |
Network Associates, Inc. (a) | 1,300 | | 18,109 |
Vastera, Inc. (a) | 1,200 | | 4,440 |
| | 70,339 |
TOTAL INFORMATION TECHNOLOGY | | 645,795 |
Common Stocks - continued |
| Shares | | Value (Note 1) |
MATERIALS - 5.1% |
Chemicals - 2.0% |
Dow Chemical Co. | 1,500 | | $ 56,535 |
E.I. du Pont de Nemours & Co. | 400 | | 16,160 |
Lyondell Chemical Co. | 700 | | 10,010 |
Olin Corp. | 500 | | 8,705 |
Praxair, Inc. | 400 | | 27,832 |
| | 119,242 |
Containers & Packaging - 0.5% |
Ball Corp. | 100 | | 5,620 |
Owens-Illinois, Inc. (a) | 1,600 | | 19,680 |
Smurfit-Stone Container Corp. (a) | 400 | | 6,200 |
| | 31,500 |
Metals & Mining - 1.6% |
Alcoa, Inc. | 900 | | 28,413 |
Companhia Vale do Rio Doce sponsored ADR | 200 | | 9,150 |
Freeport-McMoRan Copper & Gold, Inc. Class B | 200 | | 7,750 |
Massey Energy Co. | 1,300 | | 18,070 |
Newmont Mining Corp. Holding Co. | 150 | | 6,567 |
Nucor Corp. | 400 | | 21,932 |
| | 91,882 |
Paper & Forest Products - 1.0% |
Bowater, Inc. | 400 | | 16,332 |
Georgia-Pacific Corp. | 200 | | 5,256 |
International Paper Co. | 900 | | 35,415 |
| | 57,003 |
TOTAL MATERIALS | | 299,627 |
TELECOMMUNICATION SERVICES - 5.2% |
Diversified Telecommunication Services - 4.3% |
Citizens Communications Co. (a) | 1,300 | | 16,185 |
Covad Communications Group, Inc. (a) | 2,200 | | 9,636 |
NTL, Inc. (a) | 600 | | 37,038 |
Qwest Communications International, Inc. (a) | 1,200 | | 4,236 |
SBC Communications, Inc. | 1,700 | | 40,766 |
TELUS Corp. (non-vtg.) | 840 | | 14,710 |
Verizon Communications, Inc. | 3,900 | | 131,040 |
| | 253,611 |
Wireless Telecommunication Services - 0.9% |
At Road, Inc. (a) | 700 | | 9,030 |
Common Stocks - continued |
| Shares | | Value (Note 1) |
TELECOMMUNICATION SERVICES - continued |
Wireless Telecommunication Services - continued |
Crown Castle International Corp. (a) | 1,800 | | $ 22,788 |
Nextel Communications, Inc. Class A (a) | 900 | | 21,780 |
| | 53,598 |
TOTAL TELECOMMUNICATION SERVICES | | 307,209 |
UTILITIES - 3.7% |
Electric Utilities - 3.3% |
Allegheny Energy, Inc. (a) | 600 | | 6,348 |
Edison International (a) | 200 | | 3,942 |
Entergy Corp. | 500 | | 26,950 |
Exelon Corp. | 200 | | 12,690 |
FirstEnergy Corp. | 1,000 | | 34,390 |
FPL Group, Inc. | 200 | | 12,748 |
PG&E Corp. (a) | 1,000 | | 24,450 |
Southern Co. | 1,200 | | 35,760 |
Texas Genco Holdings, Inc. | 200 | | 5,980 |
TXU Corp. | 1,100 | | 25,102 |
Xcel Energy, Inc. | 600 | | 9,840 |
| | 198,200 |
Multi-Utilities & Unregulated Power - 0.4% |
AES Corp. (a) | 1,800 | | 15,750 |
Reliant Resources, Inc. (a) | 1,200 | | 5,940 |
| | 21,690 |
TOTAL UTILITIES | | 219,890 |
TOTAL COMMON STOCKS (Cost $5,743,703) | 5,972,801 |
Cash Equivalents - 0.9% |
| Maturity Amount | | Value
(Note 1) |
Investments in repurchase agreements (Collateralized by U.S. Treasury Obligations, in a joint trading account at 1%, dated 10/31/03 due 11/3/03)
(Cost $50,000) | 50,004 | | $ 50,000 |
TOTAL INVESTMENT PORTFOLIO - 102.1% (Cost $5,793,703) | | 6,022,801 |
NET OTHER ASSETS - (2.1)% | | (121,652) |
NET ASSETS - 100% | $ 5,901,149 |
Legend |
(a) Non-income producing |
Other Information |
Purchases and sales of securities, other than short-term securities, aggregated $7,920,613 and $2,165,242, respectively. |
The fund placed a portion of its portfolio transactions with brokerage firms which are affiliates of the investment adviser. The commissions paid to these affiliated firms were $434 for the period. |
See accompanying notes which are an integral part of the financial statements.
Annual Report
Financial Statements
Statement of Assets and Liabilities
| October 31, 2003 |
| | |
Assets | | |
Investment in securities, at value (including repurchase agreements of $50,000) (cost $5,793,703) - See accompanying schedule | | $ 6,022,801 |
Cash | | 525 |
Receivable for investments sold | | 115,577 |
Receivable for fund shares sold | | 1,245 |
Dividends receivable | | 6,681 |
Prepaid expenses | | 52,613 |
Receivable from investment adviser for expense reductions | | 17,371 |
Total assets | | 6,216,813 |
| | |
Liabilities | | |
Payable for investments purchased | $ 189,904 | |
Accrued management fee | 2,808 | |
Distribution fees payable | 2,666 | |
Other payables and accrued expenses | 120,286 | |
Total liabilities | | 315,664 |
| | |
Net Assets | | $ 5,901,149 |
Net Assets consist of: | | |
Paid in capital | | $ 5,688,745 |
Accumulated undistributed net realized gain (loss) on investments and foreign currency transactions | | (16,694) |
Net unrealized appreciation (depreciation) on investments | | 229,098 |
Net Assets | | $ 5,901,149 |
See accompanying notes which are an integral part of the financial statements.
Annual Report
Financial Statements - continued
Statement of Assets and Liabilities - continued
| October 31, 2003 |
| | |
Calculation of Maximum Offering Price
Class A:
Net Asset Value and redemption price per share
($1,122,665 ÷ 108,230 shares) | | $ 10.37 |
| | |
Maximum offering price per share (100/94.25 of $10.37) | | $ 11.00 |
Class T:
Net Asset Value and redemption price per share ($1,545,737 ÷ 149,157 shares) | | $ 10.36 |
| | |
Maximum offering price per share (100/96.50 of $10.36) | | $ 10.74 |
Class B:
Net Asset Value and offering price per share ($1,125,245 ÷ 108,790 shares) A | | $ 10.34 |
| | |
Class C:
Net Asset Value and offering price per share ($1,069,194 ÷ 103,373 shares) A | | $ 10.34 |
| | |
Institutional Class:
Net Asset Value, offering price and redemption price per share ($1,038,308 ÷ 100,001 shares) | | $ 10.38 |
A Redemption price per share is equal to net asset value less any applicable contingent deferred sales charge.
See accompanying notes which are an integral part of the financial statements.
Annual Report
Statement of Operations
| June 17, 2003 (commencement of operations) to October 31, 2003 |
| | |
Investment Income | | |
Dividends | | $ 33,101 |
Interest | | 839 |
Total income | | 33,940 |
| | |
Expenses | | |
Management fee | $ 11,336 | |
Transfer agent fees | 3,917 | |
Distribution fees | 10,732 | |
Accounting fees and expenses | 23,185 | |
Non-interested trustees' compensation | 7 | |
Custodian fees and expenses | 7,116 | |
Registration fees | 35,356 | |
Audit | 25,692 | |
Total expenses before reductions | 117,341 | |
Expense reductions | (76,377) | 40,964 |
Net investment income (loss) | | (7,024) |
Realized and Unrealized Gain (Loss) Net realized gain (loss) on: | | |
Investment securities | (11,493) | |
Foreign currency transactions | (55) | |
Total net realized gain (loss) | | (11,548) |
Change in net unrealized appreciation (depreciation) on investment securities | | 229,098 |
Net gain (loss) | | 217,550 |
Net increase (decrease) in net assets resulting from operations | | $ 210,526 |
See accompanying notes which are an integral part of the financial statements.
Annual Report
Financial Statements - continued
Statement of Changes in Net Assets
| June 17, 2003
(commencement of
operations) to
October 31, 2003 |
Increase (Decrease) in Net Assets | |
Operations | |
Net investment income (loss) | $ (7,024) |
Net realized gain (loss) | (11,548) |
Change in net unrealized appreciation (depreciation) | 229,098 |
Net increase (decrease) in net assets resulting from operations | 210,526 |
Share transactions - net increase (decrease) | 5,690,623 |
Total increase (decrease) in net assets | 5,901,149 |
| |
Net Assets | |
Beginning of period | - |
End of period | $ 5,901,149 |
See accompanying notes which are an integral part of the financial statements.
Annual Report
Financial Highlights - Class A
Years ended October 31, | 2003 F |
Selected Per-Share Data | |
Net asset value, beginning of period | $ 10.00 |
Income from Investment Operations | |
Net investment income (loss) E | - H |
Net realized and unrealized gain (loss) | .37 |
Total from investment operations | .37 |
Net asset value, end of period | $ 10.37 |
Total Return B, C, D | 3.70% |
Ratios to Average Net AssetsG | |
Expenses before expense reductions | 5.52% A |
Expenses net of voluntary waivers, if any | 1.75% A |
Expenses net of all reductions | 1.73% A |
Net investment income (loss) | (.05)% A |
Supplemental Data | |
Net assets, end of period (000 omitted) | $ 1,123 |
Portfolio turnover rate | 108% A |
A Annualized
B Total returns for periods of less than one year are not annualized.
C Total returns would have been lower had certain expenses not been reduced during the periods shown.
D Total returns do not include the effect of the sales charges.
E Calculated based on average shares outstanding during the period.
F For the period June 17, 2003 (commencement of operations) to October 31, 2003.
G Expense ratios reflect operating expenses of the class. Expenses before reductions do not reflect amounts reimbursed by the investment adviser or reductions from brokerage service arrangements or other expense offset arrangements and do not represent the amount paid by the class during periods when reimbursements or reductions occur. Expense ratios before reductions for start-up periods may not be representative of longer-term operating periods. Expenses net of any voluntary waivers reflect expenses after reimbursement by the investment adviser but prior to reductions from brokerage service arrangements or other expense offset arrangements. Expenses net of all reductions represent the net expenses paid by the class.
H Amount represents less than .01 per-share.
See accompanying notes which are an integral part of the financial statements.
Annual Report
Financial Highlights - Class T
Years ended October 31, | 2003 F |
Selected Per-Share Data | |
Net asset value, beginning of period | $ 10.00 |
Income from Investment Operations | |
Net investment income (loss) E | (.01) |
Net realized and unrealized gain (loss) | .37 |
Total from investment operations | .36 |
Net asset value, end of period | $ 10.36 |
Total Return B, C, D | 3.60% |
Ratios to Average Net Assets G | |
Expenses before expense reductions | 5.77% A |
Expenses net of voluntary waivers, if any | 2.00% A |
Expenses net of all reductions | 1.98% A |
Net investment income (loss) | (.30)% A |
Supplemental Data | |
Net assets, end of period (000 omitted) | $ 1,546 |
Portfolio turnover rate | 108% A |
A Annualized
B Total returns for periods of less than one year are not annualized.
C Total returns would have been lower had certain expenses not been reduced during the periods shown.
D Total returns do not include the effect of the sales charges.
E Calculated based on average shares outstanding during the period.
F For the period June 17, 2003 (commencement of operations) to October 31, 2003.
G Expense ratios reflect operating expenses of the class. Expenses before reductions do not reflect amounts reimbursed by the investment adviser or reductions from brokerage service arrangements or other expense offset arrangements and do not represent the amount paid by the class during periods when reimbursements or reductions occur. Expense ratios before reductions for start-up periods may not be representative of longer-term operating periods. Expenses net of any voluntary waivers reflect expenses after reimbursement by the investment adviser but prior to reductions from brokerage service arrangements or other expense offset arrangements. Expenses net of all reductions represent the net expenses paid by the class.
See accompanying notes which are an integral part of the financial statements.
Annual Report
Financial Highlights - Class B
Years ended October 31, | 2003 F |
Selected Per-Share Data | |
Net asset value, beginning of period | $ 10.00 |
Income from Investment Operations | |
Net investment income (loss) E | (.03) |
Net realized and unrealized gain (loss) | .37 |
Total from investment operations | .34 |
Net asset value, end of period | $ 10.34 |
Total Return B, C, D | 3.40% |
Ratios to Average Net Assets G | |
Expenses before expense reductions | 6.24% A |
Expenses net of voluntary waivers, if any | 2.50% A |
Expenses net of all reductions | 2.48% A |
Net investment income (loss) | (.80)% A |
Supplemental Data | |
Net assets, end of period (000 omitted) | $ 1,125 |
Portfolio turnover rate | 108% A |
A Annualized
B Total returns for periods of less than one year are not annualized.
C Total returns would have been lower had certain expenses not been reduced during the periods shown.
D Total returns do not include the effect of the contingent deferred sales charge.
E Calculated based on average shares outstanding during the period.
F For the period June 17, 2003 (commencement of operations) to October 31, 2003.
G Expense ratios reflect operating expenses of the class. Expenses before reductions do not reflect amounts reimbursed by the investment adviser or reductions from brokerage service arrangements or other expense offset arrangements and do not represent the amount paid by the class during periods when reimbursements or reductions occur. Expense ratios before reductions for start-up periods may not be representative of longer-term operating periods. Expenses net of any voluntary waivers reflect expenses after reimbursement by the investment adviser but prior to reductions from brokerage service arrangements or other expense offset arrangements. Expenses net of all reductions represent the net expenses paid by the class.
See accompanying notes which are an integral part of the financial statements.
Annual Report
Financial Highlights - Class C
Years ended October 31, | 2003 F |
Selected Per-Share Data | |
Net asset value, beginning of period | $ 10.00 |
Income from Investment Operations | |
Net investment income (loss) E | (.03) |
Net realized and unrealized gain (loss) | .37 |
Total from investment operations | .34 |
Net asset value, end of period | $ 10.34 |
Total Return B, C, D | 3.40% |
Ratios to Average Net Assets G | |
Expenses before expense reductions | 6.24% A |
Expenses net of voluntary waivers, if any | 2.50% A |
Expenses net of all reductions | 2.48% A |
Net investment income (loss) | (.80)% A |
Supplemental Data | |
Net assets, end of period (000 omitted) | $ 1,069 |
Portfolio turnover rate | 108% A |
A Annualized
B Total returns for periods of less than one year are not annualized.
C Total returns would have been lower had certain expenses not been reduced during the periods shown.
D Total returns do not include the effect of the contingent deferred sales charge.
E Calculated based on average shares outstanding during the period.
F For the period June 17, 2003 (commencement of operations) to October 31, 2003.
G Expense ratios reflect operating expenses of the class. Expenses before reductions do not reflect amounts reimbursed by the investment adviser or reductions from brokerage service arrangements or other expense offset arrangements and do not represent the amount paid by the class during periods when reimbursements or reductions occur. Expense ratios before reductions for start-up periods may not be representative of longer-term operating periods. Expenses net of any voluntary waivers reflect expenses after reimbursement by the investment adviser but prior to reductions from brokerage service arrangements or other expense offset arrangements. Expenses net of all reductions represent the net expenses paid by the class.
See accompanying notes which are an integral part of the financial statements.
Annual Report
Financial Highlights - Institutional Class
Years ended October 31, | 2003 E |
Selected Per-Share Data | |
Net asset value, beginning of period | $ 10.00 |
Income from Investment Operations | |
Net investment income (loss) D | .01 |
Net realized and unrealized gain (loss) | .37 |
Total from investment operations | .38 |
Net asset value, end of period | $ 10.38 |
Total Return B, C | 3.80% |
Ratios to Average Net Assets F | |
Expenses before expense reductions | 5.27% A |
Expenses net of voluntary waivers, if any | 1.50% A |
Expenses net of all reductions | 1.48% A |
Net investment income (loss) | .20% A |
Supplemental Data | |
Net assets, end of period (000 omitted) | $ 1,038 |
Portfolio turnover rate | 108% A |
A Annualized
B Total returns for periods of less than one year are not annualized.
C Total returns would have been lower had certain expenses not been reduced during the periods shown.
D Calculated based on average shares outstanding during the period.
E For the period June 17, 2003 (commencement of operations) to October 31, 2003.
F Expense ratios reflect operating expenses of the class. Expenses before reductions do not reflect amounts reimbursed by the investment adviser or reductions from brokerage service arrangements or other expense offset arrangements and do not represent the amount paid by the class during periods when reimbursements or reductions occur. Expense ratios before reductions for start-up periods may not be representative of longer-term operating periods. Expenses net of any voluntary waivers reflect expenses after reimbursement by the investment adviser but prior to reductions from brokerage service arrangements or other expense offset arrangements. Expenses net of all reductions represent the net expenses paid by the class.
See accompanying notes which are an integral part of the financial statements.
Annual Report
Notes to Financial Statements
For the period ended October 31, 2003
1. Significant Accounting Policies.
Fidelity Advisor Value Leaders Fund (the fund) is a fund of Fidelity Advisor Series VIII (the trust) and is authorized to issue an unlimited number of shares. The trust is registered under the Investment Company Act of 1940, as amended (the 1940 Act), as an open-end management investment company organized as a Massachusetts business trust.
The fund offers Class A, Class T, Class B, Class C, and Institutional Class shares, each of which has equal rights as to assets and voting privileges. Each class has exclusive voting rights with respect to matters that affect that class. Class B shares will automatically convert to Class A shares after a holding period of seven years from the initial date of purchase. Investment income, realized and unrealized capital gains and losses, the common expenses of the fund, and certain fund-level expense reductions, if any, are allocated on a pro rata basis to each class based on the relative net assets of each class to the total net assets of the fund. Each class differs with respect to transfer agent and distribution and service plan fees incurred. Certain expense reductions also differ by class.
The financial statements have been prepared in conformity with accounting principles generally accepted in the United States of America, which require management to make certain estimates and assumptions at the date of the financial statements. The following summarizes the significant accounting policies of the fund:
Security Valuation. Net asset value per share (NAV calculation) is calculated as of the close of business of the New York Stock Exchange, normally 4:00 p.m. Eastern time. Equity securities for which market quotations are available are valued at the last sale price or official closing price (closing bid price or last evaluated quote if no sale has occurred) on the primary market or exchange on which they trade. If an event that is expected to materially affect the value of a security occurs after the close of an exchange or market on which that security trades, but prior to the NAV calculation, then that security will be fair valued taking the event into account. Securities (including restricted securities) for which market quotations are not readily available are valued at their fair value as determined in good faith under consistently applied procedures under the general supervision of the Board of Trustees. Price movements in futures contracts and ADRs, market and trading trends, the bid/ask quotes of brokers and off-exchange institutional trading may be reviewed in the course of making a good faith determination of a security's fair value. Short-term securities with remaining maturities of sixty days or less for which quotations are not readily available are valued on the basis of amortized cost. Investments in open-end investment companies are valued at their net asset value each business day.
Foreign Currency. The fund uses foreign currency contracts to facilitate transactions in foreign-denominated securities. Losses from these transactions may arise from changes in the value of the foreign currency or if the counterparties do not perform under the contracts' terms.
Annual Report
Notes to Financial Statements - continued
1. Significant Accounting Policies - continued
Annual Report
Foreign Currency - continued
Foreign denominated assets, including investment securities, and liabilities are translated into U.S. dollars at the exchange rate at period end. Purchases and sales of investment securities, income and dividends received and expenses denominated in foreign currencies are translated into U.S. dollars at the exchange rate in effect on the transaction date.
The effects of exchange rate fluctuations on investments are included with the net realized and unrealized gain (loss) on investment securities. Other foreign currency transactions resulting in realized and unrealized gain (loss) are disclosed separately.
Investment Transactions and Income. Security transactions are accounted for as of trade date. Gains and losses on securities sold are determined on the basis of identified cost. Dividend income is recorded on the ex-dividend date, except for certain dividends from foreign securities where the ex-dividend date may have passed, which are recorded as soon as the fund is informed of the ex-dividend date. Non-cash dividends included in dividend income, if any, are recorded at the fair market value of the securities received. The fund estimates the components of distributions received from Real Estate Investment Trusts (REITs). Distributions received in excess of income are recorded as a reduction of cost of investments and/or realized gain. Interest income is accrued as earned. Interest income includes coupon interest and amortization of premium and accretion of discount on debt securities, which is accrued using the interest method.. Investment income is recorded net of foreign taxes withheld where recovery of such taxes is uncertain.
Expenses. Most expenses of the trust can be directly attributed to a fund. Expenses which cannot be directly attributed are apportioned among the funds in the trust.
Income Tax Information and Distributions to Shareholders. Each year the fund intends to qualify as a regulated investment company by distributing all of its taxable income and realized gains under Subchapter M of the Internal Revenue Code. As a result, no provision for income taxes is required in the accompanying financial statements. Foreign taxes are provided for based on each fund's understanding of the tax rules and rates that exist in the foreign markets in which it invests. Income dividends and capital gain distributions are declared separately for each class. Distributions are recorded on the ex-dividend date.
Income and capital gain distributions are determined in accordance with income tax regulations, which may differ from generally accepted accounting principles. Capital accounts within the financial statements are adjusted for permanent and temporary book and tax differences. These adjustments have no impact on net assets or the results of operations. Temporary differences will reverse in a subsequent period. These differences are primarily due to foreign currency transactions, net operating losses and losses deferred due to wash sales.
Annual Report
Notes to Financial Statements - continued
1. Significant Accounting Policies - continued
Annual Report
Income Tax Information and Distributions to Shareholders - continued
The tax-basis components of distributable earnings and the federal tax cost as of period end were as follows:
Unrealized appreciation | $ 391,047 | | |
Unrealized depreciation | (178,644) | |
Net unrealized appreciation (depreciation) | 212,403 | |
Cost for federal income tax purposes | $ 5,810,398 | |
2. Operating Policies.
Repurchase Agreements. Fidelity Management & Research Company (FMR) has received an Exemptive Order from the Securities and Exchange Commission (the SEC) which permits the fund and other affiliated entities of FMR to transfer uninvested cash balances into joint trading accounts. These accounts are then invested in repurchase agreements that are collateralized by U.S. Treasury or Government obligations. The fund may also invest directly with institutions, in repurchase agreements that are collateralized by commercial paper obligations and corporate obligations. Collateral is held in segregated accounts with custodian banks and may be obtained in the event of a default of the counterparty. Collateral is marked-to-market daily and maintained at a value at least equal to the principal amount of the repurchase agreement (including accrued interest).
3. Purchases and Sales of Investments.
Information regarding purchases and sales of securities is included under the caption "Other Information" at the end of the fund's Schedule of Investments.
4. Fees and Other Transactions with Affiliates.
Management Fee. FMR and its affiliates provide the fund with investment management related services for which the fund pays a monthly management fee. The management fee is the sum of an individual fund fee rate that is based on an annual rate of .30% of the fund's average net assets and a group fee rate that averaged .28% during the period. The group fee rate is based upon the average net assets of all the mutual funds advised by FMR. The group fee rate decreases as assets under management increase and increases as assets under management decrease. For the period, the total annualized management fee rate was .58% of the fund's average net assets.
Distribution and Service Plan. In accordance with Rule 12b-1 of the 1940 Act, the Fund has adopted separate Distribution and Service Plans for each class of shares, except for the Institutional Class. Certain classes pay Fidelity Distributors Corporation
Annual Report
Notes to Financial Statements - continued
4. Fees and Other Transactions with Affiliates - continued
Distribution and Service Plan - continued
(FDC), an affiliate of FMR, separate Distribution and Service Fees, each of which is based on an annual percentage of each class' average net assets. Class A and Class T Plans also authorize the use of brokerage commissions to pay distribution expenses. This practice has been discontinued and no commissions incurred after June 30, 2003 have been used to pay distribution expenses. In addition, FDC may pay financial intermediaries for selling shares of the fund and providing shareholder support services. For the period, the Distribution and Service Fee rates, the total amounts paid to and retained by FDC and the amount of distribution expenses paid with brokerage commissions were as follows:
| Distribution
Fee | Service
Fee | Paid to
FDC | Retained
by FDC |
Class A | - | .25% | $ 956 | $ 926 |
Class T | .25% | .25% | 2,226 | 1,839 |
Class B | .75% | .25% | 3,817 | 3,787 |
Class C | .75% | .25% | 3,733 | 3,720 |
| | | $ 10,732 | $ 10,272 |
Sales Load. FDC receives a front-end sales charge of up to 5.75% for selling Class A shares, and 3.50% for selling Class T shares of the fund. FDC receives the proceeds of contingent deferred sales charges levied on Class A, Class T, Class B, and Class C redemptions. These charges depend on the holding period. The deferred sales charges range from 5% to 1% for Class B, 1% for Class C, and .25% for certain purchases of Class A and Class T shares.
For the period, sales charge amounts retained by FDC were as follows:
| Retained
by FDC | |
Class A | $ 358 | |
Class T | 559 | |
Class B* | - | |
Class C* | - | |
| $ 917 | |
* When Class B and Class C shares are initially sold, FDC pays commissions from its own resources to financial intermediaries through which the sales
are made.
Annual Report
4. Fees and Other Transactions with Affiliates - continued
Transfer Agent Fees. Fidelity Investments Institutional Operations Company, Inc. (FIIOC), an affiliate of FMR, is the transfer, dividend disbursing and shareholder servicing agent (collectively referred to as the transfer agent) for each class of the fund. FIIOC receives account fees and asset-based fees that vary according to the account size and type of account of the shareholders of the respective classes of the fund. FIIOC pays for typesetting, printing and mailing of all shareholder reports, except proxy statements. For the period, the following amounts were paid to FIIOC:
| Amount | % of
Average
Net Assets* |
Class A | $ 777 | .20 |
Class T | 957 | .21 |
Class B | 765 | .19 |
Class C | 715 | .19 |
Institutional Class | 703 | .18 |
| $ 3,917 | |
* Annualized
Accounting Fees. Fidelity Service Company, Inc. (FSC), an affiliate of FMR, maintains the fund's accounting records. The fee is based on the level of average net assets for the month plus out-of-pocket expenses.
Brokerage Commissions. The fund placed a portion of its portfolio transactions with brokerage firms which are affiliates of the investment adviser. The commissions paid to these affiliated firms are shown under the caption "Other Information" at the end of the fund's Schedule of Investments.
Annual Report
Notes to Financial Statements - continued
5. Expense Reductions.
FMR agreed to reimburse the classes of the fund to the extent operating expenses exceeded certain levels of average net assets as noted in the table below. Some expenses, for example interest expense, are excluded from this reimbursement.
| Expense
Limitations | Reimbursement
from adviser |
| | |
Class A | 1.75% | $ 14,917 |
Class T | 2.00% | 17,442 |
Class B | 2.50% | 14,783 |
Class C | 2.50% | 14,415 |
Institutional Class | 1.50% | 14,440 |
| | $ 75,997 |
Many of the brokers with whom FMR places trades on behalf of the fund provided services to the fund in addition to trade execution. These services may include payments of expenses on behalf of the fund to support distribution of fund shares for Class A and Class T ("Distribution Expense Reduction") and to pay other fund expenses, such as transfer agent fees ("Other Expense Reduction") collectively referred to as "Brokerage Service Arrangements" in the accompanying table. Brokerage service arrangements generally benefits all shareholders of each class by reducing fund expenses. Each of Class A and Class T shareholders' Other Expense Reduction benefit is reduced by the amount of any Distribution Expense Reduction. In addition, through arrangements with the fund's custodian, credits realized as a result of uninvested cash balances were used to reduce the fund's expenses. All of the applicable expense reductions are noted in the table below.
| Brokerage Service Arrangements | |
| Distribution
expense
reduction | Other
expense
reduction | Custody
expense
reduction |
| | | |
Fund Level | $ - | $ 349 | $ 31 |
Annual Report
6. Other Information.
At the end of the period, FMR or its affiliates were the owners of record of 88% of the total outstanding shares of the fund.
7. Share Transactions.
Transactions for each class of shares were as follows:
| Shares | Dollars |
| June 17, 2003 (commencement of operations) to October 31, 2003 | June 17, 2003 (commencement of operations) to October 31, 2003 |
Class A | | |
Shares sold | 108,230 | $ 1,082,566 |
Net increase (decrease) | 108,230 | $ 1,082,566 |
Class T | | |
Shares sold | 150,758 | $ 1,501,803 |
Shares redeemed | (1,601) | (15,902) |
Net increase (decrease) | 149,157 | $ 1,485,901 |
Class B | | |
Shares sold | 108,790 | $ 1,088,261 |
Net increase (decrease) | 108,790 | $ 1,088,261 |
Class C | | |
Shares sold | 103,373 | $ 1,033,885 |
Net increase (decrease) | 103,373 | $ 1,033,885 |
Institutional Class | | |
Shares sold | 100,001 | $ 1,000,010 |
Net increase (decrease) | 100,001 | $ 1,000,010 |
Annual Report
Report of Independent Auditors
To the Trustees of Fidelity Advisor Series VIII and the Shareholders of Fidelity Advisor Value Leaders Fund.
In our opinion, the accompanying statement of assets and liabilities, including the schedule of investments, and the related statements of operations and of changes in net assets and the financial highlights present fairly, in all material respects, the financial position of Fidelity Advisor Value Leaders Fund (a fund of Fidelity Advisor Series VIII) at October 31, 2003 and the results of its operations, the changes in its net assets and the financial highlights for the period indicated, in conformity with accounting principles generally accepted in the United States of America. These financial statements and financial highlights (hereafter referred to as "financial statements") are the responsibility of the Fidelity Advisor Value Leaders Fund's management; our responsibility is to express an opinion on these financial statements based on our audits. We conducted our audit of these financial statements in accordance with auditing standards generally accepted in the United States of America which require that we plan and perform the audit to obtain reasonable assurance about whether the financial statements are free of material misstatement. An audit includes examining, on a test basis, evidence supporting the amounts and disclosures in the financial statements, assessing the accounting principles used and significant estimates made by management, and evaluating the overall financial statement presentation. We believe that our audit, which included confirmation of securities at October 31, 2003 by correspondence with the custodian and brokers, provides a reasonable basis for our opinion.
/s/PricewaterhouseCoopers LLP
PricewaterhouseCoopers LLP
Boston, Massachusetts
December 11, 2003
Annual Report
Trustees and Officers
The Trustees, Members of the Advisory Board, and executive officers of the trust and fund, as applicable, are listed below. The Board of Trustees governs the fund and is responsible for protecting the interests of shareholders. The Trustees are experienced executives who meet periodically throughout the year to oversee the fund's activities, review contractual arrangements with companies that provide services to the fund, and review the fund's performance. Except for William O. McCoy, each of the Trustees oversees 289 funds advised by FMR or an affiliate. Mr. McCoy oversees 291 funds advised by FMR or an affiliate.
The Trustees hold office without limit in time except that (a) any Trustee may resign; (b) any Trustee may be removed by written instrument, signed by at least two-thirds of the number of Trustees prior to such removal; (c) any Trustee who requests to be retired or who has become incapacitated by illness or injury may be retired by written instrument signed by a majority of the other Trustees; and (d) any Trustee may be removed at any special meeting of shareholders by a two-thirds vote of the outstanding voting securities of the trust. In any event, each non-interested Trustee shall retire not later than the last day of the calendar year in which his or her 72nd birthday occurs. The executive officers and Advisory Board Members hold office without limit in time, except that any officer and Advisory Board Member may resign or may be removed by a vote of a majority of the Trustees at any regular meeting or any special meeting of the Trustees. Except as indicated, each individual has held the office shown or other offices in the same company for the past five years.
The fund's Statement of Additional Information (SAI) includes more information about the Trustees. To request a free copy, call Fidelity at 1-877-208-0098.
Interested Trustees*:
Correspondence intended for each Trustee who is an "interested person" (as defined in the 1940 Act) may be sent to 82 Devonshire Street, Boston, Massachusetts 02109.
Name, Age; Principal Occupation |
Edward C. Johnson 3d (73)** |
| Year of Election or Appointment: 1983 Mr. Johnson is Chairman of the Board of Trustees. Mr. Johnson serves as Chief Executive Officer, Chairman, and a Director of FMR Corp.; a Director and Chairman of the Board and of the Executive Committee of FMR; Chairman and a Director of Fidelity Management & Research (Far East) Inc.; Chairman (1998) and a Director of Fidelity Investments Money Management, Inc.; and Chairman (2001) and a Director (2000) of FMR Co., Inc. |
Abigail P. Johnson (41)** |
| Year of Election or Appointment: 2001 Senior Vice President of Advisor Value Leaders (2003). Ms. Johnson also serves as Senior Vice President of other Fidelity funds (2001). She is President and a Director of FMR (2001), Fidelity Investments Money Management, Inc. (2001), FMR Co., Inc. (2001), and a Director of FMR Corp. Previously, Ms. Johnson managed a number of Fidelity funds. |
Laura B. Cronin (49) |
| Year of Election or Appointment: 2003 Ms. Cronin is an Executive Vice President (2002) and Chief Financial Officer (2002) of FMR Corp. and is a member of the Fidelity Management Committee (2003). Previously, Ms. Cronin served as Vice President of Finance of FMR (1997-1999), and Chief Financial Officer of FMR (1999-2001), Fidelity Personal Investments (2001), and Fidelity Brokerage Company (2001-2002). |
Robert L. Reynolds (51) |
| Year of Election or Appointment: 2003 Mr. Reynolds is a Director (2003) and Chief Operating Officer (2002) of FMR Corp. and is the head of the Fidelity Management Committee (2003). He also serves on the Board at Fidelity Investments Canada, Ltd. (2000). Previously, Mr. Reynolds served as President of Fidelity Investments Institutional Retirement Group (1996-2000). |
* Trustees have been determined to be "Interested Trustees" by virtue of, among other things, their affiliation with the trust or various entities under common control with FMR.
** Edward C. Johnson 3d, Trustee, is Abigail P. Johnson's father.
Annual Report
Non-Interested Trustees:
Correspondence intended for each non-interested Trustee (that is, the Trustees other than the Interested Trustees) may be sent to Fidelity Investments, P.O. Box 55235, Boston, Massachusetts 02205-5235.
Name, Age; Principal Occupation |
J. Michael Cook (61) |
| Year of Election or Appointment: 2001 Prior to Mr. Cook's retirement in May 1999, he served as Chairman and Chief Executive Officer of Deloitte & Touche LLP (accounting/consulting), Chairman of the Deloitte & Touche Foundation, and a member of the Board of Deloitte Touche Tohmatsu. He currently serves as a Director of Comcast (telecommunications, 2002), International Flavors & Fragrances, Inc. (2000), Rockwell Automation (2000) and The Dow Chemical Company (2000). He is a Member of the Diversity Advisory Council of Marakon (2003) and the Advisory Board of the Directorship Search Group, Chairman Emeritus of the Board of Catalyst (a leading organization for the advancement of women in business), and is Chairman of the Accountability Advisory Council to the Comptroller General of the United States. He also serves as a Member of the Advisory Board of the Graduate School of Business of the University of Florida, his alma mater. |
Ralph F. Cox (71) |
| Year of Election or Appointment: 1991 Mr. Cox is President of RABAR Enterprises (management consulting for the petroleum industry). Prior to February 1994, he was President of Greenhill Petroleum Corporation (petroleum exploration and production). Until March 1990, Mr. Cox was President and Chief Operating Officer of Union Pacific Resources Company (exploration and production). He is a Director of CH2M Hill Companies (engineering), and Abraxas Petroleum (petroleum exploration and production, 1999). In addition, he is a member of advisory boards of Texas A&M University and the University of Texas at Austin. |
Phyllis Burke Davis (71) |
| Year of Election or Appointment: 1992 Mrs. Davis is retired from Avon Products, Inc. (consumer products) where she held various positions including Senior Vice President of Corporate Affairs and Group Vice President of U.S. product marketing, sales, distribution, and manufacturing. Mrs. Davis is a member of the Board of Directors of the Southampton Hospital in Southampton, N.Y. (1998). Previously, she served as a Director of BellSouth Corporation (telecommunications), Eaton Corporation (diversified industrial), the TJX Companies, Inc. (retail stores), Hallmark Cards, Inc., and Nabisco Brands, Inc. |
Robert M. Gates (60) |
| Year of Election or Appointment: 1997 Dr. Gates is President of Texas A&M University (2002). He was Director of the Central Intelligence Agency (CIA) from 1991 to 1993. From 1989 to 1991, Dr. Gates served as Assistant to the President of the United States and Deputy National Security Advisor. Dr. Gates is a Director of NACCO Industries, Inc. (mining and manufacturing), and Parker Drilling Co., Inc. (drilling and rental tools for the energy industry, 2001). He also serves as a member of the Advisory Board of VoteHere.net (secure internet voting, 2001). Previously, Dr. Gates served as a Director of LucasVarity PLC (automotive components and diesel engines), a Director of TRW Inc. (automotive, space, defense, and information technology), and Dean of the George Bush School of Government and Public Service at Texas A&M University (1999-2001). Dr. Gates also is a Trustee of the Forum for International Policy. |
Donald J. Kirk (70) |
| Year of Election or Appointment: 1987 Mr. Kirk is a Governor of the American Stock Exchange (2001), a Trustee and former Chairman of the Board of Trustees of the Greenwich Hospital Association, a Director of the Yale-New Haven Health Services Corp. (1998), and a Director Emeritus and former Chairman of the Board of Directors of National Arts Strategies Inc. Mr. Kirk was an Executive-in-Residence (1995-2000) and a Professor (1987-1995) at Columbia University Graduate School of Business. Prior to 1987, he was Chairman of the Financial Accounting Standards Board. Previously, Mr. Kirk served as a Governor of the National Association of Securities Dealers, Inc. (1996-2002), a member and Vice Chairman of the Public Oversight Board of the American Institute of Certified Public Accountants' SEC Practice Section (1995-2002), a Director of General Re Corporation (reinsurance, 1987-1998) and as a Director of Valuation Research Corp. (appraisals and valuations). |
Marie L. Knowles (57) |
| Year of Election or Appointment: 2001 Prior to Ms. Knowles' retirement in June 2000, she served as Executive Vice President and Chief Financial Officer of Atlantic Richfield Company (ARCO) (diversified energy, 1996-2000). From 1993 to 1996, she was a Senior Vice President of ARCO and President of ARCO Transportation Company. She served as a Director of ARCO from 1996 to 1998. She currently serves as a Director of Phelps Dodge Corporation (copper mining and manufacturing), URS Corporation (multidisciplinary engineering, 1999), and McKesson Corporation (healthcare service, 2002). Ms. Knowles is a Trustee of the Brookings Institution and the Catalina Island Conservancy and also serves as a member of the Advisory Board for the School of Engineering of the University of Southern California. |
Ned C. Lautenbach (59) |
| Year of Election or Appointment: 2000 Mr. Lautenbach has been a partner of Clayton, Dubilier & Rice, Inc. (private equity investment firm) since September 1998. Previously, Mr. Lautenbach was with the International Business Machines Corporation (IBM) from 1968 until his retirement in 1998. He was most recently Senior Vice President and Group Executive of Worldwide Sales and Services. From 1993 to 1995, he was Chairman of IBM World Trade Corporation, and from 1994 to 1998 was a member of IBM's Corporate Executive Committee. Mr. Lautenbach serves as Chairman and as a Director (1998) of Acterna Corporation (communications test equipment). He is also Co-Chairman of Covansys, Inc. (global provider of business and technology solutions, 2000). In addition, he is a Director of Eaton Corporation (diversified industrial) and the Philharmonic Center for the Arts in Naples, Florida (1999). He also is a member of the Council on Foreign Relations. |
Marvin L. Mann (70) |
| Year of Election or Appointment: 1993 Mr. Mann is Chairman of the non-interested Trustees (2001). He is Chairman Emeritus of Lexmark International, Inc. (computer peripherals) where he served as CEO until April 1998 and retired as Chairman May 1999, and remains a member of the Board. Prior to 1991, he held the positions of Vice President of International Business Machines Corporation (IBM) and President and General Manager of various IBM divisions and subsidiaries. Mr. Mann is a Board member of Imation Corp. (imaging and information storage) and Acterna Corporation (communications test equipment, 1999). He is also a member of the Director Services Committee of the Investment Company Institute. In addition, Mr. Mann is a member of the President's Cabinet at the University of Alabama and the Board of Visitors of the Culverhouse College of Commerce and Business Administration at the University of Alabama. |
William O. McCoy (70) |
| Year of Election or Appointment: 1997 Prior to his retirement in December 1994, Mr. McCoy was Vice Chairman of the Board of BellSouth Corporation (telecommunications) and President of BellSouth Enterprises. He is currently a Director of Liberty Corporation (holding company), Duke Realty Corporation (real estate), Progress Energy, Inc. (electric utility), and Acterna Corporation (communications test equipment, 1999). He is also a partner of Franklin Street Partners (private investment management firm) and a member of the Research Triangle Foundation Board. In addition, Mr. McCoy served as the Interim Chancellor (1999-2000) and a member of the Board of Visitors (1994-1998) for the University of North Carolina at Chapel Hill and currently serves on the Board of Directors of the University of North Carolina Health Care System and the Board of Visitors of the Kenan-Flagler Business School (University of North Carolina at Chapel Hill). He also served as Vice President of Finance for the University of North Carolina (16-school system, 1995-1998). |
William S. Stavropoulos (64) |
| Year of Election or Appointment: 2001 Mr. Stavropoulos is Chairman of the Board, President and CEO (2002), and Chairman of the Executive Committee (2000) and a Director of The Dow Chemical Company. Since joining The Dow Chemical Company in 1967, Mr. Stavropoulos served in numerous senior management positions, including President (1993-2000) and Chief Executive Officer (1995-2000). Currently, he is a Director of NCR Corporation (data warehousing and technology solutions), BellSouth Corporation (telecommunications), Chemical Financial Corporation, and Maersk Inc. (industrial conglomerate, 2002). He also serves as a member of the Board of Trustees of the American Enterprise Institute for Public Policy Research. In addition, Mr. Stavropoulos is a member of The Business Council, J.P. Morgan International Council, World Business Council for Sustainable Development, and the University of Notre Dame Advisory Council for the College of Science. |
Annual Report
Trustees and Officers - continued
Advisory Board Members and Executive Officers:
Correspondence intended for Dr. Heilmeier may be sent to Fidelity Investments, P.O. Box 55235, Boston, Massachusetts 02205-5235. Correspondence intended for each executive officer and Mr. Lynch may be sent to 82 Devonshire Street, Boston, Massachusetts 02109.
Name, Age; Principal Occupation |
George H. Heilmeier (67) |
| Year of Election or Appointment: 2003 Member of the Advisory Board of Fidelity Advisor Series VIII. Dr. Heilmeier is Chairman Emeritus of Telcordia Technologies (communication software and systems), where prior to his retirement, he served as company Chairman and Chief Executive Officer. He currently serves on the Boards of Directors of The Mitre Corporation (systems engineering and information technology support for the government), INET Technologies Inc. (telecommunications network surveillance, 2001) and Teletech Holdings (customer management services, 1998). He is Chairman of the General Motors Technology Advisory Committee and a Life Fellow of the IEEE (2000). Dr. Heilmeier is a member of the Defense Science Board and the National Security Agency Advisory Board. He is also a member of the National Academy of Engineering, the American Academy of Arts and Sciences and The Board of Overseers of the School of Engineering and Applied Science of the University of Pennsylvania. Previously, Dr. Heilmeier served as a Director of TRW Inc. (automotive, space, defense, and information technology, 1992-2002) and Compaq (1994-2002). |
Peter S. Lynch (60) |
| Year of Election or Appointment: 2003 Member of the Advisory Board of Fidelity Advisor Series VIII. Vice Chairman and a Director of FMR, and Vice Chairman (2001) and a Director (2000) of FMR Co., Inc. Previously, Mr. Lynch served as a Trustee of the Fidelity funds (1990-2003). Prior to May 31, 1990, he was a Director of FMR and Executive Vice President of FMR (a position he held until March 31, 1991), Vice President of Fidelity® Magellan® Fund and FMR Growth Group Leader, and Managing Director of FMR Corp. Mr. Lynch was also Vice President of Fidelity Investments Corporate Services. In addition, he serves as a Trustee of Boston College, Massachusetts Eye & Ear Infirmary, Historic Deerfield, John F. Kennedy Library, and the Museum of Fine Arts of Boston. |
Bart A. Grenier (44) |
| Year of Election or Appointment: 2003 Vice President of Advisor Value Leaders. Mr. Grenier also serves as Vice President of certain Equity Funds (2001), a position he previously held from 1999 to 2000, and Vice President of certain High Income Funds (2002). He is Senior Vice President of FMR (1999) and FMR Co., Inc. (2001), and President and Director of Strategic Advisers, Inc. (2002). He also heads Fidelity's Asset Allocation Group (2000), Fidelity's Growth and Income Group (2001), Fidelity's Value Group (2001), and Fidelity's High Income Division (2001). Previously, Mr. Grenier served as President of Fidelity Ventures (2000), Vice President of certain High Income Funds (1997-2000), High Income Division Head (1997-2000), Group Leader of the Income-Growth and Asset Allocation-Income Groups (1996-2000), and Assistant Equity Division Head (1997-2000). |
Eric D. Roiter (54) |
| Year of Election or Appointment: 2003 Secretary of Advisor Value Leaders. He also serves as Secretary of other Fidelity funds (1998); Vice President, General Counsel, and Clerk of FMR Co., Inc. (2001) and FMR (1998); Vice President and Clerk of FDC (1998); Assistant Clerk of Fidelity Management & Research (U.K.) Inc. (2001) and Fidelity Management & Research (Far East) Inc. (2001); and Assistant Secretary of Fidelity Investments Money Management Inc. (2001). Prior to joining Fidelity, Mr. Roiter was with the law firm of Debevoise & Plimpton, as an associate (1981-1984) and as a partner (1985-1997), and served as an Assistant General Counsel of the U.S. Securities and Exchange Commission (1979-1981). Mr. Roiter is an Adjunct Member, Faculty of Law, at Boston College Law School (2003). |
Stuart Fross (44) |
| Year of Election or Appointment: 2003 Assistant Secretary of Advisor Value Leaders. Mr. Fross also serves as Assistant Secretary of other Fidelity funds (2003) and is an employee of FMR. |
Maria F. Dwyer (44) |
| Year of Election or Appointment: 2003 President and Treasurer of Advisor Value Leaders. Ms. Dwyer also serves as President and Treasurer of other Fidelity funds (2002) and is a Vice President (1999) and an employee (1996) of FMR. Prior to joining Fidelity, Ms. Dwyer served as Director of Compliance for MFS Investment Management. |
Timothy F. Hayes (52) |
| Year of Election or Appointment: 2003 Chief Financial Officer of Advisor Value Leaders. Mr. Hayes also serves as Chief Financial Officer of other Fidelity funds (2002). Recently he was appointed President of Fidelity Service Company (2003) where he also serves as a Director. Mr. Hayes also serves as President of Fidelity Investments Operations Group (FIOG, 2002), which includes Fidelity Pricing and Cash Management Services Group (FPCMS), where he was appointed President in 1998. Previously, Mr. Hayes served as Chief Financial Officer of Fidelity Investments Corporate Systems and Service Group (1998) and Fidelity Systems Company (1997-1998). |
John R. Hebble (45) |
| Year of Election or Appointment: 2003 Deputy Treasurer of Advisor Value Leaders. Mr. Hebble also serves as Deputy Treasurer of other Fidelity funds (2003), and is an employee of FMR. Before joining Fidelity Investments, Mr. Hebble worked at Deutsche Asset Management where he served as Director of Fund Accounting (2002-2003) and Assistant Treasurer of the Scudder Funds (1998-2003). |
John H. Costello (57) |
| Year of Election or Appointment: 2003 Assistant Treasurer of Advisor Value Leaders. Mr. Costello also serves as Assistant Treasurer of other Fidelity funds and is an employee of FMR. |
Francis V. Knox, Jr. (56) |
| Year of Election or Appointment: 2003 Assistant Treasurer of Advisor Value Leaders. Mr. Knox also serves as Assistant Treasurer of other Fidelity funds (2002), and is a Vice President and an employee of FMR. Previously, Mr. Knox served as Vice President of Investment & Advisor Compliance (1990-2001), and Compliance Officer of Fidelity Management & Research (U.K.) Inc. (1992-2002), Fidelity Management & Research (Far East) Inc. (1991-2002), and FMR Corp. (1995-2002). |
Mark Osterheld (48) |
| Year of Election or Appointment: 2003 Assistant Treasurer of Advisor Value Leaders. Mr. Osterheld also serves as Assistant Treasurer of other Fidelity funds (2002) and is an employee of FMR. |
Thomas J. Simpson (45) |
| Year of Election or Appointment: 2003 Assistant Treasurer of Advisor Value Leaders. Mr. Simpson is Assistant Treasurer of other Fidelity funds (2000) and an employee of FMR (1996). Prior to joining FMR, Mr. Simpson was Vice President and Fund Controller of Liberty Investment Services (1987-1995). |
Annual Report
Annual Report
Annual Report
Annual Report
Investment Adviser
Fidelity Management & Research Company
Boston, MA
Investment Sub-Advisers
FMR Co., Inc.
Fidelity Management & Research
(U.K.) Inc.
Fidelity Management & Research
(Far East) Inc.
Fidelity International
Investment Advisors
Fidelity Investments Japan Limited
Fidelity International Investment Advisors (U.K.) Limited
General Distributor
Fidelity Distributors Corporation
Boston, MA
Transfer and Shareholder
Servicing Agents
Fidelity Investments Institutional Operations Company, Inc.
Boston, MA
Custodian
State Street Bank and Trust Company
Quincy, MA
Annual Report
Fidelity Advisor Aggressive Growth Fund |
Fidelity Advisor Asset Allocation Fund |
Fidelity Advisor Balanced Fund |
Fidelity Advisor Biotechnology Fund |
Fidelity Advisor California Municipal Income Fund |
Fidelity Advisor Consumer Industries Fund |
Fidelity Advisor Cyclical Industries Fund |
Fidelity Advisor Developing Communications Fund |
Fidelity Advisor Diversified International Fund |
Fidelity Advisor Dividend Growth Fund |
Fidelity Advisor Dynamic Capital Appreciation Fund |
Fidelity Advisor Electronics Fund |
Fidelity Advisor Emerging Asia Fund |
Fidelity Advisor Emerging Markets Income Fund |
Fidelity Advisor Equity Growth Fund |
Fidelity Advisor Equity Income Fund |
Fidelity Advisor Equity Value Fund |
Fidelity Advisor Europe Capital Appreciation Fund |
Fidelity Advisor Fifty Fund |
Fidelity Advisor Financial Services Fund |
Fidelity Advisor Floating Rate High Income Fund |
Fidelity Advisor Freedom Income FundSM |
Fidelity Advisor Freedom 2010 FundSM |
Fidelity Advisor Freedom 2020 FundSM |
Fidelity Advisor Freedom 2030 FundSM |
Fidelity Advisor Freedom 2040 FundSM |
Fidelity Advisor Global Equity Fund |
Fidelity Advisor Government Investment Fund |
Fidelity Advisor Growth & Income Fund |
Fidelity Advisor Growth Opportunities |
Fidelity Advisor Health Care Fund |
Fidelity Advisor High Income Advantage Fund |
Fidelity Advisor High Income Fund |
Fidelity Advisor Inflation-Protected Bond Fund |
Fidelity Advisor Intermediate Bond Fund |
Fidelity Advisor International Capital Appreciation Fund |
Fidelity Advisor International Small Cap Fund |
Fidelity Advisor Investment Grade Bond Fund |
Fidelity Advisor Japan Fund |
Fidelity Advisor Korea Fund |
Fidelity Advisor Large Cap Fund |
Fidelity Advisor Latin America Fund |
Fidelity Advisor Leveraged Company Stock Fund |
Fidelity Advisor Mid Cap Fund |
Fidelity Advisor Mortgage Securities Fund |
Fidelity Advisor Municipal Income Fund |
Fidelity Advisor Natural Resources Fund |
Fidelity Advisor New Insights Fund |
Fidelity Advisor New York Municipal Income Fund |
Fidelity Advisor Overseas Fund |
Fidelity Advisor Real Estate Fund |
Fidelity Advisor Short Fixed-Income Fund |
Fidelity Advisor Short Intermediate Municipal Income Fund |
Fidelity Advisor Small Cap Fund |
Fidelity Advisor Strategic Growth Fund |
Fidelity Advisor Strategic Income Fund |
Fidelity Advisor Tax Managed Stock Fund |
Fidelity Advisor Technology Fund |
Fidelity Advisor Telecommunications & Utilities Growth Fund |
Fidelity Advisor Value Leaders Fund |
Fidelity Advisor Value Strategies Fund |
Prime Fund |
Tax-Exempt Fund |
Treasury Fund |
(Fidelity Investment logo)(registered trademark)
Corporate Headquarters
82 Devonshire St., Boston, MA 02109
www.fidelity.com
AVLFI-UANN-1203
1.793580.100
Item 2. Code of Ethics
As of the end of the period, October 31, 2003, the Fidelity Advisor Series VIII has adopted a code of ethics, as defined in Item 2 of Form N-CSR, that applies to its President and Treasurer and its Chief Financial Officer. A copy of the code of ethics is filed as an exhibit to this Form N-CSR.
Item 3. Audit Committee Financial Expert
The Board of Trustees of Fidelity Advisor Series VIII has determined that Marie L. Knowles and Donald J. Kirk are each audit committee financial experts, as defined in Item 3 of Form N-CSR. Ms. Knowles and Mr. Kirk are each independent for purposes of Item 3 of Form N-CSR.
Item 4. Principal Accountant Fees and Services
Not applicable.
Item 5. Audit Committee of Listed Registrants
Not applicable.
Item 6. Reserved
Item 7. Disclosure of Proxy Voting Policies and Procedures for Closed-End Management Investment Companies
Not applicable.
Item 8. Reserved
Item 9. Controls and Procedures
(a)(i) The President and Treasurer and the Chief Financial Officer have concluded that the Fidelity Advisor Series VIII's (the "Trust") disclosure controls and procedures (as defined in Rule 30a-3(c) under the Investment Company Act) provide reasonable assurances that material information relating to the Trust is made known to them by the appropriate persons, based on their evaluation of these controls and procedures as of a date within 90 days of the filing date of this report.
(a)(ii) There was no change in the Trust's internal control over financial reporting (as defined in Rule 30a-3(d) under the Investment Company Act) that occurred during the Trust's second fiscal half-year that has materially affected, or is reasonably likely to materially affect, the Trust's internal control over financial reporting.
Item 10. Exhibits
(a) | (1) | Code of Ethics pursuant to Item 2 of Form N-CSR is filed and attached hereto as EX-99.CODE ETH. |
(a) | (2) | Certification pursuant to Rule 30a-2(a) under the Investment Company Act of 1940 (17 CFR 270.30a-2(a)) is filed and attached hereto as Exhibit 99.CERT. |
(b) | | Certification pursuant to Rule 30a-2(b) under the Investment Company Act of 1940 (17 CFR 270.30a-2(b)) is furnished and attached hereto as Exhibit 99.906CERT. |
SIGNATURES
Pursuant to the requirements of the Securities Exchange Act of 1934 and the Investment Company Act of 1940, the registrant has duly caused this report to be signed on its behalf by the undersigned, thereunto duly authorized.
Fidelity Advisor Series VIII
By: | /s/Maria Dwyer |
| Maria Dwyer |
| President and Treasurer |
| |
Date: | December 23, 2003 |
Pursuant to the requirements of the Securities Exchange Act of 1934 and the Investment Company Act of 1940, this report has been signed below by the following persons on behalf of the registrant and in the capacities and on the dates indicated.
By: | /s/Maria Dwyer |
| Maria Dwyer |
| President and Treasurer |
| |
Date: | December 23, 2003 |
By: | /s/Timothy F. Hayes |
| Timothy F. Hayes |
| Chief Financial Officer |
| |
Date: | December 23, 2003 |