UNITED STATES
SECURITIES AND EXCHANGE COMMISSION
Washington, D.C. 20549
FORM N-CSR
CERTIFIED SHAREHOLDER REPORT OF REGISTERED
MANAGEMENT INVESTMENT COMPANIES
Investment Company Act file number 811-03855
Fidelity Advisor Series VIII
(Exact name of registrant as specified in charter)
245 Summer St., Boston, MA 02210
(Address of principal executive offices) (Zip code)
Margaret Carey, Secretary
245 Summer St.
Boston, Massachusetts 02210
(Name and address of agent for service)
Registrant's telephone number, including area code:
617-563-7000
| |
Date of fiscal year end: | October 31 |
|
|
Date of reporting period: | April 30, 2024 |
Item 1.
Reports to Stockholders
Fidelity Advisor® International Capital Appreciation Fund
Semi-Annual Report
April 30, 2024
Contents
To view a fund's proxy voting guidelines and proxy voting record for the 12-month period ended June 30, visit http://www.fidelity.com/proxyvotingresults or visit the Securities and Exchange Commission's (SEC) web site at http://www.sec.gov.
You may also call 1-877-208-0098 to request a free copy of the proxy voting guidelines.
Standard & Poor's, S&P and S&P 500 are registered service marks of The McGraw-Hill Companies, Inc. and have been licensed for use by Fidelity Distributors Corporation.
Other third-party marks appearing herein are the property of their respective owners.
All other marks appearing herein are registered or unregistered trademarks or service marks of FMR LLC or an affiliated company. © 2024 FMR LLC. All rights reserved.
This report and the financial statements contained herein are submitted for the general information of the shareholders of the Fund. This report is not authorized for distribution to prospective investors in the Fund unless preceded or accompanied by an effective prospectus.
A fund files its complete schedule of portfolio holdings with the SEC for the first and third quarters of each fiscal year on Form N-PORT. Forms N-PORT are available on the SEC's web site at http://www.sec.gov. A fund's Forms N-PORT may be reviewed and copied at the SEC's Public Reference Room in Washington, DC. Information regarding the operation of the SEC's Public Reference Room may be obtained by calling 1-800-SEC-0330.
For a complete list of a fund's portfolio holdings, view the most recent holdings listing, semiannual report, or annual report on Fidelity's web site at http://www.fidelity.com, http://www.institutional.fidelity.com, or http://www.401k.com, as applicable.
NOT FDIC INSURED •MAY LOSE VALUE •NO BANK GUARANTEE
Neither the Fund nor Fidelity Distributors Corporation is a bank.
Top Holdings (% of Fund's net assets) |
| |
| Taiwan Semiconductor Manufacturing Co. Ltd. (Taiwan, Semiconductors & Semiconductor Equipment) | 3.7 | |
| Novo Nordisk A/S Series B (Denmark, Pharmaceuticals) | 3.0 | |
| ASML Holding NV (Netherlands) (Netherlands, Semiconductors & Semiconductor Equipment) | 3.0 | |
| LVMH Moet Hennessy Louis Vuitton SE (France, Textiles, Apparel & Luxury Goods) | 2.3 | |
| Schneider Electric SA (United States of America, Electrical Equipment) | 2.0 | |
| SAP SE (Germany, Software) | 2.0 | |
| L'Oreal SA (France, Personal Care Products) | 1.9 | |
| ASM International NV (Netherlands) (Netherlands, Semiconductors & Semiconductor Equipment) | 1.8 | |
| Tokyo Electron Ltd. (Japan, Semiconductors & Semiconductor Equipment) | 1.8 | |
| ICICI Bank Ltd. (India, Banks) | 1.8 | |
| | 23.3 | |
| |
| Market Sectors (% of Fund's net assets) |
| |
| Information Technology | 25.3 | |
| Industrials | 24.9 | |
| Financials | 21.7 | |
| Consumer Discretionary | 10.2 | |
| Health Care | 6.1 | |
| Materials | 4.9 | |
| Consumer Staples | 3.4 | |
| Communication Services | 1.6 | |
| |
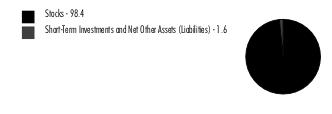
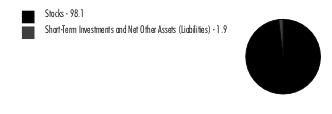
Asset Allocation (% of Fund's net assets) |
|
|
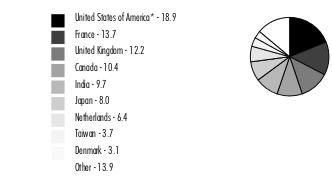
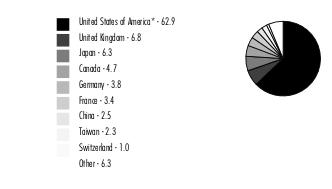
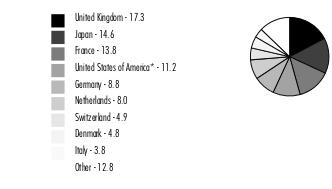
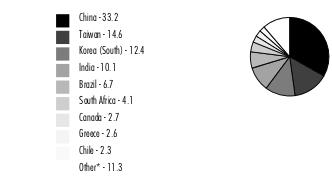
Geographic Diversification (% of Fund's net assets) |
|
* Includes Short-Term investments and Net Other Assets (Liabilities). Percentages are adjusted for the effect of derivatives, if applicable. |
| |
Showing Percentage of Net Assets
| Common Stocks - 98.1% |
| | | Shares | Value ($) |
| Brazil - 1.4% | | | |
| MercadoLibre, Inc. (a) | | 76,918 | 112,200,287 |
| Canada - 10.4% | | | |
| Alimentation Couche-Tard, Inc. Class A (multi-vtg.) | | 2,127,220 | 117,899,892 |
| Brookfield Asset Management Ltd. Class A (b) | | 2,651,429 | 101,258,074 |
| Canadian National Railway Co. | | 962,405 | 116,811,282 |
| Canadian Pacific Kansas City Ltd. | | 1,492,283 | 117,071,561 |
| CGI, Inc. Class A (sub. vtg.) (a) | | 1,022,712 | 103,626,991 |
| Constellation Software, Inc. | | 51,963 | 133,782,313 |
| Constellation Software, Inc. warrants 3/31/40 (a)(c) | | 50,717 | 4 |
| Thomson Reuters Corp. (b) | | 749,889 | 113,263,662 |
TOTAL CANADA | | | 803,713,779 |
| Denmark - 3.1% | | | |
| DSV A/S | | 23,899 | 3,412,042 |
| Novo Nordisk A/S Series B | | 1,832,256 | 234,972,743 |
TOTAL DENMARK | | | 238,384,785 |
| France - 13.7% | | | |
| Air Liquide SA | | 685,401 | 134,049,780 |
| Capgemini SA | | 536,075 | 112,672,818 |
| Dassault Systemes SA | | 2,727,612 | 107,064,018 |
| EssilorLuxottica SA | | 564,803 | 121,033,759 |
| Hermes International SCA | | 54,316 | 130,481,546 |
| L'Oreal SA | | 307,732 | 144,386,156 |
| LVMH Moet Hennessy Louis Vuitton SE | | 218,685 | 179,635,805 |
| Safran SA | | 605,225 | 131,232,159 |
TOTAL FRANCE | | | 1,060,556,041 |
| Germany - 2.0% | | | |
| SAP SE | | 849,214 | 153,340,066 |
| India - 9.7% | | | |
| Axis Bank Ltd. | | 9,328,325 | 130,168,620 |
| Bharti Airtel Ltd. | | 7,931,012 | 125,501,806 |
| HCL Technologies Ltd. | | 6,631,354 | 108,159,714 |
| HDFC Bank Ltd. | | 7,443,331 | 135,136,840 |
| ICICI Bank Ltd. | | 9,960,649 | 137,208,235 |
| Larsen & Toubro Ltd. | | 2,734,128 | 117,495,579 |
TOTAL INDIA | | | 753,670,794 |
| Indonesia - 1.4% | | | |
| PT Bank Central Asia Tbk | | 185,693,227 | 111,654,479 |
| Ireland - 1.5% | | | |
| Kingspan Group PLC (Ireland) | | 1,325,669 | 118,627,120 |
| Italy - 1.8% | | | |
| Ferrari NV (Italy) | | 328,425 | 135,711,727 |
| Japan - 8.0% | | | |
| Hoya Corp. | | 1,004,723 | 116,487,409 |
| Keyence Corp. | | 302,159 | 132,880,421 |
| OBIC Co. Ltd. | | 809,497 | 103,993,284 |
| Shin-Etsu Chemical Co. Ltd. | | 3,371,369 | 130,502,120 |
| Tokyo Electron Ltd. | | 635,744 | 139,447,850 |
TOTAL JAPAN | | | 623,311,084 |
| Netherlands - 6.4% | | | |
| ASM International NV (Netherlands) | | 220,680 | 140,175,372 |
| ASML Holding NV (Netherlands) | | 263,995 | 234,601,122 |
| Wolters Kluwer NV | | 817,437 | 122,785,904 |
TOTAL NETHERLANDS | | | 497,562,398 |
| Sweden - 2.9% | | | |
| ASSA ABLOY AB (B Shares) | | 3,790,300 | 100,145,098 |
| Atlas Copco AB (A Shares) | | 7,192,270 | 125,980,435 |
TOTAL SWEDEN | | | 226,125,533 |
| Switzerland - 2.9% | | | |
| Partners Group Holding AG | | 80,846 | 104,613,889 |
| UBS Group AG | | 4,610,575 | 121,728,208 |
TOTAL SWITZERLAND | | | 226,342,097 |
| Taiwan - 3.7% | | | |
| Taiwan Semiconductor Manufacturing Co. Ltd. | | 11,991,081 | 286,601,169 |
| United Kingdom - 12.2% | | | |
| 3i Group PLC | | 3,259,408 | 116,450,342 |
| Ashtead Group PLC | | 1,808,352 | 132,007,366 |
| BAE Systems PLC | | 7,199,957 | 119,751,243 |
| Compass Group PLC | | 4,369,628 | 121,535,642 |
| InterContinental Hotel Group PLC | | 1,110,857 | 108,346,342 |
| London Stock Exchange Group PLC | | 1,031,273 | 113,687,648 |
| RELX PLC (London Stock Exchange) | | 3,245,888 | 133,363,414 |
| Sage Group PLC | | 7,161,989 | 104,348,411 |
TOTAL UNITED KINGDOM | | | 949,490,408 |
| United States of America - 17.0% | | | |
| Arthur J. Gallagher & Co. | | 419,600 | 98,475,924 |
| Experian PLC | | 2,792,606 | 112,636,818 |
| Linde PLC | | 263,826 | 116,336,713 |
| Marsh & McLennan Companies, Inc. | | 548,293 | 109,346,073 |
| MasterCard, Inc. Class A | | 211,284 | 95,331,341 |
| Moody's Corp. | | 291,820 | 108,069,701 |
| NVIDIA Corp. | | 125,014 | 108,014,596 |
| S&P Global, Inc. | | 265,839 | 110,543,831 |
| Schneider Electric SA | | 681,611 | 155,416,378 |
| Uber Technologies, Inc. (a) | | 1,497,099 | 99,212,751 |
| Visa, Inc. Class A | | 357,769 | 96,100,331 |
| Waste Connections, Inc. (Canada) | | 660,044 | 107,014,725 |
TOTAL UNITED STATES OF AMERICA | | | 1,316,499,182 |
| TOTAL COMMON STOCKS (Cost $5,655,661,304) | | | 7,613,790,949 |
| | | | |
| Money Market Funds - 3.4% |
| | | Shares | Value ($) |
| Fidelity Cash Central Fund 5.39% (d) | | 156,781,669 | 156,813,025 |
| Fidelity Securities Lending Cash Central Fund 5.39% (d)(e) | | 105,564,519 | 105,575,075 |
| TOTAL MONEY MARKET FUNDS (Cost $262,388,100) | | | 262,388,100 |
| | | | |
| TOTAL INVESTMENT IN SECURITIES - 101.5% (Cost $5,918,049,404) | 7,876,179,049 |
NET OTHER ASSETS (LIABILITIES) - (1.5)% | (119,376,444) |
| NET ASSETS - 100.0% | 7,756,802,605 |
| | |
Legend
| (b) | Security or a portion of the security is on loan at period end. |
| (d) | Affiliated fund that is generally available only to investment companies and other accounts managed by Fidelity Investments. The rate quoted is the annualized seven-day yield of the fund at period end. A complete unaudited listing of the fund's holdings as of its most recent quarter end is available upon request. In addition, each Fidelity Central Fund's financial statements are available on the SEC's website or upon request. |
| (e) | Investment made with cash collateral received from securities on loan. |
Affiliated Central Funds
Fiscal year to date information regarding the Fund's investments in Fidelity Central Funds, including the ownership percentage, is presented below.
| Affiliate | Value, beginning of period ($) | Purchases ($) | Sales Proceeds ($) | Dividend Income ($) | Realized Gain (loss) ($) | Change in Unrealized appreciation (depreciation) ($) | Value, end of period ($) | % ownership, end of period |
| Fidelity Cash Central Fund 5.39% | 101,117,912 | 1,156,340,413 | 1,100,644,345 | 3,980,271 | (955) | - | 156,813,025 | 0.3% |
| Fidelity Securities Lending Cash Central Fund 5.39% | 21,521,790 | 176,992,935 | 92,939,650 | 25,694 | - | - | 105,575,075 | 0.4% |
| Total | 122,639,702 | 1,333,333,348 | 1,193,583,995 | 4,005,965 | (955) | - | 262,388,100 | |
| | | | | | | | | |
Amounts in the dividend income column in the above table include any capital gain distributions from underlying funds, which are presented in the corresponding line item in the Statement of Operations, if applicable.
Amounts in the dividend income column for Fidelity Securities Lending Cash Central Fund represents the income earned on investing cash collateral, less rebates paid to borrowers and any lending agent fees associated with the loan, plus any premium payments received for lending certain types of securities.
Amounts included in the purchases and sales proceeds columns may include in-kind transactions, if applicable.
Investment Valuation
The following is a summary of the inputs used, as of April 30, 2024, involving the Fund's assets and liabilities carried at fair value. The inputs or methodology used for valuing securities may not be an indication of the risk associated with investing in those securities. For more information on valuation inputs, and their aggregation into the levels used below, please refer to the Investment Valuation section in the accompanying Notes to Financial Statements.
| Valuation Inputs at Reporting Date: |
| Description | Total ($) | Level 1 ($) | Level 2 ($) | Level 3 ($) |
Investments in Securities: | | | | |
|
| Equities: | | | | |
Communication Services | 125,501,806 | - | 125,501,806 | - |
Consumer Discretionary | 787,911,349 | 378,393,560 | 409,517,789 | - |
Consumer Staples | 262,286,048 | 262,286,048 | - | - |
Financials | 1,689,773,536 | 945,467,372 | 744,306,164 | - |
Health Care | 472,493,911 | 121,033,759 | 351,460,152 | - |
Industrials | 1,926,227,537 | 930,206,413 | 996,021,124 | - |
Information Technology | 1,968,708,149 | 824,548,805 | 1,144,159,340 | 4 |
Materials | 380,888,613 | 116,336,713 | 264,551,900 | - |
|
| Money Market Funds | 262,388,100 | 262,388,100 | - | - |
| Total Investments in Securities: | 7,876,179,049 | 3,840,660,770 | 4,035,518,275 | 4 |
| Statement of Assets and Liabilities |
| | | | April 30, 2024 (Unaudited) |
| | | | | |
| Assets | | | | |
| Investment in securities, at value (including securities loaned of $98,945,541) - See accompanying schedule: | | | | |
Unaffiliated issuers (cost $5,655,661,304) | $ | 7,613,790,949 | | |
Fidelity Central Funds (cost $262,388,100) | | 262,388,100 | | |
| | | | | |
| | | | | |
| Total Investment in Securities (cost $5,918,049,404) | | | $ | 7,876,179,049 |
| Foreign currency held at value (cost $2,551,160) | | | | 2,539,429 |
| Receivable for investments sold | | | | 711,280 |
| Receivable for fund shares sold | | | | 23,360,303 |
| Dividends receivable | | | | 15,208,544 |
| Reclaims receivable | | | | 9,643,677 |
| Distributions receivable from Fidelity Central Funds | | | | 1,023,591 |
| Prepaid expenses | | | | 1,996 |
| Other receivables | | | | 1,967,926 |
Total assets | | | | 7,930,635,795 |
| Liabilities | | | | |
| Payable for investments purchased | $ | 34,980,250 | | |
| Payable for fund shares redeemed | | 6,644,039 | | |
| Accrued management fee | | 5,581,149 | | |
| Distribution and service plan fees payable | | 288,596 | | |
| Deferred taxes | | 20,295,951 | | |
| Other payables and accrued expenses | | 468,130 | | |
| Collateral on securities loaned | | 105,575,075 | | |
| Total liabilities | | | | 173,833,190 |
| Net Assets | | | $ | 7,756,802,605 |
| Net Assets consist of: | | | | |
| Paid in capital | | | $ | 6,301,337,647 |
| Total accumulated earnings (loss) | | | | 1,455,464,958 |
| Net Assets | | | $ | 7,756,802,605 |
| | | | | |
| Net Asset Value and Maximum Offering Price | | | | |
| Class A : | | | | |
Net Asset Value and redemption price per share ($578,574,253 ÷ 20,297,402 shares)(a) | | | $ | 28.50 |
| Maximum offering price per share (100/94.25 of $28.50) | | | $ | 30.24 |
| Class M : | | | | |
Net Asset Value and redemption price per share ($176,441,351 ÷ 6,396,556 shares)(a) | | | $ | 27.58 |
| Maximum offering price per share (100/96.50 of $27.58) | | | $ | 28.58 |
| Class C : | | | | |
Net Asset Value and offering price per share ($107,367,754 ÷ 4,435,976 shares)(a) | | | $ | 24.20 |
| Class I : | | | | |
Net Asset Value, offering price and redemption price per share ($5,127,628,973 ÷ 167,047,258 shares) | | | $ | 30.70 |
| Class Z : | | | | |
Net Asset Value, offering price and redemption price per share ($1,766,790,274 ÷ 57,375,032 shares) | | | $ | 30.79 |
(a)Redemption price per share is equal to net asset value less any applicable contingent deferred sales charge. |
| Statement of Operations |
| | | | Six months ended April 30, 2024 (Unaudited) |
| Investment Income | | | | |
| Dividends | | | $ | 41,299,576 |
| Income from Fidelity Central Funds (including $25,694 from security lending) | | | | 4,005,965 |
| Income before foreign taxes withheld | | | $ | 45,305,541 |
| Less foreign taxes withheld | | | | (3,759,782) |
| Total income | | | | 41,545,759 |
| Expenses | | | | |
| Management fee | | | | |
| Basic fee | $ | 25,381,805 | | |
| Performance adjustment | | 2,514,947 | | |
| Transfer agent fees | | 3,183,738 | | |
| Distribution and service plan fees | | 1,673,834 | | |
| Accounting fees | | 576,480 | | |
| Custodian fees and expenses | | 370,388 | | |
| Independent trustees' fees and expenses | | 16,650 | | |
| Registration fees | | 247,695 | | |
| Audit | | 53,984 | | |
| Legal | | 4,038 | | |
| Miscellaneous | | 12,339 | | |
| Total expenses before reductions | | 34,035,898 | | |
| Expense reductions | | (314,912) | | |
| Total expenses after reductions | | | | 33,720,986 |
| Net Investment income (loss) | | | | 7,824,773 |
| Realized and Unrealized Gain (Loss) | | | | |
| Net realized gain (loss) on: | | | | |
| Investment Securities: | | | | |
| Unaffiliated issuers (net of foreign taxes of $1,416,627) | | 172,624,698 | | |
| Fidelity Central Funds | | (955) | | |
| Foreign currency transactions | | 377,151 | | |
| Total net realized gain (loss) | | | | 173,000,894 |
| Change in net unrealized appreciation (depreciation) on: | | | | |
| Investment Securities: | | | | |
| Unaffiliated issuers (net of increase in deferred foreign taxes of $10,960,261) | | 1,059,026,744 | | |
| Assets and liabilities in foreign currencies | | (291,755) | | |
| Total change in net unrealized appreciation (depreciation) | | | | 1,058,734,989 |
| Net gain (loss) | | | | 1,231,735,883 |
| Net increase (decrease) in net assets resulting from operations | | | $ | 1,239,560,656 |
| Statement of Changes in Net Assets |
| |
| | Six months ended April 30, 2024 (Unaudited) | | Year ended October 31, 2023 |
| Increase (Decrease) in Net Assets | | | | |
| Operations | | | | |
| Net investment income (loss) | $ | 7,824,773 | $ | 25,633,375 |
| Net realized gain (loss) | | 173,000,894 | | 65,435,640 |
| Change in net unrealized appreciation (depreciation) | | 1,058,734,989 | | 619,562,948 |
| Net increase (decrease) in net assets resulting from operations | | 1,239,560,656 | | 710,631,963 |
| Distributions to shareholders | | (23,553,740) | | - |
| | | | | |
| Share transactions - net increase (decrease) | | 821,046,905 | | 263,865,104 |
| Total increase (decrease) in net assets | | 2,037,053,821 | | 974,497,067 |
| | | | | |
| Net Assets | | | | |
| Beginning of period | | 5,719,748,784 | | 4,745,251,717 |
| End of period | $ | 7,756,802,605 | $ | 5,719,748,784 |
| | | | | |
| | | | | |
Financial Highlights
Fidelity Advisor® International Capital Appreciation Fund Class A |
| |
| | Six months ended (Unaudited) April 30, 2024 | | Years ended October 31, 2023 | | 2022 | | 2021 | | 2020 | | 2019 |
Selected Per-Share Data | | | | | | | | | | | | |
| Net asset value, beginning of period | $ | 23.51 | $ | 20.33 | $ | 30.72 | $ | 24.14 | $ | 21.45 | $ | 17.63 |
| Income from Investment Operations | | | | | | | | | | | | |
Net investment income (loss) A,B | | - C | | .06 | | (.04) | | (.09) | | - C | | .11 D |
| Net realized and unrealized gain (loss) | | 5.03 | | 3.12 | | (9.21) | | 6.67 | | 2.77 | | 3.75 |
| Total from investment operations | | 5.03 | | 3.18 | | (9.25) | | 6.58 | | 2.77 | | 3.86 |
| Distributions from net investment income | | (.04) | | - | | - | | - | | (.08) | | (.04) |
| Distributions from net realized gain | | - | | - | | (1.14) | | - | | - | | - |
| Total distributions | | (.04) | | - | | (1.14) | | - | | (.08) | | (.04) |
| Net asset value, end of period | $ | 28.50 | $ | 23.51 | $ | 20.33 | $ | 30.72 | $ | 24.14 | $ | 21.45 |
Total Return E,F,G | | | | 15.64% | | (31.18)% | | 27.26% | | 12.97% | | 21.93% |
Ratios to Average Net Assets B,H,I | | | | | | | | | | | | |
| Expenses before reductions | | 1.18% J | | 1.06% | | 1.24% | | 1.23% | | 1.28% | | 1.27% |
| Expenses net of fee waivers, if any | | | | 1.06% | | 1.24% | | 1.23% | | 1.28% | | 1.27% |
| Expenses net of all reductions | | 1.18% J | | 1.06% | | 1.24% | | 1.23% | | 1.24% | | 1.25% |
| Net investment income (loss) | | (.01)% J | | .23% | | (.18)% | | (.30)% | | (.01)% | | .57% D |
| Supplemental Data | | | | | | | | | | | | |
| Net assets, end of period (000 omitted) | $ | 578,574 | $ | 464,374 | $ | 400,112 | $ | 592,640 | $ | 382,795 | $ | 278,326 |
Portfolio turnover rate K | | | | 80% | | 110% L | | 128% | | 121% | | 133% |
ACalculated based on average shares outstanding during the period.
BNet investment income (loss) is affected by the timing of the declaration of dividends by any underlying mutual funds or exchange-traded funds (ETFs). Net investment income (loss) of any mutual funds or ETFs is not included in the Fund's net investment income (loss) ratio.
CAmount represents less than $.005 per share.
DNet investment income per share reflects one or more large, non-recurring dividend(s) which amounted to $.08 per share. Excluding such non-recurring dividend(s), the ratio of net investment income (loss) to average net assets would have been .15%.
ETotal returns would have been lower if certain expenses had not been reduced during the applicable periods shown.
FTotal returns for periods of less than one year are not annualized.
GTotal returns do not include the effect of the sales charges.
HFees and expenses of any underlying mutual funds or exchange-traded funds (ETFs) are not included in the Fund's expense ratio. The Fund indirectly bears its proportionate share of these expenses. For additional expense information related to investments in Fidelity Central Funds, please refer to the "Investments in Fidelity Central Funds" note found in the Notes to Financial Statements section of the most recent Annual or Semi-Annual report.
IExpense ratios reflect operating expenses of the class. Expenses before reductions do not reflect amounts reimbursed, waived, or reduced through arrangements with the investment adviser, brokerage services, or other offset arrangements, if applicable, and do not represent the amount paid by the class during periods when reimbursements, waivers or reductions occur.
JAnnualized.
KAmount does not include the portfolio activity of any underlying mutual funds or exchange-traded funds (ETFs).
LPortfolio turnover rate excludes securities received or delivered in-kind.
Fidelity Advisor® International Capital Appreciation Fund Class M |
| |
| | Six months ended (Unaudited) April 30, 2024 | | Years ended October 31, 2023 | | 2022 | | 2021 | | 2020 | | 2019 |
Selected Per-Share Data | | | | | | | | | | | | |
| Net asset value, beginning of period | $ | 22.74 | $ | 19.71 | $ | 29.82 | $ | 23.49 | $ | 20.89 | $ | 17.17 |
| Income from Investment Operations | | | | | | | | | | | | |
Net investment income (loss) A,B | | (.03) | | (.01) | | (.10) | | (.15) | | (.06) | | .06 C |
| Net realized and unrealized gain (loss) | | 4.87 | | 3.04 | | (8.95) | | 6.48 | | 2.70 | | 3.66 |
| Total from investment operations | | 4.84 | | 3.03 | | (9.05) | | 6.33 | | 2.64 | | 3.72 |
| Distributions from net investment income | | - | | - | | - | | - | | (.04) | | - |
| Distributions from net realized gain | | - | | - | | (1.06) | | - | | - | | - |
| Total distributions | | - | | - | | (1.06) | | - | | (.04) | | - |
| Net asset value, end of period | $ | 27.58 | $ | 22.74 | $ | 19.71 | $ | 29.82 | $ | 23.49 | $ | 20.89 |
Total Return D,E,F | | | | 15.37% | | (31.39)% | | 26.95% | | 12.67% | | 21.67% |
Ratios to Average Net Assets B,G,H | | | | | | | | | | | | |
| Expenses before reductions | | 1.43% I | | 1.31% | | 1.49% | | 1.49% | | 1.53% | | 1.53% |
| Expenses net of fee waivers, if any | | | | 1.31% | | 1.49% | | 1.48% | | 1.53% | | 1.53% |
| Expenses net of all reductions | | 1.42% I | | 1.31% | | 1.49% | | 1.48% | | 1.49% | | 1.51% |
| Net investment income (loss) | | (.26)% I | | (.02)% | | (.43)% | | (.55)% | | (.26)% | | .31% C |
| Supplemental Data | | | | | | | | | | | | |
| Net assets, end of period (000 omitted) | $ | 176,441 | $ | 149,358 | $ | 126,232 | $ | 191,997 | $ | 143,072 | $ | 127,176 |
Portfolio turnover rate J | | | | 80% | | 110% K | | 128% | | 121% | | 133% |
ACalculated based on average shares outstanding during the period.
BNet investment income (loss) is affected by the timing of the declaration of dividends by any underlying mutual funds or exchange-traded funds (ETFs). Net investment income (loss) of any mutual funds or ETFs is not included in the Fund's net investment income (loss) ratio.
CNet investment income per share reflects one or more large, non-recurring dividend(s) which amounted to $.08 per share. Excluding such non-recurring dividend(s), the ratio of net investment income (loss) to average net assets would have been (.11)%.
DTotal returns for periods of less than one year are not annualized.
ETotal returns would have been lower if certain expenses had not been reduced during the applicable periods shown.
FTotal returns do not include the effect of the sales charges.
GFees and expenses of any underlying mutual funds or exchange-traded funds (ETFs) are not included in the Fund's expense ratio. The Fund indirectly bears its proportionate share of these expenses. For additional expense information related to investments in Fidelity Central Funds, please refer to the "Investments in Fidelity Central Funds" note found in the Notes to Financial Statements section of the most recent Annual or Semi-Annual report.
HExpense ratios reflect operating expenses of the class. Expenses before reductions do not reflect amounts reimbursed, waived, or reduced through arrangements with the investment adviser, brokerage services, or other offset arrangements, if applicable, and do not represent the amount paid by the class during periods when reimbursements, waivers or reductions occur.
IAnnualized.
JAmount does not include the portfolio activity of any underlying mutual funds or exchange-traded funds (ETFs).
KPortfolio turnover rate excludes securities received or delivered in-kind.
Fidelity Advisor® International Capital Appreciation Fund Class C |
| |
| | Six months ended (Unaudited) April 30, 2024 | | Years ended October 31, 2023 | | 2022 | | 2021 | | 2020 | | 2019 |
Selected Per-Share Data | | | | | | | | | | | | |
| Net asset value, beginning of period | $ | 20.00 | $ | 17.43 | $ | 26.58 | $ | 21.04 | $ | 18.77 | $ | 15.51 |
| Income from Investment Operations | | | | | | | | | | | | |
Net investment income (loss) A,B | | (.09) | | (.11) | | (.20) | | (.26) | | (.15) | | (.03) C |
| Net realized and unrealized gain (loss) | | 4.29 | | 2.68 | | (7.92) | | 5.80 | | 2.42 | | 3.29 |
| Total from investment operations | | 4.20 | | 2.57 | | (8.12) | | 5.54 | | 2.27 | | 3.26 |
| Distributions from net realized gain | | - | | - | | (1.03) | | - | | - | | - |
| Total distributions | | - | | - | | (1.03) | | - | | - | | - |
| Net asset value, end of period | $ | 24.20 | $ | 20.00 | $ | 17.43 | $ | 26.58 | $ | 21.04 | $ | 18.77 |
Total Return D,E,F | | | | 14.74% | | (31.70)% | | 26.33% | | 12.09% | | 21.02% |
Ratios to Average Net Assets B,G,H | | | | | | | | | | | | |
| Expenses before reductions | | 1.93% I | | 1.81% | | 1.99% | | 1.98% | | 2.02% | | 2.02% |
| Expenses net of fee waivers, if any | | | | 1.81% | | 1.99% | | 1.98% | | 2.02% | | 2.01% |
| Expenses net of all reductions | | 1.92% I | | 1.81% | | 1.99% | | 1.98% | | 1.99% | | 2.00% |
| Net investment income (loss) | | (.75)% I | | (.52)% | | (.93)% | | (1.05)% | | (.75)% | | (.17)% C |
| Supplemental Data | | | | | | | | | | | | |
| Net assets, end of period (000 omitted) | $ | 107,368 | $ | 96,072 | $ | 97,124 | $ | 169,018 | $ | 125,630 | $ | 112,150 |
Portfolio turnover rate J | | | | 80% | | 110% K | | 128% | | 121% | | 133% |
ACalculated based on average shares outstanding during the period.
BNet investment income (loss) is affected by the timing of the declaration of dividends by any underlying mutual funds or exchange-traded funds (ETFs). Net investment income (loss) of any mutual funds or ETFs is not included in the Fund's net investment income (loss) ratio.
CNet investment income per share reflects one or more large, non-recurring dividend(s) which amounted to $.07 per share. Excluding such non-recurring dividend(s), the ratio of net investment income (loss) to average net assets would have been (.60)%.
DTotal returns for periods of less than one year are not annualized.
ETotal returns would have been lower if certain expenses had not been reduced during the applicable periods shown.
FTotal returns do not include the effect of the contingent deferred sales charge.
GFees and expenses of any underlying mutual funds or exchange-traded funds (ETFs) are not included in the Fund's expense ratio. The Fund indirectly bears its proportionate share of these expenses. For additional expense information related to investments in Fidelity Central Funds, please refer to the "Investments in Fidelity Central Funds" note found in the Notes to Financial Statements section of the most recent Annual or Semi-Annual report.
HExpense ratios reflect operating expenses of the class. Expenses before reductions do not reflect amounts reimbursed, waived, or reduced through arrangements with the investment adviser, brokerage services, or other offset arrangements, if applicable, and do not represent the amount paid by the class during periods when reimbursements, waivers or reductions occur.
IAnnualized.
JAmount does not include the portfolio activity of any underlying mutual funds or exchange-traded funds (ETFs).
KPortfolio turnover rate excludes securities received or delivered in-kind.
Fidelity Advisor® International Capital Appreciation Fund Class I |
| |
| | Six months ended (Unaudited) April 30, 2024 | | Years ended October 31, 2023 | | 2022 | | 2021 | | 2020 | | 2019 |
Selected Per-Share Data | | | | | | | | | | | | |
| Net asset value, beginning of period | $ | 25.33 | $ | 21.85 | $ | 32.92 | $ | 25.83 | $ | 22.93 | $ | 18.85 |
| Income from Investment Operations | | | | | | | | | | | | |
Net investment income (loss) A,B | | .04 | | .13 | | .02 | | (.01) | | .06 | | .18 C |
| Net realized and unrealized gain (loss) | | 5.44 | | 3.35 | | (9.88) | | 7.13 | | 2.97 | | 4.00 |
| Total from investment operations | | 5.48 | | 3.48 | | (9.86) | | 7.12 | | 3.03 | | 4.18 |
| Distributions from net investment income | | (.11) | | - | | - | | (.03) | | (.13) | | (.10) |
| Distributions from net realized gain | | - | | - | | (1.21) | | - | | - | | - |
| Total distributions | | (.11) | | - | | (1.21) | | (.03) | | (.13) | | (.10) |
| Net asset value, end of period | $ | 30.70 | $ | 25.33 | $ | 21.85 | $ | 32.92 | $ | 25.83 | $ | 22.93 |
Total Return D,E | | | | 15.93% | | (31.01)% | | 27.60% | | 13.28% | | 22.29% |
Ratios to Average Net Assets B,F,G | | | | | | | | | | | | |
| Expenses before reductions | | .93% H | | .80% | | .98% | | .97% | | 1.01% | | .99% |
| Expenses net of fee waivers, if any | | | | .79% | | .97% | | .97% | | 1.01% | | .99% |
| Expenses net of all reductions | | .93% H | | .79% | | .97% | | .97% | | .97% | | .98% |
| Net investment income (loss) | | .24% H | | .49% | | .08% | | (.04)% | | .26% | | .85% C |
| Supplemental Data | | | | | | | | | | | | |
| Net assets, end of period (000 omitted) | $ | 5,127,629 | $ | 3,758,357 | $ | 3,228,604 | $ | 6,128,293 | $ | 3,883,309 | $ | 2,020,956 |
Portfolio turnover rate I | | | | 80% | | 110% J | | 128% | | 121% | | 133% |
ACalculated based on average shares outstanding during the period.
BNet investment income (loss) is affected by the timing of the declaration of dividends by any underlying mutual funds or exchange-traded funds (ETFs). Net investment income (loss) of any mutual funds or ETFs is not included in the Fund's net investment income (loss) ratio.
CNet investment income per share reflects one or more large, non-recurring dividend(s) which amounted to $.09 per share. Excluding such non-recurring dividend(s), the ratio of net investment income (loss) to average net assets would have been .43%.
DTotal returns for periods of less than one year are not annualized.
ETotal returns would have been lower if certain expenses had not been reduced during the applicable periods shown.
FFees and expenses of any underlying mutual funds or exchange-traded funds (ETFs) are not included in the Fund's expense ratio. The Fund indirectly bears its proportionate share of these expenses. For additional expense information related to investments in Fidelity Central Funds, please refer to the "Investments in Fidelity Central Funds" note found in the Notes to Financial Statements section of the most recent Annual or Semi-Annual report.
GExpense ratios reflect operating expenses of the class. Expenses before reductions do not reflect amounts reimbursed, waived, or reduced through arrangements with the investment adviser, brokerage services, or other offset arrangements, if applicable, and do not represent the amount paid by the class during periods when reimbursements, waivers or reductions occur.
HAnnualized.
IAmount does not include the portfolio activity of any underlying mutual funds or exchange-traded funds (ETFs).
JPortfolio turnover rate excludes securities received or delivered in-kind.
Fidelity Advisor® International Capital Appreciation Fund Class Z |
| |
| | Six months ended (Unaudited) April 30, 2024 | | Years ended October 31, 2023 | | 2022 | | 2021 | | 2020 | | 2019 |
Selected Per-Share Data | | | | | | | | | | | | |
| Net asset value, beginning of period | $ | 25.43 | $ | 21.90 | $ | 32.99 | $ | 25.88 | $ | 22.96 | $ | 18.88 |
| Income from Investment Operations | | | | | | | | | | | | |
Net investment income (loss) A,B | | .05 | | .16 | | .06 | | .03 | | .09 | | .21 C |
| Net realized and unrealized gain (loss) | | 5.45 | | 3.37 | | (9.91) | | 7.14 | | 2.98 | | 3.99 |
| Total from investment operations | | 5.50 | | 3.53 | | (9.85) | | 7.17 | | 3.07 | | 4.20 |
| Distributions from net investment income | | (.14) | | - | | - | | (.06) | | (.15) | | (.12) |
| Distributions from net realized gain | | - | | - | | (1.24) | | - | | - | | - |
| Total distributions | | (.14) | | - | | (1.24) | | (.06) | | (.15) | | (.12) |
| Net asset value, end of period | $ | 30.79 | $ | 25.43 | $ | 21.90 | $ | 32.99 | $ | 25.88 | $ | 22.96 |
Total Return D,E | | | | 16.12% | | (30.93)% | | 27.73% | | 13.45% | | 22.41% |
Ratios to Average Net Assets B,F,G | | | | | | | | | | | | |
| Expenses before reductions | | .82% H | | .67% | | .85% | | .85% | | .88% | | .87% |
| Expenses net of fee waivers, if any | | | | .67% | | .85% | | .85% | | .88% | | .87% |
| Expenses net of all reductions | | .81% H | | .67% | | .85% | | .85% | | .84% | | .85% |
| Net investment income (loss) | | .36% H | | .62% | | .21% | | .09% | | .39% | | .97% C |
| Supplemental Data | | | | | | | | | | | | |
| Net assets, end of period (000 omitted) | $ | 1,766,790 | $ | 1,251,587 | $ | 893,180 | $ | 1,845,967 | $ | 1,130,329 | $ | 403,241 |
Portfolio turnover rate I | | | | 80% | | 110% J | | 128% | | 121% | | 133% |
ACalculated based on average shares outstanding during the period.
BNet investment income (loss) is affected by the timing of the declaration of dividends by any underlying mutual funds or exchange-traded funds (ETFs). Net investment income (loss) of any mutual funds or ETFs is not included in the Fund's net investment income (loss) ratio.
CNet investment income per share reflects one or more large, non-recurring dividend(s) which amounted to $.09 per share. Excluding such non-recurring dividend(s), the ratio of net investment income (loss) to average net assets would have been .55%.
DTotal returns for periods of less than one year are not annualized.
ETotal returns would have been lower if certain expenses had not been reduced during the applicable periods shown.
FFees and expenses of any underlying mutual funds or exchange-traded funds (ETFs) are not included in the Fund's expense ratio. The Fund indirectly bears its proportionate share of these expenses. For additional expense information related to investments in Fidelity Central Funds, please refer to the "Investments in Fidelity Central Funds" note found in the Notes to Financial Statements section of the most recent Annual or Semi-Annual report.
GExpense ratios reflect operating expenses of the class. Expenses before reductions do not reflect amounts reimbursed, waived, or reduced through arrangements with the investment adviser, brokerage services, or other offset arrangements, if applicable, and do not represent the amount paid by the class during periods when reimbursements, waivers or reductions occur.
HAnnualized.
IAmount does not include the portfolio activity of any underlying mutual funds or exchange-traded funds (ETFs).
JPortfolio turnover rate excludes securities received or delivered in-kind.
For the period ended April 30, 2024
1. Organization.
Fidelity Advisor International Capital Appreciation Fund (the Fund) is a fund of Fidelity Advisor Series VIII (the Trust) and is authorized to issue an unlimited number of shares. The Trust is registered under the Investment Company Act of 1940, as amended (the 1940 Act), as an open-end management investment company organized as a Massachusetts business trust. The Fund offers Class A, Class M, Class C, Class I and Class Z shares, each of which has equal rights as to assets and voting privileges. Class A, Class M, Class C, Class I and Class Z are Fidelity Advisor classes. Each class has exclusive voting rights with respect to matters that affect that class. Class C shares will automatically convert to Class A shares after a holding period of eight years from the initial date of purchase, with certain exceptions. The Fund's investments in emerging markets can be subject to social, economic, regulatory, and political uncertainties and can be extremely volatile.
2. Investments in Fidelity Central Funds.
Funds may invest in Fidelity Central Funds, which are open-end investment companies generally available only to other investment companies and accounts managed by the investment adviser and its affiliates. The Schedule of Investments lists any Fidelity Central Funds held as an investment as of period end, but does not include the underlying holdings of each Fidelity Central Fund. An investing fund indirectly bears its proportionate share of the expenses of the underlying Fidelity Central Funds.
Based on its investment objective, each Fidelity Central Fund may invest or participate in various investment vehicles or strategies that are similar to those of the investing fund. These strategies are consistent with the investment objectives of the investing fund and may involve certain economic risks which may cause a decline in value of each of the Fidelity Central Funds and thus a decline in the value of the investing fund.
| Fidelity Central Fund | Investment Manager | Investment Objective | Investment Practices | Expense RatioA |
| Fidelity Money Market Central Funds | Fidelity Management & Research Company LLC (FMR) | Each fund seeks to obtain a high level of current income consistent with the preservation of capital and liquidity. | Short-term Investments | Less than .005% |
A Expenses expressed as a percentage of average net assets and are as of each underlying Central Fund's most recent annual or semi-annual shareholder report.
A complete unaudited list of holdings for each Fidelity Central Fund is available upon request or at the Securities and Exchange Commission website at www.sec.gov. In addition, the financial statements of the Fidelity Central Funds which contain the significant accounting policies (including investment valuation policies) of those funds, and are not covered by the Report of Independent Registered Public Accounting Firm, are available on the Securities and Exchange Commission website or upon request.
3. Significant Accounting Policies.
The Fund is an investment company and applies the accounting and reporting guidance of the Financial Accounting Standards Board (FASB) Accounting Standards Codification Topic 946 Financial Services - Investment Companies. The financial statements have been prepared in conformity with accounting principles generally accepted in the United States of America (GAAP), which require management to make certain estimates and assumptions at the date of the financial statements. Actual results could differ from those estimates. Subsequent events, if any, through the date that the financial statements were issued have been evaluated in the preparation of the financial statements. The Fund's Schedule of Investments lists any underlying mutual funds or exchange-traded funds (ETFs) but does not include the underlying holdings of these funds. The following summarizes the significant accounting policies of the Fund:
Investment Valuation. Investments are valued as of 4:00 p.m. Eastern time on the last calendar day of the period. The Board of Trustees (the Board) has designated the Fund's investment adviser as the valuation designee responsible for the fair valuation function and performing fair value determinations as needed. The investment adviser has established a Fair Value Committee (the Committee) to carry out the day-to-day fair valuation responsibilities and has adopted policies and procedures to govern the fair valuation process and the activities of the Committee. In accordance with these fair valuation policies and procedures, which have been approved by the Board, the Fund attempts to obtain prices from one or more third party pricing services or brokers to value its investments. When current market prices, quotations or currency exchange rates are not readily available or reliable, investments will be fair valued in good faith by the Committee, in accordance with the policies and procedures. Factors used in determining fair value vary by investment type and may include market or investment specific events, transaction data, estimated cash flows, and market observations of comparable investments. The frequency that the fair valuation procedures are used cannot be predicted and they may be utilized to a significant extent. The Committee manages the Fund's fair valuation practices and maintains the fair valuation policies and procedures. The Fund's investment adviser reports to the Board information regarding the fair valuation process and related material matters.
The Fund categorizes the inputs to valuation techniques used to value its investments into a disclosure hierarchy consisting of three levels as shown below:
Level 1 - unadjusted quoted prices in active markets for identical investments
Level 2 - other significant observable inputs (including quoted prices for similar investments, interest rates, prepayment speeds, etc.)
Level 3 - unobservable inputs (including the Fund's own assumptions based on the best information available)
Valuation techniques used to value the Fund's investments by major category are as follows:
Equity securities, including restricted securities, for which market quotations are readily available, are valued at the last reported sale price or official closing price as reported by a third party pricing service on the primary market or exchange on which they are traded and are categorized as Level 1 in the hierarchy. In the event there were no sales during the day or closing prices are not available, securities are valued at the last quoted bid price or may be valued using the last available price and are generally categorized as Level 2 in the hierarchy. For foreign equity securities, when market or security specific events arise, comparisons to the valuation of American Depositary Receipts (ADRs), futures contracts, Exchange-Traded Funds (ETFs) and certain indexes as well as quoted prices for similar securities may be used and would be categorized as Level 2 in the hierarchy. For equity securities, including restricted securities, where observable inputs are limited, assumptions about market activity and risk are used and these securities may be categorized as Level 3 in the hierarchy.
Investments in open-end mutual funds, including the Fidelity Central Funds, are valued at their closing net asset value (NAV) each business day and are categorized as Level 1 in the hierarchy.
Changes in valuation techniques may result in transfers in or out of an assigned level within the disclosure hierarchy. The aggregate value of investments by input level as of April 30, 2024 is included at the end of the Fund's Schedule of Investments.
Foreign Currency. Certain Funds may use foreign currency contracts to facilitate transactions in foreign-denominated securities. Gains and losses from these transactions may arise from changes in the value of the foreign currency or if the counterparties do not perform under the contracts' terms.
Foreign-denominated assets, including investment securities, and liabilities are translated into U.S. dollars at the exchange rates at period end. Purchases and sales of investment securities, income and dividends received, and expenses denominated in foreign currencies are translated into U.S. dollars at the exchange rate in effect on the transaction date.
The effects of exchange rate fluctuations on investments are included with the net realized and unrealized gain (loss) on investment securities. Other foreign currency transactions resulting in realized and unrealized gain (loss) are disclosed separately.
Investment Transactions and Income. For financial reporting purposes, the Fund's investment holdings and NAV include trades executed through the end of the last business day of the period. The NAV per share for processing shareholder transactions is calculated as of the close of business of the New York Stock Exchange (NYSE), normally 4:00 p.m. Eastern time and includes trades executed through the end of the prior business day. Gains and losses on securities sold are determined on the basis of identified cost and include proceeds received from litigation. Commissions paid to certain brokers with whom the investment adviser, or its affiliates, places trades on behalf of a fund include an amount in addition to trade execution, which may be rebated back to a fund. Any such rebates are included in net realized gain (loss) on investments in the Statement of Operations. Dividend income is recorded on the ex-dividend date, except for certain dividends from foreign securities where the ex-dividend date may have passed, which are recorded as soon as the Fund is informed of the ex-dividend date. Non-cash dividends included in dividend income, if any, are recorded at the fair market value of the securities received. Income and capital gain distributions from Fidelity Central Funds, if any, are recorded on the ex-dividend date. Certain distributions received by the Fund represent a return of capital or capital gain. The Fund determines the components of these distributions subsequent to the ex-dividend date, based upon receipt of tax filings or other correspondence relating to the underlying investment. These distributions are recorded as a reduction of cost of investments and/or as a realized gain. Investment income is recorded net of foreign taxes withheld where recovery of such taxes is uncertain. Funds may file withholding tax reclaims in certain jurisdictions to recover a portion of amounts previously withheld. Any withholding tax reclaims income is included in the Statement of Operations in foreign taxes withheld. Any receivables for withholding tax reclaims are included in the Statement of Assets and Liabilities in reclaims receivable.
Class Allocations and Expenses. Investment income, realized and unrealized capital gains and losses, common expenses of a fund, and certain fund-level expense reductions, if any, are allocated daily on a pro-rata basis to each class based on the relative net assets of each class to the total net assets of a fund. Each class differs with respect to transfer agent and distribution and service plan fees incurred, as applicable. Certain expense reductions may also differ by class, if applicable. For the reporting period, the allocated portion of income and expenses to each class as a percent of its average net assets may vary due to the timing of recording these transactions in relation to fluctuating net assets of the classes. Expenses directly attributable to a fund are charged to that fund. Expenses attributable to more than one fund are allocated among the respective funds on the basis of relative net assets or other appropriate methods. Expenses included in the accompanying financial statements reflect the expenses of that fund and do not include any expenses associated with any underlying mutual funds or exchange-traded funds (ETFs). Although not included in a fund's expenses, a fund indirectly bears its proportionate share of these expenses through the net asset value of each underlying mutual fund or exchange-traded fund (ETF). Expense estimates are accrued in the period to which they relate and adjustments are made when actual amounts are known.
Income Tax Information and Distributions to Shareholders. Each year, the Fund intends to qualify as a regulated investment company under Subchapter M of the Internal Revenue Code, including distributing substantially all of its taxable income and realized gains. As a result, no provision for U.S. Federal income taxes is required. The Fund files a U.S. federal tax return, in addition to state and local tax returns as required. The Fund's federal income tax returns are subject to examination by the Internal Revenue Service (IRS) for a period of three fiscal years after they are filed. State and local tax returns may be subject to examination for an additional fiscal year depending on the jurisdiction. Foreign taxes are provided for based on the Fund's understanding of the tax rules and rates that exist in the foreign markets in which it invests. The Fund is subject to a tax imposed on capital gains by certain countries in which it invests. An estimated deferred tax liability for net unrealized appreciation on the applicable securities is included in Deferred taxes on the Statement of Assets & Liabilities.
Distributions are declared and recorded on the ex-dividend date. Income and capital gain distributions are declared separately for each class. Income and capital gain distributions are determined in accordance with income tax regulations, which may differ from GAAP.
Capital accounts within the financial statements are adjusted for permanent book-tax differences. These adjustments have no impact on net assets or the results of operations. Capital accounts are not adjusted for temporary book-tax differences which will reverse in a subsequent period.
Book-tax differences are primarily due to foreign currency transactions, certain foreign taxes, passive foreign investment companies (PFIC), capital loss carryforwards, and losses deferred due to wash sales.
As of period end, the cost and unrealized appreciation (depreciation) in securities, and derivatives if applicable, for federal income tax purposes were as follows:
| Gross unrealized appreciation | $2,028,963,496 |
| Gross unrealized depreciation | (82,782,518) |
| Net unrealized appreciation (depreciation) | $1,946,180,978 |
| Tax cost | $5,929,998,071 |
Capital loss carryforwards are only available to offset future capital gains of the Fund to the extent provided by regulations and may be limited. The capital loss carryforward information presented below, including any applicable limitation, is estimated as of prior fiscal period end and is subject to adjustment.
Short-term | $(642,429,234) |
| Total capital loss carryforward | $(642,429,234) |
4. Purchases and Sales of Investments.
Purchases and sales of securities, other than short-term securities and in-kind transactions, as applicable, are noted in the table below.
| | Purchases ($) | Sales ($) |
| Fidelity Advisor International Capital Appreciation Fund | 2,280,717,601 | 1,503,324,322 |
5. Fees and Other Transactions with Affiliates.
Management Fee. Fidelity Management & Research Company LLC (the investment adviser) and its affiliates provide the Fund with investment management related services for which the Fund pays a monthly management fee.
Effective March 1, 2024, the Fund's management contract was amended to incorporate administrative services previously covered under separate services agreements (Transfer Agent and Accounting agreements). The amended contract incorporates a basic fee rate that may vary by class (subject to a performance adjustment). The investment adviser or an affiliate pays certain expenses of managing and operating the Fund out of each class's management fee. Each class of the Fund pays a management fee to the investment adviser. The management fee is calculated and paid to the investment adviser every month. The management fee is determined by calculating a basic fee and then applying a performance adjustment. When determining a class's basic fee, a mandate rate is calculated based on the monthly average net assets of a group of funds advised by FMR within a designated asset class. A discount rate is subtracted from the mandate rate once the Fund's monthly average net assets reach a certain level. The mandate rate and discount rate may vary by class. The annual basic fee rate for a class of shares of the Fund is the lesser of (1) the class's mandate rate reduced by the class's discount rate (if applicable) or (2) the amount set forth in the following table.
| | Maximum Management Fee Rate % |
| Class A | 0.85% |
| Class M | 0.85% |
| Class C | 0.85% |
| Class I | 0.84% |
| Class Z | 0.71% |
One-twelfth of the basic fee rate for a class is applied to the average net assets of the class for the month, giving a dollar amount which is the basic fee for the class for that month. A different management fee rate may be applicable to each class of the Fund. The difference between classes is the result of separate arrangements for class-level services and/or waivers of certain expenses. It is not the result of any difference in advisory or custodial fees or other expenses related to the management of the Fund's assets, which do not vary by class. For the portion of the reporting period on or after March 1, 2024, the total annualized management fee rates were as follows:
| | Total Management Fee Rate % |
| Class A | 0.81 |
| Class M | 0.81 |
| Class C | 0.81 |
| Class I | 0.81 |
| Class Z | 0.69 |
Prior to March 1, 2024, the management fee was the sum of an individual fund fee rate that was based on an annual rate of .45% of the Fund's average net assets and an annualized group fee rate that averaged .22% during the period. The group fee rate was based upon the monthly average net assets of a group of registered investment companies with which the investment adviser has management contracts. The group fee rate decreased as assets under management increased and increased as assets under management decreased. For the portion of the reporting period prior to March 1, 2024, the total annualized management fee rate was .67%.
The performance adjustment rate is calculated monthly by comparing over the performance period the Fund's performance to that of the performance adjustment index listed below.
| | Performance Adjustment Index |
| Fidelity Advisor International Capital Appreciation Fund | MSCI All Country World ex USA Index |
For the purposes of calculating the performance adjustment for the Fund, the Fund's investment performance is based on the performance of Class I. To the extent that other classes of the Fund have higher expenses, this could result in those classes bearing a larger positive performance adjustment and smaller negative performance adjustment than would be the case if each class's own performance were considered. The performance period is the most recent 36 month period. The maximum annualized performance adjustment rate is ±.20% of the Fund's average net assets over the performance period. The performance adjustment rate is divided by twelve and multiplied by the Fund's average net assets over the performance period, and the resulting dollar amount is proportionately added to or subtracted from a class's basic fee. For the entire reporting period, the total annualized performance adjustment was .07%.
Effective March 1, 2024, the Fund's sub-advisory agreements with FMR Investment Management (UK) Limited, Fidelity Management & Research (Hong Kong) Limited, and Fidelity Management & Research (Japan) Limited were amended to provide that the investment adviser pays each sub-adviser monthly fees equal to 110% of the sub-adviser's costs for providing sub-advisory services.
Effective March 1, 2024, the Fund's sub-advisory agreement with FIL Investment Advisors (FIA) was amended to provide that the investment adviser pays FIA monthly fees at an annual rate of 0.44% with respect to the average daily net assets of the Fund managed by FIA. FIA in turn pays FIA(UK).
Distribution and Service Plan Fees. In accordance with Rule 12b-1 of the 1940 Act, the Fund has adopted separate Distribution and Service Plans for each class of shares. Certain classes pay Fidelity Distributors Company LLC (FDC), an affiliate of the investment adviser, separate Distribution and Service Fees, each of which is based on an annual percentage of each class' average net assets. In addition, FDC may pay financial intermediaries for selling shares of the Fund and providing shareholder support services. For the period, the Distribution and Service Fee rates, total fees and amounts retained by FDC were as follows:
| | Distribution Fee | Service Fee | Total Fees ($) | Retained by FDC ($) |
| Class A | - % | .25% | 694,912 | 26,093 |
| Class M | .25% | .25% | 433,494 | 2,497 |
| Class C | .75% | .25% | 545,428 | 55,418 |
| | | | 1,673,834 | 84,008 |
Sales Load. FDC may receive a front-end sales charge of up to 5.75% for selling Class A shares and 3.50% for selling Class M shares, some of which is paid to financial intermediaries for selling shares of the Fund. Depending on the holding period, FDC may receive contingent deferred sales charges levied on Class A, Class M and Class C redemptions. The deferred sales charges are 1.00% for Class C shares, 1.00% for certain purchases of Class A shares and .25% for certain purchases of Class M shares.
For the period, sales charge amounts retained by FDC were as follows:
| | Retained by FDC ($) |
| Class A | 90,171 |
| Class M | 5,229 |
Class CA | 205 |
| | 95,605 |
A When Class C shares are initially sold, FDC pays commissions from its own resources to financial intermediaries through which the sales are made.
Transfer Agent Fees. Fidelity Investments Institutional Operations Company LLC (FIIOC), an affiliate of the investment adviser, is the transfer, dividend disbursing and shareholder servicing agent for each class of the Fund. Effective March 1, 2024, the Fund's management contract was amended to incorporate transfer agent services and associated fees previously covered under a separate services agreement. FIIOC pays for typesetting, printing and mailing of shareholder reports, except proxy statements.
During November 2023, the Board approved a change in the transfer agent fees effective December 1, 2023 to a fixed annual rate of class-level average net assets as follows:
| | % of Class-Level Average Net Assets |
| Class A | 0.1799% |
| Class M | 0.1815% |
| Class C | 0.1814% |
| Class I | 0.1672% |
Prior to December 1, 2023, FIIOC received account fees and asset-based fees that varied according to the account size and type of account of the shareholders of the respective classes of the Fund, except for Class Z. FIIOC received an asset-based fee of Class Z's average net assets. For the portion of the reporting period prior to March 1, 2024, the fees were equivalent to the following annualized rates:
| | Amount ($) | % of Class-Level Average Net Assets |
| Class A | 321,322 | .18 |
| Class M | 102,129 | .18 |
| Class C | 64,405 | .18 |
| Class I | 2,487,537 | .17 |
| Class Z | 208,345 | .04 |
| | 3,183,738 | |
Accounting Fees. Fidelity Service Company, Inc. (FSC), an affiliate of the investment adviser, maintains the Fund's accounting records. Effective March 1, 2024, the Fund's management contract was amended to incorporate accounting services and associated fees previously covered under a separate services agreement.
During November 2023, the Board approved a change in the accounting fees effective December 1, 2023 to a fixed annual rate of average net assets as follows:
| | % of Average Net Assets |
| Fidelity Advisor International Capital Appreciation Fund | 0.0257 |
Prior to December 1, 2023, the accounting fee was based on the level of average net assets for each month. For the portion of the reporting period prior to March 1, 2024, the fees were equivalent to the following annualized rates:
| | % of Average Net Assets |
| Fidelity Advisor International Capital Appreciation Fund | .03 |
Brokerage Commissions. A portion of portfolio transactions were placed with brokerage firms which are affiliates of the investment adviser. Brokerage commissions are included in net realized gain (loss) and change in net unrealized appreciation (depreciation) in the Statement of Operations. The commissions paid to these affiliated firms were as follows:
| | Amount ($) |
| Fidelity Advisor International Capital Appreciation Fund | 2,035 |
Interfund Trades. Funds may purchase from or sell securities to other Fidelity Funds under procedures adopted by the Board. The procedures have been designed to ensure these interfund trades are executed in accordance with Rule 17a-7 of the 1940 Act. Any interfund trades are included within the respective purchases and sales amounts shown in the Purchases and Sales of Investments note. Interfund trades during the period are noted in the table below.
| | Purchases ($) | Sales ($) | Realized Gain (Loss)($) |
| Fidelity Advisor International Capital Appreciation Fund | 204,849,191 | 50,999,532 | 2,578,389 |
6. Committed Line of Credit.
Certain Funds participate with other funds managed by the investment adviser or an affiliate in a $4.25 billion credit facility (the "line of credit") to be utilized for temporary or emergency purposes to fund shareholder redemptions or for other short-term liquidity purposes. The participating funds have agreed to pay commitment fees on their pro-rata portion of the line of credit, which are reflected in Miscellaneous expenses on the Statement of Operations, and are listed below. During the period, there were no borrowings on this line of credit.
| | Amount ($) |
| Fidelity Advisor International Capital Appreciation Fund | 6,341 |
7. Security Lending.
Funds lend portfolio securities from time to time in order to earn additional income. Lending agents are used, including National Financial Services (NFS), an affiliate of the investment adviser. Pursuant to a securities lending agreement, NFS will receive a fee, which is capped at 9.9% of a fund's daily lending revenue, for its services as lending agent. A fund may lend securities to certain qualified borrowers, including NFS. On the settlement date of the loan, a fund receives collateral (in the form of U.S. Treasury obligations, letters of credit and/or cash) against the loaned securities and maintains collateral in an amount not less than 100% of the market value of the loaned securities during the period of the loan. The market value of the loaned securities is determined at the close of business of a fund and any additional required collateral is delivered to a fund on the next business day. A fund or borrower may terminate the loan at any time, and if the borrower defaults on its obligation to return the securities loaned because of insolvency or other reasons, a fund may apply collateral received from the borrower against the obligation. A fund may experience delays and costs in recovering the securities loaned. Any cash collateral received is invested in the Fidelity Securities Lending Cash Central Fund. Any loaned securities are identified as such in the Schedule of Investments, and the value of loaned securities and cash collateral at period end, as applicable, are presented in the Statement of Assets and Liabilities. Security lending income represents the income earned on investing cash collateral, less rebates paid to borrowers and any lending agent fees associated with the loan, plus any premium payments received for lending certain types of securities. Security lending income is presented in the Statement of Operations as a component of income from Fidelity Central Funds. Affiliated security lending activity, if any, was as follows:
| | Total Security Lending Fees Paid to NFS ($) | Security Lending Income From Securities Loaned to NFS ($) | Value of Securities Loaned to NFS at Period End ($) |
| Fidelity Advisor International Capital Appreciation Fund | 2,734 | - | - |
8. Expense Reductions.
Through arrangements with the Fund's custodian, credits realized as a result of certain uninvested cash balances were used to reduce the Fund's expenses. During the period, custodian credits reduced the Fund's expenses by $3,068.
In addition, during the period the investment adviser or an affiliate reimbursed and/or waived a portion of fund-level operating expenses in the amount of $311,844.
9. Distributions to Shareholders.
Distributions to shareholders of each class were as follows:
| | Six months ended April 30, 2024 | Year ended October 31, 2023 |
| Fidelity Advisor International Capital Appreciation Fund | | |
| Distributions to shareholders | | |
| Class A | $870,929 | $- |
| Class I | 15,991,995 | - |
| Class Z | 6,690,816 | - |
Total | $23,553,740 | $- |
10. Share Transactions.
Share transactions for each class were as follows and may contain in-kind transactions, automatic conversions between classes or exchanges between affiliated funds:
| | Shares | Shares | Dollars | Dollars |
| | Six months ended April 30, 2024 | Year ended October 31, 2023 | Six months ended April 30, 2024 | Year ended October 31, 2023 |
| Fidelity Advisor International Capital Appreciation Fund | | | | |
| Class A | | | | |
| Shares sold | 2,830,403 | 4,796,858 | $79,039,232 | $115,824,521 |
| Reinvestment of distributions | 31,487 | - | 831,259 | - |
| Shares redeemed | (2,319,736) | (4,724,109) | (64,318,623) | (113,169,898) |
| Net increase (decrease) | 542,154 | 72,749 | $15,551,868 | $2,654,623 |
| Class M | | | | |
| Shares sold | 545,087 | 1,026,152 | $14,890,881 | $24,224,045 |
| Shares redeemed | (717,342) | (861,061) | (19,309,455) | (19,943,927) |
| Net increase (decrease) | (172,255) | 165,091 | $(4,418,574) | $4,280,118 |
| Class C | | | | |
| Shares sold | 322,951 | 531,513 | $7,721,036 | $11,110,295 |
| Shares redeemed | (690,288) | (1,301,508) | (16,341,053) | (26,610,764) |
| Net increase (decrease) | (367,337) | (769,995) | $(8,620,017) | $(15,500,469) |
| Class I | | | | |
| Shares sold | 39,855,055 | 48,481,950 | $1,199,808,089 | $1,261,327,839 |
| Reinvestment of distributions | 460,990 | - | 13,087,499 | - |
| Shares redeemed | (21,629,786) | (47,885,050) | (645,899,300) | (1,214,605,904) |
| Net increase (decrease) | 18,686,259 | 596,900 | $566,996,288 | $46,721,935 |
| Class Z | | | | |
| Shares sold | 14,713,300 | 21,823,068 | $445,800,974 | $566,083,303 |
| Reinvestment of distributions | 186,982 | - | 5,323,368 | - |
| Shares redeemed | (6,751,519) | (13,377,996) | (199,587,002) | (340,374,406) |
| Net increase (decrease) | 8,148,763 | 8,445,072 | $251,537,340 | $225,708,897 |
11. Other.
A fund's organizational documents provide former and current trustees and officers with a limited indemnification against liabilities arising in connection with the performance of their duties to the fund. In the normal course of business, a fund may also enter into contracts that provide general indemnifications. A fund's maximum exposure under these arrangements is unknown as this would be dependent on future claims that may be made against a fund. The risk of material loss from such claims is considered remote.
12. Risk and Uncertainties.
Many factors affect a fund's performance. Developments that disrupt global economies and financial markets, such as pandemics, epidemics, outbreaks of infectious diseases, war, terrorism, and environmental disasters, may significantly affect a fund's investment performance. The effects of these developments to a fund will be impacted by the types of securities in which a fund invests, the financial condition, industry, economic sector, and geographic location of an issuer, and a fund's level of investment in the securities of that issuer. Significant concentrations in security types, issuers, industries, sectors, and geographic locations may magnify the factors that affect a fund's performance.
As a shareholder, you incur two types of costs: (1) transaction costs, which may include sales charges (loads) on purchase payments or redemption proceeds, as applicable and (2) ongoing costs, which generally include management fees, distribution and/or service (12b-1) fees and other Fund expenses. This Example is intended to help you understand your ongoing costs (in dollars) of investing in a fund and to compare these costs with the ongoing costs of investing in other mutual funds.
| The Example is based on an investment of $1,000 invested at the beginning of the period and held for the entire period (November 1, 2023 to April 30, 2024). |
Actual Expenses
The first line of the accompanying table provides information about actual account values and actual expenses. You may use the information in this line, together with the amount you invested, to estimate the expenses that you paid over the period. Simply divide your account value by $1,000.00 (for example, an $8,600 account value divided by $1,000.00 = 8.6), then multiply the result by the number in the first line for a class/Fund under the heading entitled "Expenses Paid During Period" to estimate the expenses you paid on your account during this period. If any fund is a shareholder of any underlying mutual funds or exchange-traded funds (ETFs) (the Underlying Funds), such fund indirectly bears its proportional share of the expenses of the Underlying Funds in addition to the direct expenses incurred presented in the table. These fees and expenses are not included in the annualized expense ratio used to calculate the expense estimate in the table below.
Hypothetical Example for Comparison Purposes
The second line of the accompanying table provides information about hypothetical account values and hypothetical expenses based on the actual expense ratio and an assumed rate of return of 5% per year before expenses, which is not the actual return. The hypothetical account values and expenses may not be used to estimate the actual ending account balance or expenses you paid for the period. You may use this information to compare the ongoing costs of investing in the Fund and other funds. To do so, compare this 5% hypothetical example with the 5% hypothetical examples that appear in the shareholder reports of the other funds. If any fund is a shareholder of any Underlying Funds, such fund indirectly bears its proportional share of the expenses of the Underlying Funds in addition to the direct expenses as presented in the table. These fees and expenses are not included in the annualized expense ratio used to calculate the expense estimate in the table below.
Please note that the expenses shown in the table are meant to highlight your ongoing costs only and do not reflect any transaction costs. Therefore, the second line of the table is useful in comparing ongoing costs only, and will not help you determine the relative total costs of owning different funds. In addition, if these transactional costs were included, your costs would have been higher.
| | | | | Annualized Expense Ratio- A | | Beginning Account Value November 1, 2023 | | Ending Account Value April 30, 2024 | | Expenses Paid During Period- C November 1, 2023 to April 30, 2024 |
| Fidelity Advisor® International Capital Appreciation Fund | | | | | | | | | | |
| Class A | | | | 1.18% | | | | | | |
| Actual | | | | | | $ 1,000 | | $ 1,214.30 | | $ 6.50 |
Hypothetical-B | | | | | | $ 1,000 | | $ 1,019.00 | | $ 5.92 |
| Class M | | | | 1.42% | | | | | | |
| Actual | | | | | | $ 1,000 | | $ 1,212.80 | | $ 7.81 |
Hypothetical-B | | | | | | $ 1,000 | | $ 1,017.80 | | $ 7.12 |
| Class C | | | | 1.92% | | | | | | |
| Actual | | | | | | $ 1,000 | | $ 1,210.00 | | $ 10.55 |
Hypothetical-B | | | | | | $ 1,000 | | $ 1,015.32 | | $ 9.62 |
| Class I | | | | .93% | | | | | | |
| Actual | | | | | | $ 1,000 | | $ 1,216.50 | | $ 5.13 |
Hypothetical-B | | | | | | $ 1,000 | | $ 1,020.24 | | $ 4.67 |
Class Z ** | | | | .81% | | | | | | |
| Actual | | | | | | $ 1,000 | | $ 1,216.60 | | $ 4.46 |
Hypothetical-B | | | | | | $ 1,000 | | $ 1,020.84 | | $ 4.07 |
| |
A Annualized expense ratio reflects expenses net of applicable fee waivers.
B 5% return per year before expenses
C Expenses are equal to the annualized expense ratio, multiplied by the average account value over the period, multiplied by 182/ 366 (to reflect the one-half year period). The fees and expenses of any Underlying Funds are not included in each annualized expense ratio.
** If fees and changes to the expense contract and/or expense cap, effective March 1, 2024, had been in effect during the entire current period, the restated annualized expense ratio and the expenses paid in the actual and hypothetical examples above would have been as shown in table below:
| | | | | Annualized Expense Ratio- A | | Expenses Paid |
| Fidelity Advisor® International Capital Appreciation Fund | | | | | | |
| Class Z | | | | .77% | | |
| Actual | | | | | | $ 4.24 |
Hypothetical- B | | | | | | $ 3.87 |
| | | | | | | |
| A Annualized expense ratio reflects expenses net of applicable fee waivers. | | | | | | |
| B 5% return per year before expenses | | | | | | |
Board Approval of Investment Advisory Contracts
Fidelity Advisor International Capital Appreciation Fund
At its January 2024 meeting, the Board of Trustees, including the Independent Trustees (together, the Board), approved an amended and restated management contract with Fidelity Management & Research Company LLC (FMR) (the Management Contract), and amended and restated sub-advisory agreements (the Sub-Advisory Contracts, and together with the Management Contract, the Advisory Contracts) for the fund, including the fund's sub-advisory agreements with FMR Investment Management (UK) Limited (FMR UK), Fidelity Management & Research (Hong Kong) Limited (FMR H.K.), Fidelity Management & Research (Japan) Limited (FMR Japan), and FIL Investment Advisors (FIL). The Advisory Contracts will be effective March 1, 2024. The Board will consider the annual renewal of the fund's Advisory Contracts in May 2024, following its review of additional materials provided by FMR.
Management Contract. The Board approved the Management Contract, which implements a new fee structure combining the management fee, transfer agent fee (TA Fee), and pricing and bookkeeping fee (P&B Fee) of the fund and each class into a single class-level fee based on tiered schedules and subject to a maximum class-level rate (the Unified Fee). In exchange for the Unified Fee, the fund will receive investment advisory, management, administrative, transfer agent, pricing and bookkeeping services under a single agreement - the Management Contract.
In its consideration of the Management Contract over several meetings, the Board received, reviewed and discussed a comprehensive set of analyses regarding the Unified Fee including (i) the legal framework, (ii) design goals for the Unified Fee, (iii) calculation methodology for the Unified Fee and illustrative examples, (iv) annual and cumulative projected impacts under various scenarios, both in the aggregate and at the fund/class level, (v) explanations of schedules, rate levers and maximum rates and (vi) shareholder benefits and projected savings.
The Board considered that the maximum Unified Fee for each class of the fund would be no higher than the sum of (i) the lowest contractual management fee rate under the fund's existing management contract, which is the individual fund fee rate, if any, plus the lowest contractual marginal group fee rate and (ii) the TA and P&B Fee rates, which are fixed fee rates since December 1, 2023 (together, the Unified Fee Cap). The Board noted that Fidelity has represented that, as a result of this Unified Fee Cap, the Unified Fee would be no greater than the fee rates previously authorized to be charged to the fund for the same services. The Board noted that certain expenses such as third-party expenses, Rule 12b-1 fees, and certain other miscellaneous expenses would be outside the scope of the Unified Fee and the calculation of such fees would not change as a result of the Unified Fee. The Board considered that, under the Management Contract, a different management fee rate will be applicable to each class of the fund. The Board noted that Fidelity has represented that the difference in expenses between classes is based on differences in class-specific expenses and not due to any difference in advisory or third-party custodial fees or other expenses related to the management of the fund's assets.
The Board considered Fidelity's representations that implementation of the Unified Fee, which includes the Unified Fee Cap, would cause all funds subject to the Unified Fee, including the fund, to experience an immediate reduction on contractual fee rates for services provided under the current management contracts. The Board considered that some funds would not experience lower net total fees as a result of existing fee caps. The Board further considered that, in addition to the contractual fee savings, the Unified Fee offers funds and their shareholders greater protection from future rate increases for services previously offered under separate agreements that are now covered by the Management Contract because such rate increases would require shareholder approval.
Sub-Advisory Contracts. In connection with the Unified Fee changes, the Board considered the Sub-Advisory Contracts, which simplified the calculation of the fees paid by FMR to the sub-advisers under the agreements. The Board noted that the agreements with FMR UK, FMR H.K., and FMR Japan were amended to provide that FMR will compensate each sub-adviser at a fee rate equal to 110% of the sub-adviser's costs incurred in providing services under the agreement. The Board further noted that the agreement with FIL was amended to provide that FMR will compensate FIL at a flat fee rate of 0.44% of the net assets sub-advised by it. The Board considered that, under the Sub-Advisory Contracts, FMR, and not the fund, will continue to pay the sub-advisory fees to each applicable sub-adviser.
The Board further considered that the approval of the fund's Advisory Contracts will not result in any changes in the investment process or strategies employed in the management of the fund's assets or the day-to-day management of the fund or the persons primarily responsible for such management. Further, the Board considered that the Management Contract would not change the obligations and services of FMR and its affiliates on behalf of the fund, and, in particular, there would be no change in the nature and level of advisory, management, administration, transfer agent, and pricing and bookkeeping services provided to the fund by FMR, its affiliates, and each applicable sub-adviser.
In connection with its consideration of future renewals of the fund's Advisory Contracts, the Board will consider: (i) the nature, extent and quality of services provided to the funds, including shareholder and administrative services and investment performance; (ii) the competitiveness of the management fee and total expenses for the fund; (iii) the costs of the services and profitability, including the revenues earned and the expenses incurred in conducting the business of developing, marketing, distributing, managing, administering, and servicing the fund and its shareholders, to the extent applicable; and (iv) whether there have been economies of scale in respect of the Fidelity funds, whether the Fidelity funds (including the fund) have appropriately benefited from any such economies of scale, and whether there is the potential for realization of any further economies.
Based on its evaluation of all of the conclusions and representations noted above, and after considering all factors it believed relevant, the Board concluded that the fund's management fee structure is fair and reasonable, and that the fund's Advisory Contracts should be approved.
The Securities and Exchange Commission adopted Rule 22e-4 under the Investment Company Act of 1940 (the Liquidity Rule) to promote effective liquidity risk management throughout the open-end investment company industry, thereby reducing the risk that funds will be unable to meet their redemption obligations and mitigating dilution of the interests of fund shareholders.
The Fund has adopted and implemented a liquidity risk management program (the Program) reasonably designed to assess and manage the Fund's liquidity risk and to comply with the requirements of the Liquidity Rule. The Fund's Board of Trustees (the Board) has designated the Fund's investment adviser as administrator of the Program. The Fidelity advisers have established a Liquidity Risk Management Committee (the LRM Committee) to manage the Program for each of the Fidelity Funds. The LRM Committee monitors the adequacy and effectiveness of implementation of the Program and on a periodic basis assesses each Fund's liquidity risk based on a variety of factors including (1) the Fund's investment strategy, (2) portfolio liquidity and cash flow projections during normal and reasonably foreseeable stressed conditions, (3) shareholder redemptions, (4) borrowings and other funding sources and (5) certain factors specific to ETFs including the effect of the Fund's prices and spreads, market participants, and basket compositions on the overall liquidity of the Fund's portfolio, as applicable.
In accordance with the Program, each of the Fund's portfolio investments is classified into one of four defined liquidity categories based on a determination of a reasonable expectation for how long it would take to convert the investment to cash (or sell or dispose of the investment) without significantly changing its market value.
- Highly liquid investments - cash or convertible to cash within three business days or less
- Moderately liquid investments - convertible to cash in three to seven calendar days
- Less liquid investments - can be sold or disposed of, but not settled, within seven calendar days
- Illiquid investments - cannot be sold or disposed of within seven calendar days
Liquidity classification determinations take into account a variety of factors including various market, trading and investment-specific considerations, as well as market depth, and generally utilize analysis from a third-party liquidity metrics service.
The Liquidity Rule places a 15% limit on a fund's illiquid investments and requires funds that do not primarily hold assets that are highly liquid investments to determine and maintain a minimum percentage of the fund's net assets to be invested in highly liquid investments (highly liquid investment minimum or HLIM). The Program includes provisions reasonably designed to comply with the 15% limit on illiquid investments and for determining, periodically reviewing and complying with the HLIM requirement as applicable.
At a recent meeting of the Fund's Board of Trustees, the LRM Committee provided a written report to the Board pertaining to the operation, adequacy, and effectiveness of the Program for the period December 1, 2022 through November 30, 2023. The report concluded that the Program is operating effectively and is reasonably designed to assess and manage the Fund's liquidity risk.
1.703428.126
AICAP-SANN-0624
Fidelity Advisor® Emerging Asia Fund
Semi-Annual Report
April 30, 2024
Contents
To view a fund's proxy voting guidelines and proxy voting record for the 12-month period ended June 30, visit http://www.fidelity.com/proxyvotingresults or visit the Securities and Exchange Commission's (SEC) web site at http://www.sec.gov.
You may also call 1-877-208-0098 to request a free copy of the proxy voting guidelines.
Standard & Poor's, S&P and S&P 500 are registered service marks of The McGraw-Hill Companies, Inc. and have been licensed for use by Fidelity Distributors Corporation.
Other third-party marks appearing herein are the property of their respective owners.
All other marks appearing herein are registered or unregistered trademarks or service marks of FMR LLC or an affiliated company. © 2024 FMR LLC. All rights reserved.
This report and the financial statements contained herein are submitted for the general information of the shareholders of the Fund. This report is not authorized for distribution to prospective investors in the Fund unless preceded or accompanied by an effective prospectus.
A fund files its complete schedule of portfolio holdings with the SEC for the first and third quarters of each fiscal year on Form N-PORT. Forms N-PORT are available on the SEC's web site at http://www.sec.gov. A fund's Forms N-PORT may be reviewed and copied at the SEC's Public Reference Room in Washington, DC. Information regarding the operation of the SEC's Public Reference Room may be obtained by calling 1-800-SEC-0330.
For a complete list of a fund's portfolio holdings, view the most recent holdings listing, semiannual report, or annual report on Fidelity's web site at http://www.fidelity.com, http://www.institutional.fidelity.com, or http://www.401k.com, as applicable.
NOT FDIC INSURED •MAY LOSE VALUE •NO BANK GUARANTEE
Neither the Fund nor Fidelity Distributors Corporation is a bank.
Top Holdings (% of Fund's net assets) |
| |
| Taiwan Semiconductor Manufacturing Co. Ltd. | 11.0 | |
| Sea Ltd. ADR | 5.8 | |
| Samsung Electronics Co. Ltd. | 5.3 | |
| PDD Holdings, Inc. ADR | 5.1 | |
| MakeMyTrip Ltd. | 4.4 | |
| Zomato Ltd. | 3.6 | |
| SK Hynix, Inc. | 2.6 | |
| Advanced Micro-Fabrication Equipment, Inc., China (A Shares) | 2.1 | |
| Reliance Industries Ltd. | 2.0 | |
| Meituan Class B | 2.0 | |
| | 43.9 | |
| |
| Market Sectors (% of Fund's net assets) |
| |
| Information Technology | 33.5 | |
| Consumer Discretionary | 23.5 | |
| Communication Services | 10.9 | |
| Health Care | 10.7 | |
| Financials | 9.8 | |
| Industrials | 7.9 | |
| Energy | 2.0 | |
| Materials | 0.9 | |
| Consumer Staples | 0.8 | |
| Real Estate | 0.4 | |
| |
Asset Allocation (% of Fund's net assets) |
|
Short-Term Investments and Net Other Assets (Liabilities) - (0.4)% |
|
Showing Percentage of Net Assets
| Common Stocks - 98.8% |
| | | Shares | Value ($) |
| China - 35.2% | | | |
| Advanced Micro-Fabrication Equipment, Inc., China (A Shares) | | 407,100 | 7,915,414 |
| AK Medical Holdings Ltd. (a)(b) | | 3,042,787 | 2,273,111 |
| Akeso, Inc. (b)(c) | | 188,780 | 1,155,168 |
| Alibaba Group Holding Ltd. | | 823,437 | 7,709,894 |
| Asymchem Laboratories Tianjin Co. Ltd.: | | | |
| (A Shares) | | 51,021 | 580,545 |
| (H Shares) (a)(b) | | 97,100 | 789,877 |
| Baidu, Inc. Class A (c) | | 40,100 | 519,519 |
| Beijing Chunlizhengda Medical Instruments Co. Ltd. (c) | | 267,700 | 828,094 |
| Beijing Sinohytec Co. Ltd. (A Shares) | | 197,868 | 977,864 |
| Empyrean Technology Co. Ltd. (A Shares) | | 79,100 | 852,955 |
| Estun Automation Co. Ltd. (A Shares) | | 1,060,900 | 2,349,932 |
| Glodon Co. Ltd. (A Shares) | | 2,088,181 | 3,247,736 |
| GRG Metrology & Test Co. Ltd. (A Shares) | | 406,169 | 818,373 |
| Guangzhou Kingmed Diagnostics Group Co. Ltd. (A Shares) | | 173,056 | 914,335 |
| Hangzhou Tigermed Consulting Co. Ltd. (A Shares) | | 143,708 | 1,167,266 |
| Innovent Biologics, Inc. (b)(c) | | 371,405 | 1,797,958 |
| Joinn Laboratories China Co. Ltd. (A Shares) | | 291,436 | 656,767 |
| Kangji Medical Holdings Ltd. | | 643,038 | 591,679 |
| Kanzhun Ltd. ADR | | 66,180 | 1,309,702 |
| KE Holdings, Inc. ADR | | 92,513 | 1,398,797 |
| Kindstar Globalgene Technology, Inc. (b)(c) | | 2,605,082 | 519,314 |
| Kingsemi Co. Ltd. (A Shares) | | 113,500 | 1,398,758 |
| Kuaishou Technology Class B (b)(c) | | 296,600 | 2,079,376 |
| Li Auto, Inc. ADR (c) | | 168,172 | 4,419,560 |
| Li Ning Co. Ltd. | | 1,042,849 | 2,730,042 |
| Maxscend Microelectronics Co. Ltd. (A Shares) | | 56,200 | 700,249 |
| Meituan Class B (b)(c) | | 567,308 | 7,746,325 |
| Microport Cardioflow Medtech Corp. (a)(b)(c) | | 4,100,175 | 546,058 |
| MicroPort NeuroTech Ltd. (a)(c) | | 213,838 | 252,667 |
| MicroTech Medical (Hangzhou) Co. Ltd. (H Shares) (b)(c) | | 525,611 | 271,004 |
| NAURA Technology Group Co. Ltd. | | 153,173 | 6,707,416 |
| NXP Semiconductors NV | | 16,012 | 4,102,114 |
| PDD Holdings, Inc. ADR (c) | | 153,632 | 19,231,654 |
| Ping An Insurance Group Co. of China Ltd. (H Shares) | | 799,827 | 3,624,883 |
| RLX Technology, Inc. ADR (a) | | 290,639 | 563,840 |
| SG Micro Corp. (A Shares) | | 34,500 | 364,383 |
| Shandong Weigao Orthopaedic Device Co. Ltd. (A Shares) (c) | | 636,700 | 2,239,336 |
| Shanghai Aohua Photoelectricity Endoscope Co. Ltd. (A Shares) (c) | | 168,230 | 1,237,844 |
| Shanghai MicroPort Endovascula MedTech Group Co. Ltd. (A Shares) (c) | | 37,000 | 949,987 |
| Shenzhen Mindray Bio-Medical Electronics Co. Ltd. (A Shares) | | 132,839 | 5,577,886 |
| Silergy Corp. | | 82,000 | 1,087,116 |
| SITC International Holdings Co. Ltd. (a) | | 616,336 | 1,336,583 |
| Smoore International Holdings Ltd. (a)(b) | | 828,757 | 721,777 |
| SonoScape Medical Corp. (c) | | 171,800 | 978,395 |
| Tencent Holdings Ltd. | | 163,970 | 7,195,528 |
| Tofflon Science & Technology Group Co. Ltd. (A Shares) (c) | | 1,010,086 | 2,082,061 |
| Trip.com Group Ltd. (c) | | 42,340 | 2,062,270 |
| Venus MedTech Hangzhou, Inc. (H Shares) (a)(b)(c)(d) | | 1,074,577 | 617,600 |
| Weihai Guangwei Composites Co. Ltd. (A Shares) | | 337,844 | 1,211,408 |
| WuXi AppTec Co. Ltd. (H Shares) (b) | | 484,627 | 2,181,350 |
| Wuxi Biologics (Cayman), Inc. (b)(c) | | 498,528 | 863,618 |
| WuXi XDC Cayman, Inc. | | 2,522,856 | 7,027,916 |
| Zai Lab Ltd. ADR (a)(c) | | 38,440 | 607,352 |
| ZKH Group Ltd. (A Shares) (i) | | 6,186,784 | 1,931,143 |
| Zylox-Tonbridge Medical Technology Co. Ltd. (b)(c) | | 473,392 | 630,065 |
TOTAL CHINA | | | 133,651,864 |
| Hong Kong - 2.2% | | | |
| AIA Group Ltd. | | 600,927 | 4,401,405 |
| Hong Kong Exchanges and Clearing Ltd. | | 99,721 | 3,168,578 |
| Huanxi Media Group Ltd. (a)(c) | | 9,140,292 | 661,687 |
TOTAL HONG KONG | | | 8,231,670 |
| India - 23.4% | | | |
| Amber Enterprises India Ltd. (c) | | 19,405 | 890,745 |
| Aster DM Healthcare Ltd. (b) | | 171,778 | 713,702 |
| Bajaj Finance Ltd. | | 23,793 | 1,973,120 |
| Bharat Electronics Ltd. | | 520,842 | 1,456,054 |
| Computer Age Management Services Private Ltd. | | 123,807 | 4,743,951 |
| Delhivery Private Ltd. (c) | | 1,026,146 | 5,515,063 |
| Devyani International Ltd. (c) | | 413,942 | 822,224 |
| Eicher Motors Ltd. | | 30,516 | 1,679,539 |
| GMR Airports Infrastructure Ltd. (c) | | 1,354,005 | 1,376,752 |
| HDFC Asset Management Co. Ltd. (b) | | 85,707 | 3,994,435 |
| HDFC Bank Ltd. | | 408,828 | 7,422,446 |
| HDFC Standard Life Insurance Co. Ltd. (b) | | 297,758 | 2,077,774 |
| Hindustan Aeronautics Ltd. | | 93,978 | 4,433,711 |
| INOX India Ltd. | | 68,573 | 1,101,729 |
| Kotak Mahindra Bank Ltd. | | 46,928 | 911,805 |
| Larsen & Toubro Ltd. | | 34,427 | 1,479,455 |
| MakeMyTrip Ltd. (a)(c) | | 249,374 | 16,511,053 |
| Page Industries Ltd. | | 1,602 | 666,698 |
| Reliance Industries Ltd. | | 220,870 | 7,751,273 |
| Sapphire Foods India Ltd. (c) | | 75,380 | 1,284,037 |
| SIS Ltd. (c) | | 211,100 | 1,180,589 |
| SRF Ltd. | | 29,691 | 929,768 |
| Syngene International Ltd. (b) | | 101,501 | 836,693 |
| Tata Motors Ltd. | | 274,403 | 3,308,101 |
| Ultratech Cement Ltd. | | 13,419 | 1,599,954 |
| Vijaya Diagnostic Centre Pvt Ltd. | | 61,984 | 518,864 |
| Zomato Ltd. (c) | | 5,892,166 | 13,594,823 |
TOTAL INDIA | | | 88,774,358 |
| Indonesia - 1.3% | | | |
| PT Bank Central Asia Tbk | | 5,058,252 | 3,041,449 |
| PT Bank Rakyat Indonesia (Persero) Tbk | | 6,274,612 | 1,899,347 |
TOTAL INDONESIA | | | 4,940,796 |
| Japan - 1.6% | | | |
| Freee KK (c) | | 83,448 | 1,460,594 |
| Money Forward, Inc. (c) | | 75,400 | 2,625,531 |
| Renesas Electronics Corp. | | 122,231 | 1,984,512 |
TOTAL JAPAN | | | 6,070,637 |
| Korea (South) - 11.8% | | | |
| Delivery Hero AG (b)(c) | | 123,603 | 3,458,108 |
| Gabia, Inc. | | 64,100 | 820,664 |
| HD Hyundai Marine Solution Co. Ltd. (e) | | 900 | 54,157 |
| Kakao Corp. | | 37,192 | 1,288,020 |
| Kakao Pay Corp. (c) | | 57,171 | 1,436,760 |
| Kia Corp. | | 39,412 | 3,329,740 |
| LG Energy Solution (c) | | 1,335 | 370,383 |
| NAVER Corp. | | 31,273 | 4,113,347 |
| Samsung Electronics Co. Ltd. | | 362,612 | 20,099,955 |
| SK Hynix, Inc. | | 79,257 | 9,753,383 |
TOTAL KOREA (SOUTH) | | | 44,724,517 |
| Netherlands - 1.0% | | | |
| ASML Holding NV (Netherlands) | | 4,242 | 3,769,685 |
| Singapore - 6.6% | | | |
| Oversea-Chinese Banking Corp. Ltd. | | 159,570 | 1,656,588 |
| Sea Ltd. ADR (c) | | 349,778 | 22,102,472 |
| United Overseas Bank Ltd. | | 57,133 | 1,267,827 |
TOTAL SINGAPORE | | | 25,026,887 |
| Switzerland - 0.5% | | | |
| Yunnan Botanee Bio-Technology Group Co. Ltd. ELS (UBS AG London Branch Bank Warrant Programme) Class A warrants 3/10/25 (b)(c) | | 87,100 | 682,052 |
| ZWSOFT Co. Ltd. Guangzhou (UBS AG London Branch Bank Warrant Programme) Class A warrants 9/25/25 (b)(c) | | 97,608 | 1,112,675 |
TOTAL SWITZERLAND | | | 1,794,727 |
| Taiwan - 12.0% | | | |
| MediaTek, Inc. | | 47,000 | 1,414,586 |
| Taiwan Semiconductor Manufacturing Co. Ltd. | | 1,641,393 | 39,231,254 |
| Taiwan Semiconductor Manufacturing Co. Ltd. sponsored ADR | | 19,188 | 2,635,280 |
| Unimicron Technology Corp. | | 430,000 | 2,373,683 |
TOTAL TAIWAN | | | 45,654,803 |
| United Kingdom - 0.2% | | | |
| Endava PLC ADR (c) | | 30,945 | 897,405 |
| United States of America - 2.7% | | | |
| Frontage Holdings Corp. (a)(b)(c) | | 5,152,138 | 806,661 |
| Micron Technology, Inc. | | 27,433 | 3,098,832 |
| NVIDIA Corp. | | 2,893 | 2,499,610 |
| ON Semiconductor Corp. (c) | | 28,681 | 2,012,259 |
| Space Exploration Technologies Corp. Class A (c)(d)(f) | | 6,000 | 582,000 |
| Teradyne, Inc. | | 12,642 | 1,470,517 |
TOTAL UNITED STATES OF AMERICA | | | 10,469,879 |
| Vietnam - 0.3% | | | |
| Vietnam Dairy Products Corp. | | 491,921 | 1,259,857 |
| TOTAL COMMON STOCKS (Cost $297,527,277) | | | 375,267,085 |
| | | | |
| Preferred Stocks - 1.6% |
| | | Shares | Value ($) |
| Convertible Preferred Stocks - 0.8% | | | |
| China - 0.8% | | | |
| ByteDance Ltd. Series E1 (c)(d)(f) | | 11,980 | 2,761,031 |
| dMed Biopharmaceutical Co. Ltd. Series C (c)(d)(f) | | 65,318 | 322,018 |
| | | | 3,083,049 |
| Nonconvertible Preferred Stocks - 0.8% | | | |
| Korea (South) - 0.8% | | | |
| Samsung Electronics Co. Ltd. | | 61,361 | 2,856,993 |
| TOTAL PREFERRED STOCKS (Cost $4,243,599) | | | 5,940,042 |
| | | | |
| Money Market Funds - 2.6% |
| | | Shares | Value ($) |
Fidelity Securities Lending Cash Central Fund 5.39% (g)(h) (Cost $10,028,830) | | 10,027,828 | 10,028,830 |
| | | | |
| TOTAL INVESTMENT IN SECURITIES - 103.0% (Cost $311,799,706) | 391,235,957 |
NET OTHER ASSETS (LIABILITIES) - (3.0)% | (11,440,504) |
| NET ASSETS - 100.0% | 379,795,453 |
| | |
Security Type Abbreviations
| ELS | - | EQUITY-LINKED SECURITY |
Legend
| (a) | Security or a portion of the security is on loan at period end. |
| (b) | Security exempt from registration under Rule 144A of the Securities Act of 1933. These securities may be resold in transactions exempt from registration, normally to qualified institutional buyers. At the end of the period, the value of these securities amounted to $35,874,701 or 9.4% of net assets. |
| (e) | Security or a portion of the security purchased on a delayed delivery or when-issued basis. |
| (f) | Restricted securities (including private placements) - Investment in securities not registered under the Securities Act of 1933 (excluding 144A issues). At the end of the period, the value of restricted securities (excluding 144A issues) amounted to $3,665,049 or 1.0% of net assets. |
| (g) | Affiliated fund that is generally available only to investment companies and other accounts managed by Fidelity Investments. The rate quoted is the annualized seven-day yield of the fund at period end. A complete unaudited listing of the fund's holdings as of its most recent quarter end is available upon request. In addition, each Fidelity Central Fund's financial statements are available on the SEC's website or upon request. |
| (h) | Investment made with cash collateral received from securities on loan. |
| (i) | Equity security is subject to lock-up or market standoff agreement and valued at a discount to the market price of the equivalent equity security. As of period end, the total fair value of equity securities discounted due to contractual sale restrictions is $1,931,143 and all restrictions are set to expire on or before June 30, 2024. Under normal market conditions, there are no circumstances that could cause the restrictions to lapse. |
| Additional information on each restricted holding is as follows: |
| Security | Acquisition Date | Acquisition Cost ($) |
| ByteDance Ltd. Series E1 | 11/18/20 | 1,312,699 |
| | | |
| dMed Biopharmaceutical Co. Ltd. Series C | 12/01/20 | 927,721 |
| | | |
| Space Exploration Technologies Corp. Class A | 2/16/21 | 251,994 |
| | | |
Affiliated Central Funds
Fiscal year to date information regarding the Fund's investments in Fidelity Central Funds, including the ownership percentage, is presented below.
| Affiliate | Value, beginning of period ($) | Purchases ($) | Sales Proceeds ($) | Dividend Income ($) | Realized Gain (loss) ($) | Change in Unrealized appreciation (depreciation) ($) | Value, end of period ($) | % ownership, end of period |
| Fidelity Cash Central Fund 5.39% | - | 69,140,217 | 69,140,242 | 57,316 | 25 | - | - | 0.0% |
| Fidelity Securities Lending Cash Central Fund 5.39% | 7,074,240 | 44,994,367 | 42,039,777 | 41,333 | - | - | 10,028,830 | 0.0% |
| Total | 7,074,240 | 114,134,584 | 111,180,019 | 98,649 | 25 | - | 10,028,830 | |
| | | | | | | | | |
Amounts in the dividend income column in the above table include any capital gain distributions from underlying funds, which are presented in the corresponding line item in the Statement of Operations, if applicable.
Amounts in the dividend income column for Fidelity Securities Lending Cash Central Fund represents the income earned on investing cash collateral, less rebates paid to borrowers and any lending agent fees associated with the loan, plus any premium payments received for lending certain types of securities.
Amounts included in the purchases and sales proceeds columns may include in-kind transactions, if applicable.
Investment Valuation
The following is a summary of the inputs used, as of April 30, 2024, involving the Fund's assets and liabilities carried at fair value. The inputs or methodology used for valuing securities may not be an indication of the risk associated with investing in those securities. For more information on valuation inputs, and their aggregation into the levels used below, please refer to the Investment Valuation section in the accompanying Notes to Financial Statements.
| Valuation Inputs at Reporting Date: |
| Description | Total ($) | Level 1 ($) | Level 2 ($) | Level 3 ($) |
Investments in Securities: | | | | |
|
| Equities: | | | | |
Communication Services | 42,030,682 | 23,412,174 | 15,857,477 | 2,761,031 |
Consumer Discretionary | 89,444,813 | 40,162,267 | 49,282,546 | - |
Consumer Staples | 3,227,526 | 563,840 | 2,663,686 | - |
Energy | 7,751,273 | - | 7,751,273 | - |
Financials | 36,876,417 | - | 36,876,417 | - |
Health Care | 40,535,191 | 607,352 | 38,988,221 | 939,618 |
Industrials | 29,707,739 | - | 29,125,739 | 582,000 |
Information Technology | 126,493,559 | 20,485,702 | 106,007,857 | - |
Materials | 3,741,130 | - | 3,741,130 | - |
Real Estate | 1,398,797 | 1,398,797 | - | - |
|
| Money Market Funds | 10,028,830 | 10,028,830 | - | - |
| Total Investments in Securities: | 391,235,957 | 96,658,962 | 290,294,346 | 4,282,649 |
The following is a reconciliation of Investments in Securities for which Level 3 inputs were used in determining value:
| |
| Investments in Securities: | |
| Beginning Balance | $ | 6,278,069 | |
| Net Realized Gain (Loss) on Investment Securities | | (4,165,445) | |
| Net Unrealized Gain (Loss) on Investment Securities | | 4,405,085 | |
| Cost of Purchases | | - | |
| Proceeds of Sales | | (1,106,365) | |
| Amortization/Accretion | | - | |
| Transfers into Level 3 | | 609,562 | |
| Transfers out of Level 3 | | (1,738,257) | |
| Ending Balance | $ | 4,282,649 | |
| The change in unrealized gain (loss) for the period attributable to Level 3 securities held at April 30, 2024 | $ | 3,237 | |
| The information used in the above reconciliation represents fiscal year to date activity for any Investments in Securities identified as using Level 3 inputs at either the beginning or the end of the current fiscal period. Cost of purchases and proceeds of sales may include securities received and/or delivered through in-kind transactions, corporate actions or exchanges. Transfers into Level 3 were attributable to a lack of observable market data resulting from decreases in market activity, decreases in liquidity, security restructurings or corporate actions. Transfers out of Level 3 were attributable to observable market data becoming available for those securities. Transfers in or out of Level 3 represent the beginning value of any Security or Instrument where a change in the pricing level occurred from the beginning to the end of the period. Realized and unrealized gains (losses) disclosed in the reconciliation are included in Net Gain (Loss) on the Fund's Statement of Operations. | |
| Statement of Assets and Liabilities |
| | | | April 30, 2024 (Unaudited) |
| | | | | |
| Assets | | | | |
| Investment in securities, at value (including securities loaned of $9,296,669) - See accompanying schedule: | | | | |
Unaffiliated issuers (cost $301,770,876) | $ | 381,207,127 | | |
Fidelity Central Funds (cost $10,028,830) | | 10,028,830 | | |
| | | | | |
| | | | | |
| Total Investment in Securities (cost $311,799,706) | | | $ | 391,235,957 |
| Foreign currency held at value (cost $538,896) | | | | 538,314 |
| Receivable for investments sold | | | | 5,186,796 |
| Receivable for fund shares sold | | | | 254,632 |
| Dividends receivable | | | | 390,242 |
| Distributions receivable from Fidelity Central Funds | | | | 15,232 |
| Prepaid expenses | | | | 159 |
| Other receivables | | | | 230,141 |
Total assets | | | | 397,851,473 |
| Liabilities | | | | |
| Payable to custodian bank | $ | 2,093,368 | | |
| Payable for investments purchased | | | | |
Regular delivery | | 1,965,693 | | |
Delayed delivery | | 54,698 | | |
| Payable for fund shares redeemed | | 291,650 | | |
| Accrued management fee | | 267,791 | | |
| Distribution and service plan fees payable | | 47,827 | | |
| Deferred taxes | | 3,081,898 | | |
| Other payables and accrued expenses | | 228,804 | | |
| Collateral on securities loaned | | 10,024,291 | | |
| Total liabilities | | | | 18,056,020 |
| Net Assets | | | $ | 379,795,453 |
| Net Assets consist of: | | | | |
| Paid in capital | | | $ | 487,391,005 |
| Total accumulated earnings (loss) | | | | (107,595,552) |
| Net Assets | | | $ | 379,795,453 |
| | | | | |
| Net Asset Value and Maximum Offering Price | | | | |
| Class A : | | | | |
Net Asset Value and redemption price per share ($128,781,325 ÷ 3,168,750 shares)(a) | | | $ | 40.64 |
| Maximum offering price per share (100/94.25 of $40.64) | | | $ | 43.12 |
| Class M : | | | | |
Net Asset Value and redemption price per share ($33,043,141 ÷ 852,557 shares)(a) | | | $ | 38.76 |
| Maximum offering price per share (100/96.50 of $38.76) | | | $ | 40.17 |
| Class C : | | | | |
Net Asset Value and offering price per share ($8,816,231 ÷ 255,115 shares)(a) | | | $ | 34.56 |
| Class I : | | | | |
Net Asset Value, offering price and redemption price per share ($140,331,428 ÷ 3,292,435 shares) | | | $ | 42.62 |
| Class Z : | | | | |
Net Asset Value, offering price and redemption price per share ($68,823,328 ÷ 1,614,745 shares) | | | $ | 42.62 |
(a)Redemption price per share is equal to net asset value less any applicable contingent deferred sales charge. |
| Statement of Operations |
| | | | Six months ended April 30, 2024 (Unaudited) |
| Investment Income | | | | |
| Dividends | | | $ | 1,951,741 |
| Income from Fidelity Central Funds (including $41,333 from security lending) | | | | 98,649 |
| Income before foreign taxes withheld | | | $ | 2,050,390 |
| Less foreign taxes withheld | | | | (307,258) |
| Total income | | | | 1,743,132 |
| Expenses | | | | |
| Management fee | $ | 1,400,431 | | |
| Transfer agent fees | | 205,650 | | |
| Distribution and service plan fees | | 286,125 | | |
| Accounting fees | | 63,648 | | |
| Custodian fees and expenses | | 71,530 | | |
| Independent trustees' fees and expenses | | 1,010 | | |
| Registration fees | | 65,972 | | |
| Audit | | 62,732 | | |
| Legal | | 916 | | |
| Interest | | 3,583 | | |
| Miscellaneous | | 838 | | |
| Total expenses before reductions | | 2,162,435 | | |
| Expense reductions | | (17,228) | | |
| Total expenses after reductions | | | | 2,145,207 |
| Net Investment income (loss) | | | | (402,075) |
| Realized and Unrealized Gain (Loss) | | | | |
| Net realized gain (loss) on: | | | | |
| Investment Securities: | | | | |
| Unaffiliated issuers (net of foreign taxes of $1,660,372) | | 3,652,179 | | |
| Fidelity Central Funds | | 25 | | |
| Foreign currency transactions | | (3,787) | | |
| Total net realized gain (loss) | | | | 3,648,417 |
| Change in net unrealized appreciation (depreciation) on: | | | | |
| Investment Securities: | | | | |
| Unaffiliated issuers (net of increase in deferred foreign taxes of $587,642) | | 55,720,965 | | |
| Assets and liabilities in foreign currencies | | 115,751 | | |
| Total change in net unrealized appreciation (depreciation) | | | | 55,836,716 |
| Net gain (loss) | | | | 59,485,133 |
| Net increase (decrease) in net assets resulting from operations | | | $ | 59,083,058 |
| Statement of Changes in Net Assets |
| |
| | Six months ended April 30, 2024 (Unaudited) | | Year ended October 31, 2023 |
| Increase (Decrease) in Net Assets | | | | |
| Operations | | | | |
| Net investment income (loss) | $ | (402,075) | $ | (539,519) |
| Net realized gain (loss) | | 3,648,417 | | (80,332,504) |
| Change in net unrealized appreciation (depreciation) | | 55,836,716 | | 150,350,780 |
| Net increase (decrease) in net assets resulting from operations | | 59,083,058 | | 69,478,757 |
| Share transactions - net increase (decrease) | | (62,027,171) | | (55,569,856) |
| Total increase (decrease) in net assets | | (2,944,113) | | 13,908,901 |
| | | | | |
| Net Assets | | | | |
| Beginning of period | | 382,739,566 | | 368,830,665 |
| End of period | $ | 379,795,453 | $ | 382,739,566 |
| | | | | |
| | | | | |
Financial Highlights
Fidelity Advisor® Emerging Asia Fund Class A |
| |
| | Six months ended (Unaudited) April 30, 2024 | | Years ended October 31, 2023 | | 2022 | | 2021 | | 2020 | | 2019 |
Selected Per-Share Data | | | | | | | | | | | | |
| Net asset value, beginning of period | $ | 34.91 | $ | 29.31 | $ | 61.78 | $ | 56.33 | $ | 39.85 | $ | 33.52 |
| Income from Investment Operations | | | | | | | | | | | | |
Net investment income (loss) A,B | | (.07) | | (.10) | | (.25) | | (.40) C | | (.18) | | .23 |
| Net realized and unrealized gain (loss) | | 5.80 | | 5.70 | | (25.86) | | 10.17 | | 18.77 | | 8.23 |
| Total from investment operations | | 5.73 | | 5.60 | | (26.11) | | 9.77 | | 18.59 | | 8.46 |
| Distributions from net investment income | | - | | - | | - | | - | | (.13) D | | (.19) |
| Distributions from net realized gain | | - | | - | | (6.36) | | (4.32) | | (1.99) D | | (1.93) |
| Total distributions | | - | | - | | (6.36) | | (4.32) | | (2.11) E | | (2.13) E |
| Net asset value, end of period | $ | 40.64 | $ | 34.91 | $ | 29.31 | $ | 61.78 | $ | 56.33 | $ | 39.85 |
Total Return F,G,H | | | | 19.11% | | (46.56)% | | 17.45% | | 49.18% | | 26.60% |
Ratios to Average Net Assets B,I,J | | | | | | | | | | | | |
| Expenses before reductions | | 1.27% K | | 1.28% | | 1.25% | | 1.20% | | 1.26% | | 1.32% |
| Expenses net of fee waivers, if any | | | | 1.27% | | 1.25% | | 1.20% | | 1.26% | | 1.32% |
| Expenses net of all reductions | | 1.26% K | | 1.27% | | 1.25% | | 1.20% | | 1.23% | | 1.31% |
| Net investment income (loss) | | (.35)% K | | (.28)% | | (.61)% | | (.61)% C | | (.40)% | | .62% |
| Supplemental Data | | | | | | | | | | | | |
| Net assets, end of period (000 omitted) | $ | 128,781 | $ | 122,142 | $ | 115,657 | $ | 271,275 | $ | 208,546 | $ | 144,577 |
Portfolio turnover rate L | | | | 58% | | 44% | | 79% | | 110% | | 69% M |
ACalculated based on average shares outstanding during the period.
BNet investment income (loss) is affected by the timing of the declaration of dividends by any underlying mutual funds or exchange-traded funds (ETFs). Net investment income (loss) of any mutual funds or ETFs is not included in the Fund's net investment income (loss) ratio.
CNet investment income per share reflects one or more large, non-recurring dividend(s) which amounted to $.06 per share. Excluding such non-recurring dividend(s), the ratio of net investment income (loss) to average net assets would have been (.71)%.
DThe amount shown reflects reclassifications related to book to tax differences that were made in the year shown.
ETotal distributions per share do not sum due to rounding.
FTotal returns for periods of less than one year are not annualized.
GTotal returns would have been lower if certain expenses had not been reduced during the applicable periods shown.
HTotal returns do not include the effect of the sales charges.
IFees and expenses of any underlying mutual funds or exchange-traded funds (ETFs) are not included in the Fund's expense ratio. The Fund indirectly bears its proportionate share of these expenses. For additional expense information related to investments in Fidelity Central Funds, please refer to the "Investments in Fidelity Central Funds" note found in the Notes to Financial Statements section of the most recent Annual or Semi-Annual report.
JExpense ratios reflect operating expenses of the class. Expenses before reductions do not reflect amounts reimbursed, waived, or reduced through arrangements with the investment adviser, brokerage services, or other offset arrangements, if applicable, and do not represent the amount paid by the class during periods when reimbursements, waivers or reductions occur.
KAnnualized.
LAmount does not include the portfolio activity of any underlying mutual funds or exchange-traded funds (ETFs).
MPortfolio turnover rate excludes securities received or delivered in-kind.
Fidelity Advisor® Emerging Asia Fund Class M |
| |
| | Six months ended (Unaudited) April 30, 2024 | | Years ended October 31, 2023 | | 2022 | | 2021 | | 2020 | | 2019 |
Selected Per-Share Data | | | | | | | | | | | | |
| Net asset value, beginning of period | $ | 33.33 | $ | 28.07 | $ | 59.60 | $ | 54.51 | $ | 38.61 | $ | 32.50 |
| Income from Investment Operations | | | | | | | | | | | | |
Net investment income (loss) A,B | | (.11) | | (.19) | | (.34) | | (.55) C | | (.29) | | .12 |
| Net realized and unrealized gain (loss) | | 5.54 | | 5.45 | | (24.83) | | 9.87 | | 18.19 | | 7.98 |
| Total from investment operations | | 5.43 | | 5.26 | | (25.17) | | 9.32 | | 17.90 | | 8.10 |
| Distributions from net investment income | | - | | - | | - | | - | | (.01) D | | (.05) |
| Distributions from net realized gain | | - | | - | | (6.36) | | (4.23) | | (1.99) D | | (1.93) |
| Total distributions | | - | | - | | (6.36) | | (4.23) | | (2.00) | | (1.99) E |
| Net asset value, end of period | $ | 38.76 | $ | 33.33 | $ | 28.07 | $ | 59.60 | $ | 54.51 | $ | 38.61 |
Total Return F,G,H | | | | 18.74% | | (46.70)% | | 17.18% | | 48.78% | | 26.21% |
Ratios to Average Net Assets B,I,J | | | | | | | | | | | | |
| Expenses before reductions | | 1.52% K | | 1.55% | | 1.52% | | 1.45% | | 1.54% | | 1.61% |
| Expenses net of fee waivers, if any | | | | 1.55% | | 1.52% | | 1.45% | | 1.53% | | 1.61% |
| Expenses net of all reductions | | 1.51% K | | 1.54% | | 1.52% | | 1.45% | | 1.51% | | 1.60% |
| Net investment income (loss) | | (.61)% K | | (.55)% | | (.88)% | | (.87)% C | | (.68)% | | .32% |
| Supplemental Data | | | | | | | | | | | | |
| Net assets, end of period (000 omitted) | $ | 33,043 | $ | 30,814 | $ | 27,239 | $ | 60,893 | $ | 54,436 | $ | 39,197 |
Portfolio turnover rate L | | | | 58% | | 44% | | 79% | | 110% | | 69% M |
ACalculated based on average shares outstanding during the period.
BNet investment income (loss) is affected by the timing of the declaration of dividends by any underlying mutual funds or exchange-traded funds (ETFs). Net investment income (loss) of any mutual funds or ETFs is not included in the Fund's net investment income (loss) ratio.
CNet investment income per share reflects one or more large, non-recurring dividend(s) which amounted to $.06 per share. Excluding such non-recurring dividend(s), the ratio of net investment income (loss) to average net assets would have been (.96)%.
DThe amount shown reflects reclassifications related to book to tax differences that were made in the year shown.
ETotal distributions per share do not sum due to rounding.
FTotal returns for periods of less than one year are not annualized.
GTotal returns would have been lower if certain expenses had not been reduced during the applicable periods shown.
HTotal returns do not include the effect of the sales charges.
IFees and expenses of any underlying mutual funds or exchange-traded funds (ETFs) are not included in the Fund's expense ratio. The Fund indirectly bears its proportionate share of these expenses. For additional expense information related to investments in Fidelity Central Funds, please refer to the "Investments in Fidelity Central Funds" note found in the Notes to Financial Statements section of the most recent Annual or Semi-Annual report.
JExpense ratios reflect operating expenses of the class. Expenses before reductions do not reflect amounts reimbursed, waived, or reduced through arrangements with the investment adviser, brokerage services, or other offset arrangements, if applicable, and do not represent the amount paid by the class during periods when reimbursements, waivers or reductions occur.
KAnnualized.
LAmount does not include the portfolio activity of any underlying mutual funds or exchange-traded funds (ETFs).
MPortfolio turnover rate excludes securities received or delivered in-kind.
Fidelity Advisor® Emerging Asia Fund Class C |
| |
| | Six months ended (Unaudited) April 30, 2024 | | Years ended October 31, 2023 | | 2022 | | 2021 | | 2020 | | 2019 |
Selected Per-Share Data | | | | | | | | | | | | |
| Net asset value, beginning of period | $ | 29.79 | $ | 25.21 | $ | 54.45 | $ | 50.22 | $ | 35.77 | $ | 30.32 |
| Income from Investment Operations | | | | | | | | | | | | |
Net investment income (loss) A,B | | (.18) | | (.31) | | (.48) | | (.80) C | | (.47) | | (.04) |
| Net realized and unrealized gain (loss) | | 4.95 | | 4.89 | | (22.40) | | 9.10 | | 16.79 | | 7.42 |
| Total from investment operations | | 4.77 | | 4.58 | | (22.88) | | 8.30 | | 16.32 | | 7.38 |
| Distributions from net realized gain | | - | | - | | (6.36) | | (4.07) | | (1.87) | | (1.93) |
| Total distributions | | - | | - | | (6.36) | | (4.07) | | (1.87) | | (1.93) |
| Net asset value, end of period | $ | 34.56 | $ | 29.79 | $ | 25.21 | $ | 54.45 | $ | 50.22 | $ | 35.77 |
Total Return D,E,F | | | | 18.17% | | (46.94)% | | 16.58% | | 48.03% | | 25.67% |
Ratios to Average Net Assets B,G,H | | | | | | | | | | | | |
| Expenses before reductions | | 2.00% I | | 2.01% | | 1.99% | | 1.96% | | 2.03% | | 2.08% |
| Expenses net of fee waivers, if any | | | | 2.01% | | 1.99% | | 1.96% | | 2.02% | | 2.07% |
| Expenses net of all reductions | | 1.99% I | | 2.01% | | 1.99% | | 1.96% | | 1.99% | | 2.06% |
| Net investment income (loss) | | (1.08)% I | | (1.02)% | | (1.35)% | | (1.37)% C | | (1.17)% | | (.14)% |
| Supplemental Data | | | | | | | | | | | | |
| Net assets, end of period (000 omitted) | $ | 8,816 | $ | 8,864 | $ | 9,087 | $ | 26,377 | $ | 28,233 | $ | 23,584 |
Portfolio turnover rate J | | | | 58% | | 44% | | 79% | | 110% | | 69% K |
ACalculated based on average shares outstanding during the period.
BNet investment income (loss) is affected by the timing of the declaration of dividends by any underlying mutual funds or exchange-traded funds (ETFs). Net investment income (loss) of any mutual funds or ETFs is not included in the Fund's net investment income (loss) ratio.
CNet investment income per share reflects one or more large, non-recurring dividend(s) which amounted to $.05 per share. Excluding such non-recurring dividend(s), the ratio of net investment income (loss) to average net assets would have been (1.47)%.
DTotal returns for periods of less than one year are not annualized.
ETotal returns would have been lower if certain expenses had not been reduced during the applicable periods shown.
FTotal returns do not include the effect of the contingent deferred sales charge.
GFees and expenses of any underlying mutual funds or exchange-traded funds (ETFs) are not included in the Fund's expense ratio. The Fund indirectly bears its proportionate share of these expenses. For additional expense information related to investments in Fidelity Central Funds, please refer to the "Investments in Fidelity Central Funds" note found in the Notes to Financial Statements section of the most recent Annual or Semi-Annual report.
HExpense ratios reflect operating expenses of the class. Expenses before reductions do not reflect amounts reimbursed, waived, or reduced through arrangements with the investment adviser, brokerage services, or other offset arrangements, if applicable, and do not represent the amount paid by the class during periods when reimbursements, waivers or reductions occur.
IAnnualized.
JAmount does not include the portfolio activity of any underlying mutual funds or exchange-traded funds (ETFs).
KPortfolio turnover rate excludes securities received or delivered in-kind.
Fidelity Advisor® Emerging Asia Fund Class I |
| |
| | Six months ended (Unaudited) April 30, 2024 | | Years ended October 31, 2023 | | 2022 | | 2021 | | 2020 | | 2019 |
Selected Per-Share Data | | | | | | | | | | | | |
| Net asset value, beginning of period | $ | 36.56 | $ | 30.61 | $ | 64.13 | $ | 58.29 | $ | 41.16 | $ | 34.60 |
| Income from Investment Operations | | | | | | | | | | | | |
Net investment income (loss) A,B | | (.01) | | - C | | (.14) | | (.24) D | | (.07) | | .34 |
| Net realized and unrealized gain (loss) | | 6.07 | | 5.95 | | (26.95) | | 10.53 | | 19.42 | | 8.48 |
| Total from investment operations | | 6.06 | | 5.95 | | (27.09) | | 10.29 | | 19.35 | | 8.82 |
| Distributions from net investment income | | - | | - | | (.07) | | - | | (.23) E | | (.33) |
| Distributions from net realized gain | | - | | - | | (6.36) | | (4.45) | | (1.99) E | | (1.93) |
| Total distributions | | - | | - | | (6.43) | | (4.45) | | (2.22) | | (2.26) |
| Net asset value, end of period | $ | 42.62 | $ | 36.56 | $ | 30.61 | $ | 64.13 | $ | 58.29 | $ | 41.16 |
Total Return F,G | | | | 19.44% | | (46.41)% | | 17.77% | | 49.59% | | 26.93% |
Ratios to Average Net Assets B,H,I | | | | | | | | | | | | |
| Expenses before reductions | | .99% J | | .99% | | .97% | | .94% | | 1.00% | | 1.04% |
| Expenses net of fee waivers, if any | | | | .99% | | .97% | | .94% | | 1.00% | | 1.03% |
| Expenses net of all reductions | | .98% J | | .99% | | .97% | | .94% | | .97% | | 1.03% |
| Net investment income (loss) | | (.07)% J | | -% K | | (.33)% | | (.36)% D | | (.14)% | | .90% |
| Supplemental Data | | | | | | | | | | | | |
| Net assets, end of period (000 omitted) | $ | 140,331 | $ | 152,325 | $ | 143,659 | $ | 472,553 | $ | 414,664 | $ | 76,981 |
Portfolio turnover rate L | | | | 58% | | 44% | | 79% | | 110% | | 69% M |
ACalculated based on average shares outstanding during the period.
BNet investment income (loss) is affected by the timing of the declaration of dividends by any underlying mutual funds or exchange-traded funds (ETFs). Net investment income (loss) of any mutual funds or ETFs is not included in the Fund's net investment income (loss) ratio.
CAmount represents less than $.005 per share.
DNet investment income per share reflects one or more large, non-recurring dividend(s) which amounted to $.06 per share. Excluding such non-recurring dividend(s), the ratio of net investment income (loss) to average net assets would have been (.45)%.
EThe amount shown reflects reclassifications related to book to tax differences that were made in the year shown.
FTotal returns for periods of less than one year are not annualized.
GTotal returns would have been lower if certain expenses had not been reduced during the applicable periods shown.
HFees and expenses of any underlying mutual funds or exchange-traded funds (ETFs) are not included in the Fund's expense ratio. The Fund indirectly bears its proportionate share of these expenses. For additional expense information related to investments in Fidelity Central Funds, please refer to the "Investments in Fidelity Central Funds" note found in the Notes to Financial Statements section of the most recent Annual or Semi-Annual report.
IExpense ratios reflect operating expenses of the class. Expenses before reductions do not reflect amounts reimbursed, waived, or reduced through arrangements with the investment adviser, brokerage services, or other offset arrangements, if applicable, and do not represent the amount paid by the class during periods when reimbursements, waivers or reductions occur.
JAnnualized.
KAmount represents less than .005%.
LAmount does not include the portfolio activity of any underlying mutual funds or exchange-traded funds (ETFs).
MPortfolio turnover rate excludes securities received or delivered in-kind.
Fidelity Advisor® Emerging Asia Fund Class Z |
| |
| | Six months ended (Unaudited) April 30, 2024 | | Years ended October 31, 2023 | | 2022 | | 2021 | | 2020 | | 2019 |
Selected Per-Share Data | | | | | | | | | | | | |
| Net asset value, beginning of period | $ | 36.53 | $ | 30.55 | $ | 64.10 | $ | 58.22 | $ | 41.12 | $ | 34.60 |
| Income from Investment Operations | | | | | | | | | | | | |
Net investment income (loss) A,B | | .01 | | .05 | | (.08) | | (.15) C | | - D | | .40 |
| Net realized and unrealized gain (loss) | | 6.08 | | 5.93 | | (26.89) | | 10.50 | | 19.38 | | 8.47 |
| Total from investment operations | | 6.09 | | 5.98 | | (26.97) | | 10.35 | | 19.38 | | 8.87 |
| Distributions from net investment income | | - | | - | | (.22) | | - | | (.30) E | | (.42) |
| Distributions from net realized gain | | - | | - | | (6.36) | | (4.47) | | (1.99) E | | (1.93) |
| Total distributions | | - | | - | | (6.58) | | (4.47) | | (2.28) F | | (2.35) |
| Net asset value, end of period | $ | 42.62 | $ | 36.53 | $ | 30.55 | $ | 64.10 | $ | 58.22 | $ | 41.12 |
Total Return G,H | | | | 19.57% | | (46.34)% | | 17.92% | | 49.80% | | 27.14% |
Ratios to Average Net Assets B,I,J | | | | | | | | | | | | |
| Expenses before reductions | | .85% K | | .86% | | .84% | | .81% | | .86% | | .89% |
| Expenses net of fee waivers, if any | | | | .85% | | .84% | | .81% | | .85% | | .89% |
| Expenses net of all reductions | | .85% K | | .85% | | .84% | | .81% | | .82% | | .89% |
| Net investment income (loss) | | .06% K | | .14% | | (.20)% | | (.22)% C | | -% L | | 1.04% |
| Supplemental Data | | | | | | | | | | | | |
| Net assets, end of period (000 omitted) | $ | 68,823 | $ | 68,594 | $ | 73,190 | $ | 264,327 | $ | 103,477 | $ | 44,545 |
Portfolio turnover rate M | | | | 58% | | 44% | | 79% | | 110% | | 69% N |
ACalculated based on average shares outstanding during the period.
BNet investment income (loss) is affected by the timing of the declaration of dividends by any underlying mutual funds or exchange-traded funds (ETFs). Net investment income (loss) of any mutual funds or ETFs is not included in the Fund's net investment income (loss) ratio.
CNet investment income per share reflects one or more large, non-recurring dividend(s) which amounted to $.06 per share. Excluding such non-recurring dividend(s), the ratio of net investment income (loss) to average net assets would have been (.32)%.
DAmount represents less than $.005 per share.
EThe amount shown reflects reclassifications related to book to tax differences that were made in the year shown.
FTotal distributions per share do not sum due to rounding.
GTotal returns for periods of less than one year are not annualized.
HTotal returns would have been lower if certain expenses had not been reduced during the applicable periods shown.
IFees and expenses of any underlying mutual funds or exchange-traded funds (ETFs) are not included in the Fund's expense ratio. The Fund indirectly bears its proportionate share of these expenses. For additional expense information related to investments in Fidelity Central Funds, please refer to the "Investments in Fidelity Central Funds" note found in the Notes to Financial Statements section of the most recent Annual or Semi-Annual report.
JExpense ratios reflect operating expenses of the class. Expenses before reductions do not reflect amounts reimbursed, waived, or reduced through arrangements with the investment adviser, brokerage services, or other offset arrangements, if applicable, and do not represent the amount paid by the class during periods when reimbursements, waivers or reductions occur.
KAnnualized.
LAmount represents less than .005%.
MAmount does not include the portfolio activity of any underlying mutual funds or exchange-traded funds (ETFs).
NPortfolio turnover rate excludes securities received or delivered in-kind.
For the period ended April 30, 2024
1. Organization.
Fidelity Advisor Emerging Asia Fund (the Fund) is a fund of Fidelity Advisor Series VIII (the Trust) and is authorized to issue an unlimited number of shares. The Trust is registered under the Investment Company Act of 1940, as amended (the 1940 Act), as an open-end management investment company organized as a Massachusetts business trust. The Fund offers Class A, Class M, Class C, Class I and Class Z shares, each of which has equal rights as to assets and voting privileges. Class A, Class M, Class C, Class I and Class Z are Fidelity Advisor classes. Each class has exclusive voting rights with respect to matters that affect that class. Class C shares will automatically convert to Class A shares after a holding period of eight years from the initial date of purchase, with certain exceptions. The Fund's investments in emerging markets can be subject to social, economic, regulatory, and political uncertainties and can be extremely volatile.
2. Investments in Fidelity Central Funds.
Funds may invest in Fidelity Central Funds, which are open-end investment companies generally available only to other investment companies and accounts managed by the investment adviser and its affiliates. The Schedule of Investments lists any Fidelity Central Funds held as an investment as of period end, but does not include the underlying holdings of each Fidelity Central Fund. An investing fund indirectly bears its proportionate share of the expenses of the underlying Fidelity Central Funds.
Based on its investment objective, each Fidelity Central Fund may invest or participate in various investment vehicles or strategies that are similar to those of the investing fund. These strategies are consistent with the investment objectives of the investing fund and may involve certain economic risks which may cause a decline in value of each of the Fidelity Central Funds and thus a decline in the value of the investing fund.
| Fidelity Central Fund | Investment Manager | Investment Objective | Investment Practices | Expense RatioA |
| Fidelity Money Market Central Funds | Fidelity Management & Research Company LLC (FMR) | Each fund seeks to obtain a high level of current income consistent with the preservation of capital and liquidity. | Short-term Investments | Less than .005% |
A Expenses expressed as a percentage of average net assets and are as of each underlying Central Fund's most recent annual or semi-annual shareholder report.
A complete unaudited list of holdings for each Fidelity Central Fund is available upon request or at the Securities and Exchange Commission website at www.sec.gov. In addition, the financial statements of the Fidelity Central Funds which contain the significant accounting policies (including investment valuation policies) of those funds, and are not covered by the Report of Independent Registered Public Accounting Firm, are available on the Securities and Exchange Commission website or upon request.
3. Significant Accounting Policies.
The Fund is an investment company and applies the accounting and reporting guidance of the Financial Accounting Standards Board (FASB) Accounting Standards Codification Topic 946 Financial Services - Investment Companies. The financial statements have been prepared in conformity with accounting principles generally accepted in the United States of America (GAAP), which require management to make certain estimates and assumptions at the date of the financial statements. Actual results could differ from those estimates. Subsequent events, if any, through the date that the financial statements were issued have been evaluated in the preparation of the financial statements. The Fund's Schedule of Investments lists any underlying mutual funds or exchange-traded funds (ETFs) but does not include the underlying holdings of these funds. The following summarizes the significant accounting policies of the Fund:
Investment Valuation. Investments are valued as of 4:00 p.m. Eastern time on the last calendar day of the period. The Board of Trustees (the Board) has designated the Fund's investment adviser as the valuation designee responsible for the fair valuation function and performing fair value determinations as needed. The investment adviser has established a Fair Value Committee (the Committee) to carry out the day-to-day fair valuation responsibilities and has adopted policies and procedures to govern the fair valuation process and the activities of the Committee. In accordance with these fair valuation policies and procedures, which have been approved by the Board, the Fund attempts to obtain prices from one or more third party pricing services or brokers to value its investments. When current market prices, quotations or currency exchange rates are not readily available or reliable, investments will be fair valued in good faith by the Committee, in accordance with the policies and procedures. Factors used in determining fair value vary by investment type and may include market or investment specific events, transaction data, estimated cash flows, and market observations of comparable investments. The frequency that the fair valuation procedures are used cannot be predicted and they may be utilized to a significant extent. The Committee manages the Fund's fair valuation practices and maintains the fair valuation policies and procedures. The Fund's investment adviser reports to the Board information regarding the fair valuation process and related material matters.
The Fund categorizes the inputs to valuation techniques used to value its investments into a disclosure hierarchy consisting of three levels as shown below:
Level 1 - unadjusted quoted prices in active markets for identical investments
Level 2 - other significant observable inputs (including quoted prices for similar investments, interest rates, prepayment speeds, etc.)
Level 3 - unobservable inputs (including the Fund's own assumptions based on the best information available)
Valuation techniques used to value the Fund's investments by major category are as follows:
Equity securities, including restricted securities, for which market quotations are readily available, are valued at the last reported sale price or official closing price as reported by a third party pricing service on the primary market or exchange on which they are traded and are categorized as Level 1 in the hierarchy. In the event there were no sales during the day or closing prices are not available, securities are valued at the last quoted bid price or may be valued using the last available price and are generally categorized as Level 2 in the hierarchy. For foreign equity securities, when market or security specific events arise, comparisons to the valuation of American Depositary Receipts (ADRs), futures contracts, Exchange-Traded Funds (ETFs) and certain indexes as well as quoted prices for similar securities may be used and would be categorized as Level 2 in the hierarchy. For equity securities, including restricted securities, where observable inputs are limited, assumptions about market activity and risk are used and these securities may be categorized as Level 3 in the hierarchy. Securities, including private placements or other restricted securities, for which observable inputs are not available are valued using alternate valuation approaches, including the market approach, the income approach and cost approach, and are categorized as Level 3 in the hierarchy. The market approach considers factors including the price of recent investments in the same or a similar security or financial metrics of comparable securities. The income approach considers factors including expected future cash flows, security specific risks and corresponding discount rates. The cost approach considers factors including the value of the security's underlying assets and liabilities.
Investments in open-end mutual funds, including the Fidelity Central Funds, are valued at their closing net asset value (NAV) each business day and are categorized as Level 1 in the hierarchy.
The following provides information on Level 3 securities held by the Fund that were valued at period end based on unobservable inputs. These amounts exclude valuations provided by a broker.
| Asset Type | Fair Value | Valuation Technique(s) | Unobservable Input | Amount or Range/Weighted Average | Impact to Valuation from an Increase in InputA |
| Equities | $4,282,649 | Market comparable | Enterprise value/Revenue multiple (EV/R) | 2.5 - 2.8 / 2.7 | Increase |
| | | | Enterprise value/EBITDA multiple (EV/EBITDA) | 16.9 | Increase |
| | | Market approach | Discount rate | 20.0% | Decrease |
| | | Black scholes | Discount rate | 4.8% | Increase |
| | | | Term | 3.0 | Increase |
| | | | Volatility | 60.0% | Increase |
A Represents the directional change in the fair value of the Level 3 investments that could have resulted from an increase in the corresponding input as of period end. A decrease to the unobservable input would have had the opposite effect. Significant changes in these inputs may have resulted in a significantly higher or lower fair value measurement at period end.
Changes in valuation techniques may result in transfers in or out of an assigned level within the disclosure hierarchy. The aggregate value of investments by input level as of April 30, 2024, as well as a roll forward of Level 3 investments, is included at the end of the Fund's Schedule of Investments.
Foreign Currency. Certain Funds may use foreign currency contracts to facilitate transactions in foreign-denominated securities. Gains and losses from these transactions may arise from changes in the value of the foreign currency or if the counterparties do not perform under the contracts' terms.
Foreign-denominated assets, including investment securities, and liabilities are translated into U.S. dollars at the exchange rates at period end. Purchases and sales of investment securities, income and dividends received, and expenses denominated in foreign currencies are translated into U.S. dollars at the exchange rate in effect on the transaction date.
The effects of exchange rate fluctuations on investments are included with the net realized and unrealized gain (loss) on investment securities. Other foreign currency transactions resulting in realized and unrealized gain (loss) are disclosed separately.
Investment Transactions and Income. For financial reporting purposes, the Fund's investment holdings and NAV include trades executed through the end of the last business day of the period. The NAV per share for processing shareholder transactions is calculated as of the close of business of the New York Stock Exchange (NYSE), normally 4:00 p.m. Eastern time and includes trades executed through the end of the prior business day. Gains and losses on securities sold are determined on the basis of identified cost and include proceeds received from litigation. Commissions paid to certain brokers with whom the investment adviser, or its affiliates, places trades on behalf of a fund include an amount in addition to trade execution, which may be rebated back to a fund. Any such rebates are included in net realized gain (loss) on investments in the Statement of Operations. Dividend income is recorded on the ex-dividend date, except for certain dividends from foreign securities where the ex-dividend date may have passed, which are recorded as soon as the Fund is informed of the ex-dividend date. Non-cash dividends included in dividend income, if any, are recorded at the fair market value of the securities received. Income and capital gain distributions from Fidelity Central Funds, if any, are recorded on the ex-dividend date. Investment income is recorded net of foreign taxes withheld where recovery of such taxes is uncertain. Funds may file withholding tax reclaims in certain jurisdictions to recover a portion of amounts previously withheld. Any withholding tax reclaims income is included in the Statement of Operations in foreign taxes withheld. Any receivables for withholding tax reclaims are included in the Statement of Assets and Liabilities in dividends receivable.
Class Allocations and Expenses. Investment income, realized and unrealized capital gains and losses, common expenses of a fund, and certain fund-level expense reductions, if any, are allocated daily on a pro-rata basis to each class based on the relative net assets of each class to the total net assets of a fund. Each class differs with respect to transfer agent and distribution and service plan fees incurred, as applicable. Certain expense reductions may also differ by class, if applicable. For the reporting period, the allocated portion of income and expenses to each class as a percent of its average net assets may vary due to the timing of recording these transactions in relation to fluctuating net assets of the classes. Expenses directly attributable to a fund are charged to that fund. Expenses attributable to more than one fund are allocated among the respective funds on the basis of relative net assets or other appropriate methods. Expenses included in the accompanying financial statements reflect the expenses of that fund and do not include any expenses associated with any underlying mutual funds or exchange-traded funds (ETFs). Although not included in a fund's expenses, a fund indirectly bears its proportionate share of these expenses through the net asset value of each underlying mutual fund or exchange-traded fund (ETF). Expense estimates are accrued in the period to which they relate and adjustments are made when actual amounts are known.
Income Tax Information and Distributions to Shareholders. Each year, the Fund intends to qualify as a regulated investment company under Subchapter M of the Internal Revenue Code, including distributing substantially all of its taxable income and realized gains. As a result, no provision for U.S. Federal income taxes is required. The Fund files a U.S. federal tax return, in addition to state and local tax returns as required. The Fund's federal income tax returns are subject to examination by the Internal Revenue Service (IRS) for a period of three fiscal years after they are filed. State and local tax returns may be subject to examination for an additional fiscal year depending on the jurisdiction. Foreign taxes are provided for based on the Fund's understanding of the tax rules and rates that exist in the foreign markets in which it invests. The Fund is subject to a tax imposed on capital gains by certain countries in which it invests. An estimated deferred tax liability for net unrealized appreciation on the applicable securities is included in Deferred taxes on the Statement of Assets & Liabilities.
Distributions are declared and recorded on the ex-dividend date. Income and capital gain distributions are declared separately for each class. Income and capital gain distributions are determined in accordance with income tax regulations, which may differ from GAAP.
Capital accounts within the financial statements are adjusted for permanent book-tax differences. These adjustments have no impact on net assets or the results of operations. Capital accounts are not adjusted for temporary book-tax differences which will reverse in a subsequent period.
Book-tax differences are primarily due to foreign currency transactions, certain foreign taxes, passive foreign investment companies (PFIC), net operating losses, capital loss carryforwards, losses deferred due to wash sales and excise tax regulations.
As of period end, the cost and unrealized appreciation (depreciation) in securities, and derivatives if applicable, for federal income tax purposes were as follows:
| Gross unrealized appreciation | $133,881,994 |
| Gross unrealized depreciation | (58,930,255) |
| Net unrealized appreciation (depreciation) | $74,951,739 |
| Tax cost | $316,284,218 |
Capital loss carryforwards are only available to offset future capital gains of the Fund to the extent provided by regulations and may be limited. The capital loss carryforward information presented below, including any applicable limitation, is estimated as of prior fiscal period end and is subject to adjustment.
Short-term | $(80,563,041) |
Long-term | (105,506,635) |
| Total capital loss carryforward | $(186,069,676) |
The Fund elected to defer to its next fiscal year approximately $341,028 of ordinary losses recognized during the period January 1, 2023 to October 31, 2023.
Delayed Delivery Transactions and When-Issued Securities. During the period, certain Funds transacted in securities on a delayed delivery or when-issued basis. Payment and delivery may take place after the customary settlement period for that security. The price of the underlying securities and the date when the securities will be delivered and paid for are fixed at the time the transaction is negotiated. Securities purchased on a delayed delivery or when-issued basis are identified as such in the Schedule of Investments. Compensation for interest forgone in the purchase of a delayed delivery or when-issued debt security may be received. With respect to purchase commitments, each applicable Fund identifies securities as segregated in its records with a value at least equal to the amount of the commitment. Payables and receivables associated with the purchases and sales of delayed delivery securities having the same coupon, settlement date and broker are offset. Delayed delivery or when-issued securities that have been purchased from and sold to different brokers are reflected as both payables and receivables in the Statement of Assets and Liabilities under the caption "Delayed delivery", as applicable. Losses may arise due to changes in the value of the underlying securities or if the counterparty does not perform under the contract's terms, or if the issuer does not issue the securities due to political, economic, or other factors.
Restricted Securities (including Private Placements). Funds may invest in securities that are subject to legal or contractual restrictions on resale. These securities generally may be resold in transactions exempt from registration or to the public if the securities are registered. Disposal of these securities may involve time-consuming negotiations and expense, and prompt sale at an acceptable price may be difficult. Information regarding restricted securities held at period end is included at the end of the Schedule of Investments, if applicable.
4. Purchases and Sales of Investments.
Purchases and sales of securities, other than short-term securities and in-kind transactions, as applicable, are noted in the table below.
| | Purchases ($) | Sales ($) |
| Fidelity Advisor Emerging Asia Fund | 126,085,015 | 185,422,967 |
5. Fees and Other Transactions with Affiliates.
Management Fee. Fidelity Management & Research Company LLC (the investment adviser) and its affiliates provide the Fund with investment management related services for which the Fund pays a monthly management fee.
Effective March 1, 2024, the Fund's management contract was amended to incorporate administrative services previously covered under separate services agreements (Transfer Agent and Accounting agreements). The amended contract incorporates a management fee rate that may vary by class. The investment adviser or an affiliate pays certain expenses of managing and operating the Fund out of each class's management fee. Each class of the Fund pays a management fee to the investment adviser. The management fee is calculated and paid to the investment adviser every month. When determining a class's management fee, a mandate rate is calculated based on the monthly average net assets of a group of funds advised by FMR within a designated asset class. A discount rate is subtracted from the mandate rate once the Fund's monthly average net assets reach a certain level. The mandate rate and discount rate may vary by class. The annual management fee rate for a class of shares of the Fund is the lesser of (1) the class's mandate rate reduced by the class's discount rate (if applicable) or (2) the amount set forth in the following table.
| | Maximum Management Fee Rate % |
| Class A | .88 |
| Class M | .88 |
| Class C | .87 |
| Class I | .86 |
| Class Z | .72 |
One-twelfth of the management fee rate for a class is applied to the average net assets of the class for the month, giving a dollar amount which is the management fee for the class for that month. A different management fee rate may be applicable to each class of the Fund. The difference between classes is the result of separate arrangements for class-level services and/or waivers of certain expenses. It is not the result of any difference in advisory or custodial fees or other expenses related to the management of the Fund's assets, which do not vary by class. For the portion of the reporting period on or after March 1, 2024, the total annualized management fee rates were as follows:
| | Total Management Fee Rate % |
| Class A | .88 |
| Class M | .88 |
| Class C | .87 |
| Class I | .86 |
| Class Z | .72 |
Prior to March 1, 2024, the management fee was the sum of an individual fund fee rate that was based on an annual rate of .45% of the Fund's average net assets and an annualized group fee rate that averaged .22% during the period. The group fee rate was based upon the monthly average net assets of a group of registered investment companies with which the investment adviser has management contracts. The group fee rate decreased as assets under management increased and increased as assets under management decreased. For the portion of the reporting period prior to March 1, 2024, the total annualized management fee rate was .67%.
Effective March 1, 2024, the Fund's sub-advisory agreements with FMR Investment Management (UK) Limited, Fidelity Management & Research (Hong Kong) Limited, and Fidelity Management & Research (Japan) Limited were amended to provide that the investment adviser pays each sub-adviser monthly fees equal to 110% of the sub-adviser's costs for providing sub-advisory services.
Effective March 1, 2024, the Fund's sub-advisory agreement with FIL Investment Advisors (FIA) was amended to provide that the investment adviser pays FIA monthly fees at an annual rate of 0.50% with respect to the average daily net assets of the Fund managed by FIA. FIA in turn pays FIA(UK).
Distribution and Service Plan Fees. In accordance with Rule 12b-1 of the 1940 Act, the Fund has adopted separate Distribution and Service Plans for each class of shares. Certain classes pay Fidelity Distributors Company LLC (FDC), an affiliate of the investment adviser, separate Distribution and Service Fees, each of which is based on an annual percentage of each class' average net assets. In addition, FDC may pay financial intermediaries for selling shares of the Fund and providing shareholder support services. For the period, the Distribution and Service Fee rates, total fees and amounts retained by FDC were as follows:
| | Distribution Fee | Service Fee | Total Fees ($) | Retained by FDC ($) |
| Class A | - % | .25% | 159,932 | 1,806 |
| Class M | .25% | .25% | 81,156 | 616 |
| Class C | .75% | .25% | 45,037 | 4,469 |
| | | | 286,125 | 6,891 |
Sales Load. FDC may receive a front-end sales charge of up to 5.75% for selling Class A shares and 3.50% for selling Class M shares, some of which is paid to financial intermediaries for selling shares of the Fund. Depending on the holding period, FDC may receive contingent deferred sales charges levied on Class A, Class M and Class C redemptions. The deferred sales charges are 1.00% for Class C shares, 1.00% for certain purchases of Class A shares and .25% for certain purchases of Class M shares.
For the period, sales charge amounts retained by FDC were as follows:
| | Retained by FDC ($) |
| Class A | 6,267 |
| Class M | 428 |
Class CA | 40 |
| | 6,735 |
A When Class C shares are initially sold, FDC pays commissions from its own resources to financial intermediaries through which the sales are made.
Transfer Agent Fees. Fidelity Investments Institutional Operations Company LLC (FIIOC), an affiliate of the investment adviser, is the transfer, dividend disbursing and shareholder servicing agent for each class of the Fund. Effective March 1, 2024, the Fund's management contract was amended to incorporate transfer agent services and associated fees previously covered under a separate services agreement. FIIOC pays for typesetting, printing and mailing of shareholder reports, except proxy statements.
During November 2023, the Board approved a change in the transfer agent fees effective December 1, 2023 to a fixed annual rate of class-level average net assets as follows:
| | % of Class-Level Average Net Assets |
| Class A | .2000 |
| Class M | .2000 |
| Class C | .1874 |
| Class I | .1732 |
Prior to December 1, 2023, FIIOC received account fees and asset-based fees that varied according to the account size and type of account of the shareholders of, except for Class Z. FIIOC received an asset-based fee of Class Z's average net assets. For the portion of the reporting period prior to March 1, 2024, the fees were equivalent to the following annualized rates:
| | Amount ($) | % of Class-Level Average Net AssetsA |
| Class A | 85,161 | .20 |
| Class M | 22,247 | .21 |
| Class C | 5,673 | .19 |
| Class I | 82,816 | .17 |
| Class Z | 9,753 | .04 |
| | 205,650 | |
A Annualized
Accounting Fees. Fidelity Service Company, Inc. (FSC), an affiliate of the investment adviser, maintains the Fund's accounting records. Effective March 1, 2024, the Fund's management contract was amended to incorporate accounting services and associated fees previously covered under a separate services agreement.
During November 2023, the Board approved a change in the accounting fees effective December 1, 2023 to a fixed annual rate of average net assets as follows:
| | % of Average Net Assets |
| Fidelity Advisor Emerging Asia Fund | .0497 |
Prior to December 1, 2023, the accounting fee was based on the level of average net assets for each month. For the portion of the reporting period prior to March 1, 2024, the fees were equivalent to the following annualized rates:
| | % of Average Net Assets |
| Fidelity Advisor Emerging Asia Fund | .05 |
Brokerage Commissions. A portion of portfolio transactions were placed with brokerage firms which are affiliates of the investment adviser. Brokerage commissions are included in net realized gain (loss) and change in net unrealized appreciation (depreciation) in the Statement of Operations. The commissions paid to these affiliated firms were as follows:
| | Amount ($) |
| Fidelity Advisor Emerging Asia Fund | 584 |
Interfund Lending Program. Pursuant to an Exemptive Order issued by the Securities and Exchange Commission (the SEC), the Fund, along with other registered investment companies having management contracts with Fidelity Management & Research Company LLC (FMR), or other affiliated entities of FMR, may participate in an interfund lending program. This program provides an alternative credit facility allowing the Fund to borrow from, or lend money to, other participating affiliated funds. At period end, there were no interfund loans outstanding. Activity in this program during the period for which loans were outstanding was as follows:
| | Borrower or Lender | Average Loan Balance ($) | Weighted Average Interest Rate | Interest Expense ($) |
| Fidelity Advisor Emerging Asia Fund | Borrower | 3,310,714 | 5.57% | 3,583 |
Interfund Trades. Funds may purchase from or sell securities to other Fidelity Funds under procedures adopted by the Board. The procedures have been designed to ensure these interfund trades are executed in accordance with Rule 17a-7 of the 1940 Act. Any interfund trades are included within the respective purchases and sales amounts shown in the Purchases and Sales of Investments note. Interfund trades during the period are noted in the table below.
| | Purchases ($) | Sales ($) | Realized Gain (Loss)($) |
| Fidelity Advisor Emerging Asia Fund | 2,954,922 | 9,683,774 | 563,643 |
6. Committed Line of Credit.
Certain Funds participate with other funds managed by the investment adviser or an affiliate in a $4.25 billion credit facility (the "line of credit") to be utilized for temporary or emergency purposes to fund shareholder redemptions or for other short-term liquidity purposes. The participating funds have agreed to pay commitment fees on their pro-rata portion of the line of credit, which are reflected in Miscellaneous expenses on the Statement of Operations, and are listed below. During the period, there were no borrowings on this line of credit.
| | Amount ($) |
| Fidelity Advisor Emerging Asia Fund | 359 |
7. Security Lending.
Funds lend portfolio securities from time to time in order to earn additional income. Lending agents are used, including National Financial Services (NFS), an affiliate of the investment adviser. Pursuant to a securities lending agreement, NFS will receive a fee, which is capped at 9.9% of a fund's daily lending revenue, for its services as lending agent. A fund may lend securities to certain qualified borrowers, including NFS. On the settlement date of the loan, a fund receives collateral (in the form of U.S. Treasury obligations, letters of credit and/or cash) against the loaned securities and maintains collateral in an amount not less than 100% of the market value of the loaned securities during the period of the loan. The market value of the loaned securities is determined at the close of business of a fund and any additional required collateral is delivered to a fund on the next business day. A fund or borrower may terminate the loan at any time, and if the borrower defaults on its obligation to return the securities loaned because of insolvency or other reasons, a fund may apply collateral received from the borrower against the obligation. A fund may experience delays and costs in recovering the securities loaned. Any cash collateral received is invested in the Fidelity Securities Lending Cash Central Fund. Any loaned securities are identified as such in the Schedule of Investments, and the value of loaned securities and cash collateral at period end, as applicable, are presented in the Statement of Assets and Liabilities. Security lending income represents the income earned on investing cash collateral, less rebates paid to borrowers and any lending agent fees associated with the loan, plus any premium payments received for lending certain types of securities. Security lending income is presented in the Statement of Operations as a component of income from Fidelity Central Funds. Affiliated security lending activity, if any, was as follows:
| | Total Security Lending Fees Paid to NFS ($) | Security Lending Income From Securities Loaned to NFS ($) | Value of Securities Loaned to NFS at Period End ($) |
| Fidelity Advisor Emerging Asia Fund | 4,378 | 1 | - |
8. Expense Reductions.
Through arrangements with each class' transfer agent, credits realized as a result of certain uninvested cash balances were used to reduce the Fund's expenses. During the period, transfer agent credits reduced each class' expenses as noted in the table below.
| | Expense reduction ($) |
| | |
| Class M | 109 |
In addition, during the period the investment adviser or an affiliate reimbursed and/or waived a portion of fund-level operating expenses in the amount of $17,119.
9. Share Transactions.
Share transactions for each class were as follows and may contain in-kind transactions, automatic conversions between classes or exchanges between affiliated funds:
| | Shares | Shares | Dollars | Dollars |
| | Six months ended April 30, 2024 | Year ended October 31, 2023 | Six months ended April 30, 2024 | Year ended October 31, 2023 |
| Fidelity Advisor Emerging Asia Fund | | | | |
| Class A | | | | |
| Shares sold | 89,041 | 281,898 | $3,416,936 | $10,325,265 |
| Shares redeemed | (419,453) | (728,232) | (16,103,496) | (26,132,011) |
| Net increase (decrease) | (330,412) | (446,334) | $(12,686,560) | $(15,806,746) |
| Class M | | | | |
| Shares sold | 21,499 | 82,598 | $796,238 | $2,883,095 |
| Shares redeemed | (93,451) | (128,553) | (3,418,102) | (4,423,525) |
| Net increase (decrease) | (71,952) | (45,955) | $(2,621,864) | $(1,540,430) |
| Class C | | | | |
| Shares sold | 19,922 | 54,577 | $647,619 | $1,704,473 |
| Shares redeemed | (62,341) | (117,545) | (2,039,926) | (3,620,432) |
| Net increase (decrease) | (42,419) | (62,968) | $(1,392,307) | $(1,915,959) |
| Class I | | | | |
| Shares sold | 381,406 | 2,605,228 | $15,472,912 | $100,199,113 |
| Shares redeemed | (1,255,766) | (3,131,075) | (50,287,317) | (117,071,474) |
| Net increase (decrease) | (874,360) | (525,847) | $(34,814,405) | $(16,872,361) |
| Class Z | | | | |
| Shares sold | 119,120 | 487,825 | $4,841,643 | $18,334,130 |
| Shares redeemed | (382,001) | (1,005,778) | (15,353,678) | (37,768,490) |
| Net increase (decrease) | (262,881) | (517,953) | $(10,512,035) | $(19,434,360) |
10. Other.
A fund's organizational documents provide former and current trustees and officers with a limited indemnification against liabilities arising in connection with the performance of their duties to the fund. In the normal course of business, a fund may also enter into contracts that provide general indemnifications. A fund's maximum exposure under these arrangements is unknown as this would be dependent on future claims that may be made against a fund. The risk of material loss from such claims is considered remote.
11. Risk and Uncertainties.
Many factors affect a fund's performance. Developments that disrupt global economies and financial markets, such as pandemics, epidemics, outbreaks of infectious diseases, war, terrorism, and environmental disasters, may significantly affect a fund's investment performance. The effects of these developments to a fund will be impacted by the types of securities in which a fund invests, the financial condition, industry, economic sector, and geographic location of an issuer, and a fund's level of investment in the securities of that issuer. Significant concentrations in security types, issuers, industries, sectors, and geographic locations may magnify the factors that affect a fund's performance.
As a shareholder, you incur two types of costs: (1) transaction costs, which may include sales charges (loads) on purchase payments or redemption proceeds, as applicable and (2) ongoing costs, which generally include management fees, distribution and/or service (12b-1) fees and other Fund expenses. This Example is intended to help you understand your ongoing costs (in dollars) of investing in a fund and to compare these costs with the ongoing costs of investing in other mutual funds.
| The Example is based on an investment of $1,000 invested at the beginning of the period and held for the entire period (November 1, 2023 to April 30, 2024). |
Actual Expenses
The first line of the accompanying table provides information about actual account values and actual expenses. You may use the information in this line, together with the amount you invested, to estimate the expenses that you paid over the period. Simply divide your account value by $1,000.00 (for example, an $8,600 account value divided by $1,000.00 = 8.6), then multiply the result by the number in the first line for a class/Fund under the heading entitled "Expenses Paid During Period" to estimate the expenses you paid on your account during this period. If any fund is a shareholder of any underlying mutual funds or exchange-traded funds (ETFs) (the Underlying Funds), such fund indirectly bears its proportional share of the expenses of the Underlying Funds in addition to the direct expenses incurred presented in the table. These fees and expenses are not included in the annualized expense ratio used to calculate the expense estimate in the table below.
Hypothetical Example for Comparison Purposes
The second line of the accompanying table provides information about hypothetical account values and hypothetical expenses based on the actual expense ratio and an assumed rate of return of 5% per year before expenses, which is not the actual return. The hypothetical account values and expenses may not be used to estimate the actual ending account balance or expenses you paid for the period. You may use this information to compare the ongoing costs of investing in the Fund and other funds. To do so, compare this 5% hypothetical example with the 5% hypothetical examples that appear in the shareholder reports of the other funds. If any fund is a shareholder of any Underlying Funds, such fund indirectly bears its proportional share of the expenses of the Underlying Funds in addition to the direct expenses as presented in the table. These fees and expenses are not included in the annualized expense ratio used to calculate the expense estimate in the table below.
Please note that the expenses shown in the table are meant to highlight your ongoing costs only and do not reflect any transaction costs. Therefore, the second line of the table is useful in comparing ongoing costs only, and will not help you determine the relative total costs of owning different funds. In addition, if these transactional costs were included, your costs would have been higher.
| | | | | Annualized Expense Ratio- A | | Beginning Account Value November 1, 2023 | | Ending Account Value April 30, 2024 | | Expenses Paid During Period- C November 1, 2023 to April 30, 2024 |
| Fidelity Advisor® Emerging Asia Fund | | | | | | | | | | |
| Class A | | | | 1.26% | | | | | | |
| Actual | | | | | | $ 1,000 | | $ 1,164.10 | | $ 6.78 |
Hypothetical-B | | | | | | $ 1,000 | | $ 1,018.60 | | $ 6.32 |
| Class M | | | | 1.51% | | | | | | |
| Actual | | | | | | $ 1,000 | | $ 1,162.90 | | $ 8.12 |
Hypothetical-B | | | | | | $ 1,000 | | $ 1,017.35 | | $ 7.57 |
| Class C | | | | 1.99% | | | | | | |
| Actual | | | | | | $ 1,000 | | $ 1,160.10 | | $ 10.69 |
Hypothetical-B | | | | | | $ 1,000 | | $ 1,014.97 | | $ 9.97 |
| Class I | | | | .98% | | | | | | |
| Actual | | | | | | $ 1,000 | | $ 1,165.80 | | $ 5.28 |
Hypothetical-B | | | | | | $ 1,000 | | $ 1,019.99 | | $ 4.92 |
| Class Z | | | | .85% | | | | | | |
| Actual | | | | | | $ 1,000 | | $ 1,166.70 | | $ 4.58 |
Hypothetical-B | | | | | | $ 1,000 | | $ 1,020.64 | | $ 4.27 |
| |
A Annualized expense ratio reflects expenses net of applicable fee waivers.
B 5% return per year before expenses
C Expenses are equal to the annualized expense ratio, multiplied by the average account value over the period, multiplied by 182/ 366 (to reflect the one-half year period). The fees and expenses of any Underlying Funds are not included in each annualized expense ratio.
Board Approval of Investment Advisory Contracts
Fidelity Advisor Emerging Asia Fund
At its January 2024 meeting, the Board of Trustees, including the Independent Trustees (together, the Board), approved an amended and restated management contract with Fidelity Management & Research Company LLC (FMR) (the Management Contract), and amended and restated sub-advisory agreements (the Sub-Advisory Contracts, and together with the Management Contract, the Advisory Contracts) for the fund, including the fund's sub-advisory agreements with FMR Investment Management (UK) Limited (FMR UK), Fidelity Management & Research (Hong Kong) Limited (FMR H.K.), Fidelity Management & Research (Japan) Limited (FMR Japan), and FIL Investment Advisors (FIL). The Advisory Contracts will be effective March 1, 2024. The Board will consider the annual renewal of the fund's Advisory Contracts in May 2024, following its review of additional materials provided by FMR.
Management Contract. The Board approved the Management Contract, which implements a new fee structure combining the management fee, transfer agent fee (TA Fee), and pricing and bookkeeping fee (P&B Fee) of the fund and each class into a single class-level fee based on tiered schedules and subject to a maximum class-level rate (the Unified Fee). In exchange for the Unified Fee, the fund will receive investment advisory, management, administrative, transfer agent, pricing and bookkeeping services under a single agreement - the Management Contract.
In its consideration of the Management Contract over several meetings, the Board received, reviewed and discussed a comprehensive set of analyses regarding the Unified Fee including (i) the legal framework, (ii) design goals for the Unified Fee, (iii) calculation methodology for the Unified Fee and illustrative examples, (iv) annual and cumulative projected impacts under various scenarios, both in the aggregate and at the fund/class level, (v) explanations of schedules, rate levers and maximum rates and (vi) shareholder benefits and projected savings.
The Board considered that the maximum Unified Fee for each class of the fund would be no higher than the sum of (i) the lowest contractual management fee rate under the fund's existing management contract, which is the individual fund fee rate, if any, plus the lowest contractual marginal group fee rate and (ii) the TA and P&B Fee rates, which are fixed fee rates since December 1, 2023 (together, the Unified Fee Cap). The Board noted that Fidelity has represented that, as a result of this Unified Fee Cap, the Unified Fee would be no greater than the fee rates previously authorized to be charged to the fund for the same services. The Board noted that certain expenses such as third-party expenses, Rule 12b-1 fees, and certain other miscellaneous expenses would be outside the scope of the Unified Fee and the calculation of such fees would not change as a result of the Unified Fee. The Board considered that, under the Management Contract, a different management fee rate will be applicable to each class of the fund. The Board noted that Fidelity has represented that the difference in expenses between classes is based on differences in class-specific expenses and not due to any difference in advisory or third-party custodial fees or other expenses related to the management of the fund's assets.
The Board considered Fidelity's representations that implementation of the Unified Fee, which includes the Unified Fee Cap, would cause all funds subject to the Unified Fee, including the fund, to experience an immediate reduction on contractual fee rates for services provided under the current management contracts. The Board considered that some funds would not experience lower net total fees as a result of existing fee caps. The Board further considered that, in addition to the contractual fee savings, the Unified Fee offers funds and their shareholders greater protection from future rate increases for services previously offered under separate agreements that are now covered by the Management Contract because such rate increases would require shareholder approval.
Sub-Advisory Contracts. In connection with the Unified Fee changes, the Board considered the Sub-Advisory Contracts, which simplified the calculation of the fees paid by FMR to the sub-advisers under the agreements. The Board noted that the agreements with FMR UK, FMR H.K., and FMR Japan were amended to provide that FMR will compensate each sub-adviser at a fee rate equal to 110% of the sub-adviser's costs incurred in providing services under the agreement. The Board further noted that the agreement with FIL was amended to provide that FMR will compensate FIL at a flat fee rate of 0.50% of the net assets sub-advised by it. The Board considered that, under the Sub-Advisory Contracts, FMR, and not the fund, will continue to pay the sub-advisory fees to each applicable sub-adviser.
The Board further considered that the approval of the fund's Advisory Contracts will not result in any changes in the investment process or strategies employed in the management of the fund's assets or the day-to-day management of the fund or the persons primarily responsible for such management. Further, the Board considered that the Management Contract would not change the obligations and services of FMR and its affiliates on behalf of the fund, and, in particular, there would be no change in the nature and level of advisory, management, administration, transfer agent, and pricing and bookkeeping services provided to the fund by FMR, its affiliates, and each applicable sub-adviser.
In connection with its consideration of future renewals of the fund's Advisory Contracts, the Board will consider: (i) the nature, extent and quality of services provided to the funds, including shareholder and administrative services and investment performance; (ii) the competitiveness of the management fee and total expenses for the fund; (iii) the costs of the services and profitability, including the revenues earned and the expenses incurred in conducting the business of developing, marketing, distributing, managing, administering, and servicing the fund and its shareholders, to the extent applicable; and (iv) whether there have been economies of scale in respect of the Fidelity funds, whether the Fidelity funds (including the fund) have appropriately benefited from any such economies of scale, and whether there is the potential for realization of any further economies.
Based on its evaluation of all of the conclusions and representations noted above, and after considering all factors it believed relevant, the Board concluded that the fund's management fee structure is fair and reasonable, and that the fund's Advisory Contracts should be approved.
The Securities and Exchange Commission adopted Rule 22e-4 under the Investment Company Act of 1940 (the Liquidity Rule) to promote effective liquidity risk management throughout the open-end investment company industry, thereby reducing the risk that funds will be unable to meet their redemption obligations and mitigating dilution of the interests of fund shareholders.
The Fund has adopted and implemented a liquidity risk management program (the Program) reasonably designed to assess and manage the Fund's liquidity risk and to comply with the requirements of the Liquidity Rule. The Fund's Board of Trustees (the Board) has designated the Fund's investment adviser as administrator of the Program. The Fidelity advisers have established a Liquidity Risk Management Committee (the LRM Committee) to manage the Program for each of the Fidelity Funds. The LRM Committee monitors the adequacy and effectiveness of implementation of the Program and on a periodic basis assesses each Fund's liquidity risk based on a variety of factors including (1) the Fund's investment strategy, (2) portfolio liquidity and cash flow projections during normal and reasonably foreseeable stressed conditions, (3) shareholder redemptions, (4) borrowings and other funding sources and (5) certain factors specific to ETFs including the effect of the Fund's prices and spreads, market participants, and basket compositions on the overall liquidity of the Fund's portfolio, as applicable.
In accordance with the Program, each of the Fund's portfolio investments is classified into one of four defined liquidity categories based on a determination of a reasonable expectation for how long it would take to convert the investment to cash (or sell or dispose of the investment) without significantly changing its market value.
- Highly liquid investments - cash or convertible to cash within three business days or less
- Moderately liquid investments - convertible to cash in three to seven calendar days
- Less liquid investments - can be sold or disposed of, but not settled, within seven calendar days
- Illiquid investments - cannot be sold or disposed of within seven calendar days
Liquidity classification determinations take into account a variety of factors including various market, trading and investment-specific considerations, as well as market depth, and generally utilize analysis from a third-party liquidity metrics service.
The Liquidity Rule places a 15% limit on a fund's illiquid investments and requires funds that do not primarily hold assets that are highly liquid investments to determine and maintain a minimum percentage of the fund's net assets to be invested in highly liquid investments (highly liquid investment minimum or HLIM). The Program includes provisions reasonably designed to comply with the 15% limit on illiquid investments and for determining, periodically reviewing and complying with the HLIM requirement as applicable.
At a recent meeting of the Fund's Board of Trustees, the LRM Committee provided a written report to the Board pertaining to the operation, adequacy, and effectiveness of the Program for the period December 1, 2022 through November 30, 2023. The report concluded that the Program is operating effectively and is reasonably designed to assess and manage the Fund's liquidity risk.
1.703637.126
AEA-SANN-0624
Fidelity Advisor® Value Leaders Fund
Semi-Annual Report
April 30, 2024
Contents
To view a fund's proxy voting guidelines and proxy voting record for the 12-month period ended June 30, visit http://www.fidelity.com/proxyvotingresults or visit the Securities and Exchange Commission's (SEC) web site at http://www.sec.gov.
You may also call 1-877-208-0098 to request a free copy of the proxy voting guidelines.
Standard & Poor's, S&P and S&P 500 are registered service marks of The McGraw-Hill Companies, Inc. and have been licensed for use by Fidelity Distributors Corporation.
Other third-party marks appearing herein are the property of their respective owners.
All other marks appearing herein are registered or unregistered trademarks or service marks of FMR LLC or an affiliated company. © 2024 FMR LLC. All rights reserved.
This report and the financial statements contained herein are submitted for the general information of the shareholders of the Fund. This report is not authorized for distribution to prospective investors in the Fund unless preceded or accompanied by an effective prospectus.
A fund files its complete schedule of portfolio holdings with the SEC for the first and third quarters of each fiscal year on Form N-PORT. Forms N-PORT are available on the SEC's web site at http://www.sec.gov. A fund's Forms N-PORT may be reviewed and copied at the SEC's Public Reference Room in Washington, DC. Information regarding the operation of the SEC's Public Reference Room may be obtained by calling 1-800-SEC-0330.
For a complete list of a fund's portfolio holdings, view the most recent holdings listing, semiannual report, or annual report on Fidelity's web site at http://www.fidelity.com, http://www.institutional.fidelity.com, or http://www.401k.com, as applicable.
NOT FDIC INSURED •MAY LOSE VALUE •NO BANK GUARANTEE
Neither the Fund nor Fidelity Distributors Corporation is a bank.
Top Holdings (% of Fund's net assets) |
| |
| Cigna Group | 6.0 | |
| JPMorgan Chase & Co. | 5.7 | |
| UnitedHealth Group, Inc. | 4.6 | |
| Comcast Corp. Class A | 4.6 | |
| Exxon Mobil Corp. | 4.4 | |
| Centene Corp. | 4.3 | |
| Bank of America Corp. | 4.2 | |
| Shell PLC ADR | 4.2 | |
| H&R Block, Inc. | 4.1 | |
| The Walt Disney Co. | 3.6 | |
| | 45.7 | |
| |
| Market Sectors (% of Fund's net assets) |
| |
| Financials | 22.3 | |
| Health Care | 18.1 | |
| Energy | 12.3 | |
| Information Technology | 9.4 | |
| Consumer Staples | 9.0 | |
| Communication Services | 8.2 | |
| Utilities | 6.9 | |
| Industrials | 6.3 | |
| Consumer Discretionary | 4.1 | |
| Materials | 1.8 | |
| |
Asset Allocation (% of Fund's net assets) |
|
|
Geographic Diversification (% of Fund's net assets) |
|
* Includes Short-Term investments and Net Other Assets (Liabilities). Percentages are adjusted for the effect of derivatives, if applicable. |
| |
Showing Percentage of Net Assets
| Common Stocks - 94.9% |
| | | Shares | Value ($) |
| COMMUNICATION SERVICES - 8.2% | | | |
| Entertainment - 3.6% | | | |
| The Walt Disney Co. | | 11,105 | 1,233,766 |
| Media - 4.6% | | | |
| Comcast Corp. Class A | | 40,977 | 1,561,633 |
TOTAL COMMUNICATION SERVICES | | | 2,795,399 |
| CONSUMER DISCRETIONARY - 4.1% | | | |
| Diversified Consumer Services - 4.1% | | | |
| H&R Block, Inc. | | 29,506 | 1,393,568 |
| CONSUMER STAPLES - 9.0% | | | |
| Beverages - 1.7% | | | |
| Keurig Dr. Pepper, Inc. | | 17,100 | 576,270 |
| Food Products - 4.5% | | | |
| Lamb Weston Holdings, Inc. | | 4,800 | 400,032 |
| Mondelez International, Inc. | | 8,170 | 587,750 |
| Tyson Foods, Inc. Class A | | 9,160 | 555,554 |
| | | | 1,543,336 |
| Personal Care Products - 2.8% | | | |
| Kenvue, Inc. | | 50,597 | 952,236 |
TOTAL CONSUMER STAPLES | | | 3,071,842 |
| ENERGY - 12.3% | | | |
| Oil, Gas & Consumable Fuels - 12.3% | | | |
| Exxon Mobil Corp. | | 12,600 | 1,490,202 |
| Ovintiv, Inc. | | 7,933 | 407,122 |
| Parex Resources, Inc. | | 49,700 | 866,451 |
| Shell PLC ADR | | 20,074 | 1,438,503 |
| | | | 4,202,278 |
| FINANCIALS - 22.3% | | | |
| Banks - 16.4% | | | |
| Bank of America Corp. | | 39,255 | 1,452,828 |
| JPMorgan Chase & Co. | | 10,102 | 1,936,957 |
| PNC Financial Services Group, Inc. | | 4,403 | 674,804 |
| U.S. Bancorp | | 18,460 | 750,030 |
| Wells Fargo & Co. | | 13,261 | 786,643 |
| | | | 5,601,262 |
| Insurance - 5.9% | | | |
| Chubb Ltd. | | 4,113 | 1,022,656 |
| The Travelers Companies, Inc. | | 4,648 | 986,120 |
| | | | 2,008,776 |
TOTAL FINANCIALS | | | 7,610,038 |
| HEALTH CARE - 18.1% | | | |
| Health Care Providers & Services - 16.2% | | | |
| Centene Corp. (a) | | 20,052 | 1,464,999 |
| Cigna Group | | 5,737 | 2,048,336 |
| Elevance Health, Inc. | | 803 | 424,450 |
| UnitedHealth Group, Inc. | | 3,272 | 1,582,666 |
| | | | 5,520,451 |
| Pharmaceuticals - 1.9% | | | |
| AstraZeneca PLC sponsored ADR | | 8,629 | 654,769 |
TOTAL HEALTH CARE | | | 6,175,220 |
| INDUSTRIALS - 6.3% | | | |
| Air Freight & Logistics - 0.9% | | | |
| FedEx Corp. | | 1,200 | 314,136 |
| Electrical Equipment - 0.9% | | | |
| Regal Rexnord Corp. | | 2,000 | 322,740 |
| Industrial Conglomerates - 2.1% | | | |
| Siemens AG | | 3,737 | 700,066 |
| Machinery - 2.4% | | | |
| Deere & Co. | | 2,100 | 821,961 |
TOTAL INDUSTRIALS | | | 2,158,903 |
| INFORMATION TECHNOLOGY - 5.9% | | | |
| IT Services - 3.1% | | | |
| Amdocs Ltd. | | 12,394 | 1,040,972 |
| Software - 2.8% | | | |
| Gen Digital, Inc. | | 47,819 | 963,075 |
TOTAL INFORMATION TECHNOLOGY | | | 2,004,047 |
| MATERIALS - 1.8% | | | |
| Chemicals - 1.8% | | | |
| CF Industries Holdings, Inc. | | 4,000 | 315,880 |
| Nutrien Ltd. | | 6,000 | 316,620 |
| | | | 632,500 |
| UTILITIES - 6.9% | | | |
| Electric Utilities - 5.3% | | | |
| Edison International | | 10,100 | 717,706 |
| PG&E Corp. | | 64,940 | 1,111,123 |
| | | | 1,828,829 |
| Independent Power and Renewable Electricity Producers - 1.6% | | | |
| The AES Corp. | | 30,057 | 538,020 |
TOTAL UTILITIES | | | 2,366,849 |
| TOTAL COMMON STOCKS (Cost $26,378,824) | | | 32,410,644 |
| | | | |
| Nonconvertible Preferred Stocks - 3.5% |
| | | Shares | Value ($) |
| INFORMATION TECHNOLOGY - 3.5% | | | |
| Technology Hardware, Storage & Peripherals - 3.5% | | | |
Samsung Electronics Co. Ltd. (Cost $1,040,499) | | 25,791 | 1,200,840 |
| | | | |
| Money Market Funds - 1.7% |
| | | Shares | Value ($) |
Fidelity Cash Central Fund 5.39% (b) (Cost $559,677) | | 559,565 | 559,677 |
| | | | |
| TOTAL INVESTMENT IN SECURITIES - 100.1% (Cost $27,979,000) | 34,171,161 |
NET OTHER ASSETS (LIABILITIES) - (0.1)% | (18,497) |
| NET ASSETS - 100.0% | 34,152,664 |
| | |
Legend
| (b) | Affiliated fund that is generally available only to investment companies and other accounts managed by Fidelity Investments. The rate quoted is the annualized seven-day yield of the fund at period end. A complete unaudited listing of the fund's holdings as of its most recent quarter end is available upon request. In addition, each Fidelity Central Fund's financial statements are available on the SEC's website or upon request. |
Affiliated Central Funds
Fiscal year to date information regarding the Fund's investments in Fidelity Central Funds, including the ownership percentage, is presented below.
| Affiliate | Value, beginning of period ($) | Purchases ($) | Sales Proceeds ($) | Dividend Income ($) | Realized Gain (loss) ($) | Change in Unrealized appreciation (depreciation) ($) | Value, end of period ($) | % ownership, end of period |
| Fidelity Cash Central Fund 5.39% | 604,938 | 4,625,128 | 4,670,422 | 21,917 | 33 | - | 559,677 | 0.0% |
| Total | 604,938 | 4,625,128 | 4,670,422 | 21,917 | 33 | - | 559,677 | |
| | | | | | | | | |
Amounts in the dividend income column in the above table include any capital gain distributions from underlying funds, which are presented in the corresponding line item in the Statement of Operations, if applicable.
Amounts included in the purchases and sales proceeds columns may include in-kind transactions, if applicable.
Investment Valuation
The following is a summary of the inputs used, as of April 30, 2024, involving the Fund's assets and liabilities carried at fair value. The inputs or methodology used for valuing securities may not be an indication of the risk associated with investing in those securities. For more information on valuation inputs, and their aggregation into the levels used below, please refer to the Investment Valuation section in the accompanying Notes to Financial Statements.
| Valuation Inputs at Reporting Date: |
| Description | Total ($) | Level 1 ($) | Level 2 ($) | Level 3 ($) |
Investments in Securities: | | | | |
|
| Equities: | | | | |
Communication Services | 2,795,399 | 2,795,399 | - | - |
Consumer Discretionary | 1,393,568 | 1,393,568 | - | - |
Consumer Staples | 3,071,842 | 3,071,842 | - | - |
Energy | 4,202,278 | 4,202,278 | - | - |
Financials | 7,610,038 | 7,610,038 | - | - |
Health Care | 6,175,220 | 6,175,220 | - | - |
Industrials | 2,158,903 | 1,458,837 | 700,066 | - |
Information Technology | 3,204,887 | 2,004,047 | 1,200,840 | - |
Materials | 632,500 | 632,500 | - | - |
Utilities | 2,366,849 | 2,366,849 | - | - |
|
| Money Market Funds | 559,677 | 559,677 | - | - |
| Total Investments in Securities: | 34,171,161 | 32,270,255 | 1,900,906 | - |
| Statement of Assets and Liabilities |
| | | | April 30, 2024 (Unaudited) |
| | | | | |
| Assets | | | | |
| Investment in securities, at value - See accompanying schedule: | | | | |
Unaffiliated issuers (cost $27,419,323) | $ | 33,611,484 | | |
Fidelity Central Funds (cost $559,677) | | 559,677 | | |
| | | | | |
| | | | | |
| Total Investment in Securities (cost $27,979,000) | | | $ | 34,171,161 |
| Receivable for fund shares sold | | | | 6,151 |
| Dividends receivable | | | | 37,552 |
| Distributions receivable from Fidelity Central Funds | | | | 1,904 |
| Prepaid expenses | | | | 12 |
| Receivable from investment adviser for expense reductions | | | | 17,927 |
Total assets | | | | 34,234,707 |
| Liabilities | | | | |
| Payable for fund shares redeemed | $ | 22,580 | | |
| Accrued management fee | | 23,594 | | |
| Distribution and service plan fees payable | | 8,667 | | |
| Audit fee payable | | 25,208 | | |
| Other payables and accrued expenses | | 1,994 | | |
| Total liabilities | | | | 82,043 |
| Net Assets | | | $ | 34,152,664 |
| Net Assets consist of: | | | | |
| Paid in capital | | | $ | 25,746,017 |
| Total accumulated earnings (loss) | | | | 8,406,647 |
| Net Assets | | | $ | 34,152,664 |
| | | | | |
| Net Asset Value and Maximum Offering Price | | | | |
| Class A : | | | | |
Net Asset Value and redemption price per share ($20,427,878 ÷ 924,381 shares)(a) | | | $ | 22.10 |
| Maximum offering price per share (100/94.25 of $22.10) | | | $ | 23.45 |
| Class M : | | | | |
Net Asset Value and redemption price per share ($5,664,316 ÷ 254,917 shares)(a) | | | $ | 22.22 |
| Maximum offering price per share (100/96.50 of $22.22) | | | $ | 23.03 |
| Class C : | | | | |
Net Asset Value and offering price per share ($2,457,341 ÷ 114,924 shares)(a) | | | $ | 21.38 |
| Class I : | | | | |
Net Asset Value, offering price and redemption price per share ($5,603,129 ÷ 251,878 shares) | | | $ | 22.25 |
(a)Redemption price per share is equal to net asset value less any applicable contingent deferred sales charge. |
| Statement of Operations |
| | | | Six months ended April 30, 2024 (Unaudited) |
| Investment Income | | | | |
| Dividends | | | $ | 372,946 |
| Income from Fidelity Central Funds | | | | 21,917 |
| Total income | | | | 394,863 |
| Expenses | | | | |
| Management fee | | | | |
| Basic fee | $ | 98,081 | | |
| Performance adjustment | | 22,196 | | |
| Transfer agent fees | | 21,178 | | |
| Distribution and service plan fees | | 51,356 | | |
| Accounting fees and expenses | | 3,916 | | |
| Custodian fees and expenses | | 1,825 | | |
| Independent trustees' fees and expenses | | 85 | | |
| Registration fees | | 32,668 | | |
| Audit | | 23,573 | | |
| Legal | | 1,033 | | |
| Miscellaneous | | 66 | | |
| Total expenses before reductions | | 255,977 | | |
| Expense reductions | | (55,498) | | |
| Total expenses after reductions | | | | 200,479 |
| Net Investment income (loss) | | | | 194,384 |
| Realized and Unrealized Gain (Loss) | | | | |
| Net realized gain (loss) on: | | | | |
| Investment Securities: | | | | |
| Unaffiliated issuers | | 2,221,567 | | |
| Fidelity Central Funds | | 33 | | |
| Foreign currency transactions | | (152) | | |
| Total net realized gain (loss) | | | | 2,221,448 |
| Change in net unrealized appreciation (depreciation) on: | | | | |
| Investment Securities: | | | | |
| Unaffiliated issuers | | 1,752,247 | | |
| Assets and liabilities in foreign currencies | | (681) | | |
| Total change in net unrealized appreciation (depreciation) | | | | 1,751,566 |
| Net gain (loss) | | | | 3,973,014 |
| Net increase (decrease) in net assets resulting from operations | | | $ | 4,167,398 |
| Statement of Changes in Net Assets |
| |
| | Six months ended April 30, 2024 (Unaudited) | | Year ended October 31, 2023 |
| Increase (Decrease) in Net Assets | | | | |
| Operations | | | | |
| Net investment income (loss) | $ | 194,384 | $ | 397,037 |
| Net realized gain (loss) | | 2,221,448 | | 1,233,023 |
| Change in net unrealized appreciation (depreciation) | | 1,751,566 | | (1,681,317) |
| Net increase (decrease) in net assets resulting from operations | | 4,167,398 | | (51,257) |
| Distributions to shareholders | | (1,690,795) | | (767,694) |
| | | | | |
| Share transactions - net increase (decrease) | | (49,499) | | (6,072,225) |
| Total increase (decrease) in net assets | | 2,427,104 | | (6,891,176) |
| | | | | |
| Net Assets | | | | |
| Beginning of period | | 31,725,560 | | 38,616,736 |
| End of period | $ | 34,152,664 | $ | 31,725,560 |
| | | | | |
| | | | | |
Financial Highlights
Fidelity Advisor® Value Leaders Fund Class A |
| |
| | Six months ended (Unaudited) April 30, 2024 | | Years ended October 31, 2023 | | 2022 | | 2021 | | 2020 | | 2019 |
Selected Per-Share Data | | | | | | | | | | | | |
| Net asset value, beginning of period | $ | 20.54 | $ | 20.97 | $ | 22.22 | $ | 15.67 | $ | 18.62 | $ | 19.31 |
| Income from Investment Operations | | | | | | | | | | | | |
Net investment income (loss) A,B | | .13 | | .23 | | .17 | | .17 | | .15 | | .20 |
| Net realized and unrealized gain (loss) | | 2.56 | | (.26) | | .18 | | 6.49 | | (2.81) | | .58 C |
| Total from investment operations | | 2.69 | | (.03) | | .35 | | 6.66 | | (2.66) | | .78 |
| Distributions from net investment income | | (.29) | | (.13) | | (.15) | | (.11) | | (.20) | | (.19) |
| Distributions from net realized gain | | (.84) | | (.27) | | (1.45) | | - | | (.09) | | (1.28) |
| Total distributions | | (1.13) | | (.40) | | (1.60) | | (.11) | | (.29) | | (1.47) |
| Net asset value, end of period | $ | 22.10 | $ | 20.54 | $ | 20.97 | $ | 22.22 | $ | 15.67 | $ | 18.62 |
Total Return D,E,F | | | | (.21)% | | 1.92% | | 42.68% | | (14.57)% | | 4.64% C |
Ratios to Average Net Assets B,G,H | | | | | | | | | | | | |
| Expenses before reductions | | 1.48% I | | 1.41% | | 1.29% | | 1.27% | | 1.35% | | 1.29% |
| Expenses net of fee waivers, if any | | | | 1.14% | | 1.15% | | 1.15% | | 1.25% | | 1.25% |
| Expenses net of all reductions | | 1.14% I | | 1.14% | | 1.15% | | 1.15% | | 1.24% | | 1.25% |
| Net investment income (loss) | | 1.21% I | | 1.11% | | .83% | | .83% | | .91% | | 1.12% |
| Supplemental Data | | | | | | | | | | | | |
| Net assets, end of period (000 omitted) | $ | 20,428 | $ | 18,484 | $ | 20,328 | $ | 16,513 | $ | 10,954 | $ | 16,648 |
Portfolio turnover rate J | | | | 40% | | 39% | | 51% | | 144% | | 37% |
ACalculated based on average shares outstanding during the period.
BNet investment income (loss) is affected by the timing of the declaration of dividends by any underlying mutual funds or exchange-traded funds (ETFs). Net investment income (loss) of any mutual funds or ETFs is not included in the Fund's net investment income (loss) ratio.
CNet realized and unrealized gain (loss) per share reflects proceeds received from litigation which amounted to $.03 per share. Excluding these litigation proceeds, the total return would have been 4.45%.
DTotal returns for periods of less than one year are not annualized.
ETotal returns would have been lower if certain expenses had not been reduced during the applicable periods shown.
FTotal returns do not include the effect of the sales charges.
GFees and expenses of any underlying mutual funds or exchange-traded funds (ETFs) are not included in the Fund's expense ratio. The Fund indirectly bears its proportionate share of these expenses. For additional expense information related to investments in Fidelity Central Funds, please refer to the "Investments in Fidelity Central Funds" note found in the Notes to Financial Statements section of the most recent Annual or Semi-Annual report.
HExpense ratios reflect operating expenses of the class. Expenses before reductions do not reflect amounts reimbursed, waived, or reduced through arrangements with the investment adviser, brokerage services, or other offset arrangements, if applicable, and do not represent the amount paid by the class during periods when reimbursements, waivers or reductions occur.
IAnnualized.
JAmount does not include the portfolio activity of any underlying mutual funds or exchange-traded funds (ETFs).
Fidelity Advisor® Value Leaders Fund Class M |
| |
| | Six months ended (Unaudited) April 30, 2024 | | Years ended October 31, 2023 | | 2022 | | 2021 | | 2020 | | 2019 |
Selected Per-Share Data | | | | | | | | | | | | |
| Net asset value, beginning of period | $ | 20.62 | $ | 21.05 | $ | 22.30 | $ | 15.72 | $ | 18.68 | $ | 19.34 |
| Income from Investment Operations | | | | | | | | | | | | |
Net investment income (loss) A,B | | .11 | | .18 | | .12 | | .12 | | .11 | | .16 |
| Net realized and unrealized gain (loss) | | 2.56 | | (.26) | | .17 | | 6.52 | | (2.83) | | .59 C |
| Total from investment operations | | 2.67 | | (.08) | | .29 | | 6.64 | | (2.72) | | .75 |
| Distributions from net investment income | | (.23) | | (.08) | | (.09) | | (.06) | | (.15) | | (.13) |
| Distributions from net realized gain | | (.84) | | (.27) | | (1.45) | | - | | (.09) | | (1.28) |
| Total distributions | | (1.07) | | (.35) | | (1.54) | | (.06) | | (.24) | | (1.41) |
| Net asset value, end of period | $ | 22.22 | $ | 20.62 | $ | 21.05 | $ | 22.30 | $ | 15.72 | $ | 18.68 |
Total Return D,E,F | | | | (.43)% | | 1.63% | | 42.32% | | (14.79)% | | 4.42% C |
Ratios to Average Net Assets B,G,H | | | | | | | | | | | | |
| Expenses before reductions | | 1.72% I | | 1.65% | | 1.55% | | 1.54% | | 1.64% | | 1.58% |
| Expenses net of fee waivers, if any | | | | 1.40% | | 1.40% | | 1.41% | | 1.50% | | 1.50% |
| Expenses net of all reductions | | 1.39% I | | 1.39% | | 1.40% | | 1.41% | | 1.49% | | 1.50% |
| Net investment income (loss) | | .97% I | | .86% | | .57% | | .57% | | .66% | | .87% |
| Supplemental Data | | | | | | | | | | | | |
| Net assets, end of period (000 omitted) | $ | 5,664 | $ | 5,376 | $ | 5,569 | $ | 5,275 | $ | 3,821 | $ | 5,146 |
Portfolio turnover rate J | | | | 40% | | 39% | | 51% | | 144% | | 37% |
ACalculated based on average shares outstanding during the period.
BNet investment income (loss) is affected by the timing of the declaration of dividends by any underlying mutual funds or exchange-traded funds (ETFs). Net investment income (loss) of any mutual funds or ETFs is not included in the Fund's net investment income (loss) ratio.
CNet realized and unrealized gain (loss) per share reflects proceeds received from litigation which amounted to $.03 per share. Excluding these litigation proceeds, the total return would have been 4.23%.
DTotal returns for periods of less than one year are not annualized.
ETotal returns would have been lower if certain expenses had not been reduced during the applicable periods shown.
FTotal returns do not include the effect of the sales charges.
GFees and expenses of any underlying mutual funds or exchange-traded funds (ETFs) are not included in the Fund's expense ratio. The Fund indirectly bears its proportionate share of these expenses. For additional expense information related to investments in Fidelity Central Funds, please refer to the "Investments in Fidelity Central Funds" note found in the Notes to Financial Statements section of the most recent Annual or Semi-Annual report.
HExpense ratios reflect operating expenses of the class. Expenses before reductions do not reflect amounts reimbursed, waived, or reduced through arrangements with the investment adviser, brokerage services, or other offset arrangements, if applicable, and do not represent the amount paid by the class during periods when reimbursements, waivers or reductions occur.
IAnnualized.
JAmount does not include the portfolio activity of any underlying mutual funds or exchange-traded funds (ETFs).
Fidelity Advisor® Value Leaders Fund Class C |
| |
| | Six months ended (Unaudited) April 30, 2024 | | Years ended October 31, 2023 | | 2022 | | 2021 | | 2020 | | 2019 |
Selected Per-Share Data | | | | | | | | | | | | |
| Net asset value, beginning of period | $ | 19.81 | $ | 20.29 | $ | 21.49 | $ | 15.18 | $ | 17.99 | $ | 18.67 |
| Income from Investment Operations | | | | | | | | | | | | |
Net investment income (loss) A,B | | .05 | | .07 | | .02 | | .01 | | .03 | | .06 |
| Net realized and unrealized gain (loss) | | 2.47 | | (.26) | | .18 | | 6.30 | | (2.75) | | .58 C |
| Total from investment operations | | 2.52 | | (.19) | | .20 | | 6.31 | | (2.72) | | .64 |
| Distributions from net investment income | | (.12) | | (.02) | | - | | - | | - | | (.04) |
| Distributions from net realized gain | | (.84) | | (.27) | | (1.40) | | - | | (.09) | | (1.28) |
| Total distributions | | (.95) D | | (.29) | | (1.40) | | - | | (.09) | | (1.32) |
| Net asset value, end of period | $ | 21.38 | $ | 19.81 | $ | 20.29 | $ | 21.49 | $ | 15.18 | $ | 17.99 |
Total Return E,F,G | | | | (.99)% | | 1.19% | | 41.57% | | (15.22)% | | 3.90% C |
Ratios to Average Net Assets B,H,I | | | | | | | | | | | | |
| Expenses before reductions | | 2.23% J | | 2.21% | | 2.10% | | 2.09% | | 2.18% | | 2.13% |
| Expenses net of fee waivers, if any | | | | 1.90% | | 1.90% | | 1.93% | | 2.00% | | 2.00% |
| Expenses net of all reductions | | 1.88% J | | 1.90% | | 1.89% | | 1.93% | | 1.99% | | 2.00% |
| Net investment income (loss) | | .48% J | | .36% | | .08% | | .05% | | .16% | | .37% |
| Supplemental Data | | | | | | | | | | | | |
| Net assets, end of period (000 omitted) | $ | 2,457 | $ | 2,469 | $ | 2,847 | $ | 1,875 | $ | 1,763 | $ | 2,733 |
Portfolio turnover rate K | | | | 40% | | 39% | | 51% | | 144% | | 37% |
ACalculated based on average shares outstanding during the period.
BNet investment income (loss) is affected by the timing of the declaration of dividends by any underlying mutual funds or exchange-traded funds (ETFs). Net investment income (loss) of any mutual funds or ETFs is not included in the Fund's net investment income (loss) ratio.
CNet realized and unrealized gain (loss) per share reflects proceeds received from litigation which amounted to $.03 per share. Excluding these litigation proceeds, the total return would have been 3.71%.
DTotal distributions per share do not sum due to rounding.
ETotal returns for periods of less than one year are not annualized.
FTotal returns would have been lower if certain expenses had not been reduced during the applicable periods shown.
GTotal returns do not include the effect of the contingent deferred sales charge.
HFees and expenses of any underlying mutual funds or exchange-traded funds (ETFs) are not included in the Fund's expense ratio. The Fund indirectly bears its proportionate share of these expenses. For additional expense information related to investments in Fidelity Central Funds, please refer to the "Investments in Fidelity Central Funds" note found in the Notes to Financial Statements section of the most recent Annual or Semi-Annual report.
IExpense ratios reflect operating expenses of the class. Expenses before reductions do not reflect amounts reimbursed, waived, or reduced through arrangements with the investment adviser, brokerage services, or other offset arrangements, if applicable, and do not represent the amount paid by the class during periods when reimbursements, waivers or reductions occur.
JAnnualized.
KAmount does not include the portfolio activity of any underlying mutual funds or exchange-traded funds (ETFs).
Fidelity Advisor® Value Leaders Fund Class I |
| |
| | Six months ended (Unaudited) April 30, 2024 | | Years ended October 31, 2023 | | 2022 | | 2021 | | 2020 | | 2019 |
Selected Per-Share Data | | | | | | | | | | | | |
| Net asset value, beginning of period | $ | 20.70 | $ | 21.12 | $ | 22.39 | $ | 15.80 | $ | 18.78 | $ | 19.47 |
| Income from Investment Operations | | | | | | | | | | | | |
Net investment income (loss) A,B | | .16 | | .29 | | .22 | | .23 | | .20 | | .25 |
| Net realized and unrealized gain (loss) | | 2.57 | | (.27) | | .18 | | 6.54 | | (2.82) | | .59 C |
| Total from investment operations | | 2.73 | | .02 | | .40 | | 6.77 | | (2.62) | | .84 |
| Distributions from net investment income | | (.35) | | (.17) | | (.22) | | (.18) | | (.27) | | (.26) |
| Distributions from net realized gain | | (.84) | | (.27) | | (1.45) | | - | | (.09) | | (1.28) |
| Total distributions | | (1.18) D | | (.44) | | (1.67) | | (.18) | | (.36) | | (1.53) |
| Net asset value, end of period | $ | 22.25 | $ | 20.70 | $ | 21.12 | $ | 22.39 | $ | 15.80 | $ | 18.78 |
Total Return E,F | | | | .05% | | 2.16% | | 43.08% | | (14.31)% | | 4.96% C |
Ratios to Average Net Assets B,G,H | | | | | | | | | | | | |
| Expenses before reductions | | 1.17% I | | 1.08% | | .94% | | .94% | | .99% | | .97% |
| Expenses net of fee waivers, if any | | | | .90% | | .89% | | .87% | | .99% | | .97% |
| Expenses net of all reductions | | .89% I | | .90% | | .89% | | .87% | | .98% | | .96% |
| Net investment income (loss) | | 1.47% I | | 1.36% | | 1.08% | | 1.11% | | 1.17% | | 1.41% |
| Supplemental Data | | | | | | | | | | | | |
| Net assets, end of period (000 omitted) | $ | 5,603 | $ | 5,397 | $ | 9,872 | $ | 3,041 | $ | 1,898 | $ | 2,342 |
Portfolio turnover rate J | | | | 40% | | 39% | | 51% | | 144% | | 37% |
ACalculated based on average shares outstanding during the period.
BNet investment income (loss) is affected by the timing of the declaration of dividends by any underlying mutual funds or exchange-traded funds (ETFs). Net investment income (loss) of any mutual funds or ETFs is not included in the Fund's net investment income (loss) ratio.
CNet realized and unrealized gain (loss) per share reflects proceeds received from litigation which amounted to $.03 per share. Excluding these litigation proceeds, the total return would have been 4.77%.
DTotal distributions per share do not sum due to rounding.
ETotal returns for periods of less than one year are not annualized.
FTotal returns would have been lower if certain expenses had not been reduced during the applicable periods shown.
GFees and expenses of any underlying mutual funds or exchange-traded funds (ETFs) are not included in the Fund's expense ratio. The Fund indirectly bears its proportionate share of these expenses. For additional expense information related to investments in Fidelity Central Funds, please refer to the "Investments in Fidelity Central Funds" note found in the Notes to Financial Statements section of the most recent Annual or Semi-Annual report.
HExpense ratios reflect operating expenses of the class. Expenses before reductions do not reflect amounts reimbursed, waived, or reduced through arrangements with the investment adviser, brokerage services, or other offset arrangements, if applicable, and do not represent the amount paid by the class during periods when reimbursements, waivers or reductions occur.
IAnnualized.
JAmount does not include the portfolio activity of any underlying mutual funds or exchange-traded funds (ETFs).
For the period ended April 30, 2024
1. Organization.
Fidelity Advisor Value Leaders Fund (the Fund) is a fund of Fidelity Advisor Series VIII (the Trust) and is authorized to issue an unlimited number of shares. The Trust is registered under the Investment Company Act of 1940, as amended (the 1940 Act), as an open-end management investment company organized as a Massachusetts business trust. The Fund offers Class A, Class M, Class C, and Class I shares, each of which has equal rights as to assets and voting privileges. Class A, Class M, Class C and Class I are Fidelity Advisor classes. Each class has exclusive voting rights with respect to matters that affect that class. Class C shares will automatically convert to Class A shares after a holding period of eight years from the initial date of purchase, with certain exceptions.
2. Investments in Fidelity Central Funds.
Funds may invest in Fidelity Central Funds, which are open-end investment companies generally available only to other investment companies and accounts managed by the investment adviser and its affiliates. The Schedule of Investments lists any Fidelity Central Funds held as an investment as of period end, but does not include the underlying holdings of each Fidelity Central Fund. An investing fund indirectly bears its proportionate share of the expenses of the underlying Fidelity Central Funds.
Based on its investment objective, each Fidelity Central Fund may invest or participate in various investment vehicles or strategies that are similar to those of the investing fund. These strategies are consistent with the investment objectives of the investing fund and may involve certain economic risks which may cause a decline in value of each of the Fidelity Central Funds and thus a decline in the value of the investing fund.
| Fidelity Central Fund | Investment Manager | Investment Objective | Investment Practices | Expense RatioA |
| Fidelity Money Market Central Funds | Fidelity Management & Research Company LLC (FMR) | Each fund seeks to obtain a high level of current income consistent with the preservation of capital and liquidity. | Short-term Investments | Less than .005% |
A Expenses expressed as a percentage of average net assets and are as of each underlying Central Fund's most recent annual or semi-annual shareholder report.
A complete unaudited list of holdings for each Fidelity Central Fund is available upon request or at the Securities and Exchange Commission website at www.sec.gov. In addition, the financial statements of the Fidelity Central Funds which contain the significant accounting policies (including investment valuation policies) of those funds, and are not covered by the Report of Independent Registered Public Accounting Firm, are available on the Securities and Exchange Commission website or upon request.
3. Significant Accounting Policies.
The Fund is an investment company and applies the accounting and reporting guidance of the Financial Accounting Standards Board (FASB) Accounting Standards Codification Topic 946 Financial Services - Investment Companies. The financial statements have been prepared in conformity with accounting principles generally accepted in the United States of America (GAAP), which require management to make certain estimates and assumptions at the date of the financial statements. Actual results could differ from those estimates. Subsequent events, if any, through the date that the financial statements were issued have been evaluated in the preparation of the financial statements. The Fund's Schedule of Investments lists any underlying mutual funds or exchange-traded funds (ETFs) but does not include the underlying holdings of these funds. The following summarizes the significant accounting policies of the Fund:
Investment Valuation. Investments are valued as of 4:00 p.m. Eastern time on the last calendar day of the period. The Board of Trustees (the Board) has designated the Fund's investment adviser as the valuation designee responsible for the fair valuation function and performing fair value determinations as needed. The investment adviser has established a Fair Value Committee (the Committee) to carry out the day-to-day fair valuation responsibilities and has adopted policies and procedures to govern the fair valuation process and the activities of the Committee. In accordance with these fair valuation policies and procedures, which have been approved by the Board, the Fund attempts to obtain prices from one or more third party pricing services or brokers to value its investments. When current market prices, quotations or currency exchange rates are not readily available or reliable, investments will be fair valued in good faith by the Committee, in accordance with the policies and procedures. Factors used in determining fair value vary by investment type and may include market or investment specific events, transaction data, estimated cash flows, and market observations of comparable investments. The frequency that the fair valuation procedures are used cannot be predicted and they may be utilized to a significant extent. The Committee manages the Fund's fair valuation practices and maintains the fair valuation policies and procedures. The Fund's investment adviser reports to the Board information regarding the fair valuation process and related material matters.
The Fund categorizes the inputs to valuation techniques used to value its investments into a disclosure hierarchy consisting of three levels as shown below:
Level 1 - unadjusted quoted prices in active markets for identical investments
Level 2 - other significant observable inputs (including quoted prices for similar investments, interest rates, prepayment speeds, etc.)
Level 3 - unobservable inputs (including the Fund's own assumptions based on the best information available)
Valuation techniques used to value the Fund's investments by major category are as follows:
Equity securities, including restricted securities, for which market quotations are readily available, are valued at the last reported sale price or official closing price as reported by a third party pricing service on the primary market or exchange on which they are traded and are categorized as Level 1 in the hierarchy. In the event there were no sales during the day or closing prices are not available, securities are valued at the last quoted bid price or may be valued using the last available price and are generally categorized as Level 2 in the hierarchy. For foreign equity securities, when market or security specific events arise, comparisons to the valuation of American Depositary Receipts (ADRs), futures contracts, ETFs and certain indexes as well as quoted prices for similar securities may be used and would be categorized as Level 2 in the hierarchy. For equity securities, including restricted securities, where observable inputs are limited, assumptions about market activity and risk are used and these securities may be categorized as Level 3 in the hierarchy.
Investments in open-end mutual funds, including the Fidelity Central Funds, are valued at their closing net asset value (NAV) each business day and are categorized as Level 1 in the hierarchy.
Changes in valuation techniques may result in transfers in or out of an assigned level within the disclosure hierarchy. The aggregate value of investments by input level as of April 30, 2024 is included at the end of the Fund's Schedule of Investments.
Foreign Currency. Certain Funds may use foreign currency contracts to facilitate transactions in foreign-denominated securities. Gains and losses from these transactions may arise from changes in the value of the foreign currency or if the counterparties do not perform under the contracts' terms.
Foreign-denominated assets, including investment securities, and liabilities are translated into U.S. dollars at the exchange rates at period end. Purchases and sales of investment securities, income and dividends received, and expenses denominated in foreign currencies are translated into U.S. dollars at the exchange rate in effect on the transaction date.
The effects of exchange rate fluctuations on investments are included with the net realized and unrealized gain (loss) on investment securities. Other foreign currency transactions resulting in realized and unrealized gain (loss) are disclosed separately.
Investment Transactions and Income. For financial reporting purposes, the Fund's investment holdings and NAV include trades executed through the end of the last business day of the period. The NAV per share for processing shareholder transactions is calculated as of the close of business of the New York Stock Exchange (NYSE), normally 4:00 p.m. Eastern time and includes trades executed through the end of the prior business day. Gains and losses on securities sold are determined on the basis of identified cost and include proceeds received from litigation. Commissions paid to certain brokers with whom the investment adviser, or its affiliates, places trades on behalf of a fund include an amount in addition to trade execution, which may be rebated back to a fund. Any such rebates are included in net realized gain (loss) on investments in the Statement of Operations. Dividend income is recorded on the ex-dividend date, except for certain dividends from foreign securities where the ex-dividend date may have passed, which are recorded as soon as the Fund is informed of the ex-dividend date. Non-cash dividends included in dividend income, if any, are recorded at the fair market value of the securities received. Income and capital gain distributions from Fidelity Central Funds, if any, are recorded on the ex-dividend date. Investment income is recorded net of foreign taxes withheld where recovery of such taxes is uncertain. Funds may file withholding tax reclaims in certain jurisdictions to recover a portion of amounts previously withheld. Any withholding tax reclaims income is included in the Statement of Operations in dividends. Any receivables for withholding tax reclaims are included in the Statement of Assets and Liabilities in dividends receivable.
Class Allocations and Expenses. Investment income, realized and unrealized capital gains and losses, common expenses of a fund, and certain fund-level expense reductions, if any, are allocated daily on a pro-rata basis to each class based on the relative net assets of each class to the total net assets of a fund. Each class differs with respect to transfer agent and distribution and service plan fees incurred, as applicable. Certain expense reductions may also differ by class, if applicable. For the reporting period, the allocated portion of income and expenses to each class as a percent of its average net assets may vary due to the timing of recording these transactions in relation to fluctuating net assets of the classes. Expenses directly attributable to a fund are charged to that fund. Expenses attributable to more than one fund are allocated among the respective funds on the basis of relative net assets or other appropriate methods. Expenses included in the accompanying financial statements reflect the expenses of that fund and do not include any expenses associated with any underlying mutual funds or exchange-traded funds (ETFs). Although not included in a fund's expenses, a fund indirectly bears its proportionate share of these expenses through the net asset value of each underlying mutual fund or exchange-traded fund (ETF). Expense estimates are accrued in the period to which they relate and adjustments are made when actual amounts are known.
Income Tax Information and Distributions to Shareholders. Each year, the Fund intends to qualify as a regulated investment company under Subchapter M of the Internal Revenue Code, including distributing substantially all of its taxable income and realized gains. As a result, no provision for U.S. Federal income taxes is required. The Fund files a U.S. federal tax return, in addition to state and local tax returns as required. The Fund's federal income tax returns are subject to examination by the Internal Revenue Service (IRS) for a period of three fiscal years after they are filed. State and local tax returns may be subject to examination for an additional fiscal year depending on the jurisdiction. Foreign taxes are provided for based on the Fund's understanding of the tax rules and rates that exist in the foreign markets in which it invests.
Distributions are declared and recorded on the ex-dividend date. Income and capital gain distributions are declared separately for each class. Income and capital gain distributions are determined in accordance with income tax regulations, which may differ from GAAP.
Capital accounts within the financial statements are adjusted for permanent book-tax differences. These adjustments have no impact on net assets or the results of operations. Capital accounts are not adjusted for temporary book-tax differences which will reverse in a subsequent period.
Book-tax differences are primarily due to foreign currency transactions and losses deferred due to wash sales.
As of period end, the cost and unrealized appreciation (depreciation) in securities, and derivatives if applicable, for federal income tax purposes were as follows:
| Gross unrealized appreciation | $6,901,879 |
| Gross unrealized depreciation | (811,022) |
| Net unrealized appreciation (depreciation) | $6,090,857 |
| Tax cost | $28,080,304 |
4. Purchases and Sales of Investments.
Purchases and sales of securities, other than short-term securities and in-kind transactions, as applicable, are noted in the table below.
| | Purchases ($) | Sales ($) |
| Fidelity Advisor Value Leaders Fund | 7,343,955 | 8,577,473 |
5. Fees and Other Transactions with Affiliates.
Management Fee. Fidelity Management & Research Company LLC (the investment adviser) and its affiliates provide the Fund with investment management related services for which the Fund pays a monthly management fee.
Effective March 1, 2024, the Fund's management contract was amended to incorporate administrative services previously covered under separate services agreements (Transfer Agent and Accounting agreements). The amended contract incorporates a basic fee rate that may vary by class (subject to a performance adjustment). The investment adviser or an affiliate pays certain expenses of managing and operating the Fund out of each class's management fee. Each class of the Fund pays a management fee to the investment adviser. The management fee is calculated and paid to the investment adviser every month. The management fee is determined by calculating a basic fee and then applying a performance adjustment. When determining a class's basic fee, a mandate rate is calculated based on the monthly average net assets of a group of funds advised by FMR within a designated asset class. A discount rate is subtracted from the mandate rate once the Fund's monthly average net assets reach a certain level. The mandate rate and discount rate may vary by class. The annual basic fee rate for a class of shares of the Fund is the lesser of (1) the class's mandate rate reduced by the class's discount rate (if applicable) or (2) the amount set forth in the following table.
| | Maximum Management Fee Rate % |
| Class A | .72 |
| Class M | .71 |
| Class C | .72 |
| Class I | .66 |
One-twelfth of the basic fee rate for a class is applied to the average net assets of the class for the month, giving a dollar amount which is the basic fee for the class for that month. A different management fee rate may be applicable to each class of the Fund. The difference between classes is the result of separate arrangements for class-level services and/or waivers of certain expenses. It is not the result of any difference in advisory or custodial fees or other expenses related to the management of the Fund's assets, which do not vary by class. For the portion of the reporting period on or after March 1, 2024, the total annualized management fee rates were as follows:
| | Total Management Fee Rate % |
| Class A | .72 |
| Class M | .71 |
| Class C | .72 |
| Class I | .66 |
Prior to March 1, 2024, the management fee was the sum of an individual fund fee rate that was based on an annual rate of .30% of the Fund's average net assets and an annualized group fee rate that averaged .22% during the period. The group fee rate was based upon the monthly average net assets of a group of registered investment companies with which the investment adviser has management contracts. The group fee rate decreased as assets under management increased and increased as assets under management decreased. For the portion of the reporting period prior to March 1, 2024, the total annualized management fee rate was .52%.
The performance adjustment rate is calculated monthly by comparing over the performance period the Fund's performance to that of the performance adjustment index listed below.
| | Performance Adjustment Index |
| Fidelity Advisor Value Leaders Fund | Russell 1000 Value Index |
For the purposes of calculating the performance adjustment for the Fund, the Fund's investment performance is based on the performance of Class I. To the extent that other classes of the Fund have higher expenses, this could result in those classes bearing a larger positive performance adjustment and smaller negative performance adjustment than would be the case if each class's own performance were considered. The performance period is the most recent 36 month period. The maximum annualized performance adjustment rate is ±.20% of the Fund's average net assets over the performance period. The performance adjustment rate is divided by twelve and multiplied by the Fund's average net assets over the performance period, and the resulting dollar amount is proportionately added to or subtracted from a class's basic fee. For the entire reporting period, the total annualized performance adjustment was .13%.
Effective March 1, 2024, the Fund's sub-advisory agreements with FMR Investment Management (UK) Limited, Fidelity Management & Research (Hong Kong) Limited, and Fidelity Management & Research (Japan) Limited were amended to provide that the investment adviser pays each sub-adviser monthly fees equal to 110% of the sub-adviser's costs for providing sub-advisory services.
Distribution and Service Plan Fees. In accordance with Rule 12b-1 of the 1940 Act, the Fund has adopted separate Distribution and Service Plans for each class of shares. Certain classes pay Fidelity Distributors Company LLC (FDC), an affiliate of the investment adviser, separate Distribution and Service Fees, each of which is based on an annual percentage of each class' average net assets. In addition, FDC may pay financial intermediaries for selling shares of the Fund and providing shareholder support services. For the period, the Distribution and Service Fee rates, total fees and amounts retained by FDC were as follows:
| | Distribution Fee | Service Fee | Total Fees ($) | Retained by FDC ($) |
| Class A | - % | .25% | 24,797 | 381 |
| Class M | .25% | .25% | 14,054 | 83 |
| Class C | .75% | .25% | 12,505 | 1,455 |
| | | | 51,356 | 1,919 |
Sales Load. FDC may receive a front-end sales charge of up to 5.75% for selling Class A shares and 3.50% for selling Class M shares, some of which is paid to financial intermediaries for selling shares of the Fund. Depending on the holding period, FDC may receive contingent deferred sales charges levied on Class A, Class M and Class C redemptions. The deferred sales charges are 1.00% for Class C shares, 1.00% for certain purchases of Class A shares and .25% for certain purchases of Class M shares.
For the period, sales charge amounts retained by FDC were as follows:
| | Retained by FDC ($) |
| Class A | 1,967 |
| Class M | 134 |
Class CA | 180 |
| | 2,281 |
A When Class C shares are initially sold, FDC pays commissions from its own resources to financial intermediaries through which the sales are made.
Transfer Agent Fees. Fidelity Investments Institutional Operations Company LLC (FIIOC), an affiliate of the investment adviser, is the transfer, dividend disbursing and shareholder servicing agent for each class of the Fund. Effective March 1, 2024, the Fund's management contract was amended to incorporate transfer agent services and associated fees previously covered under a separate services agreement. FIIOC pays for typesetting, printing and mailing of shareholder reports, except proxy statements.
During November 2023, the Board approved a change in the transfer agent fees effective December 1, 2023 to a fixed annual rate of class-level average net assets as follows:
| | % of Class-Level Average Net Assets |
| Class A | 0.2000% |
| Class M | 0.1933% |
| Class C | 0.2000% |
| Class I | 0.1412% |
Prior to December 1, 2023, FIIOC received account fees and asset-based fees that varied according to the account size and type of account of the shareholders of the respective classes of the Fund. For the portion of the reporting period prior to March 1, 2024, the fees were equivalent to the following annualized rates:
| | Amount ($) | % of Class-Level Average Net AssetsA |
| Class A | 13,147 | .20 |
| Class M | 3,627 | .19 |
| Class C | 1,794 | .21 |
| Class I | 2,610 | .14 |
| | 21,178 | |
A Annualized
Accounting Fees. Fidelity Service Company, Inc. (FSC), an affiliate of the investment adviser, maintains the Fund's accounting records. Effective March 1, 2024, the Fund's management contract was amended to incorporate accounting services and associated fees previously covered under a separate services agreement.
During November 2023, the Board approved a change in the accounting fees effective December 1, 2023 to a fixed annual rate of average net assets as follows:
| | % of Average Net Assets |
| Fidelity Advisor Value Leaders Fund | 0.0354% |
Prior to December 1, 2023, the accounting fee was based on the level of average net assets for each month. For the portion of the reporting period prior to March 1, 2024, the fees were equivalent to the following annualized rates:
| | % of Average Net Assets |
| Fidelity Advisor Value Leaders Fund | .04 |
Brokerage Commissions. A portion of portfolio transactions were placed with brokerage firms which are affiliates of the investment adviser. Brokerage commissions are included in net realized gain (loss) and change in net unrealized appreciation (depreciation) in the Statement of Operations. The commissions paid to these affiliated firms were as follows:
| | Amount ($) |
| Fidelity Advisor Value Leaders Fund | 69 |
Interfund Trades. Funds may purchase from or sell securities to other Fidelity Funds under procedures adopted by the Board. The procedures have been designed to ensure these interfund trades are executed in accordance with Rule 17a-7 of the 1940 Act. Any interfund trades are included within the respective purchases and sales amounts shown in the Purchases and Sales of Investments note. Interfund trades during the period are noted in the table below.
| | Purchases ($) | Sales ($) | Realized Gain (Loss)($) |
| Fidelity Advisor Value Leaders Fund | 619,978 | 541,099 | 17,327 |
6. Committed Line of Credit.
Certain Funds participate with other funds managed by the investment adviser or an affiliate in a $4.25 billion credit facility (the "line of credit") to be utilized for temporary or emergency purposes to fund shareholder redemptions or for other short-term liquidity purposes. The participating funds have agreed to pay commitment fees on their pro-rata portion of the line of credit, which are reflected in Miscellaneous expenses on the Statement of Operations, and are listed below. During the period, there were no borrowings on this line of credit.
| | Amount ($) |
| Fidelity Advisor Value Leaders Fund | 31 |
7. Expense Reductions.
The investment adviser contractually agreed to reimburse expenses of each class to the extent annual operating expenses exceeded certain levels of class-level average net assets as noted in the table below. This reimbursement will remain in place through February 28, 2025. Some expenses, for example the compensation of the independent Trustees, and certain miscellaneous expenses such as proxy and shareholder meeting expenses, are excluded from this reimbursement.
The following classes were in reimbursement during the period:
| | Expense Limitations | Reimbursement ($) |
| Class A | 1.15% | 32,807 |
| Class M | 1.40% | 9,030 |
| Class C | 1.90% | 4,268 |
| Class I | .90% | 7,548 |
| | | 53,653 |
Through arrangements with the Fund's custodian, credits realized as a result of certain uninvested cash balances were used to reduce the Fund's expenses. During the period, custodian credits reduced the Fund's expenses by $353.
In addition, during the period the investment adviser or an affiliate reimbursed and/or waived a portion of fund-level operating expenses in the amount of $1,492.
8. Distributions to Shareholders.
Distributions to shareholders of each class were as follows:
| | Six months ended April 30, 2024 | Year ended October 31, 2023 |
| Fidelity Advisor Value Leaders Fund | | |
| Distributions to shareholders | | |
| Class A | $996,266 | $392,714 |
| Class M | 278,249 | 101,153 |
| Class C | 116,715 | 43,995 |
| Class I | 299,565 | 229,832 |
Total | $1,690,795 | $767,694 |
9. Share Transactions.
Share transactions for each class were as follows and may contain in-kind transactions, automatic conversions between classes or exchanges between affiliated funds:
| | Shares | Shares | Dollars | Dollars |
| | Six months ended April 30, 2024 | Year ended October 31, 2023 | Six months ended April 30, 2024 | Year ended October 31, 2023 |
| Fidelity Advisor Value Leaders Fund | | | | |
| Class A | | | | |
| Shares sold | 57,292 | 191,201 | $1,236,039 | $4,013,617 |
| Reinvestment of distributions | 47,737 | 18,365 | 979,093 | 386,214 |
| Shares redeemed | (80,635) | (279,017) | (1,726,611) | (5,815,069) |
| Net increase (decrease) | 24,394 | (69,451) | $488,521 | $(1,415,238) |
| Class M | | | | |
| Shares sold | 11,584 | 62,208 | $256,787 | $1,314,625 |
| Reinvestment of distributions | 13,265 | 4,759 | 273,788 | 100,652 |
| Shares redeemed | (30,700) | (70,749) | (665,829) | (1,475,048) |
| Net increase (decrease) | (5,851) | (3,782) | $(135,254) | $(59,771) |
| Class C | | | | |
| Shares sold | 10,568 | 42,856 | $221,361 | $873,648 |
| Reinvestment of distributions | 5,865 | 2,154 | 116,715 | 43,995 |
| Shares redeemed | (26,115) | (60,744) | (540,028) | (1,220,460) |
| Net increase (decrease) | (9,682) | (15,734) | $(201,952) | $(302,817) |
| Class I | | | | |
| Shares sold | 4,696 | 133,971 | $103,829 | $2,861,829 |
| Reinvestment of distributions | 14,510 | 10,836 | 299,341 | 229,069 |
| Shares redeemed | (28,102) | (351,523) | (603,984) | (7,385,297) |
| Net increase (decrease) | (8,896) | (206,716) | $(200,814) | $(4,294,399) |
10. Other.
A fund's organizational documents provide former and current trustees and officers with a limited indemnification against liabilities arising in connection with the performance of their duties to the fund. In the normal course of business, a fund may also enter into contracts that provide general indemnifications. A fund's maximum exposure under these arrangements is unknown as this would be dependent on future claims that may be made against a fund. The risk of material loss from such claims is considered remote.
11. Risk and Uncertainties.
Many factors affect a fund's performance. Developments that disrupt global economies and financial markets, such as pandemics, epidemics, outbreaks of infectious diseases, war, terrorism, and environmental disasters, may significantly affect a fund's investment performance. The effects of these developments to a fund will be impacted by the types of securities in which a fund invests, the financial condition, industry, economic sector, and geographic location of an issuer, and a fund's level of investment in the securities of that issuer. Significant concentrations in security types, issuers, industries, sectors, and geographic locations may magnify the factors that affect a fund's performance.
As a shareholder, you incur two types of costs: (1) transaction costs, which may include sales charges (loads) on purchase payments or redemption proceeds, as applicable and (2) ongoing costs, which generally include management fees, distribution and/or service (12b-1) fees and other Fund expenses. This Example is intended to help you understand your ongoing costs (in dollars) of investing in a fund and to compare these costs with the ongoing costs of investing in other mutual funds.
| The Example is based on an investment of $1,000 invested at the beginning of the period and held for the entire period (November 1, 2023 to April 30, 2024). |
Actual Expenses
The first line of the accompanying table provides information about actual account values and actual expenses. You may use the information in this line, together with the amount you invested, to estimate the expenses that you paid over the period. Simply divide your account value by $1,000.00 (for example, an $8,600 account value divided by $1,000.00 = 8.6), then multiply the result by the number in the first line for a class/Fund under the heading entitled "Expenses Paid During Period" to estimate the expenses you paid on your account during this period. If any fund is a shareholder of any underlying mutual funds or exchange-traded funds (ETFs) (the Underlying Funds), such fund indirectly bears its proportional share of the expenses of the Underlying Funds in addition to the direct expenses incurred presented in the table. These fees and expenses are not included in the annualized expense ratio used to calculate the expense estimate in the table below.
Hypothetical Example for Comparison Purposes
The second line of the accompanying table provides information about hypothetical account values and hypothetical expenses based on the actual expense ratio and an assumed rate of return of 5% per year before expenses, which is not the actual return. The hypothetical account values and expenses may not be used to estimate the actual ending account balance or expenses you paid for the period. You may use this information to compare the ongoing costs of investing in the Fund and other funds. To do so, compare this 5% hypothetical example with the 5% hypothetical examples that appear in the shareholder reports of the other funds. If any fund is a shareholder of any Underlying Funds, such fund indirectly bears its proportional share of the expenses of the Underlying Funds in addition to the direct expenses as presented in the table. These fees and expenses are not included in the annualized expense ratio used to calculate the expense estimate in the table below.
Please note that the expenses shown in the table are meant to highlight your ongoing costs only and do not reflect any transaction costs. Therefore, the second line of the table is useful in comparing ongoing costs only, and will not help you determine the relative total costs of owning different funds. In addition, if these transactional costs were included, your costs would have been higher.
| | | | | Annualized Expense Ratio- A | | Beginning Account Value November 1, 2023 | | Ending Account Value April 30, 2024 | | Expenses Paid During Period- C November 1, 2023 to April 30, 2024 |
| Fidelity Advisor® Value Leaders Fund | | | | | | | | | | |
| Class A | | | | 1.14% | | | | | | |
| Actual | | | | | | $ 1,000 | | $ 1,135.10 | | $ 6.05 |
Hypothetical-B | | | | | | $ 1,000 | | $ 1,019.19 | | $ 5.72 |
| Class M | | | | 1.39% | | | | | | |
| Actual | | | | | | $ 1,000 | | $ 1,133.50 | | $ 7.37 |
Hypothetical-B | | | | | | $ 1,000 | | $ 1,017.95 | | $ 6.97 |
| Class C | | | | 1.88% | | | | | | |
| Actual | | | | | | $ 1,000 | | $ 1,130.90 | | $ 9.96 |
Hypothetical-B | | | | | | $ 1,000 | | $ 1,015.51 | | $ 9.42 |
| Class I | | | | .89% | | | | | | |
| Actual | | | | | | $ 1,000 | | $ 1,136.50 | | $ 4.73 |
Hypothetical-B | | | | | | $ 1,000 | | $ 1,020.44 | | $ 4.47 |
| |
A Annualized expense ratio reflects expenses net of applicable fee waivers.
B 5% return per year before expenses
C Expenses are equal to the annualized expense ratio, multiplied by the average account value over the period, multiplied by 182/ 366 (to reflect the one-half year period). The fees and expenses of any Underlying Funds are not included in each annualized expense ratio.
Board Approval of Investment Advisory Contracts
Fidelity Advisor Value Leaders Fund
At its January 2024 meeting, the Board of Trustees, including the Independent Trustees (together, the Board), approved an amended and restated management contract with Fidelity Management & Research Company LLC (FMR) (the Management Contract), and amended and restated sub-advisory agreements (the Sub-Advisory Contracts, and together with the Management Contract, the Advisory Contracts) for the fund, including the fund's sub-advisory agreements with FMR Investment Management (UK) Limited (FMR UK), Fidelity Management & Research (Hong Kong) Limited (FMR H.K.), and Fidelity Management & Research (Japan) Limited (FMR Japan). The Advisory Contracts will be effective March 1, 2024. The Board will consider the annual renewal of the fund's Advisory Contracts in May 2024, following its review of additional materials provided by FMR.
Management Contract. The Board approved the Management Contract, which implements a new fee structure combining the management fee, transfer agent fee (TA Fee), and pricing and bookkeeping fee (P&B Fee) of the fund and each class into a single class-level fee based on tiered schedules and subject to a maximum class-level rate (the Unified Fee). In exchange for the Unified Fee, the fund will receive investment advisory, management, administrative, transfer agent, pricing and bookkeeping services under a single agreement - the Management Contract.
In its consideration of the Management Contract over several meetings, the Board received, reviewed and discussed a comprehensive set of analyses regarding the Unified Fee including (i) the legal framework, (ii) design goals for the Unified Fee, (iii) calculation methodology for the Unified Fee and illustrative examples, (iv) annual and cumulative projected impacts under various scenarios, both in the aggregate and at the fund/class level, (v) explanations of schedules, rate levers and maximum rates and (vi) shareholder benefits and projected savings.
The Board considered that the maximum Unified Fee for each class of fund would be no higher than the sum of (i) the lowest contractual management fee rate under the fund's existing management contract, which is the individual fund fee rate, if any, plus the lowest contractual marginal group fee rate and (ii) the TA and P&B Fee rates, which are fixed fee rates since December 1, 2023 (together, the Unified Fee Cap). The Board noted that Fidelity has represented that, as a result of this Unified Fee Cap, the Unified Fee would be no greater than the fee rates previously authorized to be charged to the fund for the same services. The Board noted that certain expenses such as performance adjustments, third-party expenses, Rule 12b-1 fees, and certain other miscellaneous expenses would be outside the scope of the Unified Fee and the calculation of such fees would not change as a result of the Unified Fee. The Board considered that, under the Management Contract, a different management fee rate will be applicable to each class of the fund. The Board noted that Fidelity has represented that the difference in expenses between classes is based on differences in class-specific expenses and not due to any difference in advisory or third-party custodial fees or other expenses related to the management of the fund's assets.
The Board considered Fidelity's representations that implementation of the Unified Fee, which includes the Unified Fee Cap, would cause all funds subject to the Unified Fee, including the fund, to experience an immediate reduction on contractual fee rates for services provided under the current management contracts. The Board considered that some funds would not experience lower net total fees as a result of existing fee caps. The Board further considered that, in addition to the contractual fee savings, the Unified Fee offers funds and their shareholders greater protection from future rate increases for services previously offered under separate agreements that are now covered by the Management Contract because such rate increases would require shareholder approval.
Sub-Advisory Contracts. In connection with the Unified Fee changes, the Board considered the Sub-Advisory Contracts, which simplified the calculation of the fees paid by FMR to the sub-advisers under the agreements. The Board noted that the agreements with FMR UK, FMR H.K., and FMR Japan were amended to provide that FMR will compensate each sub-adviser at a fee rate equal to 110% of the sub-adviser's costs incurred in providing services under the agreement. The Board considered that, under the Sub-Advisory Contracts, FMR, and not the fund, will continue to pay the sub-advisory fees to each applicable sub-adviser.
The Board further considered that the approval of the fund's Advisory Contracts will not result in any changes in the investment process or strategies employed in the management of the fund's assets or the day-to-day management of the fund or the persons primarily responsible for such management. Further, the Board considered that the Management Contract would not change the obligations and services of FMR and its affiliates on behalf of the fund, and, in particular, there would be no change in the nature and level of advisory, management, administration, transfer agent, and pricing and bookkeeping services provided to the fund by FMR, its affiliates, and each applicable sub-adviser.
In connection with its consideration of future renewals of the fund's Advisory Contracts, the Board will consider: (i) the nature, extent and quality of services provided to the funds, including shareholder and administrative services and investment performance; (ii) the competitiveness of the management fee and total expenses for the fund; (iii) the costs of the services and profitability, including the revenues earned and the expenses incurred in conducting the business of developing, marketing, distributing, managing, administering, and servicing the fund and its shareholders, to the extent applicable; and (iv) whether there have been economies of scale in respect of the Fidelity funds, whether the Fidelity funds (including the fund) have appropriately benefited from any such economies of scale, and whether there is the potential for realization of any further economies.
Based on its evaluation of all of the conclusions and representations noted above, and after considering all factors it believed relevant, the Board concluded that the fund's management fee structure is fair and reasonable, and that the fund's Advisory Contracts should be approved.
The Securities and Exchange Commission adopted Rule 22e-4 under the Investment Company Act of 1940 (the Liquidity Rule) to promote effective liquidity risk management throughout the open-end investment company industry, thereby reducing the risk that funds will be unable to meet their redemption obligations and mitigating dilution of the interests of fund shareholders.
The Fund has adopted and implemented a liquidity risk management program (the Program) reasonably designed to assess and manage the Fund's liquidity risk and to comply with the requirements of the Liquidity Rule. The Fund's Board of Trustees (the Board) has designated the Fund's investment adviser as administrator of the Program. The Fidelity advisers have established a Liquidity Risk Management Committee (the LRM Committee) to manage the Program for each of the Fidelity Funds. The LRM Committee monitors the adequacy and effectiveness of implementation of the Program and on a periodic basis assesses each Fund's liquidity risk based on a variety of factors including (1) the Fund's investment strategy, (2) portfolio liquidity and cash flow projections during normal and reasonably foreseeable stressed conditions, (3) shareholder redemptions, (4) borrowings and other funding sources and (5) certain factors specific to ETFs including the effect of the Fund's prices and spreads, market participants, and basket compositions on the overall liquidity of the Fund's portfolio, as applicable.
In accordance with the Program, each of the Fund's portfolio investments is classified into one of four defined liquidity categories based on a determination of a reasonable expectation for how long it would take to convert the investment to cash (or sell or dispose of the investment) without significantly changing its market value.
- Highly liquid investments - cash or convertible to cash within three business days or less
- Moderately liquid investments - convertible to cash in three to seven calendar days
- Less liquid investments - can be sold or disposed of, but not settled, within seven calendar days
- Illiquid investments - cannot be sold or disposed of within seven calendar days
Liquidity classification determinations take into account a variety of factors including various market, trading and investment-specific considerations, as well as market depth, and generally utilize analysis from a third-party liquidity metrics service.
The Liquidity Rule places a 15% limit on a fund's illiquid investments and requires funds that do not primarily hold assets that are highly liquid investments to determine and maintain a minimum percentage of the fund's net assets to be invested in highly liquid investments (highly liquid investment minimum or HLIM). The Program includes provisions reasonably designed to comply with the 15% limit on illiquid investments and for determining, periodically reviewing and complying with the HLIM requirement as applicable.
At a recent meeting of the Fund's Board of Trustees, the LRM Committee provided a written report to the Board pertaining to the operation, adequacy, and effectiveness of the Program for the period December 1, 2022 through November 30, 2023. The report concluded that the Program is operating effectively and is reasonably designed to assess and manage the Fund's liquidity risk.
1.800656.120
AVLF-SANN-0624
Fidelity Advisor® Global Capital Appreciation Fund
Semi-Annual Report
April 30, 2024
Contents
To view a fund's proxy voting guidelines and proxy voting record for the 12-month period ended June 30, visit http://www.fidelity.com/proxyvotingresults or visit the Securities and Exchange Commission's (SEC) web site at http://www.sec.gov.
You may also call 1-877-208-0098 to request a free copy of the proxy voting guidelines.
Standard & Poor's, S&P and S&P 500 are registered service marks of The McGraw-Hill Companies, Inc. and have been licensed for use by Fidelity Distributors Corporation.
Other third-party marks appearing herein are the property of their respective owners.
All other marks appearing herein are registered or unregistered trademarks or service marks of FMR LLC or an affiliated company. © 2024 FMR LLC. All rights reserved.
This report and the financial statements contained herein are submitted for the general information of the shareholders of the Fund. This report is not authorized for distribution to prospective investors in the Fund unless preceded or accompanied by an effective prospectus.
A fund files its complete schedule of portfolio holdings with the SEC for the first and third quarters of each fiscal year on Form N-PORT. Forms N-PORT are available on the SEC's web site at http://www.sec.gov. A fund's Forms N-PORT may be reviewed and copied at the SEC's Public Reference Room in Washington, DC. Information regarding the operation of the SEC's Public Reference Room may be obtained by calling 1-800-SEC-0330.
For a complete list of a fund's portfolio holdings, view the most recent holdings listing, semiannual report, or annual report on Fidelity's web site at http://www.fidelity.com, http://www.institutional.fidelity.com, or http://www.401k.com, as applicable.
NOT FDIC INSURED •MAY LOSE VALUE •NO BANK GUARANTEE
Neither the Fund nor Fidelity Distributors Corporation is a bank.
Top Holdings (% of Fund's net assets) |
| |
| Microsoft Corp. (United States of America, Software) | 6.0 | |
| NVIDIA Corp. (United States of America, Semiconductors & Semiconductor Equipment) | 5.6 | |
| Amazon.com, Inc. (United States of America, Broadline Retail) | 5.2 | |
| Meta Platforms, Inc. Class A (United States of America, Interactive Media & Services) | 3.4 | |
| Fiserv, Inc. (United States of America, Financial Services) | 3.1 | |
| Taiwan Semiconductor Manufacturing Co. Ltd. sponsored ADR (Taiwan, Semiconductors & Semiconductor Equipment) | 3.1 | |
| MasterCard, Inc. Class A (United States of America, Financial Services) | 3.1 | |
| Deckers Outdoor Corp. (United States of America, Textiles, Apparel & Luxury Goods) | 3.0 | |
| Visa, Inc. Class A (United States of America, Financial Services) | 2.6 | |
| ASML Holding NV (Netherlands) (Netherlands, Semiconductors & Semiconductor Equipment) | 2.5 | |
| | 37.6 | |
| |
| Market Sectors (% of Fund's net assets) |
| |
| Information Technology | 26.0 | |
| Financials | 22.5 | |
| Industrials | 15.6 | |
| Consumer Discretionary | 10.5 | |
| Health Care | 7.7 | |
| Communication Services | 6.5 | |
| Energy | 4.5 | |
| Materials | 1.1 | |
| |
Asset Allocation (% of Fund's net assets) |
|
|
Geographic Diversification (% of Fund's net assets) |
|
* Includes Short-Term investments and Net Other Assets (Liabilities). Percentages are adjusted for the effect of derivatives, if applicable. |
| |
Showing Percentage of Net Assets
| Common Stocks - 92.9% |
| | | Shares | Value ($) |
| Canada - 2.6% | | | |
| Canadian Natural Resources Ltd. | | 28,900 | 2,191,198 |
| Canadian Pacific Kansas City Ltd. | | 15,400 | 1,207,822 |
TOTAL CANADA | | | 3,399,020 |
| China - 3.7% | | | |
| Alibaba Group Holding Ltd. | | 146,900 | 1,375,434 |
| NXP Semiconductors NV | | 7,200 | 1,844,568 |
| Tencent Holdings Ltd. | | 36,200 | 1,588,572 |
TOTAL CHINA | | | 4,808,574 |
| Denmark - 1.8% | | | |
| Novo Nordisk A/S Series B | | 18,600 | 2,385,307 |
| France - 1.2% | | | |
| LVMH Moet Hennessy Louis Vuitton SE | | 1,850 | 1,519,657 |
| Germany - 0.8% | | | |
| Rheinmetall AG | | 2,000 | 1,103,912 |
| India - 1.2% | | | |
| HDFC Bank Ltd. | | 83,500 | 1,515,978 |
| Japan - 3.1% | | | |
| Hitachi Ltd. | | 29,200 | 2,694,012 |
| Sumitomo Mitsui Financial Group, Inc. | | 24,800 | 1,408,735 |
TOTAL JAPAN | | | 4,102,747 |
| Netherlands - 2.5% | | | |
| ASML Holding NV (Netherlands) | | 3,700 | 3,288,033 |
| Sweden - 0.8% | | | |
| Bergman & Beving AB (B Shares) | | 50,443 | 1,023,013 |
| Taiwan - 3.1% | | | |
| Taiwan Semiconductor Manufacturing Co. Ltd. sponsored ADR | | 29,900 | 4,106,466 |
| United Kingdom - 0.2% | | | |
| Starling Bank Ltd. Series D (a)(b)(c) | | 72,300 | 271,931 |
| United States of America - 71.9% | | | |
| Alphabet, Inc. Class A | | 15,300 | 2,490,534 |
| Amazon.com, Inc. (a) | | 38,700 | 6,772,500 |
| American Express Co. | | 7,200 | 1,685,016 |
| AMETEK, Inc. | | 18,500 | 3,231,210 |
| Amphenol Corp. Class A | | 18,700 | 2,258,399 |
| Apollo Global Management, Inc. | | 18,500 | 2,005,030 |
| Apple, Inc. | | 7,800 | 1,328,574 |
| Arthur J. Gallagher & Co. | | 8,200 | 1,924,458 |
| Boston Scientific Corp. (a) | | 31,600 | 2,271,092 |
| Cintas Corp. | | 2,900 | 1,909,186 |
| Danaher Corp. | | 5,800 | 1,430,396 |
| Deckers Outdoor Corp. (a) | | 4,800 | 3,928,656 |
| Eaton Corp. PLC | | 9,000 | 2,864,340 |
| Eli Lilly & Co. | | 3,250 | 2,538,575 |
| Exxon Mobil Corp. | | 20,800 | 2,460,016 |
| Fiserv, Inc. (a) | | 26,950 | 4,114,457 |
| Intercontinental Exchange, Inc. | | 13,900 | 1,789,764 |
| JPMorgan Chase & Co. | | 15,200 | 2,914,448 |
| Loar Holdings, Inc. | | 200 | 10,464 |
| Marvell Technology, Inc. | | 21,200 | 1,397,292 |
| MasterCard, Inc. Class A | | 8,900 | 4,015,680 |
| Meta Platforms, Inc. Class A | | 10,200 | 4,387,734 |
| Microsoft Corp. | | 20,250 | 7,883,931 |
| Moody's Corp. | | 5,500 | 2,036,815 |
| NVIDIA Corp. | | 8,500 | 7,344,170 |
| Pure Storage, Inc. Class A (a) | | 15,700 | 791,280 |
| S&P Global, Inc. | | 5,400 | 2,245,482 |
| Salesforce, Inc. | | 7,300 | 1,963,262 |
| Schlumberger Ltd. | | 25,300 | 1,201,244 |
| Sherwin-Williams Co. | | 4,900 | 1,468,089 |
| Thermo Fisher Scientific, Inc. | | 2,700 | 1,535,544 |
| United Rentals, Inc. | | 2,200 | 1,469,578 |
| Vertiv Holdings Co. | | 17,200 | 1,599,600 |
| Visa, Inc. Class A | | 12,400 | 3,330,764 |
| W.W. Grainger, Inc. | | 1,700 | 1,566,295 |
| Watsco, Inc. (d) | | 4,200 | 1,880,424 |
TOTAL UNITED STATES OF AMERICA | | | 94,044,299 |
| TOTAL COMMON STOCKS (Cost $78,734,745) | | | 121,568,937 |
| | | | |
| Preferred Stocks - 1.5% |
| | | Shares | Value ($) |
| Convertible Preferred Stocks - 0.5% | | | |
| United States of America - 0.5% | | | |
| Wasabi Holdings, Inc. Series C (a)(b)(c) | | 50,623 | 666,199 |
| Nonconvertible Preferred Stocks - 1.0% | | | |
| Korea (South) - 1.0% | | | |
| Samsung Electronics Co. Ltd. | | 27,930 | 1,300,432 |
| TOTAL PREFERRED STOCKS (Cost $1,667,244) | | | 1,966,631 |
| | | | |
| Money Market Funds - 6.9% |
| | | Shares | Value ($) |
| Fidelity Cash Central Fund 5.39% (e) | | 7,143,583 | 7,145,012 |
| Fidelity Securities Lending Cash Central Fund 5.39% (e)(f) | | 1,873,513 | 1,873,700 |
| TOTAL MONEY MARKET FUNDS (Cost $9,018,712) | | | 9,018,712 |
| | | | |
| TOTAL INVESTMENT IN SECURITIES - 101.3% (Cost $89,420,701) | 132,554,280 |
NET OTHER ASSETS (LIABILITIES) - (1.3)% | (1,760,599) |
| NET ASSETS - 100.0% | 130,793,681 |
| | |
Legend
| (b) | Restricted securities (including private placements) - Investment in securities not registered under the Securities Act of 1933 (excluding 144A issues). At the end of the period, the value of restricted securities (excluding 144A issues) amounted to $938,130 or 0.7% of net assets. |
| (d) | Security or a portion of the security is on loan at period end. |
| (e) | Affiliated fund that is generally available only to investment companies and other accounts managed by Fidelity Investments. The rate quoted is the annualized seven-day yield of the fund at period end. A complete unaudited listing of the fund's holdings as of its most recent quarter end is available upon request. In addition, each Fidelity Central Fund's financial statements are available on the SEC's website or upon request. |
| (f) | Investment made with cash collateral received from securities on loan. |
| Additional information on each restricted holding is as follows: |
| Security | Acquisition Date | Acquisition Cost ($) |
| Starling Bank Ltd. Series D | 6/18/21 - 4/05/22 | 138,336 |
| | | |
| Wasabi Holdings, Inc. Series C | 3/31/21 - 4/30/21 | 549,998 |
| | | |
Affiliated Central Funds
Fiscal year to date information regarding the Fund's investments in Fidelity Central Funds, including the ownership percentage, is presented below.
| Affiliate | Value, beginning of period ($) | Purchases ($) | Sales Proceeds ($) | Dividend Income ($) | Realized Gain (loss) ($) | Change in Unrealized appreciation (depreciation) ($) | Value, end of period ($) | % ownership, end of period |
| Fidelity Cash Central Fund 5.39% | 12,424,845 | 17,190,834 | 22,470,667 | 225,626 | - | - | 7,145,012 | 0.0% |
| Fidelity Securities Lending Cash Central Fund 5.39% | 610,370 | 8,697,056 | 7,433,726 | 438 | - | - | 1,873,700 | 0.0% |
| Total | 13,035,215 | 25,887,890 | 29,904,393 | 226,064 | - | - | 9,018,712 | |
| | | | | | | | | |
Amounts in the dividend income column in the above table include any capital gain distributions from underlying funds, which are presented in the corresponding line item in the Statement of Operations, if applicable.
Amounts in the dividend income column for Fidelity Securities Lending Cash Central Fund represents the income earned on investing cash collateral, less rebates paid to borrowers and any lending agent fees associated with the loan, plus any premium payments received for lending certain types of securities.
Amounts included in the purchases and sales proceeds columns may include in-kind transactions, if applicable.
Investment Valuation
The following is a summary of the inputs used, as of April 30, 2024, involving the Fund's assets and liabilities carried at fair value. The inputs or methodology used for valuing securities may not be an indication of the risk associated with investing in those securities. For more information on valuation inputs, and their aggregation into the levels used below, please refer to the Investment Valuation section in the accompanying Notes to Financial Statements.
| Valuation Inputs at Reporting Date: |
| Description | Total ($) | Level 1 ($) | Level 2 ($) | Level 3 ($) |
Investments in Securities: | | | | |
|
| Equities: | | | | |
Communication Services | 8,466,840 | 6,878,268 | 1,588,572 | - |
Consumer Discretionary | 13,596,247 | 10,701,156 | 2,895,091 | - |
Energy | 5,852,458 | 5,852,458 | - | - |
Financials | 29,258,558 | 26,061,914 | 2,924,713 | 271,931 |
Health Care | 10,160,914 | 7,775,607 | 2,385,307 | - |
Industrials | 20,559,856 | 17,865,844 | 2,694,012 | - |
Information Technology | 34,172,606 | 32,205,975 | 1,300,432 | 666,199 |
Materials | 1,468,089 | 1,468,089 | - | - |
|
| Money Market Funds | 9,018,712 | 9,018,712 | - | - |
| Total Investments in Securities: | 132,554,280 | 117,828,023 | 13,788,127 | 938,130 |
| Statement of Assets and Liabilities |
| | | | April 30, 2024 (Unaudited) |
| | | | | |
| Assets | | | | |
| Investment in securities, at value (including securities loaned of $1,835,652) - See accompanying schedule: | | | | |
Unaffiliated issuers (cost $80,401,989) | $ | 123,535,568 | | |
Fidelity Central Funds (cost $9,018,712) | | 9,018,712 | | |
| | | | | |
| | | | | |
| Total Investment in Securities (cost $89,420,701) | | | $ | 132,554,280 |
| Foreign currency held at value (cost $153) | | | | 152 |
| Receivable for fund shares sold | | | | 208,723 |
| Dividends receivable | | | | 104,450 |
| Distributions receivable from Fidelity Central Funds | | | | 31,782 |
| Prepaid expenses | | | | 34 |
| Other receivables | | | | 39,452 |
Total assets | | | | 132,938,873 |
| Liabilities | | | | |
| Payable for fund shares redeemed | $ | 93,619 | | |
| Accrued management fee | | 107,033 | | |
| Distribution and service plan fees payable | | 23,298 | | |
| Other payables and accrued expenses | | 47,542 | | |
| Collateral on securities loaned | | 1,873,700 | | |
| Total liabilities | | | | 2,145,192 |
| Net Assets | | | $ | 130,793,681 |
| Net Assets consist of: | | | | |
| Paid in capital | | | $ | 86,048,596 |
| Total accumulated earnings (loss) | | | | 44,745,085 |
| Net Assets | | | $ | 130,793,681 |
| | | | | |
| Net Asset Value and Maximum Offering Price | | | | |
| Class A : | | | | |
Net Asset Value and redemption price per share ($43,283,615 ÷ 1,869,091 shares)(a) | | | $ | 23.16 |
| Maximum offering price per share (100/94.25 of $23.16) | | | $ | 24.57 |
| Class M : | | | | |
Net Asset Value and redemption price per share ($22,020,649 ÷ 1,020,636 shares)(a) | | | $ | 21.58 |
| Maximum offering price per share (100/96.50 of $21.58) | | | $ | 22.36 |
| Class C : | | | | |
Net Asset Value and offering price per share ($5,578,753 ÷ 305,664 shares)(a) | | | $ | 18.25 |
| Class I : | | | | |
Net Asset Value, offering price and redemption price per share ($59,910,664 ÷ 2,397,180 shares) | | | $ | 24.99 |
(a)Redemption price per share is equal to net asset value less any applicable contingent deferred sales charge. |
| Statement of Operations |
| | | | Six months ended April 30, 2024 (Unaudited) |
| Investment Income | | | | |
| Dividends | | | $ | 556,421 |
| Income from Fidelity Central Funds (including $438 from security lending) | | | | 226,064 |
| Income before foreign taxes withheld | | | $ | 782,485 |
| Less foreign taxes withheld | | | | (36,673) |
| Total income | | | | 745,812 |
| Expenses | | | | |
| Management fee | | | | |
| Basic fee | $ | 442,180 | | |
| Performance adjustment | | 33,526 | | |
| Transfer agent fees | | 64,995 | | |
| Distribution and service plan fees | | 127,716 | | |
| Accounting fees | | 13,479 | | |
| Custodian fees and expenses | | 3,454 | | |
| Independent trustees' fees and expenses | | 284 | | |
| Registration fees | | 48,206 | | |
| Audit | | 45,469 | | |
| Legal | | 3,379 | | |
| Miscellaneous | | 211 | | |
| Total expenses before reductions | | 782,899 | | |
| Expense reductions | | (28,016) | | |
| Total expenses after reductions | | | | 754,883 |
| Net Investment income (loss) | | | | (9,071) |
| Realized and Unrealized Gain (Loss) | | | | |
| Net realized gain (loss) on: | | | | |
| Investment Securities: | | | | |
| Unaffiliated issuers (net of foreign taxes of $4,854) | | 1,783,032 | | |
| Foreign currency transactions | | (7,103) | | |
| Total net realized gain (loss) | | | | 1,775,929 |
| Change in net unrealized appreciation (depreciation) on: | | | | |
| Investment Securities: | | | | |
| Unaffiliated issuers (net of decrease in deferred foreign taxes of $1,275) | | 25,061,966 | | |
| Assets and liabilities in foreign currencies | | (635) | | |
| Total change in net unrealized appreciation (depreciation) | | | | 25,061,331 |
| Net gain (loss) | | | | 26,837,260 |
| Net increase (decrease) in net assets resulting from operations | | | $ | 26,828,189 |
| Statement of Changes in Net Assets |
| |
| | Six months ended April 30, 2024 (Unaudited) | | Year ended October 31, 2023 |
| Increase (Decrease) in Net Assets | | | | |
| Operations | | | | |
| Net investment income (loss) | $ | (9,071) | $ | 451,576 |
| Net realized gain (loss) | | 1,775,929 | | 6,999,028 |
| Change in net unrealized appreciation (depreciation) | | 25,061,331 | | 6,089,775 |
| Net increase (decrease) in net assets resulting from operations | | 26,828,189 | | 13,540,379 |
| Distributions to shareholders | | (6,869,783) | | - |
| | | | | |
| Share transactions - net increase (decrease) | | 11,120,097 | | 4,868,472 |
| Total increase (decrease) in net assets | | 31,078,503 | | 18,408,851 |
| | | | | |
| Net Assets | | | | |
| Beginning of period | | 99,715,178 | | 81,306,327 |
| End of period | $ | 130,793,681 | $ | 99,715,178 |
| | | | | |
| | | | | |
Financial Highlights
Fidelity Advisor® Global Capital Appreciation Fund Class A |
| |
| | Six months ended (Unaudited) April 30, 2024 | | Years ended October 31, 2023 | | 2022 | | 2021 | | 2020 | | 2019 |
Selected Per-Share Data | | | | | | | | | | | | |
| Net asset value, beginning of period | $ | 19.50 | $ | 16.68 | $ | 24.21 | $ | 18.53 | $ | 15.65 | $ | 16.48 |
| Income from Investment Operations | | | | | | | | | | | | |
Net investment income (loss) A,B | | (.01) | | .08 | | (.06) | | (.09) C | | (.08) | | .10 |
| Net realized and unrealized gain (loss) | | 5.00 | | 2.74 | | (5.64) | | 5.77 | | 3.03 | | .50 |
| Total from investment operations | | 4.99 | | 2.82 | | (5.70) | | 5.68 | | 2.95 | | .60 |
| Distributions from net investment income | | (.05) | | - | | - | | - | | (.07) | | (.02) |
| Distributions from net realized gain | | (1.27) | | - | | (1.83) | | - | | - | | (1.41) |
| Total distributions | | (1.33) D | | - | | (1.83) | | - | | (.07) | | (1.43) |
| Net asset value, end of period | $ | 23.16 | $ | 19.50 | $ | 16.68 | $ | 24.21 | $ | 18.53 | $ | 15.65 |
Total Return E,F,G | | | | 16.91% | | (25.40)% | | 30.65% | | 18.89% | | 4.39% |
Ratios to Average Net Assets B,H,I | | | | | | | | | | | | |
| Expenses before reductions | | 1.37% J | | 1.22% | | 1.31% | | 1.15% | | 1.23% | | 1.14% |
| Expenses net of fee waivers, if any | | | | 1.22% | | 1.30% | | 1.15% | | 1.23% | | 1.14% |
| Expenses net of all reductions | | 1.29% J | | 1.22% | | 1.30% | | 1.15% | | 1.21% | | 1.14% |
| Net investment income (loss) | | (.06)% J | | .42% | | (.32)% | | (.42)% C | | (.45)% | | .66% |
| Supplemental Data | | | | | | | | | | | | |
| Net assets, end of period (000 omitted) | $ | 43,284 | $ | 32,433 | $ | 28,069 | $ | 40,398 | $ | 31,247 | $ | 30,046 |
Portfolio turnover rate K | | | | 39% | | 42% | | 58% | | 44% | | 142% |
ACalculated based on average shares outstanding during the period.
BNet investment income (loss) is affected by the timing of the declaration of dividends by any underlying mutual funds or exchange-traded funds (ETFs). Net investment income (loss) of any mutual funds or ETFs is not included in the Fund's net investment income (loss) ratio.
CNet investment income per share reflects one or more large, non-recurring dividend(s) which amounted to $.02 per share. Excluding such non-recurring dividend(s), the ratio of net investment income (loss) to average net assets would have been (.50)%.
DTotal distributions per share do not sum due to rounding.
ETotal returns for periods of less than one year are not annualized.
FTotal returns would have been lower if certain expenses had not been reduced during the applicable periods shown.
GTotal returns do not include the effect of the sales charges.
HFees and expenses of any underlying mutual funds or exchange-traded funds (ETFs) are not included in the Fund's expense ratio. The Fund indirectly bears its proportionate share of these expenses. For additional expense information related to investments in Fidelity Central Funds, please refer to the "Investments in Fidelity Central Funds" note found in the Notes to Financial Statements section of the most recent Annual or Semi-Annual report.
IExpense ratios reflect operating expenses of the class. Expenses before reductions do not reflect amounts reimbursed, waived, or reduced through arrangements with the investment adviser, brokerage services, or other offset arrangements, if applicable, and do not represent the amount paid by the class during periods when reimbursements, waivers or reductions occur.
JAnnualized.
KAmount does not include the portfolio activity of any underlying mutual funds or exchange-traded funds (ETFs).
Fidelity Advisor® Global Capital Appreciation Fund Class M |
| |
| | Six months ended (Unaudited) April 30, 2024 | | Years ended October 31, 2023 | | 2022 | | 2021 | | 2020 | | 2019 |
Selected Per-Share Data | | | | | | | | | | | | |
| Net asset value, beginning of period | $ | 18.22 | $ | 15.63 | $ | 22.85 | $ | 17.54 | $ | 14.82 | $ | 15.70 |
| Income from Investment Operations | | | | | | | | | | | | |
Net investment income (loss) A,B | | (.03) | | .03 | | (.10) | | (.14) C | | (.12) | | .05 |
| Net realized and unrealized gain (loss) | | 4.66 | | 2.56 | | (5.29) | | 5.45 | | 2.87 | | .48 |
| Total from investment operations | | 4.63 | | 2.59 | | (5.39) | | 5.31 | | 2.75 | | .53 |
| Distributions from net investment income | | - | | - | | - | | - | | (.03) | | - |
| Distributions from net realized gain | | (1.27) | | - | | (1.83) | | - | | - | | (1.41) |
| Total distributions | | (1.27) | | - | | (1.83) | | - | | (.03) | | (1.41) |
| Net asset value, end of period | $ | 21.58 | $ | 18.22 | $ | 15.63 | $ | 22.85 | $ | 17.54 | $ | 14.82 |
Total Return D,E,F | | | | 16.57% | | (25.56)% | | 30.27% | | 18.59% | | 4.10% |
Ratios to Average Net Assets B,G,H | | | | | | | | | | | | |
| Expenses before reductions | | 1.61% I | | 1.47% | | 1.56% | | 1.41% | | 1.51% | | 1.43% |
| Expenses net of fee waivers, if any | | | | 1.47% | | 1.55% | | 1.41% | | 1.50% | | 1.43% |
| Expenses net of all reductions | | 1.53% I | | 1.47% | | 1.55% | | 1.41% | | 1.49% | | 1.42% |
| Net investment income (loss) | | (.30)% I | | .18% | | (.58)% | | (.68)% C | | (.73)% | | .37% |
| Supplemental Data | | | | | | | | | | | | |
| Net assets, end of period (000 omitted) | $ | 22,021 | $ | 17,748 | $ | 16,273 | $ | 22,618 | $ | 18,864 | $ | 18,611 |
Portfolio turnover rate J | | | | 39% | | 42% | | 58% | | 44% | | 142% |
ACalculated based on average shares outstanding during the period.
BNet investment income (loss) is affected by the timing of the declaration of dividends by any underlying mutual funds or exchange-traded funds (ETFs). Net investment income (loss) of any mutual funds or ETFs is not included in the Fund's net investment income (loss) ratio.
CNet investment income per share reflects one or more large, non-recurring dividend(s) which amounted to $.02 per share. Excluding such non-recurring dividend(s), the ratio of net investment income (loss) to average net assets would have been (.76)%.
DTotal returns for periods of less than one year are not annualized.
ETotal returns would have been lower if certain expenses had not been reduced during the applicable periods shown.
FTotal returns do not include the effect of the sales charges.
GFees and expenses of any underlying mutual funds or exchange-traded funds (ETFs) are not included in the Fund's expense ratio. The Fund indirectly bears its proportionate share of these expenses. For additional expense information related to investments in Fidelity Central Funds, please refer to the "Investments in Fidelity Central Funds" note found in the Notes to Financial Statements section of the most recent Annual or Semi-Annual report.
HExpense ratios reflect operating expenses of the class. Expenses before reductions do not reflect amounts reimbursed, waived, or reduced through arrangements with the investment adviser, brokerage services, or other offset arrangements, if applicable, and do not represent the amount paid by the class during periods when reimbursements, waivers or reductions occur.
IAnnualized.
JAmount does not include the portfolio activity of any underlying mutual funds or exchange-traded funds (ETFs).
Fidelity Advisor® Global Capital Appreciation Fund Class C |
| |
| | Six months ended (Unaudited) April 30, 2024 | | Years ended October 31, 2023 | | 2022 | | 2021 | | 2020 | | 2019 |
Selected Per-Share Data | | | | | | | | | | | | |
| Net asset value, beginning of period | $ | 15.62 | $ | 13.47 | $ | 20.04 | $ | 15.46 | $ | 13.10 | $ | 14.11 |
| Income from Investment Operations | | | | | | | | | | | | |
Net investment income (loss) A,B | | (.07) | | (.06) | | (.17) | | (.22) C | | (.17) | | (.01) |
| Net realized and unrealized gain (loss) | | 3.96 | | 2.21 | | (4.57) | | 4.80 | | 2.53 | | .41 |
| Total from investment operations | | 3.89 | | 2.15 | | (4.74) | | 4.58 | | 2.36 | | .40 |
| Distributions from net realized gain | | (1.26) | | - | | (1.83) | | - | | - | | (1.41) |
| Total distributions | | (1.26) | | - | | (1.83) | | - | | - | | (1.41) |
| Net asset value, end of period | $ | 18.25 | $ | 15.62 | $ | 13.47 | $ | 20.04 | $ | 15.46 | $ | 13.10 |
Total Return D,E,F | | | | 15.96% | | (25.94)% | | 29.62% | | 18.02% | | 3.59% |
Ratios to Average Net Assets B,G,H | | | | | | | | | | | | |
| Expenses before reductions | | 2.12% I | | 2.01% | | 2.08% | | 1.92% | | 1.99% | | 1.90% |
| Expenses net of fee waivers, if any | | | | 2.01% | | 2.05% | | 1.92% | | 1.98% | | 1.90% |
| Expenses net of all reductions | | 2.04% I | | 2.01% | | 2.05% | | 1.92% | | 1.97% | | 1.89% |
| Net investment income (loss) | | (.80)% I | | (.36)% | | (1.07)% | | (1.19)% C | | (1.21)% | | (.10)% |
| Supplemental Data | | | | | | | | | | | | |
| Net assets, end of period (000 omitted) | $ | 5,579 | $ | 4,192 | $ | 4,907 | $ | 8,044 | $ | 9,134 | $ | 12,540 |
Portfolio turnover rate J | | | | 39% | | 42% | | 58% | | 44% | | 142% |
ACalculated based on average shares outstanding during the period.
BNet investment income (loss) is affected by the timing of the declaration of dividends by any underlying mutual funds or exchange-traded funds (ETFs). Net investment income (loss) of any mutual funds or ETFs is not included in the Fund's net investment income (loss) ratio.
CNet investment income per share reflects one or more large, non-recurring dividend(s) which amounted to $.01 per share. Excluding such non-recurring dividend(s), the ratio of net investment income (loss) to average net assets would have been (1.27)%.
DTotal returns for periods of less than one year are not annualized.
ETotal returns would have been lower if certain expenses had not been reduced during the applicable periods shown.
FTotal returns do not include the effect of the contingent deferred sales charge.
GFees and expenses of any underlying mutual funds or exchange-traded funds (ETFs) are not included in the Fund's expense ratio. The Fund indirectly bears its proportionate share of these expenses. For additional expense information related to investments in Fidelity Central Funds, please refer to the "Investments in Fidelity Central Funds" note found in the Notes to Financial Statements section of the most recent Annual or Semi-Annual report.
HExpense ratios reflect operating expenses of the class. Expenses before reductions do not reflect amounts reimbursed, waived, or reduced through arrangements with the investment adviser, brokerage services, or other offset arrangements, if applicable, and do not represent the amount paid by the class during periods when reimbursements, waivers or reductions occur.
IAnnualized.
JAmount does not include the portfolio activity of any underlying mutual funds or exchange-traded funds (ETFs).
Fidelity Advisor® Global Capital Appreciation Fund Class I |
| |
| | Six months ended (Unaudited) April 30, 2024 | | Years ended October 31, 2023 | | 2022 | | 2021 | | 2020 | | 2019 |
Selected Per-Share Data | | | | | | | | | | | | |
| Net asset value, beginning of period | $ | 20.99 | $ | 17.89 | $ | 25.75 | $ | 19.65 | $ | 16.57 | $ | 17.37 |
| Income from Investment Operations | | | | | | | | | | | | |
Net investment income (loss) A,B | | .02 | | .16 | | - C | | (.02) D | | (.02) | | .16 |
| Net realized and unrealized gain (loss) | | 5.38 | | 2.94 | | (6.03) | | 6.12 | | 3.21 | | .52 |
| Total from investment operations | | 5.40 | | 3.10 | | (6.03) | | 6.10 | | 3.19 | | .68 |
| Distributions from net investment income | | (.13) | | - | | - | | - | | (.11) | | (.08) |
| Distributions from net realized gain | | (1.27) | | - | | (1.83) | | - | | - | | (1.41) |
| Total distributions | | (1.40) | | - | | (1.83) | | - | | (.11) | | (1.48) E |
| Net asset value, end of period | $ | 24.99 | $ | 20.99 | $ | 17.89 | $ | 25.75 | $ | 19.65 | $ | 16.57 |
Total Return F,G | | | | 17.33% | | (25.14)% | | 31.04% | | 19.37% | | 4.69% |
Ratios to Average Net Assets B,H,I | | | | | | | | | | | | |
| Expenses before reductions | | 1.05% J | | .88% | | .97% | | .82% | | .89% | | .82% |
| Expenses net of fee waivers, if any | | | | .88% | | .96% | | .82% | | .89% | | .82% |
| Expenses net of all reductions | | 1.04% J | | .88% | | .96% | | .82% | | .87% | | .82% |
| Net investment income (loss) | | .20% J | | .76% | | .01% | | (.09)% D | | (.11)% | | .97% |
| Supplemental Data | | | | | | | | | | | | |
| Net assets, end of period (000 omitted) | $ | 59,911 | $ | 45,342 | $ | 32,058 | $ | 49,146 | $ | 38,359 | $ | 37,068 |
Portfolio turnover rate K | | | | 39% | | 42% | | 58% | | 44% | | 142% |
ACalculated based on average shares outstanding during the period.
BNet investment income (loss) is affected by the timing of the declaration of dividends by any underlying mutual funds or exchange-traded funds (ETFs). Net investment income (loss) of any mutual funds or ETFs is not included in the Fund's net investment income (loss) ratio.
CAmount represents less than $.005 per share.
DNet investment income per share reflects one or more large, non-recurring dividend(s) which amounted to $.02 per share. Excluding such non-recurring dividend(s), the ratio of net investment income (loss) to average net assets would have been (.17)%.
ETotal distributions per share do not sum due to rounding.
FTotal returns for periods of less than one year are not annualized.
GTotal returns would have been lower if certain expenses had not been reduced during the applicable periods shown.
HFees and expenses of any underlying mutual funds or exchange-traded funds (ETFs) are not included in the Fund's expense ratio. The Fund indirectly bears its proportionate share of these expenses. For additional expense information related to investments in Fidelity Central Funds, please refer to the "Investments in Fidelity Central Funds" note found in the Notes to Financial Statements section of the most recent Annual or Semi-Annual report.
IExpense ratios reflect operating expenses of the class. Expenses before reductions do not reflect amounts reimbursed, waived, or reduced through arrangements with the investment adviser, brokerage services, or other offset arrangements, if applicable, and do not represent the amount paid by the class during periods when reimbursements, waivers or reductions occur.
JAnnualized.
KAmount does not include the portfolio activity of any underlying mutual funds or exchange-traded funds (ETFs).
For the period ended April 30, 2024
1. Organization.
Fidelity Advisor Global Capital Appreciation Fund (the Fund) is a fund of Fidelity Advisor Series VIII (the Trust) and is authorized to issue an unlimited number of shares. The Trust is registered under the Investment Company Act of 1940, as amended (the 1940 Act), as an open-end management investment company organized as a Massachusetts business trust. The Fund offers Class A, Class M, Class C and Class I shares, each of which has equal rights as to assets and voting privileges. Class A, Class M, Class C and Class I are Fidelity Advisor classes. Each class has exclusive voting rights with respect to matters that affect that class. Class C shares will automatically convert to Class A shares after a holding period of eight years from the initial date of purchase, with certain exceptions.
2. Investments in Fidelity Central Funds.
Funds may invest in Fidelity Central Funds, which are open-end investment companies generally available only to other investment companies and accounts managed by the investment adviser and its affiliates. The Schedule of Investments lists any Fidelity Central Funds held as an investment as of period end, but does not include the underlying holdings of each Fidelity Central Fund. An investing fund indirectly bears its proportionate share of the expenses of the underlying Fidelity Central Funds.
Based on its investment objective, each Fidelity Central Fund may invest or participate in various investment vehicles or strategies that are similar to those of the investing fund. These strategies are consistent with the investment objectives of the investing fund and may involve certain economic risks which may cause a decline in value of each of the Fidelity Central Funds and thus a decline in the value of the investing fund.
| Fidelity Central Fund | Investment Manager | Investment Objective | Investment Practices | Expense RatioA |
| Fidelity Money Market Central Funds | Fidelity Management & Research Company LLC (FMR) | Each fund seeks to obtain a high level of current income consistent with the preservation of capital and liquidity. | Short-term Investments | Less than .005% |
A Expenses expressed as a percentage of average net assets and are as of each underlying Central Fund's most recent annual or semi-annual shareholder report.
A complete unaudited list of holdings for each Fidelity Central Fund is available upon request or at the Securities and Exchange Commission website at www.sec.gov. In addition, the financial statements of the Fidelity Central Funds which contain the significant accounting policies (including investment valuation policies) of those funds, and are not covered by the Report of Independent Registered Public Accounting Firm, are available on the Securities and Exchange Commission website or upon request.
3. Significant Accounting Policies.
The Fund is an investment company and applies the accounting and reporting guidance of the Financial Accounting Standards Board (FASB) Accounting Standards Codification Topic 946 Financial Services - Investment Companies. The financial statements have been prepared in conformity with accounting principles generally accepted in the United States of America (GAAP), which require management to make certain estimates and assumptions at the date of the financial statements. Actual results could differ from those estimates. Subsequent events, if any, through the date that the financial statements were issued have been evaluated in the preparation of the financial statements. The Fund's Schedule of Investments lists any underlying mutual funds or exchange-traded funds (ETFs) but does not include the underlying holdings of these funds. The following summarizes the significant accounting policies of the Fund:
Investment Valuation. Investments are valued as of 4:00 p.m. Eastern time on the last calendar day of the period. The Board of Trustees (the Board) has designated the Fund's investment adviser as the valuation designee responsible for the fair valuation function and performing fair value determinations as needed. The investment adviser has established a Fair Value Committee (the Committee) to carry out the day-to-day fair valuation responsibilities and has adopted policies and procedures to govern the fair valuation process and the activities of the Committee. In accordance with these fair valuation policies and procedures, which have been approved by the Board, the Fund attempts to obtain prices from one or more third party pricing services or brokers to value its investments. When current market prices, quotations or currency exchange rates are not readily available or reliable, investments will be fair valued in good faith by the Committee, in accordance with the policies and procedures. Factors used in determining fair value vary by investment type and may include market or investment specific events, transaction data, estimated cash flows, and market observations of comparable investments. The frequency that the fair valuation procedures are used cannot be predicted and they may be utilized to a significant extent. The Committee manages the Fund's fair valuation practices and maintains the fair valuation policies and procedures. The Fund's investment adviser reports to the Board information regarding the fair valuation process and related material matters.
The Fund categorizes the inputs to valuation techniques used to value its investments into a disclosure hierarchy consisting of three levels as shown below:
Level 1 - unadjusted quoted prices in active markets for identical investments
Level 2 - other significant observable inputs (including quoted prices for similar investments, interest rates, prepayment speeds, etc.)
Level 3 - unobservable inputs (including the Fund's own assumptions based on the best information available)
Valuation techniques used to value the Fund's investments by major category are as follows:
Equity securities, including restricted securities, for which market quotations are readily available, are valued at the last reported sale price or official closing price as reported by a third party pricing service on the primary market or exchange on which they are traded and are categorized as Level 1 in the hierarchy. In the event there were no sales during the day or closing prices are not available, securities are valued at the last quoted bid price or may be valued using the last available price and are generally categorized as Level 2 in the hierarchy. For foreign equity securities, when market or security specific events arise, comparisons to the valuation of American Depositary Receipts (ADRs), futures contracts, Exchange-Traded Funds (ETFs) and certain indexes as well as quoted prices for similar securities may be used and would be categorized as Level 2 in the hierarchy. For equity securities, including restricted securities, where observable inputs are limited, assumptions about market activity and risk are used and these securities may be categorized as Level 3 in the hierarchy.
Investments in open-end mutual funds, including the Fidelity Central Funds, are valued at their closing net asset value (NAV) each business day and are categorized as Level 1 in the hierarchy.
Changes in valuation techniques may result in transfers in or out of an assigned level within the disclosure hierarchy. The aggregate value of investments by input level as of April 30, 2024 is included at the end of the Fund's Schedule of Investments.
Foreign Currency. Certain Funds may use foreign currency contracts to facilitate transactions in foreign-denominated securities. Gains and losses from these transactions may arise from changes in the value of the foreign currency or if the counterparties do not perform under the contracts' terms.
Foreign-denominated assets, including investment securities, and liabilities are translated into U.S. dollars at the exchange rates at period end. Purchases and sales of investment securities, income and dividends received, and expenses denominated in foreign currencies are translated into U.S. dollars at the exchange rate in effect on the transaction date.
The effects of exchange rate fluctuations on investments are included with the net realized and unrealized gain (loss) on investment securities. Other foreign currency transactions resulting in realized and unrealized gain (loss) are disclosed separately.
Investment Transactions and Income. For financial reporting purposes, the Fund's investment holdings and NAV include trades executed through the end of the last business day of the period. The NAV per share for processing shareholder transactions is calculated as of the close of business of the New York Stock Exchange (NYSE), normally 4:00 p.m. Eastern time and includes trades executed through the end of the prior business day. Gains and losses on securities sold are determined on the basis of identified cost and include proceeds received from litigation. Commissions paid to certain brokers with whom the investment adviser, or its affiliates, places trades on behalf of a fund include an amount in addition to trade execution, which may be rebated back to a fund. Any such rebates are included in net realized gain (loss) on investments in the Statement of Operations. Dividend income is recorded on the ex-dividend date, except for certain dividends from foreign securities where the ex-dividend date may have passed, which are recorded as soon as the Fund is informed of the ex-dividend date. Non-cash dividends included in dividend income, if any, are recorded at the fair market value of the securities received. Income and capital gain distributions from Fidelity Central Funds, if any, are recorded on the ex-dividend date. Investment income is recorded net of foreign taxes withheld where recovery of such taxes is uncertain. Funds may file withholding tax reclaims in certain jurisdictions to recover a portion of amounts previously withheld. Any withholding tax reclaims income is included in the Statement of Operations in foreign taxes withheld. Any receivables for withholding tax reclaims are included in the Statement of Assets and Liabilities in dividends receivable.
Class Allocations and Expenses. Investment income, realized and unrealized capital gains and losses, common expenses of a fund, and certain fund-level expense reductions, if any, are allocated daily on a pro-rata basis to each class based on the relative net assets of each class to the total net assets of a fund. Each class differs with respect to transfer agent and distribution and service plan fees incurred, as applicable. Certain expense reductions may also differ by class, if applicable. For the reporting period, the allocated portion of income and expenses to each class as a percent of its average net assets may vary due to the timing of recording these transactions in relation to fluctuating net assets of the classes. Expenses directly attributable to a fund are charged to that fund. Expenses attributable to more than one fund are allocated among the respective funds on the basis of relative net assets or other appropriate methods. Expenses included in the accompanying financial statements reflect the expenses of that fund and do not include any expenses associated with any underlying mutual funds or exchange-traded funds (ETFs). Although not included in a fund's expenses, a fund indirectly bears its proportionate share of these expenses through the net asset value of each underlying mutual fund or exchange-traded fund (ETF). Expense estimates are accrued in the period to which they relate and adjustments are made when actual amounts are known.
Income Tax Information and Distributions to Shareholders. Each year, the Fund intends to qualify as a regulated investment company under Subchapter M of the Internal Revenue Code, including distributing substantially all of its taxable income and realized gains. As a result, no provision for U.S. Federal income taxes is required. The Fund files a U.S. federal tax return, in addition to state and local tax returns as required. The Fund's federal income tax returns are subject to examination by the Internal Revenue Service (IRS) for a period of three fiscal years after they are filed. State and local tax returns may be subject to examination for an additional fiscal year depending on the jurisdiction. Foreign taxes are provided for based on the Fund's understanding of the tax rules and rates that exist in the foreign markets in which it invests. The Fund is subject to a tax imposed on capital gains by certain countries in which it invests. An estimated deferred tax liability for net unrealized appreciation on the applicable securities is included in Other payables and accrued expenses on the Statement of Assets & Liabilities.
Distributions are declared and recorded on the ex-dividend date. Income and capital gain distributions are declared separately for each class. Income and capital gain distributions are determined in accordance with income tax regulations, which may differ from GAAP.
Capital accounts within the financial statements are adjusted for permanent book-tax differences. These adjustments have no impact on net assets or the results of operations. Capital accounts are not adjusted for temporary book-tax differences which will reverse in a subsequent period.
Book-tax differences are primarily due to foreign currency transactions, certain foreign taxes, capital loss carryforwards and losses deferred due to wash sales and excise tax regulations.
As of period end, the cost and unrealized appreciation (depreciation) in securities, and derivatives if applicable, for federal income tax purposes were as follows:
| Gross unrealized appreciation | $43,716,546 |
| Gross unrealized depreciation | (601,038) |
| Net unrealized appreciation (depreciation) | $43,115,508 |
| Tax cost | $89,438,772 |
Restricted Securities (including Private Placements). Funds may invest in securities that are subject to legal or contractual restrictions on resale. These securities generally may be resold in transactions exempt from registration or to the public if the securities are registered. Disposal of these securities may involve time-consuming negotiations and expense, and prompt sale at an acceptable price may be difficult. Information regarding restricted securities held at period end is included at the end of the Schedule of Investments, if applicable.
4. Purchases and Sales of Investments.
Purchases and sales of securities, other than short-term securities and in-kind transactions, as applicable, are noted in the table below.
| | Purchases ($) | Sales ($) |
| Fidelity Advisor Global Capital Appreciation Fund | 31,437,578 | 22,091,364 |
5. Fees and Other Transactions with Affiliates.
Management Fee. Fidelity Management & Research Company LLC (the investment adviser) and its affiliates provide the Fund with investment management related services for which the Fund pays a monthly management fee.
Effective March 1, 2024, the Fund's management contract was amended to incorporate administrative services previously covered under separate services agreements (Transfer Agent and Accounting agreements). The amended contract incorporates a basic fee rate that may vary by class (subject to a performance adjustment). The investment adviser or an affiliate pays certain expenses of managing and operating the Fund out of each class's management fee. Each class of the Fund pays a management fee to the investment adviser. The management fee is calculated and paid to the investment adviser every month. The management fee is determined by calculating a basic fee and then applying a performance adjustment. When determining a class's basic fee, a mandate rate is calculated based on the monthly average net assets of a group of funds advised by FMR within a designated asset class. A discount rate is subtracted from the mandate rate once the Fund's monthly average net assets reach a certain level. The mandate rate and discount rate may vary by class. The annual basic fee rate for a class of shares of the Fund is the lesser of (1) the class's mandate rate reduced by the class's discount rate (if applicable) or (2) the amount set forth in the following table.
| | Maximum Management Fee Rate % |
| Class A | .87 |
| Class M | .87 |
| Class C | .87 |
| Class I | .80 |
One-twelfth of the basic fee rate for a class is applied to the average net assets of the class for the month, giving a dollar amount which is the basic fee for the class for that month. A different management fee rate may be applicable to each class of the Fund. The difference between classes is the result of separate arrangements for class-level services and/or waivers of certain expenses. It is not the result of any difference in advisory or custodial fees or other expenses related to the management of the Fund's assets, which do not vary by class. For the portion of the reporting period on or after March 1, 2024, the total annualized management fee rates were as follows:
| | Total Management Fee Rate % |
| Class A | .87 |
| Class M | .87 |
| Class C | .87 |
| Class I | .80 |
Prior to March 1, 2024, the management fee was the sum of an individual fund fee rate that was based on an annual rate of .45% of the Fund's average net assets and an annualized group fee rate that averaged .22% during the period. The group fee rate was based upon the monthly average net assets of a group of registered investment companies with which the investment adviser has management contracts. The group fee rate decreased as assets under management increased and increased as assets under management decreased. For the portion of the reporting period prior to March 1, 2024, the total annualized management fee rate was .67%.
The performance adjustment rate is calculated monthly by comparing over the performance period the Fund's performance to that of the performance adjustment index listed below.
| | Performance Adjustment Index |
| Fidelity Advisor Global Capital Appreciation Fund | MSCI All Country World Index |
For the purposes of calculating the performance adjustment for the Fund, the Fund's investment performance is based on the performance of Class I. To the extent that other classes of the Fund have higher expenses, this could result in those classes bearing a larger positive performance adjustment and smaller negative performance adjustment than would be the case if each class's own performance were considered. The performance period is the most recent 36 month period. The maximum annualized performance adjustment rate is ±.20% of the Fund's average net assets over the performance period. The performance adjustment rate is divided by twelve and multiplied by the Fund's average net assets over the performance period, and the resulting dollar amount is proportionately added to or subtracted from a class's basic fee. For the entire reporting period, the total annualized performance adjustment was .06%.
Effective March 1, 2024, the Fund's sub-advisory agreements with FMR Investment Management (UK) Limited, Fidelity Management & Research (Hong Kong) Limited, and Fidelity Management & Research (Japan) Limited were amended to provide that the investment adviser pays each sub-adviser monthly fees equal to 110% of the sub-adviser's costs for providing sub-advisory services.
Effective March 1, 2024, the Fund's sub-advisory agreement with FIL Investment Advisors (FIA) was amended to provide that the investment adviser pays FIA monthly fees at an annual rate of 0.38% with respect to the average daily net assets of the Fund managed by FIA. FIA in turn pays FIA(UK).
Distribution and Service Plan Fees. In accordance with Rule 12b-1 of the 1940 Act, the Fund has adopted separate Distribution and Service Plans for each class of shares. Certain classes pay Fidelity Distributors Company LLC (FDC), an affiliate of the investment adviser, separate Distribution and Service Fees, each of which is based on an annual percentage of each class' average net assets. In addition, FDC may pay financial intermediaries for selling shares of the Fund and providing shareholder support services. For the period, the Distribution and Service Fee rates, total fees and amounts retained by FDC were as follows:
| | Distribution Fee | Service Fee | Total Fees ($) | Retained by FDC ($) |
| Class A | - % | .25% | 50,268 | 928 |
| Class M | .25% | .25% | 51,780 | 246 |
| Class C | .75% | .25% | 25,668 | 3,502 |
| | | | 127,716 | 4,676 |
Sales Load. FDC may receive a front-end sales charge of up to 5.75% for selling Class A shares and 3.50% for selling Class M shares, some of which is paid to financial intermediaries for selling shares of the Fund. Depending on the holding period, FDC may receive contingent deferred sales charges levied on Class A, Class M and Class C redemptions. The deferred sales charges are 1.00% for Class C shares, 1.00% for certain purchases of Class A shares and .25% for certain purchases of Class M shares.
For the period, sales charge amounts retained by FDC were as follows:
| | Retained by FDC ($) |
| Class A | 9,740 |
| Class M | 523 |
Class CA | 112 |
| | 10,375 |
A When Class C shares are initially sold, FDC pays commissions from its own resources to financial intermediaries through which the sales are made.
Transfer Agent Fees. Fidelity Investments Institutional Operations Company LLC (FIIOC), an affiliate of the investment adviser, is the transfer, dividend disbursing and shareholder servicing agent for each class of the Fund. Effective March 1, 2024, the Fund's management contract was amended to incorporate transfer agent services and associated fees previously covered under a separate services agreement. FIIOC pays for typesetting, printing and mailing of shareholder reports, except proxy statements.
During November 2023, the Board approved a change in the transfer agent fees effective December 1, 2023 to a fixed annual rate of class-level average net assets as follows:
| | % of Class-Level Average Net Assets |
| Class A | .2000 |
| Class M | .2000 |
| Class C | .2000 |
| Class I | .1317 |
Prior to December 1, 2023, FIIOC received account fees and asset-based fees that varied according to the account size and type of account of the shareholders of the respective classes of the Fund. For the portion of the reporting period prior to March 1, 2024, the fees were equivalent to the following annualized rates:
| | Amount ($) | % of Class-Level Average Net AssetsA |
| Class A | 25,637 | .20 |
| Class M | 13,307 | .20 |
| Class C | 3,406 | .21 |
| Class I | 22,645 | .13 |
| | 64,995 | |
A Annualized
Accounting Fees. Fidelity Service Company, Inc. (FSC), an affiliate of the investment adviser, maintains the Fund's accounting records. Effective March 1, 2024, the Fund's management contract was amended to incorporate accounting services and associated fees previously covered under a separate services agreement.
During November 2023, the Board approved a change in the accounting fees effective December 1, 2023 to a fixed annual rate of average net assets as follows:
| | % of Average Net Assets |
| Fidelity Advisor Global Capital Appreciation Fund | .0354 |
Prior to December 1, 2023, the accounting fee was based on the level of average net assets for each month. For the portion of the reporting period prior to March 1, 2024, the fees were equivalent to the following annualized rates:
| | % of Average Net Assets |
| Fidelity Advisor Global Capital Appreciation Fund | .04 |
Brokerage Commissions. A portion of portfolio transactions were placed with brokerage firms which are affiliates of the investment adviser. Brokerage commissions are included in net realized gain (loss) and change in net unrealized appreciation (depreciation) in the Statement of Operations. The commissions paid to these affiliated firms were as follows:
| | Amount ($) |
| Fidelity Advisor Global Capital Appreciation Fund | 124 |
Interfund Trades. Funds may purchase from or sell securities to other Fidelity Funds under procedures adopted by the Board. The procedures have been designed to ensure these interfund trades are executed in accordance with Rule 17a-7 of the 1940 Act. Any interfund trades are included within the respective purchases and sales amounts shown in the Purchases and Sales of Investments note. Interfund trades during the period are noted in the table below.
| | Purchases ($) | Sales ($) | Realized Gain (Loss)($) |
| Fidelity Advisor Global Capital Appreciation Fund | 3,872,211 | 1,135,759 | (123,380) |
6. Committed Line of Credit.
Certain Funds participate with other funds managed by the investment adviser or an affiliate in a $4.25 billion credit facility (the "line of credit") to be utilized for temporary or emergency purposes to fund shareholder redemptions or for other short-term liquidity purposes. The participating funds have agreed to pay commitment fees on their pro-rata portion of the line of credit, which are reflected in Miscellaneous expenses on the Statement of Operations, and are listed below. During the period, there were no borrowings on this line of credit.
| | Amount ($) |
| Fidelity Advisor Global Capital Appreciation Fund | 108 |
7. Security Lending.
Funds lend portfolio securities from time to time in order to earn additional income. Lending agents are used, including National Financial Services (NFS), an affiliate of the investment adviser. Pursuant to a securities lending agreement, NFS will receive a fee, which is capped at 9.9% of a fund's daily lending revenue, for its services as lending agent. A fund may lend securities to certain qualified borrowers, including NFS. On the settlement date of the loan, a fund receives collateral (in the form of U.S. Treasury obligations, letters of credit and/or cash) against the loaned securities and maintains collateral in an amount not less than 100% of the market value of the loaned securities during the period of the loan. The market value of the loaned securities is determined at the close of business of a fund and any additional required collateral is delivered to a fund on the next business day. A fund or borrower may terminate the loan at any time, and if the borrower defaults on its obligation to return the securities loaned because of insolvency or other reasons, a fund may apply collateral received from the borrower against the obligation. A fund may experience delays and costs in recovering the securities loaned. Any cash collateral received is invested in the Fidelity Securities Lending Cash Central Fund. Any loaned securities are identified as such in the Schedule of Investments, and the value of loaned securities and cash collateral at period end, as applicable, are presented in the Statement of Assets and Liabilities. Security lending income represents the income earned on investing cash collateral, less rebates paid to borrowers and any lending agent fees associated with the loan, plus any premium payments received for lending certain types of securities. Security lending income is presented in the Statement of Operations as a component of income from Fidelity Central Funds. Affiliated security lending activity, if any, was as follows:
| | Total Security Lending Fees Paid to NFS ($) | Security Lending Income From Securities Loaned to NFS ($) | Value of Securities Loaned to NFS at Period End ($) |
| Fidelity Advisor Global Capital Appreciation Fund | 45 | - | - |
8. Expense Reductions.
The investment adviser contractually agreed to reimburse expenses of each class to the extent annual operating expenses exceeded certain levels of class-level average net assets as noted in the table below. This reimbursement will remain in place through February 28, 2025. Some expenses, for example the compensation of the independent Trustees, and certain miscellaneous expenses such as proxy and shareholder meeting expenses, are excluded from this reimbursement.
The following classes were in reimbursement during the period:
| | Expense Limitations | Reimbursement ($) |
| Class A | 1.30% | 13,779 |
| Class M | 1.55% | 6,960 |
| Class C | 2.05% | 1,874 |
| | | 22,613 |
Through arrangements with the Fund's custodian and each class' transfer agent, credits realized as a result of certain uninvested cash balances were used to reduce the Fund's expenses. During the period, custodian credits reduced the Fund's expenses by $128. During the period, transfer agent credits reduced each class' expenses as noted in the table below.
| | Expense reduction ($) |
| | |
| Class M | 27 |
In addition, during the period the investment adviser or an affiliate reimbursed and/or waived a portion of fund-level operating expenses in the amount of $5,248.
9. Distributions to Shareholders.
Distributions to shareholders of each class were as follows:
| | Six months ended April 30, 2024 | Year ended October 31, 2023 |
| Fidelity Advisor Global Capital Appreciation Fund | | |
| Distributions to shareholders | | |
| Class A | $2,253,708 | $ - |
| Class M | 1,218,995 | - |
| Class C | 351,095 | - |
| Class I | 3,045,985 | - |
Total | $6,869,783 | $- |
| | | |
10. Share Transactions.
Share transactions for each class were as follows and may contain in-kind transactions, automatic conversions between classes or exchanges between affiliated funds:
| | Shares | Shares | Dollars | Dollars |
| | Six months ended April 30, 2024 | Year ended October 31, 2023 | Six months ended April 30, 2024 | Year ended October 31, 2023 |
| Fidelity Advisor Global Capital Appreciation Fund | | | | |
| Class A | | | | |
| Shares sold | 317,706 | 236,799 | $6,973,023 | $4,608,114 |
| Reinvestment of distributions | 110,134 | - | 2,200,473 | - |
| Shares redeemed | (222,162) | (256,152) | (4,943,663) | (4,908,049) |
| Net increase (decrease) | 205,678 | (19,353) | $4,229,833 | $(299,935) |
| Class M | | | | |
| Shares sold | 44,617 | 43,515 | $923,816 | $776,382 |
| Reinvestment of distributions | 65,309 | - | 1,216,704 | - |
| Shares redeemed | (63,390) | (110,804) | (1,293,246) | (1,962,893) |
| Net increase (decrease) | 46,536 | (67,289) | $847,274 | $(1,186,511) |
| Class C | | | | |
| Shares sold | 48,941 | 37,916 | $845,349 | $590,266 |
| Reinvestment of distributions | 22,230 | - | 351,017 | - |
| Shares redeemed | (33,897) | (133,865) | (579,915) | (2,055,865) |
| Net increase (decrease) | 37,274 | (95,949) | $616,451 | $(1,465,599) |
| Class I | | | | |
| Shares sold | 327,632 | 661,612 | $7,790,347 | $13,832,392 |
| Reinvestment of distributions | 134,331 | - | 2,893,489 | - |
| Shares redeemed | (225,331) | (292,717) | (5,257,297) | (6,011,875) |
| Net increase (decrease) | 236,632 | 368,895 | $5,426,539 | $7,820,517 |
11. Other.
A fund's organizational documents provide former and current trustees and officers with a limited indemnification against liabilities arising in connection with the performance of their duties to the fund. In the normal course of business, a fund may also enter into contracts that provide general indemnifications. A fund's maximum exposure under these arrangements is unknown as this would be dependent on future claims that may be made against a fund. The risk of material loss from such claims is considered remote.
12. Risk and Uncertainties.
Many factors affect a fund's performance. Developments that disrupt global economies and financial markets, such as pandemics, epidemics, outbreaks of infectious diseases, war, terrorism, and environmental disasters, may significantly affect a fund's investment performance. The effects of these developments to a fund will be impacted by the types of securities in which a fund invests, the financial condition, industry, economic sector, and geographic location of an issuer, and a fund's level of investment in the securities of that issuer. Significant concentrations in security types, issuers, industries, sectors, and geographic locations may magnify the factors that affect a fund's performance.
As a shareholder, you incur two types of costs: (1) transaction costs, which may include sales charges (loads) on purchase payments or redemption proceeds, as applicable and (2) ongoing costs, which generally include management fees, distribution and/or service (12b-1) fees and other Fund expenses. This Example is intended to help you understand your ongoing costs (in dollars) of investing in a fund and to compare these costs with the ongoing costs of investing in other mutual funds.
| The Example is based on an investment of $1,000 invested at the beginning of the period and held for the entire period (November 1, 2023 to April 30, 2024). |
Actual Expenses
The first line of the accompanying table provides information about actual account values and actual expenses. You may use the information in this line, together with the amount you invested, to estimate the expenses that you paid over the period. Simply divide your account value by $1,000.00 (for example, an $8,600 account value divided by $1,000.00 = 8.6), then multiply the result by the number in the first line for a class/Fund under the heading entitled "Expenses Paid During Period" to estimate the expenses you paid on your account during this period. If any fund is a shareholder of any underlying mutual funds or exchange-traded funds (ETFs) (the Underlying Funds), such fund indirectly bears its proportional share of the expenses of the Underlying Funds in addition to the direct expenses incurred presented in the table. These fees and expenses are not included in the annualized expense ratio used to calculate the expense estimate in the table below.
Hypothetical Example for Comparison Purposes
The second line of the accompanying table provides information about hypothetical account values and hypothetical expenses based on the actual expense ratio and an assumed rate of return of 5% per year before expenses, which is not the actual return. The hypothetical account values and expenses may not be used to estimate the actual ending account balance or expenses you paid for the period. You may use this information to compare the ongoing costs of investing in the Fund and other funds. To do so, compare this 5% hypothetical example with the 5% hypothetical examples that appear in the shareholder reports of the other funds. If any fund is a shareholder of any Underlying Funds, such fund indirectly bears its proportional share of the expenses of the Underlying Funds in addition to the direct expenses as presented in the table. These fees and expenses are not included in the annualized expense ratio used to calculate the expense estimate in the table below.
Please note that the expenses shown in the table are meant to highlight your ongoing costs only and do not reflect any transaction costs. Therefore, the second line of the table is useful in comparing ongoing costs only, and will not help you determine the relative total costs of owning different funds. In addition, if these transactional costs were included, your costs would have been higher.
| | | | | Annualized Expense Ratio- A | | Beginning Account Value November 1, 2023 | | Ending Account Value April 30, 2024 | | Expenses Paid During Period- C November 1, 2023 to April 30, 2024 |
| Fidelity Advisor® Global Capital Appreciation Fund | | | | | | | | | | |
| Class A | | | | 1.29% | | | | | | |
| Actual | | | | | | $ 1,000 | | $ 1,266.60 | | $ 7.27 |
Hypothetical-B | | | | | | $ 1,000 | | $ 1,018.45 | | $ 6.47 |
| Class M | | | | 1.54% | | | | | | |
| Actual | | | | | | $ 1,000 | | $ 1,265.30 | | $ 8.67 |
Hypothetical-B | | | | | | $ 1,000 | | $ 1,017.21 | | $ 7.72 |
| Class C | | | | 2.04% | | | | | | |
| Actual | | | | | | $ 1,000 | | $ 1,261.70 | | $ 11.47 |
Hypothetical-B | | | | | | $ 1,000 | | $ 1,014.72 | | $ 10.22 |
| Class I | | | | 1.04% | | | | | | |
| Actual | | | | | | $ 1,000 | | $ 1,267.90 | | $ 5.86 |
Hypothetical-B | | | | | | $ 1,000 | | $ 1,019.69 | | $ 5.22 |
| |
A Annualized expense ratio reflects expenses net of applicable fee waivers.
B 5% return per year before expenses
C Expenses are equal to the annualized expense ratio, multiplied by the average account value over the period, multiplied by 182/ 366 (to reflect the one-half year period). The fees and expenses of any Underlying Funds are not included in each annualized expense ratio.
Board Approval of Investment Advisory Contracts
Fidelity Advisor Global Capital Appreciation Fund
At its January 2024 meeting, the Board of Trustees, including the Independent Trustees (together, the Board), approved an amended and restated management contract with Fidelity Management & Research Company LLC (FMR) (the Management Contract), and amended and restated sub-advisory agreements (the Sub-Advisory Contracts, and together with the Management Contract, the Advisory Contracts) for the fund, including the fund's sub-advisory agreements with FMR Investment Management (UK) Limited (FMR UK), Fidelity Management & Research (Hong Kong) Limited (FMR H.K.), Fidelity Management & Research (Japan) Limited (FMR Japan), and FIL Investment Advisors (FIL). The Advisory Contracts will be effective March 1, 2024. The Board will consider the annual renewal of the fund's Advisory Contracts in May 2024, following its review of additional materials provided by FMR.
Management Contract. The Board approved the Management Contract, which implements a new fee structure combining the management fee, transfer agent fee (TA Fee), and pricing and bookkeeping fee (P&B Fee) of the fund and each class into a single class-level fee based on tiered schedules and subject to a maximum class-level rate (the Unified Fee). In exchange for the Unified Fee, the fund will receive investment advisory, management, administrative, transfer agent, pricing and bookkeeping services under a single agreement - the Management Contract.
In its consideration of the Management Contract over several meetings, the Board received, reviewed and discussed a comprehensive set of analyses regarding the Unified Fee including (i) the legal framework, (ii) design goals for the Unified Fee, (iii) calculation methodology for the Unified Fee and illustrative examples, (iv) annual and cumulative projected impacts under various scenarios, both in the aggregate and at the fund/class level, (v) explanations of schedules, rate levers and maximum rates and (vi) shareholder benefits and projected savings.
The Board considered that the maximum Unified Fee for each class of the fund would be no higher than the sum of (i) the lowest contractual management fee rate under the fund's existing management contract, which is the individual fund fee rate, if any, plus the lowest contractual marginal group fee rate and (ii) the TA and P&B Fee rates, which are fixed fee rates since December 1, 2023 (together, the Unified Fee Cap). The Board noted that Fidelity has represented that, as a result of this Unified Fee Cap, the Unified Fee would be no greater than the fee rates previously authorized to be charged to the fund for the same services. The Board noted that certain expenses such as performance adjustments, third-party expenses, Rule 12b-1 fees, and certain other miscellaneous expenses would be outside the scope of the Unified Fee and the calculation of such fees would not change as a result of the Unified Fee. The Board considered that, under the Management Contract, a different management fee rate will be applicable to each class of the fund. The Board noted that Fidelity has represented that the difference in expenses between classes is based on differences in class-specific expenses and not due to any difference in advisory or third-party custodial fees or other expenses related to the management of the fund's assets.
The Board considered Fidelity's representations that implementation of the Unified Fee, which includes the Unified Fee Cap, would cause all funds subject to the Unified Fee, including the fund, to experience an immediate reduction on contractual fee rates for services provided under the current management contracts. The Board considered that some funds would not experience lower net total fees as a result of existing fee caps. The Board further considered that, in addition to the contractual fee savings, the Unified Fee offers funds and their shareholders greater protection from future rate increases for services previously offered under separate agreements that are now covered by the Management Contract because such rate increases would require shareholder approval.
Sub-Advisory Contracts. In connection with the Unified Fee changes, the Board considered the Sub-Advisory Contracts, which simplified the calculation of the fees paid by FMR to the sub-advisers under the agreements. The Board noted that the agreements with FMR UK, FMR H.K., and FMR Japan were amended to provide that FMR will compensate each sub-adviser at a fee rate equal to 110% of the sub-adviser's costs incurred in providing services under the agreement. The Board further noted that the agreement with FIL was amended to provide that FMR will compensate FIL at a flat fee rate of 0.38% of the net assets sub-advised by it. The Board considered that, under the Sub-Advisory Contracts, FMR, and not the fund, will continue to pay the sub-advisory fees to each applicable sub-adviser.
The Board further considered that the approval of the fund's Advisory Contracts will not result in any changes in the investment process or strategies employed in the management of the fund's assets or the day-to-day management of the fund or the persons primarily responsible for such management. Further, the Board considered that the Management Contract would not change the obligations and services of FMR and its affiliates on behalf of the fund, and, in particular, there would be no change in the nature and level of advisory, management, administration, transfer agent, and pricing and bookkeeping services provided to the fund by FMR, its affiliates, and each applicable sub-adviser.
In connection with its consideration of future renewals of the fund's Advisory Contracts, the Board will consider: (i) the nature, extent and quality of services provided to the funds, including shareholder and administrative services and investment performance; (ii) the competitiveness of the management fee and total expenses for the fund; (iii) the costs of the services and profitability, including the revenues earned and the expenses incurred in conducting the business of developing, marketing, distributing, managing, administering, and servicing the fund and its shareholders, to the extent applicable; and (iv) whether there have been economies of scale in respect of the Fidelity funds, whether the Fidelity funds (including the fund) have appropriately benefited from any such economies of scale, and whether there is the potential for realization of any further economies.
Based on its evaluation of all of the conclusions and representations noted above, and after considering all factors it believed relevant, the Board concluded that the fund's management fee structure is fair and reasonable, and that the fund's Advisory Contracts should be approved.
The Securities and Exchange Commission adopted Rule 22e-4 under the Investment Company Act of 1940 (the Liquidity Rule) to promote effective liquidity risk management throughout the open-end investment company industry, thereby reducing the risk that funds will be unable to meet their redemption obligations and mitigating dilution of the interests of fund shareholders.
The Fund has adopted and implemented a liquidity risk management program (the Program) reasonably designed to assess and manage the Fund's liquidity risk and to comply with the requirements of the Liquidity Rule. The Fund's Board of Trustees (the Board) has designated the Fund's investment adviser as administrator of the Program. The Fidelity advisers have established a Liquidity Risk Management Committee (the LRM Committee) to manage the Program for each of the Fidelity Funds. The LRM Committee monitors the adequacy and effectiveness of implementation of the Program and on a periodic basis assesses each Fund's liquidity risk based on a variety of factors including (1) the Fund's investment strategy, (2) portfolio liquidity and cash flow projections during normal and reasonably foreseeable stressed conditions, (3) shareholder redemptions, (4) borrowings and other funding sources and (5) certain factors specific to ETFs including the effect of the Fund's prices and spreads, market participants, and basket compositions on the overall liquidity of the Fund's portfolio, as applicable.
In accordance with the Program, each of the Fund's portfolio investments is classified into one of four defined liquidity categories based on a determination of a reasonable expectation for how long it would take to convert the investment to cash (or sell or dispose of the investment) without significantly changing its market value.
- Highly liquid investments - cash or convertible to cash within three business days or less
- Moderately liquid investments - convertible to cash in three to seven calendar days
- Less liquid investments - can be sold or disposed of, but not settled, within seven calendar days
- Illiquid investments - cannot be sold or disposed of within seven calendar days
Liquidity classification determinations take into account a variety of factors including various market, trading and investment-specific considerations, as well as market depth, and generally utilize analysis from a third-party liquidity metrics service.
The Liquidity Rule places a 15% limit on a fund's illiquid investments and requires funds that do not primarily hold assets that are highly liquid investments to determine and maintain a minimum percentage of the fund's net assets to be invested in highly liquid investments (highly liquid investment minimum or HLIM). The Program includes provisions reasonably designed to comply with the 15% limit on illiquid investments and for determining, periodically reviewing and complying with the HLIM requirement as applicable.
At a recent meeting of the Fund's Board of Trustees, the LRM Committee provided a written report to the Board pertaining to the operation, adequacy, and effectiveness of the Program for the period December 1, 2022 through November 30, 2023. The report concluded that the Program is operating effectively and is reasonably designed to assess and manage the Fund's liquidity risk.
1.719689.125
AGLO-SANN-0624
Fidelity Advisor® Global Equity Income Fund
Semi-Annual Report
April 30, 2024
Contents
To view a fund's proxy voting guidelines and proxy voting record for the 12-month period ended June 30, visit http://www.fidelity.com/proxyvotingresults or visit the Securities and Exchange Commission's (SEC) web site at http://www.sec.gov.
You may also call 1-877-208-0098 to request a free copy of the proxy voting guidelines.
Standard & Poor's, S&P and S&P 500 are registered service marks of The McGraw-Hill Companies, Inc. and have been licensed for use by Fidelity Distributors Corporation.
Other third-party marks appearing herein are the property of their respective owners.
All other marks appearing herein are registered or unregistered trademarks or service marks of FMR LLC or an affiliated company. © 2024 FMR LLC. All rights reserved.
This report and the financial statements contained herein are submitted for the general information of the shareholders of the Fund. This report is not authorized for distribution to prospective investors in the Fund unless preceded or accompanied by an effective prospectus.
A fund files its complete schedule of portfolio holdings with the SEC for the first and third quarters of each fiscal year on Form N-PORT. Forms N-PORT are available on the SEC's web site at http://www.sec.gov. A fund's Forms N-PORT may be reviewed and copied at the SEC's Public Reference Room in Washington, DC. Information regarding the operation of the SEC's Public Reference Room may be obtained by calling 1-800-SEC-0330.
For a complete list of a fund's portfolio holdings, view the most recent holdings listing, semiannual report, or annual report on Fidelity's web site at http://www.fidelity.com, http://www.institutional.fidelity.com, or http://www.401k.com, as applicable.
NOT FDIC INSURED •MAY LOSE VALUE •NO BANK GUARANTEE
Neither the Fund nor Fidelity Distributors Corporation is a bank.
Top Holdings (% of Fund's net assets) |
| |
| Microsoft Corp. (United States of America, Software) | 4.7 | |
| Apple, Inc. (United States of America, Technology Hardware, Storage & Peripherals) | 4.3 | |
| Rheinmetall AG (Germany, Aerospace & Defense) | 2.5 | |
| Taiwan Semiconductor Manufacturing Co. Ltd. (Taiwan, Semiconductors & Semiconductor Equipment) | 2.3 | |
| NXP Semiconductors NV (China, Semiconductors & Semiconductor Equipment) | 2.1 | |
| JPMorgan Chase & Co. (United States of America, Banks) | 2.1 | |
| Exxon Mobil Corp. (United States of America, Oil, Gas & Consumable Fuels) | 1.6 | |
| Bank of America Corp. (United States of America, Banks) | 1.6 | |
| Linde PLC (United States of America, Chemicals) | 1.5 | |
| Eli Lilly & Co. (United States of America, Pharmaceuticals) | 1.5 | |
| | 24.2 | |
| |
| Market Sectors (% of Fund's net assets) |
| |
| Information Technology | 19.7 | |
| Financials | 13.9 | |
| Industrials | 13.5 | |
| Health Care | 10.7 | |
| Consumer Staples | 9.3 | |
| Consumer Discretionary | 9.1 | |
| Communication Services | 5.8 | |
| Materials | 5.2 | |
| Energy | 5.0 | |
| Utilities | 3.9 | |
| Real Estate | 1.2 | |
| |
Asset Allocation (% of Fund's net assets) |
|
|
Geographic Diversification (% of Fund's net assets) |
|
* Includes Short-Term investments and Net Other Assets (Liabilities). Percentages are adjusted for the effect of derivatives, if applicable. |
| |
Showing Percentage of Net Assets
| Common Stocks - 97.3% |
| | | Shares | Value ($) |
| Belgium - 0.9% | | | |
| KBC Group NV | | 7,267 | 542,098 |
| UCB SA | | 2,101 | 279,264 |
TOTAL BELGIUM | | | 821,362 |
| Brazil - 0.6% | | | |
| Equatorial Energia SA | | 104,714 | 616,878 |
| Canada - 4.7% | | | |
| Alimentation Couche-Tard, Inc. Class A (multi-vtg.) | | 18,767 | 1,040,150 |
| Canadian Natural Resources Ltd. | | 9,635 | 730,123 |
| Constellation Software, Inc. | | 219 | 563,831 |
| Constellation Software, Inc. warrants 3/31/40 (a)(b) | | 219 | 0 |
| Imperial Oil Ltd. | | 10,819 | 743,848 |
| Metro, Inc. | | 13,969 | 714,559 |
| PrairieSky Royalty Ltd. | | 36,606 | 697,472 |
TOTAL CANADA | | | 4,489,983 |
| China - 2.5% | | | |
| Kweichow Moutai Co. Ltd. (A Shares) | | 816 | 191,324 |
| NXP Semiconductors NV | | 7,901 | 2,024,157 |
| SITC International Holdings Co. Ltd. | | 90,487 | 196,230 |
TOTAL CHINA | | | 2,411,711 |
| Finland - 0.9% | | | |
| Elisa Corp. (A Shares) | | 15,987 | 722,035 |
| Neste OYJ | | 4,672 | 106,400 |
TOTAL FINLAND | | | 828,435 |
| France - 3.4% | | | |
| Airbus Group NV | | 5,316 | 874,789 |
| Capgemini SA | | 2,857 | 600,487 |
| Edenred SA | | 6,875 | 326,203 |
| LVMH Moet Hennessy Louis Vuitton SE | | 1,411 | 1,159,047 |
| VINCI SA | | 2,436 | 285,441 |
TOTAL FRANCE | | | 3,245,967 |
| Germany - 3.8% | | | |
| Deutsche Telekom AG | | 26,883 | 615,770 |
| Rheinmetall AG | | 4,230 | 2,334,773 |
| Siemens AG | | 3,288 | 615,953 |
TOTAL GERMANY | | | 3,566,496 |
| Hong Kong - 0.6% | | | |
| AIA Group Ltd. | | 60,814 | 445,424 |
| HKBN Ltd. | | 271,997 | 81,820 |
TOTAL HONG KONG | | | 527,244 |
| Hungary - 0.4% | | | |
| Richter Gedeon PLC | | 15,802 | 402,398 |
| India - 0.3% | | | |
| HDFC Bank Ltd. sponsored ADR | | 3,440 | 198,144 |
| Redington (India) Ltd. | | 45,659 | 119,345 |
TOTAL INDIA | | | 317,489 |
| Italy - 0.6% | | | |
| Prysmian SpA | | 10,300 | 562,579 |
| Japan - 6.3% | | | |
| Capcom Co. Ltd. | | 22,188 | 365,269 |
| Daiichikosho Co. Ltd. | | 29,222 | 341,091 |
| FUJIFILM Holdings Corp. | | 13,281 | 282,520 |
| Hitachi Ltd. | | 8,177 | 754,416 |
| Hoya Corp. | | 4,231 | 490,541 |
| Inaba Denki Sangyo Co. Ltd. | | 19,756 | 460,918 |
| Minebea Mitsumi, Inc. | | 11,098 | 207,869 |
| Mitsubishi Electric Corp. | | 8,300 | 144,668 |
| Renesas Electronics Corp. | | 30,169 | 489,816 |
| Roland Corp. | | 11,195 | 304,334 |
| Shin-Etsu Chemical Co. Ltd. | | 18,663 | 722,425 |
| Sony Group Corp. | | 9,797 | 809,735 |
| Toyota Motor Corp. | | 25,447 | 580,410 |
TOTAL JAPAN | | | 5,954,012 |
| Kenya - 0.2% | | | |
| Safaricom Ltd. | | 1,435,064 | 169,550 |
| Korea (South) - 1.0% | | | |
| Samsung Electronics Co. Ltd. | | 16,336 | 905,521 |
| Luxembourg - 0.2% | | | |
| L'Occitane Ltd. | | 49,500 | 203,994 |
| Sweden - 0.3% | | | |
| HEXPOL AB (B Shares) | | 27,302 | 312,153 |
| Switzerland - 1.0% | | | |
| Compagnie Financiere Richemont SA Series A | | 2,360 | 326,216 |
| Galderma Group AG | | 2,900 | 216,100 |
| Sika AG | | 1,592 | 455,995 |
TOTAL SWITZERLAND | | | 998,311 |
| Taiwan - 2.3% | | | |
| Taiwan Semiconductor Manufacturing Co. Ltd. | | 89,421 | 2,137,269 |
| United Kingdom - 6.8% | | | |
| AstraZeneca PLC sponsored ADR | | 16,597 | 1,259,380 |
| B&M European Value Retail SA | | 80,508 | 522,108 |
| BAE Systems PLC | | 51,389 | 854,713 |
| Compass Group PLC | | 22,311 | 620,552 |
| Diageo PLC | | 9,423 | 325,656 |
| Games Workshop Group PLC | | 800 | 99,064 |
| JD Sports Fashion PLC | | 279,653 | 403,953 |
| London Stock Exchange Group PLC | | 4,700 | 518,129 |
| RELX PLC (London Stock Exchange) | | 18,499 | 760,066 |
| RS GROUP PLC | | 39,005 | 359,204 |
| Starling Bank Ltd. Series D (a)(b)(c) | | 20,800 | 78,232 |
| Unilever PLC | | 7,942 | 410,846 |
| WH Smith PLC | | 12,992 | 178,089 |
TOTAL UNITED KINGDOM | | | 6,389,992 |
| United States of America - 60.2% | | | |
| AbbVie, Inc. | | 4,800 | 780,672 |
| Accenture PLC Class A | | 3,925 | 1,181,072 |
| Albertsons Companies, Inc. | | 5,200 | 106,080 |
| Amdocs Ltd. | | 9,791 | 822,346 |
| Ameren Corp. | | 6,089 | 449,794 |
| American Tower Corp. | | 1,996 | 342,434 |
| Apple, Inc. | | 24,108 | 4,106,316 |
| AT&T, Inc. | | 16,508 | 278,820 |
| Ball Corp. | | 3,098 | 215,528 |
| Bank of America Corp. | | 41,128 | 1,522,147 |
| BJ's Wholesale Club Holdings, Inc. (a) | | 7,210 | 538,443 |
| BlackRock, Inc. Class A | | 400 | 301,856 |
| Capital One Financial Corp. | | 4,454 | 638,837 |
| Chubb Ltd. | | 2,690 | 668,842 |
| Cisco Systems, Inc. | | 18,846 | 885,385 |
| Comcast Corp. Class A | | 15,882 | 605,263 |
| Costco Wholesale Corp. | | 898 | 649,164 |
| Crane Co. | | 4,021 | 562,980 |
| Crane NXT Co. | | 2,421 | 147,221 |
| Crown Holdings, Inc. | | 5,670 | 465,337 |
| Danaher Corp. | | 4,234 | 1,044,189 |
| Dollar Tree, Inc. (a) | | 5,825 | 688,806 |
| Eli Lilly & Co. | | 1,816 | 1,418,478 |
| Estee Lauder Companies, Inc. Class A | | 1,957 | 287,111 |
| Experian PLC | | 17,215 | 694,349 |
| Exxon Mobil Corp. | | 12,872 | 1,522,371 |
| Freeport-McMoRan, Inc. | | 20,637 | 1,030,612 |
| GE Vernova LLC | | 1,839 | 282,673 |
| General Dynamics Corp. | | 900 | 258,381 |
| General Electric Co. | | 6,457 | 1,044,872 |
| Gilead Sciences, Inc. | | 8,201 | 534,705 |
| GSK PLC | | 23,400 | 485,478 |
| H&R Block, Inc. | | 13,925 | 657,678 |
| Hartford Financial Services Group, Inc. | | 9,708 | 940,608 |
| Hess Corp. | | 3,608 | 568,224 |
| Hillenbrand, Inc. | | 4,700 | 224,284 |
| Johnson Controls International PLC | | 7,206 | 468,894 |
| JPMorgan Chase & Co. | | 10,534 | 2,019,789 |
| Kenvue, Inc. | | 12,200 | 229,604 |
| Keurig Dr. Pepper, Inc. | | 10,337 | 348,357 |
| Lamar Advertising Co. Class A | | 6,346 | 735,184 |
| Linde PLC | | 3,270 | 1,441,939 |
| Lowe's Companies, Inc. | | 2,996 | 683,058 |
| M&T Bank Corp. | | 4,925 | 711,121 |
| McDonald's Corp. | | 2,657 | 725,467 |
| MDU Resources Group, Inc. | | 6,100 | 150,670 |
| Merck & Co., Inc. | | 6,944 | 897,304 |
| Microsoft Corp. | | 11,369 | 4,426,296 |
| Mondelez International, Inc. | | 3,454 | 248,481 |
| MSCI, Inc. | | 562 | 261,774 |
| Nestle SA (Reg. S) | | 4,941 | 496,077 |
| NextEra Energy, Inc. | | 10,379 | 695,082 |
| Norfolk Southern Corp. | | 500 | 115,160 |
| PG&E Corp. | | 10,627 | 181,828 |
| Phillips 66 Co. | | 1,643 | 235,294 |
| PNC Financial Services Group, Inc. | | 6,596 | 1,010,903 |
| Procter & Gamble Co. | | 5,326 | 869,203 |
| Roche Holding AG (participation certificate) | | 3,221 | 771,797 |
| Samsonite International SA (d) | | 79,200 | 278,441 |
| Sanofi SA | | 6,180 | 610,541 |
| Southern Co. | | 7,550 | 554,925 |
| Southwest Gas Holdings, Inc. | | 2,700 | 201,474 |
| T-Mobile U.S., Inc. | | 6,679 | 1,096,491 |
| Tapestry, Inc. | | 8,108 | 323,671 |
| Target Corp. | | 1,669 | 268,676 |
| The Boeing Co. (a) | | 200 | 33,568 |
| The Coca-Cola Co. | | 10,272 | 634,501 |
| The Travelers Companies, Inc. | | 3,936 | 835,062 |
| The Walt Disney Co. | | 6,600 | 733,260 |
| TJX Companies, Inc. | | 9,620 | 905,146 |
| U.S. Bancorp | | 11,900 | 483,497 |
| United Parcel Service, Inc. Class B | | 2,435 | 359,114 |
| UnitedHealth Group, Inc. | | 2,323 | 1,123,635 |
| Valero Energy Corp. | | 1,258 | 201,116 |
| Veralto Corp. | | 1,992 | 186,611 |
| Verizon Communications, Inc. | | 9,023 | 356,318 |
| Vistra Corp. | | 10,006 | 758,855 |
| Walmart, Inc. | | 10,540 | 625,549 |
| WEC Energy Group, Inc. | | 3,165 | 261,556 |
| Wells Fargo & Co. | | 23,327 | 1,383,758 |
TOTAL UNITED STATES OF AMERICA | | | 56,890,403 |
| Zambia - 0.3% | | | |
| First Quantum Minerals Ltd. | | 20,250 | 257,124 |
| TOTAL COMMON STOCKS (Cost $70,978,300) | | | 92,008,871 |
| | | | |
| Money Market Funds - 2.7% |
| | | Shares | Value ($) |
Fidelity Cash Central Fund 5.39% (e) (Cost $2,568,520) | | 2,568,006 | 2,568,520 |
| | | | |
| TOTAL INVESTMENT IN SECURITIES - 100.0% (Cost $73,546,820) | 94,577,391 |
NET OTHER ASSETS (LIABILITIES) - 0.0% | (12,449) |
| NET ASSETS - 100.0% | 94,564,942 |
| | |
Legend
| (c) | Restricted securities (including private placements) - Investment in securities not registered under the Securities Act of 1933 (excluding 144A issues). At the end of the period, the value of restricted securities (excluding 144A issues) amounted to $78,232 or 0.1% of net assets. |
| (d) | Security exempt from registration under Rule 144A of the Securities Act of 1933. These securities may be resold in transactions exempt from registration, normally to qualified institutional buyers. At the end of the period, the value of these securities amounted to $278,441 or 0.3% of net assets. |
| (e) | Affiliated fund that is generally available only to investment companies and other accounts managed by Fidelity Investments. The rate quoted is the annualized seven-day yield of the fund at period end. A complete unaudited listing of the fund's holdings as of its most recent quarter end is available upon request. In addition, each Fidelity Central Fund's financial statements are available on the SEC's website or upon request. |
| Additional information on each restricted holding is as follows: |
| Security | Acquisition Date | Acquisition Cost ($) |
| Starling Bank Ltd. Series D | 6/18/21 - 4/05/22 | 40,298 |
| | | |
Affiliated Central Funds
Fiscal year to date information regarding the Fund's investments in Fidelity Central Funds, including the ownership percentage, is presented below.
| Affiliate | Value, beginning of period ($) | Purchases ($) | Sales Proceeds ($) | Dividend Income ($) | Realized Gain (loss) ($) | Change in Unrealized appreciation (depreciation) ($) | Value, end of period ($) | % ownership, end of period |
| Fidelity Cash Central Fund 5.39% | 1,880,612 | 19,360,726 | 18,672,827 | 49,629 | 9 | - | 2,568,520 | 0.0% |
| Fidelity Securities Lending Cash Central Fund 5.39% | - | 1,681,483 | 1,681,483 | 160 | - | - | - | 0.0% |
| Total | 1,880,612 | 21,042,209 | 20,354,310 | 49,789 | 9 | - | 2,568,520 | |
| | | | | | | | | |
Amounts in the dividend income column in the above table include any capital gain distributions from underlying funds, which are presented in the corresponding line item in the Statement of Operations, if applicable.
Amounts in the dividend income column for Fidelity Securities Lending Cash Central Fund represents the income earned on investing cash collateral, less rebates paid to borrowers and any lending agent fees associated with the loan, plus any premium payments received for lending certain types of securities.
Amounts included in the purchases and sales proceeds columns may include in-kind transactions, if applicable.
Investment Valuation
The following is a summary of the inputs used, as of April 30, 2024, involving the Fund's assets and liabilities carried at fair value. The inputs or methodology used for valuing securities may not be an indication of the risk associated with investing in those securities. For more information on valuation inputs, and their aggregation into the levels used below, please refer to the Investment Valuation section in the accompanying Notes to Financial Statements.
| Valuation Inputs at Reporting Date: |
| Description | Total ($) | Level 1 ($) | Level 2 ($) | Level 3 ($) |
Investments in Securities: | | | | |
|
| Equities: | | | | |
Communication Services | 5,365,687 | 3,961,737 | 1,403,950 | - |
Consumer Discretionary | 8,576,969 | 4,498,234 | 4,078,735 | - |
Consumer Staples | 8,876,581 | 7,248,684 | 1,627,897 | - |
Energy | 4,804,848 | 4,804,848 | - | - |
Financials | 12,886,424 | 11,844,639 | 963,553 | 78,232 |
Health Care | 10,314,482 | 7,956,125 | 2,358,357 | - |
Industrials | 12,793,175 | 6,943,763 | 5,849,412 | - |
Information Technology | 18,691,582 | 14,156,624 | 4,534,958 | - |
Materials | 4,901,113 | 4,178,688 | 722,425 | - |
Real Estate | 1,077,618 | 1,077,618 | - | - |
Utilities | 3,720,392 | 3,720,392 | - | - |
|
| Money Market Funds | 2,568,520 | 2,568,520 | - | - |
| Total Investments in Securities: | 94,577,391 | 72,959,872 | 21,539,287 | 78,232 |
| Statement of Assets and Liabilities |
| | | | April 30, 2024 (Unaudited) |
| | | | | |
| Assets | | | | |
| Investment in securities, at value - See accompanying schedule: | | | | |
Unaffiliated issuers (cost $70,978,300) | $ | 92,008,871 | | |
Fidelity Central Funds (cost $2,568,520) | | 2,568,520 | | |
| | | | | |
| | | | | |
| Total Investment in Securities (cost $73,546,820) | | | $ | 94,577,391 |
| Foreign currency held at value (cost $7,615) | | | | 7,643 |
| Receivable for investments sold | | | | 4 |
| Receivable for fund shares sold | | | | 29,570 |
| Dividends receivable | | | | 123,605 |
| Reclaims receivable | | | | 78,391 |
| Distributions receivable from Fidelity Central Funds | | | | 11,628 |
| Prepaid expenses | | | | 36 |
| Receivable from investment adviser for expense reductions | | | | 28,094 |
Total assets | | | | 94,856,362 |
| Liabilities | | | | |
| Payable for investments purchased | $ | 65,428 | | |
| Payable for fund shares redeemed | | 100,426 | | |
| Accrued management fee | | 63,638 | | |
| Distribution and service plan fees payable | | 15,081 | | |
| Audit fee payable | | 41,722 | | |
| Other payables and accrued expenses | | 5,125 | | |
| Total liabilities | | | | 291,420 |
| Net Assets | | | $ | 94,564,942 |
| Net Assets consist of: | | | | |
| Paid in capital | | | $ | 73,340,272 |
| Total accumulated earnings (loss) | | | | 21,224,670 |
| Net Assets | | | $ | 94,564,942 |
| | | | | |
| Net Asset Value and Maximum Offering Price | | | | |
| Class A : | | | | |
Net Asset Value and redemption price per share ($22,617,264 ÷ 1,099,514 shares)(a) | | | $ | 20.57 |
| Maximum offering price per share (100/94.25 of $20.57) | | | $ | 21.82 |
| Class M : | | | | |
Net Asset Value and redemption price per share ($15,230,471 ÷ 741,179 shares)(a) | | | $ | 20.55 |
| Maximum offering price per share (100/96.50 of $20.55) | | | $ | 21.30 |
| Class C : | | | | |
Net Asset Value and offering price per share ($4,795,892 ÷ 235,970 shares)(a) | | | $ | 20.32 |
| Class I : | | | | |
Net Asset Value, offering price and redemption price per share ($15,392,822 ÷ 747,597 shares) | | | $ | 20.59 |
| Class Z : | | | | |
Net Asset Value, offering price and redemption price per share ($36,528,493 ÷ 1,760,711 shares) | | | $ | 20.75 |
(a)Redemption price per share is equal to net asset value less any applicable contingent deferred sales charge. |
| Statement of Operations |
| | | | Six months ended April 30, 2024 (Unaudited) |
| Investment Income | | | | |
| Dividends | | | $ | 1,070,482 |
| Income from Fidelity Central Funds (including $160 from security lending) | | | | 49,789 |
| Income before foreign taxes withheld | | | $ | 1,120,271 |
| Less foreign taxes withheld | | | | (51,654) |
| Total income | | | | 1,068,617 |
| Expenses | | | | |
| Management fee | $ | 358,210 | | |
| Transfer agent fees | | 40,194 | | |
| Distribution and service plan fees | | 86,987 | | |
| Accounting fees | | 16,888 | | |
| Custodian fees and expenses | | 9,599 | | |
| Independent trustees' fees and expenses | | 258 | | |
| Registration fees | | 61,113 | | |
| Audit | | 34,565 | | |
| Legal | | 677 | | |
| Miscellaneous | | 201 | | |
| Total expenses before reductions | | 608,692 | | |
| Expense reductions | | (32,912) | | |
| Total expenses after reductions | | | | 575,780 |
| Net Investment income (loss) | | | | 492,837 |
| Realized and Unrealized Gain (Loss) | | | | |
| Net realized gain (loss) on: | | | | |
| Investment Securities: | | | | |
| Unaffiliated issuers | | 1,541,045 | | |
| Fidelity Central Funds | | 9 | | |
| Foreign currency transactions | | (1,320) | | |
| Total net realized gain (loss) | | | | 1,539,734 |
| Change in net unrealized appreciation (depreciation) on: | | | | |
| Investment Securities: | | | | |
| Unaffiliated issuers (net of increase in deferred foreign taxes of $5,103) | | 14,073,329 | | |
| Assets and liabilities in foreign currencies | | (1,103) | | |
| Total change in net unrealized appreciation (depreciation) | | | | 14,072,226 |
| Net gain (loss) | | | | 15,611,960 |
| Net increase (decrease) in net assets resulting from operations | | | $ | 16,104,797 |
| Statement of Changes in Net Assets |
| |
| | Six months ended April 30, 2024 (Unaudited) | | Year ended October 31, 2023 |
| Increase (Decrease) in Net Assets | | | | |
| Operations | | | | |
| Net investment income (loss) | $ | 492,837 | $ | 1,146,560 |
| Net realized gain (loss) | | 1,539,734 | | (968,815) |
| Change in net unrealized appreciation (depreciation) | | 14,072,226 | | 2,150,099 |
| Net increase (decrease) in net assets resulting from operations | | 16,104,797 | | 2,327,844 |
| Distributions to shareholders | | (372,215) | | (1,156,098) |
| | | | | |
| Share transactions - net increase (decrease) | | (15,902,852) | | 37,571,402 |
| Total increase (decrease) in net assets | | (170,270) | | 38,743,148 |
| | | | | |
| Net Assets | | | | |
| Beginning of period | | 94,735,212 | | 55,992,064 |
| End of period | $ | 94,564,942 | $ | 94,735,212 |
| | | | | |
| | | | | |
Financial Highlights
Fidelity Advisor® Global Equity Income Fund Class A |
| |
| | Six months ended (Unaudited) April 30, 2024 | | Years ended October 31, 2023 | | 2022 | | 2021 | | 2020 | | 2019 |
Selected Per-Share Data | | | | | | | | | | | | |
| Net asset value, beginning of period | $ | 17.61 | $ | 17.01 | $ | 21.07 | $ | 15.95 | $ | 15.33 | $ | 13.86 |
| Income from Investment Operations | | | | | | | | | | | | |
Net investment income (loss) A,B | | .08 | | .20 | | .15 | | .10 | | .13 | | .19 |
| Net realized and unrealized gain (loss) | | 2.94 | | .61 | | (2.41) | | 5.32 | | .61 | | 1.76 |
| Total from investment operations | | 3.02 | | .81 | | (2.26) | | 5.42 | | .74 | | 1.95 |
| Distributions from net investment income | | (.06) | | (.21) | | (.11) | | (.10) C | | (.12) | | (.20) |
| Distributions from net realized gain | | - | | - | | (1.69) | | (.20) C | | - | | (.28) |
| Total distributions | | (.06) | | (.21) | | (1.80) | | (.30) | | (.12) | | (.48) |
| Net asset value, end of period | $ | 20.57 | $ | 17.61 | $ | 17.01 | $ | 21.07 | $ | 15.95 | $ | 15.33 |
Total Return D,E,F | | | | 4.71% | | (11.78)% | | 34.23% | | 4.87% | | 14.52% |
Ratios to Average Net Assets B,G,H | | | | | | | | | | | | |
| Expenses before reductions | | 1.37% I | | 1.40% | | 1.54% | | 1.72% | | 1.97% | | 2.18% |
| Expenses net of fee waivers, if any | | | | 1.29% | | 1.30% | | 1.34% | | 1.39% | | 1.45% |
| Expenses net of all reductions | | 1.29% I | | 1.29% | | 1.30% | | 1.34% | | 1.38% | | 1.45% |
| Net investment income (loss) | | .84% I | | 1.10% | | .81% | | .49% | | .81% | | 1.32% |
| Supplemental Data | | | | | | | | | | | | |
| Net assets, end of period (000 omitted) | $ | 22,617 | $ | 18,786 | $ | 16,093 | $ | 12,640 | $ | 8,362 | $ | 8,314 |
Portfolio turnover rate J | | | | 25% | | 17% | | 40% | | 52% | | 18% K |
ACalculated based on average shares outstanding during the period.
BNet investment income (loss) is affected by the timing of the declaration of dividends by any underlying mutual funds or exchange-traded funds (ETFs). Net investment income (loss) of any mutual funds or ETFs is not included in the Fund's net investment income (loss) ratio.
CThe amount shown reflects reclassifications related to book to tax differences that were made in the year shown.
DTotal returns for periods of less than one year are not annualized.
ETotal returns would have been lower if certain expenses had not been reduced during the applicable periods shown.
FTotal returns do not include the effect of the sales charges.
GFees and expenses of any underlying mutual funds or exchange-traded funds (ETFs) are not included in the Fund's expense ratio. The Fund indirectly bears its proportionate share of these expenses. For additional expense information related to investments in Fidelity Central Funds, please refer to the "Investments in Fidelity Central Funds" note found in the Notes to Financial Statements section of the most recent Annual or Semi-Annual report.
HExpense ratios reflect operating expenses of the class. Expenses before reductions do not reflect amounts reimbursed, waived, or reduced through arrangements with the investment adviser, brokerage services, or other offset arrangements, if applicable, and do not represent the amount paid by the class during periods when reimbursements, waivers or reductions occur.
IAnnualized.
JAmount does not include the portfolio activity of any underlying mutual funds or exchange-traded funds (ETFs).
KPortfolio turnover rate excludes securities received or delivered in-kind.
Fidelity Advisor® Global Equity Income Fund Class M |
| |
| | Six months ended (Unaudited) April 30, 2024 | | Years ended October 31, 2023 | | 2022 | | 2021 | | 2020 | | 2019 |
Selected Per-Share Data | | | | | | | | | | | | |
| Net asset value, beginning of period | $ | 17.59 | $ | 17.00 | $ | 21.05 | $ | 15.94 | $ | 15.32 | $ | 13.85 |
| Income from Investment Operations | | | | | | | | | | | | |
Net investment income (loss) A,B | | .06 | | .16 | | .10 | | .05 | | .09 | | .15 |
| Net realized and unrealized gain (loss) | | 2.94 | | .60 | | (2.40) | | 5.31 | | .61 | | 1.76 |
| Total from investment operations | | 3.00 | | .76 | | (2.30) | | 5.36 | | .70 | | 1.91 |
| Distributions from net investment income | | (.04) | | (.17) | | (.05) | | (.06) C | | (.08) | | (.16) |
| Distributions from net realized gain | | - | | - | | (1.69) | | (.20) C | | - | | (.28) |
| Total distributions | | (.04) | | (.17) | | (1.75) D | | (.25) D | | (.08) | | (.44) |
| Net asset value, end of period | $ | 20.55 | $ | 17.59 | $ | 17.00 | $ | 21.05 | $ | 15.94 | $ | 15.32 |
Total Return E,F,G | | | | 4.41% | | (11.98)% | | 33.89% | | 4.63% | | 14.23% |
Ratios to Average Net Assets B,H,I | | | | | | | | | | | | |
| Expenses before reductions | | 1.60% J | | 1.62% | | 1.76% | | 1.95% | | 2.24% | | 2.49% |
| Expenses net of fee waivers, if any | | | | 1.54% | | 1.55% | | 1.60% | | 1.64% | | 1.70% |
| Expenses net of all reductions | | 1.54% J | | 1.54% | | 1.55% | | 1.60% | | 1.63% | | 1.70% |
| Net investment income (loss) | | .59% J | | .85% | | .56% | | .23% | | .56% | | 1.07% |
| Supplemental Data | | | | | | | | | | | | |
| Net assets, end of period (000 omitted) | $ | 15,230 | $ | 12,430 | $ | 8,535 | $ | 8,442 | $ | 3,545 | $ | 3,135 |
Portfolio turnover rate K | | | | 25% | | 17% | | 40% | | 52% | | 18% L |
ACalculated based on average shares outstanding during the period.
BNet investment income (loss) is affected by the timing of the declaration of dividends by any underlying mutual funds or exchange-traded funds (ETFs). Net investment income (loss) of any mutual funds or ETFs is not included in the Fund's net investment income (loss) ratio.
CThe amount shown reflects reclassifications related to book to tax differences that were made in the year shown.
DTotal distributions per share do not sum due to rounding.
ETotal returns for periods of less than one year are not annualized.
FTotal returns would have been lower if certain expenses had not been reduced during the applicable periods shown.
GTotal returns do not include the effect of the sales charges.
HFees and expenses of any underlying mutual funds or exchange-traded funds (ETFs) are not included in the Fund's expense ratio. The Fund indirectly bears its proportionate share of these expenses. For additional expense information related to investments in Fidelity Central Funds, please refer to the "Investments in Fidelity Central Funds" note found in the Notes to Financial Statements section of the most recent Annual or Semi-Annual report.
IExpense ratios reflect operating expenses of the class. Expenses before reductions do not reflect amounts reimbursed, waived, or reduced through arrangements with the investment adviser, brokerage services, or other offset arrangements, if applicable, and do not represent the amount paid by the class during periods when reimbursements, waivers or reductions occur.
JAnnualized.
KAmount does not include the portfolio activity of any underlying mutual funds or exchange-traded funds (ETFs).
LPortfolio turnover rate excludes securities received or delivered in-kind.
Fidelity Advisor® Global Equity Income Fund Class C |
| |
| | Six months ended (Unaudited) April 30, 2024 | | Years ended October 31, 2023 | | 2022 | | 2021 | | 2020 | | 2019 |
Selected Per-Share Data | | | | | | | | | | | | |
| Net asset value, beginning of period | $ | 17.41 | $ | 16.82 | $ | 20.88 | $ | 15.84 | $ | 15.24 | $ | 13.77 |
| Income from Investment Operations | | | | | | | | | | | | |
Net investment income (loss) A,B | | .01 | | .06 | | .01 | | (.05) | | .01 | | .08 |
| Net realized and unrealized gain (loss) | | 2.90 | | .61 | | (2.39) | | 5.28 | | .62 | | 1.75 |
| Total from investment operations | | 2.91 | | .67 | | (2.38) | | 5.23 | | .63 | | 1.83 |
| Distributions from net investment income | | - | | (.08) | | (.02) | | - C,D | | (.03) | | (.09) |
| Distributions from net realized gain | | - | | - | | (1.66) | | (.19) C | | - | | (.28) |
| Total distributions | | - | | (.08) | | (1.68) | | (.19) | | (.03) | | (.36) E |
| Net asset value, end of period | $ | 20.32 | $ | 17.41 | $ | 16.82 | $ | 20.88 | $ | 15.84 | $ | 15.24 |
Total Return F,G,H | | | | 3.94% | | (12.46)% | | 33.22% | | 4.12% | | 13.71% |
Ratios to Average Net Assets A,I,J | | | | | | | | | | | | |
| Expenses before reductions | | 2.12% K | | 2.17% | | 2.31% | | 2.47% | | 2.75% | | 2.99% |
| Expenses net of fee waivers, if any | | | | 2.04% | | 2.05% | | 2.09% | | 2.14% | | 2.20% |
| Expenses net of all reductions | | 2.04% K | | 2.04% | | 2.05% | | 2.09% | | 2.13% | | 2.20% |
| Net investment income (loss) | | .09% K | | .35% | | .06% | | (.26)% | | .06% | | .57% |
| Supplemental Data | | | | | | | | | | | | |
| Net assets, end of period (000 omitted) | $ | 4,796 | $ | 4,313 | $ | 4,437 | $ | 5,891 | $ | 4,082 | $ | 4,173 |
Portfolio turnover rate L | | | | 25% | | 17% | | 40% | | 52% | | 18% M |
ANet investment income (loss) is affected by the timing of the declaration of dividends by any underlying mutual funds or exchange-traded funds (ETFs). Net investment income (loss) of any mutual funds or ETFs is not included in the Fund's net investment income (loss) ratio.
BCalculated based on average shares outstanding during the period.
CThe amount shown reflects reclassifications related to book to tax differences that were made in the year shown.
DAmount represents less than $.005 per share.
ETotal distributions per share do not sum due to rounding.
FTotal returns for periods of less than one year are not annualized.
GTotal returns would have been lower if certain expenses had not been reduced during the applicable periods shown.
HTotal returns do not include the effect of the contingent deferred sales charge.
IFees and expenses of any underlying mutual funds or exchange-traded funds (ETFs) are not included in the Fund's expense ratio. The Fund indirectly bears its proportionate share of these expenses. For additional expense information related to investments in Fidelity Central Funds, please refer to the "Investments in Fidelity Central Funds" note found in the Notes to Financial Statements section of the most recent Annual or Semi-Annual report.
JExpense ratios reflect operating expenses of the class. Expenses before reductions do not reflect amounts reimbursed, waived, or reduced through arrangements with the investment adviser, brokerage services, or other offset arrangements, if applicable, and do not represent the amount paid by the class during periods when reimbursements, waivers or reductions occur.
KAnnualized.
LAmount does not include the portfolio activity of any underlying mutual funds or exchange-traded funds (ETFs).
MPortfolio turnover rate excludes securities received or delivered in-kind.
Fidelity Advisor® Global Equity Income Fund Class I |
| |
| | Six months ended (Unaudited) April 30, 2024 | | Years ended October 31, 2023 | | 2022 | | 2021 | | 2020 | | 2019 |
Selected Per-Share Data | | | | | | | | | | | | |
| Net asset value, beginning of period | $ | 17.63 | $ | 17.03 | $ | 21.09 | $ | 15.96 | $ | 15.35 | $ | 13.88 |
| Income from Investment Operations | | | | | | | | | | | | |
Net investment income (loss) A,B | | .11 | | .25 | | .19 | | .15 | | .17 | | .22 |
| Net realized and unrealized gain (loss) | | 2.94 | | .60 | | (2.40) | | 5.32 | | .60 | | 1.77 |
| Total from investment operations | | 3.05 | | .85 | | (2.21) | | 5.47 | | .77 | | 1.99 |
| Distributions from net investment income | | (.09) | | (.25) | | (.15) | | (.15) C | | (.16) | | (.24) |
| Distributions from net realized gain | | - | | - | | (1.69) | | (.20) C | | - | | (.28) |
| Total distributions | | (.09) | | (.25) | | (1.85) D | | (.34) D | | (.16) | | (.52) |
| Net asset value, end of period | $ | 20.59 | $ | 17.63 | $ | 17.03 | $ | 21.09 | $ | 15.96 | $ | 15.35 |
Total Return E,F | | | | 4.96% | | (11.53)% | | 34.59% | | 5.08% | | 14.84% |
Ratios to Average Net Assets B,G,H | | | | | | | | | | | | |
| Expenses before reductions | | 1.09% I | | 1.11% | | 1.15% | | 1.37% | | 1.63% | | 1.83% |
| Expenses net of fee waivers, if any | | | | 1.05% | | 1.04% | | 1.07% | | 1.13% | | 1.20% |
| Expenses net of all reductions | | 1.04% I | | 1.05% | | 1.04% | | 1.07% | | 1.12% | | 1.20% |
| Net investment income (loss) | | 1.09% I | | 1.35% | | 1.06% | | .75% | | 1.06% | | 1.57% |
| Supplemental Data | | | | | | | | | | | | |
| Net assets, end of period (000 omitted) | $ | 15,393 | $ | 14,282 | $ | 16,953 | $ | 2,823 | $ | 2,378 | $ | 2,188 |
Portfolio turnover rate J | | | | 25% | | 17% | | 40% | | 52% | | 18% K |
ACalculated based on average shares outstanding during the period.
BNet investment income (loss) is affected by the timing of the declaration of dividends by any underlying mutual funds or exchange-traded funds (ETFs). Net investment income (loss) of any mutual funds or ETFs is not included in the Fund's net investment income (loss) ratio.
CThe amount shown reflects reclassifications related to book to tax differences that were made in the year shown.
DTotal distributions per share do not sum due to rounding.
ETotal returns for periods of less than one year are not annualized.
FTotal returns would have been lower if certain expenses had not been reduced during the applicable periods shown.
GFees and expenses of any underlying mutual funds or exchange-traded funds (ETFs) are not included in the Fund's expense ratio. The Fund indirectly bears its proportionate share of these expenses. For additional expense information related to investments in Fidelity Central Funds, please refer to the "Investments in Fidelity Central Funds" note found in the Notes to Financial Statements section of the most recent Annual or Semi-Annual report.
HExpense ratios reflect operating expenses of the class. Expenses before reductions do not reflect amounts reimbursed, waived, or reduced through arrangements with the investment adviser, brokerage services, or other offset arrangements, if applicable, and do not represent the amount paid by the class during periods when reimbursements, waivers or reductions occur.
IAnnualized.
JAmount does not include the portfolio activity of any underlying mutual funds or exchange-traded funds (ETFs).
KPortfolio turnover rate excludes securities received or delivered in-kind.
Fidelity Advisor® Global Equity Income Fund Class Z |
| |
| | Six months ended (Unaudited) April 30, 2024 | | Years ended October 31, 2023 | | 2022 | | 2021 | | 2020 | | 2019 |
Selected Per-Share Data | | | | | | | | | | | | |
| Net asset value, beginning of period | $ | 17.75 | $ | 17.13 | $ | 21.18 | $ | 16.01 | $ | 15.37 | $ | 13.88 |
| Income from Investment Operations | | | | | | | | | | | | |
Net investment income (loss) A,B | | .12 | | .28 | | .22 | | .18 | | .19 | | .25 |
| Net realized and unrealized gain (loss) | | 2.98 | | .60 | | (2.42) | | 5.34 | | .61 | | 1.76 |
| Total from investment operations | | 3.10 | | .88 | | (2.20) | | 5.52 | | .80 | | 2.01 |
| Distributions from net investment income | | (.10) | | (.26) | | (.16) | | (.15) C | | (.16) | | (.24) |
| Distributions from net realized gain | | - | | - | | (1.69) | | (.20) C | | - | | (.28) |
| Total distributions | | (.10) | | (.26) | | (1.85) | | (.35) | | (.16) | | (.52) |
| Net asset value, end of period | $ | 20.75 | $ | 17.75 | $ | 17.13 | $ | 21.18 | $ | 16.01 | $ | 15.37 |
Total Return D,E | | | | 5.09% | | (11.41)% | | 34.75% | | 5.29% | | 15.00% |
Ratios to Average Net Assets B,F,G | | | | | | | | | | | | |
| Expenses before reductions | | .96% H | | .97% | | 1.09% | | 1.29% | | 1.50% | | 1.37% |
| Expenses net of fee waivers, if any | | | | .89% | | .89% | | .93% | | .98% | | 1.04% |
| Expenses net of all reductions | | .89% H | | .89% | | .89% | | .93% | | .97% | | 1.04% |
| Net investment income (loss) | | 1.24% H | | 1.50% | | 1.21% | | .90% | | 1.21% | | 1.73% |
| Supplemental Data | | | | | | | | | | | | |
| Net assets, end of period (000 omitted) | $ | 36,528 | $ | 44,924 | $ | 9,974 | $ | 4,579 | $ | 3,354 | $ | 3,599 |
Portfolio turnover rate I | | | | 25% | | 17% | | 40% | | 52% | | 18% J |
ACalculated based on average shares outstanding during the period.
BNet investment income (loss) is affected by the timing of the declaration of dividends by any underlying mutual funds or exchange-traded funds (ETFs). Net investment income (loss) of any mutual funds or ETFs is not included in the Fund's net investment income (loss) ratio.
CThe amount shown reflects reclassifications related to book to tax differences that were made in the year shown.
DTotal returns for periods of less than one year are not annualized.
ETotal returns would have been lower if certain expenses had not been reduced during the applicable periods shown.
FFees and expenses of any underlying mutual funds or exchange-traded funds (ETFs) are not included in the Fund's expense ratio. The Fund indirectly bears its proportionate share of these expenses. For additional expense information related to investments in Fidelity Central Funds, please refer to the "Investments in Fidelity Central Funds" note found in the Notes to Financial Statements section of the most recent Annual or Semi-Annual report.
GExpense ratios reflect operating expenses of the class. Expenses before reductions do not reflect amounts reimbursed, waived, or reduced through arrangements with the investment adviser, brokerage services, or other offset arrangements, if applicable, and do not represent the amount paid by the class during periods when reimbursements, waivers or reductions occur.
HAnnualized.
IAmount does not include the portfolio activity of any underlying mutual funds or exchange-traded funds (ETFs).
JPortfolio turnover rate excludes securities received or delivered in-kind.
For the period ended April 30, 2024
1. Organization.
Fidelity Advisor Global Equity Income Fund (the Fund) is a fund of Fidelity Advisor Series VIII (the Trust) and is authorized to issue an unlimited number of shares. The Trust is registered under the Investment Company Act of 1940, as amended (the 1940 Act), as an open-end management investment company organized as a Massachusetts business trust. The Fund offers Class A, Class M, Class C, Class I and Class Z shares, each of which has equal rights as to assets and voting privileges. Class A, Class M, Class C, Class I and Class Z are Fidelity Advisor classes. Each class has exclusive voting rights with respect to matters that affect that class. Class C shares will automatically convert to Class A shares after a holding period of eight years from the initial date of purchase, with certain exceptions.
2. Investments in Fidelity Central Funds.
Funds may invest in Fidelity Central Funds, which are open-end investment companies generally available only to other investment companies and accounts managed by the investment adviser and its affiliates. The Schedule of Investments lists any Fidelity Central Funds held as an investment as of period end, but does not include the underlying holdings of each Fidelity Central Fund. An investing fund indirectly bears its proportionate share of the expenses of the underlying Fidelity Central Funds.
Based on its investment objective, each Fidelity Central Fund may invest or participate in various investment vehicles or strategies that are similar to those of the investing fund. These strategies are consistent with the investment objectives of the investing fund and may involve certain economic risks which may cause a decline in value of each of the Fidelity Central Funds and thus a decline in the value of the investing fund.
| Fidelity Central Fund | Investment Manager | Investment Objective | Investment Practices | Expense RatioA |
| Fidelity Money Market Central Funds | Fidelity Management & Research Company LLC (FMR) | Each fund seeks to obtain a high level of current income consistent with the preservation of capital and liquidity. | Short-term Investments | Less than .005% |
A Expenses expressed as a percentage of average net assets and are as of each underlying Central Fund's most recent annual or semi-annual shareholder report.
A complete unaudited list of holdings for each Fidelity Central Fund is available upon request or at the Securities and Exchange Commission website at www.sec.gov. In addition, the financial statements of the Fidelity Central Funds which contain the significant accounting policies (including investment valuation policies) of those funds, and are not covered by the Report of Independent Registered Public Accounting Firm, are available on the Securities and Exchange Commission website or upon request.
3. Significant Accounting Policies.
The Fund is an investment company and applies the accounting and reporting guidance of the Financial Accounting Standards Board (FASB) Accounting Standards Codification Topic 946 Financial Services - Investment Companies. The financial statements have been prepared in conformity with accounting principles generally accepted in the United States of America (GAAP), which require management to make certain estimates and assumptions at the date of the financial statements. Actual results could differ from those estimates. Subsequent events, if any, through the date that the financial statements were issued have been evaluated in the preparation of the financial statements. The Fund's Schedule of Investments lists any underlying mutual funds or exchange-traded funds (ETFs) but does not include the underlying holdings of these funds. The following summarizes the significant accounting policies of the Fund:
Investment Valuation. Investments are valued as of 4:00 p.m. Eastern time on the last calendar day of the period. The Board of Trustees (the Board) has designated the Fund's investment adviser as the valuation designee responsible for the fair valuation function and performing fair value determinations as needed. The investment adviser has established a Fair Value Committee (the Committee) to carry out the day-to-day fair valuation responsibilities and has adopted policies and procedures to govern the fair valuation process and the activities of the Committee. In accordance with these fair valuation policies and procedures, which have been approved by the Board, the Fund attempts to obtain prices from one or more third party pricing services or brokers to value its investments. When current market prices, quotations or currency exchange rates are not readily available or reliable, investments will be fair valued in good faith by the Committee, in accordance with the policies and procedures. Factors used in determining fair value vary by investment type and may include market or investment specific events, transaction data, estimated cash flows, and market observations of comparable investments. The frequency that the fair valuation procedures are used cannot be predicted and they may be utilized to a significant extent. The Committee manages the Fund's fair valuation practices and maintains the fair valuation policies and procedures. The Fund's investment adviser reports to the Board information regarding the fair valuation process and related material matters.
The Fund categorizes the inputs to valuation techniques used to value its investments into a disclosure hierarchy consisting of three levels as shown below:
Level 1 - unadjusted quoted prices in active markets for identical investments
Level 2 - other significant observable inputs (including quoted prices for similar investments, interest rates, prepayment speeds, etc.)
Level 3 - unobservable inputs (including the Fund's own assumptions based on the best information available)
Valuation techniques used to value the Fund's investments by major category are as follows:
Equity securities, including restricted securities, for which market quotations are readily available, are valued at the last reported sale price or official closing price as reported by a third party pricing service on the primary market or exchange on which they are traded and are categorized as Level 1 in the hierarchy. In the event there were no sales during the day or closing prices are not available, securities are valued at the last quoted bid price or may be valued using the last available price and are generally categorized as Level 2 in the hierarchy. For foreign equity securities, when market or security specific events arise, comparisons to the valuation of American Depositary Receipts (ADRs), futures contracts, Exchange-Traded Funds (ETFs) and certain indexes as well as quoted prices for similar securities may be used and would be categorized as Level 2 in the hierarchy. For equity securities, including restricted securities, where observable inputs are limited, assumptions about market activity and risk are used and these securities may be categorized as Level 3 in the hierarchy.
Investments in open-end mutual funds, including the Fidelity Central Funds, are valued at their closing net asset value (NAV) each business day and are categorized as Level 1 in the hierarchy.
Changes in valuation techniques may result in transfers in or out of an assigned level within the disclosure hierarchy. The aggregate value of investments by input level as of April 30, 2024 is included at the end of the Fund's Schedule of Investments.
Foreign Currency. Certain Funds may use foreign currency contracts to facilitate transactions in foreign-denominated securities. Gains and losses from these transactions may arise from changes in the value of the foreign currency or if the counterparties do not perform under the contracts' terms.
Foreign-denominated assets, including investment securities, and liabilities are translated into U.S. dollars at the exchange rates at period end. Purchases and sales of investment securities, income and dividends received, and expenses denominated in foreign currencies are translated into U.S. dollars at the exchange rate in effect on the transaction date.
The effects of exchange rate fluctuations on investments are included with the net realized and unrealized gain (loss) on investment securities. Other foreign currency transactions resulting in realized and unrealized gain (loss) are disclosed separately.
Investment Transactions and Income. For financial reporting purposes, the Fund's investment holdings and NAV include trades executed through the end of the last business day of the period. The NAV per share for processing shareholder transactions is calculated as of the close of business of the New York Stock Exchange (NYSE), normally 4:00 p.m. Eastern time and includes trades executed through the end of the prior business day. Gains and losses on securities sold are determined on the basis of identified cost. Commissions paid to certain brokers with whom the investment adviser, or its affiliates, places trades on behalf of a fund include an amount in addition to trade execution, which may be rebated back to a fund. Any such rebates are included in net realized gain (loss) on investments in the Statement of Operations. Dividend income is recorded on the ex-dividend date, except for certain dividends from foreign securities where the ex-dividend date may have passed, which are recorded as soon as the Fund is informed of the ex-dividend date. Non-cash dividends included in dividend income, if any, are recorded at the fair market value of the securities received. Income and capital gain distributions from Fidelity Central Funds, if any, are recorded on the ex-dividend date. Certain distributions received by the Fund represent a return of capital or capital gain. The Fund determines the components of these distributions subsequent to the ex-dividend date, based upon receipt of tax filings or other correspondence relating to the underlying investment. These distributions are recorded as a reduction of cost of investments and/or as a realized gain. Investment income is recorded net of foreign taxes withheld where recovery of such taxes is uncertain. Funds may file withholding tax reclaims in certain jurisdictions to recover a portion of amounts previously withheld. Any withholding tax reclaims income is included in the Statement of Operations in foreign taxes withheld. Any receivables for withholding tax reclaims are included in the Statement of Assets and Liabilities in reclaims receivable.
Class Allocations and Expenses. Investment income, realized and unrealized capital gains and losses, common expenses of a fund, and certain fund-level expense reductions, if any, are allocated daily on a pro-rata basis to each class based on the relative net assets of each class to the total net assets of a fund. Each class differs with respect to transfer agent and distribution and service plan fees incurred, as applicable. Certain expense reductions may also differ by class, if applicable. For the reporting period, the allocated portion of income and expenses to each class as a percent of its average net assets may vary due to the timing of recording these transactions in relation to fluctuating net assets of the classes. Expenses directly attributable to a fund are charged to that fund. Expenses attributable to more than one fund are allocated among the respective funds on the basis of relative net assets or other appropriate methods. Expenses included in the accompanying financial statements reflect the expenses of that fund and do not include any expenses associated with any underlying mutual funds or exchange-traded funds (ETFs). Although not included in a fund's expenses, a fund indirectly bears its proportionate share of these expenses through the net asset value of each underlying mutual fund or exchange-traded fund (ETF). Expense estimates are accrued in the period to which they relate and adjustments are made when actual amounts are known.
Income Tax Information and Distributions to Shareholders. Each year, the Fund intends to qualify as a regulated investment company under Subchapter M of the Internal Revenue Code, including distributing substantially all of its taxable income and realized gains. As a result, no provision for U.S. Federal income taxes is required. The Fund files a U.S. federal tax return, in addition to state and local tax returns as required. The Fund's federal income tax returns are subject to examination by the Internal Revenue Service (IRS) for a period of three fiscal years after they are filed. State and local tax returns may be subject to examination for an additional fiscal year depending on the jurisdiction. Foreign taxes are provided for based on the Fund's understanding of the tax rules and rates that exist in the foreign markets in which it invests. The Fund is subject to a tax imposed on capital gains by certain countries in which it invests. An estimated deferred tax liability for net unrealized appreciation on the applicable securities is included in Other payables and accrued expenses on the Statement of Assets & Liabilities.
Distributions are declared and recorded on the ex-dividend date. Income and capital gain distributions are declared separately for each class. Income and capital gain distributions are determined in accordance with income tax regulations, which may differ from GAAP.
Capital accounts within the financial statements are adjusted for permanent book-tax differences. These adjustments have no impact on net assets or the results of operations. Capital accounts are not adjusted for temporary book-tax differences which will reverse in a subsequent period.
Book-tax differences are primarily due to foreign currency transactions, certain foreign taxes, passive foreign investment companies (PFIC), capital loss carryforwards and losses deferred due to wash sales.
As of period end, the cost and unrealized appreciation (depreciation) in securities, and derivatives if applicable, for federal income tax purposes were as follows:
| Gross unrealized appreciation | $23,622,633 |
| Gross unrealized depreciation | (2,849,814) |
| Net unrealized appreciation (depreciation) | $20,772,819 |
| Tax cost | $73,804,572 |
Capital loss carryforwards are only available to offset future capital gains of the Fund to the extent provided by regulations and may be limited. The capital loss carryforward information presented below, including any applicable limitation, is estimated as of prior fiscal period end and is subject to adjustment.
Short-term | $(1,012,416) |
Long-term | (334,711) |
| Total capital loss carryforward | $(1,347,127) |
Restricted Securities (including Private Placements). Funds may invest in securities that are subject to legal or contractual restrictions on resale. These securities generally may be resold in transactions exempt from registration or to the public if the securities are registered. Disposal of these securities may involve time-consuming negotiations and expense, and prompt sale at an acceptable price may be difficult. Information regarding restricted securities held at period end is included at the end of the Schedule of Investments, if applicable.
4. Purchases and Sales of Investments.
Purchases and sales of securities, other than short-term securities and in-kind transactions, as applicable, are noted in the table below.
| | Purchases ($) | Sales ($) |
| Fidelity Advisor Global Equity Income Fund | 13,875,836 | 31,470,554 |
5. Fees and Other Transactions with Affiliates.
Management Fee. Fidelity Management & Research Company LLC (the investment adviser) and its affiliates provide the Fund with investment management related services for which the Fund pays a monthly management fee.
Effective March 1, 2024, the Fund's management contract was amended to incorporate administrative services previously covered under separate services agreements (Transfer Agent and Accounting agreements). The amended contract incorporates a management fee rate that may vary by class. The investment adviser or an affiliate pays certain expenses of managing and operating the Fund out of each class's management fee. Each class of the Fund pays a management fee to the investment adviser. The management fee is calculated and paid to the investment adviser every month. When determining a class's management fee, a mandate rate is calculated based on the monthly average net assets of a group of funds advised by FMR within a designated asset class. A discount rate is subtracted from the mandate rate once the Fund's monthly average net assets reach a certain level. The mandate rate and discount rate may vary by class. The annual management fee rate for a class of shares of the Fund is the lesser of (1) the class's mandate rate reduced by the class's discount rate (if applicable) or (2) the amount set forth in the following table.
| | Maximum Management Fee Rate % |
| Class A | 0.88 |
| Class M | 0.86 |
| Class C | 0.88 |
| Class I | 0.85 |
| Class Z | 0.72 |
One-twelfth of the management fee rate for a class is applied to the average net assets of the class for the month, giving a dollar amount which is the management fee for the class for that month. A different management fee rate may be applicable to each class of the Fund. The difference between classes is the result of separate arrangements for class-level services and/or waivers of certain expenses. It is not the result of any difference in advisory or custodial fees or other expenses related to the management of the Fund's assets, which do not vary by class. For the portion of the reporting period on or after March 1, 2024, the total annualized management fee rates were as follows:
| | Total Management Fee Rate % |
| Class A | .87 |
| Class M | .86 |
| Class C | .87 |
| Class I | .85 |
| Class Z | .72 |
Prior to March 1, 2024, the management fee was the sum of an individual fund fee rate that was based on an annual rate of .45% of the Fund's average net assets and an annualized group fee rate that averaged .22% during the period. The group fee rate was based upon the monthly average net assets of a group of registered investment companies with which the investment adviser has management contracts. The group fee rate decreased as assets under management increased and increased as assets under management decreased. For the portion of the reporting period prior to March 1, 2024, the total annualized management fee rate was .67%.
Effective March 1, 2024, the Fund's sub-advisory agreements with FMR Investment Management (UK) Limited, Fidelity Management & Research (Hong Kong) Limited, and Fidelity Management & Research (Japan) Limited were amended to provide that the investment adviser pays each sub-adviser monthly fees equal to 110% of the sub-adviser's costs for providing sub-advisory services.
Effective March 1, 2024, the Fund's sub-advisory agreement with FIL Investment Advisors (FIA) was amended to provide that the investment adviser pays FIA monthly fees at an annual rate of 0.38% with respect to the average daily net assets of the Fund managed by FIA. FIA in turn pays FIA(UK).
Distribution and Service Plan Fees. In accordance with Rule 12b-1 of the 1940 Act, the Fund has adopted separate Distribution and Service Plans for each class of shares. Certain classes pay Fidelity Distributors Company LLC (FDC), an affiliate of the investment adviser, separate Distribution and Service Fees, each of which is based on an annual percentage of each class' average net assets. In addition, FDC may pay financial intermediaries for selling shares of the Fund and providing shareholder support services. For the period, the Distribution and Service Fee rates, total fees and amounts retained by FDC were as follows:
| | Distribution Fee | Service Fee | Total Fees ($) | Retained by FDC ($) |
| Class A | - % | .25% | 27,014 | 2,166 |
| Class M | .25% | .25% | 36,214 | 163 |
| Class C | .75% | .25% | 23,759 | 4,316 |
| | | | 86,987 | 6,645 |
Sales Load. FDC may receive a front-end sales charge of up to 5.75% for selling Class A shares and 3.50% for selling Class M shares, some of which is paid to financial intermediaries for selling shares of the Fund. Depending on the holding period, FDC may receive contingent deferred sales charges levied on Class A, Class M and Class C redemptions. The deferred sales charges are 1.00% for Class C shares, 1.00% for certain purchases of Class A shares and .25% for certain purchases of Class M shares.
For the period, sales charge amounts retained by FDC were as follows:
| | Retained by FDC ($) |
| Class A | 2,066 |
| Class M | 393 |
Class CA | 63 |
| | 2,522 |
A When Class C shares are initially sold, FDC pays commissions from its own resources to financial intermediaries through which the sales are made.
Transfer Agent Fees. Fidelity Investments Institutional Operations Company LLC (FIIOC), an affiliate of the investment adviser, is the transfer, dividend disbursing and shareholder servicing agent for each class of the Fund. Effective March 1, 2024, the Fund's management contract was amended to incorporate transfer agent services and associated fees previously covered under a separate services agreement. FIIOC pays for typesetting, printing and mailing of shareholder reports, except proxy statements.
During November 2023, the Board approved a change in the transfer agent fees effective December 1, 2023 to a fixed annual rate of class-level average net assets as follows:
| | % of Class-Level Average Net Assets |
| Class A | 0.2000 |
| Class M | 0.1768 |
| Class C | 0.2000 |
| Class I | 0.1644 |
Prior to December 1, 2023, FIIOC received account fees and asset-based fees that varied according to the account size and type of account of the shareholders of the respective classes of the Fund, except for Class Z. FIIOC received an asset-based fee of Class Z's average net assets. For the portion of the reporting period prior to March 1, 2024, the fees were equivalent to the following annualized rates:
| | Amount ($) | % of Class-Level Average Net AssetsA |
| Class A | 14,029 | .20 |
| Class M | 8,346 | .18 |
| Class C | 3,166 | .20 |
| Class I | 8,103 | .16 |
| Class Z | 6,550 | .04 |
| | 40,194 | |
A Annualized
Accounting Fees. Fidelity Service Company, Inc. (FSC), an affiliate of the investment adviser, maintains the Fund's accounting records. Effective March 1, 2024, the Fund's management contract was amended to incorporate accounting services and associated fees previously covered under a separate services agreement.
During November 2023, the Board approved a change in the accounting fees effective December 1, 2023 to a fixed annual rate of average net assets as follows:
| | % of Average Net Assets |
| Fidelity Advisor Global Equity Income Fund | 0.0497 |
Prior to December 1, 2023, the accounting fee was based on the level of average net assets for each month. For the portion of the reporting period prior to March 1, 2024, the fees were equivalent to the following annualized rates:
| | % of Average Net Assets |
| Fidelity Advisor Global Equity Income Fund | .05 |
Brokerage Commissions. A portion of portfolio transactions were placed with brokerage firms which are affiliates of the investment adviser. Brokerage commissions are included in net realized gain (loss) and change in net unrealized appreciation (depreciation) in the Statement of Operations. The commissions paid to these affiliated firms were as follows:
| | Amount ($) |
| Fidelity Advisor Global Equity Income Fund | 156 |
Interfund Trades. Funds may purchase from or sell securities to other Fidelity Funds under procedures adopted by the Board. The procedures have been designed to ensure these interfund trades are executed in accordance with Rule 17a-7 of the 1940 Act. Any interfund trades are included within the respective purchases and sales amounts shown in the Purchases and Sales of Investments note. Interfund trades during the period are noted in the table below.
| | Purchases ($) | Sales ($) | Realized Gain (Loss)($) |
| Fidelity Advisor Global Equity Income Fund | 1,010,583 | 3,610,331 | 90,077 |
6. Committed Line of Credit.
Certain Funds participate with other funds managed by the investment adviser or an affiliate in a $4.25 billion credit facility (the "line of credit") to be utilized for temporary or emergency purposes to fund shareholder redemptions or for other short-term liquidity purposes. The participating funds have agreed to pay commitment fees on their pro-rata portion of the line of credit, which are reflected in Miscellaneous expenses on the Statement of Operations, and are listed below. During the period, there were no borrowings on this line of credit.
| Amount ($) |
| Fidelity Advisor Global Equity Income Fund | 93 |
7. Security Lending.
Funds lend portfolio securities from time to time in order to earn additional income. Lending agents are used, including National Financial Services (NFS), an affiliate of the investment adviser. Pursuant to a securities lending agreement, NFS will receive a fee, which is capped at 9.9% of a fund's daily lending revenue, for its services as lending agent. A fund may lend securities to certain qualified borrowers, including NFS. On the settlement date of the loan, a fund receives collateral (in the form of U.S. Treasury obligations, letters of credit and/or cash) against the loaned securities and maintains collateral in an amount not less than 100% of the market value of the loaned securities during the period of the loan. The market value of the loaned securities is determined at the close of business of a fund and any additional required collateral is delivered to a fund on the next business day. A fund or borrower may terminate the loan at any time, and if the borrower defaults on its obligation to return the securities loaned because of insolvency or other reasons, a fund may apply collateral received from the borrower against the obligation. A fund may experience delays and costs in recovering the securities loaned. Any cash collateral received is invested in the Fidelity Securities Lending Cash Central Fund. Any loaned securities are identified as such in the Schedule of Investments, and the value of loaned securities and cash collateral at period end, as applicable, are presented in the Statement of Assets and Liabilities. Security lending income represents the income earned on investing cash collateral, less rebates paid to borrowers and any lending agent fees associated with the loan, plus any premium payments received for lending certain types of securities. Security lending income is presented in the Statement of Operations as a component of income from Fidelity Central Funds. Affiliated security lending activity, if any, was as follows:
| | Total Security Lending Fees Paid to NFS ($) | Security Lending Income From Securities Loaned to NFS ($) | Value of Securities Loaned to NFS at Period End ($) |
| Fidelity Advisor Global Equity Income Fund | 17 | - | - |
8. Expense Reductions.
The investment adviser contractually agreed to reimburse expenses of each class to the extent annual operating expenses exceeded certain levels of class-level average net assets as noted in the table below. This reimbursement will remain in place through February 28, 2025. Some expenses, for example the compensation of the independent Trustees, and certain miscellaneous expenses such as proxy and shareholder meeting expenses, are excluded from this reimbursement.
The following classes were in reimbursement during the period:
| | Expense Limitations | Reimbursement ($) |
| Class A | 1.30% | 7,873 |
| Class M | 1.55% | 3,975 |
| Class C | 2.05% | 1,702 |
| Class I | 1.05% | 2,785 |
| Class Z | .90% | 11,982 |
| | | 28,317 |
In addition, during the period the investment adviser or an affiliate reimbursed and/or waived a portion of fund-level operating expenses in the amount of $4,595.
9. Distributions to Shareholders.
Distributions to shareholders of each class were as follows:
| | Six months ended April 30, 2024 | Year ended October 31, 2023 |
| Fidelity Advisor Global Equity Income Fund | | |
| Distributions to shareholders | | |
| Class A | $68,337 | $214,532 |
| Class M | 28,874 | 103,575 |
| Class C | - | 18,505 |
| Class I | 68,738 | 291,932 |
| Class Z | 206,266 | 527,554 |
Total | $372,215 | $1,156,098 |
10. Share Transactions.
Share transactions for each class were as follows and may contain in-kind transactions, automatic conversions between classes or exchanges between affiliated funds:
| | Shares | Shares | Dollars | Dollars |
| | Six months ended April 30, 2024 | Year ended October 31, 2023 | Six months ended April 30, 2024 | Year ended October 31, 2023 |
| Fidelity Advisor Global Equity Income Fund | | | | |
| Class A | | | | |
| Shares sold | 96,799 | 417,192 | $1,911,439 | $7,613,221 |
| Reinvestment of distributions | 3,411 | 11,701 | 67,822 | 214,004 |
| Shares redeemed | (67,546) | (308,132) | (1,349,086) | (5,632,749) |
| Net increase (decrease) | 32,664 | 120,761 | $630,175 | $2,194,476 |
| Class M | | | | |
| Shares sold | 71,535 | 277,079 | $1,423,250 | $5,046,852 |
| Reinvestment of distributions | 1,457 | 5,646 | 28,837 | 103,558 |
| Shares redeemed | (38,344) | (78,376) | (777,190) | (1,420,621) |
| Net increase (decrease) | 34,648 | 204,349 | $674,897 | $3,729,789 |
| Class C | | | | |
| Shares sold | 18,428 | 57,136 | $359,622 | $1,042,747 |
| Reinvestment of distributions | - | 1,009 | - | 18,498 |
| Shares redeemed | (30,233) | (74,169) | (592,009) | (1,330,726) |
| Net increase (decrease) | (11,805) | (16,024) | $(232,387) | $(269,481) |
| Class I | | | | |
| Shares sold | 68,656 | 1,260,460 | $1,377,539 | $22,822,669 |
| Reinvestment of distributions | 2,677 | 13,415 | 53,009 | 244,927 |
| Shares redeemed | (133,984) | (1,459,343) | (2,692,792) | (26,791,245) |
| Net increase (decrease) | (62,651) | (185,468) | $(1,262,244) | $(3,723,649) |
| Class Z | | | | |
| Shares sold | 261,749 | 2,511,253 | $5,272,705 | $45,972,252 |
| Reinvestment of distributions | 10,020 | 27,802 | 199,258 | 513,800 |
| Shares redeemed | (1,041,319) | (591,088) | (21,185,256) | (10,845,785) |
| Net increase (decrease) | (769,550) | 1,947,967 | $(15,713,293) | $35,640,267 |
11. Other.
A fund's organizational documents provide former and current trustees and officers with a limited indemnification against liabilities arising in connection with the performance of their duties to the fund. In the normal course of business, a fund may also enter into contracts that provide general indemnifications. A fund's maximum exposure under these arrangements is unknown as this would be dependent on future claims that may be made against a fund. The risk of material loss from such claims is considered remote.
12. Risk and Uncertainties.
Many factors affect a fund's performance. Developments that disrupt global economies and financial markets, such as pandemics, epidemics, outbreaks of infectious diseases, war, terrorism, and environmental disasters, may significantly affect a fund's investment performance. The effects of these developments to a fund will be impacted by the types of securities in which a fund invests, the financial condition, industry, economic sector, and geographic location of an issuer, and a fund's level of investment in the securities of that issuer. Significant concentrations in security types, issuers, industries, sectors, and geographic locations may magnify the factors that affect a fund's performance.
As a shareholder, you incur two types of costs: (1) transaction costs, which may include sales charges (loads) on purchase payments or redemption proceeds, as applicable and (2) ongoing costs, which generally include management fees, distribution and/or service (12b-1) fees and other Fund expenses. This Example is intended to help you understand your ongoing costs (in dollars) of investing in a fund and to compare these costs with the ongoing costs of investing in other mutual funds.
| The Example is based on an investment of $1,000 invested at the beginning of the period and held for the entire period (November 1, 2023 to April 30, 2024). |
Actual Expenses
The first line of the accompanying table provides information about actual account values and actual expenses. You may use the information in this line, together with the amount you invested, to estimate the expenses that you paid over the period. Simply divide your account value by $1,000.00 (for example, an $8,600 account value divided by $1,000.00 = 8.6), then multiply the result by the number in the first line for a class/Fund under the heading entitled "Expenses Paid During Period" to estimate the expenses you paid on your account during this period. If any fund is a shareholder of any underlying mutual funds or exchange-traded funds (ETFs) (the Underlying Funds), such fund indirectly bears its proportional share of the expenses of the Underlying Funds in addition to the direct expenses incurred presented in the table. These fees and expenses are not included in the annualized expense ratio used to calculate the expense estimate in the table below.
Hypothetical Example for Comparison Purposes
The second line of the accompanying table provides information about hypothetical account values and hypothetical expenses based on the actual expense ratio and an assumed rate of return of 5% per year before expenses, which is not the actual return. The hypothetical account values and expenses may not be used to estimate the actual ending account balance or expenses you paid for the period. You may use this information to compare the ongoing costs of investing in the Fund and other funds. To do so, compare this 5% hypothetical example with the 5% hypothetical examples that appear in the shareholder reports of the other funds. If any fund is a shareholder of any Underlying Funds, such fund indirectly bears its proportional share of the expenses of the Underlying Funds in addition to the direct expenses as presented in the table. These fees and expenses are not included in the annualized expense ratio used to calculate the expense estimate in the table below.
Please note that the expenses shown in the table are meant to highlight your ongoing costs only and do not reflect any transaction costs. Therefore, the second line of the table is useful in comparing ongoing costs only, and will not help you determine the relative total costs of owning different funds. In addition, if these transactional costs were included, your costs would have been higher.
| | | | | Annualized Expense Ratio- A | | Beginning Account Value November 1, 2023 | | Ending Account Value April 30, 2024 | | Expenses Paid During Period- C November 1, 2023 to April 30, 2024 |
| Fidelity Advisor® Global Equity Income Fund | | | | | | | | | | |
| Class A | | | | 1.29% | | | | | | |
| Actual | | | | | | $ 1,000 | | $ 1,171.80 | | $ 6.97 |
Hypothetical-B | | | | | | $ 1,000 | | $ 1,018.45 | | $ 6.47 |
Class M ** | | | | 1.54% | | | | | | |
| Actual | | | | | | $ 1,000 | | $ 1,170.60 | | $ 8.31 |
Hypothetical-B | | | | | | $ 1,000 | | $ 1,017.21 | | $ 7.72 |
| Class C | | | | 2.04% | | | | | | |
| Actual | | | | | | $ 1,000 | | $ 1,167.10 | | $ 10.99 |
Hypothetical-B | | | | | | $ 1,000 | | $ 1,014.72 | | $ 10.22 |
| Class I | | | | 1.04% | | | | | | |
| Actual | | | | | | $ 1,000 | | $ 1,173.10 | | $ 5.62 |
Hypothetical-B | | | | | | $ 1,000 | | $ 1,019.69 | | $ 5.22 |
| Class Z | | | | .89% | | | | | | |
| Actual | | | | | | $ 1,000 | | $ 1,174.70 | | $ 4.81 |
Hypothetical-B | | | | | | $ 1,000 | | $ 1,020.44 | | $ 4.47 |
| |
A Annualized expense ratio reflects expenses net of applicable fee waivers.
B 5% return per year before expenses
C Expenses are equal to the annualized expense ratio, multiplied by the average account value over the period, multiplied by 182/ 366 (to reflect the one-half year period). The fees and expenses of any Underlying Funds are not included in each annualized expense ratio.
** If fees and changes to the expense contract and/or expense cap, effective March 1, 2024, had been in effect during the entire current period, the restated annualized expense ratio and the expenses paid in the actual and hypothetical examples above would have been as shown in table below:
| | | | | Annualized Expense Ratio- A | | Expenses Paid |
| Fidelity Advisor® Global Equity Income Fund | | | | | | |
| Class M | | | | 1.32% | | |
| Actual | | | | | | $ 7.13 |
Hypothetical- B | | | | | | $ 6.62 |
| | | | | | | |
| A Annualized expense ratio reflects expenses net of applicable fee waivers. | | | | | | |
| B 5% return per year before expenses | | | | | | |
Board Approval of Investment Advisory Contracts
Fidelity Advisor Global Equity Income Fund
At its January 2024 meeting, the Board of Trustees, including the Independent Trustees (together, the Board), approved an amended and restated management contract with Fidelity Management & Research Company LLC (FMR) (the Management Contract), and amended and restated sub-advisory agreements (the Sub-Advisory Contracts, and together with the Management Contract, the Advisory Contracts) for the fund, including the fund's sub-advisory agreements with FMR Investment Management (UK) Limited (FMR UK), Fidelity Management & Research (Hong Kong) Limited (FMR H.K.), Fidelity Management & Research (Japan) Limited (FMR Japan), and FIL Investment Advisors (FIL). The Advisory Contracts will be effective March 1, 2024. The Board will consider the annual renewal of the fund's Advisory Contracts in May 2024, following its review of additional materials provided by FMR.
Management Contract. The Board approved the Management Contract, which implements a new fee structure combining the management fee, transfer agent fee (TA Fee), and pricing and bookkeeping fee (P&B Fee) of the fund and each class into a single class-level fee based on tiered schedules and subject to a maximum class-level rate (the Unified Fee). In exchange for the Unified Fee, the fund will receive investment advisory, management, administrative, transfer agent, pricing and bookkeeping services under a single agreement - the Management Contract.
In its consideration of the Management Contract over several meetings, the Board received, reviewed and discussed a comprehensive set of analyses regarding the Unified Fee including (i) the legal framework, (ii) design goals for the Unified Fee, (iii) calculation methodology for the Unified Fee and illustrative examples, (iv) annual and cumulative projected impacts under various scenarios, both in the aggregate and at the fund/class level, (v) explanations of schedules, rate levers and maximum rates and (vi) shareholder benefits and projected savings.
The Board considered that the maximum Unified Fee for each class of the fund would be no higher than the sum of (i) the lowest contractual management fee rate under the fund's existing management contract, which is the individual fund fee rate, if any, plus the lowest contractual marginal group fee rate and (ii) the TA and P&B Fee rates, which are fixed fee rates since December 1, 2023 (together, the Unified Fee Cap). The Board noted that Fidelity has represented that, as a result of this Unified Fee Cap, the Unified Fee would be no greater than the fee rates previously authorized to be charged to the fund for the same services. The Board noted that certain expenses such as third-party expenses, Rule 12b-1 fees, and certain other miscellaneous expenses would be outside the scope of the Unified Fee and the calculation of such fees would not change as a result of the Unified Fee. The Board considered that, under the Management Contract, a different management fee rate will be applicable to each class of the fund. The Board noted that Fidelity has represented that the difference in expenses between classes is based on differences in class-specific expenses and not due to any difference in advisory or third-party custodial fees or other expenses related to the management of the fund's assets.
The Board considered Fidelity's representations that implementation of the Unified Fee, which includes the Unified Fee Cap, would cause all funds subject to the Unified Fee, including the fund, to experience an immediate reduction on contractual fee rates for services provided under the current management contracts. The Board considered that some funds would not experience lower net total fees as a result of existing fee caps. The Board further considered that, in addition to the contractual fee savings, the Unified Fee offers funds and their shareholders greater protection from future rate increases for services previously offered under separate agreements that are now covered by the Management Contract because such rate increases would require shareholder approval.
Sub-Advisory Contracts. In connection with the Unified Fee changes, the Board considered the Sub-Advisory Contracts, which simplified the calculation of the fees paid by FMR to the sub-advisers under the agreements. The Board noted that the agreements with FMR UK, FMR H.K., and FMR Japan were amended to provide that FMR will compensate each sub-adviser at a fee rate equal to 110% of the sub-adviser's costs incurred in providing services under the agreement. The Board further noted that the agreement with FIL was amended to provide that FMR will compensate FIL at a flat fee rate of 0.38% of the net assets sub-advised by it. The Board considered that, under the Sub-Advisory Contracts, FMR, and not the fund, will continue to pay the sub-advisory fees to each applicable sub-adviser.
The Board further considered that the approval of the fund's Advisory Contracts will not result in any changes in the investment process or strategies employed in the management of the fund's assets or the day-to-day management of the fund or the persons primarily responsible for such management. Further, the Board considered that the Management Contract would not change the obligations and services of FMR and its affiliates on behalf of the fund, and, in particular, there would be no change in the nature and level of advisory, management, administration, transfer agent, and pricing and bookkeeping services provided to the fund by FMR, its affiliates, and each applicable sub-adviser.
In connection with its consideration of future renewals of the fund's Advisory Contracts, the Board will consider: (i) the nature, extent and quality of services provided to the funds, including shareholder and administrative services and investment performance; (ii) the competitiveness of the management fee and total expenses for the fund; (iii) the costs of the services and profitability, including the revenues earned and the expenses incurred in conducting the business of developing, marketing, distributing, managing, administering, and servicing the fund and its shareholders, to the extent applicable; and (iv) whether there have been economies of scale in respect of the Fidelity funds, whether the Fidelity funds (including the fund) have appropriately benefited from any such economies of scale, and whether there is the potential for realization of any further economies.
Based on its evaluation of all of the conclusions and representations noted above, and after considering all factors it believed relevant, the Board concluded that the fund's management fee structure is fair and reasonable, and that the fund's Advisory Contracts should be approved.
The Securities and Exchange Commission adopted Rule 22e-4 under the Investment Company Act of 1940 (the Liquidity Rule) to promote effective liquidity risk management throughout the open-end investment company industry, thereby reducing the risk that funds will be unable to meet their redemption obligations and mitigating dilution of the interests of fund shareholders.
The Fund has adopted and implemented a liquidity risk management program (the Program) reasonably designed to assess and manage the Fund's liquidity risk and to comply with the requirements of the Liquidity Rule. The Fund's Board of Trustees (the Board) has designated the Fund's investment adviser as administrator of the Program. The Fidelity advisers have established a Liquidity Risk Management Committee (the LRM Committee) to manage the Program for each of the Fidelity Funds. The LRM Committee monitors the adequacy and effectiveness of implementation of the Program and on a periodic basis assesses each Fund's liquidity risk based on a variety of factors including (1) the Fund's investment strategy, (2) portfolio liquidity and cash flow projections during normal and reasonably foreseeable stressed conditions, (3) shareholder redemptions, (4) borrowings and other funding sources and (5) certain factors specific to ETFs including the effect of the Fund's prices and spreads, market participants, and basket compositions on the overall liquidity of the Fund's portfolio, as applicable.
In accordance with the Program, each of the Fund's portfolio investments is classified into one of four defined liquidity categories based on a determination of a reasonable expectation for how long it would take to convert the investment to cash (or sell or dispose of the investment) without significantly changing its market value.
- Highly liquid investments - cash or convertible to cash within three business days or less
- Moderately liquid investments - convertible to cash in three to seven calendar days
- Less liquid investments - can be sold or disposed of, but not settled, within seven calendar days
- Illiquid investments - cannot be sold or disposed of within seven calendar days
Liquidity classification determinations take into account a variety of factors including various market, trading and investment-specific considerations, as well as market depth, and generally utilize analysis from a third-party liquidity metrics service.
The Liquidity Rule places a 15% limit on a fund's illiquid investments and requires funds that do not primarily hold assets that are highly liquid investments to determine and maintain a minimum percentage of the fund's net assets to be invested in highly liquid investments (highly liquid investment minimum or HLIM). The Program includes provisions reasonably designed to comply with the 15% limit on illiquid investments and for determining, periodically reviewing and complying with the HLIM requirement as applicable.
At a recent meeting of the Fund's Board of Trustees, the LRM Committee provided a written report to the Board pertaining to the operation, adequacy, and effectiveness of the Program for the period December 1, 2022 through November 30, 2023. The report concluded that the Program is operating effectively and is reasonably designed to assess and manage the Fund's liquidity risk.
1.938154.111
AGED-SANN-0624
Fidelity Advisor® Overseas Fund
Semi-Annual Report
April 30, 2024
Contents
To view a fund's proxy voting guidelines and proxy voting record for the 12-month period ended June 30, visit http://www.fidelity.com/proxyvotingresults or visit the Securities and Exchange Commission's (SEC) web site at http://www.sec.gov.
You may also call 1-877-208-0098 to request a free copy of the proxy voting guidelines.
Standard & Poor's, S&P and S&P 500 are registered service marks of The McGraw-Hill Companies, Inc. and have been licensed for use by Fidelity Distributors Corporation.
Other third-party marks appearing herein are the property of their respective owners.
All other marks appearing herein are registered or unregistered trademarks or service marks of FMR LLC or an affiliated company. © 2024 FMR LLC. All rights reserved.
This report and the financial statements contained herein are submitted for the general information of the shareholders of the Fund. This report is not authorized for distribution to prospective investors in the Fund unless preceded or accompanied by an effective prospectus.
A fund files its complete schedule of portfolio holdings with the SEC for the first and third quarters of each fiscal year on Form N-PORT. Forms N-PORT are available on the SEC's web site at http://www.sec.gov. A fund's Forms N-PORT may be reviewed and copied at the SEC's Public Reference Room in Washington, DC. Information regarding the operation of the SEC's Public Reference Room may be obtained by calling 1-800-SEC-0330.
For a complete list of a fund's portfolio holdings, view the most recent holdings listing, semiannual report, or annual report on Fidelity's web site at http://www.fidelity.com, http://www.institutional.fidelity.com, or http://www.401k.com, as applicable.
NOT FDIC INSURED •MAY LOSE VALUE •NO BANK GUARANTEE
Neither the Fund nor Fidelity Distributors Corporation is a bank.
Top Holdings (% of Fund's net assets) |
| |
| ASML Holding NV (Netherlands) (Netherlands, Semiconductors & Semiconductor Equipment) | 3.8 | |
| Novo Nordisk A/S Series B (Denmark, Pharmaceuticals) | 3.6 | |
| AstraZeneca PLC (United Kingdom) (United Kingdom, Pharmaceuticals) | 2.6 | |
| SAP SE (Germany, Software) | 2.3 | |
| LVMH Moet Hennessy Louis Vuitton SE (France, Textiles, Apparel & Luxury Goods) | 2.3 | |
| Tokio Marine Holdings, Inc. (Japan, Insurance) | 2.1 | |
| Safran SA (France, Aerospace & Defense) | 2.0 | |
| RELX PLC (London Stock Exchange) (United Kingdom, Professional Services) | 2.0 | |
| Wolters Kluwer NV (Netherlands, Professional Services) | 1.9 | |
| Compass Group PLC (United Kingdom, Hotels, Restaurants & Leisure) | 1.8 | |
| | 24.4 | |
| |
| Market Sectors (% of Fund's net assets) |
| |
| Financials | 22.5 | |
| Industrials | 19.2 | |
| Information Technology | 18.6 | |
| Health Care | 15.5 | |
| Consumer Discretionary | 10.0 | |
| Materials | 6.8 | |
| Consumer Staples | 5.1 | |
| Energy | 1.2 | |
| Communication Services | 0.4 | |
| Real Estate | 0.0 | |
| |
Percentages shown as 0.0% may reflect amounts less than 0.05%.
Asset Allocation (% of Fund's net assets) |
|
|
Geographic Diversification (% of Fund's net assets) |
|
* Includes Short-Term investments and Net Other Assets (Liabilities). Percentages are adjusted for the effect of derivatives, if applicable. |
| |
Showing Percentage of Net Assets
| Common Stocks - 99.3% |
| | | Shares | Value ($) (000s) |
| Bailiwick of Jersey - 0.4% | | | |
| JTC PLC (a) | | 129,400 | 1,382 |
| Belgium - 0.9% | | | |
| Azelis Group NV | | 40,800 | 986 |
| KBC Group NV | | 31,675 | 2,363 |
TOTAL BELGIUM | | | 3,349 |
| Canada - 2.6% | | | |
| Alimentation Couche-Tard, Inc. Class A (multi-vtg.) | | 55,800 | 3,093 |
| Constellation Software, Inc. | | 2,380 | 6,127 |
| Constellation Software, Inc. warrants 3/31/40 (b)(c) | | 2,780 | 0 |
| Lumine Group, Inc. (b) | | 15,341 | 420 |
TOTAL CANADA | | | 9,640 |
| Denmark - 4.8% | | | |
| Carlsberg A/S Series B | | 16,400 | 2,206 |
| DSV A/S | | 15,904 | 2,271 |
| Novo Nordisk A/S Series B | | 106,100 | 13,607 |
TOTAL DENMARK | | | 18,084 |
| Finland - 1.1% | | | |
| Nordea Bank Abp | | 337,926 | 3,943 |
| France - 13.8% | | | |
| Accor SA | | 69,200 | 3,051 |
| Air Liquide SA | | 29,010 | 5,674 |
| ALTEN | | 22,075 | 2,608 |
| Antin Infrastructure Partners SA | | 9,500 | 122 |
| Capgemini SA | | 27,819 | 5,847 |
| Dassault Systemes SA | | 60,300 | 2,367 |
| Edenred SA | | 14,754 | 700 |
| EssilorLuxottica SA | | 26,825 | 5,748 |
| L'Oreal SA | | 10,200 | 4,786 |
| LVMH Moet Hennessy Louis Vuitton SE | | 10,495 | 8,621 |
| Safran SA | | 35,100 | 7,611 |
| TotalEnergies SE | | 62,200 | 4,516 |
TOTAL FRANCE | | | 51,651 |
| Germany - 8.8% | | | |
| Allianz SE | | 19,223 | 5,455 |
| Deutsche Borse AG | | 24,103 | 4,647 |
| Hannover Reuck SE | | 21,629 | 5,364 |
| Infineon Technologies AG | | 61,700 | 2,141 |
| Merck KGaA | | 19,700 | 3,132 |
| SAP SE | | 48,100 | 8,685 |
| Siemens Healthineers AG (a) | | 65,700 | 3,644 |
TOTAL GERMANY | | | 33,068 |
| Hong Kong - 1.0% | | | |
| AIA Group Ltd. | | 487,600 | 3,571 |
| India - 0.4% | | | |
| HDFC Bank Ltd. | | 92,484 | 1,679 |
| Indonesia - 0.8% | | | |
| PT Bank Central Asia Tbk | | 5,124,000 | 3,081 |
| Ireland - 1.0% | | | |
| Kingspan Group PLC (Ireland) | | 43,300 | 3,875 |
| Italy - 3.8% | | | |
| FinecoBank SpA | | 219,563 | 3,384 |
| GVS SpA (a)(b) | | 28,462 | 166 |
| Industrie de Nora SpA | | 16,200 | 219 |
| Recordati SpA | | 84,220 | 4,498 |
| UniCredit SpA | | 160,100 | 5,876 |
TOTAL ITALY | | | 14,143 |
| Japan - 14.6% | | | |
| Ajinomoto Co., Inc. | | 68,800 | 2,558 |
| BayCurrent Consulting, Inc. | | 26,900 | 573 |
| Capcom Co. Ltd. | | 100,200 | 1,650 |
| DENSO Corp. | | 148,000 | 2,522 |
| FUJIFILM Holdings Corp. | | 203,700 | 4,333 |
| Hoya Corp. | | 43,931 | 5,093 |
| Mitsubishi Heavy Industries Ltd. | | 469,000 | 4,193 |
| NOF Corp. | | 134,013 | 1,798 |
| Renesas Electronics Corp. | | 127,800 | 2,075 |
| Rohto Pharmaceutical Co. Ltd. | | 40,600 | 792 |
| Shin-Etsu Chemical Co. Ltd. | | 162,700 | 6,298 |
| Sony Group Corp. | | 71,124 | 5,878 |
| Suzuki Motor Corp. | | 319,884 | 3,725 |
| TIS, Inc. | | 53,427 | 1,141 |
| Tokio Marine Holdings, Inc. | | 247,300 | 7,816 |
| Tokyo Electron Ltd. | | 18,781 | 4,120 |
TOTAL JAPAN | | | 54,565 |
| Netherlands - 8.0% | | | |
| ASM International NV (Netherlands) | | 6,050 | 3,843 |
| ASML Holding NV (Netherlands) | | 15,806 | 14,046 |
| IMCD NV | | 28,850 | 4,380 |
| Topicus.Com, Inc. | | 6,230 | 508 |
| Wolters Kluwer NV | | 46,541 | 6,991 |
TOTAL NETHERLANDS | | | 29,768 |
| Spain - 0.8% | | | |
| CaixaBank SA | | 570,400 | 3,008 |
| Sweden - 3.1% | | | |
| Addlife AB | | 124,837 | 1,162 |
| AddTech AB (B Shares) | | 83,987 | 1,774 |
| Atlas Copco AB (A Shares) | | 241,692 | 4,233 |
| Indutrade AB | | 183,725 | 4,305 |
| Kry International AB (b)(c)(d) | | 156 | 5 |
TOTAL SWEDEN | | | 11,479 |
| Switzerland - 4.9% | | | |
| Alcon, Inc. (Switzerland) | | 49,360 | 3,818 |
| Compagnie Financiere Richemont SA Series A | | 25,694 | 3,552 |
| Galderma Group AG | | 17,965 | 1,339 |
| Partners Group Holding AG | | 3,110 | 4,024 |
| Sika AG | | 19,488 | 5,582 |
TOTAL SWITZERLAND | | | 18,315 |
| Taiwan - 0.7% | | | |
| Taiwan Semiconductor Manufacturing Co. Ltd. | | 116,300 | 2,780 |
| United Kingdom - 17.3% | | | |
| 3i Group PLC | | 134,000 | 4,787 |
| AstraZeneca PLC (United Kingdom) | | 65,100 | 9,846 |
| BAE Systems PLC | | 295,000 | 4,907 |
| Beazley PLC | | 98,371 | 815 |
| Compass Group PLC | | 239,254 | 6,655 |
| Diageo PLC | | 162,276 | 5,608 |
| Diploma PLC | | 62,467 | 2,832 |
| Flutter Entertainment PLC (b) | | 4,924 | 918 |
| Halma PLC | | 88,700 | 2,446 |
| Hiscox Ltd. | | 92,673 | 1,424 |
| InterContinental Hotel Group PLC | | 28,328 | 2,763 |
| Lloyds Banking Group PLC | | 5,536,400 | 3,573 |
| London Stock Exchange Group PLC | | 54,600 | 6,019 |
| RELX PLC (London Stock Exchange) | | 182,384 | 7,494 |
| Sage Group PLC | | 250,100 | 3,644 |
| Volution Group PLC | | 208,151 | 1,133 |
TOTAL UNITED KINGDOM | | | 64,864 |
| United States of America - 10.5% | | | |
| CBRE Group, Inc. (b) | | 200 | 17 |
| CDW Corp. | | 11,000 | 2,660 |
| Experian PLC | | 83,500 | 3,368 |
| Ferguson PLC | | 22,800 | 4,832 |
| ICON PLC (b) | | 10,900 | 3,247 |
| Linde PLC | | 13,734 | 6,056 |
| Marsh & McLennan Companies, Inc. | | 29,730 | 5,929 |
| S&P Global, Inc. | | 11,931 | 4,961 |
| Schneider Electric SA | | 24,100 | 5,495 |
| Thermo Fisher Scientific, Inc. | | 4,800 | 2,730 |
TOTAL UNITED STATES OF AMERICA | | | 39,295 |
| TOTAL COMMON STOCKS (Cost $251,928) | | | 371,540 |
| | | | |
| Nonconvertible Preferred Stocks - 0.0% |
| | | Shares | Value ($) (000s) |
| Sweden - 0.0% | | | |
Kry International AB Series E (b)(c)(d) (Cost $412) | | 901 | 37 |
| | | | |
| TOTAL INVESTMENT IN SECURITIES - 99.3% (Cost $252,340) | 371,577 |
NET OTHER ASSETS (LIABILITIES) - 0.7% | 2,560 |
| NET ASSETS - 100.0% | 374,137 |
| | |
Any values shown as $0 in the Schedule of Investments may reflect amounts less than $500.
Legend
| (a) | Security exempt from registration under Rule 144A of the Securities Act of 1933. These securities may be resold in transactions exempt from registration, normally to qualified institutional buyers. At the end of the period, the value of these securities amounted to $5,192,000 or 1.4% of net assets. |
| (d) | Restricted securities (including private placements) - Investment in securities not registered under the Securities Act of 1933 (excluding 144A issues). At the end of the period, the value of restricted securities (excluding 144A issues) amounted to $42,000 or 0.0% of net assets. |
| Additional information on each restricted holding is as follows: |
| Security | Acquisition Date | Acquisition Cost ($) (000s) |
| Kry International AB | 5/14/21 | 68 |
| | | |
| Kry International AB Series E | 5/14/21 | 412 |
| | | |
Affiliated Central Funds
Fiscal year to date information regarding the Fund's investments in Fidelity Central Funds, including the ownership percentage, is presented below.
| Affiliate (Amounts in thousands) | Value, beginning of period ($) | Purchases ($) | Sales Proceeds ($) | Dividend Income ($) | Realized Gain (loss) ($) | Change in Unrealized appreciation (depreciation) ($) | Value, end of period ($) | % ownership, end of period |
| Fidelity Cash Central Fund 5.39% | 4,244 | 36,321 | 40,565 | 81 | - | - | - | 0.0% |
| Fidelity Securities Lending Cash Central Fund 5.39% | - | 2,927 | 2,927 | 5 | - | - | - | 0.0% |
| Total | 4,244 | 39,248 | 43,492 | 86 | - | - | - | |
| | | | | | | | | |
Amounts in the dividend income column in the above table include any capital gain distributions from underlying funds, which are presented in the corresponding line item in the Statement of Operations, if applicable.
Amounts in the dividend income column for Fidelity Securities Lending Cash Central Fund represents the income earned on investing cash collateral, less rebates paid to borrowers and any lending agent fees associated with the loan, plus any premium payments received for lending certain types of securities.
Amounts included in the purchases and sales proceeds columns may include in-kind transactions, if applicable.
Investment Valuation
The following is a summary of the inputs used, as of April 30, 2024, involving the Fund's assets and liabilities carried at fair value. The inputs or methodology used for valuing securities may not be an indication of the risk associated with investing in those securities. For more information on valuation inputs, and their aggregation into the levels used below, please refer to the Investment Valuation section in the accompanying Notes to Financial Statements.
| Valuation Inputs at Reporting Date: |
Description (Amounts in thousands) | Total ($) | Level 1 ($) | Level 2 ($) | Level 3 ($) |
Investments in Securities: | | | | |
|
| Equities: | | | | |
Communication Services | 1,650 | - | 1,650 | - |
Consumer Discretionary | 37,685 | 3,969 | 33,716 | - |
Consumer Staples | 19,043 | 7,879 | 11,164 | - |
Energy | 4,516 | - | 4,516 | - |
Financials | 83,923 | 34,411 | 49,512 | - |
Health Care | 57,864 | 25,674 | 32,190 | - |
Industrials | 71,638 | 33,764 | 37,874 | - |
Information Technology | 69,833 | 36,302 | 33,489 | 42 |
Materials | 25,408 | 11,638 | 13,770 | - |
Real Estate | 17 | 17 | - | - |
| | | | | |
| Total Investments in Securities: | 371,577 | 153,654 | 217,881 | 42 |
| Statement of Assets and Liabilities |
| Amounts in thousands (except per-share amounts) | | | | April 30, 2024 (Unaudited) |
| | | | | |
| Assets | | | | |
Investment in securities, at value - See accompanying schedule Unaffiliated issuers (cost $252,340): | | | $ | 371,577 |
| Foreign currency held at value (cost $72) | | | | 72 |
| Receivable for investments sold | | | | 617 |
| Receivable for fund shares sold | | | | 74 |
| Dividends receivable | | | | 801 |
| Reclaims receivable | | | | 1,570 |
| Distributions receivable from Fidelity Central Funds | | | | 10 |
| Other receivables | | | | 71 |
Total assets | | | | 374,792 |
| Liabilities | | | | |
| Payable to custodian bank | $ | 50 | | |
| Payable for investments purchased | | 119 | | |
| Payable for fund shares redeemed | | 130 | | |
| Accrued management fee | | 215 | | |
| Distribution and service plan fees payable | | 87 | | |
| Audit fee payable | | 38 | | |
| Other payables and accrued expenses | | 16 | | |
| Total liabilities | | | | 655 |
| Net Assets | | | $ | 374,137 |
| Net Assets consist of: | | | | |
| Paid in capital | | | $ | 282,909 |
| Total accumulated earnings (loss) | | | | 91,228 |
| Net Assets | | | $ | 374,137 |
| | | | | |
| Net Asset Value and Maximum Offering Price | | | | |
| Class A : | | | | |
Net Asset Value and redemption price per share ($44,237 ÷ 1,417 shares)(a) | | | $ | 31.22 |
| Maximum offering price per share (100/94.25 of $31.22) | | | $ | 33.12 |
| Class M : | | | | |
Net Asset Value and redemption price per share ($178,274 ÷ 5,567 shares)(a) | | | $ | 32.02 |
| Maximum offering price per share (100/96.50 of $32.02) | | | $ | 33.18 |
| Class C : | | | | |
Net Asset Value and offering price per share ($2,719 ÷ 92 shares)(a)(b) | | | $ | 29.68 |
| Class I : | | | | |
Net Asset Value, offering price and redemption price per share ($52,721 ÷ 1,637 shares)(b) | | | $ | 32.20 |
| Class Z : | | | | |
Net Asset Value, offering price and redemption price per share ($96,186 ÷ 2,993 shares)(b) | | | $ | 32.14 |
(a)Redemption price per share is equal to net asset value less any applicable contingent deferred sales charge. |
(b)Corresponding Net Asset Value does not calculate due to rounding of fractional net assets and/or shares. |
| Statement of Operations |
| Amounts in thousands | | | | Six months ended April 30, 2024 (Unaudited) |
| Investment Income | | | | |
| Dividends | | | $ | 3,457 |
| Income from Fidelity Central Funds (including $5 from security lending) | | | | 86 |
| Income before foreign taxes withheld | | | $ | 3,543 |
| Less foreign taxes withheld | | | | (245) |
| Total income | | | | 3,298 |
| Expenses | | | | |
| Management fee | | | | |
| Basic fee | $ | 1,296 | | |
| Performance adjustment | | (161) | | |
| Transfer agent fees | | 172 | | |
| Distribution and service plan fees | | 512 | | |
| Accounting fees | | 60 | | |
| Custodian fees and expenses | | 23 | | |
| Independent trustees' fees and expenses | | 1 | | |
| Registration fees | | 54 | | |
| Audit | | 48 | | |
| Legal | | 1 | | |
| Miscellaneous | | 3 | | |
| Total expenses before reductions | | 2,009 | | |
| Expense reductions | | (17) | | |
| Total expenses after reductions | | | | 1,992 |
| Net Investment income (loss) | | | | 1,306 |
| Realized and Unrealized Gain (Loss) | | | | |
| Net realized gain (loss) on: | | | | |
| Investment Securities: | | | | |
| Unaffiliated issuers (net of foreign taxes of $96) | | 5,307 | | |
| Foreign currency transactions | | (17) | | |
| Total net realized gain (loss) | | | | 5,290 |
| Change in net unrealized appreciation (depreciation) on: | | | | |
| Investment Securities: | | | | |
| Unaffiliated issuers (net of decrease in deferred foreign taxes of $63) | | 59,749 | | |
| Assets and liabilities in foreign currencies | | (35) | | |
| Total change in net unrealized appreciation (depreciation) | | | | 59,714 |
| Net gain (loss) | | | | 65,004 |
| Net increase (decrease) in net assets resulting from operations | | | $ | 66,310 |
| Statement of Changes in Net Assets |
| |
| Amount in thousands | | Six months ended April 30, 2024 (Unaudited) | | Year ended October 31, 2023 |
| Increase (Decrease) in Net Assets | | | | |
| Operations | | | | |
| Net investment income (loss) | $ | 1,306 | $ | 3,255 |
| Net realized gain (loss) | | 5,290 | | 7,127 |
| Change in net unrealized appreciation (depreciation) | | 59,714 | | 30,705 |
| Net increase (decrease) in net assets resulting from operations | | 66,310 | | 41,087 |
| Distributions to shareholders | | (2,839) | | (1,443) |
| | | | | |
| Share transactions - net increase (decrease) | | (16,639) | | (26,879) |
| Total increase (decrease) in net assets | | 46,832 | | 12,765 |
| | | | | |
| Net Assets | | | | |
| Beginning of period | | 327,305 | | 314,540 |
| End of period | $ | 374,137 | $ | 327,305 |
| | | | | |
| | | | | |
Financial Highlights
Fidelity Advisor® Overseas Fund Class A |
| |
| | Six months ended (Unaudited) April 30, 2024 | | Years ended October 31, 2023 | | 2022 | | 2021 | | 2020 | | 2019 |
Selected Per-Share Data | | | | | | | | | | | | |
| Net asset value, beginning of period | $ | 26.09 | $ | 23.29 | $ | 34.07 | $ | 24.73 | $ | 24.27 | $ | 22.48 |
| Income from Investment Operations | | | | | | | | | | | | |
Net investment income (loss) A,B | | .10 | | .23 | | .14 | | (.04) | | (.02) | | .35 |
| Net realized and unrealized gain (loss) | | 5.26 | | 2.67 | | (10.20) | | 9.38 | | .83 | | 2.38 |
| Total from investment operations | | 5.36 | | 2.90 | | (10.06) | | 9.34 | | .81 | | 2.73 |
| Distributions from net investment income | | (.23) | | (.10) | | - | | - | | (.35) | | (.21) |
| Distributions from net realized gain | | - | | - | | (.72) | | - | | - | | (.73) |
| Total distributions | | (.23) | | (.10) | | (.72) | | - | | (.35) | | (.94) |
| Net asset value, end of period | $ | 31.22 | $ | 26.09 | $ | 23.29 | $ | 34.07 | $ | 24.73 | $ | 24.27 |
Total Return C,D,E | | | | 12.43% | | (30.12)% | | 37.77% | | 3.33% | | 12.86% |
Ratios to Average Net Assets B,F,G | | | | | | | | | | | | |
| Expenses before reductions | | 1.12% H | | 1.13% | | 1.36% | | 1.43% | | 1.49% | | 1.21% |
| Expenses net of fee waivers, if any | | | | 1.12% | | 1.36% | | 1.43% | | 1.49% | | 1.21% |
| Expenses net of all reductions | | 1.11% H | | 1.12% | | 1.36% | | 1.43% | | 1.48% | | 1.19% |
| Net investment income (loss) | | .67% H | | .84% | | .51% | | (.12)% | | (.08)% | | 1.53% |
| Supplemental Data | | | | | | | | | | | | |
| Net assets, end of period (in millions) | $ | 44 | $ | 38 | $ | 35 | $ | 56 | $ | 46 | $ | 49 |
Portfolio turnover rate I | | | | 37% | | 46% | | 33% J | | 46% | | 45% J |
ACalculated based on average shares outstanding during the period.
BNet investment income (loss) is affected by the timing of the declaration of dividends by any underlying mutual funds or exchange-traded funds (ETFs). Net investment income (loss) of any mutual funds or ETFs is not included in the Fund's net investment income (loss) ratio.
CTotal returns for periods of less than one year are not annualized.
DTotal returns would have been lower if certain expenses had not been reduced during the applicable periods shown.
ETotal returns do not include the effect of the sales charges.
FFees and expenses of any underlying mutual funds or exchange-traded funds (ETFs) are not included in the Fund's expense ratio. The Fund indirectly bears its proportionate share of these expenses. For additional expense information related to investments in Fidelity Central Funds, please refer to the "Investments in Fidelity Central Funds" note found in the Notes to Financial Statements section of the most recent Annual or Semi-Annual report.
GExpense ratios reflect operating expenses of the class. Expenses before reductions do not reflect amounts reimbursed, waived, or reduced through arrangements with the investment adviser, brokerage services, or other offset arrangements, if applicable, and do not represent the amount paid by the class during periods when reimbursements, waivers or reductions occur.
HAnnualized.
IAmount does not include the portfolio activity of any underlying mutual funds or exchange-traded funds (ETFs).
JPortfolio turnover rate excludes securities received or delivered in-kind.
Fidelity Advisor® Overseas Fund Class M |
| |
| | Six months ended (Unaudited) April 30, 2024 | | Years ended October 31, 2023 | | 2022 | | 2021 | | 2020 | | 2019 |
Selected Per-Share Data | | | | | | | | | | | | |
| Net asset value, beginning of period | $ | 26.73 | $ | 23.85 | $ | 34.94 | $ | 25.41 | $ | 24.94 | $ | 23.06 |
| Income from Investment Operations | | | | | | | | | | | | |
Net investment income (loss) A,B | | .07 | | .18 | | .09 | | (.11) | | (.07) | | .31 |
| Net realized and unrealized gain (loss) | | 5.38 | | 2.73 | | (10.46) | | 9.64 | | .84 | | 2.45 |
| Total from investment operations | | 5.45 | | 2.91 | | (10.37) | | 9.53 | | .77 | | 2.76 |
| Distributions from net investment income | | (.16) | | (.03) | | - | | - | | (.30) | | (.15) |
| Distributions from net realized gain | | - | | - | | (.72) | | - | | - | | (.73) |
| Total distributions | | (.16) | | (.03) | | (.72) | | - | | (.30) | | (.88) |
| Net asset value, end of period | $ | 32.02 | $ | 26.73 | $ | 23.85 | $ | 34.94 | $ | 25.41 | $ | 24.94 |
Total Return C,D,E | | | | 12.21% | | (30.26)% | | 37.50% | | 3.09% | | 12.65% |
Ratios to Average Net Assets B,F,G | | | | | | | | | | | | |
| Expenses before reductions | | 1.34% H | | 1.33% | | 1.57% | | 1.65% | | 1.71% | | 1.42% |
| Expenses net of fee waivers, if any | | | | 1.33% | | 1.57% | | 1.65% | | 1.70% | | 1.42% |
| Expenses net of all reductions | | 1.33% H | | 1.33% | | 1.57% | | 1.65% | | 1.70% | | 1.40% |
| Net investment income (loss) | | .45% H | | .64% | | .30% | | (.34)% | | (.29)% | | 1.32% |
| Supplemental Data | | | | | | | | | | | | |
| Net assets, end of period (in millions) | $ | 178 | $ | 155 | $ | 150 | $ | 238 | $ | 194 | $ | 221 |
Portfolio turnover rate I | | | | 37% | | 46% | | 33% J | | 46% | | 45% J |
ACalculated based on average shares outstanding during the period.
BNet investment income (loss) is affected by the timing of the declaration of dividends by any underlying mutual funds or exchange-traded funds (ETFs). Net investment income (loss) of any mutual funds or ETFs is not included in the Fund's net investment income (loss) ratio.
CTotal returns for periods of less than one year are not annualized.
DTotal returns would have been lower if certain expenses had not been reduced during the applicable periods shown.
ETotal returns do not include the effect of the sales charges.
FFees and expenses of any underlying mutual funds or exchange-traded funds (ETFs) are not included in the Fund's expense ratio. The Fund indirectly bears its proportionate share of these expenses. For additional expense information related to investments in Fidelity Central Funds, please refer to the "Investments in Fidelity Central Funds" note found in the Notes to Financial Statements section of the most recent Annual or Semi-Annual report.
GExpense ratios reflect operating expenses of the class. Expenses before reductions do not reflect amounts reimbursed, waived, or reduced through arrangements with the investment adviser, brokerage services, or other offset arrangements, if applicable, and do not represent the amount paid by the class during periods when reimbursements, waivers or reductions occur.
HAnnualized.
IAmount does not include the portfolio activity of any underlying mutual funds or exchange-traded funds (ETFs).
JPortfolio turnover rate excludes securities received or delivered in-kind.
Fidelity Advisor® Overseas Fund Class C |
| |
| | Six months ended (Unaudited) April 30, 2024 | | Years ended October 31, 2023 | | 2022 | | 2021 | | 2020 | | 2019 |
Selected Per-Share Data | | | | | | | | | | | | |
| Net asset value, beginning of period | $ | 24.71 | $ | 22.15 | $ | 32.69 | $ | 23.92 | $ | 23.46 | $ | 21.72 |
| Income from Investment Operations | | | | | | | | | | | | |
Net investment income (loss) A,B | | (.01) | | .01 | | (.08) | | (.28) | | (.21) | | .15 |
| Net realized and unrealized gain (loss) | | 4.98 | | 2.55 | | (9.74) | | 9.05 | | .80 | | 2.32 |
| Total from investment operations | | 4.97 | | 2.56 | | (9.82) | | 8.77 | | .59 | | 2.47 |
| Distributions from net investment income | | - | | - | | - | | - | | (.13) | | - |
| Distributions from net realized gain | | - | | - | | (.72) | | - | | - | | (.73) |
| Total distributions | | - | | - | | (.72) | | - | | (.13) | | (.73) |
| Net asset value, end of period | $ | 29.68 | $ | 24.71 | $ | 22.15 | $ | 32.69 | $ | 23.92 | $ | 23.46 |
Total Return C,D,E | | | | 11.56% | | (30.66)% | | 36.66% | | 2.50% | | 11.94% |
Ratios to Average Net Assets B,F,G | | | | | | | | | | | | |
| Expenses before reductions | | 1.87% H | | 1.92% | | 2.16% | | 2.25% | | 2.31% | | 2.03% |
| Expenses net of fee waivers, if any | | | | 1.91% | | 2.16% | | 2.25% | | 2.31% | | 2.03% |
| Expenses net of all reductions | | 1.86% H | | 1.91% | | 2.16% | | 2.25% | | 2.30% | | 2.02% |
| Net investment income (loss) | | (.08)% H | | .05% | | (.29)% | | (.94)% | | (.89)% | | .70% |
| Supplemental Data | | | | | | | | | | | | |
| Net assets, end of period (in millions) | $ | 3 | $ | 2 | $ | 3 | $ | 5 | $ | 5 | $ | 6 |
Portfolio turnover rate I | | | | 37% | | 46% | | 33% J | | 46% | | 45% J |
ACalculated based on average shares outstanding during the period.
BNet investment income (loss) is affected by the timing of the declaration of dividends by any underlying mutual funds or exchange-traded funds (ETFs). Net investment income (loss) of any mutual funds or ETFs is not included in the Fund's net investment income (loss) ratio.
CTotal returns for periods of less than one year are not annualized.
DTotal returns would have been lower if certain expenses had not been reduced during the applicable periods shown.
ETotal returns do not include the effect of the contingent deferred sales charge.
FFees and expenses of any underlying mutual funds or exchange-traded funds (ETFs) are not included in the Fund's expense ratio. The Fund indirectly bears its proportionate share of these expenses. For additional expense information related to investments in Fidelity Central Funds, please refer to the "Investments in Fidelity Central Funds" note found in the Notes to Financial Statements section of the most recent Annual or Semi-Annual report.
GExpense ratios reflect operating expenses of the class. Expenses before reductions do not reflect amounts reimbursed, waived, or reduced through arrangements with the investment adviser, brokerage services, or other offset arrangements, if applicable, and do not represent the amount paid by the class during periods when reimbursements, waivers or reductions occur.
HAnnualized.
IAmount does not include the portfolio activity of any underlying mutual funds or exchange-traded funds (ETFs).
JPortfolio turnover rate excludes securities received or delivered in-kind.
Fidelity Advisor® Overseas Fund Class I |
| |
| | Six months ended (Unaudited) April 30, 2024 | | Years ended October 31, 2023 | | 2022 | | 2021 | | 2020 | | 2019 |
Selected Per-Share Data | | | | | | | | | | | | |
| Net asset value, beginning of period | $ | 26.94 | $ | 24.03 | $ | 35.03 | $ | 25.35 | $ | 24.79 | $ | 22.99 |
| Income from Investment Operations | | | | | | | | | | | | |
Net investment income (loss) A,B | | .15 | | .32 | | .23 | | .06 | | .07 | | .42 |
| Net realized and unrealized gain (loss) | | 5.41 | | 2.75 | | (10.51) | | 9.62 | | .84 | | 2.43 |
| Total from investment operations | | 5.56 | | 3.07 | | (10.28) | | 9.68 | | .91 | | 2.85 |
| Distributions from net investment income | | (.30) | | (.16) | | - | | - | | (.35) | | (.32) |
| Distributions from net realized gain | | - | | - | | (.72) | | - | | - | | (.73) |
| Total distributions | | (.30) | | (.16) | | (.72) | | - | | (.35) | | (1.05) |
| Net asset value, end of period | $ | 32.20 | $ | 26.94 | $ | 24.03 | $ | 35.03 | $ | 25.35 | $ | 24.79 |
Total Return C,D | | | | 12.78% | | (29.91)% | | 38.19% | | 3.68% | | 13.21% |
Ratios to Average Net Assets B,E,F | | | | | | | | | | | | |
| Expenses before reductions | | .83% G | | .83% | | 1.08% | | 1.12% | | 1.15% | | .91% |
| Expenses net of fee waivers, if any | | | | .83% | | 1.08% | | 1.12% | | 1.15% | | .91% |
| Expenses net of all reductions | | .82% G | | .83% | | 1.08% | | 1.12% | | 1.14% | | .90% |
| Net investment income (loss) | | .96% G | | 1.14% | | .79% | | .19% | | .27% | | 1.82% |
| Supplemental Data | | | | | | | | | | | | |
| Net assets, end of period (in millions) | $ | 53 | $ | 49 | $ | 48 | $ | 85 | $ | 121 | $ | 117 |
Portfolio turnover rate H | | | | 37% | | 46% | | 33% I | | 46% | | 45% I |
ACalculated based on average shares outstanding during the period.
BNet investment income (loss) is affected by the timing of the declaration of dividends by any underlying mutual funds or exchange-traded funds (ETFs). Net investment income (loss) of any mutual funds or ETFs is not included in the Fund's net investment income (loss) ratio.
CTotal returns for periods of less than one year are not annualized.
DTotal returns would have been lower if certain expenses had not been reduced during the applicable periods shown.
EFees and expenses of any underlying mutual funds or exchange-traded funds (ETFs) are not included in the Fund's expense ratio. The Fund indirectly bears its proportionate share of these expenses. For additional expense information related to investments in Fidelity Central Funds, please refer to the "Investments in Fidelity Central Funds" note found in the Notes to Financial Statements section of the most recent Annual or Semi-Annual report.
FExpense ratios reflect operating expenses of the class. Expenses before reductions do not reflect amounts reimbursed, waived, or reduced through arrangements with the investment adviser, brokerage services, or other offset arrangements, if applicable, and do not represent the amount paid by the class during periods when reimbursements, waivers or reductions occur.
GAnnualized.
HAmount does not include the portfolio activity of any underlying mutual funds or exchange-traded funds (ETFs).
IPortfolio turnover rate excludes securities received or delivered in-kind.
Fidelity Advisor® Overseas Fund Class Z |
| |
| | Six months ended (Unaudited) April 30, 2024 | | Years ended October 31, 2023 | | 2022 | | 2021 | | 2020 | | 2019 |
Selected Per-Share Data | | | | | | | | | | | | |
| Net asset value, beginning of period | $ | 26.91 | $ | 24.03 | $ | 34.97 | $ | 25.28 | $ | 24.79 | $ | 23.00 |
| Income from Investment Operations | | | | | | | | | | | | |
Net investment income (loss) A,B | | .17 | | .36 | | .27 | | .09 | | .09 | | .45 |
| Net realized and unrealized gain (loss) | | 5.41 | | 2.74 | | (10.49) | | 9.60 | | .84 | | 2.43 |
| Total from investment operations | | 5.58 | | 3.10 | | (10.22) | | 9.69 | | .93 | | 2.88 |
| Distributions from net investment income | | (.35) | | (.22) | | - | | - | | (.44) | | (.36) |
| Distributions from net realized gain | | - | | - | | (.72) | | - | | - | | (.73) |
| Total distributions | | (.35) | | (.22) | | (.72) | | - | | (.44) | | (1.09) |
| Net asset value, end of period | $ | 32.14 | $ | 26.91 | $ | 24.03 | $ | 34.97 | $ | 25.28 | $ | 24.79 |
Total Return C,D | | | | 12.90% | | (29.79)% | | 38.33% | | 3.77% | | 13.38% |
Ratios to Average Net Assets B,E,F | | | | | | | | | | | | |
| Expenses before reductions | | .71% G | | .70% | | .94% | | 1.02% | | 1.07% | | .77% |
| Expenses net of fee waivers, if any | | | | .69% | | .93% | | 1.02% | | 1.06% | | .77% |
| Expenses net of all reductions | | .70% G | | .69% | | .93% | | 1.02% | | 1.05% | | .76% |
| Net investment income (loss) | | 1.08% G | | 1.27% | | .94% | | .29% | | .35% | | 1.96% |
| Supplemental Data | | | | | | | | | | | | |
| Net assets, end of period (in millions) | $ | 96 | $ | 83 | $ | 80 | $ | 108 | $ | 47 | $ | 38 |
Portfolio turnover rate H | | | | 37% | | 46% | | 33% I | | 46% | | 45% I |
ACalculated based on average shares outstanding during the period.
BNet investment income (loss) is affected by the timing of the declaration of dividends by any underlying mutual funds or exchange-traded funds (ETFs). Net investment income (loss) of any mutual funds or ETFs is not included in the Fund's net investment income (loss) ratio.
CTotal returns for periods of less than one year are not annualized.
DTotal returns would have been lower if certain expenses had not been reduced during the applicable periods shown.
EFees and expenses of any underlying mutual funds or exchange-traded funds (ETFs) are not included in the Fund's expense ratio. The Fund indirectly bears its proportionate share of these expenses. For additional expense information related to investments in Fidelity Central Funds, please refer to the "Investments in Fidelity Central Funds" note found in the Notes to Financial Statements section of the most recent Annual or Semi-Annual report.
FExpense ratios reflect operating expenses of the class. Expenses before reductions do not reflect amounts reimbursed, waived, or reduced through arrangements with the investment adviser, brokerage services, or other offset arrangements, if applicable, and do not represent the amount paid by the class during periods when reimbursements, waivers or reductions occur.
GAnnualized.
HAmount does not include the portfolio activity of any underlying mutual funds or exchange-traded funds (ETFs).
IPortfolio turnover rate excludes securities received or delivered in-kind.
For the period ended April 30, 2024
(Amounts in thousands except percentages)
1. Organization.
Fidelity Advisor Overseas Fund (the Fund) is a fund of Fidelity Advisor Series VIII (the Trust) and is authorized to issue an unlimited number of shares. The Trust is registered under the Investment Company Act of 1940, as amended (the 1940 Act), as an open-end management investment company organized as a Massachusetts business trust. The Fund offers Class A, Class M, Class C, Class I and Class Z shares, each of which has equal rights as to assets and voting privileges. Class A, Class M, Class C, Class I and Class Z are Fidelity Advisor classes. Each class has exclusive voting rights with respect to matters that affect that class. Class C shares will automatically convert to Class A shares after a holding period of eight years from the initial date of purchase, with certain exceptions.
2. Investments in Fidelity Central Funds.
Funds may invest in Fidelity Central Funds, which are open-end investment companies generally available only to other investment companies and accounts managed by the investment adviser and its affiliates. The Schedule of Investments lists any Fidelity Central Funds held as an investment as of period end, but does not include the underlying holdings of each Fidelity Central Fund. An investing fund indirectly bears its proportionate share of the expenses of the underlying Fidelity Central Funds.
Based on its investment objective, each Fidelity Central Fund may invest or participate in various investment vehicles or strategies that are similar to those of the investing fund. These strategies are consistent with the investment objectives of the investing fund and may involve certain economic risks which may cause a decline in value of each of the Fidelity Central Funds and thus a decline in the value of the investing fund.
| Fidelity Central Fund | Investment Manager | Investment Objective | Investment Practices | Expense RatioA |
| Fidelity Money Market Central Funds | Fidelity Management & Research Company LLC (FMR) | Each fund seeks to obtain a high level of current income consistent with the preservation of capital and liquidity. | Short-term Investments | Less than .005% |
A Expenses expressed as a percentage of average net assets and are as of each underlying Central Fund's most recent annual or semi-annual shareholder report.
A complete unaudited list of holdings for each Fidelity Central Fund is available upon request or at the Securities and Exchange Commission website at www.sec.gov. In addition, the financial statements of the Fidelity Central Funds which contain the significant accounting policies (including investment valuation policies) of those funds, and are not covered by the Report of Independent Registered Public Accounting Firm, are available on the Securities and Exchange Commission website or upon request.
3. Significant Accounting Policies.
The Fund is an investment company and applies the accounting and reporting guidance of the Financial Accounting Standards Board (FASB) Accounting Standards Codification Topic 946 Financial Services - Investment Companies. The financial statements have been prepared in conformity with accounting principles generally accepted in the United States of America (GAAP), which require management to make certain estimates and assumptions at the date of the financial statements. Actual results could differ from those estimates. Subsequent events, if any, through the date that the financial statements were issued have been evaluated in the preparation of the financial statements. The Fund's Schedule of Investments lists any underlying mutual funds or exchange-traded funds (ETFs) but does not include the underlying holdings of these funds. The following summarizes the significant accounting policies of the Fund:
Investment Valuation. Investments are valued as of 4:00 p.m. Eastern time on the last calendar day of the period. The Board of Trustees (the Board) has designated the Fund's investment adviser as the valuation designee responsible for the fair valuation function and performing fair value determinations as needed. The investment adviser has established a Fair Value Committee (the Committee) to carry out the day-to-day fair valuation responsibilities and has adopted policies and procedures to govern the fair valuation process and the activities of the Committee. In accordance with these fair valuation policies and procedures, which have been approved by the Board, the Fund attempts to obtain prices from one or more third party pricing services or brokers to value its investments. When current market prices, quotations or currency exchange rates are not readily available or reliable, investments will be fair valued in good faith by the Committee, in accordance with the policies and procedures. Factors used in determining fair value vary by investment type and may include market or investment specific events, transaction data, estimated cash flows, and market observations of comparable investments. The frequency that the fair valuation procedures are used cannot be predicted and they may be utilized to a significant extent. The Committee manages the Fund's fair valuation practices and maintains the fair valuation policies and procedures. The Fund's investment adviser reports to the Board information regarding the fair valuation process and related material matters.
The Fund categorizes the inputs to valuation techniques used to value its investments into a disclosure hierarchy consisting of three levels as shown below:
Level 1 - unadjusted quoted prices in active markets for identical investments
Level 2 - other significant observable inputs (including quoted prices for similar investments, interest rates, prepayment speeds, etc.)
Level 3 - unobservable inputs (including the Fund's own assumptions based on the best information available)
Valuation techniques used to value the Fund's investments by major category are as follows:
Equity securities, including restricted securities, for which market quotations are readily available, are valued at the last reported sale price or official closing price as reported by a third party pricing service on the primary market or exchange on which they are traded and are categorized as Level 1 in the hierarchy. In the event there were no sales during the day or closing prices are not available, securities are valued at the last quoted bid price or may be valued using the last available price and are generally categorized as Level 2 in the hierarchy. For foreign equity securities, when market or security specific events arise, comparisons to the valuation of American Depositary Receipts (ADRs), futures contracts, ETFs and certain indexes as well as quoted prices for similar securities may be used and would be categorized as Level 2 in the hierarchy. For equity securities, including restricted securities, where observable inputs are limited, assumptions about market activity and risk are used and these securities may be categorized as Level 3 in the hierarchy.
Changes in valuation techniques may result in transfers in or out of an assigned level within the disclosure hierarchy. The aggregate value of investments by input level as of April 30, 2024 is included at the end of the Fund's Schedule of Investments.
Foreign Currency. Certain Funds may use foreign currency contracts to facilitate transactions in foreign-denominated securities. Gains and losses from these transactions may arise from changes in the value of the foreign currency or if the counterparties do not perform under the contracts' terms.
Foreign-denominated assets, including investment securities, and liabilities are translated into U.S. dollars at the exchange rates at period end. Purchases and sales of investment securities, income and dividends received, and expenses denominated in foreign currencies are translated into U.S. dollars at the exchange rate in effect on the transaction date.
The effects of exchange rate fluctuations on investments are included with the net realized and unrealized gain (loss) on investment securities. Other foreign currency transactions resulting in realized and unrealized gain (loss) are disclosed separately.
Investment Transactions and Income. For financial reporting purposes, the Fund's investment holdings and NAV include trades executed through the end of the last business day of the period. The NAV per share for processing shareholder transactions is calculated as of the close of business of the New York Stock Exchange (NYSE), normally 4:00 p.m. Eastern time and includes trades executed through the end of the prior business day. Gains and losses on securities sold are determined on the basis of identified cost and include proceeds received from litigation. Commissions paid to certain brokers with whom the investment adviser, or its affiliates, places trades on behalf of a fund include an amount in addition to trade execution, which may be rebated back to a fund. Any such rebates are included in net realized gain (loss) on investments in the Statement of Operations. Dividend income is recorded on the ex-dividend date, except for certain dividends from foreign securities where the ex-dividend date may have passed, which are recorded as soon as the Fund is informed of the ex-dividend date. Non-cash dividends included in dividend income, if any, are recorded at the fair market value of the securities received. Income and capital gain distributions from Fidelity Central Funds, if any, are recorded on the ex-dividend date. Investment income is recorded net of foreign taxes withheld where recovery of such taxes is uncertain. Funds may file withholding tax reclaims in certain jurisdictions to recover a portion of amounts previously withheld. Any withholding tax reclaims income is included in the Statement of Operations in foreign taxes withheld. Any receivables for withholding tax reclaims are included in the Statement of Assets and Liabilities in reclaims receivable. The Fund has filed tax reclaims for previously withheld taxes on dividends earned in certain European Union (EU) countries. These additional filings are subject to various administrative proceedings by the local jurisdictions' tax authorities within the EU, as well as a number of related judicial proceedings. Income recognized for EU reclaims is included with other reclaims in the Statement of Operations in foreign taxes withheld. These reclaims are recorded when the amount is known and there are no significant uncertainties on collectability.
Class Allocations and Expenses. Investment income, realized and unrealized capital gains and losses, common expenses of a fund, and certain fund-level expense reductions, if any, are allocated daily on a pro-rata basis to each class based on the relative net assets of each class to the total net assets of a fund. Each class differs with respect to transfer agent and distribution and service plan fees incurred, as applicable. Certain expense reductions may also differ by class, if applicable. For the reporting period, the allocated portion of income and expenses to each class as a percent of its average net assets may vary due to the timing of recording these transactions in relation to fluctuating net assets of the classes. Expenses directly attributable to a fund are charged to that fund. Expenses attributable to more than one fund are allocated among the respective funds on the basis of relative net assets or other appropriate methods. Expenses included in the accompanying financial statements reflect the expenses of that fund and do not include any expenses associated with any underlying mutual funds or exchange-traded funds (ETFs). Although not included in a fund's expenses, a fund indirectly bears its proportionate share of these expenses through the net asset value of each underlying mutual fund or exchange-traded fund (ETF). Expense estimates are accrued in the period to which they relate and adjustments are made when actual amounts are known.
Income Tax Information and Distributions to Shareholders. Each year, the Fund intends to qualify as a regulated investment company under Subchapter M of the Internal Revenue Code, including distributing substantially all of its taxable income and realized gains. As a result, no provision for U.S. Federal income taxes is required. The Fund files a U.S. federal tax return, in addition to state and local tax returns as required. The Fund's federal income tax returns are subject to examination by the Internal Revenue Service (IRS) for a period of three fiscal years after they are filed. State and local tax returns may be subject to examination for an additional fiscal year depending on the jurisdiction. Foreign taxes are provided for based on the Fund's understanding of the tax rules and rates that exist in the foreign markets in which it invests. The Fund is subject to a tax imposed on capital gains by certain countries in which it invests.
Distributions are declared and recorded on the ex-dividend date. Income and capital gain distributions are declared separately for each class. Income and capital gain distributions are determined in accordance with income tax regulations, which may differ from GAAP.
Capital accounts within the financial statements are adjusted for permanent book-tax differences. These adjustments have no impact on net assets or the results of operations. Capital accounts are not adjusted for temporary book-tax differences which will reverse in a subsequent period.
Book-tax differences are primarily due to foreign currency transactions, certain foreign taxes, passive foreign investment companies (PFIC), capital loss carryforwards and losses deferred due to wash sales.
As of period end, the cost and unrealized appreciation (depreciation) in securities, and derivatives if applicable, for federal income tax purposes were as follows:
| Gross unrealized appreciation | $122,277 |
| Gross unrealized depreciation | (3,363) |
| Net unrealized appreciation (depreciation) | $118,914 |
| Tax cost | $252,663 |
Capital loss carryforwards are only available to offset future capital gains of the Fund to the extent provided by regulations and may be limited. The capital loss carryforward information presented below, including any applicable limitation, is estimated as of prior fiscal period end and is subject to adjustment.
Short-term | $(33,940) |
| Total capital loss carryforward | $(33,940) |
Restricted Securities (including Private Placements). Funds may invest in securities that are subject to legal or contractual restrictions on resale. These securities generally may be resold in transactions exempt from registration or to the public if the securities are registered. Disposal of these securities may involve time-consuming negotiations and expense, and prompt sale at an acceptable price may be difficult. Information regarding restricted securities held at period end is included at the end of the Schedule of Investments, if applicable.
4. Purchases and Sales of Investments.
Purchases and sales of securities, other than short-term securities and in-kind transactions, as applicable, are noted in the table below.
| | Purchases ($) | Sales ($) |
| Fidelity Advisor Overseas Fund | 54,420 | 67,730 |
5. Fees and Other Transactions with Affiliates.
Management Fee. Fidelity Management & Research Company LLC (the investment adviser) and its affiliates provide the Fund with investment management related services for which the Fund pays a monthly management fee.
Effective March 1, 2024, the Fund's management contract was amended to incorporate administrative services previously covered under separate services agreements (Transfer Agent and Accounting agreements). The amended contract incorporates a basic fee rate that may vary by class (subject to a performance adjustment). The investment adviser or an affiliate pays certain expenses of managing and operating the Fund out of each class's management fee. Each class of the Fund pays a management fee to the investment adviser. The management fee is calculated and paid to the investment adviser every month. The management fee is determined by calculating a basic fee and then applying a performance adjustment. When determining a class's basic fee, a mandate rate is calculated based on the monthly average net assets of a group of funds advised by FMR within a designated asset class. A discount rate is subtracted from the mandate rate once the Fund's monthly average net assets reach a certain level. The mandate rate and discount rate may vary by class. The annual basic fee rate for a class of shares of the Fund is the lesser of (1) the class's mandate rate reduced by the class's discount rate (if applicable) or (2) the amount set forth in the following table.
| | Maximum Management Fee Rate % |
| Class A | .86 |
| Class M | .83 |
| Class C | .86 |
| Class I | .82 |
| Class Z | .70 |
One-twelfth of the basic fee rate for a class is applied to the average net assets of the class for the month, giving a dollar amount which is the basic fee for the class for that month. A different management fee rate may be applicable to each class of the Fund. The difference between classes is the result of separate arrangements for class-level services and/or waivers of certain expenses. It is not the result of any difference in advisory or custodial fees or other expenses related to the management of the Fund's assets, which do not vary by class. For the portion of the reporting period on or after March 1, 2024, the total annualized management fee rates were as follows:
| | Total Management Fee Rate % |
| Class A | .86 |
| Class M | .83 |
| Class C | .86 |
| Class I | .82 |
| Class Z | .70 |
Prior to March 1, 2024, the management fee was the sum of an individual fund fee rate that was based on an annual rate of .42% of the Fund's average net assets and an annualized group fee rate that averaged .22% during the period. The group fee rate was based upon the monthly average net assets of a group of registered investment companies with which the investment adviser has management contracts. The group fee rate decreased as assets under management increased and increased as assets under management decreased. For the portion of the reporting period prior to March 1, 2024, the total annualized management fee rate was .65%.
The performance adjustment rate is calculated monthly by comparing over the performance period the Fund's performance to that of the performance adjustment index listed below.
| | Performance Adjustment Index |
| Fidelity Advisor Overseas Fund | MSCI EAFE Index |
For the purposes of calculating the performance adjustment for the Fund, the Fund's investment performance is based on the performance of the asset-weighted return of all classes. To the extent that other classes of the Fund have higher expenses, this could result in those classes bearing a larger positive performance adjustment and smaller negative performance adjustment than would be the case if each class's own performance were considered. The performance period is the most recent 36 month period. The maximum annualized performance adjustment rate is ±.20% of the Fund's average net assets over the performance period. The performance adjustment rate is divided by twelve and multiplied by the Fund's average net assets over the performance period, and the resulting dollar amount is proportionately added to or subtracted from a class's basic fee. For the entire reporting period, the total annualized performance adjustment was (.09)%.
Effective March 1, 2024, the Fund's sub-advisory agreements with FMR Investment Management (UK) Limited, Fidelity Management & Research (Hong Kong) Limited, and Fidelity Management & Research (Japan) Limited were amended to provide that the investment adviser pays each sub-adviser monthly fees equal to 110% of the sub-adviser's costs for providing sub-advisory services.
Effective March 1, 2024, the Fund's sub-advisory agreement with FIL Investment Advisors (FIA) was amended to provide that the investment adviser pays FIA monthly fees at an annual rate of 0.44% with respect to the average daily net assets of the Fund managed by FIA. FIA in turn pays FIA(UK).
Distribution and Service Plan Fees. In accordance with Rule 12b-1 of the 1940 Act, the Fund has adopted separate Distribution and Service Plans for each class of shares. Certain classes pay Fidelity Distributors Company LLC (FDC), an affiliate of the investment adviser, separate Distribution and Service Fees, each of which is based on an annual percentage of each class' average net assets. In addition, FDC may pay financial intermediaries for selling shares of the Fund and providing shareholder support services. For the period, the Distribution and Service Fee rates, total fees and amounts retained by FDC were as follows:
| | Distribution Fee | Service Fee | Total Fees ($) | Retained by FDC ($) |
| Class A | - % | .25% | 54 | 1 |
| Class M | .25% | .25% | 444 | 4 |
| Class C | .75% | .25% | 14 | 1 |
| | | | 512 | 6 |
Sales Load. FDC may receive a front-end sales charge of up to 5.75% for selling Class A shares and 3.50% for selling Class M shares, some of which is paid to financial intermediaries for selling shares of the Fund. Depending on the holding period, FDC may receive contingent deferred sales charges levied on Class A, Class M and Class C redemptions. The deferred sales charges are 1.00% for Class C shares, 1.00% for certain purchases of Class A shares and .25% for certain purchases of Class M shares.
For the period, sales charge amounts retained by FDC were as follows:
| | Retained by FDC ($) |
| Class A | 2 |
| Class M | - B |
Class C A | - B |
| | 2 |
A When Class C shares are initially sold, FDC pays commissions from its own resources to financial intermediaries through which the sales are made.
B In the amount of less than five hundred dollars.
Transfer Agent Fees. Fidelity Investments Institutional Operations Company LLC (FIIOC), an affiliate of the investment adviser, is the transfer, dividend disbursing and shareholder servicing agent for each class of the Fund. Effective March 1, 2024, the Fund's management contract was amended to incorporate transfer agent services and associated fees previously covered under a separate services agreement. FIIOC pays for typesetting, printing and mailing of shareholder reports, except proxy statements.
During November 2023, the Board approved a change in the transfer agent fees effective December 1, 2023 to a fixed annual rate of class-level average net assets as follows:
| | % of Class-Level Average Net Assets |
| Class A | 0.2000% |
| Class M | 0.1739% |
| Class C | 0.2000% |
| Class I | 0.1679% |
Prior to December 1, 2023, FIIOC received account fees and asset-based fees that varied according to the account size and type of account of the shareholders of the respective classes of the Fund, except for Class Z. FIIOC received an asset-based fee of Class Z's average net assets. For the portion of the reporting period prior to March 1, 2024, the fees were equivalent to the following annualized rates:
| | Amount ($) | % of Class-Level Average Net AssetsA |
| Class A | 29 | .20 |
| Class M | 100 | .17 |
| Class C | 2 | .21 |
| Class I | 28 | .17 |
| Class Z | 13 | .04 |
| | 172 | |
A Annualized
Accounting Fees. Fidelity Service Company, Inc. (FSC), an affiliate of the investment adviser, maintains the Fund's accounting records. Effective March 1, 2024, the Fund's management contract was amended to incorporate accounting services and associated fees previously covered under a separate services agreement.
During November 2023, the Board approved a change in the accounting fees effective December 1, 2023 to a fixed annual rate of average net assets as follows:
| | % of Average Net Assets |
| Fidelity Advisor Overseas Fund | 0.0497% |
Prior to December 1, 2023, the accounting fee was based on the level of average net assets for each month. For the portion of the reporting period prior to March 1, 2024, the fees were equivalent to the following annualized rates:
| | % of Average Net Assets |
| Fidelity Advisor Overseas Fund | .05 |
Brokerage Commissions. A portion of portfolio transactions were placed with brokerage firms which are affiliates of the investment adviser. Brokerage commissions are included in net realized gain (loss) and change in net unrealized appreciation (depreciation) in the Statement of Operations. The commissions paid to these affiliated firms were as follows:
| | Amount ($) |
| Fidelity Advisor Overseas Fund | -A |
A In the amount of less than five hundred dollars.
Interfund Trades. Funds may purchase from or sell securities to other Fidelity Funds under procedures adopted by the Board. The procedures have been designed to ensure these interfund trades are executed in accordance with Rule 17a-7 of the 1940 Act. Any interfund trades are included within the respective purchases and sales amounts shown in the Purchases and Sales of Investments note. Interfund trades during the period are noted in the table below.
| | Purchases ($) | Sales ($) | Realized Gain (Loss)($) |
| Fidelity Advisor Overseas Fund | 61 | 4,665 | 611 |
Other. During the period, the investment adviser reimbursed the Fund for certain losses as follows:
| | Amount ($) |
| Fidelity Advisor Overseas Fund | 22 |
6. Committed Line of Credit.
Certain Funds participate with other funds managed by the investment adviser or an affiliate in a $4.25 billion credit facility (the "line of credit") to be utilized for temporary or emergency purposes to fund shareholder redemptions or for other short-term liquidity purposes. The participating funds have agreed to pay commitment fees on their pro-rata portion of the line of credit, which are reflected in Miscellaneous expenses on the Statement of Operations, and are listed below. During the period, there were no borrowings on this line of credit.
7. Security Lending.
Funds lend portfolio securities from time to time in order to earn additional income. Lending agents are used, including National Financial Services (NFS), an affiliate of the investment adviser. Pursuant to a securities lending agreement, NFS will receive a fee, which is capped at 9.9% of a fund's daily lending revenue, for its services as lending agent. A fund may lend securities to certain qualified borrowers, including NFS. On the settlement date of the loan, a fund receives collateral (in the form of U.S. Treasury obligations, letters of credit and/or cash) against the loaned securities and maintains collateral in an amount not less than 100% of the market value of the loaned securities during the period of the loan. The market value of the loaned securities is determined at the close of business of a fund and any additional required collateral is delivered to a fund on the next business day. A fund or borrower may terminate the loan at any time, and if the borrower defaults on its obligation to return the securities loaned because of insolvency or other reasons, a fund may apply collateral received from the borrower against the obligation. A fund may experience delays and costs in recovering the securities loaned. Any cash collateral received is invested in the Fidelity Securities Lending Cash Central Fund. Any loaned securities are identified as such in the Schedule of Investments, and the value of loaned securities and cash collateral at period end, as applicable, are presented in the Statement of Assets and Liabilities. Security lending income represents the income earned on investing cash collateral, less rebates paid to borrowers and any lending agent fees associated with the loan, plus any premium payments received for lending certain types of securities. Security lending income is presented in the Statement of Operations as a component of income from Fidelity Central Funds. Affiliated security lending activity, if any, was as follows:
| | Total Security Lending Fees Paid to NFS ($) | Security Lending Income From Securities Loaned to NFS ($) | Value of Securities Loaned to NFS at Period End ($) |
| Fidelity Advisor Overseas Fund | 1 | - | - |
8. Expense Reductions.
During the period the investment adviser or an affiliate reimbursed and/or waived a portion of fund-level operating expenses in the amount of $17.
9. Distributions to Shareholders.
Distributions to shareholders of each class were as follows:
| | Six months ended April 30, 2024 | Year ended October 31, 2023 |
| Fidelity Advisor Overseas Fund | | |
| Distributions to shareholders | | |
| Class A | $323 | $143 |
| Class M | 922 | 199 |
| Class I | 511 | 328 |
| Class Z | 1,083 | 773 |
Total | $2,839 | $1,443 |
10. Share Transactions.
Share transactions for each class were as follows and may contain in-kind transactions, automatic conversions between classes or exchanges between affiliated funds:
| | Shares | Shares | Dollars | Dollars |
| | Six months ended April 30, 2024 | Year ended October 31, 2023 | Six months ended April 30, 2024 | Year ended October 31, 2023 |
| Fidelity Advisor Overseas Fund | | | | |
| Class A | | | | |
| Shares sold | 51 | 252 | $1,570 | $7,038 |
| Reinvestment of distributions | 11 | 5 | 304 | 135 |
| Shares redeemed | (86) | (319) | (2,617) | (8,807) |
| Net increase (decrease) | (24) | (62) | $(743) | $(1,634) |
| Class M | | | | |
| Shares sold | 269 | 675 | $8,442 | $19,001 |
| Reinvestment of distributions | 31 | 7 | 908 | 197 |
| Shares redeemed | (539) | (1,149) | (16,833) | (32,405) |
| Net increase (decrease) | (239) | (467) | $(7,483) | $(13,207) |
| Class C | | | | |
| Shares sold | 4 | 13 | $85 | $351 |
| Shares redeemed | (10) | (36) | (281) | (934) |
| Net increase (decrease) | (6) | (23) | $(196) | $(583) |
| Class I | | | | |
| Shares sold | 302 | 971 | $9,572 | $28,244 |
| Reinvestment of distributions | 15 | 11 | 445 | 290 |
| Shares redeemed | (498) | (1,147) | (15,305) | (33,319) |
| Net increase (decrease) | (181) | (165) | $(5,288) | $(4,785) |
| Class Z | | | | |
| Shares sold | 324 | 618 | $10,187 | $17,103 |
| Reinvestment of distributions | 9 | 6 | 279 | 165 |
| Shares redeemed | (429) | (846) | (13,395) | (23,938) |
| Net increase (decrease) | (96) | (222) | $(2,929) | $(6,670) |
11. Other.
A fund's organizational documents provide former and current trustees and officers with a limited indemnification against liabilities arising in connection with the performance of their duties to the fund. In the normal course of business, a fund may also enter into contracts that provide general indemnifications. A fund's maximum exposure under these arrangements is unknown as this would be dependent on future claims that may be made against a fund. The risk of material loss from such claims is considered remote.
12. Risk and Uncertainties.
Many factors affect a fund's performance. Developments that disrupt global economies and financial markets, such as pandemics, epidemics, outbreaks of infectious diseases, war, terrorism, and environmental disasters, may significantly affect a fund's investment performance. The effects of these developments to a fund will be impacted by the types of securities in which a fund invests, the financial condition, industry, economic sector, and geographic location of an issuer, and a fund's level of investment in the securities of that issuer. Significant concentrations in security types, issuers, industries, sectors, and geographic locations may magnify the factors that affect a fund's performance.
As a shareholder, you incur two types of costs: (1) transaction costs, which may include sales charges (loads) on purchase payments or redemption proceeds, as applicable and (2) ongoing costs, which generally include management fees, distribution and/or service (12b-1) fees and other Fund expenses. This Example is intended to help you understand your ongoing costs (in dollars) of investing in a fund and to compare these costs with the ongoing costs of investing in other mutual funds.
| The Example is based on an investment of $1,000 invested at the beginning of the period and held for the entire period (November 1, 2023 to April 30, 2024). |
Actual Expenses
The first line of the accompanying table provides information about actual account values and actual expenses. You may use the information in this line, together with the amount you invested, to estimate the expenses that you paid over the period. Simply divide your account value by $1,000.00 (for example, an $8,600 account value divided by $1,000.00 = 8.6), then multiply the result by the number in the first line for a class/Fund under the heading entitled "Expenses Paid During Period" to estimate the expenses you paid on your account during this period. If any fund is a shareholder of any underlying mutual funds or exchange-traded funds (ETFs) (the Underlying Funds), such fund indirectly bears its proportional share of the expenses of the Underlying Funds in addition to the direct expenses incurred presented in the table. These fees and expenses are not included in the annualized expense ratio used to calculate the expense estimate in the table below.
Hypothetical Example for Comparison Purposes
The second line of the accompanying table provides information about hypothetical account values and hypothetical expenses based on the actual expense ratio and an assumed rate of return of 5% per year before expenses, which is not the actual return. The hypothetical account values and expenses may not be used to estimate the actual ending account balance or expenses you paid for the period. You may use this information to compare the ongoing costs of investing in the Fund and other funds. To do so, compare this 5% hypothetical example with the 5% hypothetical examples that appear in the shareholder reports of the other funds. If any fund is a shareholder of any Underlying Funds, such fund indirectly bears its proportional share of the expenses of the Underlying Funds in addition to the direct expenses as presented in the table. These fees and expenses are not included in the annualized expense ratio used to calculate the expense estimate in the table below.
Please note that the expenses shown in the table are meant to highlight your ongoing costs only and do not reflect any transaction costs. Therefore, the second line of the table is useful in comparing ongoing costs only, and will not help you determine the relative total costs of owning different funds. In addition, if these transactional costs were included, your costs would have been higher.
| | | | | Annualized Expense Ratio- A | | Beginning Account Value November 1, 2023 | | Ending Account Value April 30, 2024 | | Expenses Paid During Period- C November 1, 2023 to April 30, 2024 |
| Fidelity Advisor® Overseas Fund | | | | | | | | | | |
| Class A | | | | 1.11% | | | | | | |
| Actual | | | | | | $ 1,000 | | $ 1,205.90 | | $ 6.09 |
Hypothetical-B | | | | | | $ 1,000 | | $ 1,019.34 | | $ 5.57 |
| Class M | | | | 1.33% | | | | | | |
| Actual | | | | | | $ 1,000 | | $ 1,204.40 | | $ 7.29 |
Hypothetical-B | | | | | | $ 1,000 | | $ 1,018.25 | | $ 6.67 |
| Class C | | | | 1.86% | | | | | | |
| Actual | | | | | | $ 1,000 | | $ 1,201.10 | | $ 10.18 |
Hypothetical-B | | | | | | $ 1,000 | | $ 1,015.61 | | $ 9.32 |
| Class I | | | | .82% | | | | | | |
| Actual | | | | | | $ 1,000 | | $ 1,207.30 | | $ 4.50 |
Hypothetical-B | | | | | | $ 1,000 | | $ 1,020.79 | | $ 4.12 |
| Class Z | | | | .70% | | | | | | |
| Actual | | | | | | $ 1,000 | | $ 1,208.40 | | $ 3.84 |
Hypothetical-B | | | | | | $ 1,000 | | $ 1,021.38 | | $ 3.52 |
| |
A Annualized expense ratio reflects expenses net of applicable fee waivers.
B 5% return per year before expenses
C Expenses are equal to the annualized expense ratio, multiplied by the average account value over the period, multiplied by 182/ 366 (to reflect the one-half year period). The fees and expenses of any Underlying Funds are not included in each annualized expense ratio.
Board Approval of Investment Advisory Contracts
Fidelity Advisor Overseas Fund
At its January 2024 meeting, the Board of Trustees, including the Independent Trustees (together, the Board), approved an amended and restated management contract with Fidelity Management & Research Company LLC (FMR) (the Management Contract), and amended and restated sub-advisory agreements (the Sub-Advisory Contracts, and together with the Management Contract, the Advisory Contracts) for the fund, including the fund's sub-advisory agreements with FMR Investment Management (UK) Limited (FMR UK), Fidelity Management & Research (Hong Kong) Limited (FMR H.K.), Fidelity Management & Research (Japan) Limited (FMR Japan), and FIL Investment Advisors (FIL). The Advisory Contracts will be effective March 1, 2024. The Board will consider the annual renewal of the fund's Advisory Contracts in May 2024, following its review of additional materials provided by FMR.
Management Contract. The Board approved the Management Contract, which implements a new fee structure combining the management fee, transfer agent fee (TA Fee), and pricing and bookkeeping fee (P&B Fee) of the fund and each class into a single class-level fee based on tiered schedules and subject to a maximum class-level rate (the Unified Fee). In exchange for the Unified Fee, the fund will receive investment advisory, management, administrative, transfer agent, pricing and bookkeeping services under a single agreement - the Management Contract.
In its consideration of the Management Contract over several meetings, the Board received, reviewed and discussed a comprehensive set of analyses regarding the Unified Fee including (i) the legal framework, (ii) design goals for the Unified Fee, (iii) calculation methodology for the Unified Fee and illustrative examples, (iv) annual and cumulative projected impacts under various scenarios, both in the aggregate and at the fund/class level, (v) explanations of schedules, rate levers and maximum rates and (vi) shareholder benefits and projected savings.
The Board considered that the maximum Unified Fee for each class of the fund would be no higher than the sum of (i) the lowest contractual management fee rate under the fund's existing management contract, which is the individual fund fee rate, if any, plus the lowest contractual marginal group fee rate and (ii) the TA and P&B Fee rates, which are fixed fee rates since December 1, 2023 (together, the Unified Fee Cap). The Board noted that Fidelity has represented that, as a result of this Unified Fee Cap, the Unified Fee would be no greater than the fee rates previously authorized to be charged to the fund for the same services. The Board noted that certain expenses such as performance adjustments, third-party expenses, Rule 12b-1 fees, and certain other miscellaneous expenses would be outside the scope of the Unified Fee and the calculation of such fees would not change as a result of the Unified Fee. The Board considered that, under the Management Contract, a different management fee rate will be applicable to each class of the fund. The Board noted that Fidelity has represented that the difference in expenses between classes is based on differences in class-specific expenses and not due to any difference in advisory or third-party custodial fees or other expenses related to the management of the fund's assets.
The Board considered Fidelity's representations that implementation of the Unified Fee, which includes the Unified Fee Cap, would cause all funds subject to the Unified Fee, including the fund, to experience an immediate reduction on contractual fee rates for services provided under the current management contracts. The Board considered that some funds would not experience lower net total fees as a result of existing fee caps. The Board further considered that, in addition to the contractual fee savings, the Unified Fee offers funds and their shareholders greater protection from future rate increases for services previously offered under separate agreements that are now covered by the Management Contract because such rate increases would require shareholder approval.
Sub-Advisory Contracts. In connection with the Unified Fee changes, the Board considered the Sub-Advisory Contracts, which simplified the calculation of the fees paid by FMR to the sub-advisers under the agreements. The Board noted that the agreements with FMR UK, FMR H.K., and FMR Japan were amended to provide that FMR will compensate each sub-adviser at a fee rate equal to 110% of the sub-adviser's costs incurred in providing services under the agreement. The Board further noted that the agreement with FIL was amended to provide that FMR will compensate FIL at a flat fee rate of 0.44% of the net assets sub-advised by it. The Board considered that, under the Sub-Advisory Contracts, FMR, and not the fund, will continue to pay the sub-advisory fees to each applicable sub-adviser.
The Board further considered that the approval of the fund's Advisory Contracts will not result in any changes in the investment process or strategies employed in the management of the fund's assets or the day-to-day management of the fund or the persons primarily responsible for such management. Further, the Board considered that the Management Contract would not change the obligations and services of FMR and its affiliates on behalf of the fund, and, in particular, there would be no change in the nature and level of advisory, management, administration, transfer agent, and pricing and bookkeeping services provided to the fund by FMR, its affiliates, and each applicable sub-adviser.
In connection with its consideration of future renewals of the fund's Advisory Contracts, the Board will consider: (i) the nature, extent and quality of services provided to the funds, including shareholder and administrative services and investment performance; (ii) the competitiveness of the management fee and total expenses for the fund; (iii) the costs of the services and profitability, including the revenues earned and the expenses incurred in conducting the business of developing, marketing, distributing, managing, administering, and servicing the fund and its shareholders, to the extent applicable; and (iv) whether there have been economies of scale in respect of the Fidelity funds, whether the Fidelity funds (including the fund) have appropriately benefited from any such economies of scale, and whether there is the potential for realization of any further economies.
Based on its evaluation of all of the conclusions and representations noted above, and after considering all factors it believed relevant, the Board concluded that the fund's management fee structure is fair and reasonable, and that the fund's Advisory Contracts should be approved.
The Securities and Exchange Commission adopted Rule 22e-4 under the Investment Company Act of 1940 (the Liquidity Rule) to promote effective liquidity risk management throughout the open-end investment company industry, thereby reducing the risk that funds will be unable to meet their redemption obligations and mitigating dilution of the interests of fund shareholders.
The Fund has adopted and implemented a liquidity risk management program (the Program) reasonably designed to assess and manage the Fund's liquidity risk and to comply with the requirements of the Liquidity Rule. The Fund's Board of Trustees (the Board) has designated the Fund's investment adviser as administrator of the Program. The Fidelity advisers have established a Liquidity Risk Management Committee (the LRM Committee) to manage the Program for each of the Fidelity Funds. The LRM Committee monitors the adequacy and effectiveness of implementation of the Program and on a periodic basis assesses each Fund's liquidity risk based on a variety of factors including (1) the Fund's investment strategy, (2) portfolio liquidity and cash flow projections during normal and reasonably foreseeable stressed conditions, (3) shareholder redemptions, (4) borrowings and other funding sources and (5) certain factors specific to ETFs including the effect of the Fund's prices and spreads, market participants, and basket compositions on the overall liquidity of the Fund's portfolio, as applicable.
In accordance with the Program, each of the Fund's portfolio investments is classified into one of four defined liquidity categories based on a determination of a reasonable expectation for how long it would take to convert the investment to cash (or sell or dispose of the investment) without significantly changing its market value.
- Highly liquid investments - cash or convertible to cash within three business days or less
- Moderately liquid investments - convertible to cash in three to seven calendar days
- Less liquid investments - can be sold or disposed of, but not settled, within seven calendar days
- Illiquid investments - cannot be sold or disposed of within seven calendar days
Liquidity classification determinations take into account a variety of factors including various market, trading and investment-specific considerations, as well as market depth, and generally utilize analysis from a third-party liquidity metrics service.
The Liquidity Rule places a 15% limit on a fund's illiquid investments and requires funds that do not primarily hold assets that are highly liquid investments to determine and maintain a minimum percentage of the fund's net assets to be invested in highly liquid investments (highly liquid investment minimum or HLIM). The Program includes provisions reasonably designed to comply with the 15% limit on illiquid investments and for determining, periodically reviewing and complying with the HLIM requirement as applicable.
At a recent meeting of the Fund's Board of Trustees, the LRM Committee provided a written report to the Board pertaining to the operation, adequacy, and effectiveness of the Program for the period December 1, 2022 through November 30, 2023. The report concluded that the Program is operating effectively and is reasonably designed to assess and manage the Fund's liquidity risk.
1.703565.126
OS-SANN-0624
Fidelity Advisor® Focused Emerging Markets Fund
Semi-Annual Report
April 30, 2024
Contents
To view a fund's proxy voting guidelines and proxy voting record for the 12-month period ended June 30, visit http://www.fidelity.com/proxyvotingresults or visit the Securities and Exchange Commission's (SEC) web site at http://www.sec.gov.
You may also call 1-877-208-0098 to request a free copy of the proxy voting guidelines.
Standard & Poor's, S&P and S&P 500 are registered service marks of The McGraw-Hill Companies, Inc. and have been licensed for use by Fidelity Distributors Corporation.
Other third-party marks appearing herein are the property of their respective owners.
All other marks appearing herein are registered or unregistered trademarks or service marks of FMR LLC or an affiliated company. © 2024 FMR LLC. All rights reserved.
This report and the financial statements contained herein are submitted for the general information of the shareholders of the Fund. This report is not authorized for distribution to prospective investors in the Fund unless preceded or accompanied by an effective prospectus.
A fund files its complete schedule of portfolio holdings with the SEC for the first and third quarters of each fiscal year on Form N-PORT. Forms N-PORT are available on the SEC's web site at http://www.sec.gov. A fund's Forms N-PORT may be reviewed and copied at the SEC's Public Reference Room in Washington, DC. Information regarding the operation of the SEC's Public Reference Room may be obtained by calling 1-800-SEC-0330.
For a complete list of a fund's portfolio holdings, view the most recent holdings listing, semiannual report, or annual report on Fidelity's web site at http://www.fidelity.com, http://www.institutional.fidelity.com, or http://www.401k.com, as applicable.
NOT FDIC INSURED •MAY LOSE VALUE •NO BANK GUARANTEE
Neither the Fund nor Fidelity Distributors Corporation is a bank.
Top Holdings (% of Fund's net assets) |
| |
| Taiwan Semiconductor Manufacturing Co. Ltd. (Taiwan, Semiconductors & Semiconductor Equipment) | 9.1 | |
| Tencent Holdings Ltd. (China, Interactive Media & Services) | 8.6 | |
| Samsung Electronics Co. Ltd. (Korea (South), Technology Hardware, Storage & Peripherals) | 6.9 | |
| Haier Smart Home Co. Ltd. (A Shares) (China, Household Durables) | 3.8 | |
| Meituan Class B (China, Hotels, Restaurants & Leisure) | 3.0 | |
| China Life Insurance Co. Ltd. (H Shares) (China, Insurance) | 2.9 | |
| Barrick Gold Corp. (Canada, Metals & Mining) | 2.7 | |
| National Bank of Greece SA (Greece, Banks) | 2.6 | |
| Alibaba Group Holding Ltd. (China, Broadline Retail) | 2.5 | |
| Korea Aerospace Industries Ltd. (Korea (South), Aerospace & Defense) | 2.3 | |
| | 44.4 | |
| |
| Market Sectors (% of Fund's net assets) |
| |
| Financials | 21.0 | |
| Information Technology | 18.6 | |
| Consumer Discretionary | 16.0 | |
| Materials | 11.3 | |
| Communication Services | 10.1 | |
| Industrials | 9.5 | |
| Consumer Staples | 4.4 | |
| Health Care | 4.3 | |
| Energy | 2.9 | |
| |
Asset Allocation (% of Fund's net assets) |
|
|
Geographic Diversification (% of Fund's net assets) |
|
* Includes Short-Term investments and Net Other Assets (Liabilities). Percentages are adjusted for the effect of derivatives, if applicable. |
| |
Showing Percentage of Net Assets
| Common Stocks - 93.6% |
| | | Shares | Value ($) |
| Australia - 1.0% | | | |
| Paladin Energy Ltd. (Australia) (a) | | 5,043,038 | 44,755,692 |
| Brazil - 2.2% | | | |
| Localiza Rent a Car SA | | 14,847 | 140,190 |
| Suzano SA | | 5,606,600 | 63,120,948 |
| XP, Inc. Class A | | 1,636,600 | 33,501,202 |
TOTAL BRAZIL | | | 96,762,340 |
| Canada - 2.7% | | | |
| Barrick Gold Corp. | | 7,026,300 | 116,917,632 |
| Chile - 2.3% | | | |
| Antofagasta PLC | | 3,586,500 | 99,041,395 |
| China - 33.2% | | | |
| Alibaba Group Holding Ltd. | | 11,769,800 | 110,201,397 |
| China Life Insurance Co. Ltd. (H Shares) | | 97,624,000 | 128,563,316 |
| Haier Smart Home Co. Ltd. (A Shares) | | 39,853,199 | 165,802,035 |
| Hansoh Pharmaceutical Group Co. Ltd. (b) | | 39,497,645 | 87,277,767 |
| Industrial & Commercial Bank of China Ltd. (H Shares) | | 158,615,000 | 85,053,894 |
| Kweichow Moutai Co. Ltd. (A Shares) | | 424,903 | 99,625,388 |
| Meituan Class B (a)(b) | | 9,499,240 | 129,707,669 |
| New Oriental Education & Technology Group, Inc. (a) | | 8,584,100 | 68,208,964 |
| PDD Holdings, Inc. ADR (a) | | 501,800 | 62,815,324 |
| Shangri-La Asia Ltd. | | 32,594,000 | 22,734,022 |
| Shenzhen Inovance Technology Co. Ltd. (A Shares) | | 8,143,013 | 66,780,541 |
| Tencent Holdings Ltd. | | 8,581,800 | 376,596,849 |
| Tsingtao Brewery Co. Ltd. (H Shares) | | 6,656,075 | 47,966,352 |
TOTAL CHINA | | | 1,451,333,518 |
| Greece - 2.6% | | | |
| National Bank of Greece SA (a) | | 13,974,021 | 112,742,849 |
| Hong Kong - 1.1% | | | |
| Pacific Basin Shipping Ltd. | | 138,317,000 | 47,893,350 |
| Hungary - 1.4% | | | |
| Richter Gedeon PLC | | 2,385,846 | 60,755,631 |
| India - 10.1% | | | |
| Axis Bank Ltd. | | 5,060,700 | 70,617,644 |
| Bharat Heavy Electricals Ltd. | | 11,329,600 | 38,098,812 |
| HDFC Bank Ltd. | | 4,089,796 | 74,251,986 |
| ICICI Bank Ltd. | | 6,209,900 | 85,541,557 |
| JK Cement Ltd. | | 495,462 | 23,694,110 |
| Larsen & Toubro Ltd. | | 1,386,145 | 59,567,771 |
| Shree Cement Ltd. | | 59,653 | 17,459,585 |
| Solar Industries India Ltd. | | 551,012 | 59,070,077 |
| Zomato Ltd. (a) | | 6,726,695 | 15,520,308 |
TOTAL INDIA | | | 443,821,850 |
| Korea (South) - 12.4% | | | |
| Hd Hyundai Mipo (a) | | 830,712 | 44,606,219 |
| Hyundai Motor Co. Ltd. | | 302,470 | 54,254,766 |
| Korea Aerospace Industries Ltd. | | 2,695,238 | 100,076,429 |
| Samsung Biologics Co. Ltd. (a)(b) | | 72,960 | 40,892,925 |
| Samsung Electronics Co. Ltd. | | 5,466,021 | 302,987,149 |
TOTAL KOREA (SOUTH) | | | 542,817,488 |
| Mexico - 2.0% | | | |
| Grupo Financiero Banorte S.A.B. de CV Series O | | 4,314,900 | 42,706,320 |
| Wal-Mart de Mexico SA de CV Series V | | 11,606,400 | 43,306,982 |
TOTAL MEXICO | | | 86,013,302 |
| Peru - 1.9% | | | |
| Credicorp Ltd. (United States) | | 501,300 | 83,020,293 |
| Poland - 1.6% | | | |
| Powszechna Kasa Oszczednosci Bank SA | | 4,591,100 | 68,701,255 |
| Russia - 0.4% | | | |
| LUKOIL PJSC sponsored ADR (a)(c) | | 782,000 | 9,853,200 |
| Sberbank of Russia sponsored ADR (a)(c) | | 3,242,100 | 57,709 |
| Yandex NV Series A (a)(c) | | 798,300 | 9,260,280 |
TOTAL RUSSIA | | | 19,171,189 |
| South Africa - 4.1% | | | |
| FirstRand Ltd. (d) | | 20,152,600 | 69,569,841 |
| Impala Platinum Holdings Ltd. | | 12,143,100 | 54,055,671 |
| MTN Group Ltd. (d) | | 11,767,554 | 56,399,622 |
TOTAL SOUTH AFRICA | | | 180,025,134 |
| Taiwan - 14.6% | | | |
| Asia Vital Components Co. Ltd. | | 2,162,000 | 42,571,217 |
| ECLAT Textile Co. Ltd. | | 4,540,000 | 71,306,000 |
| HIWIN Technologies Corp. | | 8,025,159 | 56,648,782 |
| Taiwan Semiconductor Manufacturing Co. Ltd. | | 16,667,554 | 398,374,471 |
| Yageo Corp. | | 3,684,237 | 70,150,041 |
TOTAL TAIWAN | | | 639,050,511 |
| TOTAL COMMON STOCKS (Cost $3,751,825,112) | | | 4,092,823,429 |
| | | | |
| Nonconvertible Preferred Stocks - 4.5% |
| | | Shares | Value ($) |
| Brazil - 4.5% | | | |
| Gerdau SA sponsored ADR | | 18,365,080 | 63,910,478 |
| Itau Unibanco Holding SA | | 9,624,180 | 58,123,923 |
| Petroleo Brasileiro SA - Petrobras sponsored ADR | | 4,444,478 | 75,422,792 |
| | | | |
| TOTAL NONCONVERTIBLE PREFERRED STOCKS (Cost $164,620,591) | | | 197,457,193 |
| | | | |
| Money Market Funds - 2.9% |
| | | Shares | Value ($) |
| Fidelity Cash Central Fund 5.39% (e) | | 83,948,360 | 83,965,150 |
| Fidelity Securities Lending Cash Central Fund 5.39% (e)(f) | | 40,281,330 | 40,285,358 |
| TOTAL MONEY MARKET FUNDS (Cost $124,250,508) | | | 124,250,508 |
| | | | |
| TOTAL INVESTMENT IN SECURITIES - 101.0% (Cost $4,040,696,211) | 4,414,531,130 |
NET OTHER ASSETS (LIABILITIES) - (1.0)% | (43,598,326) |
| NET ASSETS - 100.0% | 4,370,932,804 |
| | |
Legend
| (b) | Security exempt from registration under Rule 144A of the Securities Act of 1933. These securities may be resold in transactions exempt from registration, normally to qualified institutional buyers. At the end of the period, the value of these securities amounted to $257,878,361 or 5.9% of net assets. |
| (d) | Security or a portion of the security is on loan at period end. |
| (e) | Affiliated fund that is generally available only to investment companies and other accounts managed by Fidelity Investments. The rate quoted is the annualized seven-day yield of the fund at period end. A complete unaudited listing of the fund's holdings as of its most recent quarter end is available upon request. In addition, each Fidelity Central Fund's financial statements are available on the SEC's website or upon request. |
| (f) | Investment made with cash collateral received from securities on loan. |
Affiliated Central Funds
Fiscal year to date information regarding the Fund's investments in Fidelity Central Funds, including the ownership percentage, is presented below.
| Affiliate | Value, beginning of period ($) | Purchases ($) | Sales Proceeds ($) | Dividend Income ($) | Realized Gain (loss) ($) | Change in Unrealized appreciation (depreciation) ($) | Value, end of period ($) | % ownership, end of period |
| Fidelity Cash Central Fund 5.39% | 21,497,428 | 749,233,483 | 686,765,165 | 2,405,307 | (596) | - | 83,965,150 | 0.2% |
| Fidelity Securities Lending Cash Central Fund 5.39% | - | 94,195,616 | 53,910,258 | 76,991 | - | - | 40,285,358 | 0.1% |
| Total | 21,497,428 | 843,429,099 | 740,675,423 | 2,482,298 | (596) | - | 124,250,508 | |
| | | | | | | | | |
Amounts in the dividend income column in the above table include any capital gain distributions from underlying funds, which are presented in the corresponding line item in the Statement of Operations, if applicable.
Amounts in the dividend income column for Fidelity Securities Lending Cash Central Fund represents the income earned on investing cash collateral, less rebates paid to borrowers and any lending agent fees associated with the loan, plus any premium payments received for lending certain types of securities.
Amounts included in the purchases and sales proceeds columns may include in-kind transactions, if applicable.
Investment Valuation
The following is a summary of the inputs used, as of April 30, 2024, involving the Fund's assets and liabilities carried at fair value. The inputs or methodology used for valuing securities may not be an indication of the risk associated with investing in those securities. For more information on valuation inputs, and their aggregation into the levels used below, please refer to the Investment Valuation section in the accompanying Notes to Financial Statements.
| Valuation Inputs at Reporting Date: |
| Description | Total ($) | Level 1 ($) | Level 2 ($) | Level 3 ($) |
Investments in Securities: | | | | |
|
| Equities: | | | | |
Communication Services | 442,256,751 | - | 432,996,471 | 9,260,280 |
Consumer Discretionary | 700,550,485 | 62,815,324 | 637,735,161 | - |
Consumer Staples | 190,898,722 | 43,306,982 | 147,591,740 | - |
Energy | 130,031,684 | 75,422,792 | 44,755,692 | 9,853,200 |
Financials | 912,451,789 | 398,795,842 | 513,598,238 | 57,709 |
Health Care | 188,926,323 | 60,755,631 | 128,170,692 | - |
Industrials | 413,812,094 | 140,190 | 413,671,904 | - |
Information Technology | 814,082,878 | - | 814,082,878 | - |
Materials | 497,269,896 | 342,990,453 | 154,279,443 | - |
|
| Money Market Funds | 124,250,508 | 124,250,508 | - | - |
| Total Investments in Securities: | 4,414,531,130 | 1,108,477,722 | 3,286,882,219 | 19,171,189 |
| Statement of Assets and Liabilities |
| | | | April 30, 2024 (Unaudited) |
| | | | | |
| Assets | | | | |
| Investment in securities, at value (including securities loaned of $37,636,896) - See accompanying schedule: | | | | |
Unaffiliated issuers (cost $3,916,445,703) | $ | 4,290,280,622 | | |
Fidelity Central Funds (cost $124,250,508) | | 124,250,508 | | |
| | | | | |
| | | | | |
| Total Investment in Securities (cost $4,040,696,211) | | | $ | 4,414,531,130 |
| Foreign currency held at value (cost $5,232,713) | | | | 5,229,984 |
| Receivable for investments sold | | | | 10,461,851 |
| Receivable for fund shares sold | | | | 3,816,143 |
| Dividends receivable | | | | 7,504,524 |
| Distributions receivable from Fidelity Central Funds | | | | 793,725 |
| Prepaid expenses | | | | 1,149 |
| Other receivables | | | | 268,712 |
Total assets | | | | 4,442,607,218 |
| Liabilities | | | | |
| Payable for investments purchased | $ | 7,420,390 | | |
| Payable for fund shares redeemed | | 2,923,290 | | |
| Accrued management fee | | 3,074,800 | | |
| Distribution and service plan fees payable | | 66,882 | | |
| Deferred taxes | | 16,994,785 | | |
| Other payables and accrued expenses | | 908,909 | | |
| Collateral on securities loaned | | 40,285,358 | | |
| Total liabilities | | | | 71,674,414 |
| Net Assets | | | $ | 4,370,932,804 |
| Net Assets consist of: | | | | |
| Paid in capital | | | $ | 4,351,726,014 |
| Total accumulated earnings (loss) | | | | 19,206,790 |
| Net Assets | | | $ | 4,370,932,804 |
| | | | | |
| Net Asset Value and Maximum Offering Price | | | | |
| Class A : | | | | |
Net Asset Value and redemption price per share ($180,369,742 ÷ 6,045,782 shares)(a) | | | $ | 29.83 |
| Maximum offering price per share (100/94.25 of $29.83) | | | $ | 31.65 |
| Class M : | | | | |
Net Asset Value and redemption price per share ($31,504,870 ÷ 1,067,607 shares)(a) | | | $ | 29.51 |
| Maximum offering price per share (100/96.50 of $29.51) | | | $ | 30.58 |
| Class C : | | | | |
Net Asset Value and offering price per share ($19,527,461 ÷ 704,006 shares)(a) | | | $ | 27.74 |
| Class I : | | | | |
Net Asset Value, offering price and redemption price per share ($2,605,134,284 ÷ 86,938,120 shares) | | | $ | 29.97 |
| Class Z : | | | | |
Net Asset Value, offering price and redemption price per share ($1,534,396,447 ÷ 51,307,622 shares) | | | $ | 29.91 |
(a)Redemption price per share is equal to net asset value less any applicable contingent deferred sales charge. |
| Statement of Operations |
| | | | Six months ended April 30, 2024 (Unaudited) |
| Investment Income | | | | |
| Dividends | | | $ | 34,174,862 |
| Income from Fidelity Central Funds (including $76,991 from security lending) | | | | 2,482,298 |
| Income before foreign taxes withheld | | | $ | 36,657,160 |
| Less foreign taxes withheld | | | | (4,053,345) |
| Total income | | | | 32,603,815 |
| Expenses | | | | |
| Management fee | $ | 15,911,163 | | |
| Transfer agent fees | | 1,625,577 | | |
| Distribution and service plan fees | | 372,216 | | |
| Accounting fees | | 515,052 | | |
| Custodian fees and expenses | | 289,210 | | |
| Independent trustees' fees and expenses | | 9,753 | | |
| Registration fees | | 136,164 | | |
| Audit | | 48,855 | | |
| Legal | | 2,052 | | |
| Interest | | 19,144 | | |
| Miscellaneous | | 7,046 | | |
| Total expenses before reductions | | 18,936,232 | | |
| Expense reductions | | (178,455) | | |
| Total expenses after reductions | | | | 18,757,777 |
| Net Investment income (loss) | | | | 13,846,038 |
| Realized and Unrealized Gain (Loss) | | | | |
| Net realized gain (loss) on: | | | | |
| Investment Securities: | | | | |
| Unaffiliated issuers (net of foreign taxes of $9,179,994) | | (28,249,275) | | |
| Fidelity Central Funds | | (596) | | |
| Foreign currency transactions | | (901,497) | | |
| Total net realized gain (loss) | | | | (29,151,368) |
| Change in net unrealized appreciation (depreciation) on: | | | | |
| Investment Securities: | | | | |
| Unaffiliated issuers (net of increase in deferred foreign taxes of $8,186,638) | | 675,649,776 | | |
| Assets and liabilities in foreign currencies | | (83,609) | | |
| Total change in net unrealized appreciation (depreciation) | | | | 675,566,167 |
| Net gain (loss) | | | | 646,414,799 |
| Net increase (decrease) in net assets resulting from operations | | | $ | 660,260,837 |
| Statement of Changes in Net Assets |
| |
| | Six months ended April 30, 2024 (Unaudited) | | Year ended October 31, 2023 |
| Increase (Decrease) in Net Assets | | | | |
| Operations | | | | |
| Net investment income (loss) | $ | 13,846,038 | $ | 61,421,663 |
| Net realized gain (loss) | | (29,151,368) | | (123,198,980) |
| Change in net unrealized appreciation (depreciation) | | 675,566,167 | | 170,184,390 |
| Net increase (decrease) in net assets resulting from operations | | 660,260,837 | | 108,407,073 |
| Distributions to shareholders | | (63,079,566) | | (23,514,660) |
| | | | | |
| Share transactions - net increase (decrease) | | 75,679,402 | | 1,894,591,299 |
| Total increase (decrease) in net assets | | 672,860,673 | | 1,979,483,712 |
| | | | | |
| Net Assets | | | | |
| Beginning of period | | 3,698,072,131 | | 1,718,588,419 |
| End of period | $ | 4,370,932,804 | $ | 3,698,072,131 |
| | | | | |
| | | | | |
Financial Highlights
Fidelity Advisor® Focused Emerging Markets Fund Class A |
| |
| | Six months ended (Unaudited) April 30, 2024 | | Years ended October 31, 2023 | | 2022 | | 2021 | | 2020 | | 2019 |
Selected Per-Share Data | | | | | | | | | | | | |
| Net asset value, beginning of period | $ | 25.58 | $ | 22.89 | $ | 36.01 | $ | 30.73 | $ | 26.18 | $ | 24.48 |
| Income from Investment Operations | | | | | | | | | | | | |
Net investment income (loss) A,B | | .05 | | .47 C | | .59 | | .31 | | .15 | | .44 D |
| Net realized and unrealized gain (loss) | | 4.56 | | 2.42 | | (12.07) | | 5.64 | | 4.48 | | 4.26 |
| Total from investment operations | | 4.61 | | 2.89 | | (11.48) | | 5.95 | | 4.63 | | 4.70 |
| Distributions from net investment income | | (.36) | | (.20) | | (.52) | | (.05) | | (.08) | | (.06) E |
| Distributions from net realized gain | | - | | - | | (1.12) | | (.62) | | - | | (2.94) E |
| Total distributions | | (.36) | | (.20) | | (1.64) | | (.67) | | (.08) | | (3.00) |
| Net asset value, end of period | $ | 29.83 | $ | 25.58 | $ | 22.89 | $ | 36.01 | $ | 30.73 | $ | 26.18 |
Total Return F,G,H | | | | 12.59% | | (33.30)% | | 19.43% | | 17.71% | | 19.42% |
Ratios to Average Net Assets B,I,J | | | | | | | | | | | | |
| Expenses before reductions | | 1.28% K | | 1.33% | | 1.34% | | 1.32% | | 1.39% | | 1.41% |
| Expenses net of fee waivers, if any | | | | 1.33% | | 1.34% | | 1.32% | | 1.39% | | 1.41% |
| Expenses net of all reductions | | 1.27% K | | 1.33% | | 1.34% | | 1.32% | | 1.36% | | 1.39% |
| Net investment income (loss) | | .38% K | | 1.72% C | | 1.99% | | .83% | | .54% | | 1.62% D |
| Supplemental Data | | | | | | | | | | | | |
| Net assets, end of period (000 omitted) | $ | 180,370 | $ | 130,156 | $ | 117,404 | $ | 191,955 | $ | 150,749 | $ | 144,062 |
Portfolio turnover rate L | | | | 33% | | 63% | | 51% | | 66% | | 166% M |
ACalculated based on average shares outstanding during the period.
BNet investment income (loss) is affected by the timing of the declaration of dividends by any underlying mutual funds or exchange-traded funds (ETFs). Net investment income (loss) of any mutual funds or ETFs is not included in the Fund's net investment income (loss) ratio.
CNet investment income per share reflects one or more large, non-recurring dividend(s) which amounted to $.10 per share. Excluding such non-recurring dividend(s), the ratio of net investment income (loss) to average net assets would have been 1.37%.
DNet investment income per share reflects one or more large, non-recurring dividend(s) which amounted to $.32 per share. Excluding such non-recurring dividend(s), the ratio of net investment income (loss) to average net assets would have been .44%.
EThe amount shown reflects reclassifications related to book to tax differences that were made in the year shown.
FTotal returns for periods of less than one year are not annualized.
GTotal returns would have been lower if certain expenses had not been reduced during the applicable periods shown.
HTotal returns do not include the effect of the sales charges.
IFees and expenses of any underlying mutual funds or exchange-traded funds (ETFs) are not included in the Fund's expense ratio. The Fund indirectly bears its proportionate share of these expenses. For additional expense information related to investments in Fidelity Central Funds, please refer to the "Investments in Fidelity Central Funds" note found in the Notes to Financial Statements section of the most recent Annual or Semi-Annual report.
JExpense ratios reflect operating expenses of the class. Expenses before reductions do not reflect amounts reimbursed, waived, or reduced through arrangements with the investment adviser, brokerage services, or other offset arrangements, if applicable, and do not represent the amount paid by the class during periods when reimbursements, waivers or reductions occur.
KAnnualized.
LAmount does not include the portfolio activity of any underlying mutual funds or exchange-traded funds (ETFs).
MPortfolio turnover rate excludes securities received or delivered in-kind.
Fidelity Advisor® Focused Emerging Markets Fund Class M |
| |
| | Six months ended (Unaudited) April 30, 2024 | | Years ended October 31, 2023 | | 2022 | | 2021 | | 2020 | | 2019 |
Selected Per-Share Data | | | | | | | | | | | | |
| Net asset value, beginning of period | $ | 25.26 | $ | 22.60 | $ | 35.56 | $ | 30.36 | $ | 25.86 | $ | 24.25 |
| Income from Investment Operations | | | | | | | | | | | | |
Net investment income (loss) A,B | | .02 | | .39 C | | .50 | | .20 | | .07 | | .36 D |
| Net realized and unrealized gain (loss) | | 4.51 | | 2.40 | | (11.94) | | 5.58 | | 4.43 | | 4.20 |
| Total from investment operations | | 4.53 | | 2.79 | | (11.44) | | 5.78 | | 4.50 | | 4.56 |
| Distributions from net investment income | | (.28) | | (.13) | | (.41) | | - | | - | | (.02) E |
| Distributions from net realized gain | | - | | - | | (1.12) | | (.58) | | - | | (2.93) E |
| Total distributions | | (.28) | | (.13) | | (1.52) F | | (.58) | | - | | (2.95) |
| Net asset value, end of period | $ | 29.51 | $ | 25.26 | $ | 22.60 | $ | 35.56 | $ | 30.36 | $ | 25.86 |
Total Return G,H,I | | | | 12.30% | | (33.50)% | | 19.10% | | 17.40% | | 19.03% |
Ratios to Average Net Assets B,J,K | | | | | | | | | | | | |
| Expenses before reductions | | 1.50% L | | 1.60% | | 1.62% | | 1.61% | | 1.68% | | 1.70% |
| Expenses net of fee waivers, if any | | | | 1.60% | | 1.62% | | 1.60% | | 1.67% | | 1.70% |
| Expenses net of all reductions | | 1.49% L | | 1.59% | | 1.62% | | 1.60% | | 1.64% | | 1.68% |
| Net investment income (loss) | | .16% L | | 1.45% C | | 1.71% | | .55% | | .25% | | 1.33% D |
| Supplemental Data | | | | | | | | | | | | |
| Net assets, end of period (000 omitted) | $ | 31,505 | $ | 29,402 | $ | 28,497 | $ | 48,494 | $ | 42,509 | $ | 45,310 |
Portfolio turnover rate M | | | | 33% | | 63% | | 51% | | 66% | | 166% N |
ACalculated based on average shares outstanding during the period.
BNet investment income (loss) is affected by the timing of the declaration of dividends by any underlying mutual funds or exchange-traded funds (ETFs). Net investment income (loss) of any mutual funds or ETFs is not included in the Fund's net investment income (loss) ratio.
CNet investment income per share reflects one or more large, non-recurring dividend(s) which amounted to $.09 per share. Excluding such non-recurring dividend(s), the ratio of net investment income (loss) to average net assets would have been 1.10%.
DNet investment income per share reflects one or more large, non-recurring dividend(s) which amounted to $.32 per share. Excluding such non-recurring dividend(s), the ratio of net investment income (loss) to average net assets would have been .15%.
EThe amount shown reflects reclassifications related to book to tax differences that were made in the year shown.
FTotal distributions per share do not sum due to rounding.
GTotal returns for periods of less than one year are not annualized.
HTotal returns would have been lower if certain expenses had not been reduced during the applicable periods shown.
ITotal returns do not include the effect of the sales charges.
JFees and expenses of any underlying mutual funds or exchange-traded funds (ETFs) are not included in the Fund's expense ratio. The Fund indirectly bears its proportionate share of these expenses. For additional expense information related to investments in Fidelity Central Funds, please refer to the "Investments in Fidelity Central Funds" note found in the Notes to Financial Statements section of the most recent Annual or Semi-Annual report.
KExpense ratios reflect operating expenses of the class. Expenses before reductions do not reflect amounts reimbursed, waived, or reduced through arrangements with the investment adviser, brokerage services, or other offset arrangements, if applicable, and do not represent the amount paid by the class during periods when reimbursements, waivers or reductions occur.
LAnnualized.
MAmount does not include the portfolio activity of any underlying mutual funds or exchange-traded funds (ETFs).
NPortfolio turnover rate excludes securities received or delivered in-kind.
Fidelity Advisor® Focused Emerging Markets Fund Class C |
| |
| | Six months ended (Unaudited) April 30, 2024 | | Years ended October 31, 2023 | | 2022 | | 2021 | | 2020 | | 2019 |
Selected Per-Share Data | | | | | | | | | | | | |
| Net asset value, beginning of period | $ | 23.69 | $ | 21.21 | $ | 33.42 | $ | 28.57 | $ | 24.46 | $ | 23.18 |
| Income from Investment Operations | | | | | | | | | | | | |
Net investment income (loss) A,B | | (.04) | | .24 C | | .33 | | .01 | | (.06) | | .22 D |
| Net realized and unrealized gain (loss) | | 4.23 | | 2.24 | | (11.21) | | 5.27 | | 4.17 | | 4.02 |
| Total from investment operations | | 4.19 | | 2.48 | | (10.88) | | 5.28 | | 4.11 | | 4.24 |
| Distributions from net investment income | | (.14) | | - | | (.21) | | - | | - | | (.02) E |
| Distributions from net realized gain | | - | | - | | (1.12) | | (.43) | | - | | (2.94) E |
| Total distributions | | (.14) | | - | | (1.33) | | (.43) | | - | | (2.96) |
| Net asset value, end of period | $ | 27.74 | $ | 23.69 | $ | 21.21 | $ | 33.42 | $ | 28.57 | $ | 24.46 |
Total Return F,G,H | | | | 11.69% | | (33.82)% | | 18.52% | | 16.80% | | 18.48% |
Ratios to Average Net Assets B,I,J | | | | | | | | | | | | |
| Expenses before reductions | | 1.99% K | | 2.10% | | 2.12% | | 2.11% | | 2.18% | | 2.20% |
| Expenses net of fee waivers, if any | | | | 2.10% | | 2.12% | | 2.11% | | 2.17% | | 2.20% |
| Expenses net of all reductions | | 1.99% K | | 2.10% | | 2.12% | | 2.11% | | 2.14% | | 2.17% |
| Net investment income (loss) | | (.34)% K | | .95% C | | 1.21% | | .04% | | (.25)% | | .83% D |
| Supplemental Data | | | | | | | | | | | | |
| Net assets, end of period (000 omitted) | $ | 19,527 | $ | 19,041 | $ | 19,733 | $ | 37,777 | $ | 35,268 | $ | 41,615 |
Portfolio turnover rate L | | | | 33% | | 63% | | 51% | | 66% | | 166% M |
ACalculated based on average shares outstanding during the period.
BNet investment income (loss) is affected by the timing of the declaration of dividends by any underlying mutual funds or exchange-traded funds (ETFs). Net investment income (loss) of any mutual funds or ETFs is not included in the Fund's net investment income (loss) ratio.
CNet investment income per share reflects one or more large, non-recurring dividend(s) which amounted to $.09 per share. Excluding such non-recurring dividend(s), the ratio of net investment income (loss) to average net assets would have been .60%.
DNet investment income per share reflects one or more large, non-recurring dividend(s) which amounted to $.30 per share. Excluding such non-recurring dividend(s), the ratio of net investment income (loss) to average net assets would have been (.34)%.
EThe amount shown reflects reclassifications related to book to tax differences that were made in the year shown.
FTotal returns would have been lower if certain expenses had not been reduced during the applicable periods shown.
GTotal returns for periods of less than one year are not annualized.
HTotal returns do not include the effect of the contingent deferred sales charge.
IFees and expenses of any underlying mutual funds or exchange-traded funds (ETFs) are not included in the Fund's expense ratio. The Fund indirectly bears its proportionate share of these expenses. For additional expense information related to investments in Fidelity Central Funds, please refer to the "Investments in Fidelity Central Funds" note found in the Notes to Financial Statements section of the most recent Annual or Semi-Annual report.
JExpense ratios reflect operating expenses of the class. Expenses before reductions do not reflect amounts reimbursed, waived, or reduced through arrangements with the investment adviser, brokerage services, or other offset arrangements, if applicable, and do not represent the amount paid by the class during periods when reimbursements, waivers or reductions occur.
KAnnualized.
LAmount does not include the portfolio activity of any underlying mutual funds or exchange-traded funds (ETFs).
MPortfolio turnover rate excludes securities received or delivered in-kind.
Fidelity Advisor® Focused Emerging Markets Fund Class I |
| |
| | Six months ended (Unaudited) April 30, 2024 | | Years ended October 31, 2023 | | 2022 | | 2021 | | 2020 | | 2019 |
Selected Per-Share Data | | | | | | | | | | | | |
| Net asset value, beginning of period | $ | 25.75 | $ | 23.06 | $ | 36.27 | $ | 30.94 | $ | 26.34 | $ | 24.65 |
| Income from Investment Operations | | | | | | | | | | | | |
Net investment income (loss) A,B | | .09 | | .56 C | | .66 | | .42 | | .24 | | .54 D |
| Net realized and unrealized gain (loss) | | 4.59 | | 2.43 | | (12.12) | | 5.67 | | 4.51 | | 4.26 |
| Total from investment operations | | 4.68 | | 2.99 | | (11.46) | | 6.09 | | 4.75 | | 4.80 |
| Distributions from net investment income | | (.46) | | (.30) | | (.63) | | (.15) | | (.15) | | (.17) E |
| Distributions from net realized gain | | - | | - | | (1.12) | | (.62) | | - | | (2.94) E |
| Total distributions | | (.46) | | (.30) | | (1.75) | | (.76) F | | (.15) | | (3.11) |
| Net asset value, end of period | $ | 29.97 | $ | 25.75 | $ | 23.06 | $ | 36.27 | $ | 30.94 | $ | 26.34 |
Total Return G,H | | | | 12.92% | | (33.08)% | | 19.77% | | 18.13% | | 19.78% |
Ratios to Average Net Assets B,I,J | | | | | | | | | | | | |
| Expenses before reductions | | .99% K | | 1.02% | | 1.03% | | 1.03% | | 1.06% | | 1.09% |
| Expenses net of fee waivers, if any | | | | 1.01% | | 1.03% | | 1.03% | | 1.06% | | 1.09% |
| Expenses net of all reductions | | .98% K | | 1.01% | | 1.03% | | 1.03% | | 1.03% | | 1.06% |
| Net investment income (loss) | | .67% K | | 2.04% C | | 2.31% | | 1.13% | | .86% | | 1.94% D |
| Supplemental Data | | | | | | | | | | | | |
| Net assets, end of period (000 omitted) | $ | 2,605,134 | $ | 2,063,159 | $ | 696,741 | $ | 660,307 | $ | 312,731 | $ | 288,485 |
Portfolio turnover rate L | | | | 33% | | 63% | | 51% | | 66% | | 166% M |
ACalculated based on average shares outstanding during the period.
BNet investment income (loss) is affected by the timing of the declaration of dividends by any underlying mutual funds or exchange-traded funds (ETFs). Net investment income (loss) of any mutual funds or ETFs is not included in the Fund's net investment income (loss) ratio.
CNet investment income per share reflects one or more large, non-recurring dividend(s) which amounted to $.10 per share. Excluding such non-recurring dividend(s), the ratio of net investment income (loss) to average net assets would have been 1.69%.
DNet investment income per share reflects one or more large, non-recurring dividend(s) which amounted to $.33 per share. Excluding such non-recurring dividend(s), the ratio of net investment income (loss) to average net assets would have been .77%.
EThe amount shown reflects reclassifications related to book to tax differences that were made in the year shown.
FTotal distributions per share do not sum due to rounding.
GTotal returns for periods of less than one year are not annualized.
HTotal returns would have been lower if certain expenses had not been reduced during the applicable periods shown.
IFees and expenses of any underlying mutual funds or exchange-traded funds (ETFs) are not included in the Fund's expense ratio. The Fund indirectly bears its proportionate share of these expenses. For additional expense information related to investments in Fidelity Central Funds, please refer to the "Investments in Fidelity Central Funds" note found in the Notes to Financial Statements section of the most recent Annual or Semi-Annual report.
JExpense ratios reflect operating expenses of the class. Expenses before reductions do not reflect amounts reimbursed, waived, or reduced through arrangements with the investment adviser, brokerage services, or other offset arrangements, if applicable, and do not represent the amount paid by the class during periods when reimbursements, waivers or reductions occur.
KAnnualized.
LAmount does not include the portfolio activity of any underlying mutual funds or exchange-traded funds (ETFs).
MPortfolio turnover rate excludes securities received or delivered in-kind.
Fidelity Advisor® Focused Emerging Markets Fund Class Z |
| |
| | Six months ended (Unaudited) April 30, 2024 | | Years ended October 31, 2023 | | 2022 | | 2021 | | 2020 | | 2019 |
Selected Per-Share Data | | | | | | | | | | | | |
| Net asset value, beginning of period | $ | 25.71 | $ | 23.01 | $ | 36.21 | $ | 30.89 | $ | 26.33 | $ | 24.65 |
| Income from Investment Operations | | | | | | | | | | | | |
Net investment income (loss) A,B | | .11 | | .59 C | | .71 | | .47 | | .28 | | .57 D |
| Net realized and unrealized gain (loss) | | 4.57 | | 2.44 | | (12.11) | | 5.66 | | 4.50 | | 4.26 |
| Total from investment operations | | 4.68 | | 3.03 | | (11.40) | | 6.13 | | 4.78 | | 4.83 |
| Distributions from net investment income | | (.48) | | (.33) | | (.68) | | (.20) | | (.22) | | (.21) E |
| Distributions from net realized gain | | - | | - | | (1.12) | | (.62) | | - | | (2.94) E |
| Total distributions | | (.48) | | (.33) | | (1.80) | | (.81) F | | (.22) | | (3.15) |
| Net asset value, end of period | $ | 29.91 | $ | 25.71 | $ | 23.01 | $ | 36.21 | $ | 30.89 | $ | 26.33 |
Total Return G,H | | | | 13.10% | | (33.01)% | | 19.94% | | 18.29% | | 19.93% |
Ratios to Average Net Assets B,I,J | | | | | | | | | | | | |
| Expenses before reductions | | .85% K | | .89% | | .90% | | .90% | | .94% | | .95% |
| Expenses net of fee waivers, if any | | | | .88% | | .90% | | .90% | | .93% | | .95% |
| Expenses net of all reductions | | .84% K | | .88% | | .90% | | .90% | | .90% | | .92% |
| Net investment income (loss) | | .81% K | | 2.16% C | | 2.43% | | 1.25% | | .99% | | 2.09% D |
| Supplemental Data | | | | | | | | | | | | |
| Net assets, end of period (000 omitted) | $ | 1,534,396 | $ | 1,456,314 | $ | 856,213 | $ | 1,127,699 | $ | 542,418 | $ | 90,032 |
Portfolio turnover rate L | | | | 33% | | 63% | | 51% | | 66% | | 166% M |
ACalculated based on average shares outstanding during the period.
BNet investment income (loss) is affected by the timing of the declaration of dividends by any underlying mutual funds or exchange-traded funds (ETFs). Net investment income (loss) of any mutual funds or ETFs is not included in the Fund's net investment income (loss) ratio.
CNet investment income per share reflects one or more large, non-recurring dividend(s) which amounted to $.10 per share. Excluding such non-recurring dividend(s), the ratio of net investment income (loss) to average net assets would have been 1.81%.
DNet investment income per share reflects one or more large, non-recurring dividend(s) which amounted to $.32 per share. Excluding such non-recurring dividend(s), the ratio of net investment income (loss) to average net assets would have been .91%.
EThe amount shown reflects reclassifications related to book to tax differences that were made in the year shown.
FTotal distributions per share do not sum due to rounding.
GTotal returns for periods of less than one year are not annualized.
HTotal returns would have been lower if certain expenses had not been reduced during the applicable periods shown.
IFees and expenses of any underlying mutual funds or exchange-traded funds (ETFs) are not included in the Fund's expense ratio. The Fund indirectly bears its proportionate share of these expenses. For additional expense information related to investments in Fidelity Central Funds, please refer to the "Investments in Fidelity Central Funds" note found in the Notes to Financial Statements section of the most recent Annual or Semi-Annual report.
JExpense ratios reflect operating expenses of the class. Expenses before reductions do not reflect amounts reimbursed, waived, or reduced through arrangements with the investment adviser, brokerage services, or other offset arrangements, if applicable, and do not represent the amount paid by the class during periods when reimbursements, waivers or reductions occur.
KAnnualized.
LAmount does not include the portfolio activity of any underlying mutual funds or exchange-traded funds (ETFs).
MPortfolio turnover rate excludes securities received or delivered in-kind.
For the period ended April 30, 2024
1. Organization.
Fidelity Advisor Focused Emerging Markets Fund (the Fund) is a fund of Fidelity Advisor Series VIII (the Trust) and is authorized to issue an unlimited number of shares. The Trust is registered under the Investment Company Act of 1940, as amended (the 1940 Act), as an open-end management investment company organized as a Massachusetts business trust. The Fund offers Class A, Class M, Class C, Class I and Class Z shares, each of which has equal rights as to assets and voting privileges. Class A, Class M, Class C, Class I and Class Z are Fidelity Advisor classes. Each class has exclusive voting rights with respect to matters that affect that class. Class C shares will automatically convert to Class A shares after a holding period of eight years from the initial date of purchase, with certain exceptions. The Fund's investments in emerging markets can be subject to social, economic, regulatory, and political uncertainties and can be extremely volatile.
2. Investments in Fidelity Central Funds.
Funds may invest in Fidelity Central Funds, which are open-end investment companies generally available only to other investment companies and accounts managed by the investment adviser and its affiliates. The Schedule of Investments lists any Fidelity Central Funds held as an investment as of period end, but does not include the underlying holdings of each Fidelity Central Fund. An investing fund indirectly bears its proportionate share of the expenses of the underlying Fidelity Central Funds.
Based on its investment objective, each Fidelity Central Fund may invest or participate in various investment vehicles or strategies that are similar to those of the investing fund. These strategies are consistent with the investment objectives of the investing fund and may involve certain economic risks which may cause a decline in value of each of the Fidelity Central Funds and thus a decline in the value of the investing fund.
| Fidelity Central Fund | Investment Manager | Investment Objective | Investment Practices | Expense RatioA |
| Fidelity Money Market Central Funds | Fidelity Management & Research Company LLC (FMR) | Each fund seeks to obtain a high level of current income consistent with the preservation of capital and liquidity. | Short-term Investments | Less than .005% |
A Expenses expressed as a percentage of average net assets and are as of each underlying Central Fund's most recent annual or semi-annual shareholder report.
A complete unaudited list of holdings for each Fidelity Central Fund is available upon request or at the Securities and Exchange Commission website at www.sec.gov. In addition, the financial statements of the Fidelity Central Funds which contain the significant accounting policies (including investment valuation policies) of those funds, and are not covered by the Report of Independent Registered Public Accounting Firm, are available on the Securities and Exchange Commission website or upon request.
3. Significant Accounting Policies.
The Fund is an investment company and applies the accounting and reporting guidance of the Financial Accounting Standards Board (FASB) Accounting Standards Codification Topic 946 Financial Services - Investment Companies. The financial statements have been prepared in conformity with accounting principles generally accepted in the United States of America (GAAP), which require management to make certain estimates and assumptions at the date of the financial statements. Actual results could differ from those estimates. Subsequent events, if any, through the date that the financial statements were issued have been evaluated in the preparation of the financial statements. The Fund's Schedule of Investments lists any underlying mutual funds or ETFs but does not include the underlying holdings of these funds. The following summarizes the significant accounting policies of the Fund:
Investment Valuation. Investments are valued as of 4:00 p.m. Eastern time on the last calendar day of the period. The Board of Trustees (the Board) has designated the Fund's investment adviser as the valuation designee responsible for the fair valuation function and performing fair value determinations as needed. The investment adviser has established a Fair Value Committee (the Committee) to carry out the day-to-day fair valuation responsibilities and has adopted policies and procedures to govern the fair valuation process and the activities of the Committee. In accordance with these fair valuation policies and procedures, which have been approved by the Board, the Fund attempts to obtain prices from one or more third party pricing services or brokers to value its investments. When current market prices, quotations or currency exchange rates are not readily available or reliable, investments will be fair valued in good faith by the Committee, in accordance with the policies and procedures. Factors used in determining fair value vary by investment type and may include market or investment specific events, transaction data, estimated cash flows, and market observations of comparable investments. The frequency that the fair valuation procedures are used cannot be predicted and they may be utilized to a significant extent. The Committee manages the Fund's fair valuation practices and maintains the fair valuation policies and procedures. The Fund's investment adviser reports to the Board information regarding the fair valuation process and related material matters.
The Fund categorizes the inputs to valuation techniques used to value its investments into a disclosure hierarchy consisting of three levels as shown below:
Level 1 - unadjusted quoted prices in active markets for identical investments
Level 2 - other significant observable inputs (including quoted prices for similar investments, interest rates, prepayment speeds, etc.)
Level 3 - unobservable inputs (including the Fund's own assumptions based on the best information available)
Valuation techniques used to value the Fund's investments by major category are as follows:
Equity securities, including restricted securities, for which market quotations are readily available, are valued at the last reported sale price or official closing price as reported by a third party pricing service on the primary market or exchange on which they are traded and are categorized as Level 1 in the hierarchy. In the event there were no sales during the day or closing prices are not available, securities are valued at the last quoted bid price or may be valued using the last available price and are generally categorized as Level 2 in the hierarchy. For foreign equity securities, when market or security specific events arise, comparisons to the valuation of American Depositary Receipts (ADRs), futures contracts, ETFs and certain indexes as well as quoted prices for similar securities may be used and would be categorized as Level 2 in the hierarchy. For equity securities, including restricted securities, where observable inputs are limited, assumptions about market activity and risk are used and these securities may be categorized as Level 3 in the hierarchy.
Investments in open-end mutual funds ,including the Fidelity Central Funds, are valued at their closing net asset value (NAV) each business day and are categorized as Level 1 in the hierarchy.
Changes in valuation techniques may result in transfers in or out of an assigned level within the disclosure hierarchy. The aggregate value of investments by input level as of April 30, 2024 is included at the end of the Fund's Schedule of Investments.
Foreign Currency. Certain Funds may use foreign currency contracts to facilitate transactions in foreign-denominated securities. Gains and losses from these transactions may arise from changes in the value of the foreign currency or if the counterparties do not perform under the contracts' terms.
Foreign-denominated assets, including investment securities, and liabilities are translated into U.S. dollars at the exchange rates at period end. Purchases and sales of investment securities, income and dividends received, and expenses denominated in foreign currencies are translated into U.S. dollars at the exchange rate in effect on the transaction date.
The effects of exchange rate fluctuations on investments are included with the net realized and unrealized gain (loss) on investment securities. Other foreign currency transactions resulting in realized and unrealized gain (loss) are disclosed separately.
Investment Transactions and Income. For financial reporting purposes, the Fund's investment holdings and NAV include trades executed through the end of the last business day of the period. The NAV per share for processing shareholder transactions is calculated as of the close of business of the New York Stock Exchange (NYSE), normally 4:00 p.m. Eastern time and includes trades executed through the end of the prior business day. Gains and losses on securities sold are determined on the basis of identified cost and include proceeds received from litigation. Commissions paid to certain brokers with whom the investment adviser, or its affiliates, places trades on behalf of a fund include an amount in addition to trade execution, which may be rebated back to a fund. Any such rebates are included in net realized gain (loss) on investments in the Statement of Operations. Dividend income is recorded on the ex-dividend date, except for certain dividends from foreign securities where the ex-dividend date may have passed, which are recorded as soon as the Fund is informed of the ex-dividend date. Non-cash dividends included in dividend income, if any, are recorded at the fair market value of the securities received. Income and capital gain distributions from Fidelity Central Funds, if any, are recorded on the ex-dividend date. Investment income is recorded net of foreign taxes withheld where recovery of such taxes is uncertain. Funds may file withholding tax reclaims in certain jurisdictions to recover a portion of amounts previously withheld. Any withholding tax reclaims income is included in the Statement of Operations in foreign taxes witheld. Any receivables for withholding tax reclaims are included in the Statement of Assets and Liabilities in dividends receivable.
Class Allocations and Expenses. Investment income, realized and unrealized capital gains and losses, common expenses of a fund, and certain fund-level expense reductions, if any, are allocated daily on a pro-rata basis to each class based on the relative net assets of each class to the total net assets of a fund. Each class differs with respect to transfer agent and distribution and service plan fees incurred, as applicable. Certain expense reductions may also differ by class, if applicable. For the reporting period, the allocated portion of income and expenses to each class as a percent of its average net assets may vary due to the timing of recording these transactions in relation to fluctuating net assets of the classes. Expenses directly attributable to a fund are charged to that fund. Expenses attributable to more than one fund are allocated among the respective funds on the basis of relative net assets or other appropriate methods. Expenses included in the accompanying financial statements reflect the expenses of that fund and do not include any expenses associated with any underlying mutual funds or exchange-traded funds (ETFs). Although not included in a fund's expenses, a fund indirectly bears its proportionate share of these expenses through the net asset value of each underlying mutual fund or exchange-traded fund (ETF). Expense estimates are accrued in the period to which they relate and adjustments are made when actual amounts are known.
Income Tax Information and Distributions to Shareholders. Each year, the Fund intends to qualify as a regulated investment company under Subchapter M of the Internal Revenue Code, including distributing substantially all of its taxable income and realized gains. As a result, no provision for U.S. Federal income taxes is required. The Fund files a U.S. federal tax return, in addition to state and local tax returns as required. The Fund's federal income tax returns are subject to examination by the Internal Revenue Service (IRS) for a period of three fiscal years after they are filed. State and local tax returns may be subject to examination for an additional fiscal year depending on the jurisdiction. Foreign taxes are provided for based on the Fund's understanding of the tax rules and rates that exist in the foreign markets in which it invests. The Fund is subject to a tax imposed on capital gains by certain countries in which it invests. An estimated deferred tax liability for net unrealized appreciation on the applicable securities is included in Deferred taxes on the Statement of Assets & Liabilities.
Distributions are declared and recorded on the ex-dividend date. Income and capital gain distributions are declared separately for each class. Income and capital gain distributions are determined in accordance with income tax regulations, which may differ from GAAP.
Capital accounts within the financial statements are adjusted for permanent book-tax differences. These adjustments have no impact on net assets or the results of operations. Capital accounts are not adjusted for temporary book-tax differences which will reverse in a subsequent period.
Book-tax differences are primarily due to foreign currency transactions, certain foreign taxes, passive foreign investment companies (PFIC), capital loss carryforwards and losses deferred due to wash sales.
As of period end, the cost and unrealized appreciation (depreciation) in securities, and derivatives if applicable, for federal income tax purposes were as follows:
| Gross unrealized appreciation | $750,502,567 |
| Gross unrealized depreciation | (390,244,238) |
| Net unrealized appreciation (depreciation) | $360,258,329 |
| Tax cost | $4,054,272,801 |
Capital loss carryforwards are only available to offset future capital gains of the Fund to the extent provided by regulations and may be limited. The capital loss carryforward information presented below, including any applicable limitation, is estimated as of prior fiscal period end and is subject to adjustment.
Short-term | $(158,619,457) |
Long-term | (104,639,561) |
| Total capital loss carryforward | $(263,259,018) |
Restricted Securities (including Private Placements). Funds may invest in securities that are subject to legal or contractual restrictions on resale. These securities generally may be resold in transactions exempt from registration or to the public if the securities are registered. Disposal of these securities may involve time-consuming negotiations and expense, and prompt sale at an acceptable price may be difficult. Information regarding restricted securities held at period end is included at the end of the Schedule of Investments, if applicable.
4. Purchases and Sales of Investments.
Purchases and sales of securities, other than short-term securities and in-kind transactions, as applicable, are noted in the table below.
| | Purchases ($) | Sales ($) |
| Fidelity Advisor Focused Emerging Markets Fund | 771,188,112 | 818,943,731 |
5. Fees and Other Transactions with Affiliates.
Management Fee. Fidelity Management & Research Company LLC (the investment adviser) and its affiliates provide the Fund with investment management related services for which the Fund pays a monthly management fee.
Effective March 1, 2024, the Fund's management contract was amended to incorporate administrative services previously covered under separate services agreements (Transfer Agent and Accounting agreements). The amended contract incorporates a management fee rate that may vary by class. The investment adviser or an affiliate pays certain expenses of managing and operating the Fund out of each class's management fee. Each class of the Fund pays a management fee to the investment adviser. The management fee is calculated and paid to the investment adviser every month. When determining a class's management fee, a mandate rate is calculated based on the monthly average net assets of a group of funds advised by FMR within a designated asset class. A discount rate is subtracted from the mandate rate once the Fund's monthly average net assets reach a certain level. The mandate rate and discount rate may vary by class. The annual management fee rate for a class of shares of the Fund is the lesser of (1) the class's mandate rate reduced by the class's discount rate (if applicable) or (2) the amount set forth in the following table.
| | Maximum Management Fee Rate % |
| Class A | .98 |
| Class M | .98 |
| Class C | .98 |
| Class I | .95 |
| Class Z | .83 |
One-twelfth of the management fee rate for a class is applied to the average net assets of the class for the month, giving a dollar amount which is the management fee for the class for that month. A different management fee rate may be applicable to each class of the Fund. The difference between classes is the result of separate arrangements for class-level services and/or waivers of certain expenses. It is not the result of any difference in advisory or custodial fees or other expenses related to the management of the Fund's assets, which do not vary by class. For the portion of the reporting period on or after March 1, 2024, the total annualized management fee rates were as follows:
| | Total Management Fee Rate % |
| Class A | .91 |
| Class M | .91 |
| Class C | .91 |
| Class I | .91 |
| Class Z | .79 |
Prior to March 1, 2024, the management fee was the sum of an individual fund fee rate that was based on an annual rate of .55% of the Fund's average net assets and an annualized group fee rate that averaged .22% during the period. The group fee rate was based upon the monthly average net assets of a group of registered investment companies with which the investment adviser has management contracts. The group fee rate decreased as assets under management increased and increased as assets under management decreased. For the portion of the reporting period prior to March 1, 2024, the total annualized management fee rate was .77%.
Effective March 1, 2024, the Fund's sub-advisory agreements with FMR Investment Management (UK) Limited, Fidelity Management & Research (Hong Kong) Limited, and Fidelity Management & Research (Japan) Limited were amended to provide that the investment adviser pays each sub-adviser monthly fees equal to 110% of the sub-adviser's costs for providing sub-advisory services.
Effective March 1, 2024, the Fund's sub-advisory agreement with FIL Investment Advisors (FIA) was amended to provide that the investment adviser pays FIA monthly fees at an annual rate of 0.50% with respect to the average daily net assets of the Fund managed by FIA. FIA in turn pays FIA(UK).
Distribution and Service Plan Fees. In accordance with Rule 12b-1 of the 1940 Act, the Fund has adopted separate Distribution and Service Plans for each class of shares. Certain classes pay Fidelity Distributors Company LLC (FDC), an affiliate of the investment adviser, separate Distribution and Service Fees, each of which is based on an annual percentage of each class' average net assets. In addition, FDC may pay financial intermediaries for selling shares of the Fund and providing shareholder support services. For the period, the Distribution and Service Fee rates, total fees and amounts retained by FDC were as follows:
| | Distribution Fee | Service Fee | Total Fees ($) | Retained by FDC ($) |
| Class A | - % | .25% | 196,153 | 3,679 |
| Class M | .25% | .25% | 77,600 | 500 |
| Class C | .75% | .25% | 98,463 | 12,296 |
| | | | 372,216 | 16,475 |
Sales Load. FDC may receive a front-end sales charge of up to 5.75% for selling Class A shares and 3.50% for selling Class M shares, some of which is paid to financial intermediaries for selling shares of the Fund. Depending on the holding period, FDC may receive contingent deferred sales charges levied on Class A, Class M and Class C redemptions. The deferred sales charges are 1.00% for Class C shares, 1.00% for certain purchases of Class A shares and .25% for certain purchases of Class M shares.
For the period, sales charge amounts retained by FDC were as follows:
| | Retained by FDC ($) |
| Class A | 9,422 |
| Class M | 782 |
Class sA | 271 |
| | 10,475 |
A When Class C shares are initially sold, FDC pays commissions from its own resources to financial intermediaries through which the sales are made.
Transfer Agent Fees. Fidelity Investments Institutional Operations Company LLC (FIIOC), an affiliate of the investment adviser, is the transfer, dividend disbursing and shareholder servicing agent for each class of the Fund. Effective March 1, 2024, the Fund's management contract was amended to incorporate transfer agent services and associated fees previously covered under a separate services agreement. FIIOC pays for typesetting, printing and mailing of shareholder reports, except proxy statements.
During November 2023, the Board approved a change in the transfer agent fees effective December 1, 2023 to a fixed annual rate of class-level average net assets as follows:
| | % of Class-Level Average Net Assets |
| Class A | .2000 |
| Class M | .2000 |
| Class C | .2000 |
| Class I | .1658 |
Prior to December 1, 2023, FIIOC received account fees and asset-based fees that varied according to the account size and type of account of the shareholders of the respective classes of the Fund, except for Class Z. FIIOC received an asset-based fee of Class Z's average net assets. For the portion of the reporting period prior to March 1, 2024, the fees were equivalent to the following annualized rates:
| | Amount ($) | % of Class-Level Average Net AssetsA |
| Class A | 100,858 | .21 |
| Class M | 21,565 | .21 |
| Class C | 13,803 | .21 |
| Class I | 1,287,340 | .17 |
| Class Z | 202,011 | .04 |
| | 1,625,577 | |
A Annualized
Accounting Fees. Fidelity Service Company, Inc. (FSC), an affiliate of the investment adviser, maintains the Fund's accounting records. Effective March 1, 2024, the Fund's management contract was amended to incorporate accounting services and associated fees previously covered under a separate services agreement.
During November 2023, the Board approved a change in the accounting fees effective December 1, 2023 to a fixed annual rate of average net assets as follows:
| | % of Average Net Assets |
| Fidelity Advisor Focused Emerging Markets Fund | .0409 |
Prior to December 1, 2023, the accounting fee was based on the level of average net assets for each month. For the portion of the reporting period prior to March 1, 2024, the fees were equivalent to the following annualized rates:
| | % of Average Net Assets |
| Fidelity Advisor Focused Emerging Markets Fund | .04 |
Brokerage Commissions. A portion of portfolio transactions were placed with brokerage firms which are affiliates of the investment adviser. Brokerage commissions are included in net realized gain (loss) and change in net unrealized appreciation (depreciation) in the Statement of Operations. The commissions paid to these affiliated firms were as follows:
| | Amount ($) |
| Fidelity Advisor Focused Emerging Markets Fund | 5,956 |
Interfund Lending Program. Pursuant to an Exemptive Order issued by the Securities and Exchange Commission (the SEC), the Fund, along with other registered investment companies having management contracts with Fidelity Management & Research Company LLC (FMR), or other affiliated entities of FMR, may participate in an interfund lending program. This program provides an alternative credit facility allowing the Fund to borrow from, or lend money to, other participating affiliated funds. At period end, there were no interfund loans outstanding. Activity in this program during the period for which loans were outstanding was as follows:
| | Borrower or Lender | Average Loan Balance ($) | Weighted Average Interest Rate | Interest Expense ($) |
Fidelity Advisor Focused Emerging Markets Fund | Borrower | 61,917,000 | 5.57% | 19,144 |
Interfund Trades. Funds may purchase from or sell securities to other Fidelity Funds under procedures adopted by the Board. The procedures have been designed to ensure these interfund trades are executed in accordance with Rule 17a-7 of the 1940 Act. Any interfund trades are included within the respective purchases and sales amounts shown in the Purchases and Sales of Investments note. Interfund trades during the period are noted in the table below.
| | Purchases ($) | Sales ($) | Realized Gain (Loss)($) |
| Fidelity Advisor Focused Emerging Markets Fund | 1,069,614 | 6,546,296 | 1,169,661 |
6. Committed Line of Credit.
Certain Funds participate with other funds managed by the investment adviser or an affiliate in a $4.25 billion credit facility (the "line of credit") to be utilized for temporary or emergency purposes to fund shareholder redemptions or for other short-term liquidity purposes. The participating funds have agreed to pay commitment fees on their pro-rata portion of the line of credit, which are reflected in Miscellaneous expenses on the Statement of Operations, and are listed below. During the period, there were no borrowings on this line of credit.
| | Amount ($) |
| Fidelity Advisor Focused Emerging Markets Fund | 3,593 |
7. Security Lending.
Funds lend portfolio securities from time to time in order to earn additional income. Lending agents are used, including National Financial Services (NFS), an affiliate of the investment adviser. Pursuant to a securities lending agreement, NFS will receive a fee, which is capped at 9.9% of a fund's daily lending revenue, for its services as lending agent. A fund may lend securities to certain qualified borrowers, including NFS. On the settlement date of the loan, a fund receives collateral (in the form of U.S. Treasury obligations, letters of credit and/or cash) against the loaned securities and maintains collateral in an amount not less than 100% of the market value of the loaned securities during the period of the loan. The market value of the loaned securities is determined at the close of business of a fund and any additional required collateral is delivered to a fund on the next business day. A fund or borrower may terminate the loan at any time, and if the borrower defaults on its obligation to return the securities loaned because of insolvency or other reasons, a fund may apply collateral received from the borrower against the obligation. A fund may experience delays and costs in recovering the securities loaned. Any cash collateral received is invested in the Fidelity Securities Lending Cash Central Fund. Any loaned securities are identified as such in the Schedule of Investments, and the value of loaned securities and cash collateral at period end, as applicable, are presented in the Statement of Assets and Liabilities. Security lending income represents the income earned on investing cash collateral, less rebates paid to borrowers and any lending agent fees associated with the loan, plus any premium payments received for lending certain types of securities. Security lending income is presented in the Statement of Operations as a component of income from Fidelity Central Funds. Affiliated security lending activity, if any, was as follows:
| | Total Security Lending Fees Paid to NFS ($) | Security Lending Income From Securities Loaned to NFS ($) | Value of Securities Loaned to NFS at Period End ($) |
| Fidelity Advisor Focused Emerging Markets Fund | 8,369 | - | - |
8. Expense Reductions.
Through arrangements with the Fund's custodian and each class' transfer agent, credits realized as a result of certain uninvested cash balances were used to reduce the Fund's expenses. During the period, custodian credits reduced the Fund's expenses by $5,068. During the period, transfer agent credits reduced each class' expenses as noted in the table below.
| | Expense reduction ($) |
| | |
| Class M | 63 |
In addition, during the period the investment adviser or an affiliate reimbursed and/or waived a portion of fund-level operating expenses in the amount of $173,324.
9. Distributions to Shareholders.
Distributions to shareholders of each class were as follows:
| | Six months ended April 30, 2024 | Year ended October 31, 2023 |
| Fidelity Advisor Focused Emerging Markets Fund | | |
| Distributions to shareholders | | |
| Class A | $1,789,295 | $1,026,327 |
| Class M | 312,730 | 156,866 |
| Class C | 108,628 | - |
| Class I | 36,223,237 | 9,611,585 |
| Class Z | 24,645,676 | 12,719,882 |
Total | $63,079,566 | $23,514,660 |
10. Share Transactions.
Share transactions for each class were as follows and may contain in-kind transactions, automatic conversions between classes or exchanges between affiliated funds:
| | Shares | Shares | Dollars | Dollars |
| | Six months ended April 30, 2024 | Year ended October 31, 2023 | Six months ended April 30, 2024 | Year ended October 31, 2023 |
| Fidelity Advisor Focused Emerging Markets Fund | | | | |
| Class A | | | | |
| Shares sold | 1,589,155 | 1,139,512 | $44,180,581 | $31,480,973 |
| Reinvestment of distributions | 64,490 | 37,305 | 1,745,981 | 1,002,465 |
| Shares redeemed | (696,325) | (1,217,283) | (19,670,032) | (33,144,535) |
| Net increase (decrease) | 957,320 | (40,466) | $26,256,530 | $(661,097) |
| Class M | | | | |
| Shares sold | 29,207 | 87,737 | $811,208 | $2,388,915 |
| Reinvestment of distributions | 11,291 | 5,728 | 302,725 | 152,271 |
| Shares redeemed | (136,786) | (190,279) | (3,799,405) | (5,187,284) |
| Net increase (decrease) | (96,288) | (96,814) | $(2,685,472) | $(2,646,098) |
| Class C | | | | |
| Shares sold | 37,259 | 141,189 | $964,763 | $3,648,827 |
| Reinvestment of distributions | 4,219 | - | 106,700 | - |
| Shares redeemed | (141,164) | (268,014) | (3,666,861) | (6,759,598) |
| Net increase (decrease) | (99,686) | (126,825) | $(2,595,398) | $(3,110,771) |
| Class I | | | | |
| Shares sold | 21,447,803 | 67,051,000 | $607,756,521 | $1,830,571,553 |
| Reinvestment of distributions | 1,180,312 | 286,193 | 32,052,946 | 7,724,700 |
| Shares redeemed | (15,812,229) | (17,433,766) | (442,187,638) | (475,311,650) |
| Net increase (decrease) | 6,815,886 | 49,903,427 | $197,621,829 | $1,362,984,603 |
| Class Z | | | | |
| Shares sold | 12,903,912 | 44,675,967 | $362,154,548 | $1,215,199,674 |
| Reinvestment of distributions | 360,193 | 177,977 | 9,755,940 | 4,789,905 |
| Shares redeemed | (18,607,967) | (25,413,754) | (514,828,575) | (681,964,917) |
| Net increase (decrease) | (5,343,862) | 19,440,190 | $(142,918,087) | $538,024,662 |
11. Other.
A fund's organizational documents provide former and current trustees and officers with a limited indemnification against liabilities arising in connection with the performance of their duties to the fund. In the normal course of business, a fund may also enter into contracts that provide general indemnifications. A fund's maximum exposure under these arrangements is unknown as this would be dependent on future claims that may be made against a fund. The risk of material loss from such claims is considered remote.
12. Risk and Uncertainties.
Many factors affect a fund's performance. Developments that disrupt global economies and financial markets, such as pandemics, epidemics, outbreaks of infectious diseases, war, terrorism, and environmental disasters, may significantly affect a fund's investment performance. The effects of these developments to a fund will be impacted by the types of securities in which a fund invests, the financial condition, industry, economic sector, and geographic location of an issuer, and a fund's level of investment in the securities of that issuer. Significant concentrations in security types, issuers, industries, sectors, and geographic locations may magnify the factors that affect a fund's performance.
As a shareholder, you incur two types of costs: (1) transaction costs, which may include sales charges (loads) on purchase payments or redemption proceeds, as applicable and (2) ongoing costs, which generally include management fees, distribution and/or service (12b-1) fees and other Fund expenses. This Example is intended to help you understand your ongoing costs (in dollars) of investing in a fund and to compare these costs with the ongoing costs of investing in other mutual funds.
| The Example is based on an investment of $1,000 invested at the beginning of the period and held for the entire period (November 1, 2023 to April 30, 2024). |
Actual Expenses
The first line of the accompanying table provides information about actual account values and actual expenses. You may use the information in this line, together with the amount you invested, to estimate the expenses that you paid over the period. Simply divide your account value by $1,000.00 (for example, an $8,600 account value divided by $1,000.00 = 8.6), then multiply the result by the number in the first line for a class/Fund under the heading entitled "Expenses Paid During Period" to estimate the expenses you paid on your account during this period. If any fund is a shareholder of any underlying mutual funds or exchange-traded funds (ETFs) (the Underlying Funds), such fund indirectly bears its proportional share of the expenses of the Underlying Funds in addition to the direct expenses incurred presented in the table. These fees and expenses are not included in the annualized expense ratio used to calculate the expense estimate in the table below.
Hypothetical Example for Comparison Purposes
The second line of the accompanying table provides information about hypothetical account values and hypothetical expenses based on the actual expense ratio and an assumed rate of return of 5% per year before expenses, which is not the actual return. The hypothetical account values and expenses may not be used to estimate the actual ending account balance or expenses you paid for the period. You may use this information to compare the ongoing costs of investing in the Fund and other funds. To do so, compare this 5% hypothetical example with the 5% hypothetical examples that appear in the shareholder reports of the other funds. If any fund is a shareholder of any Underlying Funds, such fund indirectly bears its proportional share of the expenses of the Underlying Funds in addition to the direct expenses as presented in the table. These fees and expenses are not included in the annualized expense ratio used to calculate the expense estimate in the table below.
Please note that the expenses shown in the table are meant to highlight your ongoing costs only and do not reflect any transaction costs. Therefore, the second line of the table is useful in comparing ongoing costs only, and will not help you determine the relative total costs of owning different funds. In addition, if these transactional costs were included, your costs would have been higher.
| | | | | Annualized Expense Ratio- A | | Beginning Account Value November 1, 2023 | | Ending Account Value April 30, 2024 | | Expenses Paid During Period- C November 1, 2023 to April 30, 2024 |
| Fidelity Advisor® Focused Emerging Markets Fund | | | | | | | | | | |
Class A ** | | | | 1.27% | | | | | | |
| Actual | | | | | | $ 1,000 | | $ 1,181.40 | | $ 6.89 |
Hypothetical-B | | | | | | $ 1,000 | | $ 1,018.55 | | $ 6.37 |
| Class M | | | | 1.49% | | | | | | |
| Actual | | | | | | $ 1,000 | | $ 1,180.20 | | $ 8.08 |
Hypothetical-B | | | | | | $ 1,000 | | $ 1,017.45 | | $ 7.47 |
| Class C | | | | 1.99% | | | | | | |
| Actual | | | | | | $ 1,000 | | $ 1,177.40 | | $ 10.77 |
Hypothetical-B | | | | | | $ 1,000 | | $ 1,014.97 | | $ 9.97 |
Class I ** | | | | .98% | | | | | | |
| Actual | | | | | | $ 1,000 | | $ 1,183.40 | | $ 5.32 |
Hypothetical-B | | | | | | $ 1,000 | | $ 1,019.99 | | $ 4.92 |
| Class Z | | | | .84% | | | | | | |
| Actual | | | | | | $ 1,000 | | $ 1,184.00 | | $ 4.56 |
Hypothetical-B | | | | | | $ 1,000 | | $ 1,020.69 | | $ 4.22 |
| |
A Annualized expense ratio reflects expenses net of applicable fee waivers.
B 5% return per year before expenses
C Expenses are equal to the annualized expense ratio, multiplied by the average account value over the period, multiplied by 182/ 366 (to reflect the one-half year period). The fees and expenses of any Underlying Funds are not included in each annualized expense ratio.
** If fees and changes to the expense contract and/or expense cap, effective March 1, 2024, had been in effect during the entire current period, the restated annualized expense ratio and the expenses paid in the actual and hypothetical examples above would have been as shown in table below:
| | | | | Annualized Expense Ratio- A | | Expenses Paid |
| Fidelity Advisor® Focused Emerging Markets Fund | | | | | | |
| Class A | | | | 1.18% | | |
| Actual | | | | | | $ 6.40 |
Hypothetical- B | | | | | | $ 5.92 |
| Class I | | | | .93% | | |
| Actual | | | | | | $ 5.05 |
Hypothetical- B | | | | | | $ 4.67 |
| | | | | | | |
| A Annualized expense ratio reflects expenses net of applicable fee waivers. | | | | | | |
| B 5% return per year before expenses | | | | | | |
Board Approval of Investment Advisory Contracts
Fidelity Advisor Focused Emerging Markets Fund
At its January 2024 meeting, the Board of Trustees, including the Independent Trustees (together, the Board), approved an amended and restated management contract with Fidelity Management & Research Company LLC (FMR) (the Management Contract), and amended and restated sub-advisory agreements (the Sub-Advisory Contracts, and together with the Management Contract, the Advisory Contracts) for the fund, including the fund's sub-advisory agreements with FMR Investment Management (UK) Limited (FMR UK), Fidelity Management & Research (Hong Kong) Limited (FMR H.K.), Fidelity Management & Research (Japan) Limited (FMR Japan), and FIL Investment Advisors (FIL). The Advisory Contracts will be effective March 1, 2024. The Board will consider the annual renewal of the fund's Advisory Contracts in May 2024, following its review of additional materials provided by FMR.
Management Contract. The Board approved the Management Contract, which implements a new fee structure combining the management fee, transfer agent fee (TA Fee), and pricing and bookkeeping fee (P&B Fee) of the fund and each class into a single class-level fee based on tiered schedules and subject to a maximum class-level rate (the Unified Fee). In exchange for the Unified Fee, the fund will receive investment advisory, management, administrative, transfer agent, pricing and bookkeeping services under a single agreement - the Management Contract.
In its consideration of the Management Contract over several meetings, the Board received, reviewed and discussed a comprehensive set of analyses regarding the Unified Fee including (i) the legal framework, (ii) design goals for the Unified Fee, (iii) calculation methodology for the Unified Fee and illustrative examples, (iv) annual and cumulative projected impacts under various scenarios, both in the aggregate and at the fund/class level, (v) explanations of schedules, rate levers and maximum rates and (vi) shareholder benefits and projected savings.
The Board considered that the maximum Unified Fee for each class of the fund would be no higher than the sum of (i) the lowest contractual management fee rate under the fund's existing management contract, which is the individual fund fee rate, if any, plus the lowest contractual marginal group fee rate and (ii) the TA and P&B Fee rates, which are fixed fee rates since December 1, 2023 (together, the Unified Fee Cap). The Board noted that Fidelity has represented that, as a result of this Unified Fee Cap, the Unified Fee would be no greater than the fee rates previously authorized to be charged to the fund for the same services. The Board noted that certain expenses such as third-party expenses, Rule 12b-1 fees, and certain other miscellaneous expenses would be outside the scope of the Unified Fee and the calculation of such fees would not change as a result of the Unified Fee. The Board considered that, under the Management Contract, a different management fee rate will be applicable to each class of the fund. The Board noted that Fidelity has represented that the difference in expenses between classes is based on differences in class-specific expenses and not due to any difference in advisory or third-party custodial fees or other expenses related to the management of the fund's assets.
The Board considered Fidelity's representations that implementation of the Unified Fee, which includes the Unified Fee Cap, would cause all funds subject to the Unified Fee, including the fund, to experience an immediate reduction on contractual fee rates for services provided under the current management contracts. The Board considered that some funds would not experience lower net total fees as a result of existing fee caps. The Board further considered that, in addition to the contractual fee savings, the Unified Fee offers funds and their shareholders greater protection from future rate increases for services previously offered under separate agreements that are now covered by the Management Contract because such rate increases would require shareholder approval.
Sub-Advisory Contracts. In connection with the Unified Fee changes, the Board considered the Sub-Advisory Contracts, which simplified the calculation of the fees paid by FMR to the sub-advisers under the agreements. The Board noted that the agreements with FMR UK, FMR H.K., and FMR Japan were amended to provide that FMR will compensate each sub-adviser at a fee rate equal to 110% of the sub-adviser's costs incurred in providing services under the agreement. The Board further noted that the agreement with FIL was amended to provide that FMR will compensate FIL at a flat fee rate of 0.50% of the net assets sub-advised by it. The Board considered that, under the Sub-Advisory Contracts, FMR, and not the fund, will continue to pay the sub-advisory fees to each applicable sub-adviser.
The Board further considered that the approval of the fund's Advisory Contracts will not result in any changes in the investment process or strategies employed in the management of the fund's assets or the day-to-day management of the fund or the persons primarily responsible for such management. Further, the Board considered that the Management Contract would not change the obligations and services of FMR and its affiliates on behalf of the fund, and, in particular, there would be no change in the nature and level of advisory, management, administration, transfer agent, and pricing and bookkeeping services provided to the fund by FMR, its affiliates, and each applicable sub-adviser.
In connection with its consideration of future renewals of the fund's Advisory Contracts, the Board will consider: (i) the nature, extent and quality of services provided to the funds, including shareholder and administrative services and investment performance; (ii) the competitiveness of the management fee and total expenses for the fund; (iii) the costs of the services and profitability, including the revenues earned and the expenses incurred in conducting the business of developing, marketing, distributing, managing, administering, and servicing the fund and its shareholders, to the extent applicable; and (iv) whether there have been economies of scale in respect of the Fidelity funds, whether the Fidelity funds (including the fund) have appropriately benefited from any such economies of scale, and whether there is the potential for realization of any further economies.
Based on its evaluation of all of the conclusions and representations noted above, and after considering all factors it believed relevant, the Board concluded that the fund's management fee structure is fair and reasonable, and that the fund's Advisory Contracts should be approved.
The Securities and Exchange Commission adopted Rule 22e-4 under the Investment Company Act of 1940 (the Liquidity Rule) to promote effective liquidity risk management throughout the open-end investment company industry, thereby reducing the risk that funds will be unable to meet their redemption obligations and mitigating dilution of the interests of fund shareholders.
The Fund has adopted and implemented a liquidity risk management program (the Program) reasonably designed to assess and manage the Fund's liquidity risk and to comply with the requirements of the Liquidity Rule. The Fund's Board of Trustees (the Board) has designated the Fund's investment adviser as administrator of the Program. The Fidelity advisers have established a Liquidity Risk Management Committee (the LRM Committee) to manage the Program for each of the Fidelity Funds. The LRM Committee monitors the adequacy and effectiveness of implementation of the Program and on a periodic basis assesses each Fund's liquidity risk based on a variety of factors including (1) the Fund's investment strategy, (2) portfolio liquidity and cash flow projections during normal and reasonably foreseeable stressed conditions, (3) shareholder redemptions, (4) borrowings and other funding sources and (5) certain factors specific to ETFs including the effect of the Fund's prices and spreads, market participants, and basket compositions on the overall liquidity of the Fund's portfolio, as applicable.
In accordance with the Program, each of the Fund's portfolio investments is classified into one of four defined liquidity categories based on a determination of a reasonable expectation for how long it would take to convert the investment to cash (or sell or dispose of the investment) without significantly changing its market value.
- Highly liquid investments - cash or convertible to cash within three business days or less
- Moderately liquid investments - convertible to cash in three to seven calendar days
- Less liquid investments - can be sold or disposed of, but not settled, within seven calendar days
- Illiquid investments - cannot be sold or disposed of within seven calendar days
Liquidity classification determinations take into account a variety of factors including various market, trading and investment-specific considerations, as well as market depth, and generally utilize analysis from a third-party liquidity metrics service.
The Liquidity Rule places a 15% limit on a fund's illiquid investments and requires funds that do not primarily hold assets that are highly liquid investments to determine and maintain a minimum percentage of the fund's net assets to be invested in highly liquid investments (highly liquid investment minimum or HLIM). The Program includes provisions reasonably designed to comply with the 15% limit on illiquid investments and for determining, periodically reviewing and complying with the HLIM requirement as applicable.
At a recent meeting of the Fund's Board of Trustees, the LRM Committee provided a written report to the Board pertaining to the operation, adequacy, and effectiveness of the Program for the period December 1, 2022 through November 30, 2023. The report concluded that the Program is operating effectively and is reasonably designed to assess and manage the Fund's liquidity risk.
1.800638.120
FAEM-SANN-0624
Fidelity Advisor® Diversified International Fund
Semi-Annual Report
April 30, 2024
Contents
To view a fund's proxy voting guidelines and proxy voting record for the 12-month period ended June 30, visit http://www.fidelity.com/proxyvotingresults or visit the Securities and Exchange Commission's (SEC) web site at http://www.sec.gov.
You may also call 1-877-208-0098 to request a free copy of the proxy voting guidelines.
Standard & Poor's, S&P and S&P 500 are registered service marks of The McGraw-Hill Companies, Inc. and have been licensed for use by Fidelity Distributors Corporation.
Other third-party marks appearing herein are the property of their respective owners.
All other marks appearing herein are registered or unregistered trademarks or service marks of FMR LLC or an affiliated company. © 2024 FMR LLC. All rights reserved.
This report and the financial statements contained herein are submitted for the general information of the shareholders of the Fund. This report is not authorized for distribution to prospective investors in the Fund unless preceded or accompanied by an effective prospectus.
A fund files its complete schedule of portfolio holdings with the SEC for the first and third quarters of each fiscal year on Form N-PORT. Forms N-PORT are available on the SEC's web site at http://www.sec.gov. A fund's Forms N-PORT may be reviewed and copied at the SEC's Public Reference Room in Washington, DC. Information regarding the operation of the SEC's Public Reference Room may be obtained by calling 1-800-SEC-0330.
For a complete list of a fund's portfolio holdings, view the most recent holdings listing, semiannual report, or annual report on Fidelity's web site at http://www.fidelity.com, http://www.institutional.fidelity.com, or http://www.401k.com, as applicable.
NOT FDIC INSURED •MAY LOSE VALUE •NO BANK GUARANTEE
Neither the Fund nor Fidelity Distributors Corporation is a bank.
Top Holdings (% of Fund's net assets) |
| |
| ASML Holding NV (depository receipt) (Netherlands, Semiconductors & Semiconductor Equipment) | 3.7 | |
| Novo Nordisk A/S Series B (Denmark, Pharmaceuticals) | 3.3 | |
| Hitachi Ltd. (Japan, Industrial Conglomerates) | 2.4 | |
| AstraZeneca PLC (United Kingdom) (United Kingdom, Pharmaceuticals) | 2.2 | |
| LVMH Moet Hennessy Louis Vuitton SE (France, Textiles, Apparel & Luxury Goods) | 2.1 | |
| Taiwan Semiconductor Manufacturing Co. Ltd. sponsored ADR (Taiwan, Semiconductors & Semiconductor Equipment) | 1.9 | |
| SAP SE (Germany, Software) | 1.7 | |
| RELX PLC (Euronext N.V.) (United Kingdom, Professional Services) | 1.6 | |
| Shin-Etsu Chemical Co. Ltd. (Japan, Chemicals) | 1.6 | |
| Wolters Kluwer NV (Netherlands, Professional Services) | 1.5 | |
| | 22.0 | |
| |
| Market Sectors (% of Fund's net assets) |
| |
| Industrials | 22.2 | |
| Financials | 21.5 | |
| Information Technology | 17.5 | |
| Health Care | 10.5 | |
| Consumer Discretionary | 8.8 | |
| Materials | 7.6 | |
| Energy | 5.6 | |
| Consumer Staples | 3.8 | |
| Communication Services | 0.6 | |
| Real Estate | 0.2 | |
| |
Asset Allocation (% of Fund's net assets) |
|
|
Geographic Diversification (% of Fund's net assets) |
|
* Includes Short-Term investments and Net Other Assets (Liabilities). Percentages are adjusted for the effect of derivatives, if applicable. |
| |
Showing Percentage of Net Assets
| Common Stocks - 97.8% |
| | | Shares | Value ($) (000s) |
| Australia - 0.6% | | | |
| Aristocrat Leisure Ltd. | | 202,251 | 5,161 |
| CAR Group Ltd. | | 77,081 | 1,671 |
| Steadfast Group Ltd. | | 521,145 | 1,897 |
TOTAL AUSTRALIA | | | 8,729 |
| Belgium - 0.4% | | | |
| UCB SA | | 42,458 | 5,644 |
| Canada - 7.0% | | | |
| Alimentation Couche-Tard, Inc. Class A (multi-vtg.) | | 256,916 | 14,239 |
| Cameco Corp. | | 147,384 | 6,724 |
| Canadian Natural Resources Ltd. | | 213,101 | 16,148 |
| Canadian Pacific Kansas City Ltd. | | 79,670 | 6,249 |
| Constellation Software, Inc. | | 5,448 | 14,026 |
| Constellation Software, Inc. warrants 3/31/40 (a)(b) | | 7,474 | 0 |
| Franco-Nevada Corp. | | 75,689 | 9,111 |
| Imperial Oil Ltd. | | 131,574 | 9,046 |
| Ivanhoe Mines Ltd. (a) | | 688,230 | 9,329 |
| Lumine Group, Inc. (a) | | 20,819 | 570 |
| MEG Energy Corp. (a) | | 204,569 | 4,653 |
| Thomson Reuters Corp. | | 41,747 | 6,305 |
TOTAL CANADA | | | 96,400 |
| China - 1.1% | | | |
| Chervon Holdings Ltd. | | 422,195 | 1,025 |
| Li Ning Co. Ltd. | | 669,391 | 1,752 |
| NXP Semiconductors NV | | 48,695 | 12,475 |
TOTAL CHINA | | | 15,252 |
| Denmark - 4.2% | | | |
| Carlsberg A/S Series B | | 45,825 | 6,164 |
| DSV A/S | | 20,612 | 2,943 |
| Novo Nordisk A/S Series B | | 354,997 | 45,526 |
| Pandora A/S | | 24,115 | 3,690 |
TOTAL DENMARK | | | 58,323 |
| France - 10.1% | | | |
| Air Liquide SA | | 68,380 | 13,374 |
| Airbus Group NV | | 58,941 | 9,699 |
| ALTEN | | 9,460 | 1,118 |
| AXA SA | | 310,717 | 10,757 |
| BNP Paribas SA | | 137,795 | 9,916 |
| Capgemini SA | | 71,721 | 15,074 |
| EssilorLuxottica SA | | 69,785 | 14,954 |
| Legrand SA | | 62,241 | 6,396 |
| LVMH Moet Hennessy Louis Vuitton SE | | 36,056 | 29,618 |
| Pernod Ricard SA | | 52,041 | 7,886 |
| Safran SA | | 60,658 | 13,153 |
| Sartorius Stedim Biotech | | 14,264 | 3,090 |
| Thales SA | | 24,393 | 4,112 |
TOTAL FRANCE | | | 139,147 |
| Germany - 7.6% | | | |
| Allianz SE | | 67,890 | 19,266 |
| Deutsche Borse AG | | 40,368 | 7,783 |
| DHL Group | | 150,676 | 6,309 |
| Hannover Reuck SE | | 39,636 | 9,830 |
| Infineon Technologies AG | | 212,141 | 7,362 |
| Merck KGaA | | 66,896 | 10,634 |
| Muenchener Rueckversicherungs-Gesellschaft AG in Muenchen | | 25,082 | 11,034 |
| Rheinmetall AG | | 904 | 499 |
| SAP SE | | 126,974 | 22,927 |
| Siemens AG | | 23,280 | 4,361 |
| Siemens Healthineers AG (c) | | 74,340 | 4,123 |
TOTAL GERMANY | | | 104,128 |
| Greece - 0.1% | | | |
| Piraeus Financial Holdings SA (a) | | 516,200 | 2,068 |
| Hong Kong - 0.8% | | | |
| AIA Group Ltd. | | 1,503,582 | 11,013 |
| India - 2.4% | | | |
| Axis Bank Ltd. | | 402,300 | 5,614 |
| Fairfax India Holdings Corp. (a)(c) | | 168,624 | 2,499 |
| HDFC Bank Ltd. | | 794,000 | 14,415 |
| Reliance Industries Ltd. | | 292,675 | 10,271 |
TOTAL INDIA | | | 32,799 |
| Indonesia - 1.0% | | | |
| PT Bank Central Asia Tbk | | 12,610,169 | 7,582 |
| PT Bank Rakyat Indonesia (Persero) Tbk | | 19,713,326 | 5,967 |
TOTAL INDONESIA | | | 13,549 |
| Ireland - 0.7% | | | |
| Kingspan Group PLC (Ireland) | | 98,711 | 8,833 |
| Smurfit Kappa Group PLC | | 33,854 | 1,472 |
TOTAL IRELAND | | | 10,305 |
| Italy - 2.1% | | | |
| FinecoBank SpA | | 484,967 | 7,474 |
| Ryanair Holdings PLC sponsored ADR | | 33,114 | 4,510 |
| UniCredit SpA | | 465,536 | 17,087 |
TOTAL ITALY | | | 29,071 |
| Japan - 17.6% | | | |
| BayCurrent Consulting, Inc. | | 102,859 | 2,190 |
| Capcom Co. Ltd. | | 141,350 | 2,327 |
| Fast Retailing Co. Ltd. | | 29,216 | 7,639 |
| Fuji Electric Co. Ltd. | | 117,050 | 7,281 |
| FUJIFILM Holdings Corp. | | 463,314 | 9,856 |
| Fujitsu Ltd. | | 311,953 | 4,819 |
| Hitachi Ltd. | | 355,108 | 32,763 |
| Hoya Corp. | | 152,185 | 17,644 |
| Itochu Corp. | | 344,915 | 15,561 |
| Keyence Corp. | | 29,857 | 13,130 |
| Komatsu Ltd. | | 24,600 | 734 |
| Marui Group Co. Ltd. | | 118,348 | 1,808 |
| Minebea Mitsumi, Inc. | | 219,826 | 4,117 |
| Mitsubishi Electric Corp. | | 427,152 | 7,445 |
| Mitsubishi Heavy Industries Ltd. | | 1,173,518 | 10,493 |
| ORIX Corp. | | 466,371 | 9,544 |
| Persol Holdings Co. Ltd. | | 1,185,060 | 1,639 |
| Renesas Electronics Corp. | | 540,544 | 8,776 |
| Shin-Etsu Chemical Co. Ltd. | | 566,354 | 21,923 |
| SMC Corp. | | 12,684 | 6,664 |
| Sony Group Corp. | | 133,655 | 11,047 |
| Sumitomo Mitsui Financial Group, Inc. | | 129,810 | 7,374 |
| Suzuki Motor Corp. | | 537,950 | 6,265 |
| Tokio Marine Holdings, Inc. | | 510,771 | 16,144 |
| Tokyo Electron Ltd. | | 68,930 | 15,120 |
TOTAL JAPAN | | | 242,303 |
| Korea (South) - 0.7% | | | |
| Samsung Electronics Co. Ltd. | | 164,810 | 9,136 |
| Luxembourg - 0.1% | | | |
| CVC Capital Partners PLC | | 44,400 | 806 |
| Netherlands - 6.2% | | | |
| ASML Holding NV (depository receipt) | | 58,250 | 50,821 |
| BE Semiconductor Industries NV | | 46,045 | 6,167 |
| IMCD NV | | 54,475 | 8,270 |
| Wolters Kluwer NV | | 136,439 | 20,494 |
TOTAL NETHERLANDS | | | 85,752 |
| Portugal - 0.3% | | | |
| Galp Energia SGPS SA Class B | | 162,529 | 3,504 |
| Spain - 2.3% | | | |
| Banco Santander SA (Spain) (d) | | 2,676,796 | 13,064 |
| CaixaBank SA | | 1,891,722 | 9,976 |
| Industria de Diseno Textil SA (d) | | 175,270 | 8,015 |
| Puig Group SL Class B | | 51,900 | 1,357 |
TOTAL SPAIN | | | 32,412 |
| Sweden - 3.0% | | | |
| Atlas Copco AB (A Shares) | | 505,948 | 8,862 |
| Autoliv, Inc. | | 32,648 | 3,911 |
| Indutrade AB | | 562,271 | 13,174 |
| Investor AB (B Shares) | | 624,891 | 15,443 |
| Kry International AB (a)(b)(e) | | 332 | 10 |
TOTAL SWEDEN | | | 41,400 |
| Switzerland - 3.0% | | | |
| Alcon, Inc. (Switzerland) | | 61,004 | 4,718 |
| Compagnie Financiere Richemont SA Series A | | 71,404 | 9,870 |
| Galderma Group AG | | 41,737 | 3,110 |
| Partners Group Holding AG | | 3,719 | 4,812 |
| Sika AG | | 36,713 | 10,516 |
| UBS Group AG | | 296,103 | 7,818 |
TOTAL SWITZERLAND | | | 40,844 |
| Taiwan - 2.0% | | | |
| ECLAT Textile Co. Ltd. | | 94,000 | 1,476 |
| Taiwan Semiconductor Manufacturing Co. Ltd. sponsored ADR | | 187,367 | 25,733 |
TOTAL TAIWAN | | | 27,209 |
| United Kingdom - 12.8% | | | |
| 3i Group PLC | | 262,481 | 9,378 |
| Ashtead Group PLC | | 45,169 | 3,297 |
| AstraZeneca PLC (United Kingdom) | | 197,489 | 29,870 |
| B&M European Value Retail SA | | 1,051,780 | 6,821 |
| BAE Systems PLC | | 1,181,393 | 19,649 |
| Big Yellow Group PLC | | 162,618 | 2,195 |
| Compass Group PLC | | 393,158 | 10,935 |
| Diageo PLC | | 373,819 | 12,919 |
| Flutter Entertainment PLC (a) | | 28,485 | 5,312 |
| Games Workshop Group PLC | | 22,628 | 2,802 |
| InterContinental Hotel Group PLC | | 43,778 | 4,270 |
| London Stock Exchange Group PLC | | 161,755 | 17,832 |
| RELX PLC (Euronext N.V.) | | 543,472 | 22,446 |
| Rolls-Royce Holdings PLC (a) | | 1,133,038 | 5,810 |
| RS GROUP PLC | | 584,692 | 5,385 |
| Sage Group PLC | | 609,271 | 8,877 |
| Starling Bank Ltd. Series D (a)(b)(e) | | 1,191,700 | 4,482 |
| WPP PLC | | 343,695 | 3,445 |
TOTAL UNITED KINGDOM | | | 175,725 |
| United States of America - 11.7% | | | |
| CRH PLC | | 168,547 | 13,134 |
| Experian PLC | | 156,890 | 6,328 |
| Ferguson PLC | | 83,897 | 17,780 |
| GSK PLC | | 196,072 | 4,068 |
| Holcim AG | | 64,349 | 5,387 |
| ICON PLC (a) | | 5,106 | 1,521 |
| Linde PLC | | 43,042 | 18,980 |
| Marsh & McLennan Companies, Inc. | | 67,377 | 13,437 |
| Marvell Technology, Inc. | | 157,654 | 10,391 |
| MasterCard, Inc. Class A | | 23,644 | 10,668 |
| Nestle SA (Reg. S) | | 111,246 | 11,169 |
| S&P Global, Inc. | | 20,255 | 8,423 |
| Schlumberger Ltd. | | 196,130 | 9,312 |
| Schneider Electric SA | | 63,719 | 14,529 |
| Shell PLC (London) | | 470,101 | 16,711 |
TOTAL UNITED STATES OF AMERICA | | | 161,838 |
| TOTAL COMMON STOCKS (Cost $865,756) | | | 1,347,357 |
| | | | |
| Preferred Stocks - 0.5% |
| | | Shares | Value ($) (000s) |
| Convertible Preferred Stocks - 0.5% | | | |
| Estonia - 0.1% | | | |
| Bolt Technology OU Series E (a)(b)(e) | | 10,541 | 1,294 |
| United States of America - 0.4% | | | |
| Wasabi Holdings, Inc.: | | | |
| Series C (a)(b)(e) | | 372,910 | 4,907 |
| Series D (a)(b)(e) | | 39,419 | 633 |
| | | | 5,540 |
TOTAL CONVERTIBLE PREFERRED STOCKS | | | 6,834 |
| Nonconvertible Preferred Stocks - 0.0% | | | |
| Sweden - 0.0% | | | |
| Kry International AB Series E (a)(b)(e) | | 1,920 | 80 |
| TOTAL PREFERRED STOCKS (Cost $8,229) | | | 6,914 |
| | | | |
| Money Market Funds - 2.8% |
| | | Shares | Value ($) (000s) |
| Fidelity Cash Central Fund 5.39% (f) | | 20,889,257 | 20,893 |
| Fidelity Securities Lending Cash Central Fund 5.39% (f)(g) | | 18,374,401 | 18,376 |
| TOTAL MONEY MARKET FUNDS (Cost $39,269) | | | 39,269 |
| | | | |
| TOTAL INVESTMENT IN SECURITIES - 101.1% (Cost $913,254) | 1,393,540 |
NET OTHER ASSETS (LIABILITIES) - (1.1)% | (15,820) |
| NET ASSETS - 100.0% | 1,377,720 |
| | |
Any values shown as $0 in the Schedule of Investments may reflect amounts less than $500.
Legend
| (c) | Security exempt from registration under Rule 144A of the Securities Act of 1933. These securities may be resold in transactions exempt from registration, normally to qualified institutional buyers. At the end of the period, the value of these securities amounted to $6,622,000 or 0.5% of net assets. |
| (d) | Security or a portion of the security is on loan at period end. |
| (e) | Restricted securities (including private placements) - Investment in securities not registered under the Securities Act of 1933 (excluding 144A issues). At the end of the period, the value of restricted securities (excluding 144A issues) amounted to $11,406,000 or 0.8% of net assets. |
| (f) | Affiliated fund that is generally available only to investment companies and other accounts managed by Fidelity Investments. The rate quoted is the annualized seven-day yield of the fund at period end. A complete unaudited listing of the fund's holdings as of its most recent quarter end is available upon request. In addition, each Fidelity Central Fund's financial statements are available on the SEC's website or upon request. |
| (g) | Investment made with cash collateral received from securities on loan. |
| Additional information on each restricted holding is as follows: |
| Security | Acquisition Date | Acquisition Cost ($) (000s) |
| Bolt Technology OU Series E | 1/03/22 | 2,739 |
| | | |
| Kry International AB | 5/14/21 | 144 |
| | | |
| Kry International AB Series E | 5/14/21 | 878 |
| | | |
| Starling Bank Ltd. Series D | 6/18/21 - 4/05/22 | 2,274 |
| | | |
| Wasabi Holdings, Inc. Series C | 3/31/21 | 4,052 |
| | | |
| Wasabi Holdings, Inc. Series D | 9/09/22 | 560 |
| | | |
Affiliated Central Funds
Fiscal year to date information regarding the Fund's investments in Fidelity Central Funds, including the ownership percentage, is presented below.
| Affiliate (Amounts in thousands) | Value, beginning of period ($) | Purchases ($) | Sales Proceeds ($) | Dividend Income ($) | Realized Gain (loss) ($) | Change in Unrealized appreciation (depreciation) ($) | Value, end of period ($) | % ownership, end of period |
| Fidelity Cash Central Fund 5.39% | 62,960 | 95,553 | 137,620 | 1,246 | - | - | 20,893 | 0.0% |
| Fidelity Securities Lending Cash Central Fund 5.39% | 6,177 | 91,238 | 79,039 | 26 | - | - | 18,376 | 0.1% |
| Total | 69,137 | 186,791 | 216,659 | 1,272 | - | - | 39,269 | |
| | | | | | | | | |
Amounts in the dividend income column in the above table include any capital gain distributions from underlying funds, which are presented in the corresponding line item in the Statement of Operations, if applicable.
Amounts in the dividend income column for Fidelity Securities Lending Cash Central Fund represents the income earned on investing cash collateral, less rebates paid to borrowers and any lending agent fees associated with the loan, plus any premium payments received for lending certain types of securities.
Amounts included in the purchases and sales proceeds columns may include in-kind transactions, if applicable.
Investment Valuation
The following is a summary of the inputs used, as of April 30, 2024, involving the Fund's assets and liabilities carried at fair value. The inputs or methodology used for valuing securities may not be an indication of the risk associated with investing in those securities. For more information on valuation inputs, and their aggregation into the levels used below, please refer to the Investment Valuation section in the accompanying Notes to Financial Statements.
| Valuation Inputs at Reporting Date: |
Description (Amounts in thousands) | Total ($) | Level 1 ($) | Level 2 ($) | Level 3 ($) |
Investments in Securities: | | | | |
|
| Equities: | | | | |
Communication Services | 7,443 | - | 7,443 | - |
Consumer Discretionary | 119,609 | 30,551 | 89,058 | - |
Consumer Staples | 53,734 | 22,125 | 31,609 | - |
Energy | 76,369 | 49,387 | 26,982 | - |
Financials | 295,211 | 116,065 | 174,664 | 4,482 |
Health Care | 144,902 | 43,671 | 101,231 | - |
Industrials | 308,280 | 124,297 | 183,983 | - |
Information Technology | 243,302 | 130,178 | 106,200 | 6,924 |
Materials | 103,226 | 62,542 | 40,684 | - |
Real Estate | 2,195 | 2,195 | - | - |
|
| Money Market Funds | 39,269 | 39,269 | - | - |
| Total Investments in Securities: | 1,393,540 | 620,280 | 761,854 | 11,406 |
| Statement of Assets and Liabilities |
| Amounts in thousands (except per-share amounts) | | | | April 30, 2024 (Unaudited) |
| | | | | |
| Assets | | | | |
| Investment in securities, at value (including securities loaned of $16,895) - See accompanying schedule: | | | | |
Unaffiliated issuers (cost $873,985) | $ | 1,354,271 | | |
Fidelity Central Funds (cost $39,269) | | 39,269 | | |
| | | | | |
| | | | | |
| Total Investment in Securities (cost $913,254) | | | $ | 1,393,540 |
| Foreign currency held at value (cost $385) | | | | 385 |
| Receivable for investments sold | | | | 798 |
| Receivable for fund shares sold | | | | 499 |
| Dividends receivable | | | | 4,163 |
| Reclaims receivable | | | | 4,458 |
| Distributions receivable from Fidelity Central Funds | | | | 127 |
| Prepaid expenses | | | | 1 |
| Other receivables | | | | 43 |
Total assets | | | | 1,404,014 |
| Liabilities | | | | |
| Payable for investments purchased | $ | 4,767 | | |
| Payable for fund shares redeemed | | 914 | | |
| Accrued management fee | | 973 | | |
| Distribution and service plan fees payable | | 173 | | |
| Other payables and accrued expenses | | 1,091 | | |
| Collateral on securities loaned | | 18,376 | | |
| Total liabilities | | | | 26,294 |
| Net Assets | | | $ | 1,377,720 |
| Net Assets consist of: | | | | |
| Paid in capital | | | $ | 832,676 |
| Total accumulated earnings (loss) | | | | 545,044 |
| Net Assets | | | $ | 1,377,720 |
| | | | | |
| Net Asset Value and Maximum Offering Price | | | | |
| Class A : | | | | |
Net Asset Value and redemption price per share ($476,060 ÷ 18,495 shares)(a) | | | $ | 25.74 |
| Maximum offering price per share (100/94.25 of $25.74) | | | $ | 27.31 |
| Class M : | | | | |
Net Asset Value and redemption price per share ($132,501 ÷ 5,213 shares)(a) | | | $ | 25.42 |
| Maximum offering price per share (100/96.50 of $25.42) | | | $ | 26.34 |
| Class C : | | | | |
Net Asset Value and offering price per share ($17,928 ÷ 740 shares)(a) | | | $ | 24.21 |
| Class I : | | | | |
Net Asset Value, offering price and redemption price per share ($499,042 ÷ 18,955 shares) | | | $ | 26.33 |
| Class Z : | | | | |
Net Asset Value, offering price and redemption price per share ($252,189 ÷ 9,600 shares) | | | $ | 26.27 |
(a)Redemption price per share is equal to net asset value less any applicable contingent deferred sales charge. |
| Statement of Operations |
| Amounts in thousands | | | | Six months ended April 30, 2024 (Unaudited) |
| Investment Income | | | | |
| Dividends | | | $ | 14,665 |
| Income from Fidelity Central Funds (including $26 from security lending) | | | | 1,272 |
| Income before foreign taxes withheld | | | $ | 15,937 |
| Less foreign taxes withheld | | | | (1,410) |
| Total income | | | | 14,527 |
| Expenses | | | | |
| Management fee | $ | 5,105 | | |
| Transfer agent fees | | 771 | | |
| Distribution and service plan fees | | 1,018 | | |
| Accounting fees | | 206 | | |
| Custodian fees and expenses | | 60 | | |
| Independent trustees' fees and expenses | | 4 | | |
| Registration fees | | 64 | | |
| Audit | | 59 | | |
| Legal | | 2 | | |
| Miscellaneous | | 2 | | |
| Total expenses before reductions | | 7,291 | | |
| Expense reductions | | (65) | | |
| Total expenses after reductions | | | | 7,226 |
| Net Investment income (loss) | | | | 7,301 |
| Realized and Unrealized Gain (Loss) | | | | |
| Net realized gain (loss) on: | | | | |
| Investment Securities: | | | | |
| Unaffiliated issuers (net of foreign taxes of $504) | | 21,091 | | |
| Redemptions in-kind | | 48,796 | | |
| Foreign currency transactions | | (48) | | |
| Total net realized gain (loss) | | | | 69,839 |
| Change in net unrealized appreciation (depreciation) on: | | | | |
| Investment Securities: | | | | |
| Unaffiliated issuers (net of decrease in deferred foreign taxes of $278) | | 164,298 | | |
| Assets and liabilities in foreign currencies | | (56) | | |
| Total change in net unrealized appreciation (depreciation) | | | | 164,242 |
| Net gain (loss) | | | | 234,081 |
| Net increase (decrease) in net assets resulting from operations | | | $ | 241,382 |
| Statement of Changes in Net Assets |
| |
| Amount in thousands | | Six months ended April 30, 2024 (Unaudited) | | Year ended October 31, 2023 |
| Increase (Decrease) in Net Assets | | | | |
| Operations | | | | |
| Net investment income (loss) | $ | 7,301 | $ | 15,905 |
| Net realized gain (loss) | | 69,839 | | 56,469 |
| Change in net unrealized appreciation (depreciation) | | 164,242 | | 82,113 |
| Net increase (decrease) in net assets resulting from operations | | 241,382 | | 154,487 |
| Distributions to shareholders | | (58,942) | | (28,131) |
| | | | | |
| Share transactions - net increase (decrease) | | (114,193) | | (103,254) |
| Total increase (decrease) in net assets | | 68,247 | | 23,102 |
| | | | | |
| Net Assets | | | | |
| Beginning of period | | 1,309,473 | | 1,286,371 |
| End of period | $ | 1,377,720 | $ | 1,309,473 |
| | | | | |
| | | | | |
Financial Highlights
Fidelity Advisor® Diversified International Fund Class A |
| |
| | Six months ended (Unaudited) April 30, 2024 | | Years ended October 31, 2023 | | 2022 | | 2021 | | 2020 | | 2019 |
Selected Per-Share Data | | | | | | | | | | | | |
| Net asset value, beginning of period | $ | 22.68 | $ | 20.71 | $ | 32.52 | $ | 25.10 | $ | 23.28 | $ | 21.08 |
| Income from Investment Operations | | | | | | | | | | | | |
Net investment income (loss) A,B | | .11 | | .23 | | .16 | | .09 | | .04 | | .21 |
| Net realized and unrealized gain (loss) | | 3.96 | | 2.16 | | (8.81) | | 7.33 | | 2.11 | | 2.90 |
| Total from investment operations | | 4.07 | | 2.39 | | (8.65) | | 7.42 | | 2.15 | | 3.11 |
| Distributions from net investment income | | (.31) | | (.02) | | (.31) | | - | | (.26) | | (.17) |
| Distributions from net realized gain | | (.71) | | (.40) | | (2.85) | | - | | (.07) | | (.74) |
| Total distributions | | (1.01) C | | (.42) | | (3.16) | | - | | (.33) | | (.91) |
| Net asset value, end of period | $ | 25.74 | $ | 22.68 | $ | 20.71 | $ | 32.52 | $ | 25.10 | $ | 23.28 |
Total Return D,E,F | | | | 11.55% | | (29.28)% | | 29.56% | | 9.32% | | 15.57% |
Ratios to Average Net Assets A,G,H | | | | | | | | | | | | |
| Expenses before reductions | | 1.15% I | | 1.18% | | 1.16% | | 1.16% | | 1.18% | | 1.19% |
| Expenses net of fee waivers, if any | | | | 1.17% | | 1.16% | | 1.15% | | 1.18% | | 1.19% |
| Expenses net of all reductions | | 1.14% I | | 1.17% | | 1.16% | | 1.15% | | 1.17% | | 1.19% |
| Net investment income (loss) | | .86% I | | .98% | | .65% | | .30% | | .16% | | .97% |
| Supplemental Data | | | | | | | | | | | | |
| Net assets, end of period (in millions) | $ | 476 | $ | 421 | $ | 400 | $ | 621 | $ | 514 | $ | 530 |
Portfolio turnover rate J | | | | 23% K | | 20% | | 30% | | 30% | | 37% K |
ANet investment income (loss) is affected by the timing of the declaration of dividends by any underlying mutual funds or exchange-traded funds (ETFs). Net investment income (loss) of any mutual funds or ETFs is not included in the Fund's net investment income (loss) ratio.
BCalculated based on average shares outstanding during the period.
CTotal distributions per share do not sum due to rounding.
DTotal returns for periods of less than one year are not annualized.
ETotal returns would have been lower if certain expenses had not been reduced during the applicable periods shown.
FTotal returns do not include the effect of the sales charges.
GFees and expenses of any underlying mutual funds or exchange-traded funds (ETFs) are not included in the Fund's expense ratio. The Fund indirectly bears its proportionate share of these expenses. For additional expense information related to investments in Fidelity Central Funds, please refer to the "Investments in Fidelity Central Funds" note found in the Notes to Financial Statements section of the most recent Annual or Semi-Annual report.
HExpense ratios reflect operating expenses of the class. Expenses before reductions do not reflect amounts reimbursed, waived, or reduced through arrangements with the investment adviser, brokerage services, or other offset arrangements, if applicable, and do not represent the amount paid by the class during periods when reimbursements, waivers or reductions occur.
IAnnualized.
JAmount does not include the portfolio activity of any underlying mutual funds or exchange-traded funds (ETFs).
KPortfolio turnover rate excludes securities received or delivered in-kind.
Fidelity Advisor® Diversified International Fund Class M |
| |
| | Six months ended (Unaudited) April 30, 2024 | | Years ended October 31, 2023 | | 2022 | | 2021 | | 2020 | | 2019 |
Selected Per-Share Data | | | | | | | | | | | | |
| Net asset value, beginning of period | $ | 22.37 | $ | 20.47 | $ | 32.17 | $ | 24.90 | $ | 23.10 | $ | 20.91 |
| Income from Investment Operations | | | | | | | | | | | | |
Net investment income (loss) A,B | | .08 | | .17 | | .10 | | .01 | | (.03) | | .15 |
| Net realized and unrealized gain (loss) | | 3.92 | | 2.13 | | (8.72) | | 7.26 | | 2.10 | | 2.88 |
| Total from investment operations | | 4.00 | | 2.30 | | (8.62) | | 7.27 | | 2.07 | | 3.03 |
| Distributions from net investment income | | (.24) | | - | | (.23) | | - | | (.20) | | (.11) |
| Distributions from net realized gain | | (.71) | | (.40) | | (2.85) | | - | | (.07) | | (.74) |
| Total distributions | | (.95) | | (.40) | | (3.08) | | - | | (.27) | | (.84) C |
| Net asset value, end of period | $ | 25.42 | $ | 22.37 | $ | 20.47 | $ | 32.17 | $ | 24.90 | $ | 23.10 |
Total Return D,E,F | | | | 11.24% | | (29.46)% | | 29.20% | | 9.04% | | 15.27% |
Ratios to Average Net Assets B,G,H | | | | | | | | | | | | |
| Expenses before reductions | | 1.40% I | | 1.44% | | 1.42% | | 1.41% | | 1.45% | | 1.46% |
| Expenses net of fee waivers, if any | | | | 1.43% | | 1.41% | | 1.41% | | 1.45% | | 1.46% |
| Expenses net of all reductions | | 1.39% I | | 1.43% | | 1.41% | | 1.41% | | 1.44% | | 1.46% |
| Net investment income (loss) | | .61% I | | .73% | | .39% | | .04% | | (.11)% | | .70% |
| Supplemental Data | | | | | | | | | | | | |
| Net assets, end of period (in millions) | $ | 133 | $ | 120 | $ | 118 | $ | 183 | $ | 159 | $ | 173 |
Portfolio turnover rate J | | | | 23% K | | 20% | | 30% | | 30% | | 37% K |
ACalculated based on average shares outstanding during the period.
BNet investment income (loss) is affected by the timing of the declaration of dividends by any underlying mutual funds or exchange-traded funds (ETFs). Net investment income (loss) of any mutual funds or ETFs is not included in the Fund's net investment income (loss) ratio.
CTotal distributions per share do not sum due to rounding.
DTotal returns for periods of less than one year are not annualized.
ETotal returns would have been lower if certain expenses had not been reduced during the applicable periods shown.
FTotal returns do not include the effect of the sales charges.
GFees and expenses of any underlying mutual funds or exchange-traded funds (ETFs) are not included in the Fund's expense ratio. The Fund indirectly bears its proportionate share of these expenses. For additional expense information related to investments in Fidelity Central Funds, please refer to the "Investments in Fidelity Central Funds" note found in the Notes to Financial Statements section of the most recent Annual or Semi-Annual report.
HExpense ratios reflect operating expenses of the class. Expenses before reductions do not reflect amounts reimbursed, waived, or reduced through arrangements with the investment adviser, brokerage services, or other offset arrangements, if applicable, and do not represent the amount paid by the class during periods when reimbursements, waivers or reductions occur.
IAnnualized.
JAmount does not include the portfolio activity of any underlying mutual funds or exchange-traded funds (ETFs).
KPortfolio turnover rate excludes securities received or delivered in-kind.
Fidelity Advisor® Diversified International Fund Class C |
| |
| | Six months ended (Unaudited) April 30, 2024 | | Years ended October 31, 2023 | | 2022 | | 2021 | | 2020 | | 2019 |
Selected Per-Share Data | | | | | | | | | | | | |
| Net asset value, beginning of period | $ | 21.27 | $ | 19.58 | $ | 30.84 | $ | 23.99 | $ | 22.20 | $ | 20.11 |
| Income from Investment Operations | | | | | | | | | | | | |
Net investment income (loss) A,B | | .01 | | .04 | | (.04) | | (.14) | | (.14) | | .04 |
| Net realized and unrealized gain (loss) | | 3.73 | | 2.05 | | (8.37) | | 6.99 | | 2.01 | | 2.79 |
| Total from investment operations | | 3.74 | | 2.09 | | (8.41) | | 6.85 | | 1.87 | | 2.83 |
| Distributions from net investment income | | (.09) | | - | | - | | - | | (.01) | | - |
| Distributions from net realized gain | | (.71) | | (.40) | | (2.85) | | - | | (.07) | | (.74) |
| Total distributions | | (.80) | | (.40) | | (2.85) | | - | | (.08) | | (.74) |
| Net asset value, end of period | $ | 24.21 | $ | 21.27 | $ | 19.58 | $ | 30.84 | $ | 23.99 | $ | 22.20 |
Total Return C,D,E | | | | 10.67% | | (29.88)% | | 28.55% | | 8.44% | | 14.72% |
Ratios to Average Net Assets B,F,G | | | | | | | | | | | | |
| Expenses before reductions | | 1.90% H | | 1.99% | | 1.96% | | 1.95% | | 1.98% | | 1.98% |
| Expenses net of fee waivers, if any | | | | 1.98% | | 1.96% | | 1.95% | | 1.98% | | 1.98% |
| Expenses net of all reductions | | 1.89% H | | 1.98% | | 1.96% | | 1.95% | | 1.96% | | 1.97% |
| Net investment income (loss) | | .11% H | | .18% | | (.16)% | | (.50)% | | (.64)% | | .18% |
| Supplemental Data | | | | | | | | | | | | |
| Net assets, end of period (in millions) | $ | 18 | $ | 18 | $ | 21 | $ | 39 | $ | 48 | $ | 59 |
Portfolio turnover rate I | | | | 23% J | | 20% | | 30% | | 30% | | 37% J |
ACalculated based on average shares outstanding during the period.
BNet investment income (loss) is affected by the timing of the declaration of dividends by any underlying mutual funds or exchange-traded funds (ETFs). Net investment income (loss) of any mutual funds or ETFs is not included in the Fund's net investment income (loss) ratio.
CTotal returns for periods of less than one year are not annualized.
DTotal returns would have been lower if certain expenses had not been reduced during the applicable periods shown.
ETotal returns do not include the effect of the contingent deferred sales charge.
FFees and expenses of any underlying mutual funds or exchange-traded funds (ETFs) are not included in the Fund's expense ratio. The Fund indirectly bears its proportionate share of these expenses. For additional expense information related to investments in Fidelity Central Funds, please refer to the "Investments in Fidelity Central Funds" note found in the Notes to Financial Statements section of the most recent Annual or Semi-Annual report.
GExpense ratios reflect operating expenses of the class. Expenses before reductions do not reflect amounts reimbursed, waived, or reduced through arrangements with the investment adviser, brokerage services, or other offset arrangements, if applicable, and do not represent the amount paid by the class during periods when reimbursements, waivers or reductions occur.
HAnnualized.
IAmount does not include the portfolio activity of any underlying mutual funds or exchange-traded funds (ETFs).
JPortfolio turnover rate excludes securities received or delivered in-kind.
Fidelity Advisor® Diversified International Fund Class I |
| |
| | Six months ended (Unaudited) April 30, 2024 | | Years ended October 31, 2023 | | 2022 | | 2021 | | 2020 | | 2019 |
Selected Per-Share Data | | | | | | | | | | | | |
| Net asset value, beginning of period | $ | 23.20 | $ | 21.19 | $ | 33.20 | $ | 25.57 | $ | 23.68 | $ | 21.44 |
| Income from Investment Operations | | | | | | | | | | | | |
Net investment income (loss) A,B | | .14 | | .30 | | .23 | | .17 | | .10 | | .27 |
| Net realized and unrealized gain (loss) | | 4.06 | | 2.20 | | (9.00) | | 7.47 | | 2.16 | | 2.95 |
| Total from investment operations | | 4.20 | | 2.50 | | (8.77) | | 7.64 | | 2.26 | | 3.22 |
| Distributions from net investment income | | (.36) | | (.09) | | (.39) | | (.01) | | (.30) | | (.24) |
| Distributions from net realized gain | | (.71) | | (.40) | | (2.85) | | - | | (.07) | | (.74) |
| Total distributions | | (1.07) | | (.49) | | (3.24) | | (.01) | | (.37) | | (.98) |
| Net asset value, end of period | $ | 26.33 | $ | 23.20 | $ | 21.19 | $ | 33.20 | $ | 25.57 | $ | 23.68 |
Total Return C,D | | | | 11.80% | | (29.09)% | | 29.87% | | 9.63% | | 15.89% |
Ratios to Average Net Assets B,E,F | | | | | | | | | | | | |
| Expenses before reductions | | .90% G | | .94% | | .91% | | .90% | | .92% | | .92% |
| Expenses net of fee waivers, if any | | | | .93% | | .91% | | .90% | | .92% | | .92% |
| Expenses net of all reductions | | .89% G | | .93% | | .91% | | .90% | | .91% | | .91% |
| Net investment income (loss) | | 1.11% G | | 1.23% | | .90% | | .55% | | .42% | | 1.24% |
| Supplemental Data | | | | | | | | | | | | |
| Net assets, end of period (in millions) | $ | 499 | $ | 457 | $ | 457 | $ | 725 | $ | 595 | $ | 583 |
Portfolio turnover rate H | | | | 23% I | | 20% | | 30% | | 30% | | 37% I |
ACalculated based on average shares outstanding during the period.
BNet investment income (loss) is affected by the timing of the declaration of dividends by any underlying mutual funds or exchange-traded funds (ETFs). Net investment income (loss) of any mutual funds or ETFs is not included in the Fund's net investment income (loss) ratio.
CTotal returns for periods of less than one year are not annualized.
DTotal returns would have been lower if certain expenses had not been reduced during the applicable periods shown.
EFees and expenses of any underlying mutual funds or exchange-traded funds (ETFs) are not included in the Fund's expense ratio. The Fund indirectly bears its proportionate share of these expenses. For additional expense information related to investments in Fidelity Central Funds, please refer to the "Investments in Fidelity Central Funds" note found in the Notes to Financial Statements section of the most recent Annual or Semi-Annual report.
FExpense ratios reflect operating expenses of the class. Expenses before reductions do not reflect amounts reimbursed, waived, or reduced through arrangements with the investment adviser, brokerage services, or other offset arrangements, if applicable, and do not represent the amount paid by the class during periods when reimbursements, waivers or reductions occur.
GAnnualized.
HAmount does not include the portfolio activity of any underlying mutual funds or exchange-traded funds (ETFs).
IPortfolio turnover rate excludes securities received or delivered in-kind.
Fidelity Advisor® Diversified International Fund Class Z |
| |
| | Six months ended (Unaudited) April 30, 2024 | | Years ended October 31, 2023 | | 2022 | | 2021 | | 2020 | | 2019 |
Selected Per-Share Data | | | | | | | | | | | | |
| Net asset value, beginning of period | $ | 23.17 | $ | 21.18 | $ | 33.19 | $ | 25.55 | $ | 23.67 | $ | 21.44 |
| Income from Investment Operations | | | | | | | | | | | | |
Net investment income (loss) A,B | | .16 | | .34 | | .26 | | .22 | | .14 | | .30 |
| Net realized and unrealized gain (loss) | | 4.05 | | 2.19 | | (8.98) | | 7.46 | | 2.15 | | 2.94 |
| Total from investment operations | | 4.21 | | 2.53 | | (8.72) | | 7.68 | | 2.29 | | 3.24 |
| Distributions from net investment income | | (.41) | | (.14) | | (.44) | | (.04) | | (.34) | | (.28) |
| Distributions from net realized gain | | (.71) | | (.40) | | (2.85) | | - | | (.07) | | (.74) |
| Total distributions | | (1.11) C | | (.54) | | (3.29) | | (.04) | | (.41) | | (1.01) C |
| Net asset value, end of period | $ | 26.27 | $ | 23.17 | $ | 21.18 | $ | 33.19 | $ | 25.55 | $ | 23.67 |
Total Return D,E | | | | 11.96% | | (28.99)% | | 30.10% | | 9.78% | | 16.04% |
Ratios to Average Net Assets B,F,G | | | | | | | | | | | | |
| Expenses before reductions | | .74% H | | .77% | | .76% | | .76% | | .77% | | .77% |
| Expenses net of fee waivers, if any | | | | .77% | | .75% | | .76% | | .77% | | .77% |
| Expenses net of all reductions | | .73% H | | .77% | | .75% | | .76% | | .76% | | .77% |
| Net investment income (loss) | | 1.27% H | | 1.39% | | 1.05% | | .70% | | .57% | | 1.39% |
| Supplemental Data | | | | | | | | | | | | |
| Net assets, end of period (in millions) | $ | 252 | $ | 294 | $ | 290 | $ | 393 | $ | 289 | $ | 274 |
Portfolio turnover rate I | | | | 23% J | | 20% | | 30% | | 30% | | 37% J |
ACalculated based on average shares outstanding during the period.
BNet investment income (loss) is affected by the timing of the declaration of dividends by any underlying mutual funds or exchange-traded funds (ETFs). Net investment income (loss) of any mutual funds or ETFs is not included in the Fund's net investment income (loss) ratio.
CTotal distributions per share do not sum due to rounding.
DTotal returns for periods of less than one year are not annualized.
ETotal returns would have been lower if certain expenses had not been reduced during the applicable periods shown.
FFees and expenses of any underlying mutual funds or exchange-traded funds (ETFs) are not included in the Fund's expense ratio. The Fund indirectly bears its proportionate share of these expenses. For additional expense information related to investments in Fidelity Central Funds, please refer to the "Investments in Fidelity Central Funds" note found in the Notes to Financial Statements section of the most recent Annual or Semi-Annual report.
GExpense ratios reflect operating expenses of the class. Expenses before reductions do not reflect amounts reimbursed, waived, or reduced through arrangements with the investment adviser, brokerage services, or other offset arrangements, if applicable, and do not represent the amount paid by the class during periods when reimbursements, waivers or reductions occur.
HAnnualized.
IAmount does not include the portfolio activity of any underlying mutual funds or exchange-traded funds (ETFs).
JPortfolio turnover rate excludes securities received or delivered in-kind.
For the period ended April 30, 2024
(Amounts in thousands except percentages)
1. Organization.
Fidelity Advisor Diversified International Fund (the Fund) is a fund of Fidelity Advisor Series VIII (the Trust) and is authorized to issue an unlimited number of shares. The Trust is registered under the Investment Company Act of 1940, as amended (the 1940 Act), as an open-end management investment company organized as a Massachusetts business trust. The Fund offers Class A, Class M, Class C, Class I and Class Z shares, each of which has equal rights as to assets and voting privileges. Class A, Class M, Class C, Class I and Class Z are Fidelity Advisor classes. Each class has exclusive voting rights with respect to matters that affect that class. Class C shares will automatically convert to Class A shares after a holding period of eight years from the initial date of purchase, with certain exceptions.
2. Investments in Fidelity Central Funds.
Funds may invest in Fidelity Central Funds, which are open-end investment companies generally available only to other investment companies and accounts managed by the investment adviser and its affiliates. The Schedule of Investments lists any Fidelity Central Funds held as an investment as of period end, but does not include the underlying holdings of each Fidelity Central Fund. An investing fund indirectly bears its proportionate share of the expenses of the underlying Fidelity Central Funds.
Based on its investment objective, each Fidelity Central Fund may invest or participate in various investment vehicles or strategies that are similar to those of the investing fund. These strategies are consistent with the investment objectives of the investing fund and may involve certain economic risks which may cause a decline in value of each of the Fidelity Central Funds and thus a decline in the value of the investing fund.
| Fidelity Central Fund | Investment Manager | Investment Objective | Investment Practices | Expense RatioA |
| Fidelity Money Market Central Funds | Fidelity Management & Research Company LLC (FMR) | Each fund seeks to obtain a high level of current income consistent with the preservation of capital and liquidity. | Short-term Investments | Less than .005% |
A Expenses expressed as a percentage of average net assets and are as of each underlying Central Fund's most recent annual or semi-annual shareholder report.
A complete unaudited list of holdings for each Fidelity Central Fund is available upon request or at the Securities and Exchange Commission website at www.sec.gov. In addition, the financial statements of the Fidelity Central Funds which contain the significant accounting policies (including investment valuation policies) of those funds, and are not covered by the Report of Independent Registered Public Accounting Firm, are available on the Securities and Exchange Commission website or upon request.
3. Significant Accounting Policies.
The Fund is an investment company and applies the accounting and reporting guidance of the Financial Accounting Standards Board (FASB) Accounting Standards Codification Topic 946 Financial Services - Investment Companies. The financial statements have been prepared in conformity with accounting principles generally accepted in the United States of America (GAAP), which require management to make certain estimates and assumptions at the date of the financial statements. Actual results could differ from those estimates. Subsequent events, if any, through the date that the financial statements were issued have been evaluated in the preparation of the financial statements. The Fund's Schedule of Investments lists any underlying mutual funds or ETFs but does not include the underlying holdings of these funds. The following summarizes the significant accounting policies of the Fund:
Investment Valuation. Investments are valued as of 4:00 p.m. Eastern time on the last calendar day of the period. The Board of Trustees (the Board) has designated the Fund's investment adviser as the valuation designee responsible for the fair valuation function and performing fair value determinations as needed. The investment adviser has established a Fair Value Committee (the Committee) to carry out the day-to-day fair valuation responsibilities and has adopted policies and procedures to govern the fair valuation process and the activities of the Committee. In accordance with these fair valuation policies and procedures, which have been approved by the Board, the Fund attempts to obtain prices from one or more third party pricing services or brokers to value its investments. When current market prices, quotations or currency exchange rates are not readily available or reliable, investments will be fair valued in good faith by the Committee, in accordance with the policies and procedures. Factors used in determining fair value vary by investment type and may include market or investment specific events, transaction data, estimated cash flows, and market observations of comparable investments. The frequency that the fair valuation procedures are used cannot be predicted and they may be utilized to a significant extent. The Committee manages the Fund's fair valuation practices and maintains the fair valuation policies and procedures. The Fund's investment adviser reports to the Board information regarding the fair valuation process and related material matters.
The Fund categorizes the inputs to valuation techniques used to value its investments into a disclosure hierarchy consisting of three levels as shown below:
Level 1 - unadjusted quoted prices in active markets for identical investments
Level 2 - other significant observable inputs (including quoted prices for similar investments, interest rates, prepayment speeds, etc.)
Level 3 - unobservable inputs (including the Fund's own assumptions based on the best information available)
Valuation techniques used to value the Fund's investments by major category are as follows:
Equity securities, including restricted securities, for which market quotations are readily available, are valued at the last reported sale price or official closing price as reported by a third party pricing service on the primary market or exchange on which they are traded and are categorized as Level 1 in the hierarchy. In the event there were no sales during the day or closing prices are not available, securities are valued at the last quoted bid price or may be valued using the last available price and are generally categorized as Level 2 in the hierarchy. For foreign equity securities, when market or security specific events arise, comparisons to the valuation of American Depositary Receipts (ADRs), futures contracts, ETFs and certain indexes as well as quoted prices for similar securities may be used and would be categorized as Level 2 in the hierarchy. For equity securities, including restricted securities, where observable inputs are limited, assumptions about market activity and risk are used and these securities may be categorized as Level 3 in the hierarchy.
Investments in open-end mutual funds, including the Fidelity Central Funds, are valued at their closing net asset value (NAV) each business day and are categorized as Level 1 in the hierarchy.
Changes in valuation techniques may result in transfers in or out of an assigned level within the disclosure hierarchy. The aggregate value of investments by input level as of April 30, 2024 is included at the end of the Fund's Schedule of Investments.
Foreign Currency. Foreign-denominated assets, including investment securities, and liabilities are translated into U.S. dollars at the exchange rates at period end. Purchases and sales of investment securities, income and dividends received, and expenses denominated in foreign currencies are translated into U.S. dollars at the exchange rate in effect on the transaction date.
The effects of exchange rate fluctuations on investments are included with the net realized and unrealized gain (loss) on investment securities. Other foreign currency transactions resulting in realized and unrealized gain (loss) are disclosed separately.
Realized gains and losses on foreign currency transactions arise from the disposition of foreign currency, realized changes in the value of foreign currency between the trade and settlement dates on security transactions, and the difference between the amounts of dividends, interest and foreign withholding taxes recorded on transaction date and the U.S. dollar equivalent of the amounts actually received or paid. Unrealized gains and losses on assets and liabilities in foreign currencies arise from changes in the value of foreign currency, and from assets and liabilities denominated in foreign currencies, other than investments, which are held at period end.
Investment Transactions and Income. For financial reporting purposes, the Fund's investment holdings and NAV include trades executed through the end of the last business day of the period. The NAV per share for processing shareholder transactions is calculated as of the close of business of the New York Stock Exchange (NYSE), normally 4:00 p.m. Eastern time and includes trades executed through the end of the prior business day. Gains and losses on securities sold are determined on the basis of identified cost and include proceeds received from litigation. Commissions paid to certain brokers with whom the investment adviser, or its affiliates, places trades on behalf of a fund include an amount in addition to trade execution, which may be rebated back to a fund. Any such rebates are included in net realized gain (loss) on investments in the Statement of Operations. Dividend income is recorded on the ex-dividend date, except for certain dividends from foreign securities where the ex-dividend date may have passed, which are recorded as soon as the Fund is informed of the ex-dividend date. Non-cash dividends included in dividend income, if any, are recorded at the fair market value of the securities received. Income and capital gain distributions from Fidelity Central Funds, if any, are recorded on the ex-dividend date. Investment income is recorded net of foreign taxes withheld where recovery of such taxes is uncertain. Funds may file withholding tax reclaims in certain jurisdictions to recover a portion of amounts previously withheld. Any withholding tax reclaims income is included in the Statement of Operations in foreign taxes withheld. Any receivables for withholding tax reclaims are included in the Statement of Assets and Liabilities in reclaims receivable.
Class Allocations and Expenses. Investment income, realized and unrealized capital gains and losses, common expenses of a fund, and certain fund-level expense reductions, if any, are allocated daily on a pro-rata basis to each class based on the relative net assets of each class to the total net assets of a fund. Each class differs with respect to transfer agent and distribution and service plan fees incurred, as applicable. Certain expense reductions may also differ by class, if applicable. For the reporting period, the allocated portion of income and expenses to each class as a percent of its average net assets may vary due to the timing of recording these transactions in relation to fluctuating net assets of the classes. Expenses directly attributable to a fund are charged to that fund. Expenses attributable to more than one fund are allocated among the respective funds on the basis of relative net assets or other appropriate methods. Expenses included in the accompanying financial statements reflect the expenses of that fund and do not include any expenses associated with any underlying mutual funds or exchange-traded funds (ETFs). Although not included in a fund's expenses, a fund indirectly bears its proportionate share of these expenses through the net asset value of each underlying mutual fund or exchange-traded fund (ETF). Expense estimates are accrued in the period to which they relate and adjustments are made when actual amounts are known.
Income Tax Information and Distributions to Shareholders. Each year, the Fund intends to qualify as a regulated investment company under Subchapter M of the Internal Revenue Code, including distributing substantially all of its taxable income and realized gains. As a result, no provision for U.S. Federal income taxes is required. The Fund files a U.S. federal tax return, in addition to state and local tax returns as required. The Fund's federal income tax returns are subject to examination by the Internal Revenue Service (IRS) for a period of three fiscal years after they are filed. State and local tax returns may be subject to examination for an additional fiscal year depending on the jurisdiction. Foreign taxes are provided for based on the Fund's understanding of the tax rules and rates that exist in the foreign markets in which it invests. The Fund is subject to a tax imposed on capital gains by certain countries in which it invests. An estimated deferred tax liability for net unrealized appreciation on the applicable securities is included in Other payables and accrued expenses on the Statement of Assets & Liabilities.
Distributions are declared and recorded on the ex-dividend date. Income and capital gain distributions are declared separately for each class. Income and capital gain distributions are determined in accordance with income tax regulations, which may differ from GAAP.
Capital accounts within the financial statements are adjusted for permanent book-tax differences. These adjustments have no impact on net assets or the results of operations. Capital accounts are not adjusted for temporary book-tax differences which will reverse in a subsequent period.
Book-tax differences are primarily due to foreign currency transactions, certain foreign taxes, passive foreign investment companies (PFIC), redemptions in-kind and losses deferred due to wash sales.
As of period end, the cost and unrealized appreciation (depreciation) in securities, and derivatives if applicable, for federal income tax purposes were as follows:
| Gross unrealized appreciation | $497,734 |
| Gross unrealized depreciation | (22,815) |
| Net unrealized appreciation (depreciation) | $474,919 |
| Tax cost | $918,621 |
Restricted Securities (including Private Placements). Funds may invest in securities that are subject to legal or contractual restrictions on resale. These securities generally may be resold in transactions exempt from registration or to the public if the securities are registered. Disposal of these securities may involve time-consuming negotiations and expense, and prompt sale at an acceptable price may be difficult. Information regarding restricted securities held at period end is included at the end of the Schedule of Investments, if applicable.
4. Purchases and Sales of Investments.
Purchases and sales of securities, other than short-term securities and in-kind transactions, as applicable, are noted in the table below.
| | Purchases ($) | Sales ($) |
| Fidelity Advisor Diversified International Fund | 279,775 | 294,867 |
Unaffiliated Redemptions In-Kind. Shares that were redeemed in-kind for investments, including accrued interest and cash, if any, are shown in the table below. The net realized gain or loss on investments delivered through in-kind redemptions is included in the "Net realized gain (loss) on: Redemptions in-kind" line in the accompanying Statement of Operations. The amount of the in-kind redemptions is included in share transactions in the accompanying Statement of Changes in Net Assets. There was no gain or loss for federal income tax purposes.
| | Shares | Total net realized gain or loss ($) | Total Proceeds ($) |
| Fidelity Advisor Diversified International Fund | 3,978 | 48,796 | 107,774 |
Prior Fiscal Year Unaffiliated Redemptions In-Kind. Shares that were redeemed in-kind for investments, including accrued interest and cash, if any, are shown in the table below; along with realized gain or loss on investments delivered through in-kind redemptions. The amount of the in-kind redemptions is included in share transactions in the accompanying Statement of Changes in Net Assets. There was no gain or loss for federal income tax purposes.
| | Shares | Total net realized gain or loss ($) | Total Proceeds ($) |
| Fidelity Advisor Diversified International Fund | 1,648 | 15,675 | 39,881 |
5. Fees and Other Transactions with Affiliates.
Management Fee. Fidelity Management & Research Company LLC (the investment adviser) and its affiliates provide the Fund with investment management related services for which the Fund pays a monthly management fee.
Effective March 1, 2024, the Fund's management contract was amended to incorporate administrative services previously covered under separate services agreements (Transfer Agent and Accounting agreements). The amended contract incorporates a management fee rate that may vary by class. The investment adviser or an affiliate pays certain expenses of managing and operating the Fund out of each class's management fee. Each class of the Fund pays a management fee to the investment adviser. The management fee is calculated and paid to the investment adviser every month. When determining a class's management fee, a mandate rate is calculated based on the monthly average net assets of a group of funds advised by FMR within a designated asset class. A discount rate is subtracted from the mandate rate once the Fund's monthly average net assets reach a certain level. The mandate rate and discount rate may vary by class. The annual management fee rate for a class of shares of the Fund is the lesser of (1) the class's mandate rate reduced by the class's discount rate (if applicable) or (2) the amount set forth in the following table.
| | Maximum Management Fee Rate % |
| Class A | .85 |
| Class M | .86 |
| Class C | .86 |
| Class I | .86 |
| Class Z | .70 |
One-twelfth of the management fee rate for a class is applied to the average net assets of the class for the month, giving a dollar amount which is the management fee for the class for that month. A different management fee rate may be applicable to each class of the Fund. The difference between classes is the result of separate arrangements for class-level services and/or waivers of certain expenses. It is not the result of any difference in advisory or custodial fees or other expenses related to the management of the Fund's assets, which do not vary by class. For the portion of the reporting period on or after March 1, 2024, the total annualized management fee rates were as follows:
| | Total Management Fee Rate % |
| Class A | .85 |
| Class M | .85 |
| Class C | .85 |
| Class I | .85 |
| Class Z | .70 |
Prior to March 1, 2024, the management fee was the sum of an individual fund fee rate that was based on an annual rate of .42% of the Fund's average net assets and an annualized group fee rate that averaged .22% during the period. The group fee rate was based upon the monthly average net assets of a group of registered investment companies with which the investment adviser has management contracts. The group fee rate decreased as assets under management increased and increased as assets under management decreased. For the portion of the reporting period prior to March 1, 2024, the total annualized management fee rate was .65%.
Effective March 1, 2024, the Fund's sub-advisory agreements with FMR Investment Management (UK) Limited, Fidelity Management & Research (Hong Kong) Limited, and Fidelity Management & Research (Japan) Limited were amended to provide that the investment adviser pays each sub-adviser monthly fees equal to 110% of the sub-adviser's costs for providing sub-advisory services.
Effective March 1, 2024, the Fund's sub-advisory agreement with FIL Investment Advisors (FIA) was amended to provide that the investment adviser pays FIA monthly fees at an annual rate of 0.44% with respect to the average daily net assets of the Fund managed by FIA. FIA in turn pays FIA(UK).
Distribution and Service Plan Fees. In accordance with Rule 12b-1 of the 1940 Act, the Fund has adopted separate Distribution and Service Plans for each class of shares. Certain classes pay Fidelity Distributors Company LLC (FDC), an affiliate of the investment adviser, separate Distribution and Service Fees, each of which is based on an annual percentage of each class' average net assets. In addition, FDC may pay financial intermediaries for selling shares of the Fund and providing shareholder support services. For the period, the Distribution and Service Fee rates, total fees and amounts retained by FDC were as follows:
| | Distribution Fee | Service Fee | Total Fees ($) | Retained by FDC ($) |
| Class A | - % | .25% | 589 | 8 |
| Class M | .25% | .25% | 333 | 3 |
| Class C | .75% | .25% | 96 | 8 |
| | | | 1,018 | 19 |
Sales Load. FDC may receive a front-end sales charge of up to 5.75% for selling Class A shares and 3.50% for selling Class M shares, some of which is paid to financial intermediaries for selling shares of the Fund. Depending on the holding period, FDC may receive contingent deferred sales charges levied on Class A, Class M and Class C redemptions. The deferred sales charges are 1.00% for Class C shares, 1.00% for certain purchases of Class A shares and .25% for certain purchases of Class M shares.
For the period, sales charge amounts retained by FDC were as follows:
| | Retained by FDC ($) |
| Class A | 12 |
| Class M | 2 |
Class CA | 1 |
| | 15 |
A When Class C shares are initially sold, FDC pays commissions from its own resources to financial intermediaries through which the sales are made.
Transfer Agent Fees. Fidelity Investments Institutional Operations Company LLC (FIIOC), an affiliate of the investment adviser, is the transfer, dividend disbursing and shareholder servicing agent for each class of the Fund. Effective March 1, 2024, the Fund's management contract was amended to incorporate transfer agent services and associated fees previously covered under a separate services agreement. FIIOC pays for typesetting, printing and mailing of shareholder reports, except proxy statements.
During November 2023, the Board approved a change in the transfer agent fees effective December 1, 2023 to a fixed annual rate of class-level average net assets as follows:
| | % of Class-Level Average Net Assets |
| Class A | .1933 |
| Class M | .2000 |
| Class C | .2000 |
| Class I | .2000 |
Prior to December 1, 2023, FIIOC received account fees and asset-based fees that varied according to the account size and type of account of the shareholders of the respective classes of the Fund, except for Class Z. FIIOC received an asset-based fee of Class Z's average net assets. For the portion of the reporting period prior to March 1, 2024, the fees were equivalent to the following annualized rates:
| | Amount ($) | % of Class-Level Average Net AssetsA |
| Class A | 297 | .19 |
| Class M | 87 | .20 |
| Class C | 13 | .21 |
| Class I | 328 | .20 |
| Class Z | 46 | .04 |
| | 771 | |
A Annualized
Accounting Fees. Fidelity Service Company, Inc. (FSC), an affiliate of the investment adviser, maintains the Fund's accounting records. Effective March 1, 2024, the Fund's management contract was amended to incorporate accounting services and associated fees previously covered under a separate services agreement.
During November 2023, the Board approved a change in the accounting fees effective December 1, 2023 to a fixed annual rate of average net assets as follows:
| | % of Average Net Assets |
| Fidelity Advisor Diversified International Fund | .0429 |
Prior to December 1, 2023, the accounting fee was based on the level of average net assets for each month. For the portion of the reporting period prior to March 1, 2024, the fees were equivalent to the following annualized rates:
| | % of Average Net Assets |
| Fidelity Advisor Diversified International Fund | .04 |
Brokerage Commissions. A portion of portfolio transactions were placed with brokerage firms which are affiliates of the investment adviser. Brokerage commissions are included in net realized gain (loss) and change in net unrealized appreciation (depreciation) in the Statement of Operations. The commissions paid to these affiliated firms were as follows:
| | Amount |
| Fidelity Advisor Diversified International Fund | -A |
| | |
A In the amount of less than five-hundred dollars
Interfund Trades. Funds may purchase from or sell securities to other Fidelity Funds under procedures adopted by the Board. The procedures have been designed to ensure these interfund trades are executed in accordance with Rule 17a-7 of the 1940 Act. Any interfund trades are included within the respective purchases and sales amounts shown in the Purchases and Sales of Investments note. Interfund trades during the period are noted in the table below.
| | Purchases ($) | Sales ($) | Realized Gain (Loss)($) |
| Fidelity Advisor Diversified International Fund | 2,783 | 10,684 | (543) |
6. Committed Line of Credit.
Certain Funds participate with other funds managed by the investment adviser or an affiliate in a $4.25 billion credit facility (the "line of credit") to be utilized for temporary or emergency purposes to fund shareholder redemptions or for other short-term liquidity purposes. The participating funds have agreed to pay commitment fees on their pro-rata portion of the line of credit, which are reflected in Miscellaneous expenses on the Statement of Operations, and are listed below. During the period, there were no borrowings on this line of credit.
| | Amount ($) |
| Fidelity Advisor Diversified International Fund | 1 |
7. Security Lending.
Funds lend portfolio securities from time to time in order to earn additional income. Lending agents are used, including National Financial Services (NFS), an affiliate of the investment adviser. Pursuant to a securities lending agreement, NFS will receive a fee, which is capped at 9.9% of a fund's daily lending revenue, for its services as lending agent. A fund may lend securities to certain qualified borrowers, including NFS. On the settlement date of the loan, a fund receives collateral (in the form of U.S. Treasury obligations, letters of credit and/or cash) against the loaned securities and maintains collateral in an amount not less than 100% of the market value of the loaned securities during the period of the loan. The market value of the loaned securities is determined at the close of business of a fund and any additional required collateral is delivered to a fund on the next business day. A fund or borrower may terminate the loan at any time, and if the borrower defaults on its obligation to return the securities loaned because of insolvency or other reasons, a fund may apply collateral received from the borrower against the obligation. A fund may experience delays and costs in recovering the securities loaned. Any cash collateral received is invested in the Fidelity Securities Lending Cash Central Fund. Any loaned securities are identified as such in the Schedule of Investments, and the value of loaned securities and cash collateral at period end, as applicable, are presented in the Statement of Assets and Liabilities. Security lending income represents the income earned on investing cash collateral, less rebates paid to borrowers and any lending agent fees associated with the loan, plus any premium payments received for lending certain types of securities. Security lending income is presented in the Statement of Operations as a component of income from Fidelity Central Funds. Affiliated security lending activity, if any, was as follows:
| | Total Security Lending Fees Paid to NFS ($) | Security Lending Income From Securities Loaned to NFS ($) | Value of Securities Loaned to NFS at Period End ($) |
| Fidelity Advisor Diversified International Fund | 3 | - | - |
8. Expense Reductions.
During the period the investment adviser or an affiliate reimbursed and/or waived a portion of fund-level operating expenses in the amount of $65.
9. Distributions to Shareholders.
Distributions to shareholders of each class were as follows:
| | Six months ended April 30, 2024 | Year ended October 31, 2023 |
| Fidelity Advisor Diversified International Fund | | |
| Distributions to shareholders | | |
| Class A | $18,579 | $8,055 |
| Class M | 5,022 | 2,274 |
| Class C | 662 | 428 |
| Class I | 20,547 | 9,902 |
| Class Z | 14,132 | 7,472 |
Total | $58,942 | $28,131 |
10. Share Transactions.
Share transactions for each class were as follows and may contain in-kind transactions, automatic conversions between classes or exchanges between affiliated funds:
| | Shares | Shares | Dollars | Dollars |
| | Six months ended April 30, 2024 | Year ended October 31, 2023 | Six months ended April 30, 2024 | Year ended October 31, 2023 |
| Fidelity Advisor Diversified International Fund | | | | |
| Class A | | | | |
| Shares sold | 437 | 1,201 | $10,940 | $28,447 |
| Reinvestment of distributions | 731 | 336 | 17,371 | 7,596 |
| Shares redeemed | (1,229) | (2,309) | (30,908) | (54,664) |
| Net increase (decrease) | (61) | (772) | $(2,597) | $(18,621) |
| Class M | | | | |
| Shares sold | 92 | 266 | $2,320 | $6,211 |
| Reinvestment of distributions | 210 | 100 | 4,923 | 2,237 |
| Shares redeemed | (455) | (743) | (11,339) | (17,392) |
| Net increase (decrease) | (153) | (377) | $(4,096) | $(8,944) |
| Class C | | | | |
| Shares sold | 30 | 105 | $701 | $2,330 |
| Reinvestment of distributions | 28 | 19 | 636 | 416 |
| Shares redeemed | (172) | (361) | (4,072) | (8,084) |
| Net increase (decrease) | (114) | (237) | $(2,735) | $(5,338) |
| Class I | | | | |
| Shares sold | 1,307 | 3,192 | $33,712 | $77,403 |
| Reinvestment of distributions | 693 | 346 | 16,819 | 7,975 |
| Shares redeemed | (2,737) | (5,428) | (69,945) | (130,786) |
| Net increase (decrease) | (737) | (1,890) | $(19,414) | $(45,408) |
| Class Z | | | | |
| Shares sold | 1,247 | 2,604 | $31,999 | $62,842 |
| Reinvestment of distributions | 550 | 307 | 13,319 | 7,055 |
| Shares redeemed | (4,864) | (3,933) | (130,669) | (94,840) |
| Net increase (decrease) | (3,067) | (1,022) | $(85,351) | $(24,943) |
11. Other.
A fund's organizational documents provide former and current trustees and officers with a limited indemnification against liabilities arising in connection with the performance of their duties to the fund. In the normal course of business, a fund may also enter into contracts that provide general indemnifications. A fund's maximum exposure under these arrangements is unknown as this would be dependent on future claims that may be made against a fund. The risk of material loss from such claims is considered remote.
12. Risk and Uncertainties.
Many factors affect a fund's performance. Developments that disrupt global economies and financial markets, such as pandemics, epidemics, outbreaks of infectious diseases, war, terrorism, and environmental disasters, may significantly affect a fund's investment performance. The effects of these developments to a fund will be impacted by the types of securities in which a fund invests, the financial condition, industry, economic sector, and geographic location of an issuer, and a fund's level of investment in the securities of that issuer. Significant concentrations in security types, issuers, industries, sectors, and geographic locations may magnify the factors that affect a fund's performance.
As a shareholder, you incur two types of costs: (1) transaction costs, which may include sales charges (loads) on purchase payments or redemption proceeds, as applicable and (2) ongoing costs, which generally include management fees, distribution and/or service (12b-1) fees and other Fund expenses. This Example is intended to help you understand your ongoing costs (in dollars) of investing in a fund and to compare these costs with the ongoing costs of investing in other mutual funds.
| The Example is based on an investment of $1,000 invested at the beginning of the period and held for the entire period (November 1, 2023 to April 30, 2024). |
Actual Expenses
The first line of the accompanying table provides information about actual account values and actual expenses. You may use the information in this line, together with the amount you invested, to estimate the expenses that you paid over the period. Simply divide your account value by $1,000.00 (for example, an $8,600 account value divided by $1,000.00 = 8.6), then multiply the result by the number in the first line for a class/Fund under the heading entitled "Expenses Paid During Period" to estimate the expenses you paid on your account during this period. If any fund is a shareholder of any underlying mutual funds or exchange-traded funds (ETFs) (the Underlying Funds), such fund indirectly bears its proportional share of the expenses of the Underlying Funds in addition to the direct expenses incurred presented in the table. These fees and expenses are not included in the annualized expense ratio used to calculate the expense estimate in the table below.
Hypothetical Example for Comparison Purposes
The second line of the accompanying table provides information about hypothetical account values and hypothetical expenses based on the actual expense ratio and an assumed rate of return of 5% per year before expenses, which is not the actual return. The hypothetical account values and expenses may not be used to estimate the actual ending account balance or expenses you paid for the period. You may use this information to compare the ongoing costs of investing in the Fund and other funds. To do so, compare this 5% hypothetical example with the 5% hypothetical examples that appear in the shareholder reports of the other funds. If any fund is a shareholder of any Underlying Funds, such fund indirectly bears its proportional share of the expenses of the Underlying Funds in addition to the direct expenses as presented in the table. These fees and expenses are not included in the annualized expense ratio used to calculate the expense estimate in the table below.
Please note that the expenses shown in the table are meant to highlight your ongoing costs only and do not reflect any transaction costs. Therefore, the second line of the table is useful in comparing ongoing costs only, and will not help you determine the relative total costs of owning different funds. In addition, if these transactional costs were included, your costs would have been higher.
| | | | | Annualized Expense Ratio- A | | Beginning Account Value November 1, 2023 | | Ending Account Value April 30, 2024 | | Expenses Paid During Period- C November 1, 2023 to April 30, 2024 |
| Fidelity Advisor® Diversified International Fund | | | | | | | | | | |
| Class A | | | | 1.14% | | | | | | |
| Actual | | | | | | $ 1,000 | | $ 1,183.20 | | $ 6.19 |
Hypothetical-B | | | | | | $ 1,000 | | $ 1,019.19 | | $ 5.72 |
| Class M | | | | 1.39% | | | | | | |
| Actual | | | | | | $ 1,000 | | $ 1,182.20 | | $ 7.54 |
Hypothetical-B | | | | | | $ 1,000 | | $ 1,017.95 | | $ 6.97 |
| Class C | | | | 1.89% | | | | | | |
| Actual | | | | | | $ 1,000 | | $ 1,178.80 | | $ 10.24 |
Hypothetical-B | | | | | | $ 1,000 | | $ 1,015.47 | | $ 9.47 |
| Class I | | | | .89% | | | | | | |
| Actual | | | | | | $ 1,000 | | $ 1,184.90 | | $ 4.83 |
Hypothetical-B | | | | | | $ 1,000 | | $ 1,020.44 | | $ 4.47 |
| Class Z | | | | .73% | | | | | | |
| Actual | | | | | | $ 1,000 | | $ 1,185.90 | | $ 3.97 |
Hypothetical-B | | | | | | $ 1,000 | | $ 1,021.23 | | $ 3.67 |
| |
A Annualized expense ratio reflects expenses net of applicable fee waivers.
B 5% return per year before expenses
C Expenses are equal to the annualized expense ratio, multiplied by the average account value over the period, multiplied by 182/ 366 (to reflect the one-half year period). The fees and expenses of any Underlying Funds are not included in each annualized expense ratio.
Board Approval of Investment Advisory Contracts
Fidelity Advisor Diversified International Fund
At its January 2024 meeting, the Board of Trustees, including the Independent Trustees (together, the Board), approved an amended and restated management contract with Fidelity Management & Research Company LLC (FMR) (the Management Contract), and amended and restated sub-advisory agreements (the Sub-Advisory Contracts, and together with the Management Contract, the Advisory Contracts) for the fund, including the fund's sub-advisory agreements with FMR Investment Management (UK) Limited (FMR UK), Fidelity Management & Research (Hong Kong) Limited (FMR H.K.), Fidelity Management & Research (Japan) Limited (FMR Japan), and FIL Investment Advisors (FIL). The Advisory Contracts will be effective March 1, 2024. The Board will consider the annual renewal of the fund's Advisory Contracts in May 2024, following its review of additional materials provided by FMR.
Management Contract. The Board approved the Management Contract, which implements a new fee structure combining the management fee, transfer agent fee (TA Fee), and pricing and bookkeeping fee (P&B Fee) of the fund and each class into a single class-level fee based on tiered schedules and subject to a maximum class-level rate (the Unified Fee). In exchange for the Unified Fee, the fund will receive investment advisory, management, administrative, transfer agent, pricing and bookkeeping services under a single agreement - the Management Contract.
In its consideration of the Management Contract over several meetings, the Board received, reviewed and discussed a comprehensive set of analyses regarding the Unified Fee including (i) the legal framework, (ii) design goals for the Unified Fee, (iii) calculation methodology for the Unified Fee and illustrative examples, (iv) annual and cumulative projected impacts under various scenarios, both in the aggregate and at the fund/class level, (v) explanations of schedules, rate levers and maximum rates and (vi) shareholder benefits and projected savings.
The Board considered that the maximum Unified Fee for each class of the fund would be no higher than the sum of (i) the lowest contractual management fee rate under the fund's existing management contract, which is the individual fund fee rate, if any, plus the lowest contractual marginal group fee rate and (ii) the TA and P&B Fee rates, which are fixed fee rates since December 1, 2023 (together, the Unified Fee Cap). The Board noted that Fidelity has represented that, as a result of this Unified Fee Cap, the Unified Fee would be no greater than the fee rates previously authorized to be charged to the fund for the same services. The Board noted that certain expenses such as third-party expenses, Rule 12b-1 fees, and certain other miscellaneous expenses would be outside the scope of the Unified Fee and the calculation of such fees would not change as a result of the Unified Fee. The Board considered that, under the Management Contract, a different management fee rate will be applicable to each class of the fund. The Board noted that Fidelity has represented that the difference in expenses between classes is based on differences in class-specific expenses and not due to any difference in advisory or third-party custodial fees or other expenses related to the management of the fund's assets.
The Board considered Fidelity's representations that implementation of the Unified Fee, which includes the Unified Fee Cap, would cause all funds subject to the Unified Fee, including the fund, to experience an immediate reduction on contractual fee rates for services provided under the current management contracts. The Board considered that some funds would not experience lower net total fees as a result of existing fee caps. The Board further considered that, in addition to the contractual fee savings, the Unified Fee offers funds and their shareholders greater protection from future rate increases for services previously offered under separate agreements that are now covered by the Management Contract because such rate increases would require shareholder approval.
Sub-Advisory Contracts. In connection with the Unified Fee changes, the Board considered the Sub-Advisory Contracts, which simplified the calculation of the fees paid by FMR to the sub-advisers under the agreements. The Board noted that the agreements with FMR UK, FMR H.K., and FMR Japan were amended to provide that FMR will compensate each sub-adviser at a fee rate equal to 110% of the sub-adviser's costs incurred in providing services under the agreement. The Board further noted that the agreement with FIL was amended to provide that FMR will compensate FIL at a flat fee rate of 0.44% of the net assets sub-advised by it. The Board considered that, under the Sub-Advisory Contracts, FMR, and not the fund, will continue to pay the sub-advisory fees to each applicable sub-adviser.
The Board further considered that the approval of the fund's Advisory Contracts will not result in any changes in the investment process or strategies employed in the management of the fund's assets or the day-to-day management of the fund or the persons primarily responsible for such management. Further, the Board considered that the Management Contract would not change the obligations and services of FMR and its affiliates on behalf of the fund, and, in particular, there would be no change in the nature and level of advisory, management, administration, transfer agent, and pricing and bookkeeping services provided to the fund by FMR, its affiliates, and each applicable sub-adviser.
In connection with its consideration of future renewals of the fund's Advisory Contracts, the Board will consider: (i) the nature, extent and quality of services provided to the funds, including shareholder and administrative services and investment performance; (ii) the competitiveness of the management fee and total expenses for the fund; (iii) the costs of the services and profitability, including the revenues earned and the expenses incurred in conducting the business of developing, marketing, distributing, managing, administering, and servicing the fund and its shareholders, to the extent applicable; and (iv) whether there have been economies of scale in respect of the Fidelity funds, whether the Fidelity funds (including the fund) have appropriately benefited from any such economies of scale, and whether there is the potential for realization of any further economies.
Based on its evaluation of all of the conclusions and representations noted above, and after considering all factors it believed relevant, the Board concluded that the fund's management fee structure is fair and reasonable, and that the fund's Advisory Contracts should be approved.
The Securities and Exchange Commission adopted Rule 22e-4 under the Investment Company Act of 1940 (the Liquidity Rule) to promote effective liquidity risk management throughout the open-end investment company industry, thereby reducing the risk that funds will be unable to meet their redemption obligations and mitigating dilution of the interests of fund shareholders.
The Fund has adopted and implemented a liquidity risk management program (the Program) reasonably designed to assess and manage the Fund's liquidity risk and to comply with the requirements of the Liquidity Rule. The Fund's Board of Trustees (the Board) has designated the Fund's investment adviser as administrator of the Program. The Fidelity advisers have established a Liquidity Risk Management Committee (the LRM Committee) to manage the Program for each of the Fidelity Funds. The LRM Committee monitors the adequacy and effectiveness of implementation of the Program and on a periodic basis assesses each Fund's liquidity risk based on a variety of factors including (1) the Fund's investment strategy, (2) portfolio liquidity and cash flow projections during normal and reasonably foreseeable stressed conditions, (3) shareholder redemptions, (4) borrowings and other funding sources and (5) certain factors specific to ETFs including the effect of the Fund's prices and spreads, market participants, and basket compositions on the overall liquidity of the Fund's portfolio, as applicable.
In accordance with the Program, each of the Fund's portfolio investments is classified into one of four defined liquidity categories based on a determination of a reasonable expectation for how long it would take to convert the investment to cash (or sell or dispose of the investment) without significantly changing its market value.
- Highly liquid investments - cash or convertible to cash within three business days or less
- Moderately liquid investments - convertible to cash in three to seven calendar days
- Less liquid investments - can be sold or disposed of, but not settled, within seven calendar days
- Illiquid investments - cannot be sold or disposed of within seven calendar days
Liquidity classification determinations take into account a variety of factors including various market, trading and investment-specific considerations, as well as market depth, and generally utilize analysis from a third-party liquidity metrics service.
The Liquidity Rule places a 15% limit on a fund's illiquid investments and requires funds that do not primarily hold assets that are highly liquid investments to determine and maintain a minimum percentage of the fund's net assets to be invested in highly liquid investments (highly liquid investment minimum or HLIM). The Program includes provisions reasonably designed to comply with the 15% limit on illiquid investments and for determining, periodically reviewing and complying with the HLIM requirement as applicable.
At a recent meeting of the Fund's Board of Trustees, the LRM Committee provided a written report to the Board pertaining to the operation, adequacy, and effectiveness of the Program for the period December 1, 2022 through November 30, 2023. The report concluded that the Program is operating effectively and is reasonably designed to assess and manage the Fund's liquidity risk.
1.720067.125
ADIF-SANN-0624
Item 2.
Code of Ethics
Not applicable.
Item 3.
Audit Committee Financial Expert
Not applicable.
Item 4.
Principal Accountant Fees and Services
Not applicable.
Item 5.
Audit Committee of Listed Registrants
Not applicable.
Item 6.
Investments
(a)
Not applicable.
(b)
Not applicable
Item 7.
Disclosure of Proxy Voting Policies and Procedures for Closed-End Management Investment Companies
Not applicable.
Item 8.
Portfolio Managers of Closed-End Management Investment Companies
Not applicable.
Item 9.
Purchase of Equity Securities by Closed-End Management Investment Company and Affiliated Purchasers
Not applicable.
Item 10.
Submission of Matters to a Vote of Security Holders
There were no material changes to the procedures by which shareholders may recommend nominees to the Fidelity Advisor Series VIII’s Board of Trustees.
Item 11.
Controls and Procedures
(a)(i) The President and Treasurer and the Chief Financial Officer have concluded that the Fidelity Advisor Series VIII’s (the “Trust”) disclosure controls and procedures (as defined in Rule 30a-3(c) under the Investment Company Act) provide reasonable
assurances that material information relating to the Trust is made known to them by the appropriate persons, based on their evaluation of these controls and procedures as of a date within 90 days of the filing date of this report.
(a)(ii) There was no change in the Trust’s internal control over financial reporting (as defined in Rule 30a-3(d) under the Investment Company Act) that occurred during the period covered by this report that has materially affected, or is reasonably likely to materially affect, the Trust’s internal control over financial reporting.
Item 12.
Disclosure of Securities Lending Activities for Closed-End Management
Investment Companies
Not applicable.
Item 18.
Recovery of Erroneously Awarded Compensation
(a)
Not applicable.
(b)
Not applicable.
Item 19.
Exhibits
SIGNATURES
Pursuant to the requirements of the Securities Exchange Act of 1934 and the Investment Company Act of 1940, the registrant has duly caused this report to be signed on its behalf by the undersigned, thereunto duly authorized.
Fidelity Advisor Series VIII
| |
By: | /s/Stacie M. Smith |
| Stacie M. Smith |
| President and Treasurer (Principal Executive Officer) |
|
|
Date: | June 21, 2024 |
Pursuant to the requirements of the Securities Exchange Act of 1934 and the Investment Company Act of 1940, this report has been signed below by the following persons on behalf of the registrant and in the capacities and on the dates indicated.
| |
By: | /s/Stacie M. Smith |
| Stacie M. Smith |
| President and Treasurer (Principal Executive Officer) |
|
|
Date: | June 21, 2024 |
| |
By: | /s/John J. Burke III |
| John J. Burke III |
| Chief Financial Officer (Principal Financial Officer) |
|
|
Date: | June 21, 2024 |