UNITED STATES
SECURITIES AND EXCHANGE COMMISSION
Washington, D.C. 20549
FORM N-CSR
CERTIFIED SHAREHOLDER REPORT OF REGISTERED
MANAGEMENT INVESTMENT COMPANIES
Investment Company Act file number 811-3855
Fidelity Advisor Series VIII
(Exact name of registrant as specified in charter)
245 Summer St., Boston, MA 02210
(Address of principal executive offices) (Zip code)
William C. Coffey, Secretary
245 Summer St.
Boston, Massachusetts 02210
(Name and address of agent for service)
Registrant's telephone number, including area code:
617-563-7000
| |
Date of fiscal year end: | October 31 |
|
|
Date of reporting period: | April 30, 2019 |
Item 1.
Reports to Stockholders
Fidelity Advisor® Overseas Fund
Semi-Annual Report April 30, 2019 |
 |
Beginning on January 1, 2021, as permitted by regulations adopted by the Securities and Exchange Commission, paper copies of a fund’s shareholder reports will no longer be sent by mail, unless you specifically request paper copies of the reports from the fund or from your financial intermediary, such as a financial advisor, broker-dealer or bank. Instead, the reports will be made available on a website, and you will be notified by mail each time a report is posted and provided with a website link to access the report.
If you already elected to receive shareholder reports electronically, you will not be affected by this change and you need not take any action. You may elect to receive shareholder reports and other communications from a fund electronically, by contacting your financial intermediary. For Fidelity customers, visit Fidelity's web site or call Fidelity using the contact information listed below.
You may elect to receive all future reports in paper free of charge. If you wish to continue receiving paper copies of your shareholder reports, you may contact your financial intermediary or, if you are a Fidelity customer, visit Fidelity’s website, or call Fidelity at the applicable toll-free number listed below. Your election to receive reports in paper will apply to all funds held with the fund complex/your financial intermediary.
| Account Type | Website | Phone Number |
| Brokerage, Mutual Fund, or Annuity Contracts: | fidelity.com/mailpreferences | 1-800-343-3548 |
| Employer Provided Retirement Accounts: | netbenefits.fidelity.com/preferences (choose 'no' under Required Disclosures to continue to print) | 1-800-343-0860 |
| Advisor Sold Accounts Serviced Through Your Financial Intermediary: | Contact Your Financial Intermediary | Your Financial Intermediary's phone number |
| Advisor Sold Accounts Serviced by Fidelity: | institutional.fidelity.com | 1-877-208-0098 |
Contents
To view a fund's proxy voting guidelines and proxy voting record for the 12-month period ended June 30, visit http://www.fidelity.com/proxyvotingresults or visit the Securities and Exchange Commission's (SEC) web site at http://www.sec.gov.
You may also call 1-877-208-0098 to request a free copy of the proxy voting guidelines.
Standard & Poor's, S&P and S&P 500 are registered service marks of The McGraw-Hill Companies, Inc. and have been licensed for use by Fidelity Distributors Corporation.
Other third-party marks appearing herein are the property of their respective owners.
All other marks appearing herein are registered or unregistered trademarks or service marks of FMR LLC or an affiliated company. © 2019 FMR LLC. All rights reserved.
This report and the financial statements contained herein are submitted for the general information of the shareholders of the Fund. This report is not authorized for distribution to prospective investors in the Fund unless preceded or accompanied by an effective prospectus.
A fund files its complete schedule of portfolio holdings with the SEC for the first and third quarters of each fiscal year on Form N-PORT. Forms N-PORT are available on the SEC’s web site at http://www.sec.gov. A fund's Forms N-PORT may be reviewed and copied at the SEC’s Public Reference Room in Washington, DC. Information regarding the operation of the SEC's Public Reference Room may be obtained by calling 1-800-SEC-0330.
For a complete list of a fund's portfolio holdings, view the most recent holdings listing, semiannual report, or annual report on Fidelity's web site at http://www.fidelity.com, http://www.institutional.fidelity.com, or http://www.401k.com, as applicable.
NOT FDIC INSURED •MAY LOSE VALUE •NO BANK GUARANTEE
Neither the Fund nor Fidelity Distributors Corporation is a bank.
Investment Summary (Unaudited)
Top Five Stocks as of April 30, 2019
| | % of fund's net assets |
| Roche Holding AG (participation certificate) (Switzerland, Pharmaceuticals) | 2.4 |
| Diageo PLC (United Kingdom, Beverages) | 1.8 |
| AIA Group Ltd. (Hong Kong, Insurance) | 1.7 |
| SAP SE (Germany, Software) | 1.7 |
| Total SA (France, Oil, Gas & Consumable Fuels) | 1.6 |
| | 9.2 |
Top Five Market Sectors as of April 30, 2019
| | % of fund's net assets |
| Financials | 21.6 |
| Industrials | 17.2 |
| Health Care | 14.6 |
| Information Technology | 13.5 |
| Consumer Staples | 11.6 |
Top Five Countries as of April 30, 2019
| (excluding cash equivalents) | % of fund's net assets |
| United Kingdom | 17.9 |
| Japan | 17.2 |
| France | 10.5 |
| Netherlands | 7.8 |
| Switzerland | 6.9 |
Asset Allocation (% of fund's net assets)
| As of April 30, 2019 |
| | Stocks | 97.6% |
| | Investment Companies | 1.1% |
| | Short-Term Investments and Net Other Assets (Liabilities) | 1.3% |

Percentages are adjusted for the effect of futures contracts and swaps, if applicable.
Schedule of Investments April 30, 2019 (Unaudited)
Showing Percentage of Net Assets
| Common Stocks - 97.2% | | | |
| | | Shares | Value (000s) |
| Australia - 0.3% | | | |
| Insurance Australia Group Ltd. | | 147,769 | $821 |
| Lovisa Holdings Ltd. (a) | | 48,720 | 346 |
| Pact Group Holdings Ltd. | | 75,176 | 139 |
| realestate.com.au Ltd. | | 10,685 | 602 |
|
| TOTAL AUSTRALIA | | | 1,908 |
|
| Austria - 0.6% | | | |
| Andritz AG | | 3,902 | 186 |
| Erste Group Bank AG | | 82,200 | 3,291 |
| Mayr-Melnhof Karton AG | | 3,700 | 479 |
|
| TOTAL AUSTRIA | | | 3,956 |
|
| Bailiwick of Jersey - 1.6% | | | |
| Experian PLC | | 190,100 | 5,534 |
| Glencore Xstrata PLC | | 159,500 | 633 |
| Sanne Group PLC | | 437,019 | 3,567 |
|
| TOTAL BAILIWICK OF JERSEY | | | 9,734 |
|
| Belgium - 1.2% | | | |
| KBC Groep NV | | 102,713 | 7,606 |
| Bermuda - 1.9% | | | |
| Credicorp Ltd. (United States) | | 11,200 | 2,653 |
| Hiscox Ltd. | | 175,900 | 3,840 |
| Hongkong Land Holdings Ltd. | | 53,900 | 376 |
| IHS Markit Ltd. (b) | | 80,901 | 4,632 |
| SmarTone Telecommunications Holdings Ltd. | | 431,000 | 449 |
|
| TOTAL BERMUDA | | | 11,950 |
|
| Canada - 0.9% | | | |
| Constellation Software, Inc. | | 6,400 | 5,647 |
| Cayman Islands - 0.4% | | | |
| SITC International Holdings Co. Ltd. | | 802,000 | 852 |
| Value Partners Group Ltd. | | 900,000 | 677 |
| ZTO Express (Cayman), Inc. sponsored ADR | | 39,400 | 785 |
|
| TOTAL CAYMAN ISLANDS | | | 2,314 |
|
| China - 0.3% | | | |
| Gree Electric Appliances, Inc. of Zhuhai (A Shares) | | 78,000 | 644 |
| Suofeiya Home Collection Co. Ltd. (A Shares) | | 104,054 | 344 |
| Yunnan Baiyao Group Co. Ltd. (A Shares) | | 46,563 | 612 |
|
| TOTAL CHINA | | | 1,600 |
|
| Denmark - 1.1% | | | |
| A.P. Moller - Maersk A/S Series A | | 377 | 459 |
| DSV de Sammensluttede Vognmaend A/S | | 41,600 | 3,844 |
| Netcompany Group A/S (c) | | 57,844 | 2,063 |
| Scandinavian Tobacco Group A/S (c) | | 47,936 | 571 |
|
| TOTAL DENMARK | | | 6,937 |
|
| Finland - 0.1% | | | |
| Nokian Tyres PLC | | 19,600 | 656 |
| France - 10.5% | | | |
| Altarea SCA | | 2,800 | 592 |
| ALTEN | | 30,510 | 3,330 |
| Amundi SA (c) | | 54,541 | 3,918 |
| Capgemini SA | | 55,300 | 6,705 |
| Compagnie de St. Gobain | | 17,300 | 709 |
| Danone SA | | 87,600 | 7,085 |
| Edenred SA | | 74,243 | 3,498 |
| Elior SA (c) | | 90,100 | 1,247 |
| Essilor International SA | | 24,500 | 2,985 |
| LVMH Moet Hennessy - Louis Vuitton SA | | 24,779 | 9,729 |
| Natixis SA | | 87,000 | 512 |
| Sanofi SA | | 96,541 | 8,423 |
| SR Teleperformance SA | | 28,100 | 5,399 |
| Total SA | | 182,311 | 10,135 |
|
| TOTAL FRANCE | | | 64,267 |
|
| Germany - 6.3% | | | |
| adidas AG | | 21,984 | 5,649 |
| Axel Springer Verlag AG | | 34,100 | 1,931 |
| Bayer AG | | 49,672 | 3,306 |
| Bertrandt AG | | 9,693 | 756 |
| Deutsche Borse AG | | 34,400 | 4,597 |
| Deutsche Post AG | | 122,826 | 4,269 |
| Fresenius SE & Co. KGaA | | 43,640 | 2,476 |
| Hannover Reuck SE | | 31,300 | 4,718 |
| Instone Real Estate Group BV (b)(c) | | 22,900 | 559 |
| JOST Werke AG (c) | | 7,300 | 269 |
| SAP SE | | 80,283 | 10,349 |
|
| TOTAL GERMANY | | | 38,879 |
|
| Hong Kong - 1.9% | | | |
| AIA Group Ltd. | | 1,038,700 | 10,636 |
| Dah Sing Banking Group Ltd. | | 244,800 | 468 |
| Dah Sing Financial Holdings Ltd. | | 100,000 | 525 |
|
| TOTAL HONG KONG | | | 11,629 |
|
| India - 1.5% | | | |
| Axis Bank Ltd. (b) | | 330,414 | 3,638 |
| HDFC Bank Ltd. sponsored ADR | | 31,700 | 3,634 |
| LIC Housing Finance Ltd. | | 250,600 | 1,787 |
|
| TOTAL INDIA | | | 9,059 |
|
| Indonesia - 0.6% | | | |
| PT Astra International Tbk | | 1,633,700 | 874 |
| PT Bank Rakyat Indonesia Tbk | | 8,205,700 | 2,516 |
|
| TOTAL INDONESIA | | | 3,390 |
|
| Ireland - 2.7% | | | |
| DCC PLC (United Kingdom) | | 56,809 | 5,073 |
| Kerry Group PLC Class A | | 47,490 | 5,316 |
| Kingspan Group PLC (Ireland) | | 59,144 | 3,110 |
| United Drug PLC (United Kingdom) | | 349,026 | 2,990 |
|
| TOTAL IRELAND | | | 16,489 |
|
| Italy - 1.3% | | | |
| Banca Generali SpA | | 13,150 | 371 |
| FinecoBank SpA | | 217,100 | 2,857 |
| Recordati SpA | | 125,475 | 5,065 |
|
| TOTAL ITALY | | | 8,293 |
|
| Japan - 17.2% | | | |
| AEON Financial Service Co. Ltd. | | 170,100 | 3,511 |
| Arata Corp. | | 13,800 | 492 |
| Credit Saison Co. Ltd. | | 38,000 | 483 |
| Daiichikosho Co. Ltd. | | 62,400 | 3,047 |
| Elecom Co. Ltd. | | 44,700 | 1,493 |
| GMO Internet, Inc. | | 46,600 | 719 |
| Hoya Corp. | | 106,400 | 7,465 |
| Iriso Electronics Co. Ltd. | | 53,100 | 2,746 |
| Kao Corp. | | 65,300 | 5,016 |
| Keyence Corp. | | 11,400 | 7,074 |
| KH Neochem Co. Ltd. | | 136,900 | 3,963 |
| Miroku Jyoho Service Co., Ltd. | | 81,740 | 2,193 |
| Nabtesco Corp. | | 27,330 | 832 |
| Nakanishi, Inc. (d) | | 78,100 | 1,495 |
| Nitori Holdings Co. Ltd. (d) | | 29,330 | 3,489 |
| NOF Corp. | | 95,000 | 3,373 |
| OBIC Co. Ltd. | | 36,120 | 4,170 |
| Olympus Corp. | | 354,320 | 3,957 |
| Oracle Corp. Japan | | 32,200 | 2,200 |
| ORIX Corp. | | 359,180 | 5,067 |
| Otsuka Corp. | | 93,100 | 3,652 |
| PALTAC Corp. | | 41,100 | 2,254 |
| Paramount Bed Holdings Co. Ltd. | | 12,200 | 572 |
| Persol Holdings Co., Ltd. | | 163,900 | 3,066 |
| Recruit Holdings Co. Ltd. | | 160,740 | 4,804 |
| Renesas Electronics Corp. (b) | | 80,900 | 431 |
| S Foods, Inc. | | 70,500 | 2,424 |
| Shiseido Co. Ltd. | | 64,800 | 5,071 |
| SMC Corp. | | 14,000 | 5,789 |
| Subaru Corp. | | 34,900 | 852 |
| Sundrug Co. Ltd. | | 6,980 | 186 |
| Suzuki Motor Corp. | | 64,600 | 2,937 |
| The Suruga Bank Ltd. (a) | | 54,700 | 241 |
| Tsuruha Holdings, Inc. | | 43,200 | 3,673 |
| USS Co. Ltd. | | 182,000 | 3,474 |
| Welcia Holdings Co. Ltd. | | 72,120 | 2,832 |
| Zozo, Inc. (e) | | 32,800 | 579 |
|
| TOTAL JAPAN | | | 105,622 |
|
| Kenya - 0.4% | | | |
| Safaricom Ltd. | | 7,828,400 | 2,179 |
| Korea (South) - 0.3% | | | |
| LG Chemical Ltd. | | 5,734 | 1,778 |
| Mexico - 0.3% | | | |
| Grupo Financiero Banorte S.A.B. de CV Series O | | 270,500 | 1,710 |
| Netherlands - 7.8% | | | |
| ASML Holding NV (Netherlands) | | 33,700 | 7,013 |
| ASR Nederland NV | | 7,700 | 342 |
| Grandvision NV (c) | | 113,500 | 2,554 |
| Heineken NV (Bearer) | | 68,830 | 7,430 |
| IMCD Group BV | | 84,590 | 6,831 |
| Intertrust NV (c) | | 36,624 | 695 |
| Koninklijke Philips Electronics NV | | 148,930 | 6,396 |
| QIAGEN NV (Germany) (b) | | 70,200 | 2,711 |
| Unilever NV (Certificaten Van Aandelen) (Bearer) | | 162,700 | 9,844 |
| Wolters Kluwer NV | | 55,200 | 3,850 |
|
| TOTAL NETHERLANDS | | | 47,666 |
|
| New Zealand - 0.4% | | | |
| EBOS Group Ltd. | | 193,728 | 2,772 |
| Norway - 2.0% | | | |
| Adevinta ASA: | | | |
| Class A (b) | | 125,100 | 1,262 |
| Class B | | 119,650 | 1,177 |
| Equinor ASA | | 276,240 | 6,162 |
| Schibsted ASA: | | | |
| (A Shares) | | 105,700 | 2,774 |
| (B Shares) | | 17,399 | 416 |
| Skandiabanken ASA (c) | | 52,456 | 516 |
|
| TOTAL NORWAY | | | 12,307 |
|
| Spain - 1.9% | | | |
| Amadeus IT Holding SA Class A | | 51,056 | 4,061 |
| CaixaBank SA | | 1,277,600 | 4,072 |
| Grifols SA ADR | | 23,020 | 441 |
| Prosegur Cash SA (c) | | 1,584,600 | 3,398 |
|
| TOTAL SPAIN | | | 11,972 |
|
| Sweden - 3.6% | | | |
| Addlife AB | | 96,684 | 2,594 |
| AddTech AB (B Shares) | | 67,074 | 1,631 |
| Essity AB Class B | | 18,680 | 554 |
| Hexagon AB (B Shares) | | 76,400 | 4,174 |
| HEXPOL AB (B Shares) | | 47,440 | 371 |
| Indutrade AB | | 156,220 | 4,776 |
| Securitas AB (B Shares) | | 31,000 | 542 |
| Svenska Handelsbanken AB (A Shares) | | 354,700 | 3,874 |
| Swedbank AB (A Shares) (a) | | 142,295 | 2,325 |
| Telefonaktiebolaget LM Ericsson (B Shares) | | 101,400 | 1,003 |
|
| TOTAL SWEDEN | | | 21,844 |
|
| Switzerland - 6.9% | | | |
| Alcon, Inc. (b) | | 80,600 | 4,691 |
| Julius Baer Group Ltd. | | 85,820 | 4,146 |
| Lonza Group AG | | 17,731 | 5,476 |
| Roche Holding AG (participation certificate) | | 55,556 | 14,654 |
| Sika AG | | 33,038 | 5,058 |
| Sonova Holding AG Class B | | 17,570 | 3,543 |
| UBS Group AG | | 378,334 | 5,074 |
|
| TOTAL SWITZERLAND | | | 42,642 |
|
| Taiwan - 0.6% | | | |
| Taiwan Semiconductor Manufacturing Co. Ltd. | | 433,300 | 3,638 |
| United Kingdom - 17.9% | | | |
| Admiral Group PLC | | 107,700 | 3,095 |
| Aggreko PLC | | 52,616 | 585 |
| Ascential PLC | | 525,074 | 2,442 |
| AstraZeneca PLC (United Kingdom) | | 12,600 | 939 |
| BCA Marketplace PLC | | 284,000 | 764 |
| Beazley PLC | | 446,500 | 3,354 |
| BP PLC | | 227,400 | 1,654 |
| British American Tobacco PLC (United Kingdom) | | 35,785 | 1,401 |
| Cineworld Group PLC | | 1,107,895 | 4,594 |
| Close Brothers Group PLC | | 17,118 | 346 |
| Compass Group PLC | | 284,378 | 6,471 |
| Cranswick PLC | | 80,498 | 3,042 |
| Dechra Pharmaceuticals PLC | | 64,320 | 2,231 |
| Diageo PLC | | 264,400 | 11,146 |
| Diploma PLC | | 188,980 | 3,943 |
| Hilton Food Group PLC | | 148,645 | 1,969 |
| InterContinental Hotel Group PLC | | 89,955 | 5,828 |
| Intertek Group PLC | | 66,990 | 4,673 |
| James Fisher and Sons PLC | | 78,577 | 2,019 |
| John Wood Group PLC | | 37,670 | 231 |
| JTC PLC (c) | | 242,000 | 1,253 |
| Keywords Studios PLC | | 25,900 | 526 |
| Lloyds Banking Group PLC | | 1,096,980 | 897 |
| London Stock Exchange Group PLC | | 71,730 | 4,703 |
| Micro Focus International PLC | | 26,287 | 664 |
| Mondi PLC | | 151,700 | 3,324 |
| Prudential PLC | | 368,611 | 8,375 |
| RELX PLC (London Stock Exchange) | | 184,400 | 4,230 |
| Rentokil Initial PLC | | 808,000 | 4,109 |
| Rightmove PLC | | 62,866 | 443 |
| Rolls-Royce Holdings PLC | | 326,377 | 3,909 |
| Rotork PLC | | 811,363 | 3,300 |
| Sabre Insurance Group PLC (c) | | 225,781 | 783 |
| Spectris PLC | | 79,910 | 2,863 |
| St. James's Place Capital PLC | | 48,560 | 710 |
| Standard Life PLC | | 193,661 | 704 |
| The Weir Group PLC | | 20,091 | 435 |
| Ultra Electronics Holdings PLC | | 114,709 | 2,381 |
| Unilever PLC | | 20,400 | 1,237 |
| Victrex PLC | | 77,570 | 2,460 |
| Volution Group PLC | | 818,300 | 1,846 |
|
| TOTAL UNITED KINGDOM | | | 109,879 |
|
| United States of America - 4.7% | | | |
| Alphabet, Inc. Class C (b) | | 2,383 | 2,832 |
| Becton, Dickinson & Co. | | 16,400 | 3,948 |
| Boston Scientific Corp. (b) | | 102,900 | 3,820 |
| Marsh & McLennan Companies, Inc. | | 50,600 | 4,771 |
| Moody's Corp. | | 15,230 | 2,995 |
| Roper Technologies, Inc. | | 9,900 | 3,561 |
| S&P Global, Inc. | | 17,603 | 3,884 |
| Total System Services, Inc. | | 31,500 | 3,221 |
|
| TOTAL UNITED STATES OF AMERICA | | | 29,032 |
|
| TOTAL COMMON STOCKS | | | |
| (Cost $502,652) | | | 597,355 |
|
| Nonconvertible Preferred Stocks - 0.4% | | | |
| Germany - 0.4% | | | |
| Henkel AG & Co. KGaA | | 26,970 | 2,730 |
| United Kingdom - 0.0% | | | |
| Rolls-Royce Holdings PLC (C Shares) (b) | | 23,172,767 | 30 |
| TOTAL NONCONVERTIBLE PREFERRED STOCKS | | | |
| (Cost $3,495) | | | 2,760 |
|
| Investment Companies - 1.1% | | | |
| United States of America - 1.1% | | | |
| iShares MSCI Japan ETF | | | |
| (Cost $6,282) | | 119,400 | 6,617 |
|
| Money Market Funds - 1.9% | | | |
| Fidelity Cash Central Fund, 2.49% (f) | | 11,505,246 | 11,508 |
| Fidelity Securities Lending Cash Central Fund 2.49% (f)(g) | | 390,233 | 390 |
| TOTAL MONEY MARKET FUNDS | | | |
| (Cost $11,897) | | | 11,898 |
| TOTAL INVESTMENT IN SECURITIES - 100.6% | | | |
| (Cost $524,326) | | | 618,630 |
| NET OTHER ASSETS (LIABILITIES) - (0.6)% | | | (3,715) |
| NET ASSETS - 100% | | | $614,915 |
Security Type Abbreviations
ETF – Exchange-Traded Fund
Categorizations in the Schedule of Investments are based on country or territory of incorporation.
Legend
(a) Security or a portion of the security is on loan at period end.
(b) Non-income producing
(c) Security exempt from registration under Rule 144A of the Securities Act of 1933. These securities may be resold in transactions exempt from registration, normally to qualified institutional buyers. At the end of the period, the value of these securities amounted to $17,826,000 or 2.9% of net assets.
(d) A portion of the security sold on a delayed delivery basis.
(e) Security or a portion of the security purchased on a delayed delivery or when-issued basis.
(f) Affiliated fund that is generally available only to investment companies and other accounts managed by Fidelity Investments. The rate quoted is the annualized seven-day yield of the fund at period end. A complete unaudited listing of the fund's holdings as of its most recent quarter end is available upon request. In addition, each Fidelity Central Fund's financial statements are available on the SEC's website or upon request.
(g) Investment made with cash collateral received from securities on loan.
Affiliated Central Funds
Information regarding fiscal year to date income earned by the Fund from investments in Fidelity Central Funds is as follows:
| Fund | Income earned |
| | (Amounts in thousands) |
| Fidelity Cash Central Fund | $178 |
| Fidelity Securities Lending Cash Central Fund | 47 |
| Total | $225 |
Amounts in the income column in the above table include any capital gain distributions from underlying funds, which are presented in the corresponding line-item in the Statement of Operations, if applicable.
Investment Valuation
The following is a summary of the inputs used, as of April 30, 2019, involving the Fund's assets and liabilities carried at fair value. The inputs or methodology used for valuing securities may not be an indication of the risk associated with investing in those securities. For more information on valuation inputs, and their aggregation into the levels used below, please refer to the Investment Valuation section in the accompanying Notes to Financial Statements.
| | Valuation Inputs at Reporting Date: |
| Description | Total | Level 1 | Level 2 | Level 3 |
| (Amounts in thousands) | | | | |
| Investments in Securities: | | | | |
| Equities: | | | | |
| Communication Services | $21,709 | $21,709 | $-- | $-- |
| Consumer Discretionary | 53,222 | 34,037 | 19,185 | -- |
| Consumer Staples | 71,527 | 40,260 | 31,267 | -- |
| Energy | 18,182 | 6,393 | 11,789 | -- |
| Financials | 133,261 | 89,636 | 43,625 | -- |
| Health Care | 90,577 | 49,323 | 41,254 | -- |
| Industrials | 106,158 | 84,788 | 21,370 | -- |
| Information Technology | 82,374 | 63,210 | 19,164 | -- |
| Materials | 21,578 | 20,574 | 1,004 | -- |
| Real Estate | 1,527 | 1,527 | -- | -- |
| Investment Companies | 6,617 | 6,617 | -- | -- |
| Money Market Funds | 11,898 | 11,898 | -- | -- |
| Total Investments in Securities: | $618,630 | $429,972 | $188,658 | $-- |
See accompanying notes which are an integral part of the financial statements.
Financial Statements
Statement of Assets and Liabilities
| Amounts in thousands (except per-share amounts) | | April 30, 2019 (Unaudited) |
| Assets | | |
Investment in securities, at value (including securities loaned of $370) — See accompanying schedule:
Unaffiliated issuers (cost $512,429) | $606,732 | |
| Fidelity Central Funds (cost $11,897) | 11,898 | |
| Total Investment in Securities (cost $524,326) | | $618,630 |
| Cash | | 35 |
| Receivable for investments sold | | |
| Regular delivery | | 1,082 |
| Delayed delivery | | 434 |
| Receivable for fund shares sold | | 114 |
| Dividends receivable | | 3,040 |
| Distributions receivable from Fidelity Central Funds | | 27 |
| Other receivables | | 244 |
| Total assets | | 623,606 |
| Liabilities | | |
| Payable for investments purchased | | |
| Regular delivery | $1,479 | |
| Delayed delivery | 657 | |
| Payable for fund shares redeemed | 5,436 | |
| Accrued management fee | 333 | |
| Distribution and service plan fees payable | 109 | |
| Other affiliated payables | 116 | |
| Other payables and accrued expenses | 171 | |
| Collateral on securities loaned | 390 | |
| Total liabilities | | 8,691 |
| Net Assets | | $614,915 |
| Net Assets consist of: | | |
| Paid in capital | | $536,962 |
| Total distributable earnings (loss) | | 77,953 |
| Net Assets | | $614,915 |
| Net Asset Value and Maximum Offering Price | | |
| Class A: | | |
| Net Asset Value and redemption price per share ($50,314 ÷ 2,153 shares) | | $23.37 |
| Maximum offering price per share (100/94.25 of $23.37) | | $24.80 |
| Class M: | | |
| Net Asset Value and redemption price per share ($225,551 ÷ 9,381 shares) | | $24.04 |
| Maximum offering price per share (100/96.50 of $24.04) | | $24.91 |
| Class C: | | |
| Net Asset Value and offering price per share ($6,601 ÷ 291 shares)(a) | | $22.68 |
| Class I: | | |
| Net Asset Value, offering price and redemption price per share ($313,322 ÷ 13,145 shares) | | $23.84 |
| Class Z: | | |
| Net Asset Value, offering price and redemption price per share ($19,127 ÷ 803 shares) | | $23.82 |
(a) Redemption price per share is equal to net asset value less any applicable contingent deferred sales charge.
See accompanying notes which are an integral part of the financial statements.
Statement of Operations
| Amounts in thousands | | Six months ended April 30, 2019 (Unaudited) |
| Investment Income | | |
| Dividends | | $6,696 |
| Non-Cash dividends | | 1,553 |
| Interest | | 3 |
| Income from Fidelity Central Funds | | 225 |
| Income before foreign taxes withheld | | 8,477 |
| Less foreign taxes withheld | | (605) |
| Total income | | 7,872 |
| Expenses | | |
| Management fee | | |
| Basic fee | $1,981 | |
| Performance adjustment | (275) | |
| Transfer agent fees | 540 | |
| Distribution and service plan fees | 645 | |
| Accounting and security lending fees | 150 | |
| Custodian fees and expenses | 61 | |
| Independent trustees' fees and expenses | 2 | |
| Registration fees | 58 | |
| Audit | 52 | |
| Legal | 2 | |
| Miscellaneous | 2 | |
| Total expenses before reductions | 3,218 | |
| Expense reductions | (98) | |
| Total expenses after reductions | | 3,120 |
| Net investment income (loss) | | 4,752 |
| Realized and Unrealized Gain (Loss) | | |
| Net realized gain (loss) on: | | |
| Investment securities: | | |
| Unaffiliated issuers | (18,509) | |
| Fidelity Central Funds | (1) | |
| Foreign currency transactions | (84) | |
| Futures contracts | (1,003) | |
| Total net realized gain (loss) | | (19,597) |
| Change in net unrealized appreciation (depreciation) on: | | |
| Investment securities: | | |
| Unaffiliated issuers (net of increase in deferred foreign taxes of $110) | 63,024 | |
| Fidelity Central Funds | 1 | |
| Assets and liabilities in foreign currencies | (2) | |
| Total change in net unrealized appreciation (depreciation) | | 63,023 |
| Net gain (loss) | | 43,426 |
| Net increase (decrease) in net assets resulting from operations | | $48,178 |
See accompanying notes which are an integral part of the financial statements.
Statement of Changes in Net Assets
| Amounts in thousands | Six months ended April 30, 2019 (Unaudited) | Year ended October 31, 2018 |
| Increase (Decrease) in Net Assets | | |
| Operations | | |
| Net investment income (loss) | $4,752 | $7,747 |
| Net realized gain (loss) | (19,597) | 21,240 |
| Change in net unrealized appreciation (depreciation) | 63,023 | (78,971) |
| Net increase (decrease) in net assets resulting from operations | 48,178 | (49,984) |
| Distributions to shareholders | (26,504) | (23,429) |
| Share transactions - net increase (decrease) | (33,754) | 35,007 |
| Total increase (decrease) in net assets | (12,080) | (38,406) |
| Net Assets | | |
| Beginning of period | 626,995 | 665,401 |
| End of period | $614,915 | $626,995 |
See accompanying notes which are an integral part of the financial statements.
Financial Highlights
Fidelity Advisor Overseas Fund Class A
| | Six months ended (Unaudited) April 30, | Years endedOctober 31, | | | | |
| | 2019 | 2018 | 2017 | 2016 | 2015 | 2014 |
| Selected Per–Share Data | | | | | | |
| Net asset value, beginning of period | $22.48 | $25.20 | $20.40 | $21.59 | $21.09 | $21.61 |
| Income from Investment Operations | | | | | | |
| Net investment income (loss)A | .17 | .28 | .23 | .20 | .19 | .24 |
| Net realized and unrealized gain (loss) | 1.66 | (2.10) | 4.78 | (1.31) | .33 | (.50) |
| Total from investment operations | 1.83 | (1.82) | 5.01 | (1.11) | .52 | (.26) |
| Distributions from net investment income | (.21) | (.22) | (.20) | (.08) | (.02) | (.18) |
| Distributions from net realized gain | (.73) | (.69) | (.02) | – | – | (.08) |
| Total distributions | (.94) | (.90)B | (.21)C | (.08) | (.02) | (.26) |
| Redemption fees added to paid in capitalA | – | – | –D | –D | –D | –D |
| Net asset value, end of period | $23.37 | $22.48 | $25.20 | $20.40 | $21.59 | $21.09 |
| Total ReturnE,F,G | 8.68% | (7.48)% | 24.86% | (5.16)% | 2.46% | (1.24)% |
| Ratios to Average Net AssetsH,I | | | | | | |
| Expenses before reductions | 1.16%J | 1.21% | 1.25% | 1.36% | 1.35% | 1.30% |
| Expenses net of fee waivers, if any | 1.16%J | 1.21% | 1.25% | 1.35% | 1.35% | 1.30% |
| Expenses net of all reductions | 1.12%J | 1.20% | 1.23% | 1.35% | 1.34% | 1.30% |
| Net investment income (loss) | 1.51%J | 1.13% | 1.05% | .96% | .89% | 1.10% |
| Supplemental Data | | | | | | |
| Net assets, end of period (in millions) | $50 | $44 | $69 | $58 | $78 | $65 |
| Portfolio turnover rateK | 56%J | 39% | 42% | 94% | 29% | 39% |
A Calculated based on average shares outstanding during the period.
B Total distributions of $.90 per share is comprised of distributions from net investment income of $.219 and distributions from net realized gain of $.685 per share.
C Total distributions of $.21 per share is comprised of distributions from net investment income of $.198 and distributions from net realized gain of $.015 per share.
D Amount represents less than $.005 per share.
E Total returns for periods of less than one year are not annualized.
F Total returns would have been lower if certain expenses had not been reduced during the applicable periods shown.
G Total returns do not include the effect of the sales charges.
H Fees and expenses of any underlying Fidelity Central Funds are not included in the Fund's expense ratio. The Fund indirectly bears its proportionate share of the expenses of any underlying Fidelity Central Funds.
I Expense ratios reflect operating expenses of the class. Expenses before reductions do not reflect amounts reimbursed by the investment adviser or reductions from brokerage service arrangements or reductions from other expense offset arrangements and do not represent the amount paid by the class during periods when reimbursements or reductions occur. Expenses net of fee waivers reflect expenses after reimbursement by the investment adviser but prior to reductions from brokerage service arrangements or other expense offset arrangements. Expenses net of all reductions represent the net expenses paid by the class.
J Annualized
K Amount does not include the portfolio activity of any underlying Fidelity Central Funds.
See accompanying notes which are an integral part of the financial statements.
Fidelity Advisor Overseas Fund Class M
| | Six months ended (Unaudited) April 30, | Years endedOctober 31, | | | | |
| | 2019 | 2018 | 2017 | 2016 | 2015 | 2014 |
| Selected Per–Share Data | | | | | | |
| Net asset value, beginning of period | $23.06 | $25.84 | $20.91 | $22.11 | $21.62 | $22.16 |
| Income from Investment Operations | | | | | | |
| Net investment income (loss)A | .15 | .23 | .19 | .16 | .15 | .21 |
| Net realized and unrealized gain (loss) | 1.71 | (2.15) | 4.90 | (1.34) | .34 | (.52) |
| Total from investment operations | 1.86 | (1.92) | 5.09 | (1.18) | .49 | (.31) |
| Distributions from net investment income | (.15) | (.17) | (.15) | (.02) | – | (.15) |
| Distributions from net realized gain | (.73) | (.69) | (.02) | – | – | (.08) |
| Total distributions | (.88) | (.86) | (.16)B | (.02) | – | (.23) |
| Redemption fees added to paid in capitalA | – | – | –C | –C | –C | –C |
| Net asset value, end of period | $24.04 | $23.06 | $25.84 | $20.91 | $22.11 | $21.62 |
| Total ReturnD,E,F | 8.59% | (7.71)% | 24.57% | (5.34)% | 2.27% | (1.42)% |
| Ratios to Average Net AssetsG,H | | | | | | |
| Expenses before reductions | 1.37%I | 1.44% | 1.46% | 1.56% | 1.55% | 1.48% |
| Expenses net of fee waivers, if any | 1.37%I | 1.43% | 1.46% | 1.56% | 1.55% | 1.48% |
| Expenses net of all reductions | 1.34%I | 1.43% | 1.44% | 1.56% | 1.55% | 1.48% |
| Net investment income (loss) | 1.30%I | .90% | .84% | .76% | .69% | .92% |
| Supplemental Data | | | | | | |
| Net assets, end of period (in millions) | $226 | $218 | $272 | $237 | $285 | $293 |
| Portfolio turnover rateJ | 56%I | 39% | 42% | 94% | 29% | 39% |
A Calculated based on average shares outstanding during the period.
B Total distributions of $.16 per share is comprised of distributions from net investment income of $.148 and distributions from net realized gain of $.015 per share.
C Amount represents less than $.005 per share.
D Total returns for periods of less than one year are not annualized.
E Total returns would have been lower if certain expenses had not been reduced during the applicable periods shown.
F Total returns do not include the effect of the sales charges.
G Fees and expenses of any underlying Fidelity Central Funds are not included in the Fund's expense ratio. The Fund indirectly bears its proportionate share of the expenses of any underlying Fidelity Central Funds.
H Expense ratios reflect operating expenses of the class. Expenses before reductions do not reflect amounts reimbursed by the investment adviser or reductions from brokerage service arrangements or reductions from other expense offset arrangements and do not represent the amount paid by the class during periods when reimbursements or reductions occur. Expenses net of fee waivers reflect expenses after reimbursement by the investment adviser but prior to reductions from brokerage service arrangements or other expense offset arrangements. Expenses net of all reductions represent the net expenses paid by the class.
I Annualized
J Amount does not include the portfolio activity of any underlying Fidelity Central Funds.
See accompanying notes which are an integral part of the financial statements.
Fidelity Advisor Overseas Fund Class C
| | Six months ended (Unaudited) April 30, | Years endedOctober 31, | | | | |
| | 2019 | 2018 | 2017 | 2016 | 2015 | 2014 |
| Selected Per–Share Data | | | | | | |
| Net asset value, beginning of period | $21.72 | $24.41 | $19.74 | $20.98 | $20.63 | $21.21 |
| Income from Investment Operations | | | | | | |
| Net investment income (loss)A | .07 | .07 | .05 | .03 | .02 | .07 |
| Net realized and unrealized gain (loss) | 1.62 | (2.02) | 4.64 | (1.27) | .33 | (.50) |
| Total from investment operations | 1.69 | (1.95) | 4.69 | (1.24) | .35 | (.43) |
| Distributions from net investment income | – | (.06) | (.01) | – | – | (.07) |
| Distributions from net realized gain | (.73) | (.69) | (.02) | – | – | (.08) |
| Total distributions | (.73) | (.74)B | (.02)C | – | – | (.15) |
| Redemption fees added to paid in capitalA | – | – | –D | –D | –D | –D |
| Net asset value, end of period | $22.68 | $21.72 | $24.41 | $19.74 | $20.98 | $20.63 |
| Total ReturnE,F,G | 8.22% | (8.23)% | 23.81% | (5.91)% | 1.70% | (2.06)% |
| Ratios to Average Net AssetsH,I | | | | | | |
| Expenses before reductions | 1.99%J | 2.03% | 2.06% | 2.16% | 2.15% | 2.08% |
| Expenses net of fee waivers, if any | 1.99%J | 2.03% | 2.05% | 2.16% | 2.15% | 2.08% |
| Expenses net of all reductions | 1.96%J | 2.02% | 2.04% | 2.16% | 2.14% | 2.08% |
| Net investment income (loss) | .68%J | .31% | .24% | .16% | .09% | .32% |
| Supplemental Data | | | | | | |
| Net assets, end of period (in millions) | $7 | $13 | $17 | $16 | $19 | $19 |
| Portfolio turnover rateK | 56%J | 39% | 42% | 94% | 29% | 39% |
A Calculated based on average shares outstanding during the period.
B Total distributions of $.74 per share is comprised of distributions from net investment income of $.058 and distributions from net realized gain of $.685 per share.
C Total distributions of $.02 per share is comprised of distributions from net investment income of $.009 and distributions from net realized gain of $.015 per share.
D Amount represents less than $.005 per share.
E Total returns for periods of less than one year are not annualized.
F Total returns would have been lower if certain expenses had not been reduced during the applicable periods shown.
G Total returns do not include the effect of the contingent deferred sales charge.
H Fees and expenses of any underlying Fidelity Central Funds are not included in the Fund's expense ratio. The Fund indirectly bears its proportionate share of the expenses of any underlying Fidelity Central Funds.
I Expense ratios reflect operating expenses of the class. Expenses before reductions do not reflect amounts reimbursed by the investment adviser or reductions from brokerage service arrangements or reductions from other expense offset arrangements and do not represent the amount paid by the class during periods when reimbursements or reductions occur. Expenses net of fee waivers reflect expenses after reimbursement by the investment adviser but prior to reductions from brokerage service arrangements or other expense offset arrangements. Expenses net of all reductions represent the net expenses paid by the class.
J Annualized
K Amount does not include the portfolio activity of any underlying Fidelity Central Funds.
See accompanying notes which are an integral part of the financial statements.
Fidelity Advisor Overseas Fund Class I
| | Six months ended (Unaudited) April 30, | Years endedOctober 31, | | | | |
| | 2019 | 2018 | 2017 | 2016 | 2015 | 2014 |
| Selected Per–Share Data | | | | | | |
| Net asset value, beginning of period | $22.99 | $25.74 | $20.86 | $22.06 | $21.55 | $22.07 |
| Income from Investment Operations | | | | | | |
| Net investment income (loss)A | .20 | .36 | .31 | .27 | .27 | .32 |
| Net realized and unrealized gain (loss) | 1.70 | (2.15) | 4.87 | (1.33) | .34 | (.52) |
| Total from investment operations | 1.90 | (1.79) | 5.18 | (1.06) | .61 | (.20) |
| Distributions from net investment income | (.32) | (.28) | (.29) | (.14) | (.10) | (.24) |
| Distributions from net realized gain | (.73) | (.69) | (.02) | – | – | (.08) |
| Total distributions | (1.05) | (.96)B | (.30)C | (.14) | (.10) | (.32) |
| Redemption fees added to paid in capitalA | – | – | –D | –D | –D | –D |
| Net asset value, end of period | $23.84 | $22.99 | $25.74 | $20.86 | $22.06 | $21.55 |
| Total ReturnE,F | 8.87% | (7.23)% | 25.24% | (4.85)% | 2.82% | (.95)% |
| Ratios to Average Net AssetsG,H | | | | | | |
| Expenses before reductions | .86%I | .92% | .95% | 1.04% | 1.03% | .96% |
| Expenses net of fee waivers, if any | .86%I | .92% | .94% | 1.04% | 1.03% | .96% |
| Expenses net of all reductions | .82%I | .91% | .92% | 1.03% | 1.02% | .96% |
| Net investment income (loss) | 1.81%I | 1.42% | 1.35% | 1.28% | 1.21% | 1.44% |
| Supplemental Data | | | | | | |
| Net assets, end of period (in millions) | $313 | $305 | $306 | $311 | $298 | $330 |
| Portfolio turnover rateJ | 56%I | 39% | 42% | 94% | 29% | 39% |
A Calculated based on average shares outstanding during the period.
B Total distributions of $.96 per share is comprised of distributions from net investment income of $.276 and distributions from net realized gain of $.685 per share.
C Total distributions of $.30 per share is comprised of distributions from net investment income of $.287 and distributions from net realized gain of $.015 per share.
D Amount represents less than $.005 per share.
E Total returns for periods of less than one year are not annualized.
F Total returns would have been lower if certain expenses had not been reduced during the applicable periods shown.
G Fees and expenses of any underlying Fidelity Central Funds are not included in the Fund's expense ratio. The Fund indirectly bears its proportionate share of the expenses of any underlying Fidelity Central Funds.
H Expense ratios reflect operating expenses of the class. Expenses before reductions do not reflect amounts reimbursed by the investment adviser or reductions from brokerage service arrangements or reductions from other expense offset arrangements and do not represent the amount paid by the class during periods when reimbursements or reductions occur. Expenses net of fee waivers reflect expenses after reimbursement by the investment adviser but prior to reductions from brokerage service arrangements or other expense offset arrangements. Expenses net of all reductions represent the net expenses paid by the class.
I Annualized
J Amount does not include the portfolio activity of any underlying Fidelity Central Funds.
See accompanying notes which are an integral part of the financial statements.
Fidelity Advisor Overseas Fund Class Z
| | Six months ended (Unaudited) April 30, | Years endedOctober 31, | |
| | 2019 | 2018 | 2017 A |
| Selected Per–Share Data | | | |
| Net asset value, beginning of period | $23.00 | $25.76 | $20.88 |
| Income from Investment Operations | | | |
| Net investment income (loss)B | .22 | .38 | .19 |
| Net realized and unrealized gain (loss) | 1.69 | (2.14) | 4.69 |
| Total from investment operations | 1.91 | (1.76) | 4.88 |
| Distributions from net investment income | (.36) | (.31) | – |
| Distributions from net realized gain | (.73) | (.69) | – |
| Total distributions | (1.09) | (1.00) | – |
| Net asset value, end of period | $23.82 | $23.00 | $25.76 |
| Total ReturnC,D | 8.95% | (7.13)% | 23.37% |
| Ratios to Average Net AssetsE,F | | | |
| Expenses before reductions | .73%G | .79% | .82%G |
| Expenses net of fee waivers, if any | .73%G | .79% | .82%G |
| Expenses net of all reductions | .69%G | .78% | .80%G |
| Net investment income (loss) | 1.94%G | 1.55% | 1.02%G |
| Supplemental Data | | | |
| Net assets, end of period (in millions) | $19 | $47 | $2 |
| Portfolio turnover rateH | 56%G | 39% | 42% |
A For the period February 1, 2017 (commencement of sale of shares) to October 31, 2017.
B Calculated based on average shares outstanding during the period.
C Total returns for periods of less than one year are not annualized.
D Total returns would have been lower if certain expenses had not been reduced during the applicable periods shown.
E Fees and expenses of any underlying Fidelity Central Funds are not included in the Fund's expense ratio. The Fund indirectly bears its proportionate share of the expenses of any underlying Fidelity Central Funds.
F Expense ratios reflect operating expenses of the class. Expenses before reductions do not reflect amounts reimbursed by the investment adviser or reductions from brokerage service arrangements or reductions from other expense offset arrangements and do not represent the amount paid by the class during periods when reimbursements or reductions occur. Expense ratios before reductions for start-up periods may not be representative of longer-term operating periods. Expenses net of fee waivers reflect expenses after reimbursement by the investment adviser but prior to reductions from brokerage service arrangements or other expense offset arrangements. Expenses net of all reductions represent the net expenses paid by the class.
G Annualized
H Amount does not include the portfolio activity of any underlying Fidelity Central Funds.
See accompanying notes which are an integral part of the financial statements.
Notes to Financial Statements (Unaudited)
For the period ended April 30, 2019
(Amounts in thousands except percentages)
1. Organization.
Fidelity Advisor Overseas Fund (the Fund) is a fund of Fidelity Advisor Series VIII (the Trust) and is authorized to issue an unlimited number of shares. The Trust is registered under the Investment Company Act of 1940, as amended (the 1940 Act), as an open-end management investment company organized as a Massachusetts business trust. The Fund offers Class A, Class M, Class C, Class I and Class Z shares, each of which has equal rights as to assets and voting privileges. Each class has exclusive voting rights with respect to matters that affect that class. Effective March 1, 2019, Class C shares will automatically convert to Class A shares after a holding period of ten years from the initial date of purchase, with certain exceptions.
2. Investments in Fidelity Central Funds.
The Fund invests in Fidelity Central Funds, which are open-end investment companies generally available only to other investment companies and accounts managed by the investment adviser and its affiliates. The Fund's Schedule of Investments lists each of the Fidelity Central Funds held as of period end, if any, as an investment of the Fund, but does not include the underlying holdings of each Fidelity Central Fund. As an Investing Fund, the Fund indirectly bears its proportionate share of the expenses of the underlying Fidelity Central Funds.
The Money Market Central Funds seek preservation of capital and current income and are managed by Fidelity Investments Money Management, Inc. (FIMM), an affiliate of the investment adviser. Annualized expenses of the Money Market Central Funds as of their most recent shareholder report date are less than .005%.
A complete unaudited list of holdings for each Fidelity Central Fund is available upon request or at the Securities and Exchange Commission (the SEC) website at www.sec.gov. In addition, the financial statements of the Fidelity Central Funds are available on the SEC website or upon request.
3. Significant Accounting Policies.
The Fund is an investment company and applies the accounting and reporting guidance of the Financial Accounting Standards Board (FASB) Accounting Standards Codification Topic 946 Financial Services – Investments Companies. The financial statements have been prepared in conformity with accounting principles generally accepted in the United States of America (GAAP), which require management to make certain estimates and assumptions at the date of the financial statements. Actual results could differ from those estimates. Subsequent events, if any, through the date that the financial statements were issued have been evaluated in the preparation of the financial statements. The following summarizes the significant accounting policies of the Fund:
Investment Valuation. Investments are valued as of 4:00 p.m. Eastern time on the last calendar day of the period. The Board of Trustees (the Board) has delegated the day to day responsibility for the valuation of the Fund's investments to the Fair Value Committee (the Committee) established by the Fund's investment adviser. In accordance with valuation policies and procedures approved by the Board, the Fund attempts to obtain prices from one or more third party pricing vendors or brokers to value its investments. When current market prices, quotations or currency exchange rates are not readily available or reliable, investments will be fair valued in good faith by the Committee, in accordance with procedures adopted by the Board. Factors used in determining fair value vary by investment type and may include market or investment specific events. The frequency with which these procedures are used cannot be predicted and they may be utilized to a significant extent. The Committee oversees the Fund's valuation policies and procedures and reports to the Board on the Committee's activities and fair value determinations. The Board monitors the appropriateness of the procedures used in valuing the Fund's investments and ratifies the fair value determinations of the Committee.
The Fund categorizes the inputs to valuation techniques used to value its investments into a disclosure hierarchy consisting of three levels as shown below:
- Level 1 – quoted prices in active markets for identical investments
- Level 2 – other significant observable inputs (including quoted prices for similar investments, interest rates, prepayment speeds, etc.)
- Level 3 – unobservable inputs (including the Fund's own assumptions based on the best information available)
Valuation techniques used to value the Fund's investments by major category are as follows:
Equity securities, including restricted securities, for which market quotations are readily available, are valued at the last reported sale price or official closing price as reported by a third party pricing vendor on the primary market or exchange on which they are traded and are categorized as Level 1 in the hierarchy. In the event there were no sales during the day or closing prices are not available, securities are valued at the last quoted bid price or may be valued using the last available price and are generally categorized as Level 2 in the hierarchy. For foreign equity securities, when market or security specific events arise, comparisons to the valuation of American Depositary Receipts (ADRs), futures contracts, Exchange-Traded Funds (ETFs) and certain indexes as well as quoted prices for similar securities may be used and would be categorized as Level 2 in the hierarchy. For equity securities, including restricted securities, where observable inputs are limited, assumptions about market activity and risk are used and these securities may be categorized as Level 3 in the hierarchy.
ETFs are valued at their last sale price or official closing price as reported by a third party pricing vendor on the primary market or exchange on which they are traded and are categorized as Level 1 in the hierarchy. In the event there were no sales during the day but the exchange reports a closing bid level, ETFs are valued at the closing bid and would be categorized as Level 1 in the hierarchy. In the event there was no closing bid, ETFs may be valued by another method that the Board believes reflects fair value in accordance with the Board's fair value pricing policies and may be categorized as Level 2 in the hierarchy.
Investments in open-end mutual funds, including the Fidelity Central Funds, are valued at their closing net asset value (NAV) each business day and are categorized as Level 1 in the hierarchy.
Changes in valuation techniques may result in transfers in or out of an assigned level within the disclosure hierarchy. The aggregate value of investments by input level as of April 30, 2019 is included at the end of the Fund's Schedule of Investments.
Foreign Currency. The Fund may use foreign currency contracts to facilitate transactions in foreign-denominated securities. Gains and losses from these transactions may arise from changes in the value of the foreign currency or if the counterparties do not perform under the contracts' terms.
Foreign-denominated assets, including investment securities, and liabilities are translated into U.S. dollars at the exchange rates at period end. Purchases and sales of investment securities, income and dividends received and expenses denominated in foreign currencies are translated into U.S. dollars at the exchange rate in effect on the transaction date.
The effects of exchange rate fluctuations on investments are included with the net realized and unrealized gain (loss) on investment securities. Other foreign currency transactions resulting in realized and unrealized gain (loss) are disclosed separately.
Investment Transactions and Income. For financial reporting purposes, the Fund's investment holdings and NAV include trades executed through the end of the last business day of the period. The NAV per share for processing shareholder transactions is calculated as of the close of business of the New York Stock Exchange (NYSE), normally 4:00 p.m. Eastern time and includes trades executed through the end of the prior business day. Gains and losses on securities sold are determined on the basis of identified cost and include proceeds received from litigation. Dividend income is recorded on the ex-dividend date, except for certain dividends from foreign securities where the ex-dividend date may have passed, which are recorded as soon as the Fund is informed of the ex-dividend date. Non-cash dividends included in dividend income, if any, are recorded at the fair market value of the securities received. Income and capital gain distributions from Fidelity Central Funds, if any, are recorded on the ex-dividend date. Interest income is accrued as earned and includes coupon interest and amortization of premium and accretion of discount on debt securities as applicable. Investment income is recorded net of foreign taxes withheld where recovery of such taxes is uncertain.
Class Allocations and Expenses. Investment income, realized and unrealized capital gains and losses, common expenses of the Fund, and certain fund-level expense reductions, if any, are allocated daily on a pro-rata basis to each class based on the relative net assets of each class to the total net assets of the Fund. Each class differs with respect to transfer agent and distribution and service plan fees incurred. Certain expense reductions may also differ by class. For the reporting period, the allocated portion of income and expenses to each class as a percent of its average net assets may vary due to the timing of recording these transactions in relation to fluctuating net assets of the classes. Expenses directly attributable to a fund are charged to that fund. Expenses attributable to more than one fund are allocated among the respective funds on the basis of relative net assets or other appropriate methods. Expense estimates are accrued in the period to which they relate and adjustments are made when actual amounts are known.
Income Tax Information and Distributions to Shareholders. Each year, the Fund intends to qualify as a regulated investment company under Subchapter M of the Internal Revenue Code, including distributing substantially all of its taxable income and realized gains. As a result, no provision for U.S. Federal income taxes is required. The Fund files a U.S. federal tax return, in addition to state and local tax returns as required. The Fund's federal income tax returns are subject to examination by the Internal Revenue Service (IRS) for a period of three fiscal years after they are filed. State and local tax returns may be subject to examination for an additional fiscal year depending on the jurisdiction. Foreign taxes are provided for based on the Fund's understanding of the tax rules and rates that exist in the foreign markets in which it invests. The Fund is subject to a tax imposed on capital gains by certain countries in which it invests. An estimated deferred tax liability for net unrealized appreciation on the applicable securities is included in Other payables and accrued expenses on the Statement of Assets & Liabilities.
Distributions are declared and recorded on the ex-dividend date. Income and capital gain distributions are declared separately for each class. Income and capital gain distributions are determined in accordance with income tax regulations, which may differ from GAAP.
Capital accounts within the financial statements are adjusted for permanent book-tax differences. These adjustments have no impact on net assets or the results of operations. Capital accounts are not adjusted for temporary book-tax differences which will reverse in a subsequent period.
Book-tax differences are primarily due to foreign currency transactions, passive foreign investment companies (PFIC), deferred trustees compensation and losses deferred due to wash sales.
As of period end, the cost and unrealized appreciation (depreciation) in securities, and derivatives if applicable, for federal income tax purposes were as follows:
| Gross unrealized appreciation | $110,726 |
| Gross unrealized depreciation | (19,982) |
| Net unrealized appreciation (depreciation) | $90,744 |
| Tax cost | $527,886 |
Delayed Delivery Transactions and When-Issued Securities. During the period, the Fund transacted in securities on a delayed delivery or when-issued basis. Payment and delivery may take place after the customary settlement period for that security. The price of the underlying securities and the date when the securities will be delivered and paid for are fixed at the time the transaction is negotiated. The securities purchased on a delayed delivery or when-issued basis are identified as such in the Fund's Schedule of Investments. Losses may arise due to changes in the value of the underlying securities or if the counterparty does not perform under the contract's terms, or if the issuer does not issue the securities due to political, economic, or other factors.
Restricted Securities. The Fund may invest in securities that are subject to legal or contractual restrictions on resale. These securities generally may be resold in transactions exempt from registration or to the public if the securities are registered. Disposal of these securities may involve time-consuming negotiations and expense, and prompt sale at an acceptable price may be difficult. Information regarding restricted securities is included at the end of the Fund's Schedule of Investments.
4. Derivative Instruments.
Risk Exposures and the Use of Derivative Instruments. The Fund's investment objective allows the Fund to enter into various types of derivative contracts, including futures contracts. Derivatives are investments whose value is primarily derived from underlying assets, indices or reference rates and may be transacted on an exchange or over-the-counter (OTC). Derivatives may involve a future commitment to buy or sell a specified asset based on specified terms, to exchange future cash flows at periodic intervals based on a notional principal amount, or for one party to make one or more payments upon the occurrence of specified events in exchange for periodic payments from the other party.
The Fund used derivatives to increase returns and to manage exposure to certain risks as defined below. The success of any strategy involving derivatives depends on analysis of numerous economic factors, and if the strategies for investment do not work as intended, the Fund may not achieve its objectives.
The Fund's use of derivatives increased or decreased its exposure to the following risk:
| Equity Risk | Equity risk relates to the fluctuations in the value of financial instruments as a result of changes in market prices (other than those arising from interest rate risk or foreign exchange risk), whether caused by factors specific to an individual investment, its issuer, or all factors affecting all instruments traded in a market or market segment.
|
The Fund is also exposed to additional risks from investing in derivatives, such as liquidity risk and counterparty credit risk. Liquidity risk is the risk that the Fund will be unable to close out the derivative in the open market in a timely manner. Counterparty credit risk is the risk that the counterparty will not be able to fulfill its obligation to the Fund. Counterparty credit risk related to exchange-traded futures contracts may be mitigated by the protection provided by the exchange on which they trade.
Investing in derivatives may involve greater risks than investing in the underlying assets directly and, to varying degrees, may involve risk of loss in excess of any initial investment and collateral received and amounts recognized in the Statement of Assets and Liabilities. In addition, there may be the risk that the change in value of the derivative contract does not correspond to the change in value of the underlying instrument.
Futures Contracts. A futures contract is an agreement between two parties to buy or sell a specified underlying instrument for a fixed price at a specified future date. The Fund used futures contracts to manage its exposure to the stock market.
Upon entering into a futures contract, a fund is required to deposit either cash or securities (initial margin) with a clearing broker in an amount equal to a certain percentage of the face value of the contract. Futures contracts are marked-to-market daily and subsequent daily payments (variation margin) are made or received by a fund depending on the daily fluctuations in the value of the futures contracts and are recorded as unrealized appreciation or (depreciation). This receivable and/or payable, if any, is included in daily variation margin on futures contracts in the Statement of Assets and Liabilities. Realized gain or (loss) is recorded upon the expiration or closing of a futures contract. The net realized gain (loss) and change in net unrealized appreciation (depreciation) on futures contracts during the period is presented in the Statement of Operations.
Any open futures contracts at period end are presented in the Schedule of Investments under the caption "Futures Contracts". The notional amount at value reflects each contract's exposure to the underlying instrument or index at period end.
5. Purchases and Sales of Investments.
Purchases and sales of securities, other than short-term securities, aggregated $164,399 and $205,368, respectively.
6. Fees and Other Transactions with Affiliates.
Management Fee. Fidelity Management & Research Company (the investment adviser) and its affiliates provide the Fund with investment management related services for which the Fund pays a monthly management fee. The management fee is the sum of an individual fund fee rate that is based on an annual rate of .424% of the Fund's average net assets and an annualized group fee rate that averaged .24% during the period. The group fee rate is based upon the average net assets of all the mutual funds advised by the investment adviser, including any mutual funds previously advised by the investment adviser that are currently advised by Fidelity SelectCo, LLC, an affiliate of the investment adviser. The group fee rate decreases as assets under management increase and increases as assets under management decrease. In addition, the management fee is subject to a performance adjustment (up to a maximum of +/- .20% of the Fund's average net assets over a 36 month performance period). The upward or downward adjustment to the management fee is based on the investment performance of the asset-weighted return of all classes as compared to its benchmark index, the MSCI EAFE Index, over the same 36 month performance period. For the reporting period, the total annualized management fee rate, including the performance adjustment, was .57% of the Fund's average net assets. The performance adjustment included in the management fee rate may be higher or lower than the maximum performance adjustment rate due to the difference between the average net assets for the reporting and performance periods.
Distribution and Service Plan Fees. In accordance with Rule 12b-1 of the 1940 Act, the Fund has adopted separate Distribution and Service Plans for each class of shares. Certain classes pay Fidelity Distributors Corporation (FDC), an affiliate of the investment adviser, separate Distribution and Service Fees, each of which is based on an annual percentage of each class' average net assets. In addition, FDC may pay financial intermediaries for selling shares of the Fund and providing shareholder support services. For the period, the Distribution and Service Fee rates, total fees and amounts retained by FDC were as follows:
| | Distribution Fee | Service Fee | Total Fees | Retained by FDC |
| Class A | -% | .25% | $55 | $2 |
| Class M | .25% | .25% | 537 | 25 |
| Class C | .75% | .25% | 53 | 4 |
| | | | $645 | $31 |
Sales Load. FDC may receive a front-end sales charge of up to 5.75% for selling Class A shares and 3.50% for selling Class M shares, some of which is paid to financial intermediaries for selling shares of the Fund. Depending on the holding period, FDC may receive contingent deferred sales charges levied on Class A, Class M and Class C redemptions. The deferred sales charges are 1.00% for Class C shares, 1.00% for certain purchases of Class A shares and .25% for certain purchases of Class M shares.
For the period, sales charge amounts retained by FDC were as follows:
| | Retained by FDC |
| Class A | $2 |
| Class M | 12 |
| Class C(a) | –(b) |
| | $14 |
(a) When Class C shares are initially sold, FDC pays commissions from its own resources to financial intermediaries through which the sales are made.
(b) In the amount of less than five hundred dollars.
Transfer Agent Fees. Fidelity Investments Institutional Operations Company, Inc., (FIIOC), an affiliate of the investment adviser, is the transfer, dividend disbursing and shareholder servicing agent for each class of the Fund. FIIOC receives account fees and asset-based fees that vary according to the account size and type of account of the shareholders of the respective classes of the Fund, except for Class Z. FIIOC receives an asset-based fee of Class Z's average net assets. FIIOC pays for typesetting, printing and mailing of shareholder reports, except proxy statements.
For the period, transfer agent fees for each class were as follows:
| | Amount | % of Class-Level Average Net Assets(a) |
| Class A | $50 | .23 |
| Class M | 203 | .19 |
| Class C | 16 | .31 |
| Class I | 265 | .18 |
| Class Z | 6 | .05 |
| | $540 | |
(a) Annualized
Accounting and Security Lending Fees. Fidelity Service Company, Inc. (FSC), an affiliate of the investment adviser, maintains the Fund's accounting records. The accounting fee is based on the level of average net assets for each month. Prior to April 1, 2019, FSC had a separate agreement with the Fund for administration of the security lending program, based on the number and duration of lending transactions. For the period, the total fees paid for accounting and administration of securities lending were equivalent to an annualized rate of .05%.
Brokerage Commissions. The Fund placed a portion of its portfolio transactions with brokerage firms which are affiliates of the investment adviser. Brokerage commissions are included in net realized gain (loss) and change in net unrealized appreciation (depreciation) in the Statement of Operations. The commissions paid to these affiliated firms were in the amount of less than five hundred dollars for the period.
Interfund Trades. The Fund may purchase from or sell securities to other Fidelity Funds under procedures adopted by the Board. The procedures have been designed to ensure these interfund trades are executed in accordance with Rule 17a-7 of the 1940 Act. Interfund trades are included within the respective purchases and sales amounts shown in the Purchases and Sales of Investments note.
7. Committed Line of Credit.
The Fund participates with other funds managed by the investment adviser or an affiliate in a $4.25 billion credit facility (the "line of credit") to be utilized for temporary or emergency purposes to fund shareholder redemptions or for other short-term liquidity purposes. The Fund has agreed to pay commitment fees on its pro-rata portion of the line of credit, which amounted to $1 and is reflected in Miscellaneous expenses on the Statement of Operations. During the period, the Fund did not borrow on this line of credit.
8. Security Lending.
The Fund lends portfolio securities through a lending agent from time to time in order to earn additional income. For equity securities, a lending agent is used and may loan securities to certain qualified borrowers, including Fidelity Capital Markets (FCM), a broker-dealer affiliated with the Fund. On the settlement date of the loan, the Fund receives collateral (in the form of U.S. Treasury obligations, letters of credit and/or cash) against the loaned securities and maintains collateral in an amount not less than 100% of the market value of the loaned securities during the period of the loan. The market value of the loaned securities is determined at the close of business of the Fund and any additional required collateral is delivered to the Fund on the next business day. The Fund or borrower may terminate the loan at any time, and if the borrower defaults on its obligation to return the securities loaned because of insolvency or other reasons, the Fund may apply collateral received from the borrower against the obligation. The Fund may experience delays and costs in recovering the securities loaned. Any cash collateral received is invested in the Fidelity Securities Lending Cash Central Fund. The value of loaned securities and cash collateral at period end are disclosed on the Fund's Statement of Assets and Liabilities. Security lending income represents the income earned on investing cash collateral, less rebates paid to borrowers and any lending agent fees associated with the loan, plus any premium payments received for lending certain types of securities. Security lending income is presented in the Statement of Operations as a component of income from Fidelity Central Funds. Total security lending income during the period amounted to $47. During the period, there were no securities loaned to FCM.
9. Expense Reductions.
Commissions paid to certain brokers with whom the investment adviser, or its affiliates, places trades on behalf of the Fund include an amount in addition to trade execution, which may be rebated back to the Fund to offset certain expenses. This amount totaled $96 for the period.
In addition, during the period the investment adviser reimbursed and/or waived a portion of fund-level operating expenses in the amount of $2.
10. Distributions to Shareholders.
Distributions to shareholders of each class were as follows:
| | Six months ended
April 30, 2019 | Year ended
October 31, 2018 |
| Distributions to shareholders | | |
| Class A | $1,792 | $2,452 |
| Class M | 8,320 | 8,968 |
| Class C | 405 | 506 |
| Class I | 13,825 | 11,363 |
| Class Z | 2,162 | 140 |
| Total | $26,504 | $23,429 |
11. Share Transactions.
Share transactions for each class were as follows and may contain automatic conversions between classes or exchanges between affiliated funds:
| | Shares | Shares | Dollars | Dollars |
| | Six months ended April 30, 2019 | Year ended October 31, 2018 | Six months ended April 30, 2019 | Year ended October 31, 2018 |
| Class A | | | | |
| Shares sold | 303 | 268 | $6,729 | $6,680 |
| Reinvestment of distributions | 82 | 97 | 1,682 | 2,369 |
| Shares redeemed | (173) | (1,166) | (3,811) | (28,586) |
| Net increase (decrease) | 212 | (801) | $4,600 | $(19,537) |
| Class M | | | | |
| Shares sold | 680 | 1,484 | $15,293 | $37,742 |
| Reinvestment of distributions | 387 | 354 | 8,221 | 8,851 |
| Shares redeemed | (1,143) | (2,899) | (25,641) | (73,413) |
| Net increase (decrease) | (76) | (1,061) | $(2,127) | $(26,820) |
| Class C | | | | |
| Shares sold | 14 | 85 | $291 | $2,077 |
| Reinvestment of distributions | 20 | 20 | 400 | 477 |
| Shares redeemed | (339) | (189) | (7,316) | (4,547) |
| Net increase (decrease) | (305) | (84) | $(6,625) | $(1,993) |
| Class I | | | | |
| Shares sold | 988 | 3,512 | $21,295 | $87,065 |
| Reinvestment of distributions | 498 | 332 | 10,458 | 8,235 |
| Shares redeemed | (1,625) | (2,465) | (36,309) | (61,772) |
| Net increase (decrease) | (139) | 1,379 | $(4,556) | $33,528 |
| Class Z | | | | |
| Shares sold | 323 | 3,080 | $7,167 | $77,109 |
| Reinvestment of distributions | 51 | 5 | 1,076 | 118 |
| Shares redeemed | (1,611) | (1,104) | (33,289) | (27,398) |
| Net increase (decrease) | (1,237) | 1,981 | $(25,046) | $49,829 |
12. Other.
The Fund's organizational documents provide former and current trustees and officers with a limited indemnification against liabilities arising in connection with the performance of their duties to the Fund. In the normal course of business, the Fund may also enter into contracts that provide general indemnifications. The Fund's maximum exposure under these arrangements is unknown as this would be dependent on future claims that may be made against the Fund. The risk of material loss from such claims is considered remote.
At the end of the period, Strategic Advisers Fidelity International Fund was the owner of record of approximately 12% of the total outstanding shares of the Fund.
Shareholder Expense Example
As a shareholder of the Fund, you incur two types of costs: (1) transaction costs, including sales charges (loads) on purchase payments or redemption proceeds, and (2) ongoing costs, including management fees, distribution and/or service (12b-1) fees and other Fund expenses. This Example is intended to help you understand your ongoing costs (in dollars) of investing in the Fund and to compare these costs with the ongoing costs of investing in other mutual funds.
The Example is based on an investment of $1,000 invested at the beginning of the period and held for the entire period (November 1, 2018 to April 30, 2019).
Actual Expenses
The first line of the accompanying table for each class of the Fund provides information about actual account values and actual expenses. You may use the information in this line, together with the amount you invested, to estimate the expenses that you paid over the period. Simply divide your account value by $1,000.00 (for example, an $8,600 account value divided by $1,000.00 = 8.6), then multiply the result by the number in the first line for a class of the Fund under the heading entitled "Expenses Paid During Period" to estimate the expenses you paid on your account during this period. In addition, the Fund, as a shareholder in the underlying Fidelity Central Funds, will indirectly bear its pro-rata share of the fees and expenses incurred by the underlying Fidelity Central Funds. These fees and expenses are not included in the Fund's annualized expense ratio used to calculate the expense estimate in the table below.
Hypothetical Example for Comparison Purposes
The second line of the accompanying table for each class of the Fund provides information about hypothetical account values and hypothetical expenses based on a Class' actual expense ratio and an assumed rate of return of 5% per year before expenses, which is not the Class' actual return. The hypothetical account values and expenses may not be used to estimate the actual ending account balance or expenses you paid for the period. You may use this information to compare the ongoing costs of investing in the Fund and other funds. To do so, compare this 5% hypothetical example with the 5% hypothetical examples that appear in the shareholder reports of the other funds. In addition, the Fund, as a shareholder in the underlying Fidelity Central Funds, will indirectly bear its pro-rata share of the fees and expenses incurred by the underlying Fidelity Central Funds. These fees and expenses are not included in the Fund's annualized expense ratio used to calculate the expense estimate in the table below.
Please note that the expenses shown in the table are meant to highlight your ongoing costs only and do not reflect any transaction costs. Therefore, the second line of the table is useful in comparing ongoing costs only, and will not help you determine the relative total costs of owning different funds. In addition, if these transactional costs were included, your costs would have been higher.
| | Annualized Expense Ratio-A | Beginning
Account Value
November 1, 2018 | Ending
Account Value
April 30, 2019 | Expenses Paid
During Period-B
November 1, 2018
to April 30, 2019 |
| Class A | 1.16% | | | |
| Actual | | $1,000.00 | $1,086.80 | $6.00 |
| Hypothetical-C | | $1,000.00 | $1,019.04 | $5.81 |
| Class M | 1.37% | | | |
| Actual | | $1,000.00 | $1,085.90 | $7.09 |
| Hypothetical-C | | $1,000.00 | $1,018.00 | $6.85 |
| Class C | 1.99% | | | |
| Actual | | $1,000.00 | $1,082.20 | $10.27 |
| Hypothetical-C | | $1,000.00 | $1,014.93 | $9.94 |
| Class I | .86% | | | |
| Actual | | $1,000.00 | $1,088.70 | $4.45 |
| Hypothetical-C | | $1,000.00 | $1,020.53 | $4.31 |
| Class Z | .73% | | | |
| Actual | | $1,000.00 | $1,089.50 | $3.78 |
| Hypothetical-C | | $1,000.00 | $1,021.17 | $3.66 |
A Annualized expense ratio reflects expenses net of applicable fee waivers.
B Expenses are equal to each Class' annualized expense ratio, multiplied by the average account value over the period, multiplied by 181/365 (to reflect the one-half year period).
C 5% return per year before expenses
Board Approval of Investment Advisory Contracts [and Management Fees]
Fidelity Advisor Overseas Fund
Each year, the Board of Trustees, including the Independent Trustees (together, the Board), votes on the renewal of the management contract with Fidelity Management & Research Company (FMR) and the sub-advisory agreements (together, the Advisory Contracts) for the fund. FMR and the sub-advisers are referred to herein as the Investment Advisers. The Board, assisted by the advice of fund counsel and Independent Trustees' counsel, requests and considers a broad range of information relevant to the renewal of the Advisory Contracts throughout the year.
The Board meets regularly and, at each of its meetings, covers an extensive agenda of topics and materials and considers factors that are relevant to its annual consideration of the renewal of the fund's Advisory Contracts, including the services and support provided to the fund and its shareholders. The Board has established various standing committees (Committees), each composed of and chaired by Independent Trustees with varying backgrounds, to which the Board has assigned specific subject matter responsibilities in order to enhance effective decision-making by the Board. The Board, acting directly and through its Committees, requests and receives information concerning the annual consideration of the renewal of the fund's Advisory Contracts. The Board also meets as needed to review matters specifically related to the Board's annual consideration of the renewal of the Advisory Contracts. Members of the Board may also meet with trustees of other Fidelity funds through joint ad hoc committees to discuss certain matters relevant to all of the Fidelity funds.
At its January 2019 meeting, the Board unanimously determined to renew the fund's Advisory Contracts. In reaching its determination, the Board considered all factors it believed relevant, including (i) the nature, extent, and quality of the services to be provided to the fund and its shareholders (including the investment performance of the fund); (ii) the competitiveness of the fund's management fee and total expense ratio relative to peer funds; (iii) the total costs of the services to be provided by and the profits to be realized by Fidelity from its relationships with the fund; and (iv) the extent to which, if any, economies of scale exist and would be realized as the fund grows, and whether any economies of scale are appropriately shared with fund shareholders.
In considering whether to renew the Advisory Contracts for the fund, the Board reached a determination, with the assistance of fund counsel and Independent Trustees' counsel and through the exercise of its business judgment, that the renewal of the Advisory Contracts was in the best interests of the fund and its shareholders and that the compensation payable under the Advisory Contracts was fair and reasonable. The Board's decision to renew the Advisory Contracts was not based on any single factor, but rather was based on a comprehensive consideration of all the information provided to the Board at its meetings throughout the year. The Board, in reaching its determination to renew the Advisory Contracts, was aware that shareholders of the fund have a broad range of investment choices available to them, including a wide choice among funds offered by Fidelity's competitors, and that the fund's shareholders, who have the opportunity to review and weigh the disclosure provided by the fund in its prospectus and other public disclosures, have chosen to invest in this fund, which is part of the Fidelity family of funds.
Nature, Extent, and Quality of Services Provided. The Board considered Fidelity's staffing as it relates to the fund, including the backgrounds of investment personnel of Fidelity, and also considered the fund's investment objective, strategies, and related investment philosophy. The Independent Trustees also had discussions with senior management of Fidelity's investment operations and investment groups. The Board considered the structure of the investment personnel compensation program and whether this structure provides appropriate incentives to act in the best interests of the fund. Additionally, the Board considered the portfolio managers' investments, if any, in the funds that they manage.
Resources Dedicated to Investment Management and Support Services. The Board and the Fund Oversight and Research Committees reviewed the general qualifications and capabilities of Fidelity's investment staff, including its size, education, experience, and resources, as well as Fidelity's approach to recruiting, training, managing, and compensating investment personnel. The Board noted that Fidelity has continued to increase the resources devoted to non-U.S. offices, including expansion of Fidelity's global investment organization. The Board also noted that Fidelity's analysts have extensive resources, tools and capabilities that allow them to conduct sophisticated quantitative and fundamental analysis, as well as credit analysis of issuers, counterparties and guarantors. Further, the Board considered that Fidelity's investment professionals have sufficient access to global information and data so as to provide competitive investment results over time, and that those professionals also have access to sophisticated tools that permit them to assess portfolio construction and risk and performance attribution characteristics continuously, as well as to transmit new information and research conclusions rapidly around the world. Additionally, in its deliberations, the Board considered Fidelity's trading, risk management, compliance, and technology and operations capabilities and resources, which are integral parts of the investment management process.
Shareholder and Administrative Services. The Board considered (i) the nature, extent, quality, and cost of advisory, administrative, and shareholder services performed by the Investment Advisers and their affiliates under the Advisory Contracts and under separate agreements covering transfer agency, pricing and bookkeeping, and securities lending services for the fund; (ii) the nature and extent of the supervision of third party service providers, principally custodians, subcustodians, and pricing vendors; and (iii) the resources devoted to, and the record of compliance with, the fund's compliance policies and procedures. The Board also reviewed the allocation of fund brokerage, including allocations to brokers affiliated with the Investment Advisers, the use of brokerage commissions to pay fund expenses, and the use of "soft" commission dollars to pay for research services.
The Board noted that the growth of fund assets over time across the complex allows Fidelity to reinvest in the development of services designed to enhance the value and convenience of the Fidelity funds as investment vehicles. These services include 24-hour access to account information and market information through telephone representatives and over the Internet, investor education materials and asset allocation tools, and the expanded availability of Fidelity Investor Centers.
The Board noted that it and the boards of certain other Fidelity funds had formed an ad hoc Committee on Transfer Agency Fees to review the variety of transfer agency fee structures throughout the industry and Fidelity's competitive positioning with respect to industry participants.
Investment in a Large Fund Family. The Board considered the benefits to shareholders of investing in a Fidelity fund, including the benefits of investing in a fund that is part of a large family of funds offering a variety of investment disciplines and providing a large variety of mutual fund investor services. The Board noted that Fidelity had taken, or had made recommendations that resulted in the Fidelity funds taking, a number of actions over the previous year that benefited particular funds, including: (i) continuing to dedicate additional resources to Fidelity's investment research process, which includes meetings with management of issuers of securities in which the funds invest, and to the support of the senior management team that oversees asset management; (ii) continuing efforts to enhance Fidelity's global research capabilities; (iii) launching new funds and making other enhancements to meet client needs; (iv) launching new share classes of existing funds; (v) eliminating purchase minimums and broadening eligibility requirements for certain funds and share classes; (vi) reducing management fees and total expenses for certain growth equity funds and index funds; (vii) lowering expense caps for certain existing funds and classes, and converting certain voluntary expense caps to contractual caps, to reduce expenses borne by shareholders; (viii) eliminating short-term redemption fees for funds that had such fees; (ix) rationalizing product lines and gaining increased efficiencies from fund mergers and share class consolidations; (x) continuing to develop, acquire and implement systems and technology to improve services to the funds and shareholders, strengthen information security, and increase efficiency; and (xi) continuing to implement enhancements to further strengthen Fidelity's product line to increase investors' probability of success in achieving their investment goals, including retirement income goals.
Investment Performance. The Board considered whether the fund has operated in accordance with its investment objective, as well as its record of compliance with its investment restrictions and its performance history. The Board noted that there was a portfolio management change for the fund in December 2016. The Board will continue to monitor closely the fund's performance, taking into account the portfolio manager change.
The Board took into account discussions that occur at Board meetings throughout the year with representatives of the Investment Advisers about fund investment performance. In this regard the Board noted that as part of regularly scheduled fund reviews and other reports to the Board on fund performance, the Board considers annualized return information for the fund for different time periods, measured against an appropriate securities market index ("benchmark index") and a peer group of funds with similar objectives ("peer group"), if any. In its evaluation of fund investment performance, the Board gave particular attention to information indicating changes in performance of certain Fidelity funds for specific time periods and discussed with the Investment Advisers the reasons for any overperformance or underperformance.
In addition to reviewing absolute and relative fund performance, the Independent Trustees periodically consider the appropriateness of fund performance metrics in evaluating the results achieved. In general, the Independent Trustees believe that fund performance should be evaluated based on net performance (after fees and expenses) of both the highest performing and lowest performing fund share classes, where applicable, compared to appropriate benchmark indices, over appropriate time periods that may include full market cycles, and compared to peer groups, as applicable, over the same periods, taking into account relevant factors including the following: general market conditions; issuer-specific information; and fund cash flows and other factors.
The Independent Trustees recognize that shareholders evaluate performance on a net basis over their own holding periods, for which one-, three-, and five-year periods are often used as a proxy. For this reason, the performance information reviewed by the Board also included net cumulative total return information for the fund and an appropriate benchmark index and peer group for the most recent one-, three-, and five-year periods ended June 30, 2018, as shown below. Returns are shown compared to the 25th percentile (top of box, 75% beaten) and 75th percentile (bottom of box, 25% beaten) of the peer universe. Returns of the benchmark index are "net MA,"
i.e., adjusted for tax withholding rates applicable to U.S.-based funds organized as Massachusetts business trusts.
Fidelity Advisor Overseas Fund
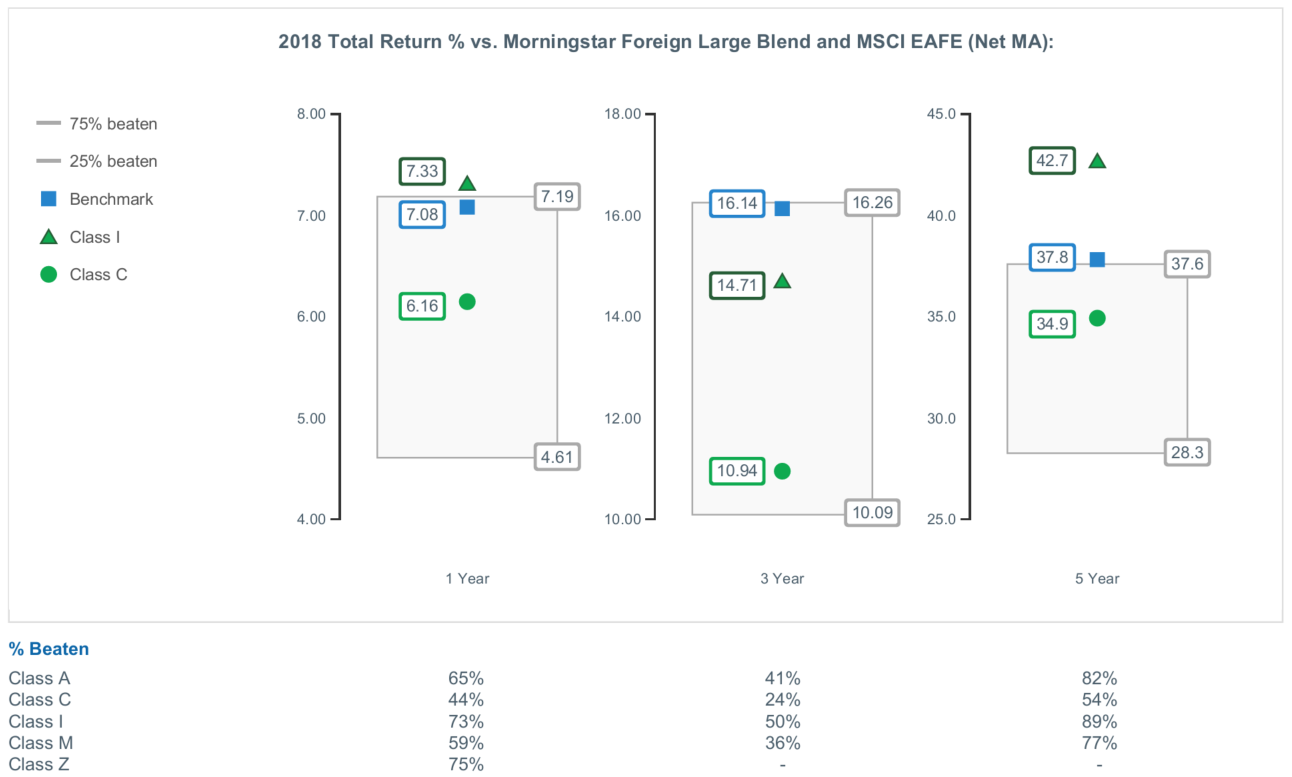
The Board also considered that the fund's management fee is subject to upward or downward adjustment depending upon whether, and to what extent, the fund's investment performance for the performance period (a rolling 36-month period) exceeds, or is exceeded by, a securities index, thus leading to a performance adjustment for the same period. The Board noted that the performance adjustment provides FMR with a strong economic incentive to seek to achieve superior long-term performance for the fund's shareholders and helps to more closely align the interests of FMR and the shareholders of the fund.
Based on its review, the Board concluded that the nature, extent, and quality of services provided to the fund under the Advisory Contracts should continue to benefit the shareholders of the fund.
Competitiveness of Management Fee and Total Expense Ratio. The Board considered the fund's management fee and total expense ratio compared to "mapped groups" of competitive funds and classes created for the purpose of facilitating the Trustees' competitive analysis of management fees and total expenses. Fidelity creates "mapped groups" by combining similar Lipper investment objective categories that have comparable investment mandates. Combining Lipper investment objective categories aids the Board's management fee and total expense ratio comparisons by broadening the competitive group used for comparison.
Management Fee. The Board considered two proprietary management fee comparisons for the 12-month periods (ended June 30 for 2018 and December 31 for prior periods) shown in basis points (BP) in the chart below. The group of Lipper funds used by the Board for management fee comparisons is referred to below as the "Total Mapped Group." The Total Mapped Group comparison focuses on a fund's standing in terms of gross management fees before expense reimbursements or caps, and without giving effect to the fund's performance adjustment, relative to the total universe of funds with comparable investment mandates, regardless of whether their management fee structures also are comparable. Funds with comparable investment mandates offer exposure to similar types of securities. Funds with comparable management fee structures have similar management fee contractual arrangements (
e.g., flat rate charged for advisory services, all-inclusive fee rate,
etc.). "TMG %" represents the percentage of funds in the Total Mapped Group that had management fees that were lower than the fund's. For example, a hypothetical TMG % of 20% would mean that 80% of the funds in the Total Mapped Group had higher, and 20% had lower, management fees than the fund. The fund's actual TMG %s and the number of funds in the Total Mapped Group are in the chart below. The "Asset-Size Peer Group" (ASPG) comparison focuses on a fund's standing relative to a subset of non-Fidelity funds within the Total Mapped Group that are similar in size and management fee structure without taking into account performance adjustments, if any. For example, if a fund is in the first quartile of the ASPG, the fund's management fee ranks in the least expensive or lowest 25% of funds in the ASPG. The ASPG represents at least 15% of the funds in the Total Mapped Group with comparable asset size and management fee structures, subject to a minimum of 50 funds (or all funds in the Total Mapped Group if fewer than 50). Additional information, such as the ASPG quartile in which the fund's management fee rate ranked and the impact of the fund's performance adjustment, is also included in the chart and was considered by the Board.
Fidelity Advisor Overseas Fund
The Board considered that effective August 1, 2014, the fund's individual fund fee rate was reduced from 0.450% to 0.424%. The Board considered that the chart below reflects the fund's lower management fee rate for 2014, as if the lower fee rate were in effect for the entire year.
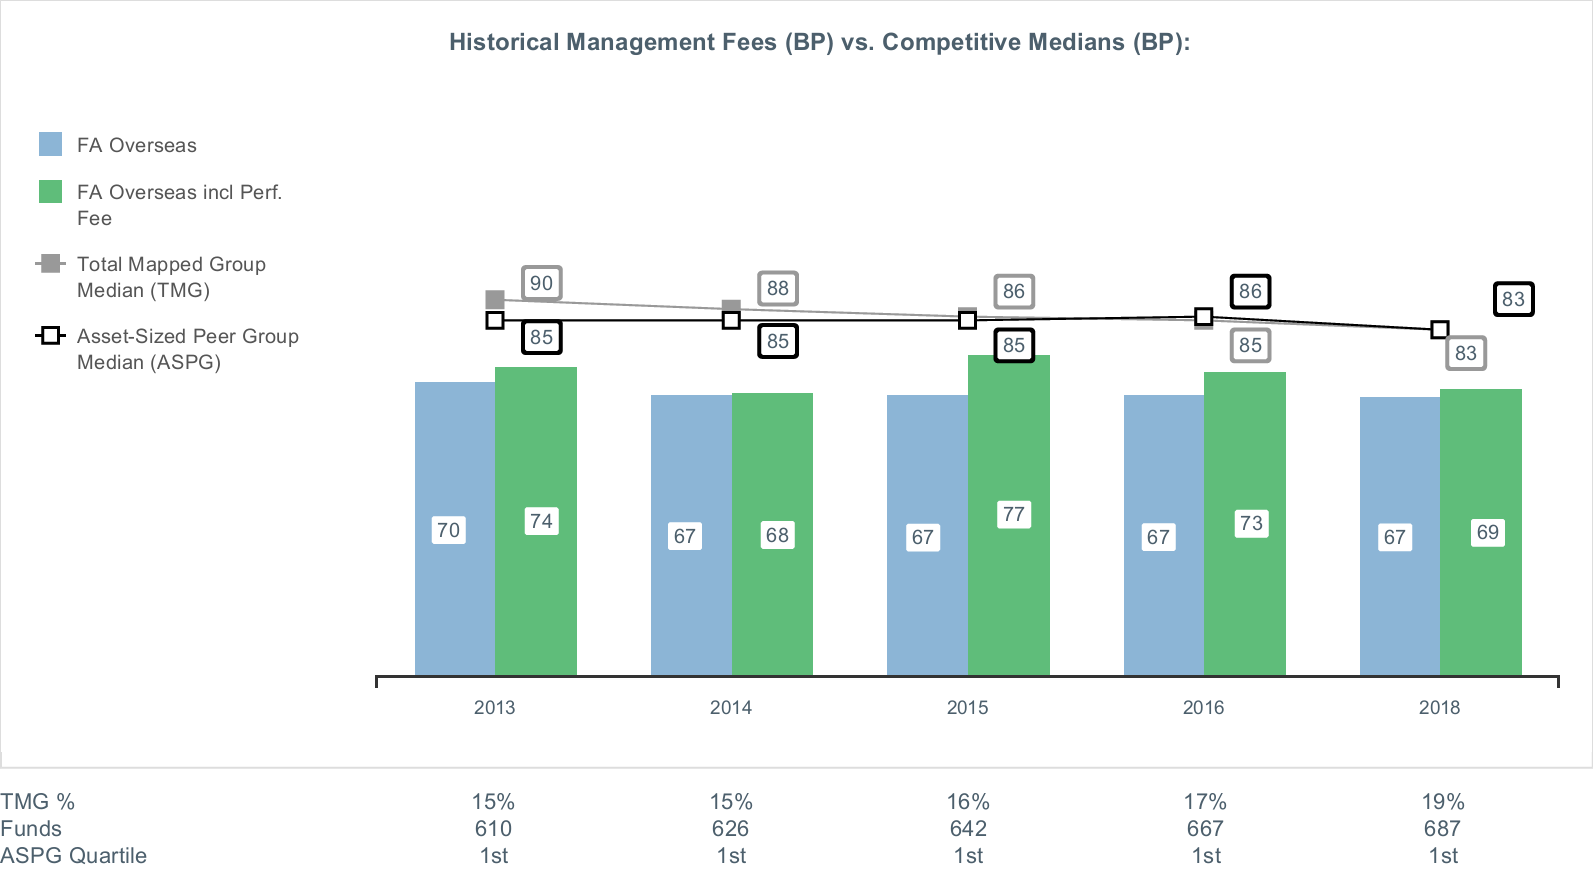
The Board noted that the fund's management fee rate ranked below the median of its Total Mapped Group and below the median of its ASPG for the 12-month period ended June 30, 2018. The Board also noted the effect of the fund's performance adjustment, if any, on the fund's management fee ranking.
The Board noted that it and the boards of other Fidelity funds formed an ad hoc Committee on Group Fee, which meets periodically, to conduct an in-depth review of the "group fee" component of the management fee of funds with such management fee structures. The Committee's focus included the mechanics of the group fee, the competitive landscape of group fee structures, Fidelity funds with no group fee component and investment products not included in group fee assets. The Board also considered that, for funds subject to the group fee, FMR agreed to voluntarily waive fees over a specified period of time in amounts designed to account for assets converted from certain funds to certain collective investment trusts.
The Board also noted that, in 2013, the ad hoc Committee on Management Fees was formed to conduct an in-depth review of the management fee rates of Fidelity's active equity mutual funds. The Committee focused on the following areas: (i) standard fee structures; (ii) research consumption and trading evolution; (iii) management fee competitiveness/profitability by category; and (iv) factors that drive institutional pricing.
Based on its review, the Board concluded that the fund's management fee is fair and reasonable in light of the services that the fund receives and the other factors considered.
Total Expense Ratio. In its review of each class's total expense ratio, the Board considered the fund's management fee rate as well as other fund or class expenses, as applicable, such as transfer agent fees, pricing and bookkeeping fees, fund-paid 12b-1 fees, and custodial, legal, and audit fees. The Board noted the impact of the fund's performance adjustment. The Board also noted that Fidelity may agree to waive fees and expenses from time to time, and the extent to which, if any, it has done so for the fund. As part of its review, the Board also considered the current and historical total expense ratios of each class of the fund compared to competitive fund median expenses. Each class of the fund is compared to those funds and classes in the Total Mapped Group (used by the Board for management fee comparisons) that have a similar sales load structure.
The Board noted that the total expense ratio of each of Class A, Class I, and Class Z ranked below the competitive median for the 12-month period ended June 30, 2018, and the total expense ratio of each of Class M and Class C ranked above the competitive median for the 12-month period ended June 30, 2018. The Board considered that, in general, various factors can affect total expense ratios. The Board noted that the total expense ratio of Class M was above the competitive median primarily because of higher 12b-1 fees on Class M as compared to most competitor funds. Class M has a higher 12b-1 fee, but a lower front-end sales charge, than traditionally priced front-end sales charge classes. The Board considered that Class M is primarily sold load-waived to retirement plans and intermediary wrap programs where its 0.50% 12b-1 fee is comparable to competing no-load, higher 12b-1 fee classes designed specifically for retirement plans and wrap programs. The Board noted that, when compared with competitor funds that charge a 0.50% 12b-1 fee, the total expense ratio of Class M is below median. The Board noted that the total expense ratio of Class C was above the competitive median primarily because of its 1.00% 12b-1 fee. The Board noted that the fund offers multiple classes, each of which has a different sales load and 12b-1 fee structure, and that the multiple structures are intended to offer a range of pricing options for the intermediary market. The Board also noted that the total expense ratios of the classes vary primarily by the level of their 12b-1 fees, although differences in transfer agent fees may also cause expenses to vary from class to class.
Fees Charged to Other Fidelity Clients. The Board also considered Fidelity fee structures and other information with respect to clients of Fidelity, such as other funds advised or subadvised by Fidelity, pension plan clients, and other institutional clients with similar mandates. The Board noted that a joint ad hoc committee created by it and the boards of other Fidelity funds periodically reviews and compares Fidelity's institutional investment advisory business with its business of providing services to the Fidelity funds and also noted the most recent findings of the committee. The Board noted that the committee's review included a consideration of the differences in services provided, fees charged, and costs incurred, as well as competition in the markets serving the different categories of clients.
Based on its review of total expense ratios and fees charged to other Fidelity clients, the Board concluded that the total expense ratio of each class of the fund was reasonable in light of the services that the fund and its shareholders receive and the other factors considered.
Costs of the Services and Profitability. The Board considered the revenues earned and the expenses incurred by Fidelity in conducting the business of developing, marketing, distributing, managing, administering and servicing the fund and servicing the fund's shareholders. The Board also considered the level of Fidelity's profits in respect of all the Fidelity funds.
On an annual basis, Fidelity presents to the Board information about the profitability of its relationships with the fund. Fidelity calculates profitability information for each fund, as well as aggregate profitability information for groups of Fidelity funds and all Fidelity funds, using a series of detailed revenue and cost allocation methodologies which originate with the books and records of Fidelity on which Fidelity's audited financial statements are based. The Audit Committee of the Board reviews any significant changes from the prior year's methodologies.
PricewaterhouseCoopers LLP (PwC), auditor to Fidelity and certain Fidelity funds, has been engaged annually by the Board as part of the Board's assessment of Fidelity's profitability analysis. PwC's engagement includes the review and assessment of the methodologies used by Fidelity in determining the revenues and expenses attributable to Fidelity's mutual fund business, and completion of agreed-upon procedures in respect of the mathematical accuracy of the fund profitability information and its conformity to established allocation methodologies. After considering PwC's reports issued under the engagement and information provided by Fidelity, the Board concluded that while other allocation methods may also be reasonable, Fidelity's profitability methodologies are reasonable in all material respects.
The Board also reviewed Fidelity's non-fund businesses and potential indirect benefits such businesses may have received as a result of their association with Fidelity's mutual fund business (i.e., fall-out benefits) as well as cases where Fidelity's affiliates may benefit from the fund's business. The Board noted that changes to fall-out benefits year-over-year reflect business developments at Fidelity's various businesses.
The Board considered the costs of the services provided by and the profits realized by Fidelity in connection with the operation of the fund and was satisfied that the profitability was not excessive.
Economies of Scale. The Board considered whether there have been economies of scale in respect of the management of the Fidelity funds, whether the Fidelity funds (including the fund) have appropriately benefited from any such economies of scale, and whether there is potential for realization of any further economies of scale. The Board considered the extent to which the fund will benefit from economies of scale as assets grow through increased services to the fund, through waivers or reimbursements, or through fee or expense ratio reductions. The Board also noted that a committee (the Economies of Scale Committee) created by it and the boards of other Fidelity funds periodically analyzes whether Fidelity attains economies of scale in respect of the management and servicing of the Fidelity funds, whether the Fidelity funds have appropriately benefited from such economies of scale, and whether there is potential for realization of any further economies of scale.
The Board recognized that the fund's management contract incorporates a "group fee" structure, which provides for lower group fee rates as total group assets increase, and for higher group fee rates as total group assets decrease (with "group assets" defined to include fund assets under FMR's management plus the assets of sector funds previously under FMR's management). FMR calculates the group fee rates based on a tiered asset "breakpoint" schedule that varies based on asset class. The Board considered that the group fee is designed to deliver the benefits of economies of scale to fund shareholders when total Fidelity fund assets increase, even if assets of any particular fund are unchanged or have declined, because some portion of Fidelity's costs are attributable to services provided to all Fidelity funds, and all funds benefit if those costs can be allocated among more assets. The Board concluded that, given the group fee structure, fund shareholders will benefit from lower management fees as group assets increase at the fund complex level, regardless of whether Fidelity achieves any such economies of scale.
The Board concluded, taking into account the analysis of the Economies of Scale Committee, that economies of scale, if any, are being appropriately shared between fund shareholders and Fidelity.
Additional Information Requested by the Board. In order to develop fully the factual basis for consideration of the Fidelity funds' advisory contracts, the Board requested and received additional information on certain topics, including: (i) fund performance trends, in particular the underperformance of certain funds, and Fidelity's long-term strategies for certain funds; (ii) Fidelity's fund profitability methodology, profitability trends for certain funds, and the impact of certain factors on fund profitability results; (iii) metrics for evaluating index fund and ETF performance and information about ETF trading characteristics; (iv) the methodology with respect to the evaluation of competitive fund data and peer group classifications and fee comparisons; (v) the expense structures for different funds and classes; (vi) information regarding other accounts managed by Fidelity, including collective investment trusts; and (vii) Fidelity's philosophies and strategies for evaluating funds and classes with lower or declining asset levels.
Based on its evaluation of all of the conclusions noted above, and after considering all factors it believed relevant, the Board concluded that the advisory fee arrangements are fair and reasonable, and that the fund's Advisory Contracts should be renewed.

OS-SANN-0619
1.703565.121
Fidelity Advisor® International Capital Appreciation Fund
Semi-Annual Report April 30, 2019 |
|
Beginning on January 1, 2021, as permitted by regulations adopted by the Securities and Exchange Commission, paper copies of a fund’s shareholder reports will no longer be sent by mail, unless you specifically request paper copies of the reports from the fund or from your financial intermediary, such as a financial advisor, broker-dealer or bank. Instead, the reports will be made available on a website, and you will be notified by mail each time a report is posted and provided with a website link to access the report.
If you already elected to receive shareholder reports electronically, you will not be affected by this change and you need not take any action. You may elect to receive shareholder reports and other communications from a fund electronically, by contacting your financial intermediary. For Fidelity customers, visit Fidelity's web site or call Fidelity using the contact information listed below.
You may elect to receive all future reports in paper free of charge. If you wish to continue receiving paper copies of your shareholder reports, you may contact your financial intermediary or, if you are a Fidelity customer, visit Fidelity’s website, or call Fidelity at the applicable toll-free number listed below. Your election to receive reports in paper will apply to all funds held with the fund complex/your financial intermediary.
| Account Type | Website | Phone Number |
| Brokerage, Mutual Fund, or Annuity Contracts: | fidelity.com/mailpreferences | 1-800-343-3548 |
| Employer Provided Retirement Accounts: | netbenefits.fidelity.com/preferences (choose 'no' under Required Disclosures to continue to print) | 1-800-343-0860 |
| Advisor Sold Accounts Serviced Through Your Financial Intermediary: | Contact Your Financial Intermediary | Your Financial Intermediary's phone number |
| Advisor Sold Accounts Serviced by Fidelity: | institutional.fidelity.com | 1-877-208-0098 |
Contents
To view a fund's proxy voting guidelines and proxy voting record for the 12-month period ended June 30, visit http://www.fidelity.com/proxyvotingresults or visit the Securities and Exchange Commission's (SEC) web site at http://www.sec.gov.
You may also call 1-877-208-0098 to request a free copy of the proxy voting guidelines.
Standard & Poor's, S&P and S&P 500 are registered service marks of The McGraw-Hill Companies, Inc. and have been licensed for use by Fidelity Distributors Corporation.
Other third-party marks appearing herein are the property of their respective owners.
All other marks appearing herein are registered or unregistered trademarks or service marks of FMR LLC or an affiliated company. © 2019 FMR LLC. All rights reserved.
This report and the financial statements contained herein are submitted for the general information of the shareholders of the Fund. This report is not authorized for distribution to prospective investors in the Fund unless preceded or accompanied by an effective prospectus.
A fund files its complete schedule of portfolio holdings with the SEC for the first and third quarters of each fiscal year on Form N-PORT. Forms N-PORT are available on the SEC’s web site at http://www.sec.gov. A fund's Forms N-PORT may be reviewed and copied at the SEC’s Public Reference Room in Washington, DC. Information regarding the operation of the SEC's Public Reference Room may be obtained by calling 1-800-SEC-0330.
For a complete list of a fund's portfolio holdings, view the most recent holdings listing, semiannual report, or annual report on Fidelity's web site at http://www.fidelity.com, http://www.institutional.fidelity.com, or http://www.401k.com, as applicable.
NOT FDIC INSURED •MAY LOSE VALUE •NO BANK GUARANTEE
Neither the Fund nor Fidelity Distributors Corporation is a bank.
Investment Summary (Unaudited)
Top Five Stocks as of April 30, 2019
| | % of fund's net assets |
| Nestle SA (Reg. S) (Switzerland, Food Products) | 2.2 |
| Tencent Holdings Ltd. (Cayman Islands, Interactive Media & Services) | 2.1 |
| Alibaba Group Holding Ltd. sponsored ADR (Cayman Islands, Internet & Direct Marketing Retail) | 1.9 |
| Taiwan Semiconductor Manufacturing Co. Ltd. sponsored ADR (Taiwan, Semiconductors & Semiconductor Equipment) | 1.8 |
| Unilever NV (Certificaten Van Aandelen) (Bearer) (Netherlands, Personal Products) | 1.6 |
| | 9.6 |
Top Five Market Sectors as of April 30, 2019
| | % of fund's net assets |
| Information Technology | 19.9 |
| Industrials | 15.5 |
| Financials | 14.9 |
| Consumer Staples | 12.6 |
| Consumer Discretionary | 12.0 |
Top Five Countries as of April 30, 2019
| (excluding cash equivalents) | % of fund's net assets |
| United States of America | 15.2 |
| France | 10.1 |
| United Kingdom | 7.5 |
| Germany | 7.0 |
| Netherlands | 6.3 |
Percentages are adjusted for the effect of futures contracts, if applicable.
Asset Allocation (% of fund's net assets)
| As of April 30, 2019 |
| | Stocks | 96.8% |
| | Short-Term Investments and Net Other Assets (Liabilities) | 3.2% |

Schedule of Investments April 30, 2019 (Unaudited)
Showing Percentage of Net Assets
| Common Stocks - 95.8% | | | |
| | | Shares | Value |
| Australia - 1.1% | | | |
| CSL Ltd. | | 176,828 | $24,752,723 |
| Bailiwick of Jersey - 0.9% | | | |
| Experian PLC | | 707,100 | 20,582,913 |
| Bermuda - 0.9% | | | |
| Credicorp Ltd. (United States) | | 82,261 | 19,487,631 |
| Brazil - 2.7% | | | |
| BM&F BOVESPA SA | | 2,459,900 | 21,612,189 |
| Equatorial Energia SA | | 913,800 | 19,133,146 |
| Rumo SA (a) | | 4,010,900 | 18,514,521 |
|
| TOTAL BRAZIL | | | 59,259,856 |
|
| Canada - 5.8% | | | |
| Alimentation Couche-Tard, Inc. Class B (sub. vtg.) | | 352,900 | 20,807,323 |
| Brookfield Asset Management, Inc. | | 448,400 | 21,608,396 |
| Canadian National Railway Co. | | 264,540 | 24,572,186 |
| Canadian Pacific Railway Ltd. | | 97,100 | 21,755,995 |
| Constellation Software, Inc. | | 22,380 | 19,746,754 |
| Waste Connection, Inc. (Canada) | | 216,630 | 20,105,825 |
|
| TOTAL CANADA | | | 128,596,479 |
|
| Cayman Islands - 4.9% | | | |
| Alibaba Group Holding Ltd. sponsored ADR (a) | | 229,060 | 42,506,664 |
| Shenzhou International Group Holdings Ltd. | | 1,410,900 | 18,938,376 |
| Tencent Holdings Ltd. | | 952,500 | 46,946,499 |
|
| TOTAL CAYMAN ISLANDS | | | 108,391,539 |
|
| China - 0.8% | | | |
| Kweichow Moutai Co. Ltd. (A Shares) | | 126,054 | 18,229,906 |
| Denmark - 1.8% | | | |
| DONG Energy A/S (b) | | 254,300 | 19,468,966 |
| DSV de Sammensluttede Vognmaend A/S | | 222,600 | 20,566,831 |
|
| TOTAL DENMARK | | | 40,035,797 |
|
| France - 10.1% | | | |
| Dassault Systemes SA | | 133,400 | 21,104,104 |
| Hermes International SCA | | 29,041 | 20,429,400 |
| Kering SA | | 38,280 | 22,626,665 |
| L'Oreal SA | | 89,320 | 24,554,440 |
| LVMH Moet Hennessy - Louis Vuitton SA | | 77,271 | 30,337,927 |
| Orpea | | 161,230 | 19,656,826 |
| Pernod Ricard SA | | 123,700 | 21,553,557 |
| Safran SA | | 161,900 | 23,598,726 |
| SR Teleperformance SA | | 96,900 | 18,617,405 |
| VINCI SA (c) | | 232,100 | 23,441,229 |
|
| TOTAL FRANCE | | | 225,920,279 |
|
| Germany - 7.0% | | | |
| adidas AG | | 86,657 | 22,267,258 |
| Deutsche Borse AG | | 154,100 | 20,591,205 |
| Linde PLC | | 100,400 | 18,062,426 |
| SAP SE | | 259,600 | 33,464,581 |
| Symrise AG | | 194,500 | 18,695,558 |
| Vonovia SE | | 418,000 | 20,848,817 |
| Wirecard AG (c) | | 144,100 | 21,608,936 |
|
| TOTAL GERMANY | | | 155,538,781 |
|
| Hong Kong - 1.4% | | | |
| AIA Group Ltd. | | 2,958,000 | 30,288,251 |
| India - 3.8% | | | |
| HDFC Bank Ltd. | | 556,816 | 18,472,752 |
| Housing Development Finance Corp. Ltd. | | 815,769 | 23,367,840 |
| Kotak Mahindra Bank Ltd. | | 943,146 | 18,776,388 |
| Reliance Industries Ltd. | | 1,217,358 | 24,344,713 |
|
| TOTAL INDIA | | | 84,961,693 |
|
| Indonesia - 0.9% | | | |
| PT Bank Central Asia Tbk | | 10,263,800 | 20,707,667 |
| Ireland - 2.6% | | | |
| Accenture PLC Class A | | 102,840 | 18,785,783 |
| Kerry Group PLC Class A | | 173,020 | 19,367,111 |
| Kingspan Group PLC (Ireland) | | 375,760 | 19,757,689 |
|
| TOTAL IRELAND | | | 57,910,583 |
|
| Israel - 0.9% | | | |
| NICE Systems Ltd. sponsored ADR (a) | | 150,800 | 20,789,288 |
| Italy - 1.7% | | | |
| Amplifon SpA | | 916,700 | 17,612,564 |
| Moncler SpA | | 473,000 | 19,400,999 |
|
| TOTAL ITALY | | | 37,013,563 |
|
| Japan - 4.4% | | | |
| Hoya Corp. | | 300,300 | 21,067,772 |
| Kao Corp. | | 301,300 | 23,144,882 |
| Keyence Corp. | | 39,114 | 24,270,027 |
| OBIC Co. Ltd. | | 183,600 | 21,195,709 |
| Relo Group, Inc. (d) | | 355,100 | 9,658,899 |
|
| TOTAL JAPAN | | | 99,337,289 |
|
| Netherlands - 6.3% | | | |
| ASML Holding NV (Netherlands) | | 133,600 | 27,802,382 |
| Ferrari NV | | 137,600 | 18,635,608 |
| Heineken NV (Bearer) | | 198,400 | 21,415,848 |
| Interxion Holding N.V. (a) | | 266,079 | 18,410,006 |
| Unilever NV (Certificaten Van Aandelen) (Bearer) | | 583,700 | 35,316,526 |
| Wolters Kluwer NV | | 276,100 | 19,255,514 |
|
| TOTAL NETHERLANDS | | | 140,835,884 |
|
| Philippines - 0.9% | | | |
| SM Prime Holdings, Inc. | | 24,580,000 | 19,683,945 |
| South Africa - 3.1% | | | |
| Capitec Bank Holdings Ltd. | | 193,100 | 18,043,680 |
| FirstRand Ltd. | | 4,217,600 | 20,022,175 |
| Naspers Ltd. Class N | | 119,630 | 30,774,882 |
|
| TOTAL SOUTH AFRICA | | | 68,840,737 |
|
| Spain - 1.0% | | | |
| Amadeus IT Holding SA Class A | | 274,491 | 21,834,077 |
| Sweden - 2.6% | | | |
| ASSA ABLOY AB (B Shares) | | 943,700 | 20,174,011 |
| Hexagon AB (B Shares) | | 359,700 | 19,651,214 |
| Swedish Match Co. AB | | 388,057 | 18,921,505 |
|
| TOTAL SWEDEN | | | 58,746,730 |
|
| Switzerland - 5.7% | | | |
| Givaudan SA | | 7,679 | 19,888,003 |
| Nestle SA (Reg. S) | | 503,600 | 48,485,428 |
| Partners Group Holding AG | | 24,900 | 18,757,780 |
| Sika AG | | 135,027 | 20,672,469 |
| Temenos Group AG | | 123,800 | 20,581,697 |
|
| TOTAL SWITZERLAND | | | 128,385,377 |
|
| Taiwan - 1.8% | | | |
| Taiwan Semiconductor Manufacturing Co. Ltd. sponsored ADR | | 933,370 | 40,900,273 |
| United Kingdom - 7.5% | | | |
| Bunzl PLC | | 613,100 | 18,460,049 |
| Compass Group PLC | | 929,250 | 21,144,025 |
| Croda International PLC | | 273,626 | 18,486,238 |
| Diageo PLC | | 683,954 | 28,833,937 |
| InterContinental Hotel Group PLC | | 294,641 | 19,087,645 |
| London Stock Exchange Group PLC | | 311,400 | 20,416,413 |
| RELX PLC (London Stock Exchange) | | 1,008,258 | 23,126,777 |
| Rentokil Initial PLC | | 3,732,100 | 18,979,968 |
|
| TOTAL UNITED KINGDOM | | | 168,535,052 |
|
| United States of America - 15.2% | | | |
| Adobe, Inc. (a) | | 65,760 | 19,021,080 |
| American Tower Corp. | | 99,330 | 19,399,149 |
| Becton, Dickinson & Co. | | 77,500 | 18,657,350 |
| Boston Scientific Corp. (a) | | 512,400 | 19,020,288 |
| Crown Castle International Corp. | | 149,000 | 18,741,220 |
| Fiserv, Inc. (a) | | 206,200 | 17,988,888 |
| HEICO Corp. Class A | | 197,100 | 17,626,653 |
| Intuitive Surgical, Inc. (a) | | 36,300 | 18,535,869 |
| Marsh & McLennan Companies, Inc. | | 189,800 | 17,896,242 |
| MasterCard, Inc. Class A | | 75,150 | 19,106,136 |
| Microsoft Corp. | | 150,900 | 19,707,540 |
| Moody's Corp. | | 97,140 | 19,099,667 |
| NextEra Energy, Inc. | | 95,100 | 18,491,244 |
| Salesforce.com, Inc. (a) | | 116,900 | 19,329,415 |
| Stryker Corp. | | 101,500 | 19,174,365 |
| Thermo Fisher Scientific, Inc. | | 71,900 | 19,948,655 |
| TransDigm Group, Inc. (a) | | 37,300 | 17,997,996 |
| Visa, Inc. Class A | | 115,340 | 18,965,356 |
|
| TOTAL UNITED STATES OF AMERICA | | | 338,707,113 |
|
| TOTAL COMMON STOCKS | | | |
| (Cost $1,804,053,199) | | | 2,138,273,426 |
|
| Nonconvertible Preferred Stocks - 1.0% | | | |
| Brazil - 1.0% | | | |
| Itau Unibanco Holding SA sponsored ADR | | | |
| (Cost $21,668,817) | | 2,633,970 | 22,783,841 |
|
| Money Market Funds - 3.8% | | | |
| Fidelity Cash Central Fund, 2.49% (e) | | 62,869,116 | 62,881,690 |
| Fidelity Securities Lending Cash Central Fund 2.49% (e)(f) | | 20,843,736 | 20,845,820 |
| TOTAL MONEY MARKET FUNDS | | | |
| (Cost $83,727,510) | | | 83,727,510 |
| TOTAL INVESTMENT IN SECURITIES - 100.6% | | | |
| (Cost $1,909,449,526) | | | 2,244,784,777 |
| NET OTHER ASSETS (LIABILITIES) - (0.6)% | | | (12,983,086) |
| NET ASSETS - 100% | | | $2,231,801,691 |
Categorizations in the Schedule of Investments are based on country or territory of incorporation.
Legend
(a) Non-income producing
(b) Security exempt from registration under Rule 144A of the Securities Act of 1933. These securities may be resold in transactions exempt from registration, normally to qualified institutional buyers. At the end of the period, the value of these securities amounted to $19,468,966 or 0.9% of net assets.
(c) Security or a portion of the security is on loan at period end.
(d) A portion of the security sold on a delayed delivery basis.
(e) Affiliated fund that is generally available only to investment companies and other accounts managed by Fidelity Investments. The rate quoted is the annualized seven-day yield of the fund at period end. A complete unaudited listing of the fund's holdings as of its most recent quarter end is available upon request. In addition, each Fidelity Central Fund's financial statements are available on the SEC's website or upon request.
(f) Investment made with cash collateral received from securities on loan.
Affiliated Central Funds
Information regarding fiscal year to date income earned by the Fund from investments in Fidelity Central Funds is as follows:
| Fund | Income earned |
| Fidelity Cash Central Fund | $387,462 |
| Fidelity Securities Lending Cash Central Fund | 398,869 |
| Total | $786,331 |
Amounts in the income column in the above table include any capital gain distributions from underlying funds, which are presented in the corresponding line-item in the Statement of Operations, if applicable.
Investment Valuation
The following is a summary of the inputs used, as of April 30, 2019, involving the Fund's assets and liabilities carried at fair value. The inputs or methodology used for valuing securities may not be an indication of the risk associated with investing in those securities. For more information on valuation inputs, and their aggregation into the levels used below, please refer to the Investment Valuation section in the accompanying Notes to Financial Statements.
| | Valuation Inputs at Reporting Date: |
| Description | Total | Level 1 | Level 2 | Level 3 |
| Investments in Securities: | | | | |
| Equities: | | | | |
| Communication Services | $46,946,499 | $-- | $46,946,499 | $-- |
| Consumer Discretionary | 266,149,449 | 183,892,615 | 82,256,834 | -- |
| Consumer Staples | 280,630,463 | 149,073,067 | 131,557,396 | -- |
| Energy | 24,344,713 | 24,344,713 | -- | -- |
| Financials | 331,932,117 | 242,163,496 | 89,768,621 | -- |
| Health Care | 178,426,412 | 178,426,412 | -- | -- |
| Industrials | 347,134,288 | 259,337,409 | 87,796,879 | -- |
| Information Technology | 444,263,246 | 391,147,451 | 53,115,795 | -- |
| Materials | 95,804,694 | 95,804,694 | -- | -- |
| Real Estate | 88,332,030 | 88,332,030 | -- | -- |
| Utilities | 57,093,356 | 57,093,356 | -- | -- |
| Money Market Funds | 83,727,510 | 83,727,510 | -- | -- |
| Total Investments in Securities: | $2,244,784,777 | $1,753,342,753 | $491,442,024 | $-- |
See accompanying notes which are an integral part of the financial statements.
Financial Statements
Statement of Assets and Liabilities
| | | April 30, 2019 (Unaudited) |
| Assets | | |
Investment in securities, at value (including securities loaned of $19,721,367) — See accompanying schedule:
Unaffiliated issuers (cost $1,825,722,016) | $2,161,057,267 | |
| Fidelity Central Funds (cost $83,727,510) | 83,727,510 | |
| Total Investment in Securities (cost $1,909,449,526) | | $2,244,784,777 |
| Foreign currency held at value (cost $483,969) | | 483,969 |
| Receivable for investments sold | | 3,671,006 |
| Receivable for fund shares sold | | 6,103,963 |
| Dividends receivable | | 4,579,009 |
| Distributions receivable from Fidelity Central Funds | | 157,230 |
| Prepaid expenses | | 815 |
| Other receivables | | 714,726 |
| Total assets | | 2,260,495,495 |
| Liabilities | | |
| Payable for investments purchased | | |
| Regular delivery | $804,405 | |
| Delayed delivery | 1,981,529 | |
| Payable for fund shares redeemed | 2,631,275 | |
| Accrued management fee | 1,390,376 | |
| Distribution and service plan fees payable | 174,331 | |
| Other affiliated payables | 354,712 | |
| Other payables and accrued expenses | 511,356 | |
| Collateral on securities loaned | 20,845,820 | |
| Total liabilities | | 28,693,804 |
| Net Assets | | $2,231,801,691 |
| Net Assets consist of: | | |
| Paid in capital | | $1,976,088,063 |
| Total distributable earnings (loss) | | 255,713,628 |
| Net Assets | | $2,231,801,691 |
| Net Asset Value and Maximum Offering Price | | |
| Class A: | | |
| Net Asset Value and redemption price per share ($231,317,147 ÷ 11,340,196 shares) | | $20.40 |
| Maximum offering price per share (100/94.25 of $20.40) | | $21.64 |
| Class M: | | |
| Net Asset Value and redemption price per share ($100,580,581 ÷ 5,057,876 shares) | | $19.89 |
| Maximum offering price per share (100/96.50 of $19.89) | | $20.61 |
| Class C: | | |
| Net Asset Value and offering price per share ($105,499,555 ÷ 5,890,240 shares)(a) | | $17.91 |
| Class I: | | |
| Net Asset Value, offering price and redemption price per share ($1,504,037,478 ÷ 69,078,502 shares) | | $21.77 |
| Class Z: | | |
| Net Asset Value, offering price and redemption price per share ($290,366,930 ÷ 13,325,259 shares) | | $21.79 |
(a) Redemption price per share is equal to net asset value less any applicable contingent deferred sales charge.
See accompanying notes which are an integral part of the financial statements.
Statement of Operations
| | | Six months ended April 30, 2019 (Unaudited) |
| Investment Income | | |
| Dividends | | $14,718,046 |
| Income from Fidelity Central Funds | | 786,331 |
| Income before foreign taxes withheld | | 15,504,377 |
| Less foreign taxes withheld | | (1,446,975) |
| Total income | | 14,057,402 |
| Expenses | | |
| Management fee | | |
| Basic fee | $6,264,323 | |
| Performance adjustment | 233,405 | |
| Transfer agent fees | 1,483,683 | |
| Distribution and service plan fees | 1,009,200 | |
| Accounting and security lending fees | 405,143 | |
| Custodian fees and expenses | 124,892 | |
| Independent trustees' fees and expenses | 4,827 | |
| Registration fees | 137,648 | |
| Audit | 61,872 | |
| Legal | 3,193 | |
| Interest | 28,438 | |
| Miscellaneous | 5,230 | |
| Total expenses before reductions | 9,761,854 | |
| Expense reductions | (271,251) | |
| Total expenses after reductions | | 9,490,603 |
| Net investment income (loss) | | 4,566,799 |
| Realized and Unrealized Gain (Loss) | | |
| Net realized gain (loss) on: | | |
| Investment securities: | | |
| Unaffiliated issuers | (39,802,084) | |
| Fidelity Central Funds | (192) | |
| Foreign currency transactions | (92,515) | |
| Total net realized gain (loss) | | (39,894,791) |
| Change in net unrealized appreciation (depreciation) on: | | |
| Investment securities: | | |
| Unaffiliated issuers (net of increase in deferred foreign taxes of $420,929) | 317,836,310 | |
| Assets and liabilities in foreign currencies | 74,877 | |
| Total change in net unrealized appreciation (depreciation) | | 317,911,187 |
| Net gain (loss) | | 278,016,396 |
| Net increase (decrease) in net assets resulting from operations | | $282,583,195 |
See accompanying notes which are an integral part of the financial statements.
Statement of Changes in Net Assets
| | Six months ended April 30, 2019 (Unaudited) | Year ended October 31, 2018 |
| Increase (Decrease) in Net Assets | | |
| Operations | | |
| Net investment income (loss) | $4,566,799 | $7,599,775 |
| Net realized gain (loss) | (39,894,791) | (43,030,217) |
| Change in net unrealized appreciation (depreciation) | 317,911,187 | (131,981,031) |
| Net increase (decrease) in net assets resulting from operations | 282,583,195 | (167,411,473) |
| Distributions to shareholders | (7,117,696) | (1,800,404) |
| Share transactions - net increase (decrease) | 301,448,333 | 766,075,127 |
| Total increase (decrease) in net assets | 576,913,832 | 596,863,250 |
| Net Assets | | |
| Beginning of period | 1,654,887,859 | 1,058,024,609 |
| End of period | $2,231,801,691 | $1,654,887,859 |
See accompanying notes which are an integral part of the financial statements.
Financial Highlights
Fidelity Advisor International Capital Appreciation Fund Class A
| | Six months ended (Unaudited) April 30, | Years endedOctober 31, | | | | |
| | 2019 | 2018 | 2017 | 2016 | 2015 | 2014 |
| Selected Per–Share Data | | | | | | |
| Net asset value, beginning of period | $17.63 | $19.14 | $15.26 | $15.25 | $14.77 | $13.96 |
| Income from Investment Operations | | | | | | |
| Net investment income (loss)A | .03 | .07 | .04 | .05 | .05 | .06 |
| Net realized and unrealized gain (loss) | 2.78 | (1.57) | 3.86 | (.03) | .46 | .82 |
| Total from investment operations | 2.81 | (1.50) | 3.90 | .02 | .51 | .88 |
| Distributions from net investment income | (.04) | (.01) | (.02) | (.01) | (.03) | (.07) |
| Total distributions | (.04) | (.01) | (.02) | (.01) | (.03) | (.07) |
| Redemption fees added to paid in capitalA | – | – | –B | –B | –B | –B |
| Net asset value, end of period | $20.40 | $17.63 | $19.14 | $15.26 | $15.25 | $14.77 |
| Total ReturnC,D,E | 15.96% | (7.85)% | 25.56% | .12% | 3.46% | 6.31% |
| Ratios to Average Net AssetsF,G | | | | | | |
| Expenses before reductions | 1.25%H | 1.29% | 1.38% | 1.50% | 1.58% | 1.73% |
| Expenses net of fee waivers, if any | 1.25%H | 1.29% | 1.37% | 1.45% | 1.45% | 1.45% |
| Expenses net of all reductions | 1.22%H | 1.23% | 1.35% | 1.43% | 1.42% | 1.44% |
| Net investment income (loss) | .33%H | .35% | .21% | .34% | .30% | .42% |
| Supplemental Data | | | | | | |
| Net assets, end of period (000 omitted) | $231,317 | $190,278 | $173,948 | $127,536 | $89,753 | $51,567 |
| Portfolio turnover rateI | 160%H | 151% | 155% | 167% | 176% | 197% |
A Calculated based on average shares outstanding during the period.
B Amount represents less than $.005 per share.
C Total returns for periods of less than one year are not annualized.
D Total returns would have been lower if certain expenses had not been reduced during the applicable periods shown.
E Total returns do not include the effect of the sales charges.
F Fees and expenses of any underlying Fidelity Central Funds are not included in the Fund's expense ratio. The Fund indirectly bears its proportionate share of the expenses of any underlying Fidelity Central Funds.
G Expense ratios reflect operating expenses of the class. Expenses before reductions do not reflect amounts reimbursed by the investment adviser or reductions from brokerage service arrangements or reductions from other expense offset arrangements and do not represent the amount paid by the class during periods when reimbursements or reductions occur. Expenses net of fee waivers reflect expenses after reimbursement by the investment adviser but prior to reductions from brokerage service arrangements or other expense offset arrangements. Expenses net of all reductions represent the net expenses paid by the class.
H Annualized
I Amount does not include the portfolio activity of any underlying Fidelity Central Funds.
See accompanying notes which are an integral part of the financial statements.
Fidelity Advisor International Capital Appreciation Fund Class M
| | Six months ended (Unaudited) April 30, | Years endedOctober 31, | | | | |
| | 2019 | 2018 | 2017 | 2016 | 2015 | 2014 |
| Selected Per–Share Data | | | | | | |
| Net asset value, beginning of period | $17.17 | $18.68 | $14.92 | $14.94 | $14.47 | $13.68 |
| Income from Investment Operations | | | | | | |
| Net investment income (loss)A | .01 | .02 | (.01) | .01 | .01 | .02 |
| Net realized and unrealized gain (loss) | 2.71 | (1.53) | 3.77 | (.03) | .46 | .81 |
| Total from investment operations | 2.72 | (1.51) | 3.76 | (.02) | .47 | .83 |
| Distributions from net investment income | – | – | – | – | – | (.04) |
| Total distributions | – | – | – | – | – | (.04) |
| Redemption fees added to paid in capitalA | – | – | –B | –B | –B | –B |
| Net asset value, end of period | $19.89 | $17.17 | $18.68 | $14.92 | $14.94 | $14.47 |
| Total ReturnC,D,E | 15.84% | (8.08)% | 25.20% | (.13)% | 3.25% | 6.07% |
| Ratios to Average Net AssetsF,G | | | | | | |
| Expenses before reductions | 1.51%H | 1.55% | 1.63% | 1.76% | 1.86% | 1.94% |
| Expenses net of fee waivers, if any | 1.51%H | 1.55% | 1.63% | 1.70% | 1.70% | 1.70% |
| Expenses net of all reductions | 1.48%H | 1.49% | 1.61% | 1.68% | 1.67% | 1.69% |
| Net investment income (loss) | .06%H | .10% | (.04)% | .09% | .05% | .17% |
| Supplemental Data | | | | | | |
| Net assets, end of period (000 omitted) | $100,581 | $87,750 | $86,547 | $62,866 | $60,293 | $58,454 |
| Portfolio turnover rateI | 160%H | 151% | 155% | 167% | 176% | 197% |
A Calculated based on average shares outstanding during the period.
B Amount represents less than $.005 per share.
C Total returns for periods of less than one year are not annualized.
D Total returns would have been lower if certain expenses had not been reduced during the applicable periods shown.
E Total returns do not include the effect of the sales charges.
F Fees and expenses of any underlying Fidelity Central Funds are not included in the Fund's expense ratio. The Fund indirectly bears its proportionate share of the expenses of any underlying Fidelity Central Funds.
G Expense ratios reflect operating expenses of the class. Expenses before reductions do not reflect amounts reimbursed by the investment adviser or reductions from brokerage service arrangements or reductions from other expense offset arrangements and do not represent the amount paid by the class during periods when reimbursements or reductions occur. Expenses net of fee waivers reflect expenses after reimbursement by the investment adviser but prior to reductions from brokerage service arrangements or other expense offset arrangements. Expenses net of all reductions represent the net expenses paid by the class.
H Annualized
I Amount does not include the portfolio activity of any underlying Fidelity Central Funds.
See accompanying notes which are an integral part of the financial statements.
Fidelity Advisor International Capital Appreciation Fund Class C
| | Six months ended (Unaudited) April 30, | Years endedOctober 31, | | | | |
| | 2019 | 2018 | 2017 | 2016 | 2015 | 2014 |
| Selected Per–Share Data | | | | | | |
| Net asset value, beginning of period | $15.51 | $16.95 | $13.61 | $13.69 | $13.33 | $12.63 |
| Income from Investment Operations | | | | | | |
| Net investment income (loss)A | (.03) | (.07) | (.08) | (.06) | (.06) | (.04) |
| Net realized and unrealized gain (loss) | 2.43 | (1.37) | 3.42 | (.02) | .42 | .74 |
| Total from investment operations | 2.40 | (1.44) | 3.34 | (.08) | .36 | .70 |
| Redemption fees added to paid in capitalA | – | – | –B | –B | –B | –B |
| Net asset value, end of period | $17.91 | $15.51 | $16.95 | $13.61 | $13.69 | $13.33 |
| Total ReturnC,D,E | 15.47% | (8.50)% | 24.54% | (.58)% | 2.70% | 5.54% |
| Ratios to Average Net AssetsF,G | | | | | | |
| Expenses before reductions | 1.99%H | 2.04% | 2.13% | 2.27% | 2.33% | 2.47% |
| Expenses net of fee waivers, if any | 1.99%H | 2.04% | 2.12% | 2.20% | 2.20% | 2.20% |
| Expenses net of all reductions | 1.96%H | 1.99% | 2.10% | 2.18% | 2.17% | 2.19% |
| Net investment income (loss) | (.42)%H | (.40)% | (.54)% | (.41)% | (.45)% | (.33)% |
| Supplemental Data | | | | | | |
| Net assets, end of period (000 omitted) | $105,500 | $107,858 | $85,022 | $42,146 | $36,491 | $20,910 |
| Portfolio turnover rateI | 160%H | 151% | 155% | 167% | 176% | 197% |
A Calculated based on average shares outstanding during the period.
B Amount represents less than $.005 per share.
C Total returns for periods of less than one year are not annualized.
D Total returns would have been lower if certain expenses had not been reduced during the applicable periods shown.
E Total returns do not include the effect of the contingent deferred sales charge.
F Fees and expenses of any underlying Fidelity Central Funds are not included in the Fund's expense ratio. The Fund indirectly bears its proportionate share of the expenses of any underlying Fidelity Central Funds.
G Expense ratios reflect operating expenses of the class. Expenses before reductions do not reflect amounts reimbursed by the investment adviser or reductions from brokerage service arrangements or reductions from other expense offset arrangements and do not represent the amount paid by the class during periods when reimbursements or reductions occur. Expenses net of fee waivers reflect expenses after reimbursement by the investment adviser but prior to reductions from brokerage service arrangements or other expense offset arrangements. Expenses net of all reductions represent the net expenses paid by the class.
H Annualized
I Amount does not include the portfolio activity of any underlying Fidelity Central Funds.
See accompanying notes which are an integral part of the financial statements.
Fidelity Advisor International Capital Appreciation Fund Class I
| | Six months ended (Unaudited) April 30, | Years endedOctober 31, | | | | |
| | 2019 | 2018 | 2017 | 2016 | 2015 | 2014 |
| Selected Per–Share Data | | | | | | |
| Net asset value, beginning of period | $18.85 | $20.44 | $16.30 | $16.28 | $15.75 | $14.87 |
| Income from Investment Operations | | | | | | |
| Net investment income (loss)A | .06 | .13 | .09 | .10 | .09 | .10 |
| Net realized and unrealized gain (loss) | 2.96 | (1.68) | 4.11 | (.04) | .51 | .87 |
| Total from investment operations | 3.02 | (1.55) | 4.20 | .06 | .60 | .97 |
| Distributions from net investment income | (.10) | (.04) | (.06) | (.04) | (.07) | (.09) |
| Total distributions | (.10) | (.04) | (.06) | (.04) | (.07) | (.09) |
| Redemption fees added to paid in capitalA | – | – | –B | –B | –B | –B |
| Net asset value, end of period | $21.77 | $18.85 | $20.44 | $16.30 | $16.28 | $15.75 |
| Total ReturnC,D | 16.10% | (7.58)% | 25.87% | .36% | 3.80% | 6.58% |
| Ratios to Average Net AssetsE,F | | | | | | |
| Expenses before reductions | .97%G | 1.02% | 1.09% | 1.21% | 1.27% | 1.38% |
| Expenses net of fee waivers, if any | .97%G | 1.02% | 1.08% | 1.20% | 1.20% | 1.20% |
| Expenses net of all reductions | .94%G | .96% | 1.06% | 1.18% | 1.17% | 1.20% |
| Net investment income (loss) | .61%G | .63% | .50% | .59% | .55% | .67% |
| Supplemental Data | | | | | | |
| Net assets, end of period (000 omitted) | $1,504,037 | $1,115,089 | $652,774 | $169,594 | $72,421 | $18,449 |
| Portfolio turnover rateH | 160%G | 151% | 155% | 167% | 176% | 197% |
A Calculated based on average shares outstanding during the period.
B Amount represents less than $.005 per share.
C Total returns for periods of less than one year are not annualized.
D Total returns would have been lower if certain expenses had not been reduced during the applicable periods shown.
E Fees and expenses of any underlying Fidelity Central Funds are not included in the Fund's expense ratio. The Fund indirectly bears its proportionate share of the expenses of any underlying Fidelity Central Funds.
F Expense ratios reflect operating expenses of the class. Expenses before reductions do not reflect amounts reimbursed by the investment adviser or reductions from brokerage service arrangements or reductions from other expense offset arrangements and do not represent the amount paid by the class during periods when reimbursements or reductions occur. Expenses net of fee waivers reflect expenses after reimbursement by the investment adviser but prior to reductions from brokerage service arrangements or other expense offset arrangements. Expenses net of all reductions represent the net expenses paid by the class.
G Annualized
H Amount does not include the portfolio activity of any underlying Fidelity Central Funds.
See accompanying notes which are an integral part of the financial statements.
Fidelity Advisor International Capital Appreciation Fund Class Z
| | Six months ended (Unaudited) April 30, | Years endedOctober 31, | |
| | 2019 | 2018 | 2017 A |
| Selected Per–Share Data | | | |
| Net asset value, beginning of period | $18.88 | $20.46 | $16.22 |
| Income from Investment Operations | | | |
| Net investment income (loss)B | .07 | .16 | .06 |
| Net realized and unrealized gain (loss) | 2.96 | (1.68) | 4.18 |
| Total from investment operations | 3.03 | (1.52) | 4.24 |
| Distributions from net investment income | (.12) | (.06) | – |
| Total distributions | (.12) | (.06) | – |
| Redemption fees added to paid in capitalB | – | – | –C |
| Net asset value, end of period | $21.79 | $18.88 | $20.46 |
| Total ReturnD,E | 16.18% | (7.46)% | 26.14% |
| Ratios to Average Net AssetsF,G | | | |
| Expenses before reductions | .84%H | .89% | .96%H |
| Expenses net of fee waivers, if any | .84%H | .89% | .96%H |
| Expenses net of all reductions | .81%H | .83% | .94%H |
| Net investment income (loss) | .73%H | .76% | .42%H |
| Supplemental Data | | | |
| Net assets, end of period (000 omitted) | $290,367 | $153,913 | $59,734 |
| Portfolio turnover rateI | 160%H | 151% | 155% |
A For the period February 1, 2017 (commencement of sale of shares) to October 31, 2017.
B Calculated based on average shares outstanding during the period.
C Amount represents less than $.005 per share.
D Total returns for periods of less than one year are not annualized.
E Total returns would have been lower if certain expenses had not been reduced during the applicable periods shown.
F Fees and expenses of any underlying Fidelity Central Funds are not included in the Fund's expense ratio. The Fund indirectly bears its proportionate share of the expenses of any underlying Fidelity Central Funds.
G Expense ratios reflect operating expenses of the class. Expenses before reductions do not reflect amounts reimbursed by the investment adviser or reductions from brokerage service arrangements or reductions from other expense offset arrangements and do not represent the amount paid by the class during periods when reimbursements or reductions occur. Expense ratios before reductions for start-up periods may not be representative of longer-term operating periods. Expenses net of fee waivers reflect expenses after reimbursement by the investment adviser but prior to reductions from brokerage service arrangements or other expense offset arrangements. Expenses net of all reductions represent the net expenses paid by the class.
H Annualized
I Amount does not include the portfolio activity of any underlying Fidelity Central Funds.
See accompanying notes which are an integral part of the financial statements.
Notes to Financial Statements (Unaudited)
For the period ended April 30, 2019
1. Organization.
Fidelity Advisor International Capital Appreciation Fund (the Fund) is a fund of Fidelity Advisor Series VIII (the Trust) and is authorized to issue an unlimited number of shares. The Trust is registered under the Investment Company Act of 1940, as amended (the 1940 Act), as an open-end management investment company organized as a Massachusetts business trust. The Fund offers Class A, Class M, Class C, Class I and Class Z shares, each of which has equal rights as to assets and voting privileges. Each class has exclusive voting rights with respect to matters that affect that class. Effective March 1, 2019, Class C shares will automatically convert to Class A shares after a holding period of ten years from the initial date of purchase, with certain exceptions. The Fund's investments in emerging markets can be subject to social, economic, regulatory, and political uncertainties and can be extremely volatile.
2. Investments in Fidelity Central Funds.
The Fund invests in Fidelity Central Funds, which are open-end investment companies generally available only to other investment companies and accounts managed by the investment adviser and its affiliates. The Fund's Schedule of Investments lists each of the Fidelity Central Funds held as of period end, if any, as an investment of the Fund, but does not include the underlying holdings of each Fidelity Central Fund. As an Investing Fund, the Fund indirectly bears its proportionate share of the expenses of the underlying Fidelity Central Funds.
The Money Market Central Funds seek preservation of capital and current income and are managed by Fidelity Investments Money Management, Inc. (FIMM), an affiliate of the investment adviser. Annualized expenses of the Money Market Central Funds as of their most recent shareholder report date are less than .005%.
A complete unaudited list of holdings for each Fidelity Central Fund is available upon request or at the Securities and Exchange Commission (the SEC) website at www.sec.gov. In addition, the financial statements of the Fidelity Central Funds are available on the SEC website or upon request.
3. Significant Accounting Policies.
The Fund is an investment company and applies the accounting and reporting guidance of the Financial Accounting Standards Board (FASB) Accounting Standards Codification Topic 946 Financial Services – Investments Companies. The financial statements have been prepared in conformity with accounting principles generally accepted in the United States of America (GAAP), which require management to make certain estimates and assumptions at the date of the financial statements. Actual results could differ from those estimates. Subsequent events, if any, through the date that the financial statements were issued have been evaluated in the preparation of the financial statements. The following summarizes the significant accounting policies of the Fund:
Investment Valuation. Investments are valued as of 4:00 p.m. Eastern time on the last calendar day of the period. The Board of Trustees (the Board) has delegated the day to day responsibility for the valuation of the Fund's investments to the Fair Value Committee (the Committee) established by the Fund's investment adviser. In accordance with valuation policies and procedures approved by the Board, the Fund attempts to obtain prices from one or more third party pricing vendors or brokers to value its investments. When current market prices, quotations or currency exchange rates are not readily available or reliable, investments will be fair valued in good faith by the Committee, in accordance with procedures adopted by the Board. Factors used in determining fair value vary by investment type and may include market or investment specific events. The frequency with which these procedures are used cannot be predicted and they may be utilized to a significant extent. The Committee oversees the Fund's valuation policies and procedures and reports to the Board on the Committee's activities and fair value determinations. The Board monitors the appropriateness of the procedures used in valuing the Fund's investments and ratifies the fair value determinations of the Committee.
The Fund categorizes the inputs to valuation techniques used to value its investments into a disclosure hierarchy consisting of three levels as shown below:
- Level 1 – quoted prices in active markets for identical investments
- Level 2 – other significant observable inputs (including quoted prices for similar investments, interest rates, prepayment speeds, etc.)
- Level 3 – unobservable inputs (including the Fund's own assumptions based on the best information available)
Valuation techniques used to value the Fund's investments by major category are as follows:
Equity securities, including restricted securities, for which market quotations are readily available, are valued at the last reported sale price or official closing price as reported by a third party pricing vendor on the primary market or exchange on which they are traded and are categorized as Level 1 in the hierarchy. In the event there were no sales during the day or closing prices are not available, securities are valued at the last quoted bid price or may be valued using the last available price and are generally categorized as Level 2 in the hierarchy. For foreign equity securities, when market or security specific events arise, comparisons to the valuation of American Depositary Receipts (ADRs), futures contracts, Exchange-Traded Funds (ETFs) and certain indexes as well as quoted prices for similar securities may be used and would be categorized as Level 2 in the hierarchy. For equity securities, including restricted securities, where observable inputs are limited, assumptions about market activity and risk are used and these securities may be categorized as Level 3 in the hierarchy.
Investments in open-end mutual funds, including the Fidelity Central Funds, are valued at their closing net asset value (NAV) each business day and are categorized as Level 1 in the hierarchy.
Changes in valuation techniques may result in transfers in or out of an assigned level within the disclosure hierarchy. The aggregate value of investments by input level as of April 30, 2019 is included at the end of the Fund's Schedule of Investments.
Foreign Currency. The Fund may use foreign currency contracts to facilitate transactions in foreign-denominated securities. Gains and losses from these transactions may arise from changes in the value of the foreign currency or if the counterparties do not perform under the contracts' terms.
Foreign-denominated assets, including investment securities, and liabilities are translated into U.S. dollars at the exchange rates at period end. Purchases and sales of investment securities, income and dividends received and expenses denominated in foreign currencies are translated into U.S. dollars at the exchange rate in effect on the transaction date.
The effects of exchange rate fluctuations on investments are included with the net realized and unrealized gain (loss) on investment securities. Other foreign currency transactions resulting in realized and unrealized gain (loss) are disclosed separately.
Investment Transactions and Income. For financial reporting purposes, the Fund's investment holdings and NAV include trades executed through the end of the last business day of the period. The NAV per share for processing shareholder transactions is calculated as of the close of business of the New York Stock Exchange (NYSE), normally 4:00 p.m. Eastern time and includes trades executed through the end of the prior business day. Gains and losses on securities sold are determined on the basis of identified cost and include proceeds received from litigation. Dividend income is recorded on the ex-dividend date, except for certain dividends from foreign securities where the ex-dividend date may have passed, which are recorded as soon as the Fund is informed of the ex-dividend date. Non-cash dividends included in dividend income, if any, are recorded at the fair market value of the securities received. Income and capital gain distributions from Fidelity Central Funds, if any, are recorded on the ex-dividend date. Certain distributions received by the Fund represent a return of capital or capital gain. The Fund determines the components of these distributions subsequent to the ex-dividend date, based upon receipt of tax filings or other correspondence relating to the underlying investment. These distributions are recorded as a reduction of cost of investments and/or as a realized gain. Investment income is recorded net of foreign taxes withheld where recovery of such taxes is uncertain.
Class Allocations and Expenses. Investment income, realized and unrealized capital gains and losses, common expenses of the Fund, and certain fund-level expense reductions, if any, are allocated daily on a pro-rata basis to each class based on the relative net assets of each class to the total net assets of the Fund. Each class differs with respect to transfer agent and distribution and service plan fees incurred. Certain expense reductions may also differ by class. For the reporting period, the allocated portion of income and expenses to each class as a percent of its average net assets may vary due to the timing of recording these transactions in relation to fluctuating net assets of the classes. Expenses directly attributable to a fund are charged to that fund. Expenses attributable to more than one fund are allocated among the respective funds on the basis of relative net assets or other appropriate methods. Expense estimates are accrued in the period to which they relate and adjustments are made when actual amounts are known.
Income Tax Information and Distributions to Shareholders. Each year, the Fund intends to qualify as a regulated investment company under Subchapter M of the Internal Revenue Code, including distributing substantially all of its taxable income and realized gains. As a result, no provision for U.S. Federal income taxes is required. The Fund files a U.S. federal tax return, in addition to state and local tax returns as required. The Fund's federal income tax returns are subject to examination by the Internal Revenue Service (IRS) for a period of three fiscal years after they are filed. State and local tax returns may be subject to examination for an additional fiscal year depending on the jurisdiction. Foreign taxes are provided for based on the Fund's understanding of the tax rules and rates that exist in the foreign markets in which it invests. The Fund is subject to a tax imposed on capital gains by certain countries in which it invests. An estimated deferred tax liability for net unrealized appreciation on the applicable securities is included in Other payables and accrued expenses on the Statement of Assets & Liabilities.
Distributions are declared and recorded on the ex-dividend date. Income and capital gain distributions are declared separately for each class. Income and capital gain distributions are determined in accordance with income tax regulations, which may differ from GAAP.
Capital accounts within the financial statements are adjusted for permanent book-tax differences. These adjustments have no impact on net assets or the results of operations. Capital accounts are not adjusted for temporary book-tax differences which will reverse in a subsequent period.
Book-tax differences are primarily due to foreign currency transactions, certain foreign taxes, passive foreign investment companies (PFIC), capital loss carryforwards and losses deferred due to wash sales.
As of period end, the cost and unrealized appreciation (depreciation) in securities, and derivatives if applicable, for federal income tax purposes were as follows:
| Gross unrealized appreciation | $338,793,449 |
| Gross unrealized depreciation | (11,915,077) |
| Net unrealized appreciation (depreciation) | $326,878,372 |
| Tax Cost | $1,917,906,405 |
Capital loss carryforwards are only available to offset future capital gains of the Fund to the extent provided by regulations and may be limited. Under the Regulated Investment Company Modernization Act of 2010 (the Act), the Fund is permitted to carry forward capital losses incurred in taxable years beginning after December 22, 2010 for an unlimited period and such capital losses are required to be used prior to any losses that expire. The capital loss carryforward information presented below, including any applicable limitation, is estimated as of fiscal period end and is subject to adjustment.
| No expiration | |
| Short-term | $(33,526,260) |
Delayed Delivery Transactions and When-Issued Securities. During the period, the Fund transacted in securities on a delayed delivery or when-issued basis. Payment and delivery may take place after the customary settlement period for that security. The price of the underlying securities and the date when the securities will be delivered and paid for are fixed at the time the transaction is negotiated. The securities purchased on a delayed delivery or when-issued basis are identified as such in the Fund's Schedule of Investments. Losses may arise due to changes in the value of the underlying securities or if the counterparty does not perform under the contract's terms, or if the issuer does not issue the securities due to political, economic, or other factors.
Restricted Securities. The Fund may invest in securities that are subject to legal or contractual restrictions on resale. These securities generally may be resold in transactions exempt from registration or to the public if the securities are registered. Disposal of these securities may involve time-consuming negotiations and expense, and prompt sale at an acceptable price may be difficult. Information regarding restricted securities is included at the end of the Fund's Schedule of Investments.
4. Purchases and Sales of Investments.
Purchases and sales of securities, other than short-term securities, aggregated $1,679,355,131 and $1,442,320,912, respectively.
5. Fees and Other Transactions with Affiliates.
Management Fee. Fidelity Management & Research Company (the investment adviser) and its affiliates provide the Fund with investment management related services for which the Fund pays a monthly management fee. The management fee is the sum of an individual fund fee rate that is based on an annual rate of .45% of the Fund's average net assets and an annualized group fee rate that averaged .24% during the period. The group fee rate is based upon the average net assets of all the mutual funds advised by the investment adviser, including any mutual funds previously advised by the investment adviser that are currently advised by Fidelity SelectCo, LLC, an affiliate of the investment adviser. The group fee rate decreases as assets under management increase and increases as assets under management decrease. In addition, the management fee is subject to a performance adjustment (up to a maximum of +/- .20% of the Fund's average net assets over a 36 month performance period). The upward or downward adjustment to the management fee is based on the relative investment performance of Class I of the Fund as compared to its benchmark index, the MSCI All Country World ex USA Index, over the same 36 month performance period. For the reporting period, the total annualized management fee rate, including the performance adjustment, was .71% of the Fund's average net assets. The performance adjustment included in the management fee rate may be higher or lower than the maximum performance adjustment rate due to the difference between the average net assets for the reporting and performance periods.
Distribution and Service Plan Fees. In accordance with Rule 12b-1 of the 1940 Act, the Fund has adopted separate Distribution and Service Plans for each class of shares. Certain classes pay Fidelity Distributors Corporation (FDC), an affiliate of the investment adviser, separate Distribution and Service Fees, each of which is based on an annual percentage of each class' average net assets. In addition, FDC may pay financial intermediaries for selling shares of the Fund and providing shareholder support services. For the period, the Distribution and Service Fee rates, total fees and amounts retained by FDC were as follows:
| | Distribution Fee | Service Fee | Total Fees | Retained by FDC |
| Class A | -% | .25% | $245,675 | $20,236 |
| Class M | .25% | .25% | 228,078 | 3,018 |
| Class C | .75% | .25% | 535,447 | 148,865 |
| | | | $1,009,200 | $172,119 |
Sales Load. FDC may receive a front-end sales charge of up to 5.75% for selling Class A shares and 3.50% for selling Class M shares, some of which is paid to financial intermediaries for selling shares of the Fund. Depending on the holding period, FDC may receive contingent deferred sales charges levied on Class A, Class M and Class C redemptions. The deferred sales charges are 1.00% for Class C shares, 1.00% for certain purchases of Class A shares and .25% for certain purchases of Class M shares.
For the period, sales charge amounts retained by FDC were as follows:
| | Retained by FDC |
| Class A | $87,554 |
| Class M | 6,237 |
| Class C(a) | 16,374 |
| | $110,165 |
(a) When Class C shares are initially sold, FDC pays commissions from its own resources to financial intermediaries through which the sales are made.
Transfer Agent Fees. Fidelity Investments Institutional Operations Company, Inc., (FIIOC), an affiliate of the investment adviser, is the transfer, dividend disbursing and shareholder servicing agent for each class of the Fund. FIIOC receives account fees and asset-based fees that vary according to the account size and type of account of the shareholders of the respective classes of the Fund, except for Class Z. FIIOC receives an asset-based fee of Class Z's average net assets. FIIOC pays for typesetting, printing and mailing of shareholder reports, except proxy statements.
For the period, transfer agent fees for each class were as follows:
| | Amount | % of Class-Level Average Net Assets(a) |
| Class A | $196,402 | .20 |
| Class M | 96,281 | .21 |
| Class C | 105,195 | .20 |
| Class I | 1,039,814 | .17 |
| Class Z | 45,991 | .05 |
| | $1,483,683 | |
(a) Annualized
Accounting and Security Lending Fees. Fidelity Service Company, Inc. (FSC), an affiliate of the investment adviser, maintains the Fund's accounting records. The accounting fee is based on the level of average net assets for each month. Prior to April 1, 2019, FSC had a separate agreement with the Fund for administration of the security lending program, based on the number and duration of lending transactions. For the period, the total fees paid for accounting and administration of securities lending were equivalent to an annualized rate of .04%.
Brokerage Commissions. The Fund placed a portion of its portfolio transactions with brokerage firms which are affiliates of the investment adviser. Brokerage commissions are included in net realized gain (loss) and change in net unrealized appreciation (depreciation) in the Statement of Operations. The commissions paid to these affiliated firms were $8,140 for the period.
Interfund Lending Program. Pursuant to an Exemptive Order issued by the SEC, the Fund, along with other registered investment companies having management contracts with Fidelity Management & Research Company (FMR) or other affiliated entities of FMR, may participate in an interfund lending program. This program provides an alternative credit facility allowing the funds to borrow from, or lend money to, other participating affiliated funds. At period end, there were no interfund loans outstanding. The Fund's activity in this program during the period for which loans were outstanding was as follows:
| Borrower or Lender | Average Loan Balance | Weighted Average Interest Rate | Interest Expense |
| Borrower | $17,295,652 | 2.57% | $28,438 |
Interfund Trades. The Fund may purchase from or sell securities to other Fidelity Funds under procedures adopted by the Board. The procedures have been designed to ensure these interfund trades are executed in accordance with Rule 17a-7 of the 1940 Act. Interfund trades are included within the respective purchases and sales amounts shown in the Purchases and Sales of Investments note.
6. Committed Line of Credit.
The Fund participates with other funds managed by the investment adviser or an affiliate in a $4.25 billion credit facility (the "line of credit") to be utilized for temporary or emergency purposes to fund shareholder redemptions or for other short-term liquidity purposes. The Fund has agreed to pay commitment fees on its pro-rata portion of the line of credit, which amounted to $2,495 and is reflected in Miscellaneous expenses on the Statement of Operations. During the period, the Fund did not borrow on this line of credit.
7. Security Lending.
The Fund lends portfolio securities through a lending agent from time to time in order to earn additional income. For equity securities, a lending agent is used and may loan securities to certain qualified borrowers, including Fidelity Capital Markets (FCM), a broker-dealer affiliated with the Fund. On the settlement date of the loan, the Fund receives collateral (in the form of U.S. Treasury obligations, letters of credit and/or cash) against the loaned securities and maintains collateral in an amount not less than 100% of the market value of the loaned securities during the period of the loan. The market value of the loaned securities is determined at the close of business of the Fund and any additional required collateral is delivered to the Fund on the next business day. The Fund or borrower may terminate the loan at any time, and if the borrower defaults on its obligation to return the securities loaned because of insolvency or other reasons, the Fund may apply collateral received from the borrower against the obligation. The Fund may experience delays and costs in recovering the securities loaned. Any cash collateral received is invested in the Fidelity Securities Lending Cash Central Fund. The value of loaned securities and cash collateral at period end are disclosed on the Fund's Statement of Assets and Liabilities. The value of securities loaned to FCM at period end was $5,993,507. Security lending income represents the income earned on investing cash collateral, less rebates paid to borrowers and any lending agent fees associated with the loan, plus any premium payments received for lending certain types of securities. Security lending income is presented in the Statement of Operations as a component of income from Fidelity Central Funds. Total security lending income during the period amounted to $398,869, including $61,160 from securities loaned to FCM.
8. Expense Reductions.
Commissions paid to certain brokers with whom the investment adviser, or its affiliates, places trades on behalf of the Fund include an amount in addition to trade execution, which may be rebated back to the Fund to offset certain expenses. This amount totaled $263,382 for the period. In addition, through arrangements with the Fund's custodian, credits realized as a result of certain uninvested cash balances were used to reduce the Fund's expenses. During the period, these credits reduced the Fund's custody expenses by $1,586.
In addition, during the period the investment adviser reimbursed and/or waived a portion of fund-level operating expenses in the amount of $6,283.
9. Distributions to Shareholders.
Distributions to shareholders of each class were as follows:
| | Six months ended
April 30, 2019 | Year ended
October 31, 2018 |
| Distributions to shareholders | | |
| Class A | $402,278 | $85,926 |
| Class I | 5,699,242 | 1,520,196 |
| Class Z | 1,016,176 | 194,282 |
| Total | $7,117,696 | $1,800,404 |
10. Share Transactions.
Share transactions for each class were as follows and may contain automatic conversions between classes or exchanges between affiliated funds:
| | Shares | Shares | Dollars | Dollars |
| | Six months ended April 30, 2019 | Year ended October 31, 2018 | Six months ended April 30, 2019 | Year ended October 31, 2018 |
| Class A | | | | |
| Shares sold | 2,541,906 | 5,619,393 | $47,960,943 | $111,188,105 |
| Reinvestment of distributions | 22,478 | 4,343 | 392,018 | 84,071 |
| Shares redeemed | (2,016,657) | (3,921,150) | (36,499,477) | (75,740,806) |
| Net increase (decrease) | 547,727 | 1,702,586 | $11,853,484 | $35,531,370 |
| Class M | | | | |
| Shares sold | 478,537 | 1,392,282 | $8,585,631 | $26,802,724 |
| Shares redeemed | (530,601) | (915,804) | (9,360,855) | (17,480,449) |
| Net increase (decrease) | (52,064) | 476,478 | $(775,224) | $9,322,275 |
| Class C | | | | |
| Shares sold | 859,288 | 3,456,992 | $13,817,200 | $60,466,658 |
| Shares redeemed | (1,925,303) | (1,517,181) | (31,697,247) | (25,987,529) |
| Net increase (decrease) | (1,066,015) | 1,939,811 | $(17,880,047) | $34,479,129 |
| Class I | | | | |
| Shares sold | 27,564,714 | 42,034,960 | $542,542,452 | $884,843,888 |
| Reinvestment of distributions | 250,184 | 64,781 | 4,653,416 | 1,337,720 |
| Shares redeemed | (17,887,825) | (14,886,018) | (344,009,936) | (307,898,733) |
| Net increase (decrease) | 9,927,073 | 27,213,723 | $203,185,932 | $578,282,875 |
| Class Z | | | | |
| Shares sold | 7,030,389 | 6,965,818 | $140,947,434 | $144,277,729 |
| Reinvestment of distributions | 38,432 | 6,285 | 715,226 | 129,857 |
| Shares redeemed | (1,895,485) | (1,739,970) | (36,598,472) | (35,948,108) |
| Net increase (decrease) | 5,173,336 | 5,232,133 | $105,064,188 | $108,459,478 |
11. Other.
The Fund's organizational documents provide former and current trustees and officers with a limited indemnification against liabilities arising in connection with the performance of their duties to the Fund. In the normal course of business, the Fund may also enter into contracts that provide general indemnifications. The Fund's maximum exposure under these arrangements is unknown as this would be dependent on future claims that may be made against the Fund. The risk of material loss from such claims is considered remote.
Shareholder Expense Example
As a shareholder of the Fund, you incur two types of costs: (1) transaction costs, including sales charges (loads) on purchase payments or redemption proceeds, and (2) ongoing costs, including management fees, distribution and/or service (12b-1) fees and other Fund expenses. This Example is intended to help you understand your ongoing costs (in dollars) of investing in the Fund and to compare these costs with the ongoing costs of investing in other mutual funds.
The Example is based on an investment of $1,000 invested at the beginning of the period and held for the entire period (November 1, 2018 to April 30, 2019).
Actual Expenses
The first line of the accompanying table for each class of the Fund provides information about actual account values and actual expenses. You may use the information in this line, together with the amount you invested, to estimate the expenses that you paid over the period. Simply divide your account value by $1,000.00 (for example, an $8,600 account value divided by $1,000.00 = 8.6), then multiply the result by the number in the first line for a class of the Fund under the heading entitled "Expenses Paid During Period" to estimate the expenses you paid on your account during this period. In addition, the Fund, as a shareholder in the underlying Fidelity Central Funds, will indirectly bear its pro-rata share of the fees and expenses incurred by the underlying Fidelity Central Funds. These fees and expenses are not included in the Fund's annualized expense ratio used to calculate the expense estimate in the table below.
Hypothetical Example for Comparison Purposes
The second line of the accompanying table for each class of the Fund provides information about hypothetical account values and hypothetical expenses based on a Class' actual expense ratio and an assumed rate of return of 5% per year before expenses, which is not the Class' actual return. The hypothetical account values and expenses may not be used to estimate the actual ending account balance or expenses you paid for the period. You may use this information to compare the ongoing costs of investing in the Fund and other funds. To do so, compare this 5% hypothetical example with the 5% hypothetical examples that appear in the shareholder reports of the other funds. In addition, the Fund, as a shareholder in the underlying Fidelity Central Funds, will indirectly bear its pro-rata share of the fees and expenses incurred by the underlying Fidelity Central Funds. These fees and expenses are not included in the Fund's annualized expense ratio used to calculate the expense estimate in the table below.
Please note that the expenses shown in the table are meant to highlight your ongoing costs only and do not reflect any transaction costs. Therefore, the second line of the table is useful in comparing ongoing costs only, and will not help you determine the relative total costs of owning different funds. In addition, if these transactional costs were included, your costs would have been higher.
| | Annualized Expense Ratio-A | Beginning
Account Value
November 1, 2018 | Ending
Account Value
April 30, 2019 | Expenses Paid
During Period-B
November 1, 2018
to April 30, 2019 |
| Class A | 1.25% | | | |
| Actual | | $1,000.00 | $1,159.60 | $6.69 |
| Hypothetical-C | | $1,000.00 | $1,018.60 | $6.26 |
| Class M | 1.51% | | | |
| Actual | | $1,000.00 | $1,158.40 | $8.08 |
| Hypothetical-C | | $1,000.00 | $1,017.31 | $7.55 |
| Class C | 1.99% | | | |
| Actual | | $1,000.00 | $1,154.70 | $10.63 |
| Hypothetical-C | | $1,000.00 | $1,014.93 | $9.94 |
| Class I | .97% | | | |
| Actual | | $1,000.00 | $1,161.00 | $5.20 |
| Hypothetical-C | | $1,000.00 | $1,019.98 | $4.86 |
| Class Z | .84% | | | |
| Actual | | $1,000.00 | $1,161.80 | $4.50 |
| Hypothetical-C | | $1,000.00 | $1,020.63 | $4.21 |
A Annualized expense ratio reflects expenses net of applicable fee waivers.
B Expenses are equal to each Class' annualized expense ratio, multiplied by the average account value over the period, multiplied by 181/365 (to reflect the one-half year period).
C 5% return per year before expenses
Board Approval of Investment Advisory Contracts and Management Fees
Fidelity Advisor International Capital Appreciation Fund
Each year, the Board of Trustees, including the Independent Trustees (together, the Board), votes on the renewal of the management contract with Fidelity Management & Research Company (FMR) and the sub-advisory agreements (together, the Advisory Contracts) for the fund. FMR and the sub-advisers are referred to herein as the Investment Advisers. The Board, assisted by the advice of fund counsel and Independent Trustees' counsel, requests and considers a broad range of information relevant to the renewal of the Advisory Contracts throughout the year.
The Board meets regularly and, at each of its meetings, covers an extensive agenda of topics and materials and considers factors that are relevant to its annual consideration of the renewal of the fund's Advisory Contracts, including the services and support provided to the fund and its shareholders. The Board has established various standing committees (Committees), each composed of and chaired by Independent Trustees with varying backgrounds, to which the Board has assigned specific subject matter responsibilities in order to enhance effective decision-making by the Board. The Board, acting directly and through its Committees, requests and receives information concerning the annual consideration of the renewal of the fund's Advisory Contracts. The Board also meets as needed to review matters specifically related to the Board's annual consideration of the renewal of the Advisory Contracts. Members of the Board may also meet with trustees of other Fidelity funds through joint ad hoc committees to discuss certain matters relevant to all of the Fidelity funds.
At its January 2019 meeting, the Board unanimously determined to renew the fund's Advisory Contracts. In reaching its determination, the Board considered all factors it believed relevant, including (i) the nature, extent, and quality of the services to be provided to the fund and its shareholders (including the investment performance of the fund); (ii) the competitiveness of the fund's management fee and total expense ratio relative to peer funds; (iii) the total costs of the services to be provided by and the profits to be realized by Fidelity from its relationships with the fund; and (iv) the extent to which, if any, economies of scale exist and would be realized as the fund grows, and whether any economies of scale are appropriately shared with fund shareholders.
In considering whether to renew the Advisory Contracts for the fund, the Board reached a determination, with the assistance of fund counsel and Independent Trustees' counsel and through the exercise of its business judgment, that the renewal of the Advisory Contracts was in the best interests of the fund and its shareholders and that the compensation payable under the Advisory Contracts was fair and reasonable. The Board's decision to renew the Advisory Contracts was not based on any single factor, but rather was based on a comprehensive consideration of all the information provided to the Board at its meetings throughout the year. The Board, in reaching its determination to renew the Advisory Contracts, was aware that shareholders of the fund have a broad range of investment choices available to them, including a wide choice among funds offered by Fidelity's competitors, and that the fund's shareholders, who have the opportunity to review and weigh the disclosure provided by the fund in its prospectus and other public disclosures, have chosen to invest in this fund, which is part of the Fidelity family of funds.
Nature, Extent, and Quality of Services Provided. The Board considered Fidelity's staffing as it relates to the fund, including the backgrounds of investment personnel of Fidelity, and also considered the fund's investment objective, strategies, and related investment philosophy. The Independent Trustees also had discussions with senior management of Fidelity's investment operations and investment groups. The Board considered the structure of the investment personnel compensation program and whether this structure provides appropriate incentives to act in the best interests of the fund. Additionally, the Board considered the portfolio managers' investments, if any, in the funds that they manage.
Resources Dedicated to Investment Management and Support Services. The Board and the Fund Oversight and Research Committees reviewed the general qualifications and capabilities of Fidelity's investment staff, including its size, education, experience, and resources, as well as Fidelity's approach to recruiting, training, managing, and compensating investment personnel. The Board noted that Fidelity has continued to increase the resources devoted to non-U.S. offices, including expansion of Fidelity's global investment organization. The Board also noted that Fidelity's analysts have extensive resources, tools and capabilities that allow them to conduct sophisticated quantitative and fundamental analysis, as well as credit analysis of issuers, counterparties and guarantors. Further, the Board considered that Fidelity's investment professionals have sufficient access to global information and data so as to provide competitive investment results over time, and that those professionals also have access to sophisticated tools that permit them to assess portfolio construction and risk and performance attribution characteristics continuously, as well as to transmit new information and research conclusions rapidly around the world. Additionally, in its deliberations, the Board considered Fidelity's trading, risk management, compliance, and technology and operations capabilities and resources, which are integral parts of the investment management process.
Shareholder and Administrative Services. The Board considered (i) the nature, extent, quality, and cost of advisory, administrative, and shareholder services performed by the Investment Advisers and their affiliates under the Advisory Contracts and under separate agreements covering transfer agency, pricing and bookkeeping, and securities lending services for the fund; (ii) the nature and extent of the supervision of third party service providers, principally custodians, subcustodians, and pricing vendors; and (iii) the resources devoted to, and the record of compliance with, the fund's compliance policies and procedures. The Board also reviewed the allocation of fund brokerage, including allocations to brokers affiliated with the Investment Advisers, the use of brokerage commissions to pay fund expenses, and the use of "soft" commission dollars to pay for research services.
The Board noted that the growth of fund assets over time across the complex allows Fidelity to reinvest in the development of services designed to enhance the value and convenience of the Fidelity funds as investment vehicles. These services include 24-hour access to account information and market information through telephone representatives and over the Internet, investor education materials and asset allocation tools, and the expanded availability of Fidelity Investor Centers.
The Board noted that it and the boards of certain other Fidelity funds had formed an ad hoc Committee on Transfer Agency Fees to review the variety of transfer agency fee structures throughout the industry and Fidelity's competitive positioning with respect to industry participants.
Investment in a Large Fund Family. The Board considered the benefits to shareholders of investing in a Fidelity fund, including the benefits of investing in a fund that is part of a large family of funds offering a variety of investment disciplines and providing a large variety of mutual fund investor services. The Board noted that Fidelity had taken, or had made recommendations that resulted in the Fidelity funds taking, a number of actions over the previous year that benefited particular funds, including: (i) continuing to dedicate additional resources to Fidelity's investment research process, which includes meetings with management of issuers of securities in which the funds invest, and to the support of the senior management team that oversees asset management; (ii) continuing efforts to enhance Fidelity's global research capabilities; (iii) launching new funds and making other enhancements to meet client needs; (iv) launching new share classes of existing funds; (v) eliminating purchase minimums and broadening eligibility requirements for certain funds and share classes; (vi) reducing management fees and total expenses for certain growth equity funds and index funds; (vii) lowering expense caps for certain existing funds and classes, and converting certain voluntary expense caps to contractual caps, to reduce expenses borne by shareholders; (viii) eliminating short-term redemption fees for funds that had such fees; (ix) rationalizing product lines and gaining increased efficiencies from fund mergers and share class consolidations; (x) continuing to develop, acquire and implement systems and technology to improve services to the funds and shareholders, strengthen information security, and increase efficiency; and (xi) continuing to implement enhancements to further strengthen Fidelity's product line to increase investors' probability of success in achieving their investment goals, including retirement income goals.
Investment Performance. The Board considered whether the fund has operated in accordance with its investment objective, as well as its record of compliance with its investment restrictions and its performance history.
The Board took into account discussions that occur at Board meetings throughout the year with representatives of the Investment Advisers about fund investment performance. In this regard the Board noted that as part of regularly scheduled fund reviews and other reports to the Board on fund performance, the Board considers annualized return information for the fund for different time periods, measured against an appropriate securities market index ("benchmark index") and a peer group of funds with similar objectives ("peer group"), if any. In its evaluation of fund investment performance, the Board gave particular attention to information indicating changes in performance of certain Fidelity funds for specific time periods and discussed with the Investment Advisers the reasons for any overperformance or underperformance.
In addition to reviewing absolute and relative fund performance, the Independent Trustees periodically consider the appropriateness of fund performance metrics in evaluating the results achieved. In general, the Independent Trustees believe that fund performance should be evaluated based on net performance (after fees and expenses) of both the highest performing and lowest performing fund share classes, where applicable, compared to appropriate benchmark indices, over appropriate time periods that may include full market cycles, and compared to peer groups, as applicable, over the same periods, taking into account relevant factors including the following: general market conditions; issuer-specific information; and fund cash flows and other factors.
The Independent Trustees recognize that shareholders evaluate performance on a net basis over their own holding periods, for which one-, three-, and five-year periods are often used as a proxy. For this reason, the performance information reviewed by the Board also included net cumulative total return information for the fund and an appropriate benchmark index and peer group for the most recent one-, three-, and five-year periods ended June 30, 2018, as shown below. Returns are shown compared to the 25th percentile (top of box, 75% beaten) and 75th percentile (bottom of box, 25% beaten) of the peer universe. Returns of the benchmark index are "net MA,"
i.e., adjusted for tax withholding rates applicable to U.S.-based funds organized as Massachusetts business trusts.
Fidelity Advisor International Capital Appreciation Fund
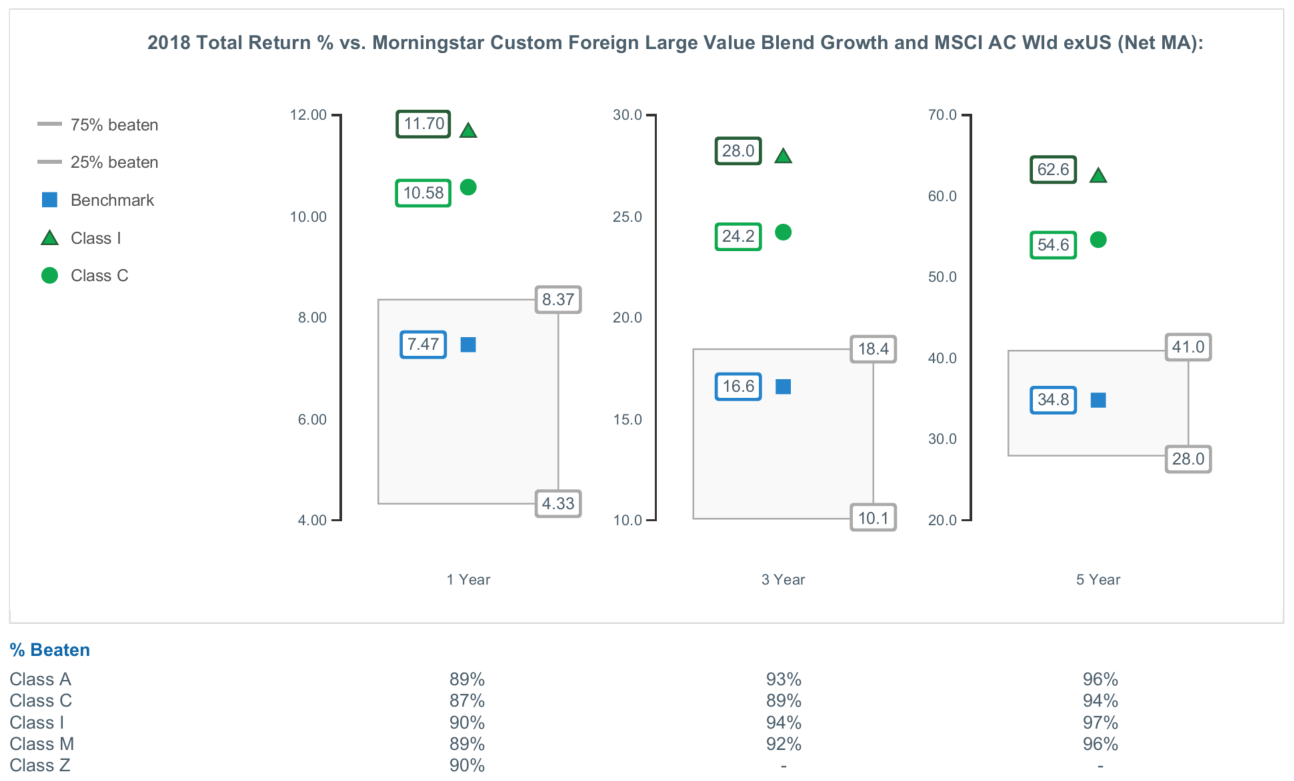
The Board also considered that the fund's management fee is subject to upward or downward adjustment depending upon whether, and to what extent, the fund's investment performance for the performance period (a rolling 36-month period) exceeds, or is exceeded by, a securities index, thus leading to a performance adjustment for the same period. The Board noted that the performance adjustment provides FMR with a strong economic incentive to seek to achieve superior long-term performance for the fund's shareholders and helps to more closely align the interests of FMR and the shareholders of the fund.
Based on its review, the Board concluded that the nature, extent, and quality of services provided to the fund under the Advisory Contracts should continue to benefit the shareholders of the fund.
Competitiveness of Management Fee and Total Expense Ratio. The Board considered the fund's management fee and total expense ratio compared to "mapped groups" of competitive funds and classes created for the purpose of facilitating the Trustees' competitive analysis of management fees and total expenses. Fidelity creates "mapped groups" by combining similar Lipper investment objective categories that have comparable investment mandates. Combining Lipper investment objective categories aids the Board's management fee and total expense ratio comparisons by broadening the competitive group used for comparison.
Management Fee. The Board considered two proprietary management fee comparisons for the 12-month periods (ended June 30 for 2018 and December 31 for prior periods) shown in basis points (BP) in the chart below. The group of Lipper funds used by the Board for management fee comparisons is referred to below as the "Total Mapped Group." The Total Mapped Group comparison focuses on a fund's standing in terms of gross management fees before expense reimbursements or caps, and without giving effect to the fund's performance adjustment, relative to the total universe of funds with comparable investment mandates, regardless of whether their management fee structures also are comparable. Funds with comparable investment mandates offer exposure to similar types of securities. Funds with comparable management fee structures have similar management fee contractual arrangements (
e.g., flat rate charged for advisory services, all-inclusive fee rate,
etc.). "TMG %" represents the percentage of funds in the Total Mapped Group that had management fees that were lower than the fund's. For example, a hypothetical TMG % of 20% would mean that 80% of the funds in the Total Mapped Group had higher, and 20% had lower, management fees than the fund. The fund's actual TMG %s and the number of funds in the Total Mapped Group are in the chart below. The "Asset-Size Peer Group" (ASPG) comparison focuses on a fund's standing relative to a subset of non-Fidelity funds within the Total Mapped Group that are similar in size and management fee structure without taking into account performance adjustments, if any. For example, if a fund is in the first quartile of the ASPG, the fund's management fee ranks in the least expensive or lowest 25% of funds in the ASPG. The ASPG represents at least 15% of the funds in the Total Mapped Group with comparable asset size and management fee structures, subject to a minimum of 50 funds (or all funds in the Total Mapped Group if fewer than 50). Additional information, such as the ASPG quartile in which the fund's management fee rate ranked and the impact of the fund's performance adjustment, is also included in the chart and was considered by the Board.
Fidelity Advisor International Capital Appreciation Fund
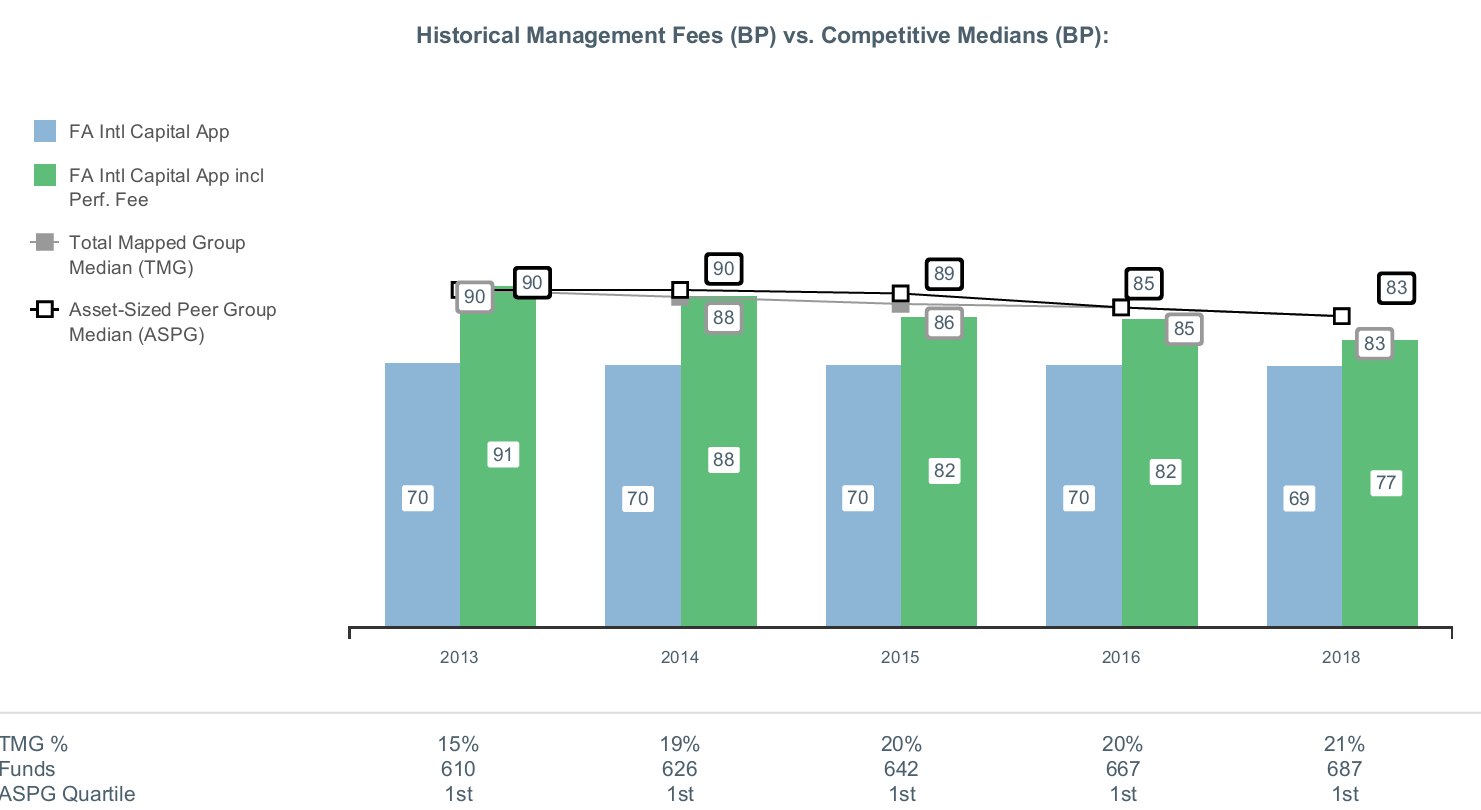
The Board noted that the fund's management fee rate ranked below the median of its Total Mapped Group and below the median of its ASPG for the 12-month period ended June 30, 2018. The Board also noted the effect of the fund's performance adjustment, if any, on the fund's management fee ranking.
The Board noted that it and the boards of other Fidelity funds formed an ad hoc Committee on Group Fee, which meets periodically, to conduct an in-depth review of the "group fee" component of the management fee of funds with such management fee structures. The Committee's focus included the mechanics of the group fee, the competitive landscape of group fee structures, Fidelity funds with no group fee component and investment products not included in group fee assets. The Board also considered that, for funds subject to the group fee, FMR agreed to voluntarily waive fees over a specified period of time in amounts designed to account for assets converted from certain funds to certain collective investment trusts.
The Board also noted that, in 2013, the ad hoc Committee on Management Fees was formed to conduct an in-depth review of the management fee rates of Fidelity's active equity mutual funds. The Committee focused on the following areas: (i) standard fee structures; (ii) research consumption and trading evolution; (iii) management fee competitiveness/profitability by category; and (iv) factors that drive institutional pricing.
Based on its review, the Board concluded that the fund's management fee is fair and reasonable in light of the services that the fund receives and the other factors considered.
Total Expense Ratio. In its review of each class's total expense ratio, the Board considered the fund's management fee rate as well as other fund or class expenses, as applicable, such as transfer agent fees, pricing and bookkeeping fees, fund-paid 12b-1 fees, and custodial, legal, and audit fees. The Board noted the impact of the fund's performance adjustment. The Board also noted that Fidelity may agree to waive fees and expenses from time to time, and the extent to which, if any, it has done so for the fund. As part of its review, the Board also considered the current and historical total expense ratios of each class of the fund compared to competitive fund median expenses. Each class of the fund is compared to those funds and classes in the Total Mapped Group (used by the Board for management fee comparisons) that have a similar sales load structure.
The Board noted that the total expense ratio of Class Z ranked below the competitive median for the 12-month period ended June 30, 2018, and the total expense ratio of each of Class A, Class M, Class C, and Class I ranked above the competitive median for the 12-month period ended June 30, 2018. The Board considered that, in general, various factors can affect total expense ratios. The Board noted that the total expense ratio of Class A was above the competitive median because of positive performance fees. Excluding performance fees, the total expense ratio of Class A ranked below the median. The Board noted that the total expense ratio of Class M was above the competitive median primarily because of higher 12b-1 fees on Class M as compared to most competitor funds. Class M has a higher 12b-1 fee, but a lower front-end sales charge, than traditionally priced front-end sales charge classes. The Board considered that Class M is primarily sold load-waived to retirement plans and intermediary wrap programs where its 0.50% 12b-1 fee is comparable to competing no-load, higher 12b-1 fee classes designed specifically for retirement plans and wrap programs. The Board noted that the total expense ratio of Class C was above the competitive median primarily because of its 1.00% 12b-1 fee. The Board noted that, although Class I is categorized by Lipper as an institutional class, Class I has a significantly lower investment minimum than most other funds and classes categorized as institutional. As a result, FMR believes Class I is generally more comparable to retail funds and classes. The Board noted that the fund offers multiple classes, each of which has a different sales load and 12b-1 fee structure, and that the multiple structures are intended to offer a range of pricing options for the intermediary market. The Board also noted that the total expense ratios of the classes vary primarily by the level of their 12b-1 fees, although differences in transfer agent fees may also cause expenses to vary from class to class.
The Board further considered that FMR has contractually agreed to reimburse Class A, Class M, Class C, Class I, and Class Z of the fund to the extent that total operating expenses, with certain exceptions, as a percentage of their respective average net assets, exceed 1.45%, 1.70%, 2.20%, 1.20%, and 1.05% through December 31, 2018.
Fees Charged to Other Fidelity Clients. The Board also considered Fidelity fee structures and other information with respect to clients of Fidelity, such as other funds advised or subadvised by Fidelity, pension plan clients, and other institutional clients with similar mandates. The Board noted that a joint ad hoc committee created by it and the boards of other Fidelity funds periodically reviews and compares Fidelity's institutional investment advisory business with its business of providing services to the Fidelity funds and also noted the most recent findings of the committee. The Board noted that the committee's review included a consideration of the differences in services provided, fees charged, and costs incurred, as well as competition in the markets serving the different categories of clients.
Based on its review of total expense ratios and fees charged to other Fidelity clients, the Board concluded that the total expense ratio of each class of the fund was reasonable in light of the services that the fund and its shareholders receive and the other factors considered.
Costs of the Services and Profitability. The Board considered the revenues earned and the expenses incurred by Fidelity in conducting the business of developing, marketing, distributing, managing, administering and servicing the fund and servicing the fund's shareholders. The Board also considered the level of Fidelity's profits in respect of all the Fidelity funds.
On an annual basis, Fidelity presents to the Board information about the profitability of its relationships with the fund. Fidelity calculates profitability information for each fund, as well as aggregate profitability information for groups of Fidelity funds and all Fidelity funds, using a series of detailed revenue and cost allocation methodologies which originate with the books and records of Fidelity on which Fidelity's audited financial statements are based. The Audit Committee of the Board reviews any significant changes from the prior year's methodologies.
PricewaterhouseCoopers LLP (PwC), auditor to Fidelity and certain Fidelity funds, has been engaged annually by the Board as part of the Board's assessment of Fidelity's profitability analysis. PwC's engagement includes the review and assessment of the methodologies used by Fidelity in determining the revenues and expenses attributable to Fidelity's mutual fund business, and completion of agreed-upon procedures in respect of the mathematical accuracy of the fund profitability information and its conformity to established allocation methodologies. After considering PwC's reports issued under the engagement and information provided by Fidelity, the Board concluded that while other allocation methods may also be reasonable, Fidelity's profitability methodologies are reasonable in all material respects.
The Board also reviewed Fidelity's non-fund businesses and potential indirect benefits such businesses may have received as a result of their association with Fidelity's mutual fund business (i.e., fall-out benefits) as well as cases where Fidelity's affiliates may benefit from the fund's business. The Board noted that changes to fall-out benefits year-over-year reflect business developments at Fidelity's various businesses.
The Board considered the costs of the services provided by and the profits realized by Fidelity in connection with the operation of the fund and was satisfied that the profitability was not excessive.
Economies of Scale. The Board considered whether there have been economies of scale in respect of the management of the Fidelity funds, whether the Fidelity funds (including the fund) have appropriately benefited from any such economies of scale, and whether there is potential for realization of any further economies of scale. The Board considered the extent to which the fund will benefit from economies of scale as assets grow through increased services to the fund, through waivers or reimbursements, or through fee or expense ratio reductions. The Board also noted that a committee (the Economies of Scale Committee) created by it and the boards of other Fidelity funds periodically analyzes whether Fidelity attains economies of scale in respect of the management and servicing of the Fidelity funds, whether the Fidelity funds have appropriately benefited from such economies of scale, and whether there is potential for realization of any further economies of scale.
The Board recognized that the fund's management contract incorporates a "group fee" structure, which provides for lower group fee rates as total group assets increase, and for higher group fee rates as total group assets decrease (with "group assets" defined to include fund assets under FMR's management plus the assets of sector funds previously under FMR's management). FMR calculates the group fee rates based on a tiered asset "breakpoint" schedule that varies based on asset class. The Board considered that the group fee is designed to deliver the benefits of economies of scale to fund shareholders when total Fidelity fund assets increase, even if assets of any particular fund are unchanged or have declined, because some portion of Fidelity's costs are attributable to services provided to all Fidelity funds, and all funds benefit if those costs can be allocated among more assets. The Board concluded that, given the group fee structure, fund shareholders will benefit from lower management fees as group assets increase at the fund complex level, regardless of whether Fidelity achieves any such economies of scale.
The Board concluded, taking into account the analysis of the Economies of Scale Committee, that economies of scale, if any, are being appropriately shared between fund shareholders and Fidelity.
Additional Information Requested by the Board. In order to develop fully the factual basis for consideration of the Fidelity funds' advisory contracts, the Board requested and received additional information on certain topics, including: (i) fund performance trends, in particular the underperformance of certain funds, and Fidelity's long-term strategies for certain funds; (ii) Fidelity's fund profitability methodology, profitability trends for certain funds, and the impact of certain factors on fund profitability results; (iii) metrics for evaluating index fund and ETF performance and information about ETF trading characteristics; (iv) the methodology with respect to the evaluation of competitive fund data and peer group classifications and fee comparisons; (v) the expense structures for different funds and classes; (vi) information regarding other accounts managed by Fidelity, including collective investment trusts; and (vii) Fidelity's philosophies and strategies for evaluating funds and classes with lower or declining asset levels.
Based on its evaluation of all of the conclusions noted above, and after considering all factors it believed relevant, the Board concluded that the advisory fee arrangements are fair and reasonable, and that the fund's Advisory Contracts should be renewed.
AICAP-SANN-0619
1.703428.121
Fidelity Advisor® Diversified International Fund
Semi-Annual Report April 30, 2019 |
|
Beginning on January 1, 2021, as permitted by regulations adopted by the Securities and Exchange Commission, paper copies of a fund’s shareholder reports will no longer be sent by mail, unless you specifically request paper copies of the reports from the fund or from your financial intermediary, such as a financial advisor, broker-dealer or bank. Instead, the reports will be made available on a website, and you will be notified by mail each time a report is posted and provided with a website link to access the report.
If you already elected to receive shareholder reports electronically, you will not be affected by this change and you need not take any action. You may elect to receive shareholder reports and other communications from a fund electronically, by contacting your financial intermediary. For Fidelity customers, visit Fidelity's web site or call Fidelity using the contact information listed below.
You may elect to receive all future reports in paper free of charge. If you wish to continue receiving paper copies of your shareholder reports, you may contact your financial intermediary or, if you are a Fidelity customer, visit Fidelity’s website, or call Fidelity at the applicable toll-free number listed below. Your election to receive reports in paper will apply to all funds held with the fund complex/your financial intermediary.
| Account Type | Website | Phone Number |
| Brokerage, Mutual Fund, or Annuity Contracts: | fidelity.com/mailpreferences | 1-800-343-3548 |
| Employer Provided Retirement Accounts: | netbenefits.fidelity.com/preferences (choose 'no' under Required Disclosures to continue to print) | 1-800-343-0860 |
| Advisor Sold Accounts Serviced Through Your Financial Intermediary: | Contact Your Financial Intermediary | Your Financial Intermediary's phone number |
| Advisor Sold Accounts Serviced by Fidelity: | institutional.fidelity.com | 1-877-208-0098 |
Contents
To view a fund's proxy voting guidelines and proxy voting record for the 12-month period ended June 30, visit http://www.fidelity.com/proxyvotingresults or visit the Securities and Exchange Commission's (SEC) web site at http://www.sec.gov.
You may also call 1-877-208-0098 to request a free copy of the proxy voting guidelines.
Standard & Poor's, S&P and S&P 500 are registered service marks of The McGraw-Hill Companies, Inc. and have been licensed for use by Fidelity Distributors Corporation.
Other third-party marks appearing herein are the property of their respective owners.
All other marks appearing herein are registered or unregistered trademarks or service marks of FMR LLC or an affiliated company. © 2019 FMR LLC. All rights reserved.
This report and the financial statements contained herein are submitted for the general information of the shareholders of the Fund. This report is not authorized for distribution to prospective investors in the Fund unless preceded or accompanied by an effective prospectus.
A fund files its complete schedule of portfolio holdings with the SEC for the first and third quarters of each fiscal year on Form N-PORT. Forms N-PORT are available on the SEC’s web site at http://www.sec.gov. A fund's Forms N-PORT may be reviewed and copied at the SEC’s Public Reference Room in Washington, DC. Information regarding the operation of the SEC's Public Reference Room may be obtained by calling 1-800-SEC-0330.
For a complete list of a fund's portfolio holdings, view the most recent holdings listing, semiannual report, or annual report on Fidelity's web site at http://www.fidelity.com, http://www.institutional.fidelity.com, or http://www.401k.com, as applicable.
NOT FDIC INSURED •MAY LOSE VALUE •NO BANK GUARANTEE
Neither the Fund nor Fidelity Distributors Corporation is a bank.
Investment Summary (Unaudited)
Top Five Stocks as of April 30, 2019
| | % of fund's net assets |
| SAP SE (Germany, Software) | 2.1 |
| Roche Holding AG (participation certificate) (Switzerland, Pharmaceuticals) | 2.0 |
| AIA Group Ltd. (Hong Kong, Insurance) | 1.7 |
| Unilever NV (Certificaten Van Aandelen) (Bearer) (Netherlands, Personal Products) | 1.5 |
| ASML Holding NV (Netherlands, Semiconductors & Semiconductor Equipment) | 1.5 |
| | 8.8 |
Top Five Market Sectors as of April 30, 2019
| | % of fund's net assets |
| Financials | 22.8 |
| Information Technology | 15.4 |
| Industrials | 14.8 |
| Health Care | 14.0 |
| Consumer Staples | 8.1 |
Top Five Countries as of April 30, 2019
| (excluding cash equivalents) | % of fund's net assets |
| Japan | 16.5 |
| United Kingdom | 13.0 |
| Germany | 9.0 |
| France | 6.5 |
| United States of America | 6.5 |
Asset Allocation (% of fund's net assets)
| As of April 30, 2019 |
| | Stocks | 96.2% |
| | Short-Term Investments and Net Other Assets (Liabilities) | 3.8% |

Schedule of Investments April 30, 2019 (Unaudited)
Showing Percentage of Net Assets
| Common Stocks - 96.2% | | | |
| | | Shares | Value (000s) |
| Australia - 1.1% | | | |
| CSL Ltd. | | 76,742 | $10,742 |
| Magellan Financial Group Ltd. | | 290,983 | 9,151 |
|
| TOTAL AUSTRALIA | | | 19,893 |
|
| Bailiwick of Jersey - 1.0% | | | |
| Experian PLC | | 317,800 | 9,251 |
| Ferguson PLC | | 114,946 | 8,154 |
|
| TOTAL BAILIWICK OF JERSEY | | | 17,405 |
|
| Belgium - 1.1% | | | |
| KBC Groep NV | | 238,380 | 17,652 |
| Umicore SA | | 87,800 | 3,397 |
|
| TOTAL BELGIUM | | | 21,049 |
|
| Bermuda - 1.7% | | | |
| Credicorp Ltd. (United States) | | 38,505 | 9,122 |
| Hiscox Ltd. | | 342,900 | 7,485 |
| IHS Markit Ltd. (a) | | 133,488 | 7,644 |
| Marvell Technology Group Ltd. | | 279,500 | 6,993 |
|
| TOTAL BERMUDA | | | 31,244 |
|
| Brazil - 0.3% | | | |
| BM&F BOVESPA SA | | 321,500 | 2,825 |
| Notre Dame Intermedica Participacoes SA | | 309,500 | 2,772 |
|
| TOTAL BRAZIL | | | 5,597 |
|
| Canada - 3.1% | | | |
| Alimentation Couche-Tard, Inc. Class B (sub. vtg.) | | 367,400 | 21,662 |
| Cenovus Energy, Inc. (Canada) | | 572,800 | 5,678 |
| Constellation Software, Inc. | | 8,300 | 7,323 |
| Fairfax India Holdings Corp. (a)(b) | | 419,800 | 5,625 |
| Suncor Energy, Inc. | | 463,100 | 15,272 |
| Waste Connection, Inc. (Canada) | | 21,400 | 1,986 |
|
| TOTAL CANADA | | | 57,546 |
|
| Cayman Islands - 1.6% | | | |
| Alibaba Group Holding Ltd. sponsored ADR (a) | | 62,600 | 11,617 |
| ENN Energy Holdings Ltd. | | 292,700 | 2,765 |
| Momo, Inc. ADR | | 48,600 | 1,704 |
| Sea Ltd. ADR (a) | | 84,000 | 2,091 |
| Tencent Holdings Ltd. | | 201,800 | 9,946 |
| Zai Lab Ltd. ADR (a) | | 69,154 | 1,843 |
|
| TOTAL CAYMAN ISLANDS | | | 29,966 |
|
| China - 1.5% | | | |
| Kweichow Moutai Co. Ltd. (A Shares) | | 62,476 | 9,035 |
| Ping An Insurance (Group) Co. of China Ltd. (H Shares) | | 665,000 | 8,050 |
| Shanghai International Airport Co. Ltd. (A Shares) | | 488,272 | 5,121 |
| Wuliangye Yibin Co. Ltd. (A Shares) | | 296,200 | 4,502 |
|
| TOTAL CHINA | | | 26,708 |
|
| Denmark - 1.3% | | | |
| DONG Energy A/S (b) | | 123,400 | 9,447 |
| DSV de Sammensluttede Vognmaend A/S | | 58,600 | 5,414 |
| Netcompany Group A/S (b) | | 73,700 | 2,629 |
| Novozymes A/S Series B | | 129,900 | 6,054 |
|
| TOTAL DENMARK | | | 23,544 |
|
| France - 6.5% | | | |
| Amundi SA (b) | | 169,158 | 12,152 |
| Capgemini SA | | 124,800 | 15,131 |
| Danone SA | | 49,100 | 3,971 |
| Elis SA | | 62,700 | 1,118 |
| Ipsen SA | | 18,300 | 2,137 |
| Kering SA | | 10,304 | 6,091 |
| Legrand SA | | 75,500 | 5,548 |
| LVMH Moet Hennessy - Louis Vuitton SA | | 53,743 | 21,100 |
| Pernod Ricard SA | | 10,100 | 1,760 |
| Sanofi SA | | 224,655 | 19,601 |
| SR Teleperformance SA | | 72,800 | 13,987 |
| VINCI SA | | 159,500 | 16,109 |
|
| TOTAL FRANCE | | | 118,705 |
|
| Germany - 9.0% | | | |
| adidas AG | | 54,209 | 13,929 |
| Allianz SE | | 68,400 | 16,533 |
| Bayer AG | | 162,026 | 10,784 |
| Continental AG | | 27,800 | 4,595 |
| Deutsche Borse AG | | 103,800 | 13,870 |
| Deutsche Post AG | | 291,526 | 10,134 |
| Fresenius SE & Co. KGaA | | 64,300 | 3,648 |
| Hannover Reuck SE | | 68,200 | 10,281 |
| Linde PLC | | 105,738 | 19,023 |
| Morphosys AG (a) | | 16,383 | 1,624 |
| Morphosys AG sponsored ADR | | 104,317 | 2,572 |
| SAP SE | | 296,573 | 38,233 |
| Symrise AG | | 105,700 | 10,160 |
| Vonovia SE | | 190,800 | 9,517 |
|
| TOTAL GERMANY | | | 164,903 |
|
| Hong Kong - 2.5% | | | |
| AIA Group Ltd. | | 3,138,200 | 32,133 |
| BOC Hong Kong (Holdings) Ltd. | | 1,551,500 | 6,942 |
| Techtronic Industries Co. Ltd. | | 1,041,500 | 7,528 |
|
| TOTAL HONG KONG | | | 46,603 |
|
| India - 4.9% | | | |
| Axis Bank Ltd. (a) | | 847,458 | 9,331 |
| Godrej Consumer Products Ltd. | | 156,548 | 1,465 |
| HDFC Bank Ltd. | | 687,971 | 22,824 |
| Housing Development Finance Corp. Ltd. | | 704,987 | 20,194 |
| Infosys Ltd. sponsored ADR | | 335,000 | 3,605 |
| Kotak Mahindra Bank Ltd. | | 314,240 | 6,256 |
| LIC Housing Finance Ltd. | | 628,032 | 4,479 |
| Reliance Industries Ltd. | | 1,025,408 | 20,506 |
|
| TOTAL INDIA | | | 88,660 |
|
| Indonesia - 1.1% | | | |
| PT Bank Central Asia Tbk | | 4,639,700 | 9,361 |
| PT Bank Rakyat Indonesia Tbk | | 32,290,000 | 9,902 |
|
| TOTAL INDONESIA | | | 19,263 |
|
| Ireland - 2.6% | | | |
| Allergan PLC | | 26,000 | 3,822 |
| CRH PLC | | 235,900 | 7,919 |
| DCC PLC (United Kingdom) | | 30,400 | 2,715 |
| Kerry Group PLC Class A | | 103,000 | 11,529 |
| Kingspan Group PLC (Ireland) | | 221,881 | 11,667 |
| Ryanair Holdings PLC sponsored ADR (a) | | 117,336 | 9,110 |
|
| TOTAL IRELAND | | | 46,762 |
|
| Israel - 0.5% | | | |
| Check Point Software Technologies Ltd. (a) | | 73,300 | 8,852 |
| Italy - 0.9% | | | |
| FinecoBank SpA | | 158,100 | 2,081 |
| Intesa Sanpaolo SpA | | 2,583,800 | 6,770 |
| Moncler SpA | | 69,500 | 2,851 |
| Recordati SpA | | 122,400 | 4,941 |
|
| TOTAL ITALY | | | 16,643 |
|
| Japan - 16.5% | | | |
| Bandai Namco Holdings, Inc. | | 86,500 | 4,116 |
| Daikin Industries Ltd. | | 96,200 | 12,248 |
| Hoya Corp. | | 368,300 | 25,838 |
| Iriso Electronics Co. Ltd. | | 29,251 | 1,513 |
| Itochu Corp. | | 381,600 | 6,851 |
| Kao Corp. | | 156,600 | 12,030 |
| Keyence Corp. (c) | | 41,700 | 25,875 |
| KH Neochem Co. Ltd. | | 95,600 | 2,768 |
| Minebea Mitsumi, Inc. | | 1,020,900 | 18,054 |
| Misumi Group, Inc. | | 220,800 | 5,705 |
| Mitsubishi UFJ Financial Group, Inc. | | 1,772,100 | 8,792 |
| Morinaga & Co. Ltd. | | 6,000 | 249 |
| Nabtesco Corp. | | 86,000 | 2,617 |
| Nidec Corp. | | 22,700 | 3,217 |
| Nissan Chemical Corp. (c) | | 40,100 | 1,775 |
| Nitori Holdings Co. Ltd. | | 92,900 | 11,050 |
| ORIX Corp. (c) | | 1,434,700 | 20,240 |
| PALTAC Corp. | | 55,100 | 3,022 |
| Persol Holdings Co., Ltd. | | 146,600 | 2,743 |
| Recruit Holdings Co. Ltd. | | 587,300 | 17,551 |
| Renesas Electronics Corp. (a) | | 1,180,100 | 6,282 |
| Shimadzu Corp. | | 116,199 | 3,102 |
| Shin-Etsu Chemical Co. Ltd. | | 125,100 | 11,850 |
| Shiseido Co. Ltd. | | 127,800 | 10,002 |
| SMC Corp. | | 31,700 | 13,107 |
| SoftBank Corp. | | 140,400 | 14,887 |
| Sony Corp. | | 128,100 | 6,452 |
| Suzuki Motor Corp. | | 223,100 | 10,144 |
| Takeda Pharmaceutical Co. Ltd. (c) | | 291,704 | 10,764 |
| Tokyo Electron Ltd. (d) | | 40,500 | 6,415 |
| Tsubaki Nakashima Co. Ltd. | | 82,868 | 1,532 |
| Tsuruha Holdings, Inc. | | 123,500 | 10,499 |
| Welcia Holdings Co. Ltd. | | 162,706 | 6,390 |
| Yahoo! Japan Corp. (d) | | 1,261,300 | 3,352 |
|
| TOTAL JAPAN | | | 301,032 |
|
| Korea (South) - 0.6% | | | |
| LG Chemical Ltd. | | 14,023 | 4,349 |
| SK Hynix, Inc. | | 102,770 | 6,975 |
|
| TOTAL KOREA (SOUTH) | | | 11,324 |
|
| Luxembourg - 0.8% | | | |
| B&M European Value Retail SA | | 2,163,595 | 11,130 |
| Samsonite International SA (b) | | 918,600 | 2,635 |
|
| TOTAL LUXEMBOURG | | | 13,765 |
|
| Mexico - 0.1% | | | |
| Grupo Financiero Banorte S.A.B. de CV Series O | | 420,700 | 2,659 |
| Netherlands - 5.8% | | | |
| Adyen BV (b) | | 3,307 | 2,691 |
| ASML Holding NV | | 131,500 | 27,460 |
| Heineken NV (Bearer) | | 71,300 | 7,696 |
| Koninklijke Philips Electronics NV | | 260,500 | 11,187 |
| NXP Semiconductors NV | | 123,400 | 13,034 |
| Unilever NV (Certificaten Van Aandelen) (Bearer) | | 462,100 | 27,959 |
| Wolters Kluwer NV | | 218,900 | 15,266 |
|
| TOTAL NETHERLANDS | | | 105,293 |
|
| New Zealand - 0.3% | | | |
| Ryman Healthcare Group Ltd. | | 740,245 | 6,007 |
| Norway - 1.4% | | | |
| Adevinta ASA: | | | |
| Class A (a) | | 362,200 | 3,653 |
| Class B | | 180,300 | 1,774 |
| Equinor ASA | | 540,000 | 12,046 |
| Schibsted ASA (A Shares) | | 290,600 | 7,626 |
|
| TOTAL NORWAY | | | 25,099 |
|
| South Africa - 0.3% | | | |
| Capitec Bank Holdings Ltd. | | 52,900 | 4,943 |
| Spain - 1.3% | | | |
| Amadeus IT Holding SA Class A | | 103,500 | 8,233 |
| CaixaBank SA | | 3,156,800 | 10,062 |
| Masmovil Ibercom SA (a) | | 43,550 | 954 |
| Prosegur Cash SA (b) | | 2,203,942 | 4,726 |
|
| TOTAL SPAIN | | | 23,975 |
|
| Sweden - 2.0% | | | |
| ASSA ABLOY AB (B Shares) | | 557,800 | 11,924 |
| Coor Service Management Holding AB (b) | | 269,788 | 2,332 |
| Indutrade AB | | 128,100 | 3,917 |
| Svenska Handelsbanken AB (A Shares) | | 326,500 | 3,566 |
| Swedbank AB (A Shares) (e) | | 233,500 | 3,815 |
| Telefonaktiebolaget LM Ericsson (B Shares) | | 1,027,700 | 10,166 |
|
| TOTAL SWEDEN | | | 35,720 |
|
| Switzerland - 5.9% | | | |
| Alcon, Inc. (a) | | 225,672 | 12,996 |
| Julius Baer Group Ltd. | | 168,480 | 8,138 |
| Lonza Group AG | | 29,786 | 9,199 |
| Medacta Group SA (b) | | 19,100 | 1,750 |
| Roche Holding AG (participation certificate) | | 138,597 | 36,571 |
| Sig Combibloc Group AG | | 50,360 | 490 |
| Sika AG | | 124,710 | 19,093 |
| Sonova Holding AG Class B | | 30,853 | 6,222 |
| Swiss Re Ltd. | | 94,720 | 9,116 |
| UBS Group AG | | 345,863 | 4,638 |
|
| TOTAL SWITZERLAND | | | 108,213 |
|
| Taiwan - 1.0% | | | |
| Taiwan Semiconductor Manufacturing Co. Ltd. sponsored ADR | | 421,500 | 18,470 |
| United Kingdom - 13.0% | | | |
| Admiral Group PLC | | 91,600 | 2,633 |
| Aon PLC | | 42,800 | 7,710 |
| Ascential PLC | | 1,046,877 | 4,868 |
| AstraZeneca PLC (United Kingdom) | | 336,879 | 25,097 |
| Beazley PLC | | 555,100 | 4,169 |
| Big Yellow Group PLC | | 201,900 | 2,741 |
| BP PLC sponsored ADR | | 415,600 | 18,174 |
| Bunzl PLC | | 429,000 | 12,917 |
| Coca-Cola European Partners PLC | | 133,500 | 7,154 |
| Compass Group PLC | | 524,692 | 11,939 |
| Halma PLC | | 79,300 | 1,861 |
| Hastings Group Holdings PLC (b) | | 652,742 | 1,620 |
| InterContinental Hotel Group PLC | | 112,053 | 7,259 |
| Lloyds Banking Group PLC | | 16,969,100 | 13,878 |
| London Stock Exchange Group PLC | | 207,000 | 13,572 |
| Micro Focus International PLC | | 118,178 | 2,986 |
| Network International Holdings PLC (b) | | 440,800 | 2,995 |
| Ocado Group PLC (a) | | 98,100 | 1,743 |
| Prudential PLC | | 1,051,094 | 23,882 |
| RELX PLC (Euronext N.V.) | | 697,647 | 16,010 |
| Rentokil Initial PLC | | 796,000 | 4,048 |
| Rio Tinto PLC | | 187,000 | 10,909 |
| Smith & Nephew PLC | | 505,600 | 9,775 |
| Spectris PLC | | 134,200 | 4,809 |
| St. James's Place Capital PLC | | 373,900 | 5,468 |
| Standard Chartered PLC (United Kingdom) | | 446,388 | 4,075 |
| Tesco PLC | | 2,443,472 | 7,972 |
| The Weir Group PLC | | 323,300 | 6,996 |
|
| TOTAL UNITED KINGDOM | | | 237,260 |
|
| United States of America - 6.5% | | | |
| Alphabet, Inc. Class C (a) | | 9,849 | 11,705 |
| Amgen, Inc. | | 47,100 | 8,446 |
| Becton, Dickinson & Co. | | 30,900 | 7,439 |
| Boston Scientific Corp. (a) | | 226,400 | 8,404 |
| Citigroup, Inc. | | 108,600 | 7,678 |
| Coty, Inc. Class A (e) | | 498,900 | 5,398 |
| IQVIA Holdings, Inc. (a) | | 61,800 | 8,584 |
| Marsh & McLennan Companies, Inc. | | 56,800 | 5,356 |
| MasterCard, Inc. Class A | | 77,700 | 19,754 |
| Microsoft Corp. | | 90,000 | 11,754 |
| QIAGEN NV (a) | | 108,327 | 4,220 |
| Visa, Inc. Class A | | 119,900 | 19,715 |
|
| TOTAL UNITED STATES OF AMERICA | | | 118,453 |
|
| TOTAL COMMON STOCKS | | | |
| (Cost $1,324,325) | | | 1,755,556 |
|
| Nonconvertible Preferred Stocks - 0.0% | | | |
| Germany - 0.0% | | | |
| Sartorius AG (non-vtg.) | | | |
| (Cost $379) | | 5,200 | 952 |
|
| Money Market Funds - 3.5% | | | |
| Fidelity Cash Central Fund, 2.49% (f) | | 62,833,701 | 62,846 |
| Fidelity Securities Lending Cash Central Fund 2.49% (f)(g) | | 1,472,073 | 1,472 |
| TOTAL MONEY MARKET FUNDS | | | |
| (Cost $64,318) | | | 64,318 |
| TOTAL INVESTMENT IN SECURITIES - 99.7% | | | |
| (Cost $1,389,022) | | | 1,820,826 |
| NET OTHER ASSETS (LIABILITIES) - 0.3% | | | 4,794 |
| NET ASSETS - 100% | | | $1,825,620 |
Categorizations in the Schedule of Investments are based on country or territory of incorporation.
Legend
(a) Non-income producing
(b) Security exempt from registration under Rule 144A of the Securities Act of 1933. These securities may be resold in transactions exempt from registration, normally to qualified institutional buyers. At the end of the period, the value of these securities amounted to $48,602,000 or 2.7% of net assets.
(c) A portion of the security sold on a delayed delivery basis.
(d) Security or a portion of the security purchased on a delayed delivery or when-issued basis.
(e) Security or a portion of the security is on loan at period end.
(f) Affiliated fund that is generally available only to investment companies and other accounts managed by Fidelity Investments. The rate quoted is the annualized seven-day yield of the fund at period end. A complete unaudited listing of the fund's holdings as of its most recent quarter end is available upon request. In addition, each Fidelity Central Fund's financial statements are available on the SEC's website or upon request.
(g) Investment made with cash collateral received from securities on loan.
Affiliated Central Funds
Information regarding fiscal year to date income earned by the Fund from investments in Fidelity Central Funds is as follows:
| Fund | Income earned |
| | (Amounts in thousands) |
| Fidelity Cash Central Fund | $971 |
| Fidelity Securities Lending Cash Central Fund | 53 |
| Total | $1,024 |
Amounts in the income column in the above table include any capital gain distributions from underlying funds, which are presented in the corresponding line-item in the Statement of Operations, if applicable.
Investment Valuation
The following is a summary of the inputs used, as of April 30, 2019, involving the Fund's assets and liabilities carried at fair value. The inputs or methodology used for valuing securities may not be an indication of the risk associated with investing in those securities. For more information on valuation inputs, and their aggregation into the levels used below, please refer to the Investment Valuation section in the accompanying Notes to Financial Statements.
| | Valuation Inputs at Reporting Date: |
| Description | Total | Level 1 | Level 2 | Level 3 |
| (Amounts in thousands) | | | | |
| Investments in Securities: | | | | |
| Equities: | | | | |
| Communication Services | $55,042 | $30,209 | $24,833 | $-- |
| Consumer Discretionary | 139,292 | 99,801 | 39,491 | -- |
| Consumer Staples | 149,273 | 109,371 | 39,902 | -- |
| Energy | 71,676 | 71,676 | -- | -- |
| Financials | 416,750 | 230,865 | 185,885 | -- |
| Health Care | 257,937 | 135,743 | 122,194 | -- |
| Industrials | 264,993 | 199,078 | 65,915 | -- |
| Information Technology | 279,288 | 230,889 | 48,399 | -- |
| Materials | 97,787 | 67,109 | 30,678 | -- |
| Real Estate | 12,258 | 12,258 | -- | -- |
| Utilities | 12,212 | 12,212 | -- | -- |
| Money Market Funds | 64,318 | 64,318 | -- | -- |
| Total Investments in Securities: | $1,820,826 | $1,263,529 | $557,297 | $-- |
See accompanying notes which are an integral part of the financial statements.
Financial Statements
Statement of Assets and Liabilities
| Amounts in thousands (except per-share amounts) | | April 30, 2019 (Unaudited) |
| Assets | | |
Investment in securities, at value (including securities loaned of $1,405) — See accompanying schedule:
Unaffiliated issuers (cost $1,324,704) | $1,756,508 | |
| Fidelity Central Funds (cost $64,318) | 64,318 | |
| Total Investment in Securities (cost $1,389,022) | | $1,820,826 |
| Cash | | 29 |
| Foreign currency held at value (cost $1,016) | | 1,016 |
| Receivable for investments sold | | |
| Regular delivery | | 3,475 |
| Delayed delivery | | 6,059 |
| Receivable for fund shares sold | | 856 |
| Dividends receivable | | 8,532 |
| Distributions receivable from Fidelity Central Funds | | 138 |
| Prepaid expenses | | 1 |
| Other receivables | | 131 |
| Total assets | | 1,841,063 |
| Liabilities | | |
| Payable for investments purchased | | |
| Regular delivery | $4,773 | |
| Delayed delivery | 1,986 | |
| Payable for fund shares redeemed | 5,056 | |
| Accrued management fee | 1,004 | |
| Distribution and service plan fees payable | 242 | |
| Other affiliated payables | 342 | |
| Other payables and accrued expenses | 568 | |
| Collateral on securities loaned | 1,472 | |
| Total liabilities | | 15,443 |
| Net Assets | | $1,825,620 |
| Net Assets consist of: | | |
| Paid in capital | | $1,447,173 |
| Total distributable earnings (loss) | | 378,447 |
| Net Assets | | $1,825,620 |
| Net Asset Value and Maximum Offering Price | | |
| Class A: | | |
| Net Asset Value and redemption price per share ($532,465 ÷ 24,194 shares) | | $22.01 |
| Maximum offering price per share (100/94.25 of $22.01) | | $23.35 |
| Class M: | | |
| Net Asset Value and redemption price per share ($178,559 ÷ 8,166 shares) | | $21.87 |
| Maximum offering price per share (100/96.50 of $21.87) | | $22.66 |
| Class C: | | |
| Net Asset Value and offering price per share ($67,172 ÷ 3,189 shares)(a) | | $21.07 |
| Class I: | | |
| Net Asset Value, offering price and redemption price per share ($781,284 ÷ 34,943 shares) | | $22.36 |
| Class Z: | | |
| Net Asset Value, offering price and redemption price per share ($266,140 ÷ 11,917 shares) | | $22.33 |
(a) Redemption price per share is equal to net asset value less any applicable contingent deferred sales charge.
See accompanying notes which are an integral part of the financial statements.
Statement of Operations
| Amounts in thousands | | Six months ended April 30, 2019 (Unaudited) |
| Investment Income | | |
| Dividends | | $18,881 |
| Non-Cash dividends | | 2,976 |
| Income from Fidelity Central Funds | | 1,024 |
| Income before foreign taxes withheld | | 22,881 |
| Less foreign taxes withheld | | (1,518) |
| Total income | | 21,363 |
| Expenses | | |
| Management fee | $6,031 | |
| Transfer agent fees | 1,641 | |
| Distribution and service plan fees | 1,633 | |
| Accounting and security lending fees | 404 | |
| Custodian fees and expenses | 111 | |
| Independent trustees' fees and expenses | 5 | |
| Registration fees | 71 | |
| Audit | 62 | |
| Legal | 4 | |
| Miscellaneous | 5 | |
| Total expenses before reductions | 9,967 | |
| Expense reductions | (69) | |
| Total expenses after reductions | | 9,898 |
| Net investment income (loss) | | 11,465 |
| Realized and Unrealized Gain (Loss) | | |
| Net realized gain (loss) on: | | |
| Investment securities: | | |
| Unaffiliated issuers | (48,470) | |
| Fidelity Central Funds | (1) | |
| Foreign currency transactions | (39) | |
| Total net realized gain (loss) | | (48,510) |
| Change in net unrealized appreciation (depreciation) on: | | |
| Investment securities: | | |
| Unaffiliated issuers (net of increase in deferred foreign taxes of $464) | 196,693 | |
| Assets and liabilities in foreign currencies | 61 | |
| Total change in net unrealized appreciation (depreciation) | | 196,754 |
| Net gain (loss) | | 148,244 |
| Net increase (decrease) in net assets resulting from operations | | $159,709 |
See accompanying notes which are an integral part of the financial statements.
Statement of Changes in Net Assets
| Amounts in thousands | Six months ended April 30, 2019 (Unaudited) | Year ended October 31, 2018 |
| Increase (Decrease) in Net Assets | | |
| Operations | | |
| Net investment income (loss) | $11,465 | $21,211 |
| Net realized gain (loss) | (48,510) | 65,951 |
| Change in net unrealized appreciation (depreciation) | 196,754 | (274,393) |
| Net increase (decrease) in net assets resulting from operations | 159,709 | (187,231) |
| Distributions to shareholders | (82,038) | (24,045) |
| Share transactions - net increase (decrease) | (144,178) | (148,877) |
| Total increase (decrease) in net assets | (66,507) | (360,153) |
| Net Assets | | |
| Beginning of period | 1,892,127 | 2,252,280 |
| End of period | $1,825,620 | $1,892,127 |
See accompanying notes which are an integral part of the financial statements.
Financial Highlights
Fidelity Advisor Diversified International Fund Class A
| | Six months ended (Unaudited) April 30, | Years endedOctober 31, | | | | |
| | 2019 | 2018 | 2017 | 2016 | 2015 | 2014 |
| Selected Per–Share Data | | | | | | |
| Net asset value, beginning of period | $21.08 | $23.43 | $19.38 | $20.10 | $19.56 | $19.47 |
| Income from Investment Operations | | | | | | |
| Net investment income (loss)A | .12 | .21 | .17 | .18 | .15 | .27B |
| Net realized and unrealized gain (loss) | 1.72 | (2.33)C | 4.11 | (.77) | .61 | .17 |
| Total from investment operations | 1.84 | (2.12) | 4.28 | (.59) | .76 | .44 |
| Distributions from net investment income | (.17) | (.16) | (.19) | (.13) | (.20) | (.18) |
| Distributions from net realized gain | (.74) | (.07) | (.05) | – | (.02) | (.17) |
| Total distributions | (.91) | (.23) | (.23)D | (.13) | (.22) | (.35) |
| Redemption fees added to paid in capitalA | – | – | –E | –E | –E | –E |
| Net asset value, end of period | $22.01 | $21.08 | $23.43 | $19.38 | $20.10 | $19.56 |
| Total ReturnF,G,H | 9.27% | (9.14)%C | 22.39% | (2.97)% | 3.93% | 2.28% |
| Ratios to Average Net AssetsI,J | | | | | | |
| Expenses before reductions | 1.20%K | 1.19% | 1.21% | 1.23% | 1.22% | 1.26% |
| Expenses net of fee waivers, if any | 1.20%K | 1.19% | 1.21% | 1.23% | 1.22% | 1.26% |
| Expenses net of all reductions | 1.19%K | 1.17% | 1.20% | 1.22% | 1.21% | 1.26% |
| Net investment income (loss) | 1.16%K | .89% | .82% | .92% | .75% | 1.34%B |
| Supplemental Data | | | | | | |
| Net assets, end of period (in millions) | $532 | $463 | $579 | $574 | $662 | $693 |
| Portfolio turnover rateL | 45%K | 32% | 44% | 31% | 34% | 40% |
A Calculated based on average shares outstanding during the period.
B Net investment income per share reflects a large, non-recurring dividend which amounted to $.10 per share. Excluding this non-recurring dividend, the ratio of net investment income (loss) to average net assets would have been .85%.
C Net realized and unrealized gain (loss) per share reflects proceeds received from litigation which amounted to $.11 per share. Excluding these litigation proceeds, the total return would have been (9.62)%
D Total distributions of $.23 per share is comprised of distributions from net investment income of $.187 and distributions from net realized gain of $.046 per share.
E Amount represents less than $.005 per share.
F Total returns for periods of less than one year are not annualized.
G Total returns would have been lower if certain expenses had not been reduced during the applicable periods shown.
H Total returns do not include the effect of the sales charges.
I Fees and expenses of any underlying Fidelity Central Funds are not included in the Fund's expense ratio. The Fund indirectly bears its proportionate share of the expenses of any underlying Fidelity Central Funds.
J Expense ratios reflect operating expenses of the class. Expenses before reductions do not reflect amounts reimbursed by the investment adviser or reductions from brokerage service arrangements or reductions from other expense offset arrangements and do not represent the amount paid by the class during periods when reimbursements or reductions occur. Expenses net of fee waivers reflect expenses after reimbursement by the investment adviser but prior to reductions from brokerage service arrangements or other expense offset arrangements. Expenses net of all reductions represent the net expenses paid by the class.
K Annualized
L Amount does not include the portfolio activity of any underlying Fidelity Central Funds.
See accompanying notes which are an integral part of the financial statements.
Fidelity Advisor Diversified International Fund Class M
| | Six months ended (Unaudited) April 30, | Years endedOctober 31, | | | | |
| | 2019 | 2018 | 2017 | 2016 | 2015 | 2014 |
| Selected Per–Share Data | | | | | | |
| Net asset value, beginning of period | $20.91 | $23.24 | $19.21 | $19.92 | $19.38 | $19.30 |
| Income from Investment Operations | | | | | | |
| Net investment income (loss)A | .09 | .14 | .12 | .13 | .10 | .21B |
| Net realized and unrealized gain (loss) | 1.71 | (2.31)C | 4.08 | (.77) | .61 | .18 |
| Total from investment operations | 1.80 | (2.17) | 4.20 | (.64) | .71 | .39 |
| Distributions from net investment income | (.11) | (.09) | (.13) | (.07) | (.15) | (.14) |
| Distributions from net realized gain | (.74) | (.07) | (.05) | – | (.02) | (.17) |
| Total distributions | (.84)D | (.16) | (.17)E | (.07) | (.17) | (.31) |
| Redemption fees added to paid in capitalA | – | – | –F | –F | –F | –F |
| Net asset value, end of period | $21.87 | $20.91 | $23.24 | $19.21 | $19.92 | $19.38 |
| Total ReturnG,H,I | 9.14% | (9.40)%C | 22.10% | (3.22)% | 3.67% | 2.04% |
| Ratios to Average Net AssetsJ,K | | | | | | |
| Expenses before reductions | 1.47%L | 1.46% | 1.48% | 1.49% | 1.48% | 1.51% |
| Expenses net of fee waivers, if any | 1.47%L | 1.46% | 1.47% | 1.49% | 1.48% | 1.51% |
| Expenses net of all reductions | 1.46%L | 1.44% | 1.47% | 1.48% | 1.47% | 1.51% |
| Net investment income (loss) | .89%L | .62% | .56% | .66% | .49% | 1.09%B |
| Supplemental Data | | | | | | |
| Net assets, end of period (in millions) | $179 | $175 | $224 | $224 | $271 | $284 |
| Portfolio turnover rateM | 45%L | 32% | 44% | 31% | 34% | 40% |
A Calculated based on average shares outstanding during the period.
B Net investment income per share reflects a large, non-recurring dividend which amounted to $.10 per share. Excluding this non-recurring dividend, the ratio of net investment income (loss) to average net assets would have been .60%.
C Net realized and unrealized gain (loss) per share reflects proceeds received from litigation which amounted to $.11 per share. Excluding these litigation proceeds, the total return would have been (9.88)%.
D Total distributions of $.84 per share is comprised of distributions from net investment income of $.109 and distributions from net realized gain of $.735 per share.
E Total distributions of $.17 per share is comprised of distributions from net investment income of $.128 and distributions from net realized gain of $.046 per share.
F Amount represents less than $.005 per share.
G Total returns for periods of less than one year are not annualized.
H Total returns would have been lower if certain expenses had not been reduced during the applicable periods shown.
I Total returns do not include the effect of the sales charges.
J Fees and expenses of any underlying Fidelity Central Funds are not included in the Fund's expense ratio. The Fund indirectly bears its proportionate share of the expenses of any underlying Fidelity Central Funds.
K Expense ratios reflect operating expenses of the class. Expenses before reductions do not reflect amounts reimbursed by the investment adviser or reductions from brokerage service arrangements or reductions from other expense offset arrangements and do not represent the amount paid by the class during periods when reimbursements or reductions occur. Expenses net of fee waivers reflect expenses after reimbursement by the investment adviser but prior to reductions from brokerage service arrangements or other expense offset arrangements. Expenses net of all reductions represent the net expenses paid by the class.
L Annualized
M Amount does not include the portfolio activity of any underlying Fidelity Central Funds.
See accompanying notes which are an integral part of the financial statements.
Fidelity Advisor Diversified International Fund Class C
| | Six months ended (Unaudited) April 30, | Years endedOctober 31, | | | | |
| | 2019 | 2018 | 2017 | 2016 | 2015 | 2014 |
| Selected Per–Share Data | | | | | | |
| Net asset value, beginning of period | $20.11 | $22.35 | $18.48 | $19.19 | $18.68 | $18.63 |
| Income from Investment Operations | | | | | | |
| Net investment income (loss)A | .04 | .03 | .01 | .03 | –B | .11C |
| Net realized and unrealized gain (loss) | 1.66 | (2.23)D | 3.94 | (.74) | .59 | .18 |
| Total from investment operations | 1.70 | (2.20) | 3.95 | (.71) | .59 | .29 |
| Distributions from net investment income | – | – | (.03) | – | (.06) | (.07) |
| Distributions from net realized gain | (.74) | (.04) | (.05) | – | (.02) | (.17) |
| Total distributions | (.74) | (.04) | (.08) | – | (.08) | (.24) |
| Redemption fees added to paid in capitalA | – | – | –B | –B | –B | –B |
| Net asset value, end of period | $21.07 | $20.11 | $22.35 | $18.48 | $19.19 | $18.68 |
| Total ReturnE,F,G | 8.88% | (9.85)%D | 21.46% | (3.70)% | 3.15% | 1.58% |
| Ratios to Average Net AssetsH,I | | | | | | |
| Expenses before reductions | 1.98%J | 1.95% | 1.96% | 1.98% | 1.97% | 2.00% |
| Expenses net of fee waivers, if any | 1.98%J | 1.95% | 1.96% | 1.98% | 1.97% | 2.00% |
| Expenses net of all reductions | 1.97%J | 1.94% | 1.96% | 1.98% | 1.96% | 2.00% |
| Net investment income (loss) | .38%J | .13% | .07% | .17% | - %K | .60%C |
| Supplemental Data | | | | | | |
| Net assets, end of period (in millions) | $67 | $150 | $211 | $206 | $251 | $243 |
| Portfolio turnover rateL | 45%J | 32% | 44% | 31% | 34% | 40% |
A Calculated based on average shares outstanding during the period.
B Amount represents less than $.005 per share.
C Net investment income per share reflects a large, non-recurring dividend which amounted to $.09 per share. Excluding this non-recurring dividend, the ratio of net investment income (loss) to average net assets would have been .11%.
D Net realized and unrealized gain (loss) per share reflects proceeds received from litigation which amounted to $.11 per share. Excluding these litigation proceeds, the total return would have been (10.33)%.
E Total returns for periods of less than one year are not annualized.
F Total returns would have been lower if certain expenses had not been reduced during the applicable periods shown.
G Total returns do not include the effect of the contingent deferred sales charge.
H Fees and expenses of any underlying Fidelity Central Funds are not included in the Fund's expense ratio. The Fund indirectly bears its proportionate share of the expenses of any underlying Fidelity Central Funds.
I Expense ratios reflect operating expenses of the class. Expenses before reductions do not reflect amounts reimbursed by the investment adviser or reductions from brokerage service arrangements or reductions from other expense offset arrangements and do not represent the amount paid by the class during periods when reimbursements or reductions occur. Expenses net of fee waivers reflect expenses after reimbursement by the investment adviser but prior to reductions from brokerage service arrangements or other expense offset arrangements. Expenses net of all reductions represent the net expenses paid by the class.
J Annualized
K Amount represents less than .005%.
L Amount does not include the portfolio activity of any underlying Fidelity Central Funds.
See accompanying notes which are an integral part of the financial statements.
Fidelity Advisor Diversified International Fund Class I
| | Six months ended (Unaudited) April 30, | Years endedOctober 31, | | | | |
| | 2019 | 2018 | 2017 | 2016 | 2015 | 2014 |
| Selected Per–Share Data | | | | | | |
| Net asset value, beginning of period | $21.44 | $23.85 | $19.73 | $20.46 | $19.91 | $19.80 |
| Income from Investment Operations | | | | | | |
| Net investment income (loss)A | .15 | .27 | .24 | .24 | .21 | .33B |
| Net realized and unrealized gain (loss) | 1.75 | (2.37)C | 4.18 | (.78) | .63 | .18 |
| Total from investment operations | 1.90 | (2.10) | 4.42 | (.54) | .84 | .51 |
| Distributions from net investment income | (.24) | (.24) | (.25) | (.19) | (.26) | (.23) |
| Distributions from net realized gain | (.74) | (.07) | (.05) | – | (.02) | (.17) |
| Total distributions | (.98) | (.31) | (.30) | (.19) | (.29)D | (.40) |
| Redemption fees added to paid in capitalA | – | – | –E | –E | –E | –E |
| Net asset value, end of period | $22.36 | $21.44 | $23.85 | $19.73 | $20.46 | $19.91 |
| Total ReturnF,G | 9.43% | (8.94)%C | 22.75% | (2.69)% | 4.24% | 2.60% |
| Ratios to Average Net AssetsH,I | | | | | | |
| Expenses before reductions | .93%J | .92% | .93% | .94% | .94% | .97% |
| Expenses net of fee waivers, if any | .92%J | .92% | .93% | .94% | .94% | .97% |
| Expenses net of all reductions | .92%J | .91% | .92% | .94% | .94% | .97% |
| Net investment income (loss) | 1.43%J | 1.16% | 1.10% | 1.21% | 1.03% | 1.63%B |
| Supplemental Data | | | | | | |
| Net assets, end of period (in millions) | $781 | $807 | $953 | $757 | $747 | $648 |
| Portfolio turnover rateK | 45%J | 32% | 44% | 31% | 34% | 40% |
A Calculated based on average shares outstanding during the period.
B Net investment income per share reflects a large, non-recurring dividend which amounted to $.10 per share. Excluding this non-recurring dividend, the ratio of net investment income (loss) to average net assets would have been 1.14%.
C Net realized and unrealized gain (loss) per share reflects proceeds received from litigation which amounted to $.11 per share. Excluding these litigation proceeds, the total return would have been (9.42)%.
D Total distributions of $.29 per share is comprised of distributions from net investment income of $.263 and distributions from net realized gain of $.022 per share.
E Amount represents less than $.005 per share.
F Total returns for periods of less than one year are not annualized.
G Total returns would have been lower if certain expenses had not been reduced during the applicable periods shown.
H Fees and expenses of any underlying Fidelity Central Funds are not included in the Fund's expense ratio. The Fund indirectly bears its proportionate share of the expenses of any underlying Fidelity Central Funds.
I Expense ratios reflect operating expenses of the class. Expenses before reductions do not reflect amounts reimbursed by the investment adviser or reductions from brokerage service arrangements or reductions from other expense offset arrangements and do not represent the amount paid by the class during periods when reimbursements or reductions occur. Expenses net of fee waivers reflect expenses after reimbursement by the investment adviser but prior to reductions from brokerage service arrangements or other expense offset arrangements. Expenses net of all reductions represent the net expenses paid by the class.
J Annualized
K Amount does not include the portfolio activity of any underlying Fidelity Central Funds.
See accompanying notes which are an integral part of the financial statements.
Fidelity Advisor Diversified International Fund Class Z
| | Six months ended (Unaudited) April 30, | Years endedOctober 31, | | | | |
| | 2019 | 2018 | 2017 | 2016 | 2015 | 2014 |
| Selected Per–Share Data | | | | | | |
| Net asset value, beginning of period | $21.44 | $23.85 | $19.73 | $20.46 | $19.93 | $19.81 |
| Income from Investment Operations | | | | | | |
| Net investment income (loss)A | .16 | .31 | .27 | .27 | .24 | .36B |
| Net realized and unrealized gain (loss) | 1.74 | (2.37)C | 4.18 | (.78) | .61 | .19 |
| Total from investment operations | 1.90 | (2.06) | 4.45 | (.51) | .85 | .55 |
| Distributions from net investment income | (.28) | (.28) | (.28) | (.22) | (.30) | (.26) |
| Distributions from net realized gain | (.74) | (.07) | (.05) | – | (.02) | (.17) |
| Total distributions | (1.01)D | (.35) | (.33) | (.22) | (.32) | (.43) |
| Redemption fees added to paid in capitalA | – | – | –E | –E | –E | –E |
| Net asset value, end of period | $22.33 | $21.44 | $23.85 | $19.73 | $20.46 | $19.93 |
| Total ReturnF,G | 9.47% | (8.78)%C | 22.94% | (2.54)% | 4.34% | 2.81% |
| Ratios to Average Net AssetsH,I | | | | | | |
| Expenses before reductions | .78%J | .78% | .78% | .79% | .79% | .81% |
| Expenses net of fee waivers, if any | .78%J | .78% | .78% | .79% | .79% | .81% |
| Expenses net of all reductions | .77%J | .76% | .78% | .79% | .78% | .81% |
| Net investment income (loss) | 1.57%J | 1.30% | 1.25% | 1.36% | 1.18% | 1.79%B |
| Supplemental Data | | | | | | |
| Net assets, end of period (in millions) | $266 | $298 | $286 | $93 | $83 | $24 |
| Portfolio turnover rateK | 45%J | 32% | 44% | 31% | 34% | 40% |
A Calculated based on average shares outstanding during the period.
B Net investment income per share reflects a large, non-recurring dividend which amounted to $.10 per share. Excluding this non-recurring dividend, the ratio of net investment income (loss) to average net assets would have been 1.30%.
C Net realized and unrealized gain (loss) per share reflects proceeds received from litigation which amounted to $.11 per share. Excluding these litigation proceeds, the total return would have been (9.26) %.
D Total distributions of $1.01 per share is comprised of distributions from net investment income of $.276 and distributions from net realized gain of $.735 per share.
E Amount represents less than $.005 per share.
F Total returns for periods of less than one year are not annualized.
G Total returns would have been lower if certain expenses had not been reduced during the applicable periods shown.
H Fees and expenses of any underlying Fidelity Central Funds are not included in the Fund's expense ratio. The Fund indirectly bears its proportionate share of the expenses of any underlying Fidelity Central Funds.
I Expense ratios reflect operating expenses of the class. Expenses before reductions do not reflect amounts reimbursed by the investment adviser or reductions from brokerage service arrangements or reductions from other expense offset arrangements and do not represent the amount paid by the class during periods when reimbursements or reductions occur. Expenses net of fee waivers reflect expenses after reimbursement by the investment adviser but prior to reductions from brokerage service arrangements or other expense offset arrangements. Expenses net of all reductions represent the net expenses paid by the class.
J Annualized
K Amount does not include the portfolio activity of any underlying Fidelity Central Funds.
See accompanying notes which are an integral part of the financial statements.
Notes to Financial Statements (Unaudited)
For the period ended April 30, 2019
(Amounts in thousands except percentages)
1. Organization.
Fidelity Advisor Diversified International Fund (the Fund) is a fund of Fidelity Advisor Series VIII (the Trust) and is authorized to issue an unlimited number of shares. The Trust is registered under the Investment Company Act of 1940, as amended (the 1940 Act), as an open-end management investment company organized as a Massachusetts business trust. The Fund offers Class A, Class M, Class C, Class I and Class Z shares, each of which has equal rights as to assets and voting privileges. Each class has exclusive voting rights with respect to matters that affect that class.
2. Investments in Fidelity Central Funds.
The Fund invests in Fidelity Central Funds, which are open-end investment companies generally available only to other investment companies and accounts managed by the investment adviser and its affiliates. The Fund's Schedule of Investments lists each of the Fidelity Central Funds held as of period end, if any, as an investment of the Fund, but does not include the underlying holdings of each Fidelity Central Fund. As an Investing Fund, the Fund indirectly bears its proportionate share of the expenses of the underlying Fidelity Central Funds.
The Money Market Central Funds seek preservation of capital and current income and are managed by Fidelity Investments Money Management, Inc. (FIMM), an affiliate of the investment adviser. Annualized expenses of the Money Market Central Funds as of their most recent shareholder report date are less than .005%.
A complete unaudited list of holdings for each Fidelity Central Fund is available upon request or at the Securities and Exchange Commission (the SEC) website at www.sec.gov. In addition, the financial statements of the Fidelity Central Funds are available on the SEC website or upon request.
3. Significant Accounting Policies.
The Fund is an investment company and applies the accounting and reporting guidance of the Financial Accounting Standards Board (FASB) Accounting Standards Codification Topic 946 Financial Services – Investments Companies. The financial statements have been prepared in conformity with accounting principles generally accepted in the United States of America (GAAP), which require management to make certain estimates and assumptions at the date of the financial statements. Actual results could differ from those estimates. Subsequent events, if any, through the date that the financial statements were issued have been evaluated in the preparation of the financial statements. The following summarizes the significant accounting policies of the Fund:
Investment Valuation. Investments are valued as of 4:00 p.m. Eastern time on the last calendar day of the period. The Board of Trustees (the Board) has delegated the day to day responsibility for the valuation of the Fund's investments to the Fair Value Committee (the Committee) established by the Fund's investment adviser. In accordance with valuation policies and procedures approved by the Board, the Fund attempts to obtain prices from one or more third party pricing vendors or brokers to value its investments. When current market prices, quotations or currency exchange rates are not readily available or reliable, investments will be fair valued in good faith by the Committee, in accordance with procedures adopted by the Board. Factors used in determining fair value vary by investment type and may include market or investment specific events. The frequency with which these procedures are used cannot be predicted and they may be utilized to a significant extent. The Committee oversees the Fund's valuation policies and procedures and reports to the Board on the Committee's activities and fair value determinations. The Board monitors the appropriateness of the procedures used in valuing the Fund's investments and ratifies the fair value determinations of the Committee.
The Fund categorizes the inputs to valuation techniques used to value its investments into a disclosure hierarchy consisting of three levels as shown below:
- Level 1 – quoted prices in active markets for identical investments
- Level 2 – other significant observable inputs (including quoted prices for similar investments, interest rates, prepayment speeds, etc.)
- Level 3 – unobservable inputs (including the Fund's own assumptions based on the best information available)
Valuation techniques used to value the Fund's investments by major category are as follows:
Equity securities, including restricted securities, for which market quotations are readily available, are valued at the last reported sale price or official closing price as reported by a third party pricing vendor on the primary market or exchange on which they are traded and are categorized as Level 1 in the hierarchy. In the event there were no sales during the day or closing prices are not available, securities are valued at the last quoted bid price or may be valued using the last available price and are generally categorized as Level 2 in the hierarchy. For foreign equity securities, when market or security specific events arise, comparisons to the valuation of American Depositary Receipts (ADRs), futures contracts, Exchange-Traded Funds (ETFs) and certain indexes as well as quoted prices for similar securities may be used and would be categorized as Level 2 in the hierarchy. For equity securities, including restricted securities, where observable inputs are limited, assumptions about market activity and risk are used and these securities may be categorized as Level 3 in the hierarchy.
Investments in open-end mutual funds, including the Fidelity Central Funds, are valued at their closing net asset value (NAV) each business day and are categorized as Level 1 in the hierarchy.
Changes in valuation techniques may result in transfers in or out of an assigned level within the disclosure hierarchy. The aggregate value of investments by input level as of April 30, 2019 is included at the end of the Fund's Schedule of Investments.
Foreign Currency. The Fund may use foreign currency contracts to facilitate transactions in foreign-denominated securities. Gains and losses from these transactions may arise from changes in the value of the foreign currency or if the counterparties do not perform under the contracts' terms.
Foreign-denominated assets, including investment securities, and liabilities are translated into U.S. dollars at the exchange rates at period end. Purchases and sales of investment securities, income and dividends received and expenses denominated in foreign currencies are translated into U.S. dollars at the exchange rate in effect on the transaction date.
The effects of exchange rate fluctuations on investments are included with the net realized and unrealized gain (loss) on investment securities. Other foreign currency transactions resulting in realized and unrealized gain (loss) are disclosed separately.
Investment Transactions and Income. For financial reporting purposes, the Fund's investment holdings and NAV include trades executed through the end of the last business day of the period. The NAV per share for processing shareholder transactions is calculated as of the close of business of the New York Stock Exchange (NYSE), normally 4:00 p.m. Eastern time and includes trades executed through the end of the prior business day. Gains and losses on securities sold are determined on the basis of identified cost and include proceeds received from litigation. Dividend income is recorded on the ex-dividend date, except for certain dividends from foreign securities where the ex-dividend date may have passed, which are recorded as soon as the Fund is informed of the ex-dividend date. Non-cash dividends included in dividend income, if any, are recorded at the fair market value of the securities received. Income and capital gain distributions from Fidelity Central Funds, if any, are recorded on the ex-dividend date. Certain distributions received by the Fund represent a return of capital or capital gain. The Fund determines the components of these distributions subsequent to the ex-dividend date, based upon receipt of tax filings or other correspondence relating to the underlying investment. These distributions are recorded as a reduction of cost of investments and/or as a realized gain. Investment income is recorded net of foreign taxes withheld where recovery of such taxes is uncertain.
Class Allocations and Expenses. Investment income, realized and unrealized capital gains and losses, common expenses of the Fund, and certain fund-level expense reductions, if any, are allocated daily on a pro-rata basis to each class based on the relative net assets of each class to the total net assets of the Fund. Each class differs with respect to transfer agent and distribution and service plan fees incurred. Certain expense reductions may also differ by class. For the reporting period, the allocated portion of income and expenses to each class as a percent of its average net assets may vary due to the timing of recording these transactions in relation to fluctuating net assets of the classes. Expenses directly attributable to a fund are charged to that fund. Expenses attributable to more than one fund are allocated among the respective funds on the basis of relative net assets or other appropriate methods. Expense estimates are accrued in the period to which they relate and adjustments are made when actual amounts are known.
Income Tax Information and Distributions to Shareholders. Each year, the Fund intends to qualify as a regulated investment company under Subchapter M of the Internal Revenue Code, including distributing substantially all of its taxable income and realized gains. As a result, no provision for U.S. Federal income taxes is required. The Fund files a U.S. federal tax return, in addition to state and local tax returns as required. The Fund's federal income tax returns are subject to examination by the Internal Revenue Service (IRS) for a period of three fiscal years after they are filed. State and local tax returns may be subject to examination for an additional fiscal year depending on the jurisdiction. Foreign taxes are provided for based on the Fund's understanding of the tax rules and rates that exist in the foreign markets in which it invests. The Fund is subject to a tax imposed on capital gains by certain countries in which it invests. An estimated deferred tax liability for net unrealized appreciation on the applicable securities is included in Other payables and accrued expenses on the Statement of Assets & Liabilities.
Distributions are declared and recorded on the ex-dividend date. Income and capital gain distributions are declared separately for each class. Income and capital gain distributions are determined in accordance with income tax regulations, which may differ from GAAP.
Capital accounts within the financial statements are adjusted for permanent book-tax differences. These adjustments have no impact on net assets or the results of operations. Capital accounts are not adjusted for temporary book-tax differences which will reverse in a subsequent period.
Book-tax differences are primarily due to foreign currency transactions, passive foreign investment companies (PFIC), deferred trustees compensation and losses deferred due to wash sales
As of period end, the cost and unrealized appreciation (depreciation) in securities, and derivatives if applicable, for federal income tax purposes were as follows:
| Gross unrealized appreciation | $481,625 |
| Gross unrealized depreciation | (52,059) |
| Net unrealized appreciation (depreciation) | $429,566 |
| Tax cost | $1,391,260 |
Delayed Delivery Transactions and When-Issued Securities. During the period, the transacted in securities on a delayed delivery or when-issued basis. Payment and delivery may take place after the customary settlement period for that security. The price of the underlying securities and the date when the securities will be delivered and paid for are fixed at the time the transaction is negotiated. The securities purchased on a delayed delivery or when-issued basis are identified as such in the Fund's Schedule of Investments. Losses may arise due to changes in the value of the underlying securities or if the counterparty does not perform under the contract's terms, or if the issuer does not issue the securities due to political, economic, or other factors.
Restricted Securities. The Fund may invest in securities that are subject to legal or contractual restrictions on resale. These securities generally may be resold in transactions exempt from registration or to the public if the securities are registered. Disposal of these securities may involve time-consuming negotiations and expense, and prompt sale at an acceptable price may be difficult. Information regarding restricted securities is included at the end of the Fund's Schedule of Investments.
4. Purchases and Sales of Investments.
Purchases and sales of securities, other than short-term securities, aggregated $387,119 and $561,663, respectively.
5. Fees and Other Transactions with Affiliates.
Management Fee. Fidelity Management & Research Company (the investment adviser) and its affiliates provide the Fund with investment management related services for which the Fund pays a monthly management fee. The management fee is the sum of an individual fund fee rate that is based on an annual rate of .424% of the Fund's average net assets and an annualized group fee rate that averaged .24% during the period. The group fee rate is based upon the average net assets of all the mutual funds advised by the investment adviser, including any mutual funds previously advised by the investment adviser that are currently advised by Fidelity SelectCo, LLC, an affiliate of the investment adviser. The group fee rate decreases as assets under management increase and increases as assets under management decrease. For the reporting period, the total annualized management fee rate was .66% of the Fund's average net assets.
Distribution and Service Plan Fees. In accordance with Rule 12b-1 of the 1940 Act, the Fund has adopted separate Distribution and Service Plans for each class of shares. Certain classes pay Fidelity Distributors Corporation (FDC), an affiliate of the investment adviser, separate Distribution and Service Fees, each of which is based on an annual percentage of each class' average net assets. In addition, FDC may pay financial intermediaries for selling shares of the Fund and providing shareholder support services. For the period, the Distribution and Service Fee rates, total fees and amounts retained by FDC were as follows:
| | Distribution Fee | Service Fee | Total Fees | Retained by FDC |
| Class A | -% | .25% | $574 | $10 |
| Class M | .25% | .25% | 428 | 9 |
| Class C | .75% | .25% | 631 | 36 |
| | | | $1,633 | $55 |
Sales Load. FDC may receive a front-end sales charge of up to 5.75% for selling Class A shares and 3.50% for selling Class M shares, some of which is paid to financial intermediaries for selling shares of the Fund. Depending on the holding period, FDC may receive contingent deferred sales charges levied on Class A, Class M and Class C redemptions. The deferred sales charges are 1.00% for Class C shares, 1.00% for certain purchases of Class A shares and .25% for certain purchases of Class M shares.
For the period, sales charge amounts retained by FDC were as follows:
| | Retained by FDC |
| Class A | $19 |
| Class M | 5 |
| Class C(a) | 4 |
| | $28 |
(a) When Class C shares are initially sold, FDC pays commissions from its own resources to financial intermediaries through which the sales are made.
Transfer Agent Fees. Fidelity Investments Institutional Operations Company, Inc., (FIIOC), an affiliate of the investment adviser, is the transfer, dividend disbursing and shareholder servicing agent for each class of the Fund. FIIOC receives account fees and asset-based fees that vary according to the account size and type of account of the shareholders of the respective classes of the Fund, except for Class Z. FIIOC receives an asset-based fee of Class Z's average net assets. FIIOC pays for typesetting, printing and mailing of shareholder reports, except proxy statements.
For the period, transfer agent fees for each class were as follows:
| | Amount | % of Class-Level Average Net Assets(a) |
| Class A | $495 | .21 |
| Class M | 202 | .24 |
| Class C | 149 | .24 |
| Class I | 727 | .19 |
| Class Z | 68 | .05 |
| | $1,641 | |
(a) Annualized
Accounting and Security Lending Fees. Fidelity Service Company, Inc. (FSC), an affiliate of the investment adviser, maintains the Fund's accounting records. The accounting fee is based on the level of average net assets for each month. Prior to April 1, 2019, FSC had a separate agreement with the Fund for administration of the security lending program, based on the number and duration of lending transactions. For the period, the total fees paid for accounting and administration of securities lending were equivalent to an annualized rate of .04%.
Brokerage Commissions. The Fund placed a portion of its portfolio transactions with brokerage firms which are affiliates of the investment adviser. Brokerage commissions are included in net realized gain (loss) and change in net unrealized appreciation (depreciation) in the Statement of Operations. The commissions paid to these affiliated firms were $1 for the period.
Interfund Trades. The Fund may purchase from or sell securities to other Fidelity Funds under procedures adopted by the Board. The procedures have been designed to ensure these interfund trades are executed in accordance with Rule 17a-7 of the 1940 Act. Interfund trades are included within the respective purchases and sales amounts shown in the Purchases and Sales of Investments note.
6. Committed Line of Credit.
The Fund participates with other funds managed by the investment adviser or an affiliate in a $4.25 billion credit facility (the "line of credit") to be utilized for temporary or emergency purposes to fund shareholder redemptions or for other short-term liquidity purposes. The Fund has agreed to pay commitment fees on its pro-rata portion of the line of credit, which amounted to $3 and is reflected in Miscellaneous expenses on the Statement of Operations. During the period, the Fund did not borrow on this line of credit.
7. Security Lending.
The Fund lends portfolio securities through a lending agent from time to time in order to earn additional income. For equity securities, a lending agent is used and may loan securities to certain qualified borrowers, including Fidelity Capital Markets (FCM), a broker-dealer affiliated with the Fund. On the settlement date of the loan, the Fund receives collateral (in the form of U.S. Treasury obligations, letters of credit and/or cash) against the loaned securities and maintains collateral in an amount not less than 100% of the market value of the loaned securities during the period of the loan. The market value of the loaned securities is determined at the close of business of the Fund and any additional required collateral is delivered to the Fund on the next business day. The Fund or borrower may terminate the loan at any time, and if the borrower defaults on its obligation to return the securities loaned because of insolvency or other reasons, the Fund may apply collateral received from the borrower against the obligation. The Fund may experience delays and costs in recovering the securities loaned. Any cash collateral received is invested in the Fidelity Securities Lending Cash Central Fund. The value of loaned securities and cash collateral at period end are disclosed on the Fund's Statement of Assets and Liabilities. Security lending income represents the income earned on investing cash collateral, less rebates paid to borrowers and any lending agent fees associated with the loan, plus any premium payments received for lending certain types of securities. Security lending income is presented in the Statement of Operations as a component of income from Fidelity Central Funds. Total security lending income during the period amounted to $53. During the period, there were no securities loaned to FCM.
8. Expense Reductions.
Commissions paid to certain brokers with whom the investment adviser, or its affiliates, places trades on behalf of the Fund include an amount in addition to trade execution, which may be rebated back to the Fund to offset certain expenses. This amount totaled $62 for the period. In addition, through arrangements with the Fund's custodian, credits realized as a result of certain uninvested cash balances were used to reduce the Fund's expenses. During the period, these credits reduced the Fund's custody expenses in an amount less than five hundred dollars.
In addition, during the period the investment adviser reimbursed and/or waived a portion of fund-level operating expenses in the amount of $7.
9. Distributions to Shareholders.
Distributions to shareholders of each class were as follows:
| | Six months ended
April 30, 2019 | Year ended
October 31, 2018 |
| Distributions to shareholders | | |
| Class A | $19,552 | $5,653 |
| Class M | 6,962 | 1,520 |
| Class C | 5,360 | 401 |
| Class I | 36,043 | 12,234 |
| Class Z | 14,122 | 4,237 |
| Total | $82,038 | $24,045 |
10. Share Transactions.
Share transactions for each class were as follows and may contain automatic conversions between classes or exchanges between affiliated funds:
| | Shares | Shares | Dollars | Dollars |
| | Six months ended April 30, 2019 | Year ended October 31, 2018 | Six months ended April 30, 2019 | Year ended October 31, 2018 |
| Class A | | | | |
| Shares sold | 4,242 | 2,464 | $89,325 | $58,230 |
| Reinvestment of distributions | 940 | 235 | 18,359 | 5,469 |
| Shares redeemed | (2,960) | (5,429) | (60,499) | (126,599) |
| Net increase (decrease) | 2,222 | (2,730) | $47,185 | $(62,900) |
| Class M | | | | |
| Shares sold | 277 | 557 | $5,661 | $13,025 |
| Reinvestment of distributions | 353 | 64 | 6,857 | 1,487 |
| Shares redeemed | (817) | (1,889) | (16,728) | (44,045) |
| Net increase (decrease) | (187) | (1,268) | $(4,210) | $(29,533) |
| Class C | | | | |
| Shares sold | 147 | 462 | $2,848 | $10,419 |
| Reinvestment of distributions | 280 | 16 | 5,253 | 361 |
| Shares redeemed | (4,689) | (2,468) | (94,422) | (55,659) |
| Net increase (decrease) | (4,262) | (1,990) | $(86,321) | $(44,879) |
| Class I | | | | |
| Shares sold | 2,519 | 6,999 | $51,934 | $164,832 |
| Reinvestment of distributions | 1,548 | 434 | 30,665 | 10,246 |
| Shares redeemed | (6,742) | (9,766) | (139,527) | (231,388) |
| Net increase (decrease) | (2,675) | (2,333) | $(56,928) | $(56,310) |
| Class Z | | | | |
| Shares sold | 3,101 | 5,480 | $65,002 | $130,793 |
| Reinvestment of distributions | 636 | 164 | 12,575 | 3,858 |
| Shares redeemed | (5,723) | (3,743) | (121,481) | (89,906) |
| Net increase (decrease) | (1,986) | 1,901 | $(43,904) | $44,745 |
11. Other.
The Fund's organizational documents provide former and current trustees and officers with a limited indemnification against liabilities arising in connection with the performance of their duties to the Fund. In the normal course of business, the Fund may also enter into contracts that provide general indemnifications. The Fund's maximum exposure under these arrangements is unknown as this would be dependent on future claims that may be made against the Fund. The risk of material loss from such claims is considered remote.
Shareholder Expense Example
As a shareholder of the Fund, you incur two types of costs: (1) transaction costs, including sales charges (loads) on purchase payments or redemption proceeds, and (2) ongoing costs, including management fees, distribution and/or service (12b-1) fees and other Fund expenses. This Example is intended to help you understand your ongoing costs (in dollars) of investing in the Fund and to compare these costs with the ongoing costs of investing in other mutual funds.
The Example is based on an investment of $1,000 invested at the beginning of the period and held for the entire period (November 1, 2018 to April 30, 2019).
Actual Expenses
The first line of the accompanying table for each class of the Fund provides information about actual account values and actual expenses. You may use the information in this line, together with the amount you invested, to estimate the expenses that you paid over the period. Simply divide your account value by $1,000.00 (for example, an $8,600 account value divided by $1,000.00 = 8.6), then multiply the result by the number in the first line for a class of the Fund under the heading entitled "Expenses Paid During Period" to estimate the expenses you paid on your account during this period. In addition, the Fund, as a shareholder in the underlying Fidelity Central Funds, will indirectly bear its pro-rata share of the fees and expenses incurred by the underlying Fidelity Central Funds. These fees and expenses are not included in the Fund's annualized expense ratio used to calculate the expense estimate in the table below.
Hypothetical Example for Comparison Purposes
The second line of the accompanying table for each class of the Fund provides information about hypothetical account values and hypothetical expenses based on a Class' actual expense ratio and an assumed rate of return of 5% per year before expenses, which is not the Class' actual return. The hypothetical account values and expenses may not be used to estimate the actual ending account balance or expenses you paid for the period. You may use this information to compare the ongoing costs of investing in the Fund and other funds. To do so, compare this 5% hypothetical example with the 5% hypothetical examples that appear in the shareholder reports of the other funds. In addition, the Fund, as a shareholder in the underlying Fidelity Central Funds, will indirectly bear its pro-rata share of the fees and expenses incurred by the underlying Fidelity Central Funds. These fees and expenses are not included in the Fund's annualized expense ratio used to calculate the expense estimate in the table below.
Please note that the expenses shown in the table are meant to highlight your ongoing costs only and do not reflect any transaction costs. Therefore, the second line of the table is useful in comparing ongoing costs only, and will not help you determine the relative total costs of owning different funds. In addition, if these transactional costs were included, your costs would have been higher.
| | Annualized Expense Ratio-A | Beginning
Account Value
November 1, 2018 | Ending
Account Value
April 30, 2019 | Expenses Paid
During Period-B
November 1, 2018
to April 30, 2019 |
| Class A | 1.20% | | | |
| Actual | | $1,000.00 | $1,092.70 | $6.23 |
| Hypothetical-C | | $1,000.00 | $1,018.84 | $6.01 |
| Class M | 1.47% | | | |
| Actual | | $1,000.00 | $1,091.40 | $7.62 |
| Hypothetical-C | | $1,000.00 | $1,017.50 | $7.35 |
| Class C | 1.98% | | | |
| Actual | | $1,000.00 | $1,088.80 | $10.25 |
| Hypothetical-C | | $1,000.00 | $1,014.98 | $9.89 |
| Class I | .92% | | | |
| Actual | | $1,000.00 | $1,094.30 | $4.78 |
| Hypothetical-C | | $1,000.00 | $1,020.23 | $4.61 |
| Class Z | .78% | | | |
| Actual | | $1,000.00 | $1,094.70 | $4.05 |
| Hypothetical-C | | $1,000.00 | $1,020.93 | $3.91 |
A Annualized expense ratio reflects expenses net of applicable fee waivers.
B Expenses are equal to each Class' annualized expense ratio, multiplied by the average account value over the period, multiplied by 181/365 (to reflect the one-half year period).
C 5% return per year before expenses
Board Approval of Investment Advisory Contracts and Management Fees
Fidelity Advisor Diversified International Fund
Each year, the Board of Trustees, including the Independent Trustees (together, the Board), votes on the renewal of the management contract with Fidelity Management & Research Company (FMR) and the sub-advisory agreements (together, the Advisory Contracts) for the fund. FMR and the sub-advisers are referred to herein as the Investment Advisers. The Board, assisted by the advice of fund counsel and Independent Trustees' counsel, requests and considers a broad range of information relevant to the renewal of the Advisory Contracts throughout the year.
The Board meets regularly and, at each of its meetings, covers an extensive agenda of topics and materials and considers factors that are relevant to its annual consideration of the renewal of the fund's Advisory Contracts, including the services and support provided to the fund and its shareholders. The Board has established various standing committees (Committees), each composed of and chaired by Independent Trustees with varying backgrounds, to which the Board has assigned specific subject matter responsibilities in order to enhance effective decision-making by the Board. The Board, acting directly and through its Committees, requests and receives information concerning the annual consideration of the renewal of the fund's Advisory Contracts. The Board also meets as needed to review matters specifically related to the Board's annual consideration of the renewal of the Advisory Contracts. Members of the Board may also meet with trustees of other Fidelity funds through joint ad hoc committees to discuss certain matters relevant to all of the Fidelity funds.
At its January 2019 meeting, the Board unanimously determined to renew the fund's Advisory Contracts. In reaching its determination, the Board considered all factors it believed relevant, including (i) the nature, extent, and quality of the services to be provided to the fund and its shareholders (including the investment performance of the fund); (ii) the competitiveness of the fund's management fee and total expense ratio relative to peer funds; (iii) the total costs of the services to be provided by and the profits to be realized by Fidelity from its relationships with the fund; and (iv) the extent to which, if any, economies of scale exist and would be realized as the fund grows, and whether any economies of scale are appropriately shared with fund shareholders.
In considering whether to renew the Advisory Contracts for the fund, the Board reached a determination, with the assistance of fund counsel and Independent Trustees' counsel and through the exercise of its business judgment, that the renewal of the Advisory Contracts was in the best interests of the fund and its shareholders and that the compensation payable under the Advisory Contracts was fair and reasonable. The Board's decision to renew the Advisory Contracts was not based on any single factor, but rather was based on a comprehensive consideration of all the information provided to the Board at its meetings throughout the year. The Board, in reaching its determination to renew the Advisory Contracts, was aware that shareholders of the fund have a broad range of investment choices available to them, including a wide choice among funds offered by Fidelity's competitors, and that the fund's shareholders, who have the opportunity to review and weigh the disclosure provided by the fund in its prospectus and other public disclosures, have chosen to invest in this fund, which is part of the Fidelity family of funds.
Nature, Extent, and Quality of Services Provided. The Board considered Fidelity's staffing as it relates to the fund, including the backgrounds of investment personnel of Fidelity, and also considered the fund's investment objective, strategies, and related investment philosophy. The Independent Trustees also had discussions with senior management of Fidelity's investment operations and investment groups. The Board considered the structure of the investment personnel compensation program and whether this structure provides appropriate incentives to act in the best interests of the fund. Additionally, the Board considered the portfolio managers' investments, if any, in the funds that they manage.
Resources Dedicated to Investment Management and Support Services. The Board and the Fund Oversight and Research Committees reviewed the general qualifications and capabilities of Fidelity's investment staff, including its size, education, experience, and resources, as well as Fidelity's approach to recruiting, training, managing, and compensating investment personnel. The Board noted that Fidelity has continued to increase the resources devoted to non-U.S. offices, including expansion of Fidelity's global investment organization. The Board also noted that Fidelity's analysts have extensive resources, tools and capabilities that allow them to conduct sophisticated quantitative and fundamental analysis, as well as credit analysis of issuers, counterparties and guarantors. Further, the Board considered that Fidelity's investment professionals have sufficient access to global information and data so as to provide competitive investment results over time, and that those professionals also have access to sophisticated tools that permit them to assess portfolio construction and risk and performance attribution characteristics continuously, as well as to transmit new information and research conclusions rapidly around the world. Additionally, in its deliberations, the Board considered Fidelity's trading, risk management, compliance, and technology and operations capabilities and resources, which are integral parts of the investment management process.
Shareholder and Administrative Services. The Board considered (i) the nature, extent, quality, and cost of advisory, administrative, and shareholder services performed by the Investment Advisers and their affiliates under the Advisory Contracts and under separate agreements covering transfer agency, pricing and bookkeeping, and securities lending services for the fund; (ii) the nature and extent of the supervision of third party service providers, principally custodians, subcustodians, and pricing vendors; and (iii) the resources devoted to, and the record of compliance with, the fund's compliance policies and procedures. The Board also reviewed the allocation of fund brokerage, including allocations to brokers affiliated with the Investment Advisers, the use of brokerage commissions to pay fund expenses, and the use of "soft" commission dollars to pay for research services.
The Board noted that the growth of fund assets over time across the complex allows Fidelity to reinvest in the development of services designed to enhance the value and convenience of the Fidelity funds as investment vehicles. These services include 24-hour access to account information and market information through telephone representatives and over the Internet, investor education materials and asset allocation tools, and the expanded availability of Fidelity Investor Centers.
The Board noted that it and the boards of certain other Fidelity funds had formed an ad hoc Committee on Transfer Agency Fees to review the variety of transfer agency fee structures throughout the industry and Fidelity's competitive positioning with respect to industry participants.
Investment in a Large Fund Family. The Board considered the benefits to shareholders of investing in a Fidelity fund, including the benefits of investing in a fund that is part of a large family of funds offering a variety of investment disciplines and providing a large variety of mutual fund investor services. The Board noted that Fidelity had taken, or had made recommendations that resulted in the Fidelity funds taking, a number of actions over the previous year that benefited particular funds, including: (i) continuing to dedicate additional resources to Fidelity's investment research process, which includes meetings with management of issuers of securities in which the funds invest, and to the support of the senior management team that oversees asset management; (ii) continuing efforts to enhance Fidelity's global research capabilities; (iii) launching new funds and making other enhancements to meet client needs; (iv) launching new share classes of existing funds; (v) eliminating purchase minimums and broadening eligibility requirements for certain funds and share classes; (vi) reducing management fees and total expenses for certain growth equity funds and index funds; (vii) lowering expense caps for certain existing funds and classes, and converting certain voluntary expense caps to contractual caps, to reduce expenses borne by shareholders; (viii) eliminating short-term redemption fees for funds that had such fees; (ix) rationalizing product lines and gaining increased efficiencies from fund mergers and share class consolidations; (x) continuing to develop, acquire and implement systems and technology to improve services to the funds and shareholders, strengthen information security, and increase efficiency; and (xi) continuing to implement enhancements to further strengthen Fidelity's product line to increase investors' probability of success in achieving their investment goals, including retirement income goals.
Investment Performance. The Board considered whether the fund has operated in accordance with its investment objective, as well as its record of compliance with its investment restrictions and its performance history.
The Board took into account discussions that occur at Board meetings throughout the year with representatives of the Investment Advisers about fund investment performance. In this regard the Board noted that as part of regularly scheduled fund reviews and other reports to the Board on fund performance, the Board considers annualized return information for the fund for different time periods, measured against an appropriate securities market index ("benchmark index") and a peer group of funds with similar objectives ("peer group"), if any. In its evaluation of fund investment performance, the Board gave particular attention to information indicating changes in performance of certain Fidelity funds for specific time periods and discussed with the Investment Advisers the reasons for any overperformance or underperformance.
In addition to reviewing absolute and relative fund performance, the Independent Trustees periodically consider the appropriateness of fund performance metrics in evaluating the results achieved. In general, the Independent Trustees believe that fund performance should be evaluated based on net performance (after fees and expenses) of both the highest performing and lowest performing fund share classes, where applicable, compared to appropriate benchmark indices, over appropriate time periods that may include full market cycles, and compared to peer groups, as applicable, over the same periods, taking into account relevant factors including the following: general market conditions; issuer-specific information; and fund cash flows and other factors.
The Independent Trustees recognize that shareholders evaluate performance on a net basis over their own holding periods, for which one-, three-, and five-year periods are often used as a proxy. For this reason, the performance information reviewed by the Board also included net cumulative total return information for the fund and an appropriate benchmark index and peer group for the most recent one-, three-, and five-year periods ended June 30, 2018, as shown below. Returns are shown compared to the 25th percentile (top of box, 75% beaten) and 75th percentile (bottom of box, 25% beaten) of the peer universe. Returns of the benchmark index are "net MA,"
i.e., adjusted for tax withholding rates applicable to U.S.-based funds organized as Massachusetts business trusts.
Fidelity Advisor Diversified International Fund
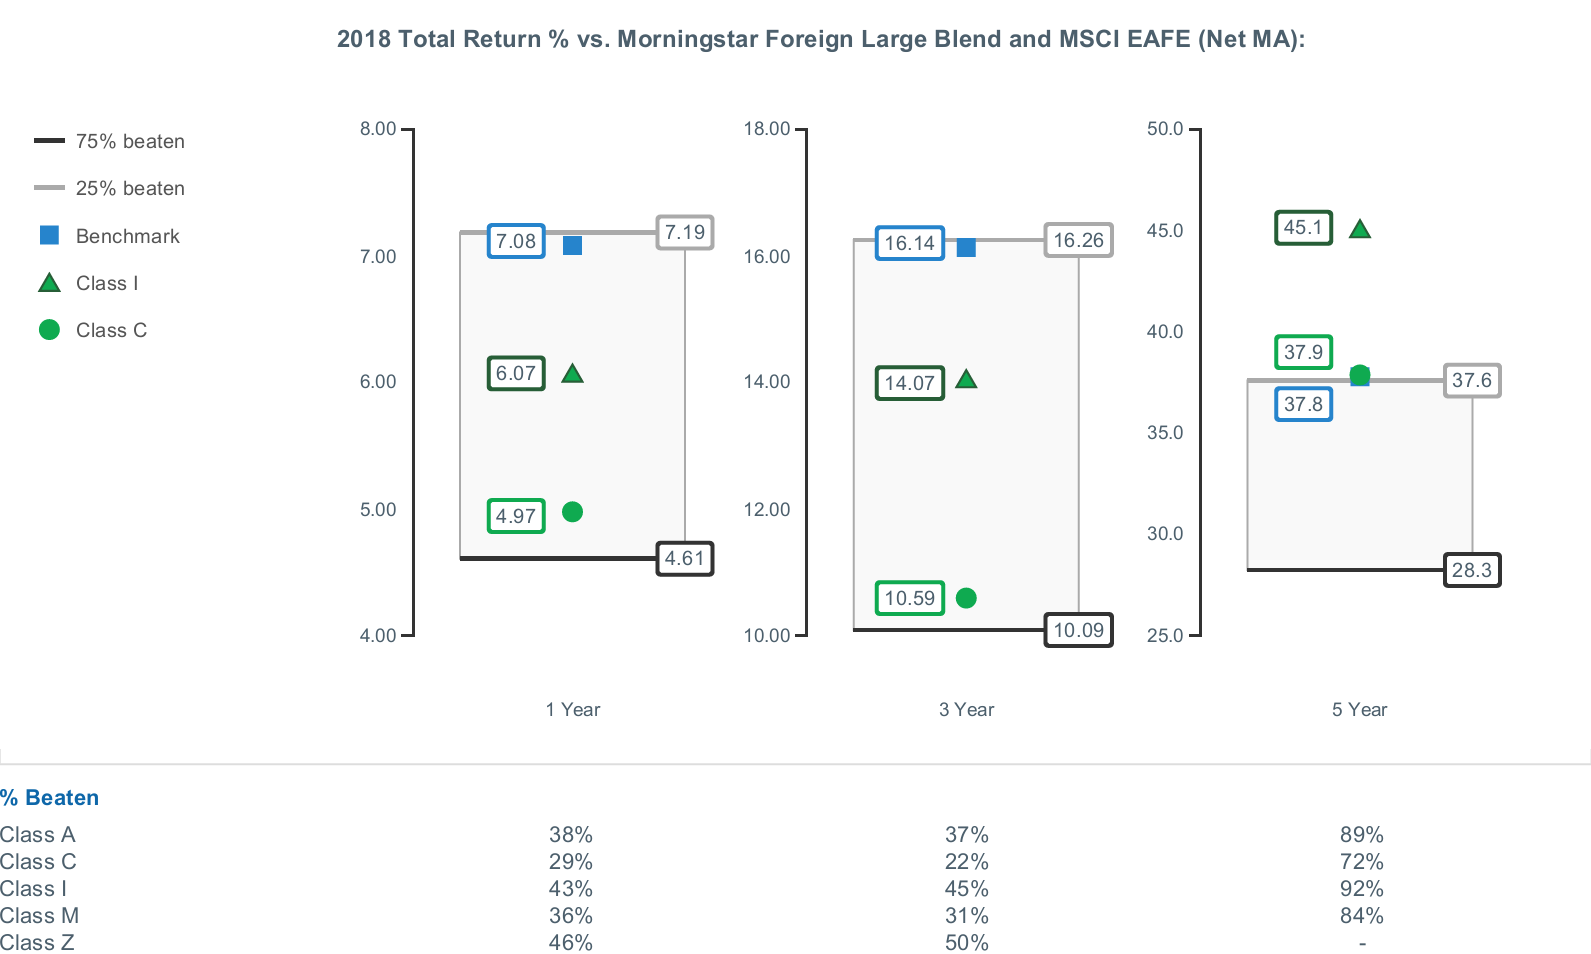
The Board considered the fund's underperformance for different time periods based on the June 30, 2018 data presented above and based on earlier periods ended prior to June 30, 2018. The Board's discussions with FMR regarding underperformance cover topics including, but not limited to: the longer-term track record of a fund's portfolio manager(s); broader trends in the market that may adversely impact a fund's performance; attribution reports on contributors to the fund's underperformance; and the applicable portfolio manager's explanation of his or her underperformance. The Board engages with FMR on steps that might be taken to address a fund's underperformance.
Based on its review, the Board concluded that the nature, extent, and quality of services provided to the fund under the Advisory Contracts should continue to benefit the shareholders of the fund.
Competitiveness of Management Fee and Total Expense Ratio. The Board considered the fund's management fee and total expense ratio compared to "mapped groups" of competitive funds and classes created for the purpose of facilitating the Trustees' competitive analysis of management fees and total expenses. Fidelity creates "mapped groups" by combining similar Lipper investment objective categories that have comparable investment mandates. Combining Lipper investment objective categories aids the Board's management fee and total expense ratio comparisons by broadening the competitive group used for comparison.
Management Fee. The Board considered two proprietary management fee comparisons for the 12-month periods (ended June 30 for 2018 and December 31 for prior periods) shown in basis points (BP) in the chart below. The group of Lipper funds used by the Board for management fee comparisons is referred to below as the "Total Mapped Group." The Total Mapped Group comparison focuses on a fund's standing in terms of gross management fees before expense reimbursements or caps relative to the total universe of funds with comparable investment mandates, regardless of whether their management fee structures also are comparable. Funds with comparable investment mandates offer exposure to similar types of securities. Funds with comparable management fee structures have similar management fee contractual arrangements (
e.g., flat rate charged for advisory services, all-inclusive fee rate,
etc.). "TMG %" represents the percentage of funds in the Total Mapped Group that had management fees that were lower than the fund's. For example, a hypothetical TMG % of 20% would mean that 80% of the funds in the Total Mapped Group had higher, and 20% had lower, management fees than the fund. The fund's actual TMG %s and the number of funds in the Total Mapped Group are in the chart below. The "Asset-Size Peer Group" (ASPG) comparison focuses on a fund's standing relative to a subset of non-Fidelity funds within the Total Mapped Group that are similar in size and management fee structure. For example, if a fund is in the first quartile of the ASPG, the fund's management fee ranks in the least expensive or lowest 25% of funds in the ASPG. The ASPG represents at least 15% of the funds in the Total Mapped Group with comparable asset size and management fee structures, subject to a minimum of 50 funds (or all funds in the Total Mapped Group if fewer than 50). Additional information, such as the ASPG quartile in which the fund's management fee rate ranked, is also included in the chart and was considered by the Board.
Fidelity Advisor Diversified International Fund
The Board considered that effective August 1, 2014, the fund's individual fund fee rate was reduced from 0.450% to 0.424%. The Board considered that the chart below reflects the fund's lower management fee rate for 2014, as if the lower fee rate were in effect for the entire year.
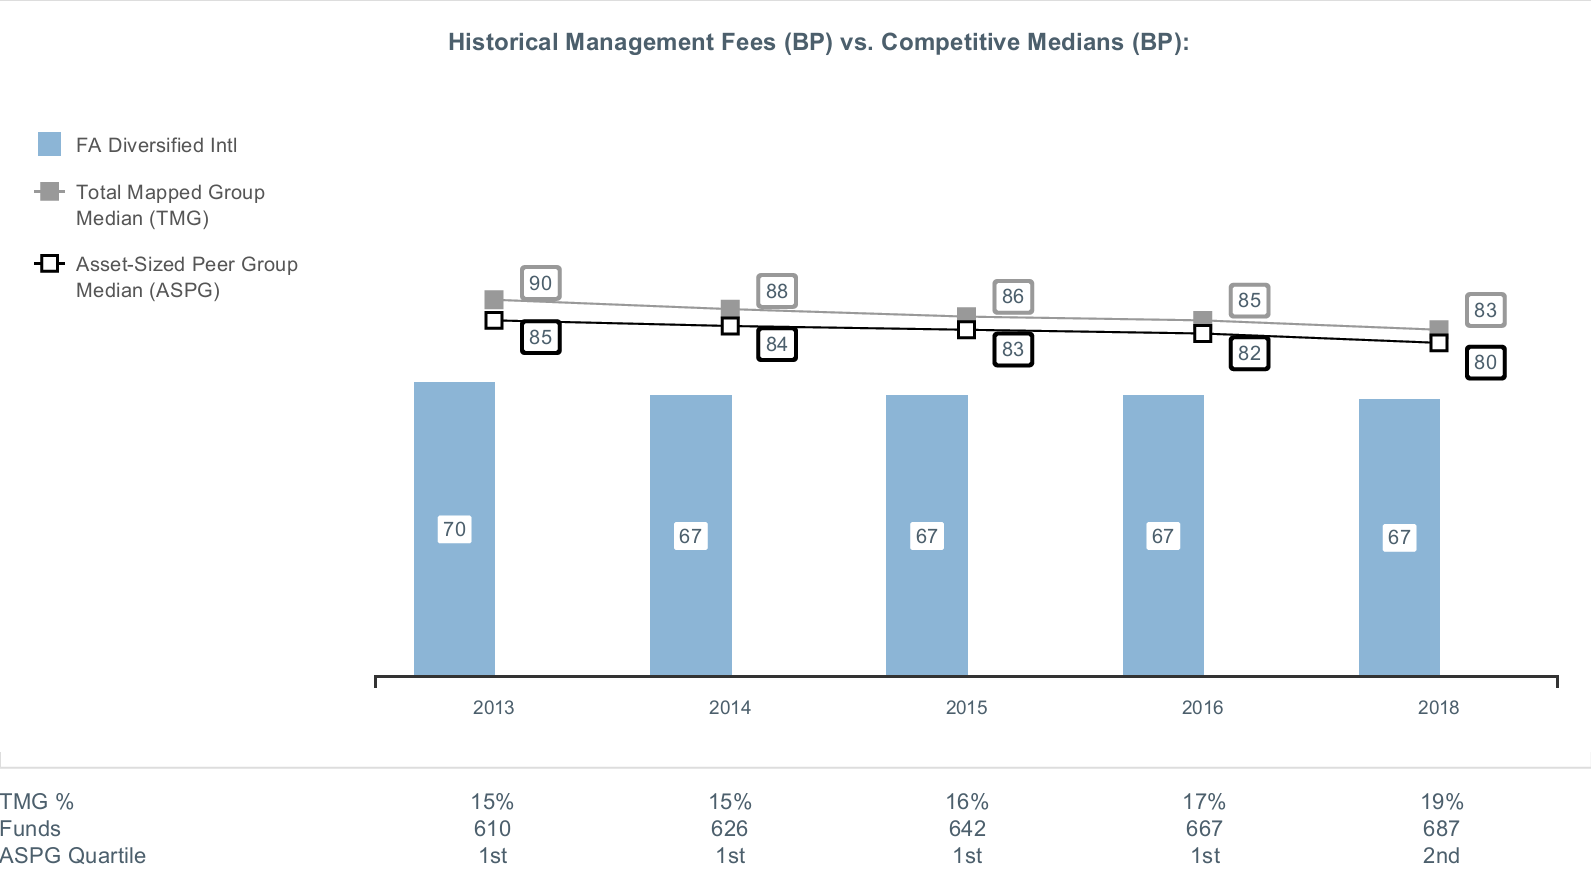
The Board noted that the fund's management fee rate ranked below the median of its Total Mapped Group and below the median of its ASPG for the 12-month period ended June 30, 2018.
The Board noted that it and the boards of other Fidelity funds formed an ad hoc Committee on Group Fee, which meets periodically, to conduct an in-depth review of the "group fee" component of the management fee of funds with such management fee structures. The Committee's focus included the mechanics of the group fee, the competitive landscape of group fee structures, Fidelity funds with no group fee component and investment products not included in group fee assets. The Board also considered that, for funds subject to the group fee, FMR agreed to voluntarily waive fees over a specified period of time in amounts designed to account for assets converted from certain funds to certain collective investment trusts.
The Board also noted that, in 2013, the ad hoc Committee on Management Fees was formed to conduct an in-depth review of the management fee rates of Fidelity's active equity mutual funds. The Committee focused on the following areas: (i) standard fee structures; (ii) research consumption and trading evolution; (iii) management fee competitiveness/profitability by category; and (iv) factors that drive institutional pricing.
Based on its review, the Board concluded that the fund's management fee is fair and reasonable in light of the services that the fund receives and the other factors considered.
Total Expense Ratio. In its review of each class's total expense ratio, the Board considered the fund's management fee rate as well as other fund or class expenses, as applicable, such as transfer agent fees, pricing and bookkeeping fees, fund-paid 12b-1 fees, and custodial, legal, and audit fees. The Board also noted that Fidelity may agree to waive fees and expenses from time to time, and the extent to which, if any, it has done so for the fund. As part of its review, the Board also considered the current and historical total expense ratios of each class of the fund compared to competitive fund median expenses. Each class of the fund is compared to those funds and classes in the Total Mapped Group (used by the Board for management fee comparisons) that have a similar sales load structure.
The Board noted that the total expense ratio of each of Class A, Class C, Class I, and Class Z ranked below the competitive median for the 12-month period ended June 30, 2018, and the total expense ratio of Class M ranked above the competitive median for the 12-month period ended June 30, 2018. The Board considered that, in general, various factors can affect total expense ratios. The Board noted that the total expense ratio of Class M was above the competitive median primarily because of higher 12b-1 fees on Class M as compared to most competitor funds. Class M has a higher 12b-1 fee, but a lower front-end sales charge, than traditionally priced front-end sales charge classes. The Board considered that Class M is primarily sold load-waived to retirement plans and intermediary wrap programs where its 0.50% 12b-1 fee is comparable to competing no-load, higher 12b-1 fee classes designed specifically for retirement plans and wrap programs. The Board noted that, when compared with competitor funds that charge a 0.50% 12b-1 fee, the total expense ratio of Class M is below median. The Board noted that the fund offers multiple classes, each of which has a different sales load and 12b-1 fee structure, and that the multiple structures are intended to offer a range of pricing options for the intermediary market. The Board also noted that the total expense ratios of the classes vary primarily by the level of their 12b-1 fees, although differences in transfer agent fees may also cause expenses to vary from class to class.
Fees Charged to Other Fidelity Clients. The Board also considered Fidelity fee structures and other information with respect to clients of Fidelity, such as other funds advised or subadvised by Fidelity, pension plan clients, and other institutional clients with similar mandates. The Board noted that a joint ad hoc committee created by it and the boards of other Fidelity funds periodically reviews and compares Fidelity's institutional investment advisory business with its business of providing services to the Fidelity funds and also noted the most recent findings of the committee. The Board noted that the committee's review included a consideration of the differences in services provided, fees charged, and costs incurred, as well as competition in the markets serving the different categories of clients.
Based on its review of total expense ratios and fees charged to other Fidelity clients, the Board concluded that the total expense ratio of each class of the fund was reasonable in light of the services that the fund and its shareholders receive and the other factors considered.
Costs of the Services and Profitability. The Board considered the revenues earned and the expenses incurred by Fidelity in conducting the business of developing, marketing, distributing, managing, administering and servicing the fund and servicing the fund's shareholders. The Board also considered the level of Fidelity's profits in respect of all the Fidelity funds.
On an annual basis, Fidelity presents to the Board information about the profitability of its relationships with the fund. Fidelity calculates profitability information for each fund, as well as aggregate profitability information for groups of Fidelity funds and all Fidelity funds, using a series of detailed revenue and cost allocation methodologies which originate with the books and records of Fidelity on which Fidelity's audited financial statements are based. The Audit Committee of the Board reviews any significant changes from the prior year's methodologies.
PricewaterhouseCoopers LLP (PwC), auditor to Fidelity and certain Fidelity funds, has been engaged annually by the Board as part of the Board's assessment of Fidelity's profitability analysis. PwC's engagement includes the review and assessment of the methodologies used by Fidelity in determining the revenues and expenses attributable to Fidelity's mutual fund business, and completion of agreed-upon procedures in respect of the mathematical accuracy of the fund profitability information and its conformity to established allocation methodologies. After considering PwC's reports issued under the engagement and information provided by Fidelity, the Board concluded that while other allocation methods may also be reasonable, Fidelity's profitability methodologies are reasonable in all material respects.
The Board also reviewed Fidelity's non-fund businesses and potential indirect benefits such businesses may have received as a result of their association with Fidelity's mutual fund business (i.e., fall-out benefits) as well as cases where Fidelity's affiliates may benefit from the fund's business. The Board noted that changes to fall-out benefits year-over-year reflect business developments at Fidelity's various businesses.
The Board considered the costs of the services provided by and the profits realized by Fidelity in connection with the operation of the fund and was satisfied that the profitability was not excessive.
Economies of Scale. The Board considered whether there have been economies of scale in respect of the management of the Fidelity funds, whether the Fidelity funds (including the fund) have appropriately benefited from any such economies of scale, and whether there is potential for realization of any further economies of scale. The Board considered the extent to which the fund will benefit from economies of scale as assets grow through increased services to the fund, through waivers or reimbursements, or through fee or expense ratio reductions. The Board also noted that a committee (the Economies of Scale Committee) created by it and the boards of other Fidelity funds periodically analyzes whether Fidelity attains economies of scale in respect of the management and servicing of the Fidelity funds, whether the Fidelity funds have appropriately benefited from such economies of scale, and whether there is potential for realization of any further economies of scale.
The Board recognized that the fund's management contract incorporates a "group fee" structure, which provides for lower group fee rates as total group assets increase, and for higher group fee rates as total group assets decrease (with "group assets" defined to include fund assets under FMR's management plus the assets of sector funds previously under FMR's management). FMR calculates the group fee rates based on a tiered asset "breakpoint" schedule that varies based on asset class. The Board considered that the group fee is designed to deliver the benefits of economies of scale to fund shareholders when total Fidelity fund assets increase, even if assets of any particular fund are unchanged or have declined, because some portion of Fidelity's costs are attributable to services provided to all Fidelity funds, and all funds benefit if those costs can be allocated among more assets. The Board concluded that, given the group fee structure, fund shareholders will benefit from lower management fees as group assets increase at the fund complex level, regardless of whether Fidelity achieves any such economies of scale.
The Board concluded, taking into account the analysis of the Economies of Scale Committee, that economies of scale, if any, are being appropriately shared between fund shareholders and Fidelity.
Additional Information Requested by the Board. In order to develop fully the factual basis for consideration of the Fidelity funds' advisory contracts, the Board requested and received additional information on certain topics, including: (i) fund performance trends, in particular the underperformance of certain funds, and Fidelity's long-term strategies for certain funds; (ii) Fidelity's fund profitability methodology, profitability trends for certain funds, and the impact of certain factors on fund profitability results; (iii) metrics for evaluating index fund and ETF performance and information about ETF trading characteristics; (iv) the methodology with respect to the evaluation of competitive fund data and peer group classifications and fee comparisons; (v) the expense structures for different funds and classes; (vi) information regarding other accounts managed by Fidelity, including collective investment trusts; and (vii) Fidelity's philosophies and strategies for evaluating funds and classes with lower or declining asset levels.
Based on its evaluation of all of the conclusions noted above, and after considering all factors it believed relevant, the Board concluded that the advisory fee arrangements are fair and reasonable, and that the fund's Advisory Contracts should be renewed.
ADIF-SANN-0619
1.720067.120
Fidelity Advisor® Global Capital Appreciation Fund
Semi-Annual Report April 30, 2019 |
|
Beginning on January 1, 2021, as permitted by regulations adopted by the Securities and Exchange Commission, paper copies of a fund’s shareholder reports will no longer be sent by mail, unless you specifically request paper copies of the reports from the fund or from your financial intermediary, such as a financial advisor, broker-dealer or bank. Instead, the reports will be made available on a website, and you will be notified by mail each time a report is posted and provided with a website link to access the report.
If you already elected to receive shareholder reports electronically, you will not be affected by this change and you need not take any action. You may elect to receive shareholder reports and other communications from a fund electronically, by contacting your financial intermediary. For Fidelity customers, visit Fidelity's web site or call Fidelity using the contact information listed below.
You may elect to receive all future reports in paper free of charge. If you wish to continue receiving paper copies of your shareholder reports, you may contact your financial intermediary or, if you are a Fidelity customer, visit Fidelity’s website, or call Fidelity at the applicable toll-free number listed below. Your election to receive reports in paper will apply to all funds held with the fund complex/your financial intermediary.
| Account Type | Website�� | Phone Number |
| Brokerage, Mutual Fund, or Annuity Contracts: | fidelity.com/mailpreferences | 1-800-343-3548 |
| Employer Provided Retirement Accounts: | netbenefits.fidelity.com/preferences (choose 'no' under Required Disclosures to continue to print) | 1-800-343-0860 |
| Advisor Sold Accounts Serviced Through Your Financial Intermediary: | Contact Your Financial Intermediary | Your Financial Intermediary's phone number |
| Advisor Sold Accounts Serviced by Fidelity: | institutional.fidelity.com | 1-877-208-0098 |
Contents
To view a fund's proxy voting guidelines and proxy voting record for the 12-month period ended June 30, visit http://www.fidelity.com/proxyvotingresults or visit the Securities and Exchange Commission's (SEC) web site at http://www.sec.gov.
You may also call 1-877-208-0098 to request a free copy of the proxy voting guidelines.
Standard & Poor's, S&P and S&P 500 are registered service marks of The McGraw-Hill Companies, Inc. and have been licensed for use by Fidelity Distributors Corporation.
Other third-party marks appearing herein are the property of their respective owners.
All other marks appearing herein are registered or unregistered trademarks or service marks of FMR LLC or an affiliated company. © 2019 FMR LLC. All rights reserved.
This report and the financial statements contained herein are submitted for the general information of the shareholders of the Fund. This report is not authorized for distribution to prospective investors in the Fund unless preceded or accompanied by an effective prospectus.
A fund files its complete schedule of portfolio holdings with the SEC for the first and third quarters of each fiscal year on Form N-PORT. Forms N-PORT are available on the SEC’s web site at http://www.sec.gov. A fund's Forms N-PORT may be reviewed and copied at the SEC’s Public Reference Room in Washington, DC. Information regarding the operation of the SEC's Public Reference Room may be obtained by calling 1-800-SEC-0330.
For a complete list of a fund's portfolio holdings, view the most recent holdings listing, semiannual report, or annual report on Fidelity's web site at http://www.fidelity.com, http://www.institutional.fidelity.com, or http://www.401k.com, as applicable.
NOT FDIC INSURED •MAY LOSE VALUE •NO BANK GUARANTEE
Neither the Fund nor Fidelity Distributors Corporation is a bank.
Investment Summary (Unaudited)
Top Five Stocks as of April 30, 2019
| | % of fund's net assets |
| Activision Blizzard, Inc. (United States of America, Entertainment) | 2.1 |
| Alphabet, Inc. Class A (United States of America, Interactive Media & Services) | 1.6 |
| Roche Holding AG (participation certificate) (Switzerland, Pharmaceuticals) | 1.3 |
| Electronic Arts, Inc. (United States of America, Entertainment) | 1.2 |
| The AES Corp. (United States of America, Independent Power and Renewable Electricity Producers) | 1.2 |
| | 7.4 |
Top Five Market Sectors as of April 30, 2019
| | % of fund's net assets |
| Financials | 16.8 |
| Industrials | 13.7 |
| Information Technology | 13.1 |
| Health Care | 12.0 |
| Consumer Discretionary | 9.4 |
Top Five Countries as of April 30, 2019
| (excluding cash equivalents) | % of fund's net assets |
| United States of America | 48.6 |
| Japan | 6.9 |
| United Kingdom | 4.7 |
| Cayman Islands | 3.8 |
| Ireland | 3.5 |
Percentages are adjusted for the effect of futures contracts, if applicable.
Asset Allocation (% of fund's net assets)
| As of April 30, 2019 |
| | Stocks | 99.1% |
| | Short-Term Investments and Net Other Assets (Liabilities) | 0.9% |

Schedule of Investments April 30, 2019 (Unaudited)
Showing Percentage of Net Assets
| Common Stocks - 99.0% | | | |
| | | Shares | Value |
| Australia - 0.5% | | | |
| Beacon Lighting Group Ltd. | | 100,270 | $73,336 |
| Imdex Ltd. | | 74,192 | 54,394 |
| Northern Star Resources Ltd. | | 36,664 | 211,681 |
| Webjet Ltd. | | 23,825 | 283,171 |
|
| TOTAL AUSTRALIA | | | 622,582 |
|
| Austria - 0.2% | | | |
| Erste Group Bank AG | | 5,600 | 224,230 |
| Bailiwick of Jersey - 0.2% | | | |
| WNS Holdings Ltd. sponsored ADR (a) | | 4,900 | 280,035 |
| Bermuda - 2.4% | | | |
| BW LPG Ltd. (a)(b) | | 6,600 | 30,218 |
| Credicorp Ltd. (United States) | | 2,000 | 473,800 |
| Essent Group Ltd. (a) | | 5,900 | 279,955 |
| Genpact Ltd. | | 27,300 | 990,990 |
| Hiscox Ltd. | | 5,196 | 113,423 |
| Marvell Technology Group Ltd. | | 21,200 | 530,424 |
| Tai Cheung Holdings Ltd. | | 205,000 | 217,157 |
| Tai Fook Securities Group Ltd. | | 79,639 | 28,831 |
|
| TOTAL BERMUDA | | | 2,664,798 |
|
| Brazil - 2.0% | | | |
| BK Brasil Operacao e Assessoria a Restaurantes SA | | 41,500 | 240,146 |
| BM&F BOVESPA SA | | 25,500 | 224,038 |
| BR Properties SA | | 3,100 | 6,918 |
| BTG Pactual Participations Ltd. unit | | 39,000 | 411,573 |
| Direcional Engenharia SA | | 9,600 | 20,174 |
| Even Construtora e Incorporadora SA (a) | | 36,800 | 61,097 |
| Gafisa SA (a) | | 6,312 | 9,304 |
| Gafisa SA rights 5/23/19 (a) | | 4,026 | 411 |
| Helbor Empreendimentos SA (a) | | 27,900 | 9,036 |
| IRB Brasil Resseguros SA | | 5,500 | 131,710 |
| Localiza Rent A Car SA | | 27,900 | 257,576 |
| Lojas Renner SA | | 21,900 | 261,833 |
| Natura Cosmeticos SA | | 200 | 2,665 |
| Notre Dame Intermedica Participacoes SA | | 24,546 | 219,850 |
| Smiles Fidelidade SA | | 4,400 | 54,985 |
| Sul America SA unit | | 46,664 | 371,303 |
|
| TOTAL BRAZIL | | | 2,282,619 |
|
| British Virgin Islands - 0.6% | | | |
| Nomad Foods Ltd. (a) | | 33,100 | 688,480 |
| Canada - 3.2% | | | |
| Canadian Natural Resources Ltd. | | 4,200 | 125,916 |
| Canadian Natural Resources Ltd. | | 9,100 | 273,197 |
| Constellation Software, Inc. | | 300 | 264,702 |
| First Quantum Minerals Ltd. | | 28,800 | 304,188 |
| Gluskin Sheff + Associates, Inc. | | 9,200 | 98,956 |
| Lions Gate Entertainment Corp.: | | | |
| Class A | | 29,850 | 435,512 |
| Class B | | 3,250 | 44,200 |
| Pan American Silver Corp. | | 7,408 | 94,156 |
| Pan American Silver Corp. rights (a)(c) | | 38,400 | 0 |
| Pason Systems, Inc. | | 3,300 | 49,142 |
| PrairieSky Royalty Ltd. | | 6,600 | 95,130 |
| Precision Drilling Corp. (a) | | 226,750 | 556,847 |
| Stingray Group, Inc. | | 26,700 | 129,544 |
| Suncor Energy, Inc. | | 21,200 | 699,124 |
| Suncor Energy, Inc. | | 3,500 | 115,500 |
| Torex Gold Resources, Inc. (a) | | 33,200 | 317,453 |
|
| TOTAL CANADA | | | 3,603,567 |
|
| Cayman Islands - 3.8% | | | |
| Alibaba Group Holding Ltd. sponsored ADR (a) | | 4,900 | 909,293 |
| Anta Sports Products Ltd. | | 46,000 | 324,266 |
| Ausnutria Dairy Hunan Co. Ltd. (H Shares) | | 252,000 | 406,680 |
| Chailease Holding Co. Ltd. | | 35,000 | 148,939 |
| Greatview Aseptic Pack Co. Ltd. | | 12,000 | 7,297 |
| Hengan International Group Co. Ltd. | | 32,500 | 286,480 |
| HKBN Ltd. | | 62,000 | 110,963 |
| Li Ning Co. Ltd. (a) | | 167,500 | 304,476 |
| Logan Property Holdings Co. Ltd. | | 92,000 | 146,594 |
| Sunny Optical Technology Group Co. Ltd. | | 21,300 | 259,706 |
| Tencent Holdings Ltd. | | 13,800 | 680,170 |
| Theravance Biopharma, Inc. (a) | | 9,900 | 236,115 |
| Towngas China Co. Ltd. | | 57,110 | 45,427 |
| Value Partners Group Ltd. | | 580,000 | 436,213 |
| ZTO Express (Cayman), Inc. sponsored ADR | | 100 | 1,993 |
|
| TOTAL CAYMAN ISLANDS | | | 4,304,612 |
|
| China - 0.6% | | | |
| Air China Ltd. (H Shares) | | 4,000 | 4,767 |
| Bank of China Ltd. (H Shares) | | 40,000 | 19,070 |
| Beijing Urban Consolidated & Development Group Ltd. (H Shares) (b) | | 11,000 | 3,828 |
| China Construction Bank Corp. (H Shares) | | 8,000 | 7,053 |
| China Life Insurance Co. Ltd. (H Shares) | | 5,000 | 14,208 |
| China Merchants Bank Co. Ltd. (H Shares) | | 55,000 | 272,195 |
| Industrial & Commercial Bank of China Ltd. (H Shares) | | 27,000 | 20,272 |
| Ping An Insurance (Group) Co. of China Ltd. (H Shares) | | 25,500 | 308,669 |
| Yunnan Baiyao Group Co. Ltd. (A Shares) | | 300 | 3,942 |
|
| TOTAL CHINA | | | 654,004 |
|
| Colombia - 0.2% | | | |
| Interconexion Electrica SA ESP | | 54,400 | 266,174 |
| Curacao - 0.4% | | | |
| Schlumberger Ltd. | | 11,900 | 507,892 |
| Denmark - 0.5% | | | |
| DONG Energy A/S (b) | | 3,400 | 260,301 |
| GN Store Nord A/S | | 5,800 | 296,871 |
|
| TOTAL DENMARK | | | 557,172 |
|
| Finland - 0.4% | | | |
| Nokia Corp. sponsored ADR (d) | | 75,500 | 398,640 |
| France - 3.5% | | | |
| Air France KLM (Reg.) (a) | | 26,100 | 301,520 |
| BNP Paribas SA | | 9,000 | 479,098 |
| Danone SA | | 4,000 | 323,510 |
| Edenred SA | | 3,700 | 174,338 |
| Elis SA | | 13,900 | 247,885 |
| Korian | | 7,100 | 285,566 |
| LVMH Moet Hennessy - Louis Vuitton SA | | 800 | 314,094 |
| Safran SA | | 2,000 | 291,522 |
| SEB SA | | 1,600 | 292,872 |
| Societe Generale Series A | | 15,800 | 501,042 |
| Soitec SA (a) | | 3,400 | 343,782 |
| Vivendi SA | | 12,100 | 351,213 |
|
| TOTAL FRANCE | | | 3,906,442 |
|
| Germany - 1.6% | | | |
| BAUER AG | | 7,400 | 185,916 |
| Deutsche Post AG | | 16,792 | 583,697 |
| KION Group AG | | 9,100 | 623,008 |
| Krones AG | | 3,400 | 316,325 |
| MLP AG | | 18,800 | 94,887 |
|
| TOTAL GERMANY | | | 1,803,833 |
|
| Hong Kong - 0.8% | | | |
| AIA Group Ltd. | | 86,800 | 888,783 |
| Sino Land Ltd. | | 632 | 1,112 |
|
| TOTAL HONG KONG | | | 889,895 |
|
| India - 1.7% | | | |
| Bharat Heavy Electricals Ltd. | | 17,669 | 17,962 |
| Biocon Ltd. | | 27,300 | 232,638 |
| Divi's Laboratories Ltd. | | 7,400 | 185,603 |
| HDFC Bank Ltd. | | 4,366 | 144,845 |
| HDFC Bank Ltd. sponsored ADR | | 1,400 | 160,510 |
| Praxis Home Retail Ltd. (a) | | 5 | 11 |
| RBL Bank Ltd. (b) | | 13,600 | 132,559 |
| Reliance Industries Ltd. | | 17,839 | 356,744 |
| Tata Consultancy Services Ltd. | | 3,700 | 120,081 |
| TCNS Clothing Co. Ltd. (a)(b) | | 13,900 | 163,923 |
| Tech Mahindra Ltd. (a) | | 9,500 | 114,046 |
| The Karnataka Bank Ltd. (a) | | 10,441 | 19,009 |
| Torrent Pharmaceuticals Ltd. | | 8,500 | 218,691 |
|
| TOTAL INDIA | | | 1,866,622 |
|
| Indonesia - 0.3% | | | |
| PT Bank Bukopin Tbk (a) | | 520,100 | 11,387 |
| PT Semen Gresik (Persero) Tbk | | 315,900 | 299,274 |
| PT Sumber Alfaria Trijaya Tbk | | 128,900 | 9,272 |
|
| TOTAL INDONESIA | | | 319,933 |
|
| Ireland - 3.5% | | | |
| Allergan PLC | | 5,400 | 793,800 |
| C&C Group PLC | | 125,421 | 476,175 |
| Hibernia (REIT) PLC | | 172,958 | 277,405 |
| Jazz Pharmaceuticals PLC (a) | | 6,300 | 817,551 |
| Kingspan Group PLC (United Kingdom) | | 3,800 | 199,551 |
| Medtronic PLC | | 7,100 | 630,551 |
| Perrigo Co. PLC | | 11,300 | 541,496 |
| Ryanair Holdings PLC sponsored ADR (a) | | 2,600 | 201,864 |
|
| TOTAL IRELAND | | | 3,938,393 |
|
| Israel - 0.8% | | | |
| CyberArk Software Ltd. (a) | | 3,100 | 399,683 |
| Mellanox Technologies Ltd. (a) | | 1,300 | 156,390 |
| Teva Pharmaceutical Industries Ltd. sponsored ADR (a) | | 26,600 | 404,852 |
|
| TOTAL ISRAEL | | | 960,925 |
|
| Italy - 0.7% | | | |
| Mediaset SpA (a)(d) | | 28,300 | 94,081 |
| Technogym SpA (a) | | 59,600 | 730,642 |
|
| TOTAL ITALY | | | 824,723 |
|
| Japan - 6.9% | | | |
| Aichi Electric Co. Ltd. | | 3,500 | 84,833 |
| Aucnet, Inc. | | 58,800 | 666,148 |
| Bandai Namco Holdings, Inc. | | 7,400 | 352,080 |
| Broadleaf Co. Ltd. | | 43,700 | 224,002 |
| Daisue Construction Co. Ltd. | | 28,600 | 238,002 |
| Ezaki Glico Co. Ltd. | | 11,200 | 589,183 |
| Fanuc Corp. | | 1,600 | 300,601 |
| FJ Next Co. Ltd. | | 25,600 | 204,533 |
| Hokuriku Electrical Construction Co. Ltd. | | 19,400 | 159,004 |
| Hoshizaki Corp. | | 2,100 | 135,733 |
| Hoya Corp. | | 8,800 | 617,371 |
| Lasertec Corp. | | 7,500 | 338,660 |
| LIFULL Co. Ltd. | | 58,931 | 317,417 |
| Maeda Seisakusho Co. Ltd. | | 17,500 | 69,909 |
| Meitetsu Transport Co. Ltd. | | 7,500 | 156,538 |
| Mikikogyo Co. Ltd. | | 5,300 | 180,798 |
| Minebea Mitsumi, Inc. | | 27,900 | 493,406 |
| Moriya Corp. | | 13,000 | 232,003 |
| Nakano Corp. | | 43,400 | 184,673 |
| NOF Corp. | | 17,400 | 617,775 |
| Renesas Electronics Corp. (a) | | 18,500 | 98,483 |
| Sakai Heavy Industries Ltd. | | 3,100 | 88,078 |
| Sanei Architecture Planning Co. Ltd. | | 700 | 9,891 |
| Seikitokyu Kogyo Co. Ltd. | | 94,400 | 480,496 |
| SG Holdings Co. Ltd. | | 9,600 | 256,385 |
| Shionogi & Co. Ltd. | | 6,800 | 395,321 |
| Taiheiyo Cement Corp. | | 5,700 | 182,674 |
| Zenkoku Hosho Co. Ltd. | | 4,100 | 143,175 |
|
| TOTAL JAPAN | | | 7,817,172 |
|
| Kenya - 0.0% | | | |
| Safaricom Ltd. | | 100 | 28 |
| Korea (South) - 0.1% | | | |
| Hyundai Fire & Marine Insurance Co. Ltd. | | 1,122 | 36,870 |
| LG Chemical Ltd. | | 208 | 64,508 |
|
| TOTAL KOREA (SOUTH) | | | 101,378 |
|
| Liberia - 0.2% | | | |
| Royal Caribbean Cruises Ltd. | | 1,900 | 229,786 |
| Mexico - 0.5% | | | |
| Credito Real S.A.B. de CV | | 463,600 | 528,948 |
| Multi-National - 0.1% | | | |
| HKT Trust/HKT Ltd. unit | | 39,000 | 60,453 |
| Netherlands - 2.5% | | | |
| Argenx SE ADR (a) | | 400 | 51,228 |
| ASML Holding NV (Netherlands) | | 2,400 | 499,444 |
| IMCD Group BV | | 3,600 | 290,719 |
| Intertrust NV (b) | | 39,200 | 743,477 |
| Koninklijke Philips Electronics NV | | 12,552 | 539,030 |
| NSI NV | | 5,983 | 236,882 |
| NSI NV rights 5/14/19 (a)(e) | | 5,983 | 7,516 |
| PostNL NV | | 83,575 | 214,845 |
| Yandex NV Series A (a) | | 7,300 | 273,239 |
|
| TOTAL NETHERLANDS | | | 2,856,380 |
|
| Norway - 0.5% | | | |
| Det Norske Oljeselskap ASA (DNO) (A Shares) | | 129,500 | 293,750 |
| Grieg Seafood ASA | | 22,100 | 255,006 |
| Kongsberg Gruppen ASA | | 150 | 2,173 |
|
| TOTAL NORWAY | | | 550,929 |
|
| Panama - 0.2% | | | |
| Copa Holdings SA Class A | | 2,400 | 199,824 |
| Philippines - 0.0% | | | |
| Century Properties Group, Inc. | | 1,560,000 | 15,070 |
| Poland - 0.1% | | | |
| Dino Polska SA (a)(b) | | 4,700 | 156,197 |
| Portugal - 0.4% | | | |
| Banco Comercial Portugues SA (Reg.) (a) | | 1,542,600 | 432,718 |
| Russia - 0.1% | | | |
| Bank St. Petersburg PJSC (a) | | 60,200 | 54,114 |
| Sberbank of Russia | | 15,700 | 55,003 |
|
| TOTAL RUSSIA | | | 109,117 |
|
| Singapore - 0.2% | | | |
| Wing Tai Holdings Ltd. | | 115,400 | 173,936 |
| Spain - 1.1% | | | |
| Atresmedia Corporacion de Medios de Comunicacion SA | | 15,200 | 81,832 |
| CaixaBank SA | | 213,400 | 680,211 |
| Indra Sistemas SA (a) | | 26,600 | 313,263 |
| Unicaja Banco SA (b) | | 180,400 | 207,193 |
|
| TOTAL SPAIN | | | 1,282,499 |
|
| Sweden - 1.3% | | | |
| Essity AB Class B | | 11,600 | 343,951 |
| Indutrade AB | | 11,300 | 345,494 |
| Nibe Industrier AB (B Shares) | | 11,500 | 154,616 |
| Telefonaktiebolaget LM Ericsson (B Shares) | | 40,100 | 396,676 |
| THQ Nordic AB (a) | | 12,000 | 277,896 |
|
| TOTAL SWEDEN | | | 1,518,633 |
|
| Switzerland - 1.9% | | | |
| Chubb Ltd. | | 2,300 | 333,960 |
| Roche Holding AG (participation certificate) | | 5,570 | 1,469,719 |
| Sika AG | | 1,880 | 287,826 |
|
| TOTAL SWITZERLAND | | | 2,091,505 |
|
| Taiwan - 1.0% | | | |
| Accton Technology Corp. | | 67,000 | 284,027 |
| Makalot Industrial Co. Ltd. | | 35,000 | 241,247 |
| Realtek Semiconductor Corp. | | 41,000 | 277,296 |
| St.Shine Optical Co. Ltd. | | 1,000 | 18,640 |
| Taiwan Semiconductor Manufacturing Co. Ltd. | | 33,000 | 277,060 |
| TCI Co. Ltd. | | 3,136 | 46,783 |
|
| TOTAL TAIWAN | | | 1,145,053 |
|
| Thailand - 0.7% | | | |
| Energy Absolute PCL | | 167,600 | 292,745 |
| Kasikornbank PCL (For. Reg.) | | 1,400 | 8,356 |
| MC Group PCL | | 2,700 | 766 |
| Muangthai Leasing PCL | | 147,800 | 238,480 |
| Srisawad Corp. PCL | | 142,500 | 244,439 |
|
| TOTAL THAILAND | | | 784,786 |
|
| United Kingdom - 4.7% | | | |
| Admiral Group PLC | | 6,473 | 186,035 |
| Aon PLC | | 1,900 | 342,266 |
| ConvaTec Group PLC (b) | | 151,087 | 272,968 |
| ConvaTec Group PLC ADR | | 1,900 | 13,870 |
| Diageo PLC | | 6,655 | 280,560 |
| Direct Line Insurance Group PLC | | 61,436 | 263,891 |
| Fever-Tree Drinks PLC | | 522 | 21,401 |
| Hastings Group Holdings PLC (b) | | 96,893 | 240,441 |
| HomeServe PLC | | 24,900 | 352,295 |
| Ibstock PLC (b) | | 43,200 | 147,141 |
| Lloyds Banking Group PLC | | 550,856 | 450,510 |
| Metro Bank PLC (a)(d) | | 3,777 | 36,939 |
| Moneysupermarket.com Group PLC | | 34,386 | 163,081 |
| Prudential PLC | | 14,345 | 325,938 |
| Safestore Holdings PLC | | 39,558 | 332,199 |
| Senior Engineering Group PLC | | 35,900 | 108,514 |
| Smiths Group PLC | | 18,200 | 361,332 |
| Spire Healthcare Group PLC (b) | | 109,505 | 191,202 |
| Telecom Plus PLC | | 15,700 | 289,076 |
| Tesco PLC | | 152,251 | 496,740 |
| Unilever PLC | | 3,649 | 221,184 |
| Volution Group PLC | | 81,400 | 183,632 |
|
| TOTAL UNITED KINGDOM | | | 5,281,215 |
|
| United States of America - 48.6% | | | |
| Abraxas Petroleum Corp. (a) | | 176,000 | 242,880 |
| Activision Blizzard, Inc. | | 50,300 | 2,424,953 |
| Akamai Technologies, Inc. (a) | | 8,300 | 664,498 |
| Alexion Pharmaceuticals, Inc. (a) | | 7,000 | 952,910 |
| Alleghany Corp. (a) | | 600 | 394,128 |
| Allison Transmission Holdings, Inc. | | 4,800 | 224,928 |
| Alphabet, Inc. Class A (a) | | 1,500 | 1,798,440 |
| Amazon.com, Inc. (a) | | 200 | 385,304 |
| American International Group, Inc. | | 15,000 | 713,550 |
| Anadarko Petroleum Corp. | | 12,700 | 925,195 |
| Anthem, Inc. | | 1,900 | 499,757 |
| Apache Corp. | | 9,900 | 325,809 |
| ARAMARK Holdings Corp. | | 8,600 | 267,288 |
| Avnet, Inc. | | 4,100 | 199,301 |
| Baker Hughes, a GE Co. Class A | | 1,900 | 45,638 |
| bluebird bio, Inc. (a) | | 500 | 70,915 |
| Broadcom, Inc. | | 900 | 286,560 |
| Brunswick Corp. | | 2,400 | 122,904 |
| Cabot Microelectronics Corp. | | 3,100 | 391,375 |
| California Resources Corp. (a)(d) | | 6,100 | 128,588 |
| CDW Corp. | | 3,750 | 396,000 |
| Charles Schwab Corp. | | 5,700 | 260,946 |
| Cheniere Energy, Inc. (a) | | 11,700 | 752,895 |
| Cigna Corp. | | 2,300 | 365,332 |
| Cimarex Energy Co. | | 4,100 | 281,506 |
| Cisco Systems, Inc. | | 11,200 | 626,640 |
| CIT Group, Inc. | | 10,700 | 569,989 |
| Citigroup, Inc. | | 16,000 | 1,131,200 |
| Cognizant Technology Solutions Corp. Class A | | 2,300 | 167,808 |
| Conduent, Inc. (a) | | 44,100 | 565,803 |
| Covetrus, Inc. (a) | | 1,600 | 52,592 |
| Crown Holdings, Inc. (a) | | 17,200 | 999,836 |
| CVS Health Corp. | | 2,245 | 122,083 |
| Cyclerion Therapeutics, Inc. (a) | | 290 | 4,417 |
| Del Frisco's Restaurant Group, Inc. (a) | | 31,600 | 211,720 |
| Dine Brands Global, Inc. | | 5,700 | 505,362 |
| Dorman Products, Inc. (a) | | 1,400 | 122,738 |
| Dow, Inc. (a) | | 3,200 | 181,536 |
| DowDuPont, Inc. | | 9,900 | 380,655 |
| Dycom Industries, Inc. (a) | | 5,800 | 287,622 |
| Electronic Arts, Inc. (a) | | 14,500 | 1,372,425 |
| Element Solutions, Inc. (a) | | 42,800 | 464,808 |
| EOG Resources, Inc. | | 3,500 | 336,175 |
| Epizyme, Inc. (a) | | 12,600 | 156,366 |
| Euronet Worldwide, Inc. (a) | | 7,400 | 1,109,186 |
| Exelon Corp. | | 7,800 | 397,410 |
| F5 Networks, Inc. (a) | | 1,200 | 188,280 |
| FleetCor Technologies, Inc. (a) | | 1,200 | 313,140 |
| Fluor Corp. | | 13,400 | 532,382 |
| General Electric Co. | | 100 | 1,017 |
| Global Payments, Inc. | | 2,200 | 321,354 |
| Goldman Sachs Group, Inc. | | 2,000 | 411,840 |
| Great Southern Bancorp, Inc. | | 1,800 | 104,310 |
| Greif, Inc. Class A | | 4,471 | 176,694 |
| HD Supply Holdings, Inc. (a) | | 12,700 | 580,263 |
| Henry Schein, Inc. (a) | | 2,100 | 134,526 |
| Hill-Rom Holdings, Inc. | | 1,500 | 152,130 |
| Hubbell, Inc. Class B | | 3,300 | 421,080 |
| Humana, Inc. | | 1,300 | 332,033 |
| Huntington Bancshares, Inc. | | 50,607 | 704,449 |
| ImmunoGen, Inc. (a) | | 15,300 | 36,567 |
| Independence Contract Drilling, Inc. (a) | | 23,500 | 66,505 |
| Ingevity Corp. (a) | | 1,200 | 138,012 |
| Intercept Pharmaceuticals, Inc. (a) | | 300 | 25,854 |
| Ironwood Pharmaceuticals, Inc. Class A (a) | | 2,900 | 34,481 |
| Jacobs Engineering Group, Inc. | | 11,000 | 857,340 |
| JBG SMITH Properties | | 6,800 | 289,340 |
| Keysight Technologies, Inc. (a) | | 3,500 | 304,605 |
| Las Vegas Sands Corp. | | 100 | 6,705 |
| M&T Bank Corp. | | 3,500 | 595,245 |
| Malibu Boats, Inc. Class A (a) | | 8,400 | 349,608 |
| Martin Marietta Materials, Inc. | | 1,500 | 332,850 |
| Matrix Service Co. (a) | | 20,700 | 405,927 |
| Melinta Therapeutics, Inc. (a)(d) | | 3,060 | 13,403 |
| MetLife, Inc. | | 16,000 | 738,080 |
| Microsoft Corp. | | 5,100 | 666,060 |
| Mondelez International, Inc. | | 23,000 | 1,169,550 |
| MyoKardia, Inc. (a) | | 1,300 | 62,374 |
| NMI Holdings, Inc. (a) | | 12,100 | 339,768 |
| Noble Energy, Inc. | | 23,300 | 630,498 |
| Northrop Grumman Corp. | | 2,100 | 608,811 |
| Oceaneering International, Inc. (a) | | 20,700 | 397,440 |
| PacWest Bancorp | | 7,300 | 288,715 |
| Par Pacific Holdings, Inc. (a) | | 29,700 | 580,338 |
| Party City Holdco, Inc. (a) | | 31,600 | 211,720 |
| Planet Fitness, Inc. (a) | | 6,500 | 492,050 |
| Post Holdings, Inc. (a) | | 2,700 | 304,506 |
| Procter & Gamble Co. | | 7,100 | 756,008 |
| PVH Corp. | | 2,400 | 309,576 |
| Qualcomm, Inc. | | 6,900 | 594,297 |
| Radian Group, Inc. | | 10,400 | 243,568 |
| Radius Health, Inc. (a) | | 2,500 | 55,050 |
| Regal Beloit Corp. | | 9,400 | 799,752 |
| Regeneron Pharmaceuticals, Inc. (a) | | 2,500 | 857,850 |
| Rexnord Corp. (a) | | 6,000 | 171,600 |
| Sarepta Therapeutics, Inc. (a) | | 3,000 | 350,820 |
| Spectrum Brands Holdings, Inc. | | 4,300 | 264,751 |
| SS&C Technologies Holdings, Inc. | | 4,400 | 297,704 |
| Starbucks Corp. | | 5,600 | 435,008 |
| Stericycle, Inc. (a) | | 9,900 | 578,061 |
| Stifel Financial Corp. | | 3,300 | 196,911 |
| Store Capital Corp. | | 1,600 | 53,312 |
| Team, Inc. (a) | | 7,300 | 123,370 |
| Teradyne, Inc. | | 2,800 | 137,200 |
| The AES Corp. | | 78,000 | 1,335,360 |
| The Chemours Co. LLC | | 24,200 | 871,442 |
| The Mosaic Co. | | 27,400 | 715,414 |
| The New York Times Co. Class A | | 21,900 | 725,985 |
| The Walt Disney Co. | | 5,200 | 712,244 |
| TreeHouse Foods, Inc. (a) | | 8,900 | 596,122 |
| TriMas Corp. (a) | | 4,500 | 139,185 |
| Twitter, Inc. (a) | | 7,100 | 283,361 |
| U.S. Foods Holding Corp. (a) | | 15,000 | 548,250 |
| Ultragenyx Pharmaceutical, Inc. (a) | | 1,600 | 105,600 |
| Umpqua Holdings Corp. | | 16,500 | 286,440 |
| Under Armour, Inc. Class A (sub. vtg.) (a) | | 100 | 2,309 |
| Union Pacific Corp. | | 2,200 | 389,488 |
| Univar, Inc. (a) | | 12,000 | 267,960 |
| Viavi Solutions, Inc. (a) | | 22,500 | 299,250 |
| Virtusa Corp. (a) | | 4,700 | 261,085 |
| Vistra Energy Corp. | | 22,100 | 602,225 |
| Wells Fargo & Co. | | 22,200 | 1,074,702 |
| WESCO International, Inc. (a) | | 2,500 | 143,100 |
| World Fuel Services Corp. | | 19,600 | 604,660 |
| YETI Holdings, Inc. (d) | | 12,400 | 442,432 |
| Yum China Holdings, Inc. | | 100 | 4,754 |
| Yum! Brands, Inc. | | 600 | 62,634 |
| Zimmer Biomet Holdings, Inc. | | 4,500 | 554,220 |
| Zoetis, Inc. Class A | | 4,000 | 407,360 |
|
| TOTAL UNITED STATES OF AMERICA | | | 54,868,241 |
|
| TOTAL COMMON STOCKS | | | |
| (Cost $103,880,420) | | | 111,769,439 |
|
| Nonconvertible Preferred Stocks - 0.1% | | | |
| Brazil - 0.1% | | | |
| Banco ABC Brasil SA | | 12,467 | 61,841 |
| Banco do Estado Rio Grande do Sul SA | | 2,700 | 16,815 |
| Companhia Paranaense de Energia-Copel (PN-B) | | 5,100 | 53,587 |
| Itau Unibanco Holding SA | | 2,400 | 20,706 |
| TOTAL NONCONVERTIBLE PREFERRED STOCKS | | | |
| (Cost $110,406) | | | 152,949 |
| | | Principal Amount(f) | Value |
|
| Nonconvertible Bonds - 0.0% | | | |
| Canada - 0.0% | | | |
| Constellation Software, Inc. Canada Consumer Price Index + 6.500% 8.8% 3/31/40(g)(h) | CAD | | |
| (Cost $4,419) | | 5,600 | 5,330 |
| | | Shares | Value |
|
| Money Market Funds - 1.2% | | | |
| Fidelity Cash Central Fund, 2.49% (i) | | 215,938 | 215,981 |
| Fidelity Securities Lending Cash Central Fund 2.49% (i)(j) | | 1,074,774 | 1,074,882 |
| TOTAL MONEY MARKET FUNDS | | | |
| (Cost $1,290,863) | | | 1,290,863 |
| TOTAL INVESTMENT IN SECURITIES - 100.3% | | | |
| (Cost $105,286,108) | | | 113,218,581 |
| NET OTHER ASSETS (LIABILITIES) - (0.3)% | | | (298,086) |
| NET ASSETS - 100% | | | $112,920,495 |
Currency Abbreviations
CAD – Canadian dollar
Categorizations in the Schedule of Investments are based on country or territory of incorporation.
Legend
(a) Non-income producing
(b) Security exempt from registration under Rule 144A of the Securities Act of 1933. These securities may be resold in transactions exempt from registration, normally to qualified institutional buyers. At the end of the period, the value of these securities amounted to $2,549,448 or 2.3% of net assets.
(c) Level 3 security
(d) Security or a portion of the security is on loan at period end.
(e) Security or a portion of the security purchased on a delayed delivery or when-issued basis.
(f) Amount is stated in United States dollars unless otherwise noted.
(g) Coupon rates for floating and adjustable rate securities reflect the rates in effect at period end.
(h) Coupon is indexed to a floating interest rate which may be multiplied by a specified factor and/or subject to caps or floors.
(i) Affiliated fund that is generally available only to investment companies and other accounts managed by Fidelity Investments. The rate quoted is the annualized seven-day yield of the fund at period end. A complete unaudited listing of the fund's holdings as of its most recent quarter end is available upon request. In addition, each Fidelity Central Fund's financial statements are available on the SEC's website or upon request.
(j) Investment made with cash collateral received from securities on loan.
Affiliated Central Funds
Information regarding fiscal year to date income earned by the Fund from investments in Fidelity Central Funds is as follows:
| Fund | Income earned |
| Fidelity Cash Central Fund | $35,371 |
| Fidelity Securities Lending Cash Central Fund | 10,390 |
| Total | $45,761 |
Amounts in the income column in the above table include any capital gain distributions from underlying funds, which are presented in the corresponding line-item in the Statement of Operations, if applicable.
Investment Valuation
The following is a summary of the inputs used, as of April 30, 2019, involving the Fund's assets and liabilities carried at fair value. The inputs or methodology used for valuing securities may not be an indication of the risk associated with investing in those securities. For more information on valuation inputs, and their aggregation into the levels used below, please refer to the Investment Valuation section in the accompanying Notes to Financial Statements.
| | Valuation Inputs at Reporting Date: |
| Description | Total | Level 1 | Level 2 | Level 3 |
| Investments in Securities: | | | | |
| Equities: | | | | |
| Communication Services | $9,951,045 | $8,919,662 | $1,031,383 | $-- |
| Consumer Discretionary | 10,595,321 | 10,281,227 | 314,094 | -- |
| Consumer Staples | 7,695,204 | 6,029,259 | 1,665,945 | -- |
| Energy | 8,827,514 | 8,827,514 | -- | -- |
| Financials | 18,979,248 | 14,851,693 | 4,127,555 | -- |
| Health Care | 13,783,515 | 11,774,766 | 2,008,749 | -- |
| Industrials | 15,296,713 | 13,620,783 | 1,675,930 | -- |
| Information Technology | 14,635,432 | 13,683,800 | 951,632 | -- |
| Materials | 6,849,614 | 6,849,614 | -- | -- |
| Real Estate | 1,766,477 | 1,766,477 | -- | -- |
| Utilities | 3,542,305 | 3,542,305 | -- | -- |
| Corporate Bonds | 5,330 | -- | 5,330 | -- |
| Money Market Funds | 1,290,863 | 1,290,863 | -- | -- |
| Total Investments in Securities: | $113,218,581 | $101,437,963 | $11,780,618 | $-- |
See accompanying notes which are an integral part of the financial statements.
Financial Statements
Statement of Assets and Liabilities
| | | April 30, 2019 (Unaudited) |
| Assets | | |
Investment in securities, at value (including securities loaned of $1,043,243) — See accompanying schedule:
Unaffiliated issuers (cost $103,995,245) | $111,927,718 | |
| Fidelity Central Funds (cost $1,290,863) | 1,290,863 | |
| Total Investment in Securities (cost $105,286,108) | | $113,218,581 |
| Foreign currency held at value (cost $2,247) | | 2,255 |
| Receivable for investments sold | | 1,803,249 |
| Receivable for fund shares sold | | 47,103 |
| Dividends receivable | | 288,289 |
| Interest receivable | | 31 |
| Distributions receivable from Fidelity Central Funds | | 5,511 |
| Prepaid expenses | | 69 |
| Other receivables | | 54,461 |
| Total assets | | 115,419,549 |
| Liabilities | | |
| Payable for investments purchased | | |
| Regular delivery | $1,166,428 | |
| Delayed delivery | 22,273 | |
| Payable for fund shares redeemed | 97,564 | |
| Accrued management fee | 44,444 | |
| Distribution and service plan fees payable | 28,679 | |
| Other affiliated payables | 23,247 | |
| Other payables and accrued expenses | 41,584 | |
| Collateral on securities loaned | 1,074,835 | |
| Total liabilities | | 2,499,054 |
| Net Assets | | $112,920,495 |
| Net Assets consist of: | | |
| Paid in capital | | $105,087,161 |
| Total distributable earnings (loss) | | 7,833,334 |
| Net Assets | | $112,920,495 |
| Net Asset Value and Maximum Offering Price | | |
| Class A: | | |
| Net Asset Value and redemption price per share ($35,102,894 ÷ 2,205,944 shares) | | $15.91 |
| Maximum offering price per share (100/94.25 of $15.91) | | $16.88 |
| Class M: | | |
| Net Asset Value and redemption price per share ($21,468,934 ÷ 1,422,715 shares) | | $15.09 |
| Maximum offering price per share (100/96.50 of $15.09) | | $15.64 |
| Class C: | | |
| Net Asset Value and offering price per share ($14,806,875 ÷ 1,107,511 shares)(a) | | $13.37 |
| Class I: | | |
| Net Asset Value, offering price and redemption price per share ($41,541,792 ÷ 2,468,719 shares) | | $16.83 |
(a) Redemption price per share is equal to net asset value less any applicable contingent deferred sales charge.
See accompanying notes which are an integral part of the financial statements.
Statement of Operations
| | | Six months ended April 30, 2019 (Unaudited) |
| Investment Income | | |
| Dividends | | $1,000,995 |
| Interest | | 84 |
| Income from Fidelity Central Funds | | 45,761 |
| Income before foreign taxes withheld | | 1,046,840 |
| Less foreign taxes withheld | | (56,644) |
| Total income | | 990,196 |
| Expenses | | |
| Management fee | | |
| Basic fee | $382,706 | |
| Performance adjustment | (128,312) | |
| Transfer agent fees | 117,013 | |
| Distribution and service plan fees | 178,239 | |
| Accounting and security lending fees | 21,713 | |
| Custodian fees and expenses | 18,860 | |
| Independent trustees' fees and expenses | 322 | |
| Registration fees | 49,992 | |
| Audit | 59,156 | |
| Legal | 2,198 | |
| Miscellaneous | 400 | |
| Total expenses before reductions | 702,287 | |
| Expense reductions | (8,219) | |
| Total expenses after reductions | | 694,068 |
| Net investment income (loss) | | 296,128 |
| Realized and Unrealized Gain (Loss) | | |
| Net realized gain (loss) on: | | |
| Investment securities: | | |
| Unaffiliated issuers | 65,318 | |
| Fidelity Central Funds | (1) | |
| Foreign currency transactions | (5,753) | |
| Total net realized gain (loss) | | 59,564 |
| Change in net unrealized appreciation (depreciation) on: | | |
| Investment securities: | | |
| Unaffiliated issuers | 5,783,226 | |
| Assets and liabilities in foreign currencies | 2,393 | |
| Total change in net unrealized appreciation (depreciation) | | 5,785,619 |
| Net gain (loss) | | 5,845,183 |
| Net increase (decrease) in net assets resulting from operations | | $6,141,311 |
See accompanying notes which are an integral part of the financial statements.
Statement of Changes in Net Assets
| | Six months ended April 30, 2019 (Unaudited) | Year ended October 31, 2018 |
| Increase (Decrease) in Net Assets | | |
| Operations | | |
| Net investment income (loss) | $296,128 | $281,292 |
| Net realized gain (loss) | 59,564 | 12,417,623 |
| Change in net unrealized appreciation (depreciation) | 5,785,619 | (21,261,349) |
| Net increase (decrease) in net assets resulting from operations | 6,141,311 | (8,562,434) |
| Distributions to shareholders | (10,356,661) | (17,875,671) |
| Share transacrtions - net increase (decrease) | (2,561,634) | 6,794,419 |
| Redemption fees | – | 407 |
| Total increase (decrease) in net assets | (6,776,984) | (19,643,279) |
| Net Assets | | |
| Beginning of period | 119,697,479 | 139,340,758 |
| End of period | $112,920,495 | $119,697,479 |
| | | |
| | | |
See accompanying notes which are an integral part of the financial statements.
Financial Highlights
Fidelity Advisor Global Capital Appreciation Fund Class A
| | Six months ended (Unaudited) April 30, | Years endedOctober 31, | | | | |
| | 2019 | 2018 | 2017 | 2016 | 2015 | 2014 |
| Selected Per–Share Data | | | | | | |
| Net asset value, beginning of period | $16.48 | $20.21 | $16.18 | $15.89 | $15.32 | $13.64 |
| Income from Investment Operations | | | | | | |
| Net investment income (loss)A | .04 | .05 | .05 | –B | (.01) | .01 |
| Net realized and unrealized gain (loss) | .82 | (1.22) | 4.15 | .38 | .58 | 1.76 |
| Total from investment operations | .86 | (1.17) | 4.20 | .38 | .57 | 1.77 |
| Distributions from net investment income | (.02) | (.04) | – | – | – | (.02) |
| Distributions from net realized gain | (1.41) | (2.52) | (.17) | (.09) | – | (.06) |
| Total distributions | (1.43) | (2.56) | (.17) | (.09) | – | (.09)C |
| Redemption fees added to paid in capitalA | – | –B | –B | –B | –B | –B |
| Net asset value, end of period | $15.91 | $16.48 | $20.21 | $16.18 | $15.89 | $15.32 |
| Total ReturnD,E,F | 6.12% | (6.74)% | 26.17% | 2.39% | 3.72% | 13.03% |
| Ratios to Average Net AssetsG,H | | | | | | |
| Expenses before reductions | 1.21%I | 1.39% | 1.48% | 1.55% | 1.57% | 1.62% |
| Expenses net of fee waivers, if any | 1.21%I | 1.39% | 1.45% | 1.45% | 1.45% | 1.45% |
| Expenses net of all reductions | 1.19%I | 1.37% | 1.44% | 1.44% | 1.44% | 1.45% |
| Net investment income (loss) | .59%I | .26% | .28% | (.02)% | (.07)% | .07% |
| Supplemental Data | | | | | | |
| Net assets, end of period (000 omitted) | $35,103 | $33,589 | $38,710 | $39,565 | $41,225 | $35,987 |
| Portfolio turnover rateJ | 88%I | 99% | 137% | 122% | 176% | 249% |
A Calculated based on average shares outstanding during the period.
B Amount represents less than $.005 per share.
C Total distributions of $.09 per share is comprised of distributions from net investment income of $.024 and distributions from net realized gain of $.064 per share.
D Total returns for periods of less than one year are not annualized.
E Total returns would have been lower if certain expenses had not been reduced during the applicable periods shown.
F Total returns do not include the effect of the sales charges.
G Fees and expenses of any underlying Fidelity Central Funds are not included in the Fund's expense ratio. The Fund indirectly bears its proportionate share of the expenses of any underlying Fidelity Central Funds.
H Expense ratios reflect operating expenses of the class. Expenses before reductions do not reflect amounts reimbursed by the investment adviser or reductions from brokerage service arrangements or reductions from other expense offset arrangements and do not represent the amount paid by the class during periods when reimbursements or reductions occur. Expenses net of fee waivers reflect expenses after reimbursement by the investment adviser but prior to reductions from brokerage service arrangements or other expense offset arrangements. Expenses net of all reductions represent the net expenses paid by the class.
I Annualized
J Amount does not include the portfolio activity of any underlying Fidelity Central Funds.
See accompanying notes which are an integral part of the financial statements.
Fidelity Advisor Global Capital Appreciation Fund Class M
| | Six months ended (Unaudited) April 30, | Years endedOctober 31, | | | | |
| | 2019 | 2018 | 2017 | 2016 | 2015 | 2014 |
| Selected Per–Share Data | | | | | | |
| Net asset value, beginning of period | $15.70 | $19.37 | $15.56 | $15.32 | $14.81 | $13.19 |
| Income from Investment Operations | | | | | | |
| Net investment income (loss)A | .02 | – | .01 | (.04) | (.05) | (.03) |
| Net realized and unrealized gain (loss) | .78 | (1.15) | 3.97 | .37 | .56 | 1.71 |
| Total from investment operations | .80 | (1.15) | 3.98 | .33 | .51 | 1.68 |
| Distributions from net investment income | – | – | – | – | – | – |
| Distributions from net realized gain | (1.41) | (2.52) | (.17) | (.09) | – | (.06) |
| Total distributions | (1.41) | (2.52) | (.17) | (.09) | – | (.06) |
| Redemption fees added to paid in capitalA | – | –B | –B | –B | –B | –B |
| Net asset value, end of period | $15.09 | $15.70 | $19.37 | $15.56 | $15.32 | $14.81 |
| Total ReturnC,D,E | 6.00% | (6.97)% | 25.80% | 2.15% | 3.44% | 12.77% |
| Ratios to Average Net AssetsF,G | | | | | | |
| Expenses before reductions | 1.50%H | 1.67% | 1.77% | 1.85% | 1.89% | 1.93% |
| Expenses net of fee waivers, if any | 1.49%H | 1.67% | 1.70% | 1.70% | 1.70% | 1.70% |
| Expenses net of all reductions | 1.48%H | 1.65% | 1.69% | 1.69% | 1.69% | 1.70% |
| Net investment income (loss) | .30%H | (.01)% | .03% | (.27)% | (.32)% | (.17)% |
| Supplemental Data | | | | | | |
| Net assets, end of period (000 omitted) | $21,469 | $21,339 | $25,535 | $21,351 | $24,017 | $20,975 |
| Portfolio turnover rateI | 88%H | 99% | 137% | 122% | 176% | 249% |
A Calculated based on average shares outstanding during the period.
B Amount represents less than $.005 per share.
C Total returns for periods of less than one year are not annualized.
D Total returns would have been lower if certain expenses had not been reduced during the applicable periods shown.
E Total returns do not include the effect of the sales charges.
F Fees and expenses of any underlying Fidelity Central Funds are not included in the Fund's expense ratio. The Fund indirectly bears its proportionate share of the expenses of any underlying Fidelity Central Funds.
G Expense ratios reflect operating expenses of the class. Expenses before reductions do not reflect amounts reimbursed by the investment adviser or reductions from brokerage service arrangements or reductions from other expense offset arrangements and do not represent the amount paid by the class during periods when reimbursements or reductions occur. Expenses net of fee waivers reflect expenses after reimbursement by the investment adviser but prior to reductions from brokerage service arrangements or other expense offset arrangements. Expenses net of all reductions represent the net expenses paid by the class.
H Annualized
I Amount does not include the portfolio activity of any underlying Fidelity Central Funds.
See accompanying notes which are an integral part of the financial statements.
Fidelity Advisor Global Capital Appreciation Fund Class C
| | Six months ended (Unaudited) April 30, | Years endedOctober 31, | | | | |
| | 2019 | 2018 | 2017 | 2016 | 2015 | 2014 |
| Selected Per–Share Data | | | | | | |
| Net asset value, beginning of period | $14.11 | $17.65 | $14.26 | $14.12 | $13.72 | $12.26 |
| Income from Investment Operations | | | | | | |
| Net investment income (loss)A | (.01) | (.08) | (.07) | (.11) | (.12) | (.09) |
| Net realized and unrealized gain (loss) | .68 | (1.02) | 3.63 | .34 | .52 | 1.58 |
| Total from investment operations | .67 | (1.10) | 3.56 | .23 | .40 | 1.49 |
| Distributions from net investment income | – | – | – | – | – | – |
| Distributions from net realized gain | (1.41) | (2.44) | (.17) | (.09) | – | (.03) |
| Total distributions | (1.41) | (2.44) | (.17) | (.09) | – | (.03) |
| Redemption fees added to paid in capitalA | – | –B | –B | –B | –B | –B |
| Net asset value, end of period | $13.37 | $14.11 | $17.65 | $14.26 | $14.12 | $13.72 |
| Total ReturnC,D,E | 5.73% | (7.39)% | 25.20% | 1.62% | 2.92% | 12.13% |
| Ratios to Average Net AssetsF,G | | | | | | |
| Expenses before reductions | 1.96%H | 2.14% | 2.23% | 2.31% | 2.34% | 2.40% |
| Expenses net of fee waivers, if any | 1.96%H | 2.14% | 2.20% | 2.20% | 2.20% | 2.20% |
| Expenses net of all reductions | 1.95%H | 2.12% | 2.19% | 2.19% | 2.19% | 2.20% |
| Net investment income (loss) | (.17)%H | (.48)% | (.47)% | (.77)% | (.82)% | (.67)% |
| Supplemental Data | | | | | | |
| Net assets, end of period (000 omitted) | $14,807 | $19,741 | $24,215 | $19,942 | $21,186 | $15,747 |
| Portfolio turnover rateI | 88%H | 99% | 137% | 122% | 176% | 249% |
A Calculated based on average shares outstanding during the period.
B Amount represents less than $.005 per share.
C Total returns for periods of less than one year are not annualized.
D Total returns would have been lower if certain expenses had not been reduced during the applicable periods shown.
E Total returns do not include the effect of the contingent deferred sales charge.
F Fees and expenses of any underlying Fidelity Central Funds are not included in the Fund's expense ratio. The Fund indirectly bears its proportionate share of the expenses of any underlying Fidelity Central Funds.
G Expense ratios reflect operating expenses of the class. Expenses before reductions do not reflect amounts reimbursed by the investment adviser or reductions from brokerage service arrangements or reductions from other expense offset arrangements and do not represent the amount paid by the class during periods when reimbursements or reductions occur. Expenses net of fee waivers reflect expenses after reimbursement by the investment adviser but prior to reductions from brokerage service arrangements or other expense offset arrangements. Expenses net of all reductions represent the net expenses paid by the class.
H Annualized
I Amount does not include the portfolio activity of any underlying Fidelity Central Funds.
See accompanying notes which are an integral part of the financial statements.
Fidelity Advisor Global Capital Appreciation Fund Class I
| | Six months ended (Unaudited) April 30, | Years endedOctober 31, | | | | |
| | 2019 | 2018 | 2017 | 2016 | 2015 | 2014 |
| Selected Per–Share Data | | | | | | |
| Net asset value, beginning of period | $17.37 | $21.16 | $16.90 | $16.55 | $15.92 | $14.18 |
| Income from Investment Operations | | | | | | |
| Net investment income (loss)A | .07 | .11 | .11 | .04 | .03 | .05 |
| Net realized and unrealized gain (loss) | .87 | (1.28) | 4.33 | .40 | .60 | 1.82 |
| Total from investment operations | .94 | (1.17) | 4.44 | .44 | .63 | 1.87 |
| Distributions from net investment income | (.08) | (.10) | – | – | – | (.06) |
| Distributions from net realized gain | (1.41) | (2.52) | (.18) | (.09) | – | (.06) |
| Total distributions | (1.48)B | (2.62) | (.18) | (.09) | – | (.13)C |
| Redemption fees added to paid in capitalA | – | –D | –D | –D | –D | –D |
| Net asset value, end of period | $16.83 | $17.37 | $21.16 | $16.90 | $16.55 | $15.92 |
| Total ReturnE,F | 6.33% | (6.45)% | 26.52% | 2.66% | 3.96% | 13.27% |
| Ratios to Average Net AssetsG,H | | | | | | |
| Expenses before reductions | .90%I | 1.09% | 1.16% | 1.22% | 1.26% | 1.29% |
| Expenses net of fee waivers, if any | .89%I | 1.09% | 1.16% | 1.20% | 1.20% | 1.20% |
| Expenses net of all reductions | .88%I | 1.07% | 1.15% | 1.19% | 1.19% | 1.20% |
| Net investment income (loss) | .90%I | .57% | .57% | .23% | .18% | .33% |
| Supplemental Data | | | | | | |
| Net assets, end of period (000 omitted) | $41,542 | $45,029 | $50,881 | $57,060 | $59,117 | $39,159 |
| Portfolio turnover rateJ | 88%I | 99% | 137% | 122% | 176% | 249% |
A Calculated based on average shares outstanding during the period.
B Total distributions of $1.48 per share is comprised of distributions from net investment income of $.076 and distributions from net realized gain of $1.406 per share.
C Total distributions of $.13 per share is comprised of distributions from net investment income of $.064 and distributions from net realized gain of $.064 per share.
D Amount represents less than $.005 per share.
E Total returns for periods of less than one year are not annualized.
F Total returns would have been lower if certain expenses had not been reduced during the applicable periods shown.
G Fees and expenses of any underlying Fidelity Central Funds are not included in the Fund's expense ratio. The Fund indirectly bears its proportionate share of the expenses of any underlying Fidelity Central Funds.
H Expense ratios reflect operating expenses of the class. Expenses before reductions do not reflect amounts reimbursed by the investment adviser or reductions from brokerage service arrangements or reductions from other expense offset arrangements and do not represent the amount paid by the class during periods when reimbursements or reductions occur. Expenses net of fee waivers reflect expenses after reimbursement by the investment adviser but prior to reductions from brokerage service arrangements or other expense offset arrangements. Expenses net of all reductions represent the net expenses paid by the class.
I Annualized
J Amount does not include the portfolio activity of any underlying Fidelity Central Funds.
See accompanying notes which are an integral part of the financial statements.
Notes to Financial Statements (Unaudited)
For the period ended April 30, 2019
1. Organization.
Fidelity Advisor Global Capital Appreciation Fund (the Fund) is a fund of Fidelity Advisor Series VIII (the Trust) and is authorized to issue an unlimited number of shares. The Trust is registered under the Investment Company Act of 1940, as amended (the 1940 Act), as an open-end management investment company organized as a Massachusetts business trust. The Fund offers Class A, Class M, Class C and Class I shares, each of which has equal rights as to assets and voting privileges. Each class has exclusive voting rights with respect to matters that affect that class. Effective March 1, 2019, Class C shares will automatically convert to Class A shares after a holding period of ten years from the initial date of purchase, with certain exceptions.
2. Investments in Fidelity Central Funds.
The Fund invests in Fidelity Central Funds, which are open-end investment companies generally available only to other investment companies and accounts managed by the investment adviser and its affiliates. The Fund's Schedule of Investments lists each of the Fidelity Central Funds held as of period end, if any, as an investment of the Fund, but does not include the underlying holdings of each Fidelity Central Fund. As an Investing Fund, the Fund indirectly bears its proportionate share of the expenses of the underlying Fidelity Central Funds.
The Money Market Central Funds seek preservation of capital and current income and are managed by Fidelity Investments Money Management, Inc. (FIMM), an affiliate of the investment adviser. Annualized expenses of the Money Market Central Funds as of their most recent shareholder report date are less than .005%.
A complete unaudited list of holdings for each Fidelity Central Fund is available upon request or at the Securities and Exchange Commission (the SEC) website at www.sec.gov. In addition, the financial statements of the Fidelity Central Funds are available on the SEC website or upon request.
3. Significant Accounting Policies.
The Fund is an investment company and applies the accounting and reporting guidance of the Financial Accounting Standards Board (FASB) Accounting Standards Codification Topic 946 Financial Services – Investments Companies. The financial statements have been prepared in conformity with accounting principles generally accepted in the United States of America (GAAP), which require management to make certain estimates and assumptions at the date of the financial statements. Actual results could differ from those estimates. Subsequent events, if any, through the date that the financial statements were issued have been evaluated in the preparation of the financial statements. The following summarizes the significant accounting policies of the Fund:
Investment Valuation. Investments are valued as of 4:00 p.m. Eastern time on the last calendar day of the period. The Board of Trustees (the Board) has delegated the day to day responsibility for the valuation of the Fund's investments to the Fair Value Committee (the Committee) established by the Fund's investment adviser. In accordance with valuation policies and procedures approved by the Board, the Fund attempts to obtain prices from one or more third party pricing vendors or brokers to value its investments. When current market prices, quotations or currency exchange rates are not readily available or reliable, investments will be fair valued in good faith by the Committee, in accordance with procedures adopted by the Board. Factors used in determining fair value vary by investment type and may include market or investment specific events, changes in interest rates and credit quality. The frequency with which these procedures are used cannot be predicted and they may be utilized to a significant extent. The Committee oversees the Fund's valuation policies and procedures and reports to the Board on the Committee's activities and fair value determinations. The Board monitors the appropriateness of the procedures used in valuing the Fund's investments and ratifies the fair value determinations of the Committee.
The Fund categorizes the inputs to valuation techniques used to value its investments into a disclosure hierarchy consisting of three levels as shown below:
- Level 1 – quoted prices in active markets for identical investments
- Level 2 – other significant observable inputs (including quoted prices for similar investments, interest rates, prepayment speeds, etc.)
- Level 3 – unobservable inputs (including the Fund's own assumptions based on the best information available)
Valuation techniques used to value the Fund's investments by major category are as follows:
Equity securities, including restricted securities, for which market quotations are readily available, are valued at the last reported sale price or official closing price as reported by a third party pricing vendor on the primary market or exchange on which they are traded and are categorized as Level 1 in the hierarchy. In the event there were no sales during the day or closing prices are not available, securities are valued at the last quoted bid price or may be valued using the last available price and are generally categorized as Level 2 in the hierarchy. For foreign equity securities, when market or security specific events arise, comparisons to the valuation of American Depositary Receipts (ADRs), futures contracts, Exchange-Traded Funds (ETFs)and certain indexes as well as quoted prices for similar securities may be used and would be categorized as Level 2 in the hierarchy. For equity securities, including restricted securities, where observable inputs are limited, assumptions about market activity and risk are used and these securities may be categorized as Level 3 in the hierarchy.
Debt securities, including restricted securities, are valued based on evaluated prices received from third party pricing vendors or from brokers who make markets in such securities. Corporate bonds are valued by pricing vendors who utilize matrix pricing which considers yield or price of bonds of comparable quality, coupon, maturity and type or by broker-supplied prices. When independent prices are unavailable or unreliable, debt securities may be valued utilizing pricing methodologies which consider similar factors that would be used by third party pricing vendors. Debt securities are generally categorized as Level 2 in the hierarchy but may be Level 3 depending on the circumstances.
Investments in open-end mutual funds, including the Fidelity Central Funds, are valued at their closing net asset value (NAV) each business day and are categorized as Level 1 in the hierarchy.
Changes in valuation techniques may result in transfers in or out of an assigned level within the disclosure hierarchy. The aggregate value of investments by input level as of April 30, 2019 is included at the end of the Fund's Schedule of Investments.
Foreign Currency. The Fund may use foreign currency contracts to facilitate transactions in foreign-denominated securities. Gains and losses from these transactions may arise from changes in the value of the foreign currency or if the counterparties do not perform under the contracts' terms.
Foreign-denominated assets, including investment securities, and liabilities are translated into U.S. dollars at the exchange rates at period end. Purchases and sales of investment securities, income and dividends received and expenses denominated in foreign currencies are translated into U.S. dollars at the exchange rate in effect on the transaction date.
The effects of exchange rate fluctuations on investments are included with the net realized and unrealized gain (loss) on investment securities. Other foreign currency transactions resulting in realized and unrealized gain (loss) are disclosed separately.
Investment Transactions and Income. For financial reporting purposes, the Fund's investment holdings and NAV include trades executed through the end of the last business day of the period. The NAV per share for processing shareholder transactions is calculated as of the close of business of the New York Stock Exchange (NYSE), normally 4:00 p.m. Eastern time and includes trades executed through the end of the prior business day. Gains and losses on securities sold are determined on the basis of identified cost and include proceeds received from litigation. Dividend income is recorded on the ex-dividend date, except for certain dividends from foreign securities where the ex-dividend date may have passed, which are recorded as soon as the fund is informed of the ex-dividend date. Non-cash dividends included in dividend income, if any, are recorded at the fair market value of the securities received. Income and capital gain distributions from Fidelity Central Funds, if any, are recorded on the ex-dividend date. Certain distributions received by the Fund represent a return of capital or capital gain. The Fund determines the components of these distributions subsequent to the ex-dividend date, based upon receipt of tax filings or other correspondence relating to the underlying investment. These distributions are recorded as a reduction of cost of investments and/or as a realized gain. Interest income is accrued as earned and includes coupon interest and amortization of premium and accretion of discount on debt securities as applicable. Investment income is recorded net of foreign taxes withheld where recovery of such taxes is uncertain.
Class Allocations and Expenses. Investment income, realized and unrealized capital gains and losses, common expenses of the Fund, and certain fund-level expense reductions, if any, are allocated daily on a pro-rata basis to each class based on the relative net assets of each class to the total net assets of the Fund. Each class differs with respect to transfer agent and distribution and service plan fees incurred. Certain expense reductions may also differ by class. For the reporting period, the allocated portion of income and expenses to each class as a percent of its average net assets may vary due to the timing of recording these transactions in relation to fluctuating net assets of the classes. Expenses directly attributable to a fund are charged to that fund. Expenses attributable to more than one fund are allocated among the respective funds on the basis of relative net assets or other appropriate methods. Expense estimates are accrued in the period to which they relate and adjustments are made when actual amounts are known.
Income Tax Information and Distributions to Shareholders. Each year, the Fund intends to qualify as a regulated investment company under Subchapter M of the Internal Revenue Code, including distributing substantially all of its taxable income and realized gains. As a result, no provision for U.S. Federal income taxes is required. The Fund files a U.S. federal tax return, in addition to state and local tax returns as required. The Fund's federal income tax returns are subject to examination by the Internal Revenue Service (IRS) for a period of three fiscal years after they are filed. State and local tax returns may be subject to examination for an additional fiscal year depending on the jurisdiction. Foreign taxes are provided for based on the Fund's understanding of the tax rules and rates that exist in the foreign markets in which it invests.
Distributions are declared and recorded on the ex-dividend date. Income and capital gain distributions are declared separately for each class. Income and capital gain distributions are determined in accordance with income tax regulations, which may differ from GAAP.
Capital accounts within the financial statements are adjusted for permanent book-tax differences. These adjustments have no impact on net assets or the results of operations. Capital accounts are not adjusted for temporary book-tax differences which will reverse in a subsequent period.
Book-tax differences are primarily due to foreign currency transactions, passive foreign investment companies (PFIC), partnerships and losses deferred due to wash sales.
As of period end, the cost and unrealized appreciation (depreciation) in securities, and derivatives if applicable, for federal income tax purposes were as follows:
| Gross unrealized appreciation | $15,686,217 |
| Gross unrealized depreciation | (7,882,697) |
| Net unrealized appreciation (depreciation) | $7,803,250 |
| Tax cost | $105,415,061 |
Delayed Delivery Transactions and When-Issued Securities. During the period, the Fund transacted in securities on a delayed delivery or when-issued basis. Payment and delivery may take place after the customary settlement period for that security. The price of the underlying securities and the date when the securities will be delivered and paid for are fixed at the time the transaction is negotiated. The securities purchased on a delayed delivery or when-issued basis are identified as such in the Fund's Schedule of Investments. Losses may arise due to changes in the value of the underlying securities or if the counterparty does not perform under the contract's terms, or if the issuer does not issue the securities due to political, economic, or other factors.
Restricted Securities. The Fund may invest in securities that are subject to legal or contractual restrictions on resale. These securities generally may be resold in transactions exempt from registration or to the public if the securities are registered. Disposal of these securities may involve time-consuming negotiations and expense, and prompt sale at an acceptable price may be difficult. Information regarding restricted securities is included at the end of the Fund's Schedule of Investments.
4. Purchases and Sales of Investments.
Purchases and sales of securities, other than short-term securities, aggregated $47,850,749 and $57,658,100, respectively.
5. Fees and Other Transactions with Affiliates.
Management Fee. Fidelity Management & Research Company (the investment adviser) and its affiliates provide the Fund with investment management related services for which the Fund pays a monthly management fee. The management fee is the sum of an individual fund fee rate that is based on an annual rate of .45% of the Fund's average net assets and an annualized group fee rate that averaged .24% during the period. The group fee rate is based upon the average net assets of all the mutual funds advised by the investment adviser, including any mutual funds previously advised by the investment adviser that are currently advised by Fidelity SelectCo, LLC, an affiliate of the investment adviser. The group fee rate decreases as assets under management increase and increases as assets under management decrease. In addition, the management fee is subject to a performance adjustment (up to a maximum of +/- .20% of the Fund's average net assets over a 36 month performance period). The upward or downward adjustment to the management fee is based on the relative investment performance of Class I of the Fund as compared to its benchmark index, the MSCI All Country World Index, over the same 36 month performance period. For the reporting period, the total annualized management fee rate, including the performance adjustment, was .46% of the Fund's average net assets. The performance adjustment included in the management fee rate may be higher or lower than the maximum performance adjustment rate due to the difference between the average net assets for the reporting and performance periods.
Distribution and Service Plan Fees. In accordance with Rule 12b-1 of the 1940 Act, the Fund has adopted separate Distribution and Service Plans for each class of shares. Certain classes pay Fidelity Distributors Corporation (FDC), an affiliate of the investment adviser, separate Distribution and Service Fees, each of which is based on an annual percentage of each class' average net assets. In addition, FDC may pay financial intermediaries for selling shares of the Fund and providing shareholder support services. For the period, the Distribution and Service Fee rates, total fees and amounts retained by FDC were as follows:
| | Distribution Fee | Service Fee | Total Fees | Retained by FDC |
| Class A | -% | .25% | $40,379 | $835 |
| Class M | .25% | .25% | 50,856 | 879 |
| Class C | .75% | .25% | 87,004 | 12,342 |
| | | | $178,239 | $14,056 |
Sales Load. FDC may receive a front-end sales charge of up to 5.75% for selling Class A shares and 3.50% for selling Class M shares, some of which is paid to financial intermediaries for selling shares of the Fund. Depending on the holding period, FDC may receive contingent deferred sales charges levied on Class A, Class M and Class C redemptions. The deferred sales charges are 1.00% for Class C shares, 1.00% for certain purchases of Class A shares and .25% for certain purchases of Class M shares.
For the period, sales charge amounts retained by FDC were as follows:
| | Retained by FDC |
| Class A | $1,112 |
| Class M | 1,003 |
| Class C(a) | 699 |
| | $2,814 |
(a) When Class C shares are initially sold, FDC pays commissions from its own resources to financial intermediaries through which the sales are made.
Transfer Agent Fees. Fidelity Investments Institutional Operations Company, Inc., (FIIOC), an affiliate of the investment adviser, is the transfer, dividend disbursing and shareholder servicing agent for each class of the Fund. FIIOC receives account fees and asset-based fees that vary according to the account size and type of account of the shareholders of the respective classes of the Fund. FIIOC pays for typesetting, printing and mailing of shareholder reports, except proxy statements.
For the period, transfer agent fees for each class were as follows:
| | Amount | % of Class-Level Average Net Assets(a) |
| Class A | $36,785 | .23 |
| Class M | 26,863 | .26 |
| Class C | 19,937 | .23 |
| Class I | 33,428 | .16 |
| | $117,013 | |
(a) Annualized
Accounting and Security Lending Fees. Fidelity Service Company, Inc. (FSC), an affiliate of the investment adviser, maintains the Fund's accounting records. The accounting fee is based on the level of average net assets for each month. Prior to April 1, 2019, FSC had a separate agreement with the Fund for administration of the security lending program, based on the number and duration of lending transactions. For the period, the total fees paid for accounting and administration of securities lending were equivalent to an annualized rate of .04%.
Brokerage Commissions. The Fund placed a portion of its portfolio transactions with brokerage firms which are affiliates of the investment adviser. Brokerage commissions are included in net realized gain (loss) and change in net unrealized appreciation (depreciation) in the Statement of Operations. The commissions paid to these affiliated firms were $1,071 for the period.
Interfund Trades. The Fund may purchase from or sell securities to other Fidelity Funds under procedures adopted by the Board. The procedures have been designed to ensure these interfund trades are executed in accordance with Rule 17a-7 of the 1940 Act. Interfund trades are included within the respective purchases and sales amounts shown in the Purchases and Sales of Investments note.
6. Committed Line of Credit.
The Fund participates with other funds managed by the investment adviser or an affiliate in a $4.25 billion credit facility (the "line of credit") to be utilized for temporary or emergency purposes to fund shareholder redemptions or for other short-term liquidity purposes. The Fund has agreed to pay commitment fees on its pro-rata portion of the line of credit, which amounted to $162 and is reflected in Miscellaneous expenses on the Statement of Operations. During the period, the Fund did not borrow on this line of credit.
7. Security Lending.
The Fund lends portfolio securities through a lending agent from time to time in order to earn additional income. For equity securities, a lending agent is used and may loan securities to certain qualified borrowers, including Fidelity Capital Markets (FCM), a broker-dealer affiliated with the Fund. On the settlement date of the loan, the Fund receives collateral (in the form of U.S. Treasury obligations, letters of credit and/or cash) against the loaned securities and maintains collateral in an amount not less than 100% of the market value of the loaned securities during the period of the loan. The market value of the loaned securities is determined at the close of business of the Fund and any additional required collateral is delivered to the Fund on the next business day. The Fund or borrower may terminate the loan at any time, and if the borrower defaults on its obligation to return the securities loaned because of insolvency or other reasons, the Fund may apply collateral received from the borrower against the obligation. The Fund may experience delays and costs in recovering the securities loaned. Any cash collateral received is invested in the Fidelity Securities Lending Cash Central Fund. The value of loaned securities and cash collateral at period end are disclosed on the Fund's Statement of Assets and Liabilities. Security lending income represents the income earned on investing cash collateral, less rebates paid to borrowers and any lending agent fees associated with the loan, plus any premium payments received for lending certain types of securities. Security lending income is presented in the Statement of Operations as a component of income from Fidelity Central Funds. Total security lending income during the period amounted to $10,390. During the period, there were no securities loaned to FCM.
8. Expense Reductions.
Commissions paid to certain brokers with whom the investment adviser, or its affiliates, places trades on behalf of the Fund include an amount in addition to trade execution, which may be rebated back to the Fund to offset certain expenses. This amount totaled $7,795 for the period.
In addition, during the period the investment adviser reimbursed and/or waived a portion of fund-level operating expenses in the amount of $424.
9. Distributions to Shareholders.
Distributions to shareholders of each class were as follows:
| | Six months ended
April 30, 2019 | Year ended
October 31, 2018 |
| Distributions to shareholders | | |
| Class A | $2,906,974 | $4,934,393 |
| Class M | 1,898,257 | 3,322,710 |
| Class C | 1,864,569 | 3,329,453 |
| Class I | 3,686,861 | 6,289,115 |
| Total | $10,356,661 | $17,875,671 |
10. Share Transactions.
Share transactions for each class were as follows and may contain automatic conversions between classes or exchanges between affiliated funds:
| | Shares | Shares | Dollars | Dollars |
| | Six months ended April 30, 2019 | Year ended October 31, 2018 | Six months ended April 30, 2019 | Year ended October 31, 2018 |
| Class A | | | | |
| Shares sold | 281,145 | 327,844 | $4,284,047 | $6,088,684 |
| Reinvestment of distributions | 198,251 | 267,705 | 2,854,816 | 4,779,482 |
| Shares redeemed | (311,911) | (472,747) | (4,578,459) | (8,656,517) |
| Net increase (decrease) | 167,485 | 122,802 | $2,560,404 | $2,211,649 |
| Class M | | | | |
| Shares sold | 107,163 | 148,419 | $1,569,816 | $2,645,272 |
| Reinvestment of distributions | 138,334 | 194,710 | 1,891,020 | 3,320,374 |
| Shares redeemed | (181,948) | (301,937) | (2,554,455) | (5,316,454) |
| Net increase (decrease) | 63,549 | 41,192 | $906,381 | $649,192 |
| Class C | | | | |
| Shares sold | 76,627 | 336,353 | $931,706 | $5,409,086 |
| Reinvestment of distributions | 150,390 | 209,356 | 1,825,734 | 3,222,495 |
| Shares redeemed | (518,901) | (517,958) | (6,687,075) | (8,241,987) |
| Net increase (decrease) | (291,884) | 27,751 | $(3,929,635) | $389,594 |
| Class I | | | | |
| Shares sold | 176,310 | 523,929 | $2,790,921 | $10,283,715 |
| Reinvestment of distributions | 229,038 | 322,367 | 3,483,673 | 6,048,866 |
| Shares redeemed | (529,464) | (658,439) | (8,373,378) | (12,788,597) |
| Net increase (decrease) | (124,116) | 187,857 | $(2,098,784) | $3,543,984 |
11. Other.
The Fund's organizational documents provide former and current trustees and officers with a limited indemnification against liabilities arising in connection with the performance of their duties to the Fund. In the normal course of business, the Fund may also enter into contracts that provide general indemnifications. The Fund's maximum exposure under these arrangements is unknown as this would be dependent on future claims that may be made against the Fund. The risk of material loss from such claims is considered remote.
Shareholder Expense Example
As a shareholder of the Fund, you incur two types of costs: (1) transaction costs, including sales charges (loads) on purchase payments or redemption proceeds, and (2) ongoing costs, including management fees, distribution and/or service (12b-1) fees and other Fund expenses. This Example is intended to help you understand your ongoing costs (in dollars) of investing in the Fund and to compare these costs with the ongoing costs of investing in other mutual funds.
The Example is based on an investment of $1,000 invested at the beginning of the period and held for the entire period (November 1, 2018 to April 30, 2019).
Actual Expenses
The first line of the accompanying table for each class of the Fund provides information about actual account values and actual expenses. You may use the information in this line, together with the amount you invested, to estimate the expenses that you paid over the period. Simply divide your account value by $1,000.00 (for example, an $8,600 account value divided by $1,000.00 = 8.6), then multiply the result by the number in the first line for a class of the Fund under the heading entitled "Expenses Paid During Period" to estimate the expenses you paid on your account during this period. In addition, the Fund, as a shareholder in the underlying Fidelity Central Funds, will indirectly bear its pro-rata share of the fees and expenses incurred by the underlying Fidelity Central Funds. These fees and expenses are not included in the Fund's annualized expense ratio used to calculate the expense estimate in the table below.
Hypothetical Example for Comparison Purposes
The second line of the accompanying table for each class of the Fund provides information about hypothetical account values and hypothetical expenses based on a Class' actual expense ratio and an assumed rate of return of 5% per year before expenses, which is not the Class' actual return. The hypothetical account values and expenses may not be used to estimate the actual ending account balance or expenses you paid for the period. You may use this information to compare the ongoing costs of investing in the Fund and other funds. To do so, compare this 5% hypothetical example with the 5% hypothetical examples that appear in the shareholder reports of the other funds. In addition, the Fund, as a shareholder in the underlying Fidelity Central Funds, will indirectly bear its pro-rata share of the fees and expenses incurred by the underlying Fidelity Central Funds. These fees and expenses are not included in the Fund's annualized expense ratio used to calculate the expense estimate in the table below.
Please note that the expenses shown in the table are meant to highlight your ongoing costs only and do not reflect any transaction costs. Therefore, the second line of the table is useful in comparing ongoing costs only, and will not help you determine the relative total costs of owning different funds. In addition, if these transactional costs were included, your costs would have been higher.
| | Annualized Expense Ratio-A | Beginning
Account Value
November 1, 2018 | Ending
Account Value
April 30, 2019 | Expenses Paid
During Period-B
November 1, 2018
to April 30, 2019 |
| Class A | 1.21% | | | |
| Actual | | $1,000.00 | $1,061.20 | $6.18 |
| Hypothetical-C | | $1,000.00 | $1,018.79 | $6.06 |
| Class M | 1.49% | | | |
| Actual | | $1,000.00 | $1,060.00 | $7.61 |
| Hypothetical-C | | $1,000.00 | $1,017.41 | $7.45 |
| Class C | 1.96% | | | |
| Actual | | $1,000.00 | $1,057.30 | $10.00 |
| Hypothetical-C | | $1,000.00 | $1,015.08 | $9.79 |
| Class I | .89% | | | |
| Actual | | $1,000.00 | $1,063.30 | $4.55 |
| Hypothetical-C | | $1,000.00 | $1,020.38 | $4.46 |
A Annualized expense ratio reflects expenses net of applicable fee waivers.
B Expenses are equal to each Class' annualized expense ratio, multiplied by the average account value over the period, multiplied by 181/365 (to reflect the one-half year period).
C 5% return per year before expenses
Board Approval of Investment Advisory Contracts and Management Fees
Fidelity Advisor Global Capital Appreciation Fund
Each year, the Board of Trustees, including the Independent Trustees (together, the Board), votes on the renewal of the management contract with Fidelity Management & Research Company (FMR) and the sub-advisory agreements (together, the Advisory Contracts) for the fund. FMR and the sub-advisers are referred to herein as the Investment Advisers. The Board, assisted by the advice of fund counsel and Independent Trustees' counsel, requests and considers a broad range of information relevant to the renewal of the Advisory Contracts throughout the year.
The Board meets regularly and, at each of its meetings, covers an extensive agenda of topics and materials and considers factors that are relevant to its annual consideration of the renewal of the fund's Advisory Contracts, including the services and support provided to the fund and its shareholders. The Board has established various standing committees (Committees), each composed of and chaired by Independent Trustees with varying backgrounds, to which the Board has assigned specific subject matter responsibilities in order to enhance effective decision-making by the Board. The Board, acting directly and through its Committees, requests and receives information concerning the annual consideration of the renewal of the fund's Advisory Contracts. The Board also meets as needed to review matters specifically related to the Board's annual consideration of the renewal of the Advisory Contracts. Members of the Board may also meet with trustees of other Fidelity funds through joint ad hoc committees to discuss certain matters relevant to all of the Fidelity funds.
At its January 2019 meeting, the Board unanimously determined to renew the fund's Advisory Contracts. In reaching its determination, the Board considered all factors it believed relevant, including (i) the nature, extent, and quality of the services to be provided to the fund and its shareholders (including the investment performance of the fund); (ii) the competitiveness of the fund's management fee and total expense ratio relative to peer funds; (iii) the total costs of the services to be provided by and the profits to be realized by Fidelity from its relationships with the fund; and (iv) the extent to which, if any, economies of scale exist and would be realized as the fund grows, and whether any economies of scale are appropriately shared with fund shareholders.
In considering whether to renew the Advisory Contracts for the fund, the Board reached a determination, with the assistance of fund counsel and Independent Trustees' counsel and through the exercise of its business judgment, that the renewal of the Advisory Contracts was in the best interests of the fund and its shareholders and that the compensation payable under the Advisory Contracts was fair and reasonable. The Board's decision to renew the Advisory Contracts was not based on any single factor, but rather was based on a comprehensive consideration of all the information provided to the Board at its meetings throughout the year. The Board, in reaching its determination to renew the Advisory Contracts, was aware that shareholders of the fund have a broad range of investment choices available to them, including a wide choice among funds offered by Fidelity's competitors, and that the fund's shareholders, who have the opportunity to review and weigh the disclosure provided by the fund in its prospectus and other public disclosures, have chosen to invest in this fund, which is part of the Fidelity family of funds.
Nature, Extent, and Quality of Services Provided. The Board considered Fidelity's staffing as it relates to the fund, including the backgrounds of investment personnel of Fidelity, and also considered the fund's investment objective, strategies, and related investment philosophy. The Independent Trustees also had discussions with senior management of Fidelity's investment operations and investment groups. The Board considered the structure of the investment personnel compensation program and whether this structure provides appropriate incentives to act in the best interests of the fund. Additionally, the Board considered the portfolio managers' investments, if any, in the funds that they manage.
Resources Dedicated to Investment Management and Support Services. The Board and the Fund Oversight and Research Committees reviewed the general qualifications and capabilities of Fidelity's investment staff, including its size, education, experience, and resources, as well as Fidelity's approach to recruiting, training, managing, and compensating investment personnel. The Board noted that Fidelity has continued to increase the resources devoted to non-U.S. offices, including expansion of Fidelity's global investment organization. The Board also noted that Fidelity's analysts have extensive resources, tools and capabilities that allow them to conduct sophisticated quantitative and fundamental analysis, as well as credit analysis of issuers, counterparties and guarantors. Further, the Board considered that Fidelity's investment professionals have sufficient access to global information and data so as to provide competitive investment results over time, and that those professionals also have access to sophisticated tools that permit them to assess portfolio construction and risk and performance attribution characteristics continuously, as well as to transmit new information and research conclusions rapidly around the world. Additionally, in its deliberations, the Board considered Fidelity's trading, risk management, compliance, and technology and operations capabilities and resources, which are integral parts of the investment management process.
Shareholder and Administrative Services. The Board considered (i) the nature, extent, quality, and cost of advisory, administrative, and shareholder services performed by the Investment Advisers and their affiliates under the Advisory Contracts and under separate agreements covering transfer agency, pricing and bookkeeping, and securities lending services for the fund; (ii) the nature and extent of the supervision of third party service providers, principally custodians, subcustodians, and pricing vendors; and (iii) the resources devoted to, and the record of compliance with, the fund's compliance policies and procedures. The Board also reviewed the allocation of fund brokerage, including allocations to brokers affiliated with the Investment Advisers, the use of brokerage commissions to pay fund expenses, and the use of "soft" commission dollars to pay for research services.
The Board noted that the growth of fund assets over time across the complex allows Fidelity to reinvest in the development of services designed to enhance the value and convenience of the Fidelity funds as investment vehicles. These services include 24-hour access to account information and market information through telephone representatives and over the Internet, investor education materials and asset allocation tools, and the expanded availability of Fidelity Investor Centers.
The Board noted that it and the boards of certain other Fidelity funds had formed an ad hoc Committee on Transfer Agency Fees to review the variety of transfer agency fee structures throughout the industry and Fidelity's competitive positioning with respect to industry participants.
Investment in a Large Fund Family. The Board considered the benefits to shareholders of investing in a Fidelity fund, including the benefits of investing in a fund that is part of a large family of funds offering a variety of investment disciplines and providing a large variety of mutual fund investor services. The Board noted that Fidelity had taken, or had made recommendations that resulted in the Fidelity funds taking, a number of actions over the previous year that benefited particular funds, including: (i) continuing to dedicate additional resources to Fidelity's investment research process, which includes meetings with management of issuers of securities in which the funds invest, and to the support of the senior management team that oversees asset management; (ii) continuing efforts to enhance Fidelity's global research capabilities; (iii) launching new funds and making other enhancements to meet client needs; (iv) launching new share classes of existing funds; (v) eliminating purchase minimums and broadening eligibility requirements for certain funds and share classes; (vi) reducing management fees and total expenses for certain growth equity funds and index funds; (vii) lowering expense caps for certain existing funds and classes, and converting certain voluntary expense caps to contractual caps, to reduce expenses borne by shareholders; (viii) eliminating short-term redemption fees for funds that had such fees; (ix) rationalizing product lines and gaining increased efficiencies from fund mergers and share class consolidations; (x) continuing to develop, acquire and implement systems and technology to improve services to the funds and shareholders, strengthen information security, and increase efficiency; and (xi) continuing to implement enhancements to further strengthen Fidelity's product line to increase investors' probability of success in achieving their investment goals, including retirement income goals.
Investment Performance. The Board considered whether the fund has operated in accordance with its investment objective, as well as its record of compliance with its investment restrictions and its performance history.
The Board took into account discussions that occur at Board meetings throughout the year with representatives of the Investment Advisers about fund investment performance. In this regard the Board noted that as part of regularly scheduled fund reviews and other reports to the Board on fund performance, the Board considers annualized return information for the fund for different time periods, measured against an appropriate securities market index ("benchmark index") and a peer group of funds with similar objectives ("peer group"), if any. In its evaluation of fund investment performance, the Board gave particular attention to information indicating changes in performance of certain Fidelity funds for specific time periods and discussed with the Investment Advisers the reasons for any overperformance or underperformance.
In addition to reviewing absolute and relative fund performance, the Independent Trustees periodically consider the appropriateness of fund performance metrics in evaluating the results achieved. In general, the Independent Trustees believe that fund performance should be evaluated based on net performance (after fees and expenses) of both the highest performing and lowest performing fund share classes, where applicable, compared to appropriate benchmark indices, over appropriate time periods that may include full market cycles, and compared to peer groups, as applicable, over the same periods, taking into account relevant factors including the following: general market conditions; issuer-specific information; and fund cash flows and other factors.
The Independent Trustees recognize that shareholders evaluate performance on a net basis over their own holding periods, for which one-, three-, and five-year periods are often used as a proxy. For this reason, the performance information reviewed by the Board also included net cumulative total return information for the fund and an appropriate benchmark index and peer group for the most recent one-, three-, and five-year periods ended June 30, 2018, as shown below. Returns are shown compared to the 25th percentile (top of box, 75% beaten) and 75th percentile (bottom of box, 25% beaten) of the peer universe. Returns of the benchmark index are "net MA,"
i.e., adjusted for tax withholding rates applicable to U.S.-based funds organized as Massachusetts business trusts.
Fidelity Advisor Global Capital Appreciation Fund
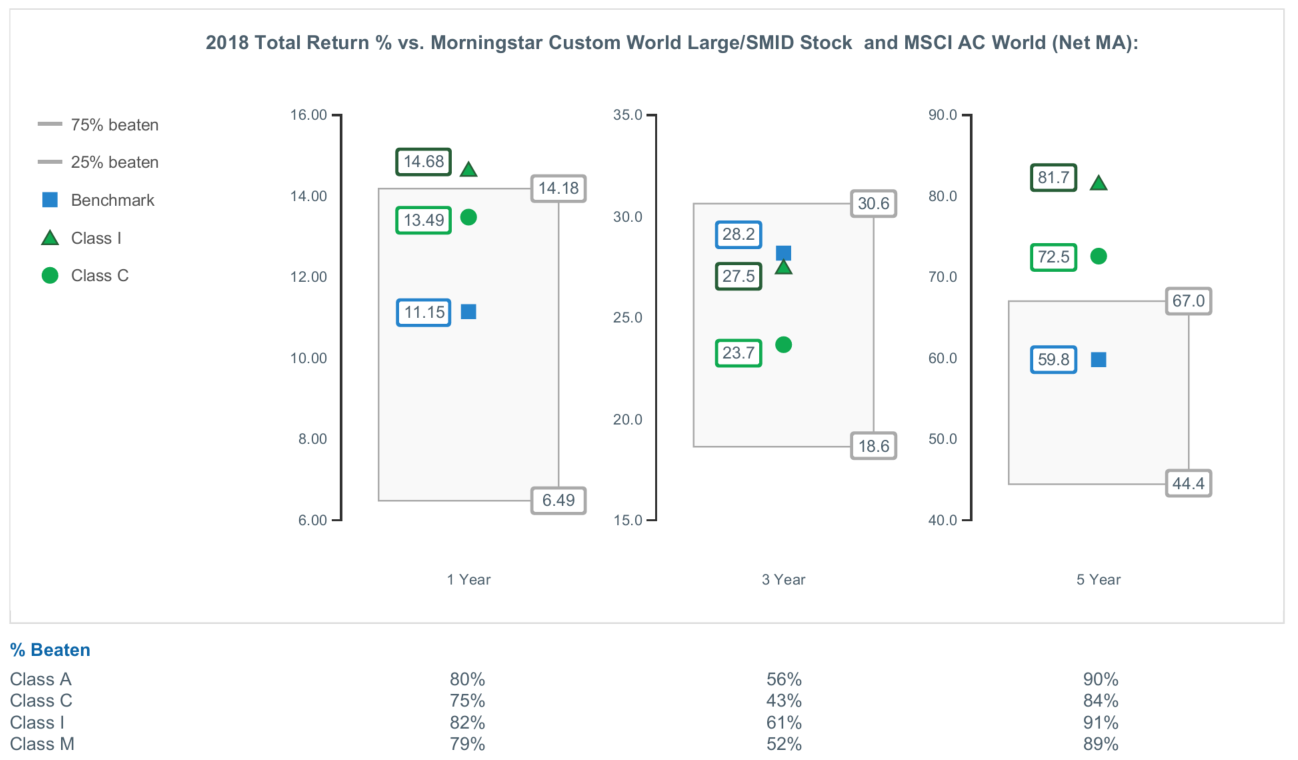
The Board also considered that the fund's management fee is subject to upward or downward adjustment depending upon whether, and to what extent, the fund's investment performance for the performance period (a rolling 36-month period) exceeds, or is exceeded by, a securities index, thus leading to a performance adjustment for the same period. The Board noted that the performance adjustment provides FMR with a strong economic incentive to seek to achieve superior long-term performance for the fund's shareholders and helps to more closely align the interests of FMR and the shareholders of the fund.
Based on its review, the Board concluded that the nature, extent, and quality of services provided to the fund under the Advisory Contracts should continue to benefit the shareholders of the fund.
Competitiveness of Management Fee and Total Expense Ratio. The Board considered the fund's management fee and total expense ratio compared to "mapped groups" of competitive funds and classes created for the purpose of facilitating the Trustees' competitive analysis of management fees and total expenses. Fidelity creates "mapped groups" by combining similar Lipper investment objective categories that have comparable investment mandates. Combining Lipper investment objective categories aids the Board's management fee and total expense ratio comparisons by broadening the competitive group used for comparison.
Management Fee. The Board considered two proprietary management fee comparisons for the 12-month periods (ended June 30 for 2018 and December 31 for prior periods) shown in basis points (BP) in the chart below. The group of Lipper funds used by the Board for management fee comparisons is referred to below as the "Total Mapped Group." The Total Mapped Group comparison focuses on a fund's standing in terms of gross management fees before expense reimbursements or caps, and without giving effect to the fund's performance adjustment, relative to the total universe of funds with comparable investment mandates, regardless of whether their management fee structures also are comparable. Funds with comparable investment mandates offer exposure to similar types of securities. Funds with comparable management fee structures have similar management fee contractual arrangements (
e.g., flat rate charged for advisory services, all-inclusive fee rate,
etc.). "TMG %" represents the percentage of funds in the Total Mapped Group that had management fees that were lower than the fund's. For example, a hypothetical TMG % of 20% would mean that 80% of the funds in the Total Mapped Group had higher, and 20% had lower, management fees than the fund. The fund's actual TMG %s and the number of funds in the Total Mapped Group are in the chart below. The "Asset-Size Peer Group" (ASPG) comparison focuses on a fund's standing relative to a subset of non-Fidelity funds within the Total Mapped Group that are similar in size and management fee structure without taking into account performance adjustments, if any. For example, if a fund is in the first quartile of the ASPG, the fund's management fee ranks in the least expensive or lowest 25% of funds in the ASPG. The ASPG represents at least 15% of the funds in the Total Mapped Group with comparable asset size and management fee structures, subject to a minimum of 50 funds (or all funds in the Total Mapped Group if fewer than 50). Additional information, such as the ASPG quartile in which the fund's management fee rate ranked and the impact of the fund's performance adjustment, is also included in the chart and was considered by the Board.
Fidelity Advisor Global Capital Appreciation Fund
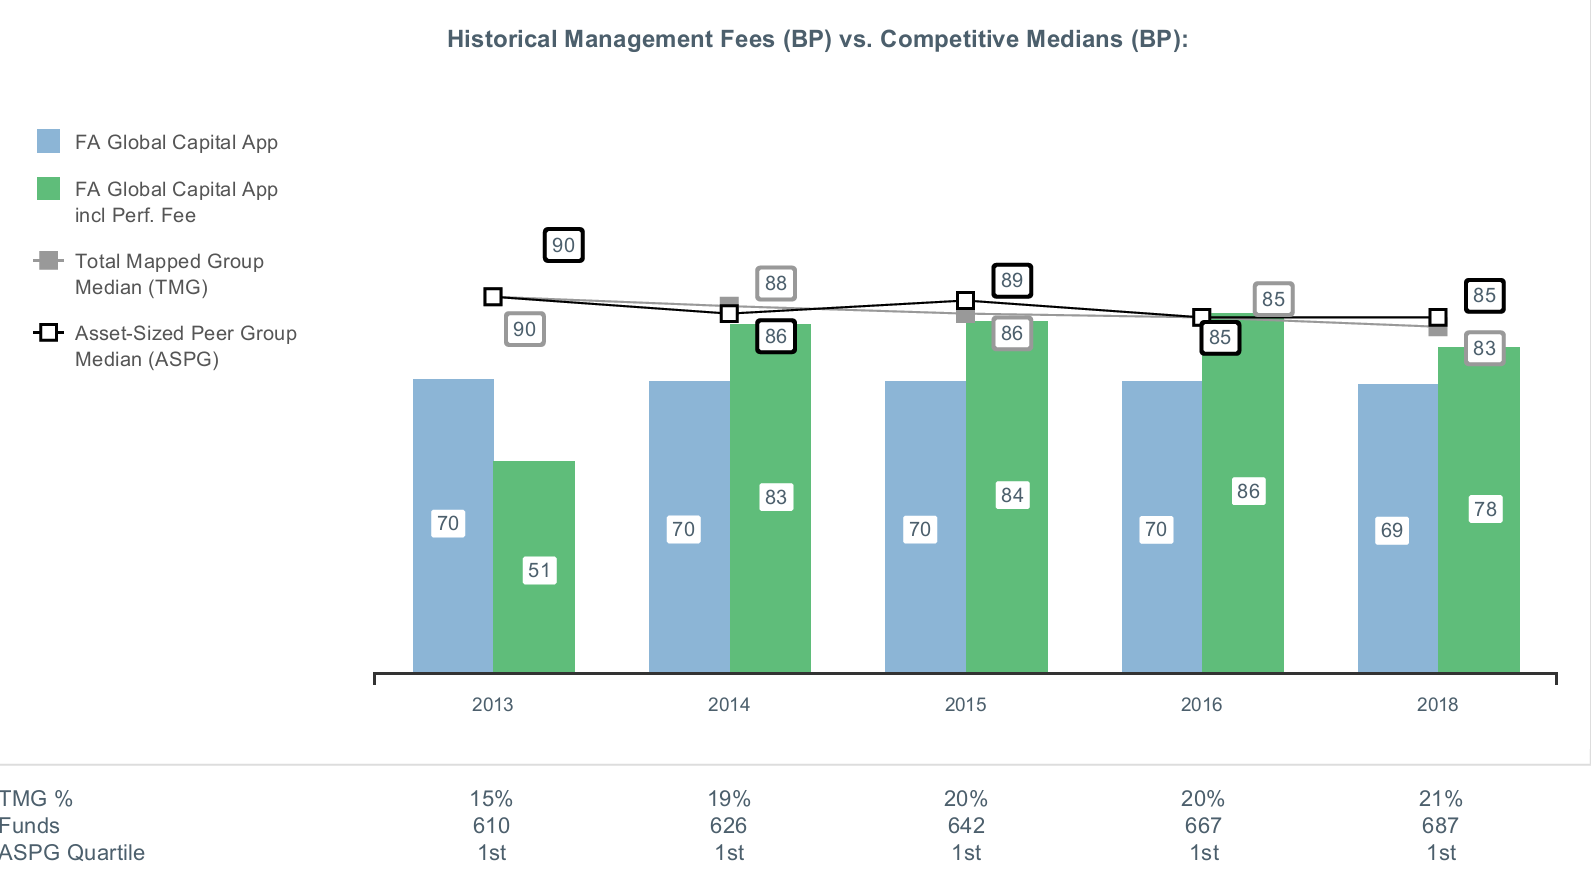
The Board noted that the fund's management fee rate ranked below the median of its Total Mapped Group and below the median of its ASPG for the 12-month period ended June 30, 2018. The Board also noted the effect of the fund's performance adjustment, if any, on the fund's management fee ranking.
The Board noted that it and the boards of other Fidelity funds formed an ad hoc Committee on Group Fee, which meets periodically, to conduct an in-depth review of the "group fee" component of the management fee of funds with such management fee structures. The Committee's focus included the mechanics of the group fee, the competitive landscape of group fee structures, Fidelity funds with no group fee component and investment products not included in group fee assets. The Board also considered that, for funds subject to the group fee, FMR agreed to voluntarily waive fees over a specified period of time in amounts designed to account for assets converted from certain funds to certain collective investment trusts.
The Board also noted that, in 2013, the ad hoc Committee on Management Fees was formed to conduct an in-depth review of the management fee rates of Fidelity's active equity mutual funds. The Committee focused on the following areas: (i) standard fee structures; (ii) research consumption and trading evolution; (iii) management fee competitiveness/profitability by category; and (iv) factors that drive institutional pricing.
Based on its review, the Board concluded that the fund's management fee is fair and reasonable in light of the services that the fund receives and the other factors considered.
Total Expense Ratio. In its review of each class's total expense ratio, the Board considered the fund's management fee rate as well as other fund or class expenses, as applicable, such as transfer agent fees, pricing and bookkeeping fees, fund-paid 12b-1 fees, and custodial, legal, and audit fees. The Board noted the impact of the fund's performance adjustment. The Board also noted that Fidelity may agree to waive fees and expenses from time to time, and the extent to which, if any, it has done so for the fund. As part of its review, the Board also considered the current and historical total expense ratios of each class of the fund compared to competitive fund median expenses. Each class of the fund is compared to those funds and classes in the Total Mapped Group (used by the Board for management fee comparisons) that have a similar sales load structure.
The Board noted that the total expense ratio of each class ranked above the competitive median for the 12-month period ended June 30, 2018. The Board considered that, in general, various factors can affect total expense ratios. The Board noted that the total expense ratio of Class A was above the competitive median because of positive performance fees and relatively higher other expenses due to asset levels. The Board noted that the total expense ratio of Class M was above the competitive median primarily because of higher 12b-1 fees on Class M as compared to most competitor funds. Class M has a higher 12b-1 fee, but a lower front-end sales charge, than traditionally priced front-end sales charge classes. The Board considered that Class M is primarily sold load-waived to retirement plans and intermediary wrap programs where its 0.50% 12b-1 fee is comparable to competing no-load, higher 12b-1 fee classes designed specifically for retirement plans and wrap programs. The Board noted that the total expense ratio of Class C was above the competitive median primarily because of its 1.00% 12b-1 fee. The Board noted that, although Class I is categorized by Lipper as an institutional class, Class I has a significantly lower investment minimum than most other funds and classes categorized as institutional. As a result, FMR believes Class I is generally more comparable to retail funds and classes. The Board noted that the fund offers multiple classes, each of which has a different sales load and 12b-1 fee structure, and that the multiple structures are intended to offer a range of pricing options for the intermediary market. The Board also noted that the total expense ratios of the classes vary primarily by the level of their 12b-1 fees, although differences in transfer agent fees may also cause expenses to vary from class to class.
The Board further considered that FMR has contractually agreed to reimburse Class A, Class M, Class C, and Class I of the fund to the extent that total operating expenses, with certain exceptions, as a percentage of their respective average net assets, exceed 1.45%, 1.70%, 2.20%, and 1.20% through February 29, 2020.
Fees Charged to Other Fidelity Clients. The Board also considered Fidelity fee structures and other information with respect to clients of Fidelity, such as other funds advised or subadvised by Fidelity, pension plan clients, and other institutional clients with similar mandates. The Board noted that a joint ad hoc committee created by it and the boards of other Fidelity funds periodically reviews and compares Fidelity's institutional investment advisory business with its business of providing services to the Fidelity funds and also noted the most recent findings of the committee. The Board noted that the committee's review included a consideration of the differences in services provided, fees charged, and costs incurred, as well as competition in the markets serving the different categories of clients.
Based on its review of total expense ratios and fees charged to other Fidelity clients, the Board concluded that the total expense ratio of each class of the fund was reasonable in light of the services that the fund and its shareholders receive and the other factors considered.
Costs of the Services and Profitability. The Board considered the revenues earned and the expenses incurred by Fidelity in conducting the business of developing, marketing, distributing, managing, administering and servicing the fund and servicing the fund's shareholders. The Board also considered the level of Fidelity's profits in respect of all the Fidelity funds.
On an annual basis, Fidelity presents to the Board information about the profitability of its relationships with the fund. Fidelity calculates profitability information for each fund, as well as aggregate profitability information for groups of Fidelity funds and all Fidelity funds, using a series of detailed revenue and cost allocation methodologies which originate with the books and records of Fidelity on which Fidelity's audited financial statements are based. The Audit Committee of the Board reviews any significant changes from the prior year's methodologies.
PricewaterhouseCoopers LLP (PwC), auditor to Fidelity and certain Fidelity funds, has been engaged annually by the Board as part of the Board's assessment of Fidelity's profitability analysis. PwC's engagement includes the review and assessment of the methodologies used by Fidelity in determining the revenues and expenses attributable to Fidelity's mutual fund business, and completion of agreed-upon procedures in respect of the mathematical accuracy of the fund profitability information and its conformity to established allocation methodologies. After considering PwC's reports issued under the engagement and information provided by Fidelity, the Board concluded that while other allocation methods may also be reasonable, Fidelity's profitability methodologies are reasonable in all material respects.
The Board also reviewed Fidelity's non-fund businesses and potential indirect benefits such businesses may have received as a result of their association with Fidelity's mutual fund business (i.e., fall-out benefits) as well as cases where Fidelity's affiliates may benefit from the fund's business. The Board noted that changes to fall-out benefits year-over-year reflect business developments at Fidelity's various businesses.
The Board considered the costs of the services provided by and the profits realized by Fidelity in connection with the operation of the fund and was satisfied that the profitability was not excessive.
Economies of Scale. The Board considered whether there have been economies of scale in respect of the management of the Fidelity funds, whether the Fidelity funds (including the fund) have appropriately benefited from any such economies of scale, and whether there is potential for realization of any further economies of scale. The Board considered the extent to which the fund will benefit from economies of scale as assets grow through increased services to the fund, through waivers or reimbursements, or through fee or expense ratio reductions. The Board also noted that a committee (the Economies of Scale Committee) created by it and the boards of other Fidelity funds periodically analyzes whether Fidelity attains economies of scale in respect of the management and servicing of the Fidelity funds, whether the Fidelity funds have appropriately benefited from such economies of scale, and whether there is potential for realization of any further economies of scale.
The Board recognized that the fund's management contract incorporates a "group fee" structure, which provides for lower group fee rates as total group assets increase, and for higher group fee rates as total group assets decrease (with "group assets" defined to include fund assets under FMR's management plus the assets of sector funds previously under FMR's management). FMR calculates the group fee rates based on a tiered asset "breakpoint" schedule that varies based on asset class. The Board considered that the group fee is designed to deliver the benefits of economies of scale to fund shareholders when total Fidelity fund assets increase, even if assets of any particular fund are unchanged or have declined, because some portion of Fidelity's costs are attributable to services provided to all Fidelity funds, and all funds benefit if those costs can be allocated among more assets. The Board concluded that, given the group fee structure, fund shareholders will benefit from lower management fees as group assets increase at the fund complex level, regardless of whether Fidelity achieves any such economies of scale.
The Board concluded, taking into account the analysis of the Economies of Scale Committee, that economies of scale, if any, are being appropriately shared between fund shareholders and Fidelity.
Additional Information Requested by the Board. In order to develop fully the factual basis for consideration of the Fidelity funds' advisory contracts, the Board requested and received additional information on certain topics, including: (i) fund performance trends, in particular the underperformance of certain funds, and Fidelity's long-term strategies for certain funds; (ii) Fidelity's fund profitability methodology, profitability trends for certain funds, and the impact of certain factors on fund profitability results; (iii) metrics for evaluating index fund and ETF performance and information about ETF trading characteristics; (iv) the methodology with respect to the evaluation of competitive fund data and peer group classifications and fee comparisons; (v) the expense structures for different funds and classes; (vi) information regarding other accounts managed by Fidelity, including collective investment trusts; and (vii) Fidelity's philosophies and strategies for evaluating funds and classes with lower or declining asset levels.
Based on its evaluation of all of the conclusions noted above, and after considering all factors it believed relevant, the Board concluded that the advisory fee arrangements are fair and reasonable, and that the fund's Advisory Contracts should be renewed.
AGLO-SANN-0619
1.719689.120
Fidelity Advisor® Emerging Asia Fund
Semi-Annual Report April 30, 2019 |
|
Beginning on January 1, 2021, as permitted by regulations adopted by the Securities and Exchange Commission, paper copies of a fund’s shareholder reports will no longer be sent by mail, unless you specifically request paper copies of the reports from the fund or from your financial intermediary, such as a financial advisor, broker-dealer or bank. Instead, the reports will be made available on a website, and you will be notified by mail each time a report is posted and provided with a website link to access the report.
If you already elected to receive shareholder reports electronically, you will not be affected by this change and you need not take any action. You may elect to receive shareholder reports and other communications from a fund electronically, by contacting your financial intermediary. For Fidelity customers, visit Fidelity's web site or call Fidelity using the contact information listed below.
You may elect to receive all future reports in paper free of charge. If you wish to continue receiving paper copies of your shareholder reports, you may contact your financial intermediary or, if you are a Fidelity customer, visit Fidelity’s website, or call Fidelity at the applicable toll-free number listed below. Your election to receive reports in paper will apply to all funds held with the fund complex/your financial intermediary.
| Account Type | Website | Phone Number |
| Brokerage, Mutual Fund, or Annuity Contracts: | fidelity.com/mailpreferences | 1-800-343-3548 |
| Employer Provided Retirement Accounts: | netbenefits.fidelity.com/preferences (choose 'no' under Required Disclosures to continue to print) | 1-800-343-0860 |
| Advisor Sold Accounts Serviced Through Your Financial Intermediary: | Contact Your Financial Intermediary | Your Financial Intermediary's phone number |
| Advisor Sold Accounts Serviced by Fidelity: | institutional.fidelity.com | 1-877-208-0098 |
Contents
To view a fund's proxy voting guidelines and proxy voting record for the 12-month period ended June 30, visit http://www.fidelity.com/proxyvotingresults or visit the Securities and Exchange Commission's (SEC) web site at http://www.sec.gov.
You may also call 1-877-208-0098 to request a free copy of the proxy voting guidelines.
Standard & Poor's, S&P and S&P 500 are registered service marks of The McGraw-Hill Companies, Inc. and have been licensed for use by Fidelity Distributors Corporation.
Other third-party marks appearing herein are the property of their respective owners.
All other marks appearing herein are registered or unregistered trademarks or service marks of FMR LLC or an affiliated company. © 2019 FMR LLC. All rights reserved.
This report and the financial statements contained herein are submitted for the general information of the shareholders of the Fund. This report is not authorized for distribution to prospective investors in the Fund unless preceded or accompanied by an effective prospectus.
A fund files its complete schedule of portfolio holdings with the SEC for the first and third quarters of each fiscal year on Form N-PORT. Forms N-PORT are available on the SEC’s web site at http://www.sec.gov. A fund's Forms N-PORT may be reviewed and copied at the SEC’s Public Reference Room in Washington, DC. Information regarding the operation of the SEC's Public Reference Room may be obtained by calling 1-800-SEC-0330.
For a complete list of a fund's portfolio holdings, view the most recent holdings listing, semiannual report, or annual report on Fidelity's web site at http://www.fidelity.com, http://www.institutional.fidelity.com, or http://www.401k.com, as applicable.
NOT FDIC INSURED •MAY LOSE VALUE •NO BANK GUARANTEE
Neither the Fund nor Fidelity Distributors Corporation is a bank.
Investment Summary (Unaudited)
Top Ten Stocks as of April 30, 2019
| | % of fund's net assets |
| Tencent Holdings Ltd. | 8.6 |
| Taiwan Semiconductor Manufacturing Co. Ltd. | 6.4 |
| Alibaba Group Holding Ltd. sponsored ADR | 6.3 |
| AIA Group Ltd. | 4.7 |
| Kweichow Moutai Co. Ltd. (A Shares) | 3.2 |
| Reliance Industries Ltd. | 3.1 |
| Housing Development Finance Corp. Ltd. | 2.5 |
| Ping An Insurance (Group) Co. of China Ltd. (H Shares) | 2.2 |
| HDFC Bank Ltd. | 2.0 |
| HKT Trust/HKT Ltd. unit | 1.7 |
| | 40.7 |
Top Five Market Sectors as of April 30, 2019
| | % of fund's net assets |
| Financials | 24.2 |
| Information Technology | 13.3 |
| Consumer Discretionary | 13.1 |
| Communication Services | 12.7 |
| Industrials | 8.7 |
Asset Allocation (% of fund's net assets)
| As of April 30, 2019 |
| | Stocks | 95.4% |
| | Short-Term Investments and Net Other Assets (Liabilities) | 4.6% |

Schedule of Investments April 30, 2019 (Unaudited)
Showing Percentage of Net Assets
| Common Stocks - 94.4% | | | |
| | | Shares | Value |
| Australia - 1.6% | | | |
| Blue Sky Alternative Investments Ltd. (a) | | 282,448 | $53,760 |
| HUB24 Ltd. (b) | | 152,852 | 1,616,295 |
| Pro Medicus Ltd. | | 12,500 | 180,115 |
| SpeedCast International Ltd. | | 403,509 | 1,103,680 |
| Woodside Petroleum Ltd. | | 65,560 | 1,635,603 |
|
| TOTAL AUSTRALIA | | | 4,589,453 |
|
| Bermuda - 2.0% | | | |
| Hongkong Land Holdings Ltd. | | 428,800 | 2,988,736 |
| Tai Cheung Holdings Ltd. | | 1,538,000 | 1,629,204 |
| Vtech Holdings Ltd. | | 126,100 | 1,150,119 |
|
| TOTAL BERMUDA | | | 5,768,059 |
|
| Cayman Islands - 19.8% | | | |
| 51job, Inc. sponsored ADR (a) | | 28,000 | 2,585,520 |
| Alibaba Group Holding Ltd. sponsored ADR (a) | | 99,700 | 18,501,329 |
| International Housewares Retail Co. Ltd. | | 6,277,900 | 1,648,541 |
| NetEase, Inc. ADR | | 10,700 | 3,044,471 |
| Shenzhou International Group Holdings Ltd. | | 313,000 | 4,201,369 |
| SITC International Holdings Co. Ltd. | | 1,540,000 | 1,635,249 |
| Tencent Holdings Ltd. | | 516,500 | 25,457,080 |
| Value Partners Group Ltd. | | 1,872,000 | 1,407,914 |
|
| TOTAL CAYMAN ISLANDS | | | 58,481,473 |
|
| China - 19.7% | | | |
| China Pacific Insurance (Group) Co. Ltd. (H Shares) | | 522,800 | 2,142,568 |
| Chongqing Fuling Zhacai Group Co. Ltd. Group (A Shares) | | 349,100 | 1,487,131 |
| Foshan Haitian Flavouring & Food Co. Ltd. (A Shares) | | 207,888 | 2,755,830 |
| Gree Electric Appliances, Inc. of Zhuhai (A Shares) | | 350,100 | 2,889,213 |
| Hangzhou Tigermed Consulting Co. Ltd. (A Shares) | | 255,472 | 2,518,722 |
| Inner Mongoli Yili Industries Co. Ltd. (A Shares) | | 337,800 | 1,554,856 |
| Kweichow Moutai Co. Ltd. (A Shares) | | 64,944 | 9,392,189 |
| Midea Group Co. Ltd. (A Shares) | | 317,800 | 2,472,601 |
| PICC Property & Casualty Co. Ltd. (H Shares) | | 1,576,590 | 1,770,569 |
| Ping An Insurance (Group) Co. of China Ltd. (H Shares) | | 546,500 | 6,615,200 |
| Qingdao Port International Co. Ltd. (H Shares) (a)(c) | | 3,682,000 | 2,557,987 |
| Shanghai International Airport Co. Ltd. (A Shares) | | 437,200 | 4,584,988 |
| Shanghai M&G Stationery, Inc. (A Shares) | | 350,100 | 1,944,682 |
| Shenzhen Expressway Co. (H Shares) | | 3,266,000 | 3,975,920 |
| Sinopec Engineering Group Co. Ltd. (H Shares) | | 1,934,500 | 1,869,201 |
| Tonghua Dongbao Pharmaceutical Co. Ltd. (A Shares) | | 976,807 | 2,291,578 |
| Wuliangye Yibin Co. Ltd. (A Shares) | | 184,200 | 2,799,553 |
| Yunnan Baiyao Group Co. Ltd. (A Shares) | | 219,883 | 2,889,374 |
| Zhejiang Sanhua Intelligent Controls Co. Ltd. (A Shares) | | 683,918 | 1,614,619 |
|
| TOTAL CHINA | | | 58,126,781 |
|
| Hong Kong - 9.0% | | | |
| AIA Group Ltd. | | 1,365,600 | 13,982,973 |
| Dah Sing Banking Group Ltd. | | 1,174,400 | 2,245,564 |
| Hong Kong Exchanges and Clearing Ltd. | | 109,473 | 3,795,719 |
| Sino Land Ltd. | | 1,278,203 | 2,248,521 |
| Techtronic Industries Co. Ltd. | | 578,000 | 4,177,621 |
|
| TOTAL HONG KONG | | | 26,450,398 |
|
| India - 15.8% | | | |
| Axis Bank Ltd. (a) | | 327,230 | 3,602,974 |
| Bharti Infratel Ltd. | | 140,681 | 530,329 |
| CCL Products (India) Ltd. | | 461,679 | 1,716,207 |
| Havells India Ltd. (a) | | 146,726 | 1,631,963 |
| HDFC Asset Management Co. Ltd. (c) | | 63,290 | 1,540,335 |
| HDFC Bank Ltd. | | 175,127 | 5,809,958 |
| Housing Development Finance Corp. Ltd. | | 259,806 | 7,442,186 |
| Indraprastha Gas Ltd. (a) | | 405,036 | 1,819,106 |
| Oberoi Realty Ltd. | | 359,207 | 2,616,419 |
| Petronet LNG Ltd. | | 872,433 | 3,020,765 |
| Power Grid Corp. of India Ltd. | | 1,365,532 | 3,654,647 |
| Reliance Industries Ltd. | | 463,096 | 9,260,989 |
| TCNS Clothing Co. Ltd. (a)(c) | | 164,260 | 1,937,125 |
| UPL Ltd. (a) | | 149,011 | 2,073,514 |
|
| TOTAL INDIA | | | 46,656,517 |
|
| Indonesia - 3.0% | | | |
| PT Bank Central Asia Tbk | | 2,521,600 | 5,087,439 |
| PT Bank Rakyat Indonesia Tbk | | 11,874,100 | 3,641,391 |
|
| TOTAL INDONESIA | | | 8,728,830 |
|
| Israel - 0.1% | | | |
| Sarine Technologies Ltd. | | 803,000 | 215,495 |
| Japan - 1.5% | | | |
| Keyence Corp. | | 3,100 | 1,923,533 |
| SoftBank Corp. | | 22,300 | 2,364,500 |
|
| TOTAL JAPAN | | | 4,288,033 |
|
| Korea (South) - 6.0% | | | |
| Cafe24 Corp. (a) | | 10,691 | 881,724 |
| Cuckoo Holdings Co. Ltd. | | 5,223 | 652,869 |
| Hyundai Fire & Marine Insurance Co. Ltd. | | 49,864 | 1,638,558 |
| KB Financial Group, Inc. | | 81,277 | 3,220,667 |
| LG Chemical Ltd. | | 6,753 | 2,094,340 |
| Samsung Electronics Co. Ltd. | | 104,400 | 4,112,284 |
| SK Hynix, Inc. | | 72,914 | 4,948,588 |
|
| TOTAL KOREA (SOUTH) | | | 17,549,030 |
|
| Malaysia - 0.3% | | | |
| Bursa Malaysia Bhd | | 594,100 | 969,930 |
| Multi-National - 1.7% | | | |
| HKT Trust/HKT Ltd. unit | | 3,315,500 | 5,139,262 |
| Philippines - 1.3% | | | |
| Ayala Land, Inc. | | 4,192,300 | 3,964,704 |
| Singapore - 0.7% | | | |
| Wing Tai Holdings Ltd. | | 1,397,800 | 2,106,823 |
| Taiwan - 9.1% | | | |
| E.SUN Financial Holdings Co. Ltd. | | 4,164,922 | 3,416,632 |
| Micro-Star International Co. Ltd. | | 567,000 | 1,570,617 |
| Taiwan Semiconductor Manufacturing Co. Ltd. | | 2,250,393 | 18,893,761 |
| Voltronic Power Technology Corp. | | 151,000 | 2,980,713 |
|
| TOTAL TAIWAN | | | 26,861,723 |
|
| Thailand - 1.9% | | | |
| Bangkok Bank PCL (For. Reg.) | | 221,600 | 1,451,066 |
| Home Product Center PCL (For. Reg.) | | 4,134,300 | 2,033,634 |
| Thai Beverage PCL | | 3,594,000 | 2,219,660 |
|
| TOTAL THAILAND | | | 5,704,360 |
|
| United States of America - 0.9% | | | |
| IPG Photonics Corp. (a) | | 15,900 | 2,778,207 |
| TOTAL COMMON STOCKS | | | |
| (Cost $183,933,392) | | | 278,379,078 |
|
| Nonconvertible Preferred Stocks - 1.0% | | | |
| Korea (South) - 1.0% | | | |
| Samsung Electronics Co. Ltd. | | | |
| (Cost $3,271,485) | | 92,500 | 2,956,160 |
|
| Money Market Funds - 4.9% | | | |
| Fidelity Cash Central Fund, 2.49% (d) | | 12,854,713 | 12,857,284 |
| Fidelity Securities Lending Cash Central Fund 2.49% (d)(e) | | 1,703,550 | 1,703,720 |
| TOTAL MONEY MARKET FUNDS | | | |
| (Cost $14,560,893) | | | 14,561,004 |
| TOTAL INVESTMENT IN SECURITIES - 100.3% | | | |
| (Cost $201,765,770) | | | 295,896,242 |
| NET OTHER ASSETS (LIABILITIES) - (0.3)% | | | (1,009,579) |
| NET ASSETS - 100% | | | $294,886,663 |
Categorizations in the Schedule of Investments are based on country or territory of incorporation.
Legend
(a) Non-income producing
(b) Security or a portion of the security is on loan at period end.
(c) Security exempt from registration under Rule 144A of the Securities Act of 1933. These securities may be resold in transactions exempt from registration, normally to qualified institutional buyers. At the end of the period, the value of these securities amounted to $6,035,447 or 2.0% of net assets.
(d) Affiliated fund that is generally available only to investment companies and other accounts managed by Fidelity Investments. The rate quoted is the annualized seven-day yield of the fund at period end. A complete unaudited listing of the fund's holdings as of its most recent quarter end is available upon request. In addition, each Fidelity Central Fund's financial statements are available on the SEC's website or upon request.
(e) Investment made with cash collateral received from securities on loan.
Affiliated Central Funds
Information regarding fiscal year to date income earned by the Fund from investments in Fidelity Central Funds is as follows:
| Fund | Income earned |
| Fidelity Cash Central Fund | $96,294 |
| Fidelity Securities Lending Cash Central Fund | 9,531 |
| Total | $105,825 |
Amounts in the income column in the above table include any capital gain distributions from underlying funds, which are presented in the corresponding line-item in the Statement of Operations, if applicable.
Investment Valuation
The following is a summary of the inputs used, as of April 30, 2019, involving the Fund's assets and liabilities carried at fair value. The inputs or methodology used for valuing securities may not be an indication of the risk associated with investing in those securities. For more information on valuation inputs, and their aggregation into the levels used below, please refer to the Investment Valuation section in the accompanying Notes to Financial Statements.
| | Valuation Inputs at Reporting Date: |
| Description | Total | Level 1 | Level 2 | Level 3 |
| Investments in Securities: | | | | |
| Equities: | | | | |
| Communication Services | $37,639,322 | $9,817,742 | $27,821,580 | $-- |
| Consumer Discretionary | 38,514,302 | 38,514,302 | -- | -- |
| Consumer Staples | 21,925,426 | 21,925,426 | -- | -- |
| Energy | 13,917,357 | 13,917,357 | -- | -- |
| Financials | 71,451,698 | 41,822,900 | 29,628,798 | -- |
| Health Care | 7,879,789 | 7,879,789 | -- | -- |
| Industrials | 25,596,337 | 25,596,337 | -- | -- |
| Information Technology | 39,214,993 | 20,321,232 | 18,893,761 | -- |
| Materials | 4,167,854 | 4,167,854 | -- | -- |
| Real Estate | 15,554,407 | 15,554,407 | -- | -- |
| Utilities | 5,473,753 | 5,473,753 | -- | -- |
| Money Market Funds | 14,561,004 | 14,561,004 | -- | -- |
| Total Investments in Securities: | $295,896,242 | $219,552,103 | $76,344,139 | $-- |
See accompanying notes which are an integral part of the financial statements.
Financial Statements
Statement of Assets and Liabilities
| | | April 30, 2019 (Unaudited) |
| Assets | | |
Investment in securities, at value (including securities loaned of $1,616,433) — See accompanying schedule:
Unaffiliated issuers (cost $187,204,877) | $281,335,238 | |
| Fidelity Central Funds (cost $14,560,893) | 14,561,004 | |
| Total Investment in Securities (cost $201,765,770) | | $295,896,242 |
| Foreign currency held at value (cost $998,438) | | 998,438 |
| Receivable for investments sold | | 459,319 |
| Receivable for fund shares sold | | 412,825 |
| Dividends receivable | | 224,881 |
| Distributions receivable from Fidelity Central Funds | | 29,593 |
| Prepaid expenses | | 151 |
| Other receivables | | 133,851 |
| Total assets | | 298,155,300 |
| Liabilities | | |
| Payable for investments purchased | $919,686 | |
| Payable for fund shares redeemed | 204,985 | |
| Accrued management fee | 168,886 | |
| Distribution and service plan fees payable | 71,042 | |
| Other affiliated payables | 64,005 | |
| Other payables and accrued expenses | 136,313 | |
| Collateral on securities loaned | 1,703,720 | |
| Total liabilities | | 3,268,637 |
| Net Assets | | $294,886,663 |
| Net Assets consist of: | | |
| Paid in capital | | $202,890,655 |
| Total distributable earnings (loss) | | 91,996,008 |
| Net Assets | | $294,886,663 |
| Net Asset Value and Maximum Offering Price | | |
| Class A: | | |
| Net Asset Value and redemption price per share ($140,419,078 ÷ 3,593,967 shares) | | $39.07 |
| Maximum offering price per share (100/94.25 of $39.07) | | $41.45 |
| Class M: | | |
| Net Asset Value and redemption price per share ($41,523,472 ÷ 1,095,119 shares) | | $37.92 |
| Maximum offering price per share (100/96.50 of $37.92) | | $39.30 |
| Class C: | | |
| Net Asset Value and offering price per share ($28,985,672 ÷ 823,397 shares)(a) | | $35.20 |
| Class I: | | |
| Net Asset Value, offering price and redemption price per share ($72,857,709 ÷ 1,807,617 shares) | | $40.31 |
| Class Z: | | |
| Net Asset Value, offering price and redemption price per share ($11,100,732 ÷ 275,902 shares) | | $40.23 |
(a) Redemption price per share is equal to net asset value less any applicable contingent deferred sales charge.
See accompanying notes which are an integral part of the financial statements.
Statement of Operations
| | | Six months ended April 30, 2019 (Unaudited) |
| Investment Income | | |
| Dividends | | $1,384,130 |
| Income from Fidelity Central Funds | | 105,825 |
| Income before foreign taxes withheld | | 1,489,955 |
| Less foreign taxes withheld | | (108,440) |
| Total income | | 1,381,515 |
| Expenses | | |
| Management fee | $923,924 | |
| Transfer agent fees | 295,951 | |
| Distribution and service plan fees | 467,384 | |
| Accounting and security lending fees | 69,473 | |
| Custodian fees and expenses | 48,113 | |
| Independent trustees' fees and expenses | 733 | |
| Registration fees | 80,499 | |
| Audit | 65,378 | |
| Legal | 1,164 | |
| Miscellaneous | 894 | |
| Total expenses before reductions | 1,953,513 | |
| Expense reductions | (19,672) | |
| Total expenses after reductions | | 1,933,841 |
| Net investment income (loss) | | (552,326) |
| Realized and Unrealized Gain (Loss) | | |
| Net realized gain (loss) on: | | |
| Investment securities: | | |
| Unaffiliated issuers | (415,260) | |
| Fidelity Central Funds | (111) | |
| Foreign currency transactions | (72,181) | |
| Total net realized gain (loss) | | (487,552) |
| Change in net unrealized appreciation (depreciation) on: | | |
| Investment securities: | | |
| Unaffiliated issuers (net of increase in deferred foreign taxes of $81,155) | 58,731,445 | |
| Fidelity Central Funds | 111 | |
| Assets and liabilities in foreign currencies | 9,338 | |
| Total change in net unrealized appreciation (depreciation) | | 58,740,894 |
| Net gain (loss) | | 58,253,342 |
| Net increase (decrease) in net assets resulting from operations | | $57,701,016 |
See accompanying notes which are an integral part of the financial statements.
Statement of Changes in Net Assets
| | Six months ended April 30, 2019 (Unaudited) | Year ended October 31, 2018 |
| Increase (Decrease) in Net Assets | | |
| Operations | | |
| Net investment income (loss) | $(552,326) | $1,583,642 |
| Net realized gain (loss) | (487,552) | 20,926,638 |
| Change in net unrealized appreciation (depreciation) | 58,740,894 | (71,369,376) |
| Net increase (decrease) in net assets resulting from operations | 57,701,016 | (48,859,096) |
| Distributions to shareholders | (15,626,458) | (1,669,451) |
| Share transactions - net increase (decrease) | 3,951,419 | (10,181,121) |
| Redemption fees | – | 5,359 |
| Total increase (decrease) in net assets | 46,025,977 | (60,704,309) |
| Net Assets | | |
| Beginning of period | 248,860,686 | 309,564,995 |
| End of period | $294,886,663 | $248,860,686 |
See accompanying notes which are an integral part of the financial statements.
Financial Highlights
Fidelity Advisor Emerging Asia Fund Class A
| | Six months ended (Unaudited) April 30, | Years endedOctober 31, | | | | |
| | 2019 | 2018 | 2017 | 2016 | 2015 | 2014 |
| Selected Per–Share Data | | | | | | |
| Net asset value, beginning of period | $33.52 | $39.98 | $30.26 | $28.75 | $32.05 | $31.34 |
| Income from Investment Operations | | | | | | |
| Net investment income (loss)A | (.06) | .25 | .27 | .29 | .31 | .30 |
| Net realized and unrealized gain (loss) | 7.74 | (6.48) | 9.75 | 1.67 | (1.76) | 2.00B |
| Total from investment operations | 7.68 | (6.23) | 10.02 | 1.96 | (1.45) | 2.30 |
| Distributions from net investment income | (.19) | (.22) | (.24) | (.22) | (.18) | (.26) |
| Distributions from net realized gain | (1.93) | (.01) | (.07) | (.23) | (1.67) | (1.33) |
| Total distributions | (2.13)C | (.23) | (.31) | (.45) | (1.86)D | (1.59) |
| Redemption fees added to paid in capitalA | – | –E | .01 | –E | .01 | –E |
| Net asset value, end of period | $39.07 | $33.52 | $39.98 | $30.26 | $28.75 | $32.05 |
| Total ReturnF,G,H | 24.12% | (15.67)% | 33.54% | 6.95% | (4.78)% | 7.70%B |
| Ratios to Average Net AssetsI,J | | | | | | |
| Expenses before reductions | 1.36%K | 1.32% | 1.38% | 1.42% | 1.37% | 1.42% |
| Expenses net of fee waivers, if any | 1.35%K | 1.32% | 1.37% | 1.42% | 1.37% | 1.42% |
| Expenses net of all reductions | 1.35%K | 1.30% | 1.36% | 1.42% | 1.36% | 1.42% |
| Net investment income (loss) | (.32)%K | .62% | .80% | 1.03% | 1.00% | .96% |
| Supplemental Data | | | | | | |
| Net assets, end of period (000 omitted) | $140,419 | $106,775 | $137,165 | $119,449 | $125,528 | $145,184 |
| Portfolio turnover rateL | 38%K | 34% | 43% | 75% | 70% | 91% |
A Calculated based on average shares outstanding during the period.
B In 2014, a change to the Indian tax rules invalidated a prior ruling that had exempted the Fund from taxes on realized gains. As a result, the fund recorded a tax liability which resulted in a decrease to realized and unrealized gain (loss) per share of $.18. Excluding this amount, the total return would have been 8.29%.
C Total distributions of $2.13 per share is comprised of distributions from net investment income of $.194 and distributions from net realized gain of $1.933 per share.
D Total distributions of $1.86 per share is comprised of distributions from net investment income of $.183 and distributions from net realized gain of $1.674 per share.
E Amount represents less than $.005 per share.
F Total returns for periods of less than one year are not annualized.
G Total returns would have been lower if certain expenses had not been reduced during the applicable periods shown.
H Total returns do not include the effect of the sales charges.
I Fees and expenses of any underlying Fidelity Central Funds are not included in the Fund's expense ratio. The Fund indirectly bears its proportionate share of the expenses of any underlying Fidelity Central Funds.
J Expense ratios reflect operating expenses of the class. Expenses before reductions do not reflect amounts reimbursed by the investment adviser or reductions from brokerage service arrangements or reductions from other expense offset arrangements and do not represent the amount paid by the class during periods when reimbursements or reductions occur. Expenses net of fee waivers reflect expenses after reimbursement by the investment adviser but prior to reductions from brokerage service arrangements or other expense offset arrangements. Expenses net of all reductions represent the net expenses paid by the class.
K Annualized
L Amount does not include the portfolio activity of any underlying Fidelity Central Funds.
See accompanying notes which are an integral part of the financial statements.
Fidelity Advisor Emerging Asia Fund Class M
| | Six months ended (Unaudited) April 30, | Years endedOctober 31, | | | | |
| | 2019 | 2018 | 2017 | 2016 | 2015 | 2014 |
| Selected Per–Share Data | | | | | | |
| Net asset value, beginning of period | $32.50 | $38.80 | $29.39 | $27.93 | $31.17 | $30.53 |
| Income from Investment Operations | | | | | | |
| Net investment income (loss)A | (.11) | .13 | .16 | .20 | .21 | .20 |
| Net realized and unrealized gain (loss) | 7.52 | (6.29) | 9.49 | 1.62 | (1.71) | 1.94B |
| Total from investment operations | 7.41 | (6.16) | 9.65 | 1.82 | (1.50) | 2.14 |
| Distributions from net investment income | (.05) | (.13) | (.18) | (.13) | (.08) | (.17) |
| Distributions from net realized gain | (1.93) | (.01) | (.07) | (.23) | (1.67) | (1.33) |
| Total distributions | (1.99)C | (.14) | (.25) | (.36) | (1.75) | (1.50) |
| Redemption fees added to paid in capitalA | – | –D | .01 | –D | .01 | –D |
| Net asset value, end of period | $37.92 | $32.50 | $38.80 | $29.39 | $27.93 | $31.17 |
| Total ReturnE,F,G | 23.96% | (15.93)% | 33.16% | 6.62% | (5.05)% | 7.34%B |
| Ratios to Average Net AssetsH,I | | | | | | |
| Expenses before reductions | 1.66%J | 1.61% | 1.68% | 1.72% | 1.68% | 1.73% |
| Expenses net of fee waivers, if any | 1.65%J | 1.61% | 1.68% | 1.72% | 1.68% | 1.73% |
| Expenses net of all reductions | 1.64%J | 1.59% | 1.66% | 1.72% | 1.67% | 1.73% |
| Net investment income (loss) | (.61)%J | .33% | .50% | .72% | .69% | .66% |
| Supplemental Data | | | | | | |
| Net assets, end of period (000 omitted) | $41,523 | $33,478 | $44,730 | $35,791 | $37,720 | $44,563 |
| Portfolio turnover rateK | 38%J | 34% | 43% | 75% | 70% | 91% |
A Calculated based on average shares outstanding during the period.
B In 2014, a change to the Indian tax rules invalidated a prior ruling that had exempted the Fund from taxes on realized gains. As a result, the fund recorded a tax liability which resulted in a decrease to realized and unrealized gain (loss) per share of $.18. Excluding this amount, the total return would have been 7.93%.
C Total distributions of $1.99 per share is comprised of distributions from net investment income of $.054 and distributions from net realized gain of $1.933 per share.
D Amount represents less than $.005 per share.
E Total returns for periods of less than one year are not annualized.
F Total returns would have been lower if certain expenses had not been reduced during the applicable periods shown.
G Total returns do not include the effect of the sales charges.
H Fees and expenses of any underlying Fidelity Central Funds are not included in the Fund's expense ratio. The Fund indirectly bears its proportionate share of the expenses of any underlying Fidelity Central Funds.
I Expense ratios reflect operating expenses of the class. Expenses before reductions do not reflect amounts reimbursed by the investment adviser or reductions from brokerage service arrangements or reductions from other expense offset arrangements and do not represent the amount paid by the class during periods when reimbursements or reductions occur. Expenses net of fee waivers reflect expenses after reimbursement by the investment adviser but prior to reductions from brokerage service arrangements or other expense offset arrangements. Expenses net of all reductions represent the net expenses paid by the class.
J Annualized
K Amount does not include the portfolio activity of any underlying Fidelity Central Funds.
See accompanying notes which are an integral part of the financial statements.
Fidelity Advisor Emerging Asia Fund Class C
| | Six months ended (Unaudited) April 30, | Years endedOctober 31, | | | | |
| | 2019 | 2018 | 2017 | 2016 | 2015 | 2014 |
| Selected Per–Share Data | | | | | | |
| Net asset value, beginning of period | $30.32 | $36.29 | $27.52 | $26.17 | $29.30 | $28.78 |
| Income from Investment Operations | | | | | | |
| Net investment income (loss)A | (.17) | (.04) | .02 | .07 | .07 | .06 |
| Net realized and unrealized gain (loss) | 6.98 | (5.86) | 8.89 | 1.52 | (1.59) | 1.82B |
| Total from investment operations | 6.81 | (5.90) | 8.91 | 1.59 | (1.52) | 1.88 |
| Distributions from net investment income | – | (.05) | (.08) | (.01) | – | (.03) |
| Distributions from net realized gain | (1.93) | (.01) | (.07) | (.23) | (1.62) | (1.33) |
| Total distributions | (1.93) | (.07)C | (.14)D | (.24) | (1.62) | (1.36) |
| Redemption fees added to paid in capitalA | – | –E | –E | –E | .01 | –E |
| Net asset value, end of period | $35.20 | $30.32 | $36.29 | $27.52 | $26.17 | $29.30 |
| Total ReturnF,G,H | 23.67% | (16.30)% | 32.58% | 6.14% | (5.46)% | 6.85%B |
| Ratios to Average Net AssetsI,J | | | | | | |
| Expenses before reductions | 2.11%K | 2.06% | 2.11% | 2.16% | 2.11% | 2.17% |
| Expenses net of fee waivers, if any | 2.10%K | 2.05% | 2.11% | 2.16% | 2.11% | 2.17% |
| Expenses net of all reductions | 2.09%K | 2.04% | 2.09% | 2.16% | 2.10% | 2.17% |
| Net investment income (loss) | (1.06)%K | (.11)% | .07% | .29% | .26% | .22% |
| Supplemental Data | | | | | | |
| Net assets, end of period (000 omitted) | $28,986 | $48,507 | $60,852 | $43,016 | $51,651 | $57,226 |
| Portfolio turnover rateL | 38%K | 34% | 43% | 75% | 70% | 91% |
A Calculated based on average shares outstanding during the period.
B In 2014, a change to the Indian tax rules invalidated a prior ruling that had exempted the Fund from taxes on realized gains. As a result, the fund recorded a tax liability which resulted in a decrease to realized and unrealized gain (loss) per share of $.17. Excluding this amount, the total return would have been 7.44%.
C Total distributions of $.07 per share is comprised of distributions from net investment income of $.054 and distributions from net realized gain of $.013 per share.
D Total distributions of $.14 per share is comprised of distributions from net investment income of $.076 and distributions from net realized gain of $.067 per share.
E Amount represents less than $.005 per share.
F Total returns for periods of less than one year are not annualized.
G Total returns would have been lower if certain expenses had not been reduced during the applicable periods shown.
H Total returns do not include the effect of the contingent deferred sales charge.
I Fees and expenses of any underlying Fidelity Central Funds are not included in the Fund's expense ratio. The Fund indirectly bears its proportionate share of the expenses of any underlying Fidelity Central Funds.
J Expense ratios reflect operating expenses of the class. Expenses before reductions do not reflect amounts reimbursed by the investment adviser or reductions from brokerage service arrangements or reductions from other expense offset arrangements and do not represent the amount paid by the class during periods when reimbursements or reductions occur. Expenses net of fee waivers reflect expenses after reimbursement by the investment adviser but prior to reductions from brokerage service arrangements or other expense offset arrangements. Expenses net of all reductions represent the net expenses paid by the class.
K Annualized
L Amount does not include the portfolio activity of any underlying Fidelity Central Funds.
See accompanying notes which are an integral part of the financial statements.
Fidelity Advisor Emerging Asia Fund Class I
| | Six months ended (Unaudited) April 30, | Years endedOctober 31, | | | | |
| | 2019 | 2018 | 2017 | 2016 | 2015 | 2014 |
| Selected Per–Share Data | | | | | | |
| Net asset value, beginning of period | $34.60 | $41.27 | $31.19 | $29.63 | $33.00 | $32.24 |
| Income from Investment Operations | | | | | | |
| Net investment income (loss)A | (.01) | .37 | .38 | .39 | .41 | .40 |
| Net realized and unrealized gain (loss) | 7.98 | (6.68) | 10.06 | 1.72 | (1.81) | 2.04B |
| Total from investment operations | 7.97 | (6.31) | 10.44 | 2.11 | (1.40) | 2.44 |
| Distributions from net investment income | (.33) | (.34) | (.31) | (.32) | (.31) | (.35) |
| Distributions from net realized gain | (1.93) | (.01) | (.07) | (.23) | (1.67) | (1.33) |
| Total distributions | (2.26) | (.36)C | (.37)D | (.55) | (1.98) | (1.68) |
| Redemption fees added to paid in capitalA | – | –E | .01 | –E | .01 | –E |
| Net asset value, end of period | $40.31 | $34.60 | $41.27 | $31.19 | $29.63 | $33.00 |
| Total ReturnF,G | 24.31% | (15.43)% | 33.97% | 7.27% | (4.47)% | 7.98%B |
| Ratios to Average Net AssetsH,I | | | | | | |
| Expenses before reductions | 1.07%J | 1.03% | 1.08% | 1.11% | 1.07% | 1.12% |
| Expenses net of fee waivers, if any | 1.06%J | 1.03% | 1.07% | 1.11% | 1.07% | 1.12% |
| Expenses net of all reductions | 1.06%J | 1.02% | 1.06% | 1.11% | 1.06% | 1.12% |
| Net investment income (loss) | (.03)%J | .91% | 1.10% | 1.34% | 1.30% | 1.26% |
| Supplemental Data | | | | | | |
| Net assets, end of period (000 omitted) | $72,858 | $59,527 | $66,818 | $37,364 | $51,569 | $48,693 |
| Portfolio turnover rateK | 38%J | 34% | 43% | 75% | 70% | 91% |
A Calculated based on average shares outstanding during the period.
B In 2014, a change to the Indian tax rules invalidated a prior ruling that had exempted the Fund from taxes on realized gains. As a result, the fund recorded a tax liability which resulted in a decrease to realized and unrealized gain (loss) per share of $.19. Excluding this amount, the total return would have been 8.57%.
C Total distributions of $.36 per share is comprised of distributions from net investment income of $.342 and distributions from net realized gain of $.013 per share.
D Total distributions of $.37 per share is comprised of distributions from net investment income of $.307 and distributions from net realized gain of $.067 per share.
E Amount represents less than $.005 per share.
F Total returns for periods of less than one year are not annualized.
G Total returns would have been lower if certain expenses had not been reduced during the applicable periods shown.
H Fees and expenses of any underlying Fidelity Central Funds are not included in the Fund's expense ratio. The Fund indirectly bears its proportionate share of the expenses of any underlying Fidelity Central Funds.
I Expense ratios reflect operating expenses of the class. Expenses before reductions do not reflect amounts reimbursed by the investment adviser or reductions from brokerage service arrangements or reductions from other expense offset arrangements and do not represent the amount paid by the class during periods when reimbursements or reductions occur. Expenses net of fee waivers reflect expenses after reimbursement by the investment adviser but prior to reductions from brokerage service arrangements or other expense offset arrangements. Expenses net of all reductions represent the net expenses paid by the class.
J Annualized
K Amount does not include the portfolio activity of any underlying Fidelity Central Funds.
See accompanying notes which are an integral part of the financial statements.
Fidelity Advisor Emerging Asia Fund Class Z
| | Six months ended (Unaudited) April 30, | Years endedOctober 31, |
| | 2019 | 2018 A |
| Selected Per–Share Data | | |
| Net asset value, beginning of period | $34.60 | $38.03 |
| Income from Investment Operations | | |
| Net investment income (loss)B | .02 | – |
| Net realized and unrealized gain (loss) | 7.96 | (3.43) |
| Total from investment operations | 7.98 | (3.43) |
| Distributions from net investment income | (.42) | – |
| Distributions from net realized gain | (1.93) | – |
| Total distributions | (2.35) | – |
| Net asset value, end of period | $40.23 | $34.60 |
| Total ReturnC,D | 24.39% | (9.02)% |
| Ratios to Average Net AssetsE,F | | |
| Expenses before reductions | .93%G | .97%G |
| Expenses net of fee waivers, if any | .93%G | .97%G |
| Expenses net of all reductions | .93%G | .95%G |
| Net investment income (loss) | .10%G | (.02)%G |
| Supplemental Data | | |
| Net assets, end of period (000 omitted) | $11,101 | $573 |
| Portfolio turnover rateH | 38%G | 34% |
A For the period October 2, 2018 (commencement of sale of shares) to October 31, 2018.
B Calculated based on average shares outstanding during the period.
C Total returns for periods of less than one year are not annualized.
D Total returns would have been lower if certain expenses had not been reduced during the applicable periods shown.
E Fees and expenses of any underlying Fidelity Central Funds are not included in the Fund's expense ratio. The Fund indirectly bears its proportionate share of the expenses of any underlying Fidelity Central Funds.
F Expense ratios reflect operating expenses of the class. Expenses before reductions do not reflect amounts reimbursed by the investment adviser or reductions from brokerage service arrangements or reductions from other expense offset arrangements and do not represent the amount paid by the class during periods when reimbursements or reductions occur. Expense ratios before reductions for start-up periods may not be representative of longer-term operating periods. Expenses net of fee waivers reflect expenses after reimbursement by the investment adviser but prior to reductions from brokerage service arrangements or other expense offset arrangements. Expenses net of all reductions represent the net expenses paid by the class.
G Annualized
H Amount does not include the portfolio activity of any underlying Fidelity Central Funds.
See accompanying notes which are an integral part of the financial statements.
Notes to Financial Statements (Unaudited)
For the period ended April 30, 2019
1. Organization.
Fidelity Advisor Emerging Asia Fund (the Fund) is a fund of Fidelity Advisor Series VIII (the Trust) and is authorized to issue an unlimited number of shares. The Trust is registered under the Investment Company Act of 1940, as amended (the 1940 Act), as an open-end management investment company organized as a Massachusetts business trust. The Fund offers Class A, Class M, Class C, Class I and Class Z shares, each of which has equal rights as to assets and voting privileges. Each class has exclusive voting rights with respect to matters that affect that class. Effective March 1, 2019, Class C shares will automatically convert to Class A shares after a holding period of ten years from the initial date of purchase, with certain exceptions. The Fund's investments in emerging markets can be subject to social, economic, regulatory, and political uncertainties and can be extremely volatile.
2. Investments in Fidelity Central Funds.
The Fund invests in Fidelity Central Funds, which are open-end investment companies generally available only to other investment companies and accounts managed by the investment adviser and its affiliates. The Fund's Schedule of Investments lists each of the Fidelity Central Funds held as of period end, if any, as an investment of the Fund, but does not include the underlying holdings of each Fidelity Central Fund. As an Investing Fund, the Fund indirectly bears its proportionate share of the expenses of the underlying Fidelity Central Funds.
The Money Market Central Funds seek preservation of capital and current income and are managed by Fidelity Investments Money Management, Inc. (FIMM), an affiliate of the investment adviser. Annualized expenses of the Money Market Central Funds as of their most recent shareholder report date are less than .005%.
A complete unaudited list of holdings for each Fidelity Central Fund is available upon request or at the Securities and Exchange Commission (the SEC) website at www.sec.gov. In addition, the financial statements of the Fidelity Central Funds are available on the SEC website or upon request.
3. Significant Accounting Policies.
The Fund is an investment company and applies the accounting and reporting guidance of the Financial Accounting Standards Board (FASB) Accounting Standards Codification Topic 946 Financial Services – Investments Companies. The financial statements have been prepared in conformity with accounting principles generally accepted in the United States of America (GAAP), which require management to make certain estimates and assumptions at the date of the financial statements. Actual results could differ from those estimates. Subsequent events, if any, through the date that the financial statements were issued have been evaluated in the preparation of the financial statements. The following summarizes the significant accounting policies of the Fund:
Investment Valuation. Investments are valued as of 4:00 p.m. Eastern time on the last calendar day of the period. The Board of Trustees (the Board) has delegated the day to day responsibility for the valuation of the Fund's investments to the Fair Value Committee (the Committee) established by the Fund's investment adviser. In accordance with valuation policies and procedures approved by the Board, the Fund attempts to obtain prices from one or more third party pricing vendors or brokers to value its investments. When current market prices, quotations or currency exchange rates are not readily available or reliable, investments will be fair valued in good faith by the Committee, in accordance with procedures adopted by the Board. Factors used in determining fair value vary by investment type and may include market or investment specific events. The frequency with which these procedures are used cannot be predicted and they may be utilized to a significant extent. The Committee oversees the Fund's valuation policies and procedures and reports to the Board on the Committee's activities and fair value determinations. The Board monitors the appropriateness of the procedures used in valuing the Fund's investments and ratifies the fair value determinations of the Committee.
The Fund categorizes the inputs to valuation techniques used to value its investments into a disclosure hierarchy consisting of three levels as shown below:
- Level 1 – quoted prices in active markets for identical investments
- Level 2 – other significant observable inputs (including quoted prices for similar investments, interest rates, prepayment speeds, etc.)
- Level 3 – unobservable inputs (including the Fund's own assumptions based on the best information available)
Valuation techniques used to value the Fund's investments by major category are as follows:
Equity securities, including restricted securities, for which market quotations are readily available, are valued at the last reported sale price or official closing price as reported by a third party pricing vendor on the primary market or exchange on which they are traded and are categorized as Level 1 in the hierarchy. In the event there were no sales during the day or closing prices are not available, securities are valued at the last quoted bid price or may be valued using the last available price and are generally categorized as Level 2 in the hierarchy. For foreign equity securities, when market or security specific events arise, comparisons to the valuation of American Depositary Receipts (ADRs), futures contracts, Exchange-Traded Funds (ETFs) and certain indexes as well as quoted prices for similar securities may be used and would be categorized as Level 2 in the hierarchy. For equity securities, including restricted securities, where observable inputs are limited, assumptions about market activity and risk are used and these securities may be categorized as Level 3 in the hierarchy.
Investments in open-end mutual funds, are valued at their closing net asset value (NAV) each business day and are categorized as Level 1 in the hierarchy.
Changes in valuation techniques may result in transfers in or out of an assigned level within the disclosure hierarchy. The aggregate value of investments by input level as of April 30, 2019 is included at the end of the Fund's Schedule of Investments.
Foreign Currency. The Fund may use foreign currency contracts to facilitate transactions in foreign-denominated securities. Gains and losses from these transactions may arise from changes in the value of the foreign currency or if the counterparties do not perform under the contracts' terms.
Foreign-denominated assets, including investment securities, and liabilities are translated into U.S. dollars at the exchange rates at period end. Purchases and sales of investment securities, income and dividends received and expenses denominated in foreign currencies are translated into U.S. dollars at the exchange rate in effect on the transaction date.
The effects of exchange rate fluctuations on investments are included with the net realized and unrealized gain (loss) on investment securities. Other foreign currency transactions resulting in realized and unrealized gain (loss) are disclosed separately.
Investment Transactions and Income. For financial reporting purposes, the Fund's investment holdings and NAV include trades executed through the end of the last business day of the period. The NAV per share for processing shareholder transactions is calculated as of the close of business of the New York Stock Exchange (NYSE), normally 4:00 p.m. Eastern time and includes trades executed through the end of the prior business day. Gains and losses on securities sold are determined on the basis of identified cost and include proceeds received from litigation. Dividend income is recorded on the ex-dividend date, except for certain dividends from foreign securities where the ex-dividend date may have passed, which are recorded as soon as the Fund is informed of the ex-dividend date. Non-cash dividends included in dividend income, if any, are recorded at the fair market value of the securities received. Income and capital gain distributions from Fidelity Central Funds, if any, are recorded on the ex-dividend date. Investment income is recorded net of foreign taxes withheld where recovery of such taxes is uncertain.
Class Allocations and Expenses. Investment income, realized and unrealized capital gains and losses, common expenses of the Fund, and certain fund-level expense reductions, if any, are allocated daily on a pro-rata basis to each class based on the relative net assets of each class to the total net assets of the Fund. Each class differs with respect to transfer agent and distribution and service plan fees incurred. Certain expense reductions may also differ by class. For the reporting period, the allocated portion of income and expenses to each class as a percent of its average net assets may vary due to the timing of recording these transactions in relation to fluctuating net assets of the classes. Expenses directly attributable to a fund are charged to that fund. Expenses attributable to more than one fund are allocated among the respective funds on the basis of relative net assets or other appropriate methods. Expense estimates are accrued in the period to which they relate and adjustments are made when actual amounts are known.
Income Tax Information and Distributions to Shareholders. Each year, the Fund intends to qualify as a regulated investment company under Subchapter M of the Internal Revenue Code, including distributing substantially all of its taxable income and realized gains. As a result, no provision for U.S. Federal income taxes is required. The Fund files a U.S. federal tax return, in addition to state and local tax returns as required. The Fund's federal income tax returns are subject to examination by the Internal Revenue Service (IRS) for a period of three fiscal years after they are filed. State and local tax returns may be subject to examination for an additional fiscal year depending on the jurisdiction. Foreign taxes are provided for based on the Fund's understanding of the tax rules and rates that exist in the foreign markets in which it invests. The Fund is subject to a tax imposed on capital gains by certain countries in which it invests. An estimated deferred tax liability for net unrealized appreciation on the applicable securities is included in Other payables and accrued expenses on the Statement of Assets & Liabilities.
Distributions are declared and recorded on the ex-dividend date. Income and capital gain distributions are declared separately for each class. Income and capital gain distributions are determined in accordance with income tax regulations, which may differ from GAAP.
Capital accounts within the financial statements are adjusted for permanent book-tax differences. These adjustments have no impact on net assets or the results of operations. Capital accounts are not adjusted for temporary book-tax differences which will reverse in a subsequent period.
Book-tax differences are primarily due to foreign currency transactions, passive foreign investment companies (PFIC), capital loss carryforwards and losses deferred due to wash sales.
As of period end, the cost and unrealized appreciation (depreciation) in securities, and derivatives if applicable, for federal income tax purposes were as follows:
| Gross unrealized appreciation | $101,496,378 |
| Gross unrealized depreciation | (8,690,483) |
| Net unrealized appreciation (depreciation) | $92,805,895 |
| Tax cost | $203,090,347 |
Restricted Securities. The Fund may invest in securities that are subject to legal or contractual restrictions on resale. These securities generally may be resold in transactions exempt from registration or to the public if the securities are registered. Disposal of these securities may involve time-consuming negotiations and expense, and prompt sale at an acceptable price may be difficult. Information regarding restricted securities is included at the end of the Fund's Schedule of Investments.
4. Purchases and Sales of Investments.
Purchases and sales of securities, other than short-term securities, aggregated $49,640,012 and $54,683,790, respectively.
5. Fees and Other Transactions with Affiliates.
Management Fee. Fidelity Management & Research Company (the investment adviser) and its affiliates provide the Fund with investment management related services for which the Fund pays a monthly management fee. The management fee is the sum of an individual fund fee rate that is based on an annual rate of .45% of the Fund's average net assets and an annualized group fee rate that averaged .24% during the period. The group fee rate is based upon the average net assets of all the mutual funds advised by the investment adviser, including any mutual funds previously advised by the investment adviser that are currently advised by Fidelity SelectCo, LLC, an affiliate of the investment adviser. The group fee rate decreases as assets under management increase and increases as assets under management decrease. For the reporting period, the total annualized management fee rate was .69% of the Fund's average net assets.
Distribution and Service Plan Fees. In accordance with Rule 12b-1 of the 1940 Act, the Fund has adopted separate Distribution and Service Plans for each class of shares. Certain classes pay Fidelity Distributors Corporation (FDC), an affiliate of the investment adviser, separate Distribution and Service Fees, each of which is based on an annual percentage of each class' average net assets. In addition, FDC may pay financial intermediaries for selling shares of the Fund and providing shareholder support services. For the period, the Distribution and Service Fee rates, total fees and amounts retained by FDC were as follows:
| | Distribution Fee | Service Fee | Total Fees | Retained by FDC |
| Class A | -% | .25% | $148,227 | $4,568 |
| Class M | .25% | .25% | 92,986 | 2,541 |
| Class C | .75% | .25% | 226,171 | 16,751 |
| | | | $467,384 | $23,860 |
Sales Load. FDC may receive a front-end sales charge of up to 5.75% for selling Class A shares and 3.50% for selling Class M shares, some of which is paid to financial intermediaries for selling shares of the Fund. Depending on the holding period, FDC may receive contingent deferred sales charges levied on Class A, Class M and Class C redemptions. The deferred sales charges are 1.00% for Class C shares, 1.00% for certain purchases of Class A shares and .25% for certain purchases of Class M shares.
For the period, sales charge amounts retained by FDC were as follows:
| | Retained by FDC |
| Class A | $11,703 |
| Class M | 1,530 |
| Class C(a) | 2,343 |
| | $15,576 |
(a) When Class C shares are initially sold, FDC pays commissions from its own resources to financial intermediaries through which the sales are made.
Transfer Agent Fees. Fidelity Investments Institutional Operations Company, Inc., (FIIOC), an affiliate of the investment adviser, is the transfer, dividend disbursing and shareholder servicing agent for each class of the Fund. FIIOC receives account fees and asset-based fees that vary according to the account size and type of account of the shareholders of the respective classes of the Fund, except for Class Z. FIIOC receives an asset-based fee of Class Z's average net assets. FIIOC pays for typesetting, printing and mailing of shareholder reports, except proxy statements.
For the period, transfer agent fees for each class were as follows:
| | Amount | % of Class-Level Average Net Assets(a) |
| Class A | $135,305 | .23 |
| Class M | 50,614 | .27 |
| Class C | 49,665 | .22 |
| Class I | 59,718 | .19 |
| Class Z | 649 | .05 |
| | $295,951 | |
(a) Annualized
Accounting and Security Lending Fees. Fidelity Service Company, Inc. (FSC), an affiliate of the investment adviser, maintains the Fund's accounting records. The accounting fee is based on the level of average net assets for each month. Prior to April 1, 2019, FSC had a separate agreement with the Fund for administration of the security lending program, based on the number and duration of lending transactions. For the period, the total fees paid for accounting and administration of securities lending were equivalent to an annualized rate of .05%.
Brokerage Commissions. The Fund placed a portion of its portfolio transactions with brokerage firms which are affiliates of the investment adviser. Brokerage commissions are included in net realized gain (loss) and change in net unrealized appreciation (depreciation) in the Statement of Operations. The commissions paid to these affiliated firms were $103 for the period.
Interfund Trades. The Funds may purchase from or sell securities to other Fidelity Funds under procedures adopted by the Board. The procedures have been designed to ensure these interfund trades are executed in accordance with Rule 17a-7 of the 1940 Act. Interfund trades are included within the respective purchases and sales amounts shown in the Purchases and Sales of Investments note.
6. Committed Line of Credit.
The Fund participates with other funds managed by the investment adviser or an affiliate in a $4.25 billion credit facility (the "line of credit") to be utilized for temporary or emergency purposes to fund shareholder redemptions or for other short-term liquidity purposes. The Fund has agreed to pay commitment fees on its pro-rata portion of the line of credit, which amounted to $376 and is reflected in Miscellaneous expenses on the Statement of Operations. During the period, the Fund did not borrow on this line of credit.
7. Security Lending.
The Fund lends portfolio securities through a lending agent from time to time in order to earn additional income. For equity securities, a lending agent is used and may loan securities to certain qualified borrowers, including Fidelity Capital Markets (FCM), a broker-dealer affiliated with the Fund. On the settlement date of the loan, the Fund receives collateral (in the form of U.S. Treasury obligations, letters of credit and/or cash) against the loaned securities and maintains collateral in an amount not less than 100% of the market value of the loaned securities during the period of the loan. The market value of the loaned securities is determined at the close of business of the Fund and any additional required collateral is delivered to the Fund on the next business day. The Fund or borrower may terminate the loan at any time, and if the borrower defaults on its obligation to return the securities loaned because of insolvency or other reasons, the Fund may apply collateral received from the borrower against the obligation. The Fund may experience delays and costs in recovering the securities loaned. Any cash collateral received is invested in the Fidelity Securities Lending Cash Central Fund. The value of loaned securities and cash collateral at period end are disclosed on the Fund's Statement of Assets and Liabilities. Security lending income represents the income earned on investing cash collateral, less rebates paid to borrowers and any lending agent fees associated with the loan, plus any premium payments received for lending certain types of securities. Security lending income is presented in the Statement of Operations as a component of income from Fidelity Central Funds. Total security lending income during the period amounted to $9,531. During the period, there were no securities loaned to FCM.
8. Expense Reductions.
Commissions paid to certain brokers with whom the investment adviser, or its affiliates, places trades on behalf of the Fund include an amount in addition to trade execution, which may be rebated back to the Fund to offset certain expenses. This amount totaled $2,591 for the period. In addition, through arrangements with the Fund's custodian, credits realized as a result of certain uninvested cash balances were used to reduce the Fund's expenses. During the period, these credits reduced the Fund's custody expenses by $10.
In addition, during the period the investment adviser reimbursed and/or waived a portion of fund-level operating expenses in the amount of $1,008 and a portion of class-level operating expenses as follows:
| | Reimbursement |
| Class A | $6,907 |
| Class M | 2,269 |
| Class C | 2,951 |
| Class I | 3,879 |
| Class Z | 57 |
| | $16,063 |
9. Distributions to Shareholders.
Distributions to shareholders of each class were as follows:
| | Six months ended
April 30, 2019 | Year ended
October 31, 2018 |
| Distributions to shareholders | | |
| Class A | $6,691,790 | $782,369 |
| Class M | 2,031,064 | 164,115 |
| Class C | 3,030,598 | 114,683 |
| Class I | 3,816,719 | 608,284 |
| Class Z | 56,287 | – |
| Total | $15,626,458 | $1,669,451 |
10. Share Transactions.
Share transactions for each class were as follows and may contain automatic conversions between classes or exchanges between affiliated funds:
| | Shares | Shares | Dollars | Dollars |
| | Six months ended April 30, 2019 | Year ended October 31, 2018(a) | Six months ended April 30, 2019 | Year ended October 31, 2018(a) |
| Class A | | | | |
| Shares sold | 620,322 | 347,979 | $22,889,043 | $13,983,752 |
| Reinvestment of distributions | 188,292 | 18,295 | 6,170,342 | 726,143 |
| Shares redeemed | (400,252) | (611,537) | (14,256,938) | (24,140,514) |
| Net increase (decrease) | 408,362 | (245,263) | $14,802,447 | $(9,430,619) |
| Class M | | | | |
| Shares sold | 77,987 | 106,289 | $2,688,343 | $4,193,456 |
| Reinvestment of distributions | 63,400 | 4,228 | 2,018,654 | 163,108 |
| Shares redeemed | (76,377) | (233,325) | (2,629,059) | (8,901,416) |
| Net increase (decrease) | 65,010 | (122,808) | $2,077,938 | $(4,544,852) |
| Class C | | | | |
| Shares sold | 62,516 | 264,089 | $2,025,294 | $9,881,327 |
| Reinvestment of distributions | 97,571 | 2,994 | 2,890,051 | 108,193 |
| Shares redeemed | (936,371) | (344,108) | (31,023,602) | (12,330,390) |
| Net increase (decrease) | (776,284) | (77,025) | $(26,108,257) | $(2,340,870) |
| Class I | | | | |
| Shares sold | 391,191 | 916,032 | $14,506,326 | $38,220,251 |
| Reinvestment of distributions | 96,243 | 13,464 | 3,250,123 | 550,139 |
| Shares redeemed | (400,488) | (828,029) | (14,524,128) | (33,233,325) |
| Net increase (decrease) | 86,946 | 101,467 | $3,232,321 | $5,537,065 |
| Class Z | | | | |
| Shares sold | 278,438 | 16,569 | $10,714,023 | $598,155 |
| Reinvestment of distributions | 783 | – | 26,366 | – |
| Shares redeemed | (19,888) | – | (793,419) | – |
| Net increase (decrease) | 259,333 | 16,569 | $9,946,970 | $598,155 |
(a) Share transactions for Class Z are for the period October 2, 2018 (commencement of sale of shares) to October 31, 2018.
11. Other.
The Fund's organizational documents provide former and current trustees and officers with a limited indemnification against liabilities arising in connection with the performance of their duties to the Fund. In the normal course of business, the Fund may also enter into contracts that provide general indemnifications. The Fund's maximum exposure under these arrangements is unknown as this would be dependent on future claims that may be made against the Fund. The risk of material loss from such claims is considered remote.
Shareholder Expense Example
As a shareholder of the Fund, you incur two types of costs: (1) transaction costs, including sales charges (loads) on purchase payments or redemption proceeds, and (2) ongoing costs, including management fees, distribution and/or service (12b-1) fees and other Fund expenses. This Example is intended to help you understand your ongoing costs (in dollars) of investing in the Fund and to compare these costs with the ongoing costs of investing in other mutual funds.
The Example is based on an investment of $1,000 invested at the beginning of the period and held for the entire period (November 1, 2018 to April 30, 2019).
Actual Expenses
The first line of the accompanying table for each class of the Fund provides information about actual account values and actual expenses. You may use the information in this line, together with the amount you invested, to estimate the expenses that you paid over the period. Simply divide your account value by $1,000.00 (for example, an $8,600 account value divided by $1,000.00 = 8.6), then multiply the result by the number in the first line for a class of the Fund under the heading entitled "Expenses Paid During Period" to estimate the expenses you paid on your account during this period. In addition, the Fund, as a shareholder in the underlying Fidelity Central Funds, will indirectly bear its pro-rata share of the fees and expenses incurred by the underlying Fidelity Central Funds. These fees and expenses are not included in the Fund's annualized expense ratio used to calculate the expense estimate in the table below.
Hypothetical Example for Comparison Purposes
The second line of the accompanying table for each class of the Fund provides information about hypothetical account values and hypothetical expenses based on a Class' actual expense ratio and an assumed rate of return of 5% per year before expenses, which is not the Class' actual return. The hypothetical account values and expenses may not be used to estimate the actual ending account balance or expenses you paid for the period. You may use this information to compare the ongoing costs of investing in the Fund and other funds. To do so, compare this 5% hypothetical example with the 5% hypothetical examples that appear in the shareholder reports of the other funds. In addition, the Fund, as a shareholder in the underlying Fidelity Central Funds, will indirectly bear its pro-rata share of the fees and expenses incurred by the underlying Fidelity Central Funds. These fees and expenses are not included in the Fund's annualized expense ratio used to calculate the expense estimate in the table below.
Please note that the expenses shown in the table are meant to highlight your ongoing costs only and do not reflect any transaction costs. Therefore, the second line of the table is useful in comparing ongoing costs only, and will not help you determine the relative total costs of owning different funds. In addition, if these transactional costs were included, your costs would have been higher.
| | Annualized Expense Ratio-A | Beginning
Account Value
November 1, 2018 | Ending
Account Value
April 30, 2019 | Expenses Paid
During Period-B
November 1, 2018
to April 30, 2019 |
| Class A | 1.35% | | | |
| Actual | | $1,000.00 | $1,241.20 | $7.50 |
| Hypothetical-C | | $1,000.00 | $1,018.10 | $6.76 |
| Class M | 1.65% | | | |
| Actual | | $1,000.00 | $1,239.60 | $9.16 |
| Hypothetical-C | | $1,000.00 | $1,016.61 | $8.25 |
| Class C | 2.10% | | | |
| Actual | | $1,000.00 | $1,236.70 | $11.65 |
| Hypothetical-C | | $1,000.00 | $1,014.38 | $10.49 |
| Class I | 1.06% | | | |
| Actual | | $1,000.00 | $1,243.10 | $5.90 |
| Hypothetical-C | | $1,000.00 | $1,019.54 | $5.31 |
| Class Z | .93% | | | |
| Actual | | $1,000.00 | $1,243.90 | $5.17 |
| Hypothetical-C | | $1,000.00 | $1,020.18 | $4.66 |
A Annualized expense ratio reflects expenses net of applicable fee waivers.
B Expenses are equal to each Class' annualized expense ratio, multiplied by the average account value over the period, multiplied by 181/365 (to reflect the one-half year period).
C 5% return per year before expenses
Board Approval of Investment Advisory Contracts and Management Fees
Fidelity Advisor Emerging Asia Fund
Each year, the Board of Trustees, including the Independent Trustees (together, the Board), votes on the renewal of the management contract with Fidelity Management & Research Company (FMR) and the sub-advisory agreements (together, the Advisory Contracts) for the fund. FMR and the sub-advisers are referred to herein as the Investment Advisers. The Board, assisted by the advice of fund counsel and Independent Trustees' counsel, requests and considers a broad range of information relevant to the renewal of the Advisory Contracts throughout the year.
The Board meets regularly and, at each of its meetings, covers an extensive agenda of topics and materials and considers factors that are relevant to its annual consideration of the renewal of the fund's Advisory Contracts, including the services and support provided to the fund and its shareholders. The Board has established various standing committees (Committees), each composed of and chaired by Independent Trustees with varying backgrounds, to which the Board has assigned specific subject matter responsibilities in order to enhance effective decision-making by the Board. The Board, acting directly and through its Committees, requests and receives information concerning the annual consideration of the renewal of the fund's Advisory Contracts. The Board also meets as needed to review matters specifically related to the Board's annual consideration of the renewal of the Advisory Contracts. Members of the Board may also meet with trustees of other Fidelity funds through joint ad hoc committees to discuss certain matters relevant to all of the Fidelity funds.
At its January 2019 meeting, the Board unanimously determined to renew the fund's Advisory Contracts. In reaching its determination, the Board considered all factors it believed relevant, including (i) the nature, extent, and quality of the services to be provided to the fund and its shareholders (including the investment performance of the fund); (ii) the competitiveness of the fund's management fee and total expense ratio relative to peer funds; (iii) the total costs of the services to be provided by and the profits to be realized by Fidelity from its relationships with the fund; and (iv) the extent to which, if any, economies of scale exist and would be realized as the fund grows, and whether any economies of scale are appropriately shared with fund shareholders.
In considering whether to renew the Advisory Contracts for the fund, the Board reached a determination, with the assistance of fund counsel and Independent Trustees' counsel and through the exercise of its business judgment, that the renewal of the Advisory Contracts was in the best interests of the fund and its shareholders and that the compensation payable under the Advisory Contracts was fair and reasonable. The Board's decision to renew the Advisory Contracts was not based on any single factor, but rather was based on a comprehensive consideration of all the information provided to the Board at its meetings throughout the year. The Board, in reaching its determination to renew the Advisory Contracts, was aware that shareholders of the fund have a broad range of investment choices available to them, including a wide choice among funds offered by Fidelity's competitors, and that the fund's shareholders, who have the opportunity to review and weigh the disclosure provided by the fund in its prospectus and other public disclosures, have chosen to invest in this fund, which is part of the Fidelity family of funds.
Nature, Extent, and Quality of Services Provided. The Board considered Fidelity's staffing as it relates to the fund, including the backgrounds of investment personnel of Fidelity, and also considered the fund's investment objective, strategies, and related investment philosophy. The Independent Trustees also had discussions with senior management of Fidelity's investment operations and investment groups. The Board considered the structure of the investment personnel compensation program and whether this structure provides appropriate incentives to act in the best interests of the fund. Additionally, the Board considered the portfolio managers' investments, if any, in the funds that they manage.
Resources Dedicated to Investment Management and Support Services. The Board and the Fund Oversight and Research Committees reviewed the general qualifications and capabilities of Fidelity's investment staff, including its size, education, experience, and resources, as well as Fidelity's approach to recruiting, training, managing, and compensating investment personnel. The Board noted that Fidelity has continued to increase the resources devoted to non-U.S. offices, including expansion of Fidelity's global investment organization. The Board also noted that Fidelity's analysts have extensive resources, tools and capabilities that allow them to conduct sophisticated quantitative and fundamental analysis, as well as credit analysis of issuers, counterparties and guarantors. Further, the Board considered that Fidelity's investment professionals have sufficient access to global information and data so as to provide competitive investment results over time, and that those professionals also have access to sophisticated tools that permit them to assess portfolio construction and risk and performance attribution characteristics continuously, as well as to transmit new information and research conclusions rapidly around the world. Additionally, in its deliberations, the Board considered Fidelity's trading, risk management, compliance, and technology and operations capabilities and resources, which are integral parts of the investment management process.
Shareholder and Administrative Services. The Board considered (i) the nature, extent, quality, and cost of advisory, administrative, and shareholder services performed by the Investment Advisers and their affiliates under the Advisory Contracts and under separate agreements covering transfer agency, pricing and bookkeeping, and securities lending services for the fund; (ii) the nature and extent of the supervision of third party service providers, principally custodians, subcustodians, and pricing vendors; and (iii) the resources devoted to, and the record of compliance with, the fund's compliance policies and procedures. The Board also reviewed the allocation of fund brokerage, including allocations to brokers affiliated with the Investment Advisers, the use of brokerage commissions to pay fund expenses, and the use of "soft" commission dollars to pay for research services.
The Board noted that the growth of fund assets over time across the complex allows Fidelity to reinvest in the development of services designed to enhance the value and convenience of the Fidelity funds as investment vehicles. These services include 24-hour access to account information and market information through telephone representatives and over the Internet, investor education materials and asset allocation tools, and the expanded availability of Fidelity Investor Centers.
The Board noted that it and the boards of certain other Fidelity funds had formed an ad hoc Committee on Transfer Agency Fees to review the variety of transfer agency fee structures throughout the industry and Fidelity's competitive positioning with respect to industry participants.
Investment in a Large Fund Family. The Board considered the benefits to shareholders of investing in a Fidelity fund, including the benefits of investing in a fund that is part of a large family of funds offering a variety of investment disciplines and providing a large variety of mutual fund investor services. The Board noted that Fidelity had taken, or had made recommendations that resulted in the Fidelity funds taking, a number of actions over the previous year that benefited particular funds, including: (i) continuing to dedicate additional resources to Fidelity's investment research process, which includes meetings with management of issuers of securities in which the funds invest, and to the support of the senior management team that oversees asset management; (ii) continuing efforts to enhance Fidelity's global research capabilities; (iii) launching new funds and making other enhancements to meet client needs; (iv) launching new share classes of existing funds; (v) eliminating purchase minimums and broadening eligibility requirements for certain funds and share classes; (vi) reducing management fees and total expenses for certain growth equity funds and index funds; (vii) lowering expense caps for certain existing funds and classes, and converting certain voluntary expense caps to contractual caps, to reduce expenses borne by shareholders; (viii) eliminating short-term redemption fees for funds that had such fees; (ix) rationalizing product lines and gaining increased efficiencies from fund mergers and share class consolidations; (x) continuing to develop, acquire and implement systems and technology to improve services to the funds and shareholders, strengthen information security, and increase efficiency; and (xi) continuing to implement enhancements to further strengthen Fidelity's product line to increase investors' probability of success in achieving their investment goals, including retirement income goals.
Investment Performance. The Board considered whether the fund has operated in accordance with its investment objective, as well as its record of compliance with its investment restrictions and its performance history. The Board noted that there were portfolio management changes for the fund in September 2016 and December 2016. The Board will continue to monitor closely the fund's performance, taking into account the portfolio manager changes.
The Board took into account discussions that occur at Board meetings throughout the year with representatives of the Investment Advisers about fund investment performance. In this regard the Board noted that as part of regularly scheduled fund reviews and other reports to the Board on fund performance, the Board considers annualized return information for the fund for different time periods, measured against an appropriate securities market index ("benchmark index") and a peer group of funds with similar objectives ("peer group"), if any. In its evaluation of fund investment performance, the Board gave particular attention to information indicating changes in performance of certain Fidelity funds for specific time periods and discussed with the Investment Advisers the reasons for any overperformance or underperformance.
In addition to reviewing absolute and relative fund performance, the Independent Trustees periodically consider the appropriateness of fund performance metrics in evaluating the results achieved. In general, the Independent Trustees believe that fund performance should be evaluated based on net performance (after fees and expenses) of both the highest performing and lowest performing fund share classes, where applicable, compared to appropriate benchmark indices, over appropriate time periods that may include full market cycles, and compared to peer groups, as applicable, over the same periods, taking into account relevant factors including the following: general market conditions; issuer-specific information; and fund cash flows and other factors.
The Independent Trustees recognize that shareholders evaluate performance on a net basis over their own holding periods, for which one-, three-, and five-year periods are often used as a proxy. For this reason, the performance information reviewed by the Board also included net cumulative total return information for the fund and an appropriate benchmark index for the most recent one-, three-, and five-year periods ended June 30, 2018, as shown below. A peer group is not shown below because the fund does not generally utilize a peer group for performance comparison purposes. Returns of the benchmark index are "net MA,"
i.e., adjusted for tax withholding rates applicable to U.S.-based funds organized as Massachusetts business trusts.
Fidelity Advisor Emerging Asia Fund
Based on its review, the Board concluded that the nature, extent, and quality of services provided to the fund under the Advisory Contracts should continue to benefit the shareholders of the fund.
Competitiveness of Management Fee and Total Expense Ratio. The Board considered the fund's management fee and total expense ratio compared to "mapped groups" of competitive funds and classes created for the purpose of facilitating the Trustees' competitive analysis of management fees and total expenses. Fidelity creates "mapped groups" by combining similar Lipper investment objective categories that have comparable investment mandates. Combining Lipper investment objective categories aids the Board's management fee and total expense ratio comparisons by broadening the competitive group used for comparison.
Management Fee. The Board considered two proprietary management fee comparisons for the 12-month periods (ended June 30 for 2018 and December 31 for prior periods) shown in basis points (BP) in the chart below. The group of Lipper funds used by the Board for management fee comparisons is referred to below as the "Total Mapped Group." The Total Mapped Group comparison focuses on a fund's standing in terms of gross management fees before expense reimbursements or caps relative to the total universe of funds with comparable investment mandates, regardless of whether their management fee structures also are comparable. Funds with comparable investment mandates offer exposure to similar types of securities. Funds with comparable management fee structures have similar management fee contractual arrangements (
e.g., flat rate charged for advisory services, all-inclusive fee rate,
etc.). "TMG %" represents the percentage of funds in the Total Mapped Group that had management fees that were lower than the fund's. For example, a hypothetical TMG % of 20% would mean that 80% of the funds in the Total Mapped Group had higher, and 20% had lower, management fees than the fund. The fund's actual TMG %s and the number of funds in the Total Mapped Group are in the chart below. The "Asset-Size Peer Group" (ASPG) comparison focuses on a fund's standing relative to a subset of non-Fidelity funds within the Total Mapped Group that are similar in size and management fee structure. For example, if a fund is in the first quartile of the ASPG, the fund's management fee ranks in the least expensive or lowest 25% of funds in the ASPG. The ASPG represents at least 15% of the funds in the Total Mapped Group with comparable asset size and management fee structures, subject to a minimum of 50 funds (or all funds in the Total Mapped Group if fewer than 50). Additional information, such as the ASPG quartile in which the fund's management fee rate ranked, is also included in the chart and was considered by the Board.
Fidelity Advisor Emerging Asia Fund
The Board noted that the fund's management fee rate ranked below the median of its Total Mapped Group and below the median of its ASPG for the 12-month period ended June 30, 2018.
The Board noted that it and the boards of other Fidelity funds formed an ad hoc Committee on Group Fee, which meets periodically, to conduct an in-depth review of the "group fee" component of the management fee of funds with such management fee structures. The Committee's focus included the mechanics of the group fee, the competitive landscape of group fee structures, Fidelity funds with no group fee component and investment products not included in group fee assets. The Board also considered that, for funds subject to the group fee, FMR agreed to voluntarily waive fees over a specified period of time in amounts designed to account for assets converted from certain funds to certain collective investment trusts.
The Board also noted that, in 2013, the ad hoc Committee on Management Fees was formed to conduct an in-depth review of the management fee rates of Fidelity's active equity mutual funds. The Committee focused on the following areas: (i) standard fee structures; (ii) research consumption and trading evolution; (iii) management fee competitiveness/profitability by category; and (iv) factors that drive institutional pricing.
Based on its review, the Board concluded that the fund's management fee is fair and reasonable in light of the services that the fund receives and the other factors considered.
Total Expense Ratio. In its review of each class's total expense ratio, the Board considered the fund's management fee rate as well as other fund or class expenses, as applicable, such as transfer agent fees, pricing and bookkeeping fees, fund-paid 12b-1 fees, and custodial, legal, and audit fees. The Board also noted that Fidelity may agree to waive fees and expenses from time to time, and the extent to which, if any, it has done so for the fund. As part of its review, the Board also considered the current and historical total expense ratios of each class of the fund compared to competitive fund median expenses. Each class of the fund is compared to those funds and classes in the Total Mapped Group (used by the Board for management fee comparisons) that have a similar sales load structure.
The Board noted that the total expense ratio of each of Class A, Class C, and Class I ranked below the competitive median for the 12-month period ended June 30, 2018, and the total expense ratio of Class M ranked above the competitive median for the 12-month period ended June 30, 2018. The Board considered that, in general, various factors can affect total expense ratios. The Board noted that the total expense ratio of Class M was above the competitive median primarily because of higher 12b-1 fees on Class M as compared to most competitor funds. Class M has a higher 12b-1 fee, but a lower front-end sales charge, than traditionally priced front-end sales charge classes. The Board considered that Class M is primarily sold load-waived to retirement plans and intermediary wrap programs where its 0.50% 12b-1 fee is comparable to competing no-load, higher 12b-1 fee classes designed specifically for retirement plans and wrap programs. The Board noted that, when compared with competitor funds that charge a 0.50% 12b-1 fee, the total expense ratio of Class M is below median. The Board noted that the fund offers multiple classes, each of which has a different sales load and 12b-1 fee structure, and that the multiple structures are intended to offer a range of pricing options for the intermediary market. The Board also noted that the total expense ratios of the classes vary primarily by the level of their 12b-1 fees, although differences in transfer agent fees may also cause expenses to vary from class to class.
Fees Charged to Other Fidelity Clients. The Board also considered Fidelity fee structures and other information with respect to clients of Fidelity, such as other funds advised or subadvised by Fidelity, pension plan clients, and other institutional clients with similar mandates. The Board noted that a joint ad hoc committee created by it and the boards of other Fidelity funds periodically reviews and compares Fidelity's institutional investment advisory business with its business of providing services to the Fidelity funds and also noted the most recent findings of the committee. The Board noted that the committee's review included a consideration of the differences in services provided, fees charged, and costs incurred, as well as competition in the markets serving the different categories of clients.
Based on its review of total expense ratios and fees charged to other Fidelity clients, the Board concluded that the total expense ratio of each class of the fund was reasonable in light of the services that the fund and its shareholders receive and the other factors considered.
Costs of the Services and Profitability. The Board considered the revenues earned and the expenses incurred by Fidelity in conducting the business of developing, marketing, distributing, managing, administering and servicing the fund and servicing the fund's shareholders. The Board also considered the level of Fidelity's profits in respect of all the Fidelity funds.
On an annual basis, Fidelity presents to the Board information about the profitability of its relationships with the fund. Fidelity calculates profitability information for each fund, as well as aggregate profitability information for groups of Fidelity funds and all Fidelity funds, using a series of detailed revenue and cost allocation methodologies which originate with the books and records of Fidelity on which Fidelity's audited financial statements are based. The Audit Committee of the Board reviews any significant changes from the prior year's methodologies.
PricewaterhouseCoopers LLP (PwC), auditor to Fidelity and certain Fidelity funds, has been engaged annually by the Board as part of the Board's assessment of Fidelity's profitability analysis. PwC's engagement includes the review and assessment of the methodologies used by Fidelity in determining the revenues and expenses attributable to Fidelity's mutual fund business, and completion of agreed-upon procedures in respect of the mathematical accuracy of the fund profitability information and its conformity to established allocation methodologies. After considering PwC's reports issued under the engagement and information provided by Fidelity, the Board concluded that while other allocation methods may also be reasonable, Fidelity's profitability methodologies are reasonable in all material respects.
The Board also reviewed Fidelity's non-fund businesses and potential indirect benefits such businesses may have received as a result of their association with Fidelity's mutual fund business (i.e., fall-out benefits) as well as cases where Fidelity's affiliates may benefit from the fund's business. The Board noted that changes to fall-out benefits year-over-year reflect business developments at Fidelity's various businesses.
The Board considered the costs of the services provided by and the profits realized by Fidelity in connection with the operation of the fund and was satisfied that the profitability was not excessive.
Economies of Scale. The Board considered whether there have been economies of scale in respect of the management of the Fidelity funds, whether the Fidelity funds (including the fund) have appropriately benefited from any such economies of scale, and whether there is potential for realization of any further economies of scale. The Board considered the extent to which the fund will benefit from economies of scale as assets grow through increased services to the fund, through waivers or reimbursements, or through fee or expense ratio reductions. The Board also noted that a committee (the Economies of Scale Committee) created by it and the boards of other Fidelity funds periodically analyzes whether Fidelity attains economies of scale in respect of the management and servicing of the Fidelity funds, whether the Fidelity funds have appropriately benefited from such economies of scale, and whether there is potential for realization of any further economies of scale.
The Board recognized that the fund's management contract incorporates a "group fee" structure, which provides for lower group fee rates as total group assets increase, and for higher group fee rates as total group assets decrease (with "group assets" defined to include fund assets under FMR's management plus the assets of sector funds previously under FMR's management). FMR calculates the group fee rates based on a tiered asset "breakpoint" schedule that varies based on asset class. The Board considered that the group fee is designed to deliver the benefits of economies of scale to fund shareholders when total Fidelity fund assets increase, even if assets of any particular fund are unchanged or have declined, because some portion of Fidelity's costs are attributable to services provided to all Fidelity funds, and all funds benefit if those costs can be allocated among more assets. The Board concluded that, given the group fee structure, fund shareholders will benefit from lower management fees as group assets increase at the fund complex level, regardless of whether Fidelity achieves any such economies of scale.
The Board concluded, taking into account the analysis of the Economies of Scale Committee, that economies of scale, if any, are being appropriately shared between fund shareholders and Fidelity.
Additional Information Requested by the Board. In order to develop fully the factual basis for consideration of the Fidelity funds' advisory contracts, the Board requested and received additional information on certain topics, including: (i) fund performance trends, in particular the underperformance of certain funds, and Fidelity's long-term strategies for certain funds; (ii) Fidelity's fund profitability methodology, profitability trends for certain funds, and the impact of certain factors on fund profitability results; (iii) metrics for evaluating index fund and ETF performance and information about ETF trading characteristics; (iv) the methodology with respect to the evaluation of competitive fund data and peer group classifications and fee comparisons; (v) the expense structures for different funds and classes; (vi) information regarding other accounts managed by Fidelity, including collective investment trusts; and (vii) Fidelity's philosophies and strategies for evaluating funds and classes with lower or declining asset levels.
Based on its evaluation of all of the conclusions noted above, and after considering all factors it believed relevant, the Board concluded that the advisory fee arrangements are fair and reasonable, and that the fund's Advisory Contracts should be renewed.
AEA-SANN-0619
1.703637.121
Fidelity Advisor® Value Leaders Fund
Semi-Annual Report April 30, 2019 |
|
Beginning on January 1, 2021, as permitted by regulations adopted by the Securities and Exchange Commission, paper copies of a fund’s shareholder reports will no longer be sent by mail, unless you specifically request paper copies of the reports from the fund or from your financial intermediary, such as a financial advisor, broker-dealer or bank. Instead, the reports will be made available on a website, and you will be notified by mail each time a report is posted and provided with a website link to access the report.
If you already elected to receive shareholder reports electronically, you will not be affected by this change and you need not take any action. You may elect to receive shareholder reports and other communications from a fund electronically, by contacting your financial intermediary. For Fidelity customers, visit Fidelity's web site or call Fidelity using the contact information listed below.
You may elect to receive all future reports in paper free of charge. If you wish to continue receiving paper copies of your shareholder reports, you may contact your financial intermediary or, if you are a Fidelity customer, visit Fidelity’s website, or call Fidelity at the applicable toll-free number listed below. Your election to receive reports in paper will apply to all funds held with the fund complex/your financial intermediary.
| Account Type | Website | Phone Number |
| Brokerage, Mutual Fund, or Annuity Contracts: | fidelity.com/mailpreferences | 1-800-343-3548 |
| Employer Provided Retirement Accounts: | netbenefits.fidelity.com/preferences (choose 'no' under Required Disclosures to continue to print) | 1-800-343-0860 |
| Advisor Sold Accounts Serviced Through Your Financial Intermediary: | Contact Your Financial Intermediary | Your Financial Intermediary's phone number |
| Advisor Sold Accounts Serviced by Fidelity: | institutional.fidelity.com | 1-877-208-0098 |
Contents
To view a fund's proxy voting guidelines and proxy voting record for the 12-month period ended June 30, visit http://www.fidelity.com/proxyvotingresults or visit the Securities and Exchange Commission's (SEC) web site at http://www.sec.gov.
You may also call 1-877-208-0098 to request a free copy of the proxy voting guidelines.
Standard & Poor's, S&P and S&P 500 are registered service marks of The McGraw-Hill Companies, Inc. and have been licensed for use by Fidelity Distributors Corporation.
Other third-party marks appearing herein are the property of their respective owners.
All other marks appearing herein are registered or unregistered trademarks or service marks of FMR LLC or an affiliated company. © 2019 FMR LLC. All rights reserved.
This report and the financial statements contained herein are submitted for the general information of the shareholders of the Fund. This report is not authorized for distribution to prospective investors in the Fund unless preceded or accompanied by an effective prospectus.
A fund files its complete schedule of portfolio holdings with the SEC for the first and third quarters of each fiscal year on Form N-PORT. Forms N-PORT are available on the SEC’s web site at http://www.sec.gov. A fund's Forms N-PORT may be reviewed and copied at the SEC’s Public Reference Room in Washington, DC. Information regarding the operation of the SEC's Public Reference Room may be obtained by calling 1-800-SEC-0330.
For a complete list of a fund's portfolio holdings, view the most recent holdings listing, semiannual report, or annual report on Fidelity's web site at http://www.fidelity.com, http://www.institutional.fidelity.com, or http://www.401k.com, as applicable.
NOT FDIC INSURED •MAY LOSE VALUE •NO BANK GUARANTEE
Neither the Fund nor Fidelity Distributors Corporation is a bank.
Investment Summary (Unaudited)
Top Ten Stocks as of April 30, 2019
| | % of fund's net assets |
| Comcast Corp. Class A | 5.7 |
| Berkshire Hathaway, Inc. Class B | 5.2 |
| Cigna Corp. | 4.8 |
| Exxon Mobil Corp. | 4.1 |
| UnitedHealth Group, Inc. | 3.9 |
| The Walt Disney Co. | 3.8 |
| Roche Holding AG (participation certificate) | 3.4 |
| Wells Fargo & Co. | 3.3 |
| CBRE Group, Inc. | 3.3 |
| Celgene Corp. | 3.0 |
| | 40.5 |
Top Five Market Sectors as of April 30, 2019
| | % of fund's net assets |
| Financials | 28.7 |
| Health Care | 21.8 |
| Communication Services | 13.3 |
| Energy | 10.0 |
| Consumer Staples | 6.4 |
Asset Allocation (% of fund's net assets)
| As of April 30, 2019 * |
| | Stocks | 99.0% |
| | Short-Term Investments and Net Other Assets (Liabilities) | 1.0% |

* Foreign investments - 17.2%
Schedule of Investments April 30, 2019 (Unaudited)
Showing Percentage of Net Assets
| Common Stocks - 99.0% | | | |
| | | Shares | Value |
| COMMUNICATION SERVICES - 13.3% | | | |
| Entertainment - 3.8% | | | |
| The Walt Disney Co. | | 7,708 | $1,055,765 |
| Interactive Media & Services - 2.0% | | | |
| Alphabet, Inc. Class A (a) | | 451 | 540,731 |
| Media - 7.5% | | | |
| Comcast Corp. Class A | | 35,800 | 1,558,374 |
| Fox Corp. Class A (a) | | 6,000 | 233,940 |
| Interpublic Group of Companies, Inc. | | 12,100 | 278,300 |
| | | | 2,070,614 |
|
| TOTAL COMMUNICATION SERVICES | | | 3,667,110 |
|
| CONSUMER DISCRETIONARY - 3.8% | | | |
| Multiline Retail - 1.9% | | | |
| Dollar General Corp. | | 4,100 | 516,969 |
| Textiles, Apparel & Luxury Goods - 1.9% | | | |
| PVH Corp. | | 4,200 | 541,758 |
|
| TOTAL CONSUMER DISCRETIONARY | | | 1,058,727 |
|
| CONSUMER STAPLES - 6.4% | | | |
| Beverages - 2.0% | | | |
| C&C Group PLC | | 141,102 | 535,710 |
| Food Products - 4.4% | | | |
| Danone SA | | 6,500 | 525,704 |
| The Hershey Co. | | 4,700 | 586,795 |
| The J.M. Smucker Co. | | 900 | 110,367 |
| | | | 1,222,866 |
|
| TOTAL CONSUMER STAPLES | | | 1,758,576 |
|
| ENERGY - 10.0% | | | |
| Energy Equipment & Services - 1.5% | | | |
| Baker Hughes, a GE Co. Class A | | 17,100 | 410,742 |
| Oil, Gas & Consumable Fuels - 8.5% | | | |
| Exxon Mobil Corp. | | 14,100 | 1,131,948 |
| GasLog Partners LP | | 18,600 | 391,716 |
| Golar LNG Partners LP | | 30,700 | 388,048 |
| Teekay LNG Partners LP | | 29,000 | 428,910 |
| | | | 2,340,622 |
|
| TOTAL ENERGY | | | 2,751,364 |
|
| FINANCIALS - 28.7% | | | |
| Banks - 8.1% | | | |
| SunTrust Banks, Inc. | | 9,600 | 628,608 |
| U.S. Bancorp | | 12,671 | 675,618 |
| Wells Fargo & Co. | | 19,026 | 921,049 |
| | | | 2,225,275 |
| Capital Markets - 2.7% | | | |
| Goldman Sachs Group, Inc. | | 3,600 | 741,312 |
| Diversified Financial Services - 5.2% | | | |
| Berkshire Hathaway, Inc. Class B (a) | | 6,700 | 1,451,957 |
| Insurance - 7.1% | | | |
| Chubb Ltd. | | 5,300 | 769,560 |
| Prudential PLC | | 17,873 | 406,099 |
| The Travelers Companies, Inc. | | 5,400 | 776,250 |
| | | | 1,951,909 |
| Mortgage Real Estate Investment Trusts - 5.6% | | | |
| AGNC Investment Corp. | | 34,600 | 615,534 |
| Annaly Capital Management, Inc. | | 55,400 | 558,986 |
| MFA Financial, Inc. | | 50,100 | 376,251 |
| | | | 1,550,771 |
|
| TOTAL FINANCIALS | | | 7,921,224 |
|
| HEALTH CARE - 21.8% | | | |
| Biotechnology - 3.8% | | | |
| Amgen, Inc. | | 1,200 | 215,184 |
| Celgene Corp. (a) | | 8,800 | 833,008 |
| | | | 1,048,192 |
| Health Care Providers & Services - 13.4% | | | |
| Anthem, Inc. | | 2,300 | 604,969 |
| Centene Corp. (a) | | 6,900 | 355,764 |
| Cigna Corp. | | 8,300 | 1,318,372 |
| UnitedHealth Group, Inc. | | 4,600 | 1,072,122 |
| Wellcare Health Plans, Inc. (a) | | 1,300 | 335,855 |
| | | | 3,687,082 |
| Pharmaceuticals - 4.6% | | | |
| Bristol-Myers Squibb Co. | | 7,400 | 343,582 |
| Roche Holding AG (participation certificate) | | 3,550 | 936,715 |
| | | | 1,280,297 |
|
| TOTAL HEALTH CARE | | | 6,015,571 |
|
| INDUSTRIALS - 3.9% | | | |
| Aerospace & Defense - 1.6% | | | |
| United Technologies Corp. | | 3,000 | 427,830 |
| Air Freight & Logistics - 2.3% | | | |
| C.H. Robinson Worldwide, Inc. | | 8,000 | 648,000 |
|
| TOTAL INDUSTRIALS | | | 1,075,830 |
|
| INFORMATION TECHNOLOGY - 4.6% | | | |
| IT Services - 4.6% | | | |
| Amdocs Ltd. | | 6,000 | 330,480 |
| Cognizant Technology Solutions Corp. Class A | | 7,900 | 576,384 |
| The Western Union Co. | | 18,900 | 367,416 |
| | | | 1,274,280 |
| REAL ESTATE - 4.6% | | | |
| Equity Real Estate Investment Trusts (REITs) - 1.3% | | | |
| Simon Property Group, Inc. | | 2,100 | 364,770 |
| Real Estate Management & Development - 3.3% | | | |
| CBRE Group, Inc. (a) | | 17,100 | 890,397 |
|
| TOTAL REAL ESTATE | | | 1,255,167 |
|
| UTILITIES - 1.9% | | | |
| Electric Utilities - 1.9% | | | |
| Exelon Corp. | | 10,500 | 534,975 |
| TOTAL COMMON STOCKS | | | |
| (Cost $23,694,494) | | | 27,312,824 |
|
| Money Market Funds - 0.9% | | | |
| Fidelity Cash Central Fund, 2.49% (b) | | | |
| (Cost $243,547) | | 243,499 | 243,547 |
| TOTAL INVESTMENT IN SECURITIES - 99.9% | | | |
| (Cost $23,938,041) | | | 27,556,371 |
| NET OTHER ASSETS (LIABILITIES) - 0.1% | | | 27,539 |
| NET ASSETS - 100% | | | $27,583,910 |
Legend
(a) Non-income producing
(b) Affiliated fund that is generally available only to investment companies and other accounts managed by Fidelity Investments. The rate quoted is the annualized seven-day yield of the fund at period end. A complete unaudited listing of the fund's holdings as of its most recent quarter end is available upon request. In addition, each Fidelity Central Fund's financial statements are available on the SEC's website or upon request.
Affiliated Central Funds
Information regarding fiscal year to date income earned by the Fund from investments in Fidelity Central Funds is as follows:
| Fund | Income earned |
| Fidelity Cash Central Fund | $11,058 |
| Total | $11,058 |
Amounts in the income column in the above table include any capital gain distributions from underlying funds, which are presented in the corresponding line-item in the Statement of Operations, if applicable.
Investment Valuation
The following is a summary of the inputs used, as of April 30, 2019, involving the Fund's assets and liabilities carried at fair value. The inputs or methodology used for valuing securities may not be an indication of the risk associated with investing in those securities. For more information on valuation inputs, and their aggregation into the levels used below, please refer to the Investment Valuation section in the accompanying Notes to Financial Statements.
| | Valuation Inputs at Reporting Date: |
| Description | Total | Level 1 | Level 2 | Level 3 |
| Investments in Securities: | | | | |
| Equities: | | | | |
| Communication Services | $3,667,110 | $3,667,110 | $-- | $-- |
| Consumer Discretionary | 1,058,727 | 1,058,727 | -- | -- |
| Consumer Staples | 1,758,576 | 1,232,872 | 525,704 | -- |
| Energy | 2,751,364 | 2,751,364 | -- | -- |
| Financials | 7,921,224 | 7,515,125 | 406,099 | -- |
| Health Care | 6,015,571 | 5,078,856 | 936,715 | -- |
| Industrials | 1,075,830 | 1,075,830 | -- | -- |
| Information Technology | 1,274,280 | 1,274,280 | -- | -- |
| Real Estate | 1,255,167 | 1,255,167 | -- | -- |
| Utilities | 534,975 | 534,975 | -- | -- |
| Money Market Funds | 243,547 | 243,547 | -- | -- |
| Total Investments in Securities: | $27,556,371 | $25,687,853 | $1,868,518 | $-- |
Other Information
Distribution of investments by country or territory of incorporation, as a percentage of Total Net Assets, is as follows (Unaudited):
| United States of America | 82.8% |
| Switzerland | 6.2% |
| Marshall Islands | 4.4% |
| Ireland | 2.0% |
| France | 1.9% |
| United Kingdom | 1.5% |
| Bailiwick of Guernsey | 1.2% |
| | 100.0% |
See accompanying notes which are an integral part of the financial statements.
Financial Statements
Statement of Assets and Liabilities
| | | April 30, 2019 (Unaudited) |
| Assets | | |
Investment in securities, at value — See accompanying schedule:
Unaffiliated issuers (cost $23,694,494) | $27,312,824 | |
| Fidelity Central Funds (cost $243,547) | 243,547 | |
| Total Investment in Securities (cost $23,938,041) | | $27,556,371 |
| Receivable for investments sold | | 152,704 |
| Receivable for fund shares sold | | 1,923 |
| Dividends receivable | | 28,779 |
| Distributions receivable from Fidelity Central Funds | | 1,519 |
| Prepaid expenses | | 14 |
| Receivable from investment adviser for expense reductions | | 8,427 |
| Other receivables | | 646 |
| Total assets | | 27,750,383 |
| Liabilities | | |
| Payable for investments purchased | $116,127 | |
| Payable for fund shares redeemed | 3,822 | |
| Accrued management fee | 7,180 | |
| Audit fee payable | 24,136 | |
| Distribution and service plan fees payable | 8,454 | |
| Other affiliated payables | 6,066 | |
| Other payables and accrued expenses | 688 | |
| Total liabilities | | 166,473 |
| Net Assets | | $27,583,910 |
| Net Assets consist of: | | |
| Paid in capital | | $24,054,600 |
| Total distributable earnings (loss) | | 3,529,310 |
| Net Assets | | $27,583,910 |
| Net Asset Value and Maximum Offering Price | | |
| Class A: | | |
| Net Asset Value and redemption price per share ($16,839,409 ÷ 925,544 shares) | | $18.19 |
| Maximum offering price per share (100/94.25 of $18.19) | | $19.30 |
| Class M: | | |
| Net Asset Value and redemption price per share ($5,333,555 ÷ 291,919 shares) | | $18.27 |
| Maximum offering price per share (100/96.50 of $18.27) | | $18.93 |
| Class C: | | |
| Net Asset Value and offering price per share ($3,183,526 ÷ 180,471 shares)(a) | | $17.64 |
| Class I: | | |
| Net Asset Value, offering price and redemption price per share ($2,227,420 ÷ 121,595 shares) | | $18.32 |
(a) Redemption price per share is equal to net asset value less any applicable contingent deferred sales charge.
See accompanying notes which are an integral part of the financial statements.
Statement of Operations
| | | Six months ended April 30, 2019 (Unaudited) |
| Investment Income | | |
| Dividends | | $298,576 |
| Income from Fidelity Central Funds | | 11,058 |
| Total income | | 309,634 |
| Expenses | | |
| Management fee | | |
| Basic fee | $76,302 | |
| Performance adjustment | (29,527) | |
| Transfer agent fees | 32,272 | |
| Distribution and service plan fees | 55,694 | |
| Accounting fees and expenses | 5,502 | |
| Custodian fees and expenses | 2,570 | |
| Independent trustees' fees and expenses | 81 | |
| Registration fees | 33,444 | |
| Audit | 29,954 | |
| Legal | 1,827 | |
| Miscellaneous | 91 | |
| Total expenses before reductions | 208,210 | |
| Expense reductions | (12,057) | |
| Total expenses after reductions | | 196,153 |
| Net investment income (loss) | | 113,481 |
| Realized and Unrealized Gain (Loss) | | |
| Net realized gain (loss) on: | | |
| Investment securities: | | |
| Unaffiliated issuers | (87,395) | |
| Foreign currency transactions | 71 | |
| Futures contracts | 40,741 | |
| Total net realized gain (loss) | | (46,583) |
| Change in net unrealized appreciation (depreciation) on: | | |
| Investment securities: | | |
| Unaffiliated issuers | 568,987 | |
| Assets and liabilities in foreign currencies | (57) | |
| Total change in net unrealized appreciation (depreciation) | | 568,930 |
| Net gain (loss) | | 522,347 |
| Net increase (decrease) in net assets resulting from operations | | $635,828 |
See accompanying notes which are an integral part of the financial statements.
Statement of Changes in Net Assets
| | Six months ended April 30, 2019 (Unaudited) | Year ended October 31, 2018 |
| Increase (Decrease) in Net Assets | | |
| Operations | | |
| Net investment income (loss) | $113,481�� | $217,634 |
| Net realized gain (loss) | (46,583) | 2,239,985 |
| Change in net unrealized appreciation (depreciation) | 568,930 | (1,305,995) |
| Net increase (decrease) in net assets resulting from operations | 635,828 | 1,151,624 |
| Distributions to shareholders | (2,172,169) | (177,168) |
| Share transactions - net increase (decrease) | (493,950) | (4,744,571) |
| Total increase (decrease) in net assets | (2,030,291) | (3,770,115) |
| Net Assets | | |
| Beginning of period | 29,614,201 | 33,384,316 |
| End of period | $27,583,910 | $29,614,201 |
See accompanying notes which are an integral part of the financial statements.
Financial Highlights
Fidelity Advisor Value Leaders Fund Class A
| | Six months ended (Unaudited) April 30, | Years endedOctober 31, | | | | |
| | 2019 | 2018 | 2017 | 2016 | 2015 | 2014 |
| Selected Per–Share Data | | | | | | |
| Net asset value, beginning of period | $19.31 | $18.81 | $16.03 | $16.34 | $15.79 | $13.73 |
| Income from Investment Operations | | | | | | |
| Net investment income (loss)A | .08 | .16 | .11 | .12 | .29 | .12 |
| Net realized and unrealized gain (loss) | .27B | .47C | 2.75 | (.15)D | .39E | 1.94 |
| Total from investment operations | .35 | .63 | 2.86 | (.03) | .68 | 2.06 |
| Distributions from net investment income | (.19) | (.13) | (.08) | (.27) | (.12) | – |
| Distributions from net realized gain | (1.28) | – | – | (.02) | (.01) | – |
| Total distributions | (1.47) | (.13) | (.08) | (.28)F | (.13) | – |
| Net asset value, end of period | $18.19 | $19.31 | $18.81 | $16.03 | $16.34 | $15.79 |
| Total ReturnG,H,I | 2.22%B | 3.33%C | 17.87% | (.18)%D | 4.32%E | 15.00% |
| Ratios to Average Net AssetsJ,K | | | | | | |
| Expenses before reductions | 1.32%L | 1.25% | 1.39% | 1.47% | 1.49% | 1.30% |
| Expenses net of fee waivers, if any | 1.25%L | 1.25% | 1.25% | 1.25% | 1.25% | 1.25% |
| Expenses net of all reductions | 1.24%L | 1.25% | 1.25% | 1.24% | 1.25% | 1.25% |
| Net investment income (loss) | .95%L | .81% | .61% | .77% | 1.78% | .78% |
| Supplemental Data | | | | | | |
| Net assets, end of period (000 omitted) | $16,839 | $15,105 | $17,848 | $16,448 | $18,237 | $15,067 |
| Portfolio turnover rateM | 61%L | 35% | 34% | 63% | 54% | 182% |
A Calculated based on average shares outstanding during the period.
B Net realized and unrealized gain (loss) per share reflects proceeds received from litigation which amounted to $.02 per share. Excluding these litigation proceeds, the total return would have been 2.12%.
C Net realized and unrealized gain (loss) per share reflects proceeds received from litigation which amounted to $.02 per share. Excluding these litigation proceeds, the total return would have been 3.21%.
D Net realized and unrealized gain (loss) per share reflects proceeds received from litigation which amounted to $.01 per share. Excluding these litigation proceeds, the total return would have been ( .24)%.
E Net realized and unrealized gain (loss) per share reflects proceeds received from litigation which amounted to $.05 per share. Excluding these litigation proceeds, the total return would have been 4.01%.
F Total distributions of $.28 per share is comprised of distributions from net investment income of $.265 and distributions from net realized gain of $.017 per share.
G Total returns for periods of less than one year are not annualized.
H Total returns would have been lower if certain expenses had not been reduced during the applicable periods shown.
I Total returns do not include the effect of the sales charges.
J Fees and expenses of any underlying Fidelity Central Funds are not included in the Fund's expense ratio. The Fund indirectly bears its proportionate share of the expenses of any underlying Fidelity Central Funds.
K Expense ratios reflect operating expenses of the class. Expenses before reductions do not reflect amounts reimbursed by the investment adviser or reductions from brokerage service arrangements or reductions from other expense offset arrangements and do not represent the amount paid by the class during periods when reimbursements or reductions occur. Expenses net of fee waivers reflect expenses after reimbursement by the investment adviser but prior to reductions from brokerage service arrangements or other expense offset arrangements. Expenses net of all reductions represent the net expenses paid by the class.
L Annualized
M Amount does not include the portfolio activity of any underlying Fidelity Central Funds.
See accompanying notes which are an integral part of the financial statements.
Fidelity Advisor Value Leaders Fund Class M
| | Six months ended (Unaudited) April 30, | Years endedOctober 31, | | | | |
| | 2019 | 2018 | 2017 | 2016 | 2015 | 2014 |
| Selected Per–Share Data | | | | | | |
| Net asset value, beginning of period | $19.34 | $18.82 | $16.04 | $16.33 | $15.78 | $13.75 |
| Income from Investment Operations | | | | | | |
| Net investment income (loss)A | .06 | .11 | .07 | .08 | .25 | .08 |
| Net realized and unrealized gain (loss) | .28B | .47C | 2.75 | (.16)D | .39E | 1.95 |
| Total from investment operations | .34 | .58 | 2.82 | (.08) | .64 | 2.03 |
| Distributions from net investment income | (.13) | (.06) | (.04) | (.20) | (.08) | – |
| Distributions from net realized gain | (1.28) | – | – | (.02) | (.01) | – |
| Total distributions | (1.41) | (.06) | (.04) | (.21)F | (.09) | – |
| Net asset value, end of period | $18.27 | $19.34 | $18.82 | $16.04 | $16.33 | $15.78 |
| Total ReturnG,H,I | 2.13%B | 3.09%C | 17.60% | (.49)%D | 4.04%E | 14.76% |
| Ratios to Average Net AssetsJ,K | | | | | | |
| Expenses before reductions | 1.61%L | 1.54% | 1.67% | 1.77% | 1.78% | 1.58% |
| Expenses net of fee waivers, if any | 1.50%L | 1.50% | 1.50% | 1.50% | 1.50% | 1.50% |
| Expenses net of all reductions | 1.49%L | 1.50% | 1.50% | 1.49% | 1.50% | 1.50% |
| Net investment income (loss) | .70%L | .56% | .37% | .52% | 1.53% | .53% |
| Supplemental Data | | | | | | |
| Net assets, end of period (000 omitted) | $5,334 | $4,987 | $5,866 | $6,732 | $7,672 | $7,819 |
| Portfolio turnover rateM | 61%L | 35% | 34% | 63% | 54% | 182% |
A Calculated based on average shares outstanding during the period.
B Net realized and unrealized gain (loss) per share reflects proceeds received from litigation which amounted to $.02 per share. Excluding these litigation proceeds, the total return would have been 2.03%.
C Net realized and unrealized gain (loss) per share reflects proceeds received from litigation which amounted to $.02 per share. Excluding these litigation proceeds, the total return would have been 2 .97%.
D Net realized and unrealized gain (loss) per share reflects proceeds received from litigation which amounted to $.01 per share. Excluding these litigation proceeds, the total return would have been (.55)%.
E Net realized and unrealized gain (loss) per share reflects proceeds received from litigation which amounted to $.05 per share. Excluding these litigation proceeds, the total return would have been 3 .73%.
F Total distributions of $.21 per share is comprised of distributions from net investment income of $.195 and distributions from net realized gain of $.017 per share.
G Total returns for periods of less than one year are not annualized.
H Total returns would have been lower if certain expenses had not been reduced during the applicable periods shown.
I Total returns do not include the effect of the sales charges.
J Fees and expenses of any underlying Fidelity Central Funds are not included in the Fund's expense ratio. The Fund indirectly bears its proportionate share of the expenses of any underlying Fidelity Central Funds.
K Expense ratios reflect operating expenses of the class. Expenses before reductions do not reflect amounts reimbursed by the investment adviser or reductions from brokerage service arrangements or reductions from other expense offset arrangements and do not represent the amount paid by the class during periods when reimbursements or reductions occur. Expenses net of fee waivers reflect expenses after reimbursement by the investment adviser but prior to reductions from brokerage service arrangements or other expense offset arrangements. Expenses net of all reductions represent the net expenses paid by the class.
L Annualized
M Amount does not include the portfolio activity of any underlying Fidelity Central Funds.
See accompanying notes which are an integral part of the financial statements.
Fidelity Advisor Value Leaders Fund Class C
| | Six months ended (Unaudited) April 30, | Years endedOctober 31, | | | | |
| | 2019 | 2018 | 2017 | 2016 | 2015 | 2014 |
| Selected Per–Share Data | | | | | | |
| Net asset value, beginning of period | $18.67 | $18.21 | $15.56 | $15.88 | $15.35 | $13.44 |
| Income from Investment Operations | | | | | | |
| Net investment income (loss)A | .02 | .01 | (.02) | –B | .17 | –B |
| Net realized and unrealized gain (loss) | .27C | .45D | 2.67 | (.16)E | .37F | 1.91 |
| Total from investment operations | .29 | .46 | 2.65 | (.16) | .54 | 1.91 |
| Distributions from net investment income | (.04) | – | – | (.15) | – | – |
| Distributions from net realized gain | (1.28) | – | – | (.02) | (.01) | – |
| Total distributions | (1.32) | – | – | (.16)G | (.01) | – |
| Net asset value, end of period | $17.64 | $18.67 | $18.21 | $15.56 | $15.88 | $15.35 |
| Total ReturnH,I,J | 1.88%C | 2.53%D | 17.03% | (1.00)%E | 3.54%F | 14.21% |
| Ratios to Average Net AssetsK,L | | | | | | |
| Expenses before reductions | 2.12%M | 2.09% | 2.22% | 2.29% | 2.29% | 2.09% |
| Expenses net of fee waivers, if any | 2.00%M | 2.00% | 1.99% | 2.00% | 2.00% | 2.00% |
| Expenses net of all reductions | 1.99%M | 2.00% | 1.99% | 1.99% | 2.00% | 2.00% |
| Net investment income (loss) | .19%M | .06% | (.13)% | .02% | 1.03% | .03% |
| Supplemental Data | | | | | | |
| Net assets, end of period (000 omitted) | $3,184 | $5,298 | $5,619 | $5,057 | $5,662 | $4,458 |
| Portfolio turnover rateN | 61%M | 35% | 34% | 63% | 54% | 182% |
A Calculated based on average shares outstanding during the period.
B Amount represents less than $.005 per share.
C Net realized and unrealized gain (loss) per share reflects proceeds received from litigation which amounted to $.02 per share. Excluding these litigation proceeds, the total return would have been 1.78%.
D Net realized and unrealized gain (loss) per share reflects proceeds received from litigation which amounted to $.02 per share. Excluding these litigation proceeds, the total return would have been 2.41%.
E Net realized and unrealized gain (loss) per share reflects proceeds received from litigation which amounted to $.01 per share. Excluding these litigation proceeds, the total return would have been (1.06)%.
F Net realized and unrealized gain (loss) per share reflects proceeds received from litigation which amounted to $.05 per share. Excluding these litigation proceeds, the total return would have been 3.23%.
G Total distributions of $.16 per share is comprised of distributions from net investment income of $.147 and distributions from net realized gain of $.017 per share.
H Total returns for periods of less than one year are not annualized.
I Total returns would have been lower if certain expenses had not been reduced during the applicable periods shown.
J Total returns do not include the effect of the contingent deferred sales charge.
K Fees and expenses of any underlying Fidelity Central Funds are not included in the Fund's expense ratio. The Fund indirectly bears its proportionate share of the expenses of any underlying Fidelity Central Funds.
L Expense ratios reflect operating expenses of the class. Expenses before reductions do not reflect amounts reimbursed by the investment adviser or reductions from brokerage service arrangements or reductions from other expense offset arrangements and do not represent the amount paid by the class during periods when reimbursements or reductions occur. Expenses net of fee waivers reflect expenses after reimbursement by the investment adviser but prior to reductions from brokerage service arrangements or other expense offset arrangements. Expenses net of all reductions represent the net expenses paid by the class.
M Annualized
N Amount does not include the portfolio activity of any underlying Fidelity Central Funds.
See accompanying notes which are an integral part of the financial statements.
Fidelity Advisor Value Leaders Fund Class I
| | Six months ended (Unaudited) April 30, | Years endedOctober 31, | | | | |
| | 2019 | 2018 | 2017 | 2016 | 2015 | 2014 |
| Selected Per–Share Data | | | | | | |
| Net asset value, beginning of period | $19.47 | $18.97 | $16.16 | $16.48 | $15.93 | $13.81 |
| Income from Investment Operations | | | | | | |
| Net investment income (loss)A | .11 | .22 | .16 | .16 | .34 | .15 |
| Net realized and unrealized gain (loss) | .27B | .46C | 2.77 | (.15)D | .39E | 1.97 |
| Total from investment operations | .38 | .68 | 2.93 | .01 | .73 | 2.12 |
| Distributions from net investment income | (.26) | (.18) | (.12) | (.31) | (.17) | – |
| Distributions from net realized gain | (1.28) | – | – | (.02) | (.01) | – |
| Total distributions | (1.53)F | (.18) | (.12) | (.33) | (.18) | – |
| Net asset value, end of period | $18.32 | $19.47 | $18.97 | $16.16 | $16.48 | $15.93 |
| Total ReturnG,H | 2.39%B | 3.61%C | 18.19% | .03%D | 4.58%E | 15.35% |
| Ratios to Average Net AssetsI,J | | | | | | |
| Expenses before reductions | 1.00%K | .96% | 1.12% | 1.18% | 1.18% | 1.01% |
| Expenses net of fee waivers, if any | 1.00%K | .96% | 1.00% | 1.00% | 1.00% | 1.00% |
| Expenses net of all reductions | .99%K | .96% | 1.00% | .99% | 1.00% | 1.00% |
| Net investment income (loss) | 1.20%K | 1.10% | .87% | 1.02% | 2.03% | 1.03% |
| Supplemental Data | | | | | | |
| Net assets, end of period (000 omitted) | $2,227 | $4,225 | $4,052 | $3,287 | $3,052 | $1,261 |
| Portfolio turnover rateL | 61%K | 35% | 34% | 63% | 54% | 182% |
A Calculated based on average shares outstanding during the period.
B Net realized and unrealized gain (loss) per share reflects proceeds received from litigation which amounted to $.02 per share. Excluding these litigation proceeds, the total return would have been 2.29%.
C Net realized and unrealized gain (loss) per share reflects proceeds received from litigation which amounted to $.02 per share. Excluding these litigation proceeds, the total return would have been 3.49%.
D Net realized and unrealized gain (loss) per share reflects proceeds received from litigation which amounted to $.01 per share. Excluding these litigation proceeds, the total return would have been (.03)%.
E Net realized and unrealized gain (loss) per share reflects proceeds received from litigation which amounted to $.05 per share. Excluding these litigation proceeds, the total return would have been 4.27%.
F Total distributions of $1.53 per share is comprised of distributions from net investment income of $.255 and distributions from net realized gain of $1.278 per share.
G Total returns for periods of less than one year are not annualized.
H Total returns would have been lower if certain expenses had not been reduced during the applicable periods shown.
I Fees and expenses of any underlying Fidelity Central Funds are not included in the Fund's expense ratio. The Fund indirectly bears its proportionate share of the expenses of any underlying Fidelity Central Funds.
J Expense ratios reflect operating expenses of the class. Expenses before reductions do not reflect amounts reimbursed by the investment adviser or reductions from brokerage service arrangements or reductions from other expense offset arrangements and do not represent the amount paid by the class during periods when reimbursements or reductions occur. Expenses net of fee waivers reflect expenses after reimbursement by the investment adviser but prior to reductions from brokerage service arrangements or other expense offset arrangements. Expenses net of all reductions represent the net expenses paid by the class.
K Annualized
L Amount does not include the portfolio activity of any underlying Fidelity Central Funds.
See accompanying notes which are an integral part of the financial statements.
Notes to Financial Statements (Unaudited)
For the period ended April 30, 2019
1. Organization.
Fidelity Advisor Value Leaders Fund (the Fund) is a fund of Fidelity Advisor Series VIII (the Trust) and is authorized to issue an unlimited number of shares. The Trust is registered under the Investment Company Act of 1940, as amended (the 1940 Act), as an open-end management investment company organized as a Massachusetts business trust. The Fund offers Class A, Class M, Class C, and Class I shares, each of which has equal rights as to assets and voting privileges. Each class has exclusive voting rights with respect to matters that affect that class.
Effective March 1, 2019, Class C shares will automatically convert to Class A shares after a holding period of ten years from the initial date of purchase, with certain exceptions.
2. Investments in Fidelity Central Funds.
The Fund invests in Fidelity Central Funds, which are open-end investment companies generally available only to other investment companies and accounts managed by the investment adviser and its affiliates. The Fund's Schedule of Investments lists each of the Fidelity Central Funds held as of period end, if any, as an investment of the Fund, but does not include the underlying holdings of each Fidelity Central Fund. As an Investing Fund, the Fund indirectly bears its proportionate share of the expenses of the underlying Fidelity Central Funds.
The Money Market Central Funds seek preservation of capital and current income and are managed by Fidelity Investments Money Management, Inc. (FIMM), an affiliate of the investment adviser. Annualized expenses of the Money Market Central Funds as of their most recent shareholder report date are less than .005%.
A complete unaudited list of holdings for each Fidelity Central Fund is available upon request or at the Securities and Exchange Commission (the SEC) website at www.sec.gov. In addition, the financial statements of the Fidelity Central Funds are available on the SEC website or upon request.
3. Significant Accounting Policies.
The Fund is an investment company and applies the accounting and reporting guidance of the Financial Accounting Standards Board (FASB) Accounting Standards Codification Topic 946 Financial Services – Investments Companies. The financial statements have been prepared in conformity with accounting principles generally accepted in the United States of America (GAAP), which require management to make certain estimates and assumptions at the date of the financial statements. Actual results could differ from those estimates. Subsequent events, if any, through the date that the financial statements were issued have been evaluated in the preparation of the financial statements. The following summarizes the significant accounting policies of the Fund:
Investment Valuation. Investments are valued as of 4:00 p.m. Eastern time on the last calendar day of the period. The Board of Trustees (the Board) has delegated the day to day responsibility for the valuation of the Fund's investments to the Fair Value Committee (the Committee) established by the Fund's investment adviser. In accordance with valuation policies and procedures approved by the Board, the Fund attempts to obtain prices from one or more third party pricing vendors or brokers to value its investments. When current market prices, quotations or currency exchange rates are not readily available or reliable, investments will be fair valued in good faith by the Committee, in accordance with procedures adopted by the Board. Factors used in determining fair value vary by investment type and may include market or investment specific events. The frequency with which these procedures are used cannot be predicted and they may be utilized to a significant extent. The Committee oversees the Fund's valuation policies and procedures and reports to the Board on the Committee's activities and fair value determinations. The Board monitors the appropriateness of the procedures used in valuing the Fund's investments and ratifies the fair value determinations of the Committee.
The Fund categorizes the inputs to valuation techniques used to value its investments into a disclosure hierarchy consisting of three levels as shown below:
- Level 1 – quoted prices in active markets for identical investments
- Level 2 – other significant observable inputs (including quoted prices for similar investments, interest rates, prepayment speeds, etc.)
- Level 3 – unobservable inputs (including the Fund's own assumptions based on the best information available)
Valuation techniques used to value the Fund's investments by major category are as follows:
Equity securities, including restricted securities, for which market quotations are readily available, are valued at the last reported sale price or official closing price as reported by a third party pricing vendor on the primary market or exchange on which they are traded and are categorized as Level 1 in the hierarchy. In the event there were no sales during the day or closing prices are not available, securities are valued at the last quoted bid price or may be valued using the last available price and are generally categorized as Level 2 in the hierarchy. For foreign equity securities, when market or security specific events arise, comparisons to the valuation of American Depositary Receipts (ADRs), futures contracts, Exchange-Traded Funds (ETFs) and certain indexes as well as quoted prices for similar securities may be used and would be categorized as Level 2 in the hierarchy. For equity securities, including restricted securities, where observable inputs are limited, assumptions about market activity and risk are used and these securities may be categorized as Level 3 in the hierarchy.
Investments in open-end mutual funds ,including the Fidelity Central Funds, are valued at their closing net asset value (NAV) each business day and are categorized as Level 1 in the hierarchy.
Changes in valuation techniques may result in transfers in or out of an assigned level within the disclosure hierarchy. The aggregate value of investments by input level as of April 30, 2019 is included at the end of the Fund's Schedule of Investments.
Foreign Currency. The Fund may use foreign currency contracts to facilitate transactions in foreign-denominated securities. Gains and losses from these transactions may arise from changes in the value of the foreign currency or if the counterparties do not perform under the contracts' terms.
Foreign-denominated assets, including investment securities, and liabilities are translated into U.S. dollars at the exchange rates at period end. Purchases and sales of investment securities, income and dividends received and expenses denominated in foreign currencies are translated into U.S. dollars at the exchange rate in effect on the transaction date.
The effects of exchange rate fluctuations on investments are included with the net realized and unrealized gain (loss) on investment securities. Other foreign currency transactions resulting in realized and unrealized gain (loss) are disclosed separately.
Investment Transactions and Income. For financial reporting purposes, the Fund's investment holdings and NAV include trades executed through the end of the last business day of the period. The NAV per share for processing shareholder transactions is calculated as of the close of business of the New York Stock Exchange (NYSE), normally 4:00 p.m. Eastern time and includes trades executed through the end of the prior business day. Gains and losses on securities sold are determined on the basis of identified cost and include proceeds received from litigation. Dividend income is recorded on the ex-dividend date, except for certain dividends from foreign securities where the ex-dividend date may have passed, which are recorded as soon as the Fund is informed of the ex-dividend date. Non-cash dividends included in dividend income, if any, are recorded at the fair market value of the securities received. Income and capital gain distributions from Fidelity Central Funds, if any, are recorded on the ex-dividend date. Certain distributions received by the Fund represent a return of capital or capital gain. The Fund determines the components of these distributions subsequent to the ex-dividend date, based upon receipt of tax filings or other correspondence relating to the underlying investment. These distributions are recorded as a reduction of cost of investments and/or as a realized gain. Investment income is recorded net of foreign taxes withheld where recovery of such taxes is uncertain.
Class Allocations and Expenses. Investment income, realized and unrealized capital gains and losses, common expenses of the Fund, and certain fund-level expense reductions, if any, are allocated daily on a pro-rata basis to each class based on the relative net assets of each class to the total net assets of the Fund. Each class differs with respect to transfer agent and distribution and service plan fees incurred. Certain expense reductions may also differ by class. For the reporting period, the allocated portion of income and expenses to each class as a percent of its average net assets may vary due to the timing of recording these transactions in relation to fluctuating net assets of the classes. Expenses directly attributable to a fund are charged to that fund. Expenses attributable to more than one fund are allocated among the respective funds on the basis of relative net assets or other appropriate methods. Expense estimates are accrued in the period to which they relate and adjustments are made when actual amounts are known.
Income Tax Information and Distributions to Shareholders. Each year, the Fund intends to qualify as a regulated investment company under Subchapter M of the Internal Revenue Code, including distributing substantially all of its taxable income and realized gains. As a result, no provision for U.S. Federal income taxes is required. The Fund files a U.S. federal tax return, in addition to state and local tax returns as required. The Fund's federal income tax returns are subject to examination by the Internal Revenue Service (IRS) for a period of three fiscal years after they are filed. State and local tax returns may be subject to examination for an additional fiscal year depending on the jurisdiction. Foreign taxes are provided for based on the Fund's understanding of the tax rules and rates that exist in the foreign markets in which it invests.
Distributions are declared and recorded on the ex-dividend date. Income and capital gain distributions are declared separately for each class. Income and capital gain distributions are determined in accordance with income tax regulations, which may differ from GAAP.
Capital accounts within the financial statements are adjusted for permanent book-tax differences. These adjustments have no impact on net assets or the results of operations. Capital accounts are not adjusted for temporary book-tax differences which will reverse in a subsequent period.
Book-tax differences are primarily due to foreign currency transactions, partnerships, capital loss carryforwards and losses deferred due to wash sales.
As of period end, the cost and unrealized appreciation (depreciation) in securities, and derivatives if applicable, for federal income tax purposes were as follows:
| Gross unrealized appreciation | $4,178,448 |
| Gross unrealized depreciation | (609,779) |
| Net unrealized appreciation (depreciation) | $3,568,669 |
| Tax cost | $23,987,702 |
4. Derivative Instruments.
Risk Exposures and the Use of Derivative Instruments. The Fund's investment objective allows the Fund to enter into various types of derivative contracts, including futures contracts. Derivatives are investments whose value is primarily derived from underlying assets, indices or reference rates and may be transacted on an exchange or over-the-counter (OTC). Derivatives may involve a future commitment to buy or sell a specified asset based on specified terms, to exchange future cash flows at periodic intervals based on a notional principal amount, or for one party to make one or more payments upon the occurrence of specified events in exchange for periodic payments from the other party.
The Fund used derivatives to increase returns and to manage exposure to certain risks as defined below. The success of any strategy involving derivatives depends on analysis of numerous economic factors, and if the strategies for investment do not work as intended, the Fund may not achieve its objectives.
The Fund's use of derivatives increased or decreased its exposure to the following risk:
| Equity Risk | Equity risk relates to the fluctuations in the value of financial instruments as a result of changes in market prices (other than those arising from interest rate risk or foreign exchange risk), whether caused by factors specific to an individual investment, its issuer, or all factors affecting all instruments traded in a market or market segment.
|
The Fund is also exposed to additional risks from investing in derivatives, such as liquidity risk and counterparty credit risk. Liquidity risk is the risk that the Fund will be unable to close out the derivative in the open market in a timely manner. Counterparty credit risk is the risk that the counterparty will not be able to fulfill its obligation to the Fund. Counterparty credit risk related to exchange-traded futures contracts may be mitigated by the protection provided by the exchange on which they trade.
Investing in derivatives may involve greater risks than investing in the underlying assets directly and, to varying degrees, may involve risk of loss in excess of any initial investment and collateral received and amounts recognized in the Statement of Assets and Liabilities. In addition, there may be the risk that the change in value of the derivative contract does not correspond to the change in value of the underlying instrument.
Futures Contracts. A futures contract is an agreement between two parties to buy or sell a specified underlying instrument for a fixed price at a specified future date. The Fund used futures contracts to manage its exposure to the stock market.
Upon entering into a futures contract, a fund is required to deposit either cash or securities (initial margin) with a clearing broker in an amount equal to a certain percentage of the face value of the contract. Futures contracts are marked-to-market daily and subsequent daily payments (variation margin) are made or received by a fund depending on the daily fluctuations in the value of the futures contracts and are recorded as unrealized appreciation or (depreciation). This receivable and/or payable, if any, is included in daily variation margin on futures contracts in the Statement of Assets and Liabilities. Realized gain or (loss) is recorded upon the expiration or closing of a futures contract. The net realized gain (loss) and change in net unrealized appreciation (depreciation) on futures contracts during the period is presented in the Statement of Operations.
Any open futures contracts at period end are presented in the Schedule of Investments under the caption "Futures Contracts". The notional amount at value reflects each contract's exposure to the underlying instrument or index at period end.
5. Purchases and Sales of Investments.
Purchases and sales of securities, other than short-term securities, aggregated $8,344,490 and $9,904,839, respectively.
6. Fees and Other Transactions with Affiliates.
Management Fee. Fidelity Management & Research Company (the investment adviser) and its affiliates provide the Fund with investment management related services for which the Fund pays a monthly management fee. The management fee is the sum of an individual fund fee rate that is based on an annual rate of .30% of the Fund's average net assets and an annualized group fee rate that averaged .24% during the period. The group fee rate is based upon the average net assets of all the mutual funds advised by the investment adviser, including any mutual funds previously advised by the investment adviser that are currently advised by Fidelity SelectCo, LLC, an affiliate of the investment adviser. The group fee rate decreases as assets under management increase and increases as assets under management decrease. In addition, the management fee is subject to a performance adjustment (up to a maximum of +/- .20% of the Fund's average net assets over a 36 month performance period). The upward or downward adjustment to the management fee is based on the relative investment performance of Class I of the Fund as compared to its benchmark index, the Russell 1000 Value Index, over the same 36 month performance period. For the reporting period, the total annualized management fee rate, including the performance adjustment, was .33% of the Fund's average net assets. The performance adjustment included in the management fee rate may be higher or lower than the maximum performance adjustment rate due to the difference between the average net assets for the reporting and performance periods.
Distribution and Service Plan Fees. In accordance with Rule 12b-1 of the 1940 Act, the Fund has adopted separate Distribution and Service Plans for each class of shares. Certain classes pay Fidelity Distributors Corporation (FDC), an affiliate of the investment adviser, separate Distribution and Service Fees, each of which is based on an annual percentage of each class' average net assets. In addition, FDC may pay financial intermediaries for selling shares of the Fund and providing shareholder support services. For the period, the Distribution and Service Fee rates, total fees and amounts retained by FDC were as follows:
| | Distribution Fee | Service Fee | Total Fees | Retained by FDC |
| Class A | -% | .25% | $18,591 | $548 |
| Class M | .25% | .25% | 12,826 | 191 |
| Class C | .75% | .25% | 24,277 | 1,645 |
| | | | $55,694 | $2,384 |
Sales Load. FDC may receive a front-end sales charge of up to 5.75% for selling Class A shares and 3.50% for selling Class M shares, some of which is paid to financial intermediaries for selling shares of the Fund. Depending on the holding period, FDC may receive contingent deferred sales charges levied on Class A, Class M and Class C redemptions. The deferred sales charges are 1.00% for Class C shares, 1.00% for certain purchases of Class A shares and .25% for certain purchases of Class M shares.
For the period, sales charge amounts retained by FDC were as follows:
| | Retained by FDC |
| Class A | $1,579 |
| Class M | 320 |
| Class C(a) | 34 |
| | $1,933 |
(a) When Class C shares are initially sold, FDC pays commissions from its own resources to financial intermediaries through which the sales are made.
Transfer Agent Fees. Fidelity Investments Institutional Operations Company, Inc., (FIIOC), an affiliate of the investment adviser, is the transfer, dividend disbursing and shareholder servicing agent for each class of the Fund. FIIOC receives account fees and asset-based fees that vary according to the account size and type of account of the shareholders of the respective classes of the Fund. FIIOC pays for typesetting, printing and mailing of shareholder reports, except proxy statements.
For the period, transfer agent fees for each class were as follows:
| | Amount | % of Class-Level Average Net Assets(a) |
| Class A | $15,560 | .21 |
| Class M | 6,647 | .26 |
| Class C | 7,230 | .30 |
| Class I | 2,835 | .17 |
| | $32,272 | |
(a) Annualized
Accounting Fees. Fidelity Service Company, Inc. (FSC), an affiliate of the investment adviser, maintains the Fund's accounting records. The fee is based on the level of average net assets for each month. For the period, the fees were equivalent to an annualized rate of .04%.
Brokerage Commissions. The Fund placed a portion of its portfolio transactions with brokerage firms which are affiliates of the investment adviser. Brokerage commissions are included in net realized gain (loss) and change in net unrealized appreciation (depreciation) in the Statement of Operations. The commissions paid to these affiliated firms were $139 for the period.
Interfund Trades. The Fund may purchase from or sell securities to other Fidelity Funds under procedures adopted by the Board. The procedures have been designed to ensure these interfund trades are executed in accordance with Rule 17a-7 of the 1940 Act. Interfund trades are included within the respective purchases and sales amounts shown in the Purchases and Sales of Investments note.
7. Committed Line of Credit.
The Fund participates with other funds managed by the investment adviser or an affiliate in a $4.25 billion credit facility (the "line of credit") to be utilized for temporary or emergency purposes to fund shareholder redemptions or for other short-term liquidity purposes. The Fund has agreed to pay commitment fees on its pro-rata portion of the line of credit, which amounted to $41 and is reflected in Miscellaneous expenses on the Statement of Operations. During the period, the Fund did not borrow on this line of credit.
8. Expense Reductions.
The investment adviser contractually agreed to reimburse each class to the extent annual operating expenses exceeded certain levels of class-level average net assets as noted in the table below. This reimbursement will remain in place through February 29, 2020. Some expenses, for example the compensation of the independent Trustees, and certain miscellaneous expenses such as proxy and shareholder meeting expenses, are excluded from this reimbursement.
The following classes were in reimbursement during the period:
| | Expense Limitations | Reimbursement |
| Class A | 1.25% | $5,129 |
| Class M | 1.50% | 2,803 |
| Class C | 2.00% | 2,936 |
| | | $10,868 |
Commissions paid to certain brokers with whom the investment adviser, or its affiliates, places trades on behalf of the Fund include an amount in addition to trade execution, which may be rebated back to the Fund to offset certain expenses. This amount totaled $993 for the period. In addition through arrangements with the Fund's custodian, credits realized as a result of certain uninvested cash balances were used to reduce the Fund's expenses. During the period, these credits reduced the Fund's custody expenses by $87.
In addition, during the period the investment adviser reimbursed and/or waived a portion of fund-level operating expenses in the amount of $109.
9. Distributions to Shareholders.
Distributions to shareholders of each class were as follows:
| | Six months ended
April 30, 2019 | Year ended
October 31, 2018 |
| Distributions to shareholders | | |
| Class A | $1,115,067 | $113,174 |
| Class M | 369,129 | 19,042 |
| Class C | 369,297 | – |
| Class I | 318,676 | 44,952 |
| Total | $2,172,169 | $177,168 |
10. Share Transactions.
Share transactions for each class were as follows and may contain automatic conversions between classes or exchanges between affiliated funds:
| | Shares | Shares | Dollars | Dollars |
| | Six months ended April 30, 2019 | Year ended October 31, 2018 | Six months ended April 30, 2019 | Year ended October 31, 2018 |
| Class A | | | | |
| Shares sold | 190,093 | 65,937 | $3,341,336 | $1,294,206 |
| Reinvestment of distributions | 63,431 | 5,767 | 1,096,720 | 111,530 |
| Shares redeemed | (110,215) | (238,442) | (1,972,398) | (4,673,543) |
| Net increase (decrease) | 143,309 | (166,738) | $2,465,658 | $(3,267,807) |
| Class M | | | | |
| Shares sold | 28,819 | 13,950 | $503,832 | $273,190 |
| Reinvestment of distributions | 20,833 | 959 | 362,077 | 18,619 |
| Shares redeemed | (15,541) | (68,747) | (275,904) | (1,339,051) |
| Net increase (decrease) | 34,111 | (53,838) | $590,005 | $(1,047,242) |
| Class C | | | | |
| Shares sold | 36,161 | 24,252 | $588,016 | $460,882 |
| Reinvestment of distributions | 21,782 | – | 366,152 | – |
| Shares redeemed | (161,177) | (49,189) | (2,781,952) | (931,780) |
| Net increase (decrease) | (103,234) | (24,937) | $(1,827,784) | $(470,898) |
| Class I | | | | |
| Shares sold | 12,050 | 105,068 | $217,349 | $2,041,577 |
| Reinvestment of distributions | 18,169 | 2,283 | 315,952 | 44,422 |
| Shares redeemed | (125,602) | (103,976) | (2,255,130) | (2,044,623) |
| Net increase (decrease) | (95,383) | 3,375 | $(1,721,829) | $41,376 |
11. Other.
The Fund's organizational documents provide former and current trustees and officers with a limited indemnification against liabilities arising in connection with the performance of their duties to the Fund. In the normal course of business, the Fund may also enter into contracts that provide general indemnifications. The Fund's maximum exposure under these arrangements is unknown as this would be dependent on future claims that may be made against the Fund. The risk of material loss from such claims is considered remote.
Shareholder Expense Example
As a shareholder of the Fund, you incur two types of costs: (1) transaction costs, including sales charges (loads) on purchase payments or redemption proceeds, and (2) ongoing costs, including management fees, distribution and/or service (12b-1) fees and other Fund expenses. This Example is intended to help you understand your ongoing costs (in dollars) of investing in the Fund and to compare these costs with the ongoing costs of investing in other mutual funds.
The Example is based on an investment of $1,000 invested at the beginning of the period and held for the entire period (November 1, 2018 to April 30, 2019).
Actual Expenses
The first line of the accompanying table for each class of the Fund provides information about actual account values and actual expenses. You may use the information in this line, together with the amount you invested, to estimate the expenses that you paid over the period. Simply divide your account value by $1,000.00 (for example, an $8,600 account value divided by $1,000.00 = 8.6), then multiply the result by the number in the first line for a class of the Fund under the heading entitled "Expenses Paid During Period" to estimate the expenses you paid on your account during this period. In addition, the Fund, as a shareholder in the underlying Fidelity Central Funds, will indirectly bear its pro-rata share of the fees and expenses incurred by the underlying Fidelity Central Funds. These fees and expenses are not included in the Fund's annualized expense ratio used to calculate the expense estimate in the table below.
Hypothetical Example for Comparison Purposes
The second line of the accompanying table for each class of the Fund provides information about hypothetical account values and hypothetical expenses based on a Class' actual expense ratio and an assumed rate of return of 5% per year before expenses, which is not the Class' actual return. The hypothetical account values and expenses may not be used to estimate the actual ending account balance or expenses you paid for the period. You may use this information to compare the ongoing costs of investing in the Fund and other funds. To do so, compare this 5% hypothetical example with the 5% hypothetical examples that appear in the shareholder reports of the other funds. In addition, the Fund, as a shareholder in the underlying Fidelity Central Funds, will indirectly bear its pro-rata share of the fees and expenses incurred by the underlying Fidelity Central Funds. These fees and expenses are not included in the Fund's annualized expense ratio used to calculate the expense estimate in the table below.
Please note that the expenses shown in the table are meant to highlight your ongoing costs only and do not reflect any transaction costs. Therefore, the second line of the table is useful in comparing ongoing costs only, and will not help you determine the relative total costs of owning different funds. In addition, if these transactional costs were included, your costs would have been higher.
| | Annualized Expense Ratio-A | Beginning
Account Value
November 1, 2018 | Ending
Account Value
April 30, 2019 | Expenses Paid
During Period-B
November 1, 2018
to April 30, 2019 |
| Class A | 1.25% | | | |
| Actual | | $1,000.00 | $1,022.20 | $6.27 |
| Hypothetical-C | | $1,000.00 | $1,018.60 | $6.26 |
| Class M | 1.50% | | | |
| Actual | | $1,000.00 | $1,021.30 | $7.52 |
| Hypothetical-C | | $1,000.00 | $1,017.36 | $7.50 |
| Class C | 2.00% | | | |
| Actual | | $1,000.00 | $1,018.80 | $10.01 |
| Hypothetical-C | | $1,000.00 | $1,014.88 | $9.99 |
| Class I | 1.00% | | | |
| Actual | | $1,000.00 | $1,023.90 | $5.02 |
| Hypothetical-C | | $1,000.00 | $1,019.84 | $5.01 |
A Annualized expense ratio reflects expenses net of applicable fee waivers.
B Expenses are equal to each Class' annualized expense ratio, multiplied by the average account value over the period, multiplied by 181/365 (to reflect the one-half year period).
C 5% return per year before expenses
Board Approval of Investment Advisory Contracts and Management Fees
Fidelity Advisor Value Leaders Fund
Each year, the Board of Trustees, including the Independent Trustees (together, the Board), votes on the renewal of the management contract with Fidelity Management & Research Company (FMR) and the sub-advisory agreements (together, the Advisory Contracts) for the fund. FMR and the sub-advisers are referred to herein as the Investment Advisers. The Board, assisted by the advice of fund counsel and Independent Trustees' counsel, requests and considers a broad range of information relevant to the renewal of the Advisory Contracts throughout the year.
The Board meets regularly and, at each of its meetings, covers an extensive agenda of topics and materials and considers factors that are relevant to its annual consideration of the renewal of the fund's Advisory Contracts, including the services and support provided to the fund and its shareholders. The Board has established various standing committees (Committees), each composed of and chaired by Independent Trustees with varying backgrounds, to which the Board has assigned specific subject matter responsibilities in order to enhance effective decision-making by the Board. The Board, acting directly and through its Committees, requests and receives information concerning the annual consideration of the renewal of the fund's Advisory Contracts. The Board also meets as needed to review matters specifically related to the Board's annual consideration of the renewal of the Advisory Contracts. Members of the Board may also meet with trustees of other Fidelity funds through joint ad hoc committees to discuss certain matters relevant to all of the Fidelity funds.
At its January 2019 meeting, the Board unanimously determined to renew the fund's Advisory Contracts. In reaching its determination, the Board considered all factors it believed relevant, including (i) the nature, extent, and quality of the services to be provided to the fund and its shareholders (including the investment performance of the fund); (ii) the competitiveness of the fund's management fee and total expense ratio relative to peer funds; (iii) the total costs of the services to be provided by and the profits to be realized by Fidelity from its relationships with the fund; and (iv) the extent to which, if any, economies of scale exist and would be realized as the fund grows, and whether any economies of scale are appropriately shared with fund shareholders.
In considering whether to renew the Advisory Contracts for the fund, the Board reached a determination, with the assistance of fund counsel and Independent Trustees' counsel and through the exercise of its business judgment, that the renewal of the Advisory Contracts was in the best interests of the fund and its shareholders and that the compensation payable under the Advisory Contracts was fair and reasonable. The Board's decision to renew the Advisory Contracts was not based on any single factor, but rather was based on a comprehensive consideration of all the information provided to the Board at its meetings throughout the year. The Board, in reaching its determination to renew the Advisory Contracts, was aware that shareholders of the fund have a broad range of investment choices available to them, including a wide choice among funds offered by Fidelity's competitors, and that the fund's shareholders, who have the opportunity to review and weigh the disclosure provided by the fund in its prospectus and other public disclosures, have chosen to invest in this fund, which is part of the Fidelity family of funds.
Nature, Extent, and Quality of Services Provided. The Board considered Fidelity's staffing as it relates to the fund, including the backgrounds of investment personnel of Fidelity, and also considered the fund's investment objective, strategies, and related investment philosophy. The Independent Trustees also had discussions with senior management of Fidelity's investment operations and investment groups. The Board considered the structure of the investment personnel compensation program and whether this structure provides appropriate incentives to act in the best interests of the fund. Additionally, the Board considered the portfolio managers' investments, if any, in the funds that they manage.
Resources Dedicated to Investment Management and Support Services. The Board and the Fund Oversight and Research Committees reviewed the general qualifications and capabilities of Fidelity's investment staff, including its size, education, experience, and resources, as well as Fidelity's approach to recruiting, training, managing, and compensating investment personnel. The Board noted that Fidelity has continued to increase the resources devoted to non-U.S. offices, including expansion of Fidelity's global investment organization. The Board also noted that Fidelity's analysts have extensive resources, tools and capabilities that allow them to conduct sophisticated quantitative and fundamental analysis, as well as credit analysis of issuers, counterparties and guarantors. Further, the Board considered that Fidelity's investment professionals have sufficient access to global information and data so as to provide competitive investment results over time, and that those professionals also have access to sophisticated tools that permit them to assess portfolio construction and risk and performance attribution characteristics continuously, as well as to transmit new information and research conclusions rapidly around the world. Additionally, in its deliberations, the Board considered Fidelity's trading, risk management, compliance, and technology and operations capabilities and resources, which are integral parts of the investment management process.
Shareholder and Administrative Services. The Board considered (i) the nature, extent, quality, and cost of advisory, administrative, and shareholder services performed by the Investment Advisers and their affiliates under the Advisory Contracts and under separate agreements covering transfer agency, pricing and bookkeeping, and securities lending services for the fund; (ii) the nature and extent of the supervision of third party service providers, principally custodians, subcustodians, and pricing vendors; and (iii) the resources devoted to, and the record of compliance with, the fund's compliance policies and procedures. The Board also reviewed the allocation of fund brokerage, including allocations to brokers affiliated with the Investment Advisers, the use of brokerage commissions to pay fund expenses, and the use of "soft" commission dollars to pay for research services.
The Board noted that the growth of fund assets over time across the complex allows Fidelity to reinvest in the development of services designed to enhance the value and convenience of the Fidelity funds as investment vehicles. These services include 24-hour access to account information and market information through telephone representatives and over the Internet, investor education materials and asset allocation tools, and the expanded availability of Fidelity Investor Centers.
The Board noted that it and the boards of certain other Fidelity funds had formed an ad hoc Committee on Transfer Agency Fees to review the variety of transfer agency fee structures throughout the industry and Fidelity's competitive positioning with respect to industry participants.
Investment in a Large Fund Family. The Board considered the benefits to shareholders of investing in a Fidelity fund, including the benefits of investing in a fund that is part of a large family of funds offering a variety of investment disciplines and providing a large variety of mutual fund investor services. The Board noted that Fidelity had taken, or had made recommendations that resulted in the Fidelity funds taking, a number of actions over the previous year that benefited particular funds, including: (i) continuing to dedicate additional resources to Fidelity's investment research process, which includes meetings with management of issuers of securities in which the funds invest, and to the support of the senior management team that oversees asset management; (ii) continuing efforts to enhance Fidelity's global research capabilities; (iii) launching new funds and making other enhancements to meet client needs; (iv) launching new share classes of existing funds; (v) eliminating purchase minimums and broadening eligibility requirements for certain funds and share classes; (vi) reducing management fees and total expenses for certain growth equity funds and index funds; (vii) lowering expense caps for certain existing funds and classes, and converting certain voluntary expense caps to contractual caps, to reduce expenses borne by shareholders; (viii) eliminating short-term redemption fees for funds that had such fees; (ix) rationalizing product lines and gaining increased efficiencies from fund mergers and share class consolidations; (x) continuing to develop, acquire and implement systems and technology to improve services to the funds and shareholders, strengthen information security, and increase efficiency; and (xi) continuing to implement enhancements to further strengthen Fidelity's product line to increase investors' probability of success in achieving their investment goals, including retirement income goals.
Investment Performance. The Board considered whether the fund has operated in accordance with its investment objective, as well as its record of compliance with its investment restrictions and its performance history.
The Board took into account discussions that occur at Board meetings throughout the year with representatives of the Investment Advisers about fund investment performance. In this regard the Board noted that as part of regularly scheduled fund reviews and other reports to the Board on fund performance, the Board considers annualized return information for the fund for different time periods, measured against an appropriate securities market index ("benchmark index") and a peer group of funds with similar objectives ("peer group"), if any. In its evaluation of fund investment performance, the Board gave particular attention to information indicating changes in performance of certain Fidelity funds for specific time periods and discussed with the Investment Advisers the reasons for any overperformance or underperformance.
In addition to reviewing absolute and relative fund performance, the Independent Trustees periodically consider the appropriateness of fund performance metrics in evaluating the results achieved. In general, the Independent Trustees believe that fund performance should be evaluated based on net performance (after fees and expenses) of both the highest performing and lowest performing fund share classes, where applicable, compared to appropriate benchmark indices, over appropriate time periods that may include full market cycles, and compared to peer groups, as applicable, over the same periods, taking into account relevant factors including the following: general market conditions; issuer-specific information; and fund cash flows and other factors.
The Independent Trustees recognize that shareholders evaluate performance on a net basis over their own holding periods, for which one-, three-, and five-year periods are often used as a proxy. For this reason, the performance information reviewed by the Board also included net cumulative total return information for the fund and an appropriate benchmark index and peer group for the most recent one-, three-, and five-year periods ended June 30, 2018, as shown below. Returns are shown compared to the 25th percentile (top of box, 75% beaten) and 75th percentile (bottom of box, 25% beaten) of the peer universe.
Fidelity Advisor Value Leaders Fund
The Board considered the fund's underperformance for different time periods based on the June 30, 2018 data presented above and based on earlier periods ended prior to June 30, 2018. The Board's discussions with FMR regarding underperformance cover topics including, but not limited to: the longer-term track record of a fund's portfolio manager(s); broader trends in the market that may adversely impact a fund's performance; attribution reports on contributors to the fund's underperformance; and the applicable portfolio manager's explanation of his or her underperformance. The Board engages with FMR on steps that might be taken to address a fund's underperformance.
The Board also considered that the fund's management fee is subject to upward or downward adjustment depending upon whether, and to what extent, the fund's investment performance for the performance period (a rolling 36-month period) exceeds, or is exceeded by, a securities index, thus leading to a performance adjustment for the same period. The Board noted that the performance adjustment provides FMR with a strong economic incentive to seek to achieve superior long-term performance for the fund's shareholders and helps to more closely align the interests of FMR and the shareholders of the fund.
Based on its review, the Board concluded that the nature, extent, and quality of services provided to the fund under the Advisory Contracts should continue to benefit the shareholders of the fund.
Competitiveness of Management Fee and Total Expense Ratio. The Board considered the fund's management fee and total expense ratio compared to "mapped groups" of competitive funds and classes created for the purpose of facilitating the Trustees' competitive analysis of management fees and total expenses. Fidelity creates "mapped groups" by combining similar Lipper investment objective categories that have comparable investment mandates. Combining Lipper investment objective categories aids the Board's management fee and total expense ratio comparisons by broadening the competitive group used for comparison.
Management Fee. The Board considered two proprietary management fee comparisons for the 12-month periods (ended June 30 for 2018 and December 31 for prior periods) shown in basis points (BP) in the chart below. The group of Lipper funds used by the Board for management fee comparisons is referred to below as the "Total Mapped Group." The Total Mapped Group comparison focuses on a fund's standing in terms of gross management fees before expense reimbursements or caps, and without giving effect to the fund's performance adjustment, relative to the total universe of funds with comparable investment mandates, regardless of whether their management fee structures also are comparable. Funds with comparable investment mandates offer exposure to similar types of securities. Funds with comparable management fee structures have similar management fee contractual arrangements (
e.g., flat rate charged for advisory services, all-inclusive fee rate,
etc.). "TMG %" represents the percentage of funds in the Total Mapped Group that had management fees that were lower than the fund's. For example, a hypothetical TMG % of 20% would mean that 80% of the funds in the Total Mapped Group had higher, and 20% had lower, management fees than the fund. The fund's actual TMG %s and the number of funds in the Total Mapped Group are in the chart below. The "Asset-Size Peer Group" (ASPG) comparison focuses on a fund's standing relative to a subset of non-Fidelity funds within the Total Mapped Group that are similar in size and management fee structure without taking into account performance adjustments, if any. For example, if a fund is in the first quartile of the ASPG, the fund's management fee ranks in the least expensive or lowest 25% of funds in the ASPG. The ASPG represents at least 15% of the funds in the Total Mapped Group with comparable asset size and management fee structures, subject to a minimum of 50 funds (or all funds in the Total Mapped Group if fewer than 50). Additional information, such as the ASPG quartile in which the fund's management fee rate ranked and the impact of the fund's performance adjustment, is also included in the chart and was considered by the Board.
Fidelity Advisor Value Leaders Fund
The Board noted that the fund's management fee rate ranked below the median of its Total Mapped Group and below the median of its ASPG for the 12-month period ended June 30, 2018. The Board also noted the effect of the fund's performance adjustment, if any, on the fund's management fee ranking.
The Board noted that it and the boards of other Fidelity funds formed an ad hoc Committee on Group Fee, which meets periodically, to conduct an in-depth review of the "group fee" component of the management fee of funds with such management fee structures. The Committee's focus included the mechanics of the group fee, the competitive landscape of group fee structures, Fidelity funds with no group fee component and investment products not included in group fee assets. The Board also considered that, for funds subject to the group fee, FMR agreed to voluntarily waive fees over a specified period of time in amounts designed to account for assets converted from certain funds to certain collective investment trusts.
The Board also noted that, in 2013, the ad hoc Committee on Management Fees was formed to conduct an in-depth review of the management fee rates of Fidelity's active equity mutual funds. The Committee focused on the following areas: (i) standard fee structures; (ii) research consumption and trading evolution; (iii) management fee competitiveness/profitability by category; and (iv) factors that drive institutional pricing.
Based on its review, the Board concluded that the fund's management fee is fair and reasonable in light of the services that the fund receives and the other factors considered.
Total Expense Ratio. In its review of each class's total expense ratio, the Board considered the fund's management fee rate as well as other fund or class expenses, as applicable, such as transfer agent fees, pricing and bookkeeping fees, fund-paid 12b-1 fees, and custodial, legal, and audit fees. The Board noted the impact of the fund's performance adjustment. The Board also noted that Fidelity may agree to waive fees and expenses from time to time, and the extent to which, if any, it has done so for the fund. As part of its review, the Board also considered the current and historical total expense ratios of each class of the fund compared to competitive fund median expenses. Each class of the fund is compared to those funds and classes in the Total Mapped Group (used by the Board for management fee comparisons) that have a similar sales load structure.
The Board noted that the total expense ratio of each class ranked above the competitive median for the 12-month period ended June 30, 2018. The Board considered that, in general, various factors can affect total expense ratios. The Board noted that the total expense ratio of Class A was above the competitive median because of relatively higher other expenses due to asset levels or small average account sizes. The Board noted that the total expense ratio of Class M was above the competitive median primarily because of higher 12b-1 fees on Class M as compared to most competitor funds. Class M has a higher 12b-1 fee, but a lower front-end sales charge, than traditionally priced front-end sales charge classes. The Board considered that Class M is primarily sold load-waived to retirement plans and intermediary wrap programs where its 0.50% 12b-1 fee is comparable to competing no-load, higher 12b-1 fee classes designed specifically for retirement plans and wrap programs. The Board noted that the total expense ratio of Class C was above the competitive median primarily because of its 1.00% 12b-1 fee. The Board noted that, although Class I is categorized by Lipper as an institutional class, Class I has a significantly lower investment minimum than most other funds and classes categorized as institutional. As a result, FMR believes Class I is generally more comparable to retail funds and classes. The Board noted that the fund offers multiple classes, each of which has a different sales load and 12b-1 fee structure, and that the multiple structures are intended to offer a range of pricing options for the intermediary market. The Board also noted that the total expense ratios of the classes vary primarily by the level of their 12b-1 fees, although differences in transfer agent fees may also cause expenses to vary from class to class.
The Board further considered that FMR has contractually agreed to reimburse Class A, Class M, Class C, and Class I of the fund to the extent that total operating expenses, with certain exceptions, as a percentage of their respective average net assets, exceed 1.25%, 1.50%, 2.00%, and 1.00% through February 29, 2020.
Fees Charged to Other Fidelity Clients. The Board also considered Fidelity fee structures and other information with respect to clients of Fidelity, such as other funds advised or subadvised by Fidelity, pension plan clients, and other institutional clients with similar mandates. The Board noted that a joint ad hoc committee created by it and the boards of other Fidelity funds periodically reviews and compares Fidelity's institutional investment advisory business with its business of providing services to the Fidelity funds and also noted the most recent findings of the committee. The Board noted that the committee's review included a consideration of the differences in services provided, fees charged, and costs incurred, as well as competition in the markets serving the different categories of clients.
Based on its review of total expense ratios and fees charged to other Fidelity clients, the Board concluded that the total expense ratio of each class of the fund was reasonable in light of the services that the fund and its shareholders receive and the other factors considered.
Costs of the Services and Profitability. The Board considered the revenues earned and the expenses incurred by Fidelity in conducting the business of developing, marketing, distributing, managing, administering and servicing the fund and servicing the fund's shareholders. The Board also considered the level of Fidelity's profits in respect of all the Fidelity funds.
On an annual basis, Fidelity presents to the Board information about the profitability of its relationships with the fund. Fidelity calculates profitability information for each fund, as well as aggregate profitability information for groups of Fidelity funds and all Fidelity funds, using a series of detailed revenue and cost allocation methodologies which originate with the books and records of Fidelity on which Fidelity's audited financial statements are based. The Audit Committee of the Board reviews any significant changes from the prior year's methodologies.
PricewaterhouseCoopers LLP (PwC), auditor to Fidelity and certain Fidelity funds, has been engaged annually by the Board as part of the Board's assessment of Fidelity's profitability analysis. PwC's engagement includes the review and assessment of the methodologies used by Fidelity in determining the revenues and expenses attributable to Fidelity's mutual fund business, and completion of agreed-upon procedures in respect of the mathematical accuracy of the fund profitability information and its conformity to established allocation methodologies. After considering PwC's reports issued under the engagement and information provided by Fidelity, the Board concluded that while other allocation methods may also be reasonable, Fidelity's profitability methodologies are reasonable in all material respects.
The Board also reviewed Fidelity's non-fund businesses and potential indirect benefits such businesses may have received as a result of their association with Fidelity's mutual fund business (i.e., fall-out benefits) as well as cases where Fidelity's affiliates may benefit from the fund's business. The Board noted that changes to fall-out benefits year-over-year reflect business developments at Fidelity's various businesses.
The Board considered the costs of the services provided by and the profits realized by Fidelity in connection with the operation of the fund and was satisfied that the profitability was not excessive.
Economies of Scale. The Board considered whether there have been economies of scale in respect of the management of the Fidelity funds, whether the Fidelity funds (including the fund) have appropriately benefited from any such economies of scale, and whether there is potential for realization of any further economies of scale. The Board considered the extent to which the fund will benefit from economies of scale as assets grow through increased services to the fund, through waivers or reimbursements, or through fee or expense ratio reductions. The Board also noted that a committee (the Economies of Scale Committee) created by it and the boards of other Fidelity funds periodically analyzes whether Fidelity attains economies of scale in respect of the management and servicing of the Fidelity funds, whether the Fidelity funds have appropriately benefited from such economies of scale, and whether there is potential for realization of any further economies of scale.
The Board recognized that the fund's management contract incorporates a "group fee" structure, which provides for lower group fee rates as total group assets increase, and for higher group fee rates as total group assets decrease (with "group assets" defined to include fund assets under FMR's management plus the assets of sector funds previously under FMR's management). FMR calculates the group fee rates based on a tiered asset "breakpoint" schedule that varies based on asset class. The Board considered that the group fee is designed to deliver the benefits of economies of scale to fund shareholders when total Fidelity fund assets increase, even if assets of any particular fund are unchanged or have declined, because some portion of Fidelity's costs are attributable to services provided to all Fidelity funds, and all funds benefit if those costs can be allocated among more assets. The Board concluded that, given the group fee structure, fund shareholders will benefit from lower management fees as group assets increase at the fund complex level, regardless of whether Fidelity achieves any such economies of scale.
The Board concluded, taking into account the analysis of the Economies of Scale Committee, that economies of scale, if any, are being appropriately shared between fund shareholders and Fidelity.
Additional Information Requested by the Board. In order to develop fully the factual basis for consideration of the Fidelity funds' advisory contracts, the Board requested and received additional information on certain topics, including: (i) fund performance trends, in particular the underperformance of certain funds, and Fidelity's long-term strategies for certain funds; (ii) Fidelity's fund profitability methodology, profitability trends for certain funds, and the impact of certain factors on fund profitability results; (iii) metrics for evaluating index fund and ETF performance and information about ETF trading characteristics; (iv) the methodology with respect to the evaluation of competitive fund data and peer group classifications and fee comparisons; (v) the expense structures for different funds and classes; (vi) information regarding other accounts managed by Fidelity, including collective investment trusts; and (vii) Fidelity's philosophies and strategies for evaluating funds and classes with lower or declining asset levels.
Based on its evaluation of all of the conclusions noted above, and after considering all factors it believed relevant, the Board concluded that the advisory fee arrangements are fair and reasonable, and that the fund's Advisory Contracts should be renewed.
AVLF-SANN-0619
1.800656.115
Fidelity Advisor® Emerging Markets Fund
Semi-Annual Report April 30, 2019 |
|
Beginning on January 1, 2021, as permitted by regulations adopted by the Securities and Exchange Commission, paper copies of a fund’s shareholder reports will no longer be sent by mail, unless you specifically request paper copies of the reports from the fund or from your financial intermediary, such as a financial advisor, broker-dealer or bank. Instead, the reports will be made available on a website, and you will be notified by mail each time a report is posted and provided with a website link to access the report.
If you already elected to receive shareholder reports electronically, you will not be affected by this change and you need not take any action. You may elect to receive shareholder reports and other communications from a fund electronically, by contacting your financial intermediary. For Fidelity customers, visit Fidelity's web site or call Fidelity using the contact information listed below.
You may elect to receive all future reports in paper free of charge. If you wish to continue receiving paper copies of your shareholder reports, you may contact your financial intermediary or, if you are a Fidelity customer, visit Fidelity’s website, or call Fidelity at the applicable toll-free number listed below. Your election to receive reports in paper will apply to all funds held with the fund complex/your financial intermediary.
| Account Type | Website | Phone Number |
| Brokerage, Mutual Fund, or Annuity Contracts: | fidelity.com/mailpreferences | 1-800-343-3548 |
| Employer Provided Retirement Accounts: | netbenefits.fidelity.com/preferences (choose 'no' under Required Disclosures to continue to print) | 1-800-343-0860 |
| Advisor Sold Accounts Serviced Through Your Financial Intermediary: | Contact Your Financial Intermediary | Your Financial Intermediary's phone number |
| Advisor Sold Accounts Serviced by Fidelity: | institutional.fidelity.com | 1-877-208-0098 |
Contents
To view a fund's proxy voting guidelines and proxy voting record for the 12-month period ended June 30, visit http://www.fidelity.com/proxyvotingresults or visit the Securities and Exchange Commission's (SEC) web site at http://www.sec.gov.
You may also call 1-877-208-0098 to request a free copy of the proxy voting guidelines.
Standard & Poor's, S&P and S&P 500 are registered service marks of The McGraw-Hill Companies, Inc. and have been licensed for use by Fidelity Distributors Corporation.
Other third-party marks appearing herein are the property of their respective owners.
All other marks appearing herein are registered or unregistered trademarks or service marks of FMR LLC or an affiliated company. © 2019 FMR LLC. All rights reserved.
This report and the financial statements contained herein are submitted for the general information of the shareholders of the Fund. This report is not authorized for distribution to prospective investors in the Fund unless preceded or accompanied by an effective prospectus.
A fund files its complete schedule of portfolio holdings with the SEC for the first and third quarters of each fiscal year on Form N-PORT. Forms N-PORT are available on the SEC’s web site at http://www.sec.gov. A fund's Forms N-PORT may be reviewed and copied at the SEC’s Public Reference Room in Washington, DC. Information regarding the operation of the SEC's Public Reference Room may be obtained by calling 1-800-SEC-0330.
For a complete list of a fund's portfolio holdings, view the most recent holdings listing, semiannual report, or annual report on Fidelity's web site at http://www.fidelity.com, http://www.institutional.fidelity.com, or http://www.401k.com, as applicable.
NOT FDIC INSURED •MAY LOSE VALUE •NO BANK GUARANTEE
Neither the Fund nor Fidelity Distributors Corporation is a bank.
Investment Summary (Unaudited)
Top Five Stocks as of April 30, 2019
| | % of fund's net assets |
| Tencent Holdings Ltd. (Cayman Islands, Interactive Media & Services) | 6.0 |
| Alibaba Group Holding Ltd. sponsored ADR (Cayman Islands, Internet & Direct Marketing Retail) | 5.2 |
| Taiwan Semiconductor Manufacturing Co. Ltd. (Taiwan, Semiconductors & Semiconductor Equipment) | 4.5 |
| Naspers Ltd. Class N (South Africa, Internet & Direct Marketing Retail) | 3.1 |
| Samsung Electronics Co. Ltd. (Korea (South), Technology Hardware, Storage & Peripherals) | 2.3 |
| | 21.1 |
Top Five Market Sectors as of April 30, 2019
| | % of fund's net assets |
| Financials | 21.2 |
| Information Technology | 18.4 |
| Consumer Discretionary | 17.0 |
| Consumer Staples | 9.2 |
| Communication Services | 7.0 |
Top Five Countries as of April 30, 2019
| (excluding cash equivalents) | % of fund's net assets |
| Cayman Islands | 14.9 |
| India | 11.3 |
| Brazil | 10.6 |
| China | 9.9 |
| United States of America | 7.0 |
Asset Allocation (% of fund's net assets)
| As of April 30, 2019 |
| | Stocks | 96.4% |
| | Short-Term Investments and Net Other Assets (Liabilities) | 3.6% |

Schedule of Investments April 30, 2019 (Unaudited)
Showing Percentage of Net Assets
| Common Stocks - 93.9% | | | |
| | | Shares | Value |
| Bermuda - 0.9% | | | |
| Credicorp Ltd. (United States) | | 32,314 | $7,655,187 |
| Brazil - 8.1% | | | |
| Atacadao Distribuicao Comercio e Industria Ltda | | 795,800 | 4,302,609 |
| BM&F BOVESPA SA | | 1,106,200 | 9,718,852 |
| Equatorial Energia SA | | 346,900 | 7,263,393 |
| Localiza Rent A Car SA | | 568,600 | 5,249,374 |
| Lojas Renner SA | | 757,500 | 9,056,540 |
| Natura Cosmeticos SA | | 367,000 | 4,889,465 |
| Notre Dame Intermedica Participacoes SA | | 330,800 | 2,962,867 |
| Rumo SA (a) | | 1,245,000 | 5,746,984 |
| Suzano Papel e Celulose SA | | 600,300 | 6,235,551 |
| Vale SA sponsored ADR | | 1,036,000 | 13,240,080 |
|
| TOTAL BRAZIL | | | 68,665,715 |
|
| Cayman Islands - 14.9% | | | |
| Airtac International Group | | 477,000 | 6,359,588 |
| Alibaba Group Holding Ltd. sponsored ADR (a) | | 238,700 | 44,295,559 |
| New Oriental Education & Technology Group, Inc. sponsored ADR (a) | | 105,700 | 10,090,122 |
| Shenzhou International Group Holdings Ltd. | | 698,800 | 9,379,926 |
| TAL Education Group ADR (a) | | 145,300 | 5,589,691 |
| Tencent Holdings Ltd. | | 1,022,900 | 50,416,350 |
|
| TOTAL CAYMAN ISLANDS | | | 126,131,236 |
|
| Chile - 1.2% | | | |
| Banco Santander Chile sponsored ADR | | 247,700 | 6,935,600 |
| Sociedad Quimica y Minera de Chile SA (PN-B) sponsored ADR (b) | | 100,400 | 3,578,256 |
|
| TOTAL CHILE | | | 10,513,856 |
|
| China - 9.9% | | | |
| Foshan Haitian Flavouring & Food Co. Ltd. (A Shares) | | 580,151 | 7,690,668 |
| Inner Mongoli Yili Industries Co. Ltd. (A Shares) | | 1,571,960 | 7,235,558 |
| Jiangsu Yanghe Brewery JSC Ltd. (A Shares) | | 437,691 | 7,646,546 |
| Kweichow Moutai Co. Ltd. (A Shares) | | 69,075 | 9,989,614 |
| Midea Group Co. Ltd. (A Shares) | | 1,052,438 | 8,188,355 |
| Ping An Insurance (Group) Co. of China Ltd. (H Shares) | | 1,500,000 | 18,156,998 |
| Shanghai International Airport Co. Ltd. (A Shares) | | 805,671 | 8,449,204 |
| Shenzhen Inovance Technology Co. Ltd. (A Shares) | | 1,881,894 | 7,033,107 |
| Wuliangye Yibin Co. Ltd. (A Shares) | | 591,994 | 8,997,388 |
|
| TOTAL CHINA | | | 83,387,438 |
|
| France - 4.4% | | | |
| Dassault Systemes SA | | 49,000 | 7,751,882 |
| Hermes International SCA | | 10,469 | 7,364,601 |
| Kering SA | | 12,886 | 7,616,698 |
| LVMH Moet Hennessy - Louis Vuitton SA | | 20,412 | 8,014,103 |
| Pernod Ricard SA | | 37,200 | 6,481,749 |
|
| TOTAL FRANCE | | | 37,229,033 |
|
| Hong Kong - 0.9% | | | |
| AIA Group Ltd. | | 778,200 | 7,968,329 |
| India - 11.3% | | | |
| Asian Paints Ltd. | | 371,239 | 7,799,020 |
| Axis Bank Ltd. (a) | | 927,100 | 10,207,857 |
| Godrej Consumer Products Ltd. | | 769,539 | 7,201,825 |
| HDFC Bank Ltd. | | 236,272 | 7,838,485 |
| Housing Development Finance Corp. Ltd. | | 488,198 | 13,984,514 |
| Infosys Ltd. sponsored ADR | | 1,122,400 | 12,077,024 |
| Kotak Mahindra Bank Ltd. | | 392,704 | 7,818,050 |
| Reliance Industries Ltd. | | 804,709 | 16,092,562 |
| Tata Consultancy Services Ltd. | | 382,400 | 12,410,554 |
|
| TOTAL INDIA | | | 95,429,891 |
|
| Indonesia - 2.3% | | | |
| PT Bank Central Asia Tbk | | 4,795,800 | 9,675,737 |
| PT Bank Rakyat Indonesia Tbk | | 31,590,300 | 9,687,692 |
|
| TOTAL INDONESIA | | | 19,363,429 |
|
| Ireland - 0.9% | | | |
| Accenture PLC Class A | | 41,100 | 7,507,737 |
| Israel - 0.5% | | | |
| Elbit Systems Ltd. (Israel) | | 30,400 | 4,231,387 |
| Japan - 1.7% | | | |
| Hoya Corp. | | 97,800 | 6,861,233 |
| Keyence Corp. | | 11,800 | 7,321,837 |
|
| TOTAL JAPAN | | | 14,183,070 |
|
| Korea (South) - 3.3% | | | |
| Db Insurance Co. Ltd. (a) | | 29,120 | 1,711,161 |
| LG Household & Health Care Ltd. | | 3,878 | 4,737,516 |
| Samsung Electronics Co. Ltd. | | 492,941 | 19,416,796 |
| Shinhan Financial Group Co. Ltd. | | 52,160 | 1,978,393 |
|
| TOTAL KOREA (SOUTH) | | | 27,843,866 |
|
| Netherlands - 2.7% | | | |
| ASML Holding NV (Netherlands) | | 36,300 | 7,554,090 |
| Unilever NV (Certificaten Van Aandelen) (Bearer) | | 116,000 | 7,018,532 |
| Yandex NV Series A (a) | | 217,100 | 8,126,053 |
|
| TOTAL NETHERLANDS | | | 22,698,675 |
|
| Peru - 0.1% | | | |
| Compania de Minas Buenaventura SA sponsored ADR | | 67,288 | 1,090,738 |
| Philippines - 1.7% | | | |
| Ayala Land, Inc. | | 6,589,700 | 6,231,952 |
| SM Prime Holdings, Inc. | | 10,570,600 | 8,465,057 |
|
| TOTAL PHILIPPINES | | | 14,697,009 |
|
| Russia - 5.1% | | | |
| Alrosa Co. Ltd. | | 5,111,300 | 7,449,207 |
| Lukoil PJSC sponsored ADR | | 147,700 | 12,522,006 |
| NOVATEK OAO GDR (Reg. S) | | 54,477 | 10,497,718 |
| Sberbank of Russia | | 3,675,990 | 12,878,298 |
|
| TOTAL RUSSIA | | | 43,347,229 |
|
| South Africa - 6.2% | | | |
| Capitec Bank Holdings Ltd. | | 80,300 | 7,503,405 |
| FirstRand Ltd. | | 2,074,100 | 9,846,357 |
| Mondi Ltd. | | 306,420 | 6,753,664 |
| Mr Price Group Ltd. | | 149,000 | 2,256,405 |
| Naspers Ltd. Class N | | 101,700 | 26,162,380 |
|
| TOTAL SOUTH AFRICA | | | 52,522,211 |
|
| Spain - 0.8% | | | |
| Amadeus IT Holding SA Class A | | 86,100 | 6,848,727 |
| Sweden - 0.6% | | | |
| Hexagon AB (B Shares) | | 95,400 | 5,211,915 |
| Switzerland - 0.7% | | | |
| Sika AG | | 37,306 | 5,711,503 |
| Taiwan - 5.7% | | | |
| E.SUN Financial Holdings Co. Ltd. | | 10,227,000 | 8,389,569 |
| Sporton International, Inc. | | 207,000 | 1,225,843 |
| Taiwan Semiconductor Manufacturing Co. Ltd. | | 4,566,000 | 38,335,042 |
|
| TOTAL TAIWAN | | | 47,950,454 |
|
| Thailand - 0.5% | | | |
| Siam Cement PCL (For. Reg.) | | 288,400 | 4,174,537 |
| Turkey - 0.5% | | | |
| Tupras Turkiye Petrol Rafinerileri A/S | | 203,000 | 4,194,791 |
| United Arab Emirates - 1.1% | | | |
| National Bank of Abu Dhabi PJSC (a) | | 2,079,700 | 9,059,037 |
| United Kingdom - 0.9% | | | |
| NMC Health PLC | | 201,400 | 7,411,294 |
| United States of America - 7.0% | | | |
| Adobe, Inc. (a) | | 27,000 | 7,809,750 |
| MasterCard, Inc. Class A | | 30,300 | 7,703,472 |
| MercadoLibre, Inc. (a) | | 10,600 | 5,131,884 |
| Microsoft Corp. | | 60,900 | 7,953,540 |
| Moody's Corp. | | 39,800 | 7,825,476 |
| Thermo Fisher Scientific, Inc. | | 25,600 | 7,102,720 |
| TransDigm Group, Inc. (a) | | 15,900 | 7,672,068 |
| Visa, Inc. Class A | | 45,600 | 7,498,008 |
|
| TOTAL UNITED STATES OF AMERICA | | | 58,696,918 |
|
| TOTAL COMMON STOCKS | | | |
| (Cost $595,951,045) | | | 793,725,212 |
|
| Nonconvertible Preferred Stocks - 2.5% | | | |
| Brazil - 2.5% | | | |
| Itau Unibanco Holding SA | | 1,466,780 | 12,654,910 |
| Petroleo Brasileiro SA - Petrobras sponsored ADR | | 547,200 | 8,333,856 |
| TOTAL NONCONVERTIBLE PREFERRED STOCKS | | | |
| (Cost $17,522,932) | | | 20,988,766 |
|
| Money Market Funds - 4.6% | | | |
| Fidelity Cash Central Fund, 2.49% (c) | | 34,446,756 | 34,453,645 |
| Fidelity Securities Lending Cash Central Fund 2.49% (c)(d) | | 4,458,095 | 4,458,541 |
| TOTAL MONEY MARKET FUNDS | | | |
| (Cost $38,912,186) | | | 38,912,186 |
| TOTAL INVESTMENT IN SECURITIES - 101.0% | | | |
| (Cost $652,386,163) | | | 853,626,164 |
| NET OTHER ASSETS (LIABILITIES) - (1.0)% | | | (8,730,971) |
| NET ASSETS - 100% | | | $844,895,193 |
Categorizations in the Schedule of Investments are based on country or territory of incorporation.
Legend
(a) Non-income producing
(b) Security or a portion of the security is on loan at period end.
(c) Affiliated fund that is generally available only to investment companies and other accounts managed by Fidelity Investments. The rate quoted is the annualized seven-day yield of the fund at period end. A complete unaudited listing of the fund's holdings as of its most recent quarter end is available upon request. In addition, each Fidelity Central Fund's financial statements are available on the SEC's website or upon request.
(d) Investment made with cash collateral received from securities on loan.
Affiliated Central Funds
Information regarding fiscal year to date income earned by the Fund from investments in Fidelity Central Funds is as follows:
| Fund | Income earned |
| Fidelity Cash Central Fund | $129,802 |
| Fidelity Securities Lending Cash Central Fund | 349,872 |
| Total | $479,674 |
Amounts in the income column in the above table include any capital gain distributions from underlying funds, which are presented in the corresponding line-item in the Statement of Operations, if applicable.
Investment Valuation
The following is a summary of the inputs used, as of April 30, 2019, involving the Fund's assets and liabilities carried at fair value. The inputs or methodology used for valuing securities may not be an indication of the risk associated with investing in those securities. For more information on valuation inputs, and their aggregation into the levels used below, please refer to the Investment Valuation section in the accompanying Notes to Financial Statements.
| | Valuation Inputs at Reporting Date: |
| Description | Total | Level 1 | Level 2 | Level 3 |
| Investments in Securities: | | | | |
| Equities: | | | | |
| Communication Services | $58,542,403 | $8,126,053 | $50,416,350 | $-- |
| Consumer Discretionary | 143,146,264 | 108,969,781 | 34,176,483 | -- |
| Consumer Staples | 76,191,470 | 69,172,938 | 7,018,532 | -- |
| Energy | 51,640,933 | 51,640,933 | -- | -- |
| Financials | 181,493,907 | 132,673,404 | 48,820,503 | -- |
| Health Care | 24,338,114 | 24,338,114 | -- | -- |
| Industrials | 45,967,555 | 45,967,555 | -- | -- |
| Information Technology | 155,400,374 | 111,853,417 | 43,546,957 | -- |
| Materials | 56,032,556 | 56,032,556 | -- | -- |
| Real Estate | 14,697,009 | 14,697,009 | -- | -- |
| Utilities | 7,263,393 | 7,263,393 | -- | -- |
| Money Market Funds | 38,912,186 | 38,912,186 | -- | -- |
| Total Investments in Securities: | $853,626,164 | $669,647,339 | $183,978,825 | $-- |
See accompanying notes which are an integral part of the financial statements.
Financial Statements
Statement of Assets and Liabilities
| | | April 30, 2019 (Unaudited) |
| Assets | | |
Investment in securities, at value (including securities loaned of $4,323,132) — See accompanying schedule:
Unaffiliated issuers (cost $613,473,977) | $814,713,978 | |
| Fidelity Central Funds (cost $38,912,186) | 38,912,186 | |
| Total Investment in Securities (cost $652,386,163) | | $853,626,164 |
| Foreign currency held at value (cost $13,155) | | 13,155 |
| Receivable for investments sold | | 2,267,737 |
| Receivable for fund shares sold | | 1,319,853 |
| Dividends receivable | | 1,352,780 |
| Distributions receivable from Fidelity Central Funds | | 143,014 |
| Prepaid expenses | | 351 |
| Other receivables | | 134,364 |
| Total assets | | 858,857,418 |
| Liabilities | | |
| Payable to custodian bank | $1,493,167 | |
| Payable for investments purchased | 1,589,126 | |
| Payable for fund shares redeemed | 5,461,962 | |
| Accrued management fee | 546,775 | |
| Distribution and service plan fees payable | 91,099 | |
| Other affiliated payables | 165,011 | |
| Other payables and accrued expenses | 157,310 | |
| Collateral on securities loaned | 4,457,775 | |
| Total liabilities | | 13,962,225 |
| Net Assets | | $844,895,193 |
| Net Assets consist of: | | |
| Paid in capital | | $675,898,647 |
| Total distributable earnings (loss) | | 168,996,546 |
| Net Assets | | $844,895,193 |
| Net Asset Value and Maximum Offering Price | | |
| Class A: | | |
| Net Asset Value and redemption price per share ($154,527,609 ÷ 5,266,053 shares) | | $29.34 |
| Maximum offering price per share (100/94.25 of $29.34) | | $31.13 |
| Class M: | | |
| Net Asset Value and redemption price per share ($49,252,034 ÷ 1,694,344 shares) | | $29.07 |
| Maximum offering price per share (100/96.50 of $29.07) | | $30.12 |
| Class C: | | |
| Net Asset Value and offering price per share ($47,156,023 ÷ 1,701,042 shares)(a) | | $27.72 |
| Class I: | | |
| Net Asset Value, offering price and redemption price per share ($508,197,345 ÷ 17,250,366 shares) | | $29.46 |
| Class Z: | | |
| Net Asset Value, offering price and redemption price per share ($85,762,182 ÷ 2,913,944 shares) | | $29.43 |
(a) Redemption price per share is equal to net asset value less any applicable contingent deferred sales charge.
See accompanying notes which are an integral part of the financial statements.
Statement of Operations
| | | Six months ended April 30, 2019 (Unaudited) |
| Investment Income | | |
| Dividends | | $4,644,108 |
| Interest | | 12 |
| Income from Fidelity Central Funds (including $349,872 from security lending) | | 479,674 |
| Income before foreign taxes withheld | | 5,123,794 |
| Less foreign taxes withheld | | (460,977) |
| Total income | | 4,662,817 |
| Expenses | | |
| Management fee | $2,924,340 | |
| Transfer agent fees | 739,692 | |
| Distribution and service plan fees | 529,527 | |
| Accounting and security lending fees | 180,382 | |
| Custodian fees and expenses | 174,549 | |
| Independent trustees' fees and expenses | 1,983 | |
| Registration fees | 80,803 | |
| Audit | 76,717 | |
| Legal | 1,798 | |
| Interest | 9,572 | |
| Miscellaneous | 2,224 | |
| Total expenses before reductions | 4,721,587 | |
| Expense reductions | (132,189) | |
| Total expenses after reductions | | 4,589,398 |
| Net investment income (loss) | | 73,419 |
| Realized and Unrealized Gain (Loss) | | |
| Net realized gain (loss) on: | | |
| Investment securities: | | |
| Unaffiliated issuers | (2,198,029) | |
| Fidelity Central Funds | (47) | |
| Foreign currency transactions | (185,203) | |
| Total net realized gain (loss) | | (2,383,279) |
| Change in net unrealized appreciation (depreciation) on: | | |
| Investment securities: | | |
| Unaffiliated issuers | 140,080,242 | |
| Assets and liabilities in foreign currencies | 4,015 | |
| Total change in net unrealized appreciation (depreciation) | | 140,084,257 |
| Net gain (loss) | | 137,700,978 |
| Net increase (decrease) in net assets resulting from operations | | $137,774,397 |
See accompanying notes which are an integral part of the financial statements.
Statement of Changes in Net Assets
| | Six months ended April 30, 2019 (Unaudited) | Year ended October 31, 2018 |
| Increase (Decrease) in Net Assets | | |
| Operations | | |
| Net investment income (loss) | $73,419 | $2,986,977 |
| Net realized gain (loss) | (2,383,279) | (29,147,894) |
| Change in net unrealized appreciation (depreciation) | 140,084,257 | (95,549,261) |
| Net increase (decrease) in net assets resulting from operations | 137,774,397 | (121,710,178) |
| Distributions to shareholders | (3,109,430) | (2,511,924) |
| Share transactions - net increase (decrease) | 38,141,112 | 188,083,026 |
| Redemption fees | – | 14,852 |
| Total increase (decrease) in net assets | 172,806,079 | 63,875,776 |
| Net Assets | | |
| Beginning of period | 672,089,114 | 608,213,338 |
| End of period | $844,895,193 | $672,089,114 |
See accompanying notes which are an integral part of the financial statements.
Financial Highlights
Fidelity Advisor Emerging Markets Fund Class A
| | Six months ended (Unaudited) April 30, | Years endedOctober 31, | | | | |
| | 2019 | 2018 | 2017 | 2016 | 2015 | 2014 |
| Selected Per–Share Data | | | | | | |
| Net asset value, beginning of period | $24.48 | $28.86 | $22.30 | $20.73 | $23.38 | $22.62 |
| Income from Investment Operations | | | | | | |
| Net investment income (loss)A | (.02) | .09 | .08 | .02 | .06 | .06 |
| Net realized and unrealized gain (loss) | 4.92 | (4.39) | 6.49 | 1.55 | (2.66) | .76 |
| Total from investment operations | 4.90 | (4.30) | 6.57 | 1.57 | (2.60) | .82 |
| Distributions from net investment income | (.04) | (.05) | (.01) | – | (.02) | (.05) |
| Distributions from net realized gain | (.01) | (.03) | – | – | (.03) | (.01) |
| Total distributions | (.04)B | (.08) | (.01) | – | (.05) | (.06) |
| Redemption fees added to paid in capitalA | – | –C | –C | –C | –C | –C |
| Net asset value, end of period | $29.34 | $24.48 | $28.86 | $22.30 | $20.73 | $23.38 |
| Total ReturnD,E,F | 20.05% | (14.93)% | 29.46% | 7.57% | (11.13)% | 3.65% |
| Ratios to Average Net AssetsG,H | | | | | | |
| Expenses before reductions | 1.44%I | 1.44% | 1.47% | 1.51% | 1.52% | 1.52% |
| Expenses net of fee waivers, if any | 1.44%I | 1.44% | 1.47% | 1.51% | 1.52% | 1.52% |
| Expenses net of all reductions | 1.41%I | 1.40% | 1.46% | 1.51% | 1.50% | 1.52% |
| Net investment income (loss) | (.15)%I | .30% | .34% | .11% | .28% | .26% |
| Supplemental Data | | | | | | |
| Net assets, end of period (000 omitted) | $154,528 | $120,499 | $142,129 | $118,092 | $112,931 | $141,601 |
| Portfolio turnover rateJ | 113%I | 87% | 86% | 85% | 110% | 97% |
A Calculated based on average shares outstanding during the period.
B Total distributions of $.04 per share is comprised of distributions from net investment income of $.036 and distributions from net realized gain of $.005 per share.
C Amount represents less than $.005 per share.
D Total returns for periods of less than one year are not annualized.
E Total returns would have been lower if certain expenses had not been reduced during the applicable periods shown.
F Total returns do not include the effect of the sales charges.
G Fees and expenses of any underlying Fidelity Central Funds are not included in the Fund's expense ratio. The Fund indirectly bears its proportionate share of the expenses of any underlying Fidelity Central Funds.
H Expense ratios reflect operating expenses of the class. Expenses before reductions do not reflect amounts reimbursed by the investment adviser or reductions from brokerage service arrangements or reductions from other expense offset arrangements and do not represent the amount paid by the class during periods when reimbursements or reductions occur. Expenses net of fee waivers reflect expenses after reimbursement by the investment adviser but prior to reductions from brokerage service arrangements or other expense offset arrangements. Expenses net of all reductions represent the net expenses paid by the class.
I Annualized
J Amount does not include the portfolio activity of any underlying Fidelity Central Funds.
See accompanying notes which are an integral part of the financial statements.
Fidelity Advisor Emerging Markets Fund Class M
| | Six months ended (Unaudited) April 30, | Years endedOctober 31, | | | | |
| | 2019 | 2018 | 2017 | 2016 | 2015 | 2014 |
| Selected Per–Share Data | | | | | | |
| Net asset value, beginning of period | $24.25 | $28.61 | $22.16 | $20.65 | $23.30 | $22.55 |
| Income from Investment Operations | | | | | | |
| Net investment income (loss)A | (.06) | –B | .02 | (.03) | .01 | –B |
| Net realized and unrealized gain (loss) | 4.88 | (4.34) | 6.43 | 1.54 | (2.66) | .76 |
| Total from investment operations | 4.82 | (4.34) | 6.45 | 1.51 | (2.65) | .76 |
| Distributions from net investment income | – | – | – | – | – | –B |
| Distributions from net realized gain | – | (.02) | – | – | – | (.01) |
| Total distributions | – | (.02) | – | – | – | (.01) |
| Redemption fees added to paid in capitalA | – | –B | –B | –B | –B | –B |
| Net asset value, end of period | $29.07 | $24.25 | $28.61 | $22.16 | $20.65 | $23.30 |
| Total ReturnC,D,E | 19.88% | (15.17)% | 29.11% | 7.31% | (11.37)% | 3.39% |
| Ratios to Average Net AssetsF,G | | | | | | |
| Expenses before reductions | 1.73%H | 1.73% | 1.75% | 1.77% | 1.78% | 1.78% |
| Expenses net of fee waivers, if any | 1.73%H | 1.73% | 1.75% | 1.77% | 1.78% | 1.78% |
| Expenses net of all reductions | 1.69%H | 1.69% | 1.73% | 1.77% | 1.76% | 1.78% |
| Net investment income (loss) | (.44)%H | - %I | .06% | (.15)% | .02% | - %I |
| Supplemental Data | | | | | | |
| Net assets, end of period (000 omitted) | $49,252 | $40,616 | $53,572 | $44,575 | $43,365 | $54,341 |
| Portfolio turnover rateJ | 113%H | 87% | 86% | 85% | 110% | 97% |
A Calculated based on average shares outstanding during the period.
B Amount represents less than $.005 per share.
C Total returns for periods of less than one year are not annualized.
D Total returns would have been lower if certain expenses had not been reduced during the applicable periods shown.
E Total returns do not include the effect of the sales charges.
F Fees and expenses of any underlying Fidelity Central Funds are not included in the Fund's expense ratio. The Fund indirectly bears its proportionate share of the expenses of any underlying Fidelity Central Funds.
G Expense ratios reflect operating expenses of the class. Expenses before reductions do not reflect amounts reimbursed by the investment adviser or reductions from brokerage service arrangements or reductions from other expense offset arrangements and do not represent the amount paid by the class during periods when reimbursements or reductions occur. Expenses net of fee waivers reflect expenses after reimbursement by the investment adviser but prior to reductions from brokerage service arrangements or other expense offset arrangements. Expenses net of all reductions represent the net expenses paid by the class.
H Annualized
I Amount represents less than .005%.
J Amount does not include the portfolio activity of any underlying Fidelity Central Funds.
See accompanying notes which are an integral part of the financial statements.
Fidelity Advisor Emerging Markets Fund Class C
| | Six months ended (Unaudited) April 30, | Years endedOctober 31, | | | | |
| | 2019 | 2018 | 2017 | 2016 | 2015 | 2014 |
| Selected Per–Share Data | | | | | | |
| Net asset value, beginning of period | $23.18 | $27.46 | $21.37 | $20.02 | $22.70 | $22.06 |
| Income from Investment Operations | | | | | | |
| Net investment income (loss)A | (.12) | (.13) | (.10) | (.13) | (.10) | (.11) |
| Net realized and unrealized gain (loss) | 4.66 | (4.15) | 6.19 | 1.48 | (2.58) | .75 |
| Total from investment operations | 4.54 | (4.28) | 6.09 | 1.35 | (2.68) | .64 |
| Distributions from net investment income | – | – | – | – | – | – |
| Distributions from net realized gain | – | – | – | – | – | – |
| Total distributions | – | – | – | – | – | – |
| Redemption fees added to paid in capitalA | – | –B | –B | –B | –B | –B |
| Net asset value, end of period | $27.72 | $23.18 | $27.46 | $21.37 | $20.02 | $22.70 |
| Total ReturnC,D,E | 19.59% | (15.59)% | 28.50% | 6.74% | (11.81)% | 2.90% |
| Ratios to Average Net AssetsF,G | | | | | | |
| Expenses before reductions | 2.23%H | 2.22% | 2.24% | 2.26% | 2.27% | 2.27% |
| Expenses net of fee waivers, if any | 2.23%H | 2.22% | 2.24% | 2.26% | 2.27% | 2.27% |
| Expenses net of all reductions | 2.19%H | 2.19% | 2.22% | 2.26% | 2.26% | 2.27% |
| Net investment income (loss) | (.94)%H | (.49)% | (.43)% | (.64)% | (.47)% | (.49)% |
| Supplemental Data | | | | | | |
| Net assets, end of period (000 omitted) | $47,156 | $50,617 | $57,599 | $43,848 | $46,595 | $64,026 |
| Portfolio turnover rateI | 113%H | 87% | 86% | 85% | 110% | 97% |
A Calculated based on average shares outstanding during the period.
B Amount represents less than $.005 per share.
C Total returns for periods of less than one year are not annualized.
D Total returns would have been lower if certain expenses had not been reduced during the applicable periods shown.
E Total returns do not include the effect of the contingent deferred sales charge.
F Fees and expenses of any underlying Fidelity Central Funds are not included in the Fund's expense ratio. The Fund indirectly bears its proportionate share of the expenses of any underlying Fidelity Central Funds.
G Expense ratios reflect operating expenses of the class. Expenses before reductions do not reflect amounts reimbursed by the investment adviser or reductions from brokerage service arrangements or reductions from other expense offset arrangements and do not represent the amount paid by the class during periods when reimbursements or reductions occur. Expenses net of fee waivers reflect expenses after reimbursement by the investment adviser but prior to reductions from brokerage service arrangements or other expense offset arrangements. Expenses net of all reductions represent the net expenses paid by the class.
H Annualized
I Amount does not include the portfolio activity of any underlying Fidelity Central Funds.
See accompanying notes which are an integral part of the financial statements.
Fidelity Advisor Emerging Markets Fund Class I
| | Six months ended (Unaudited) April 30, | Years endedOctober 31, | | | | |
| | 2019 | 2018 | 2017 | 2016 | 2015 | 2014 |
| Selected Per–Share Data | | | | | | |
| Net asset value, beginning of period | $24.65 | $29.03 | $22.44 | $20.83 | $23.50 | $22.73 |
| Income from Investment Operations | | | | | | |
| Net investment income (loss)A | .02 | .18 | .17 | .10 | .14 | .14 |
| Net realized and unrealized gain (loss) | 4.94 | (4.41) | 6.51 | 1.55 | (2.67) | .76 |
| Total from investment operations | 4.96 | (4.23) | 6.68 | 1.65 | (2.53) | .90 |
| Distributions from net investment income | (.15) | (.12) | (.09) | (.04) | (.11) | (.12) |
| Distributions from net realized gain | (.01) | (.03) | – | – | (.03) | (.01) |
| Total distributions | (.15)B | (.15) | (.09) | (.04) | (.14) | (.13) |
| Redemption fees added to paid in capitalA | – | –C | –C | –C | –C | –C |
| Net asset value, end of period | $29.46 | $24.65 | $29.03 | $22.44 | $20.83 | $23.50 |
| Total ReturnD,E | 20.24% | (14.64)% | 29.94% | 7.93% | (10.83)% | 4.00% |
| Ratios to Average Net AssetsF,G | | | | | | |
| Expenses before reductions | 1.11%H | 1.12% | 1.13% | 1.16% | 1.17% | 1.18% |
| Expenses net of fee waivers, if any | 1.11%H | 1.12% | 1.13% | 1.16% | 1.17% | 1.18% |
| Expenses net of all reductions | 1.08%H | 1.08% | 1.11% | 1.15% | 1.16% | 1.18% |
| Net investment income (loss) | .18%H | .62% | .68% | .46% | .63% | .60% |
| Supplemental Data | | | | | | |
| Net assets, end of period (000 omitted) | $508,197 | $394,904 | $340,526 | $242,116 | $209,270 | $199,098 |
| Portfolio turnover rateI | 113%H | 87% | 86% | 85% | 110% | 97% |
A Calculated based on average shares outstanding during the period.
B Total distributions of $.15 per share is comprised of distributions from net investment income of $.146 and distributions from net realized gain of $.005 per share.
C Amount represents less than $.005 per share.
D Total returns for periods of less than one year are not annualized.
E Total returns would have been lower if certain expenses had not been reduced during the applicable periods shown.
F Fees and expenses of any underlying Fidelity Central Funds are not included in the Fund's expense ratio. The Fund indirectly bears its proportionate share of the expenses of any underlying Fidelity Central Funds.
G Expense ratios reflect operating expenses of the class. Expenses before reductions do not reflect amounts reimbursed by the investment adviser or reductions from brokerage service arrangements or reductions from other expense offset arrangements and do not represent the amount paid by the class during periods when reimbursements or reductions occur. Expenses net of fee waivers reflect expenses after reimbursement by the investment adviser but prior to reductions from brokerage service arrangements or other expense offset arrangements. Expenses net of all reductions represent the net expenses paid by the class.
H Annualized
I Amount does not include the portfolio activity of any underlying Fidelity Central Funds.
See accompanying notes which are an integral part of the financial statements.
Fidelity Advisor Emerging Markets Fund Class Z
| | Six months ended (Unaudited) April 30, | Years endedOctober 31, | | | | |
| | 2019 | 2018 | 2017 | 2016 | 2015 | 2014 |
| Selected Per–Share Data | | | | | | |
| Net asset value, beginning of period | $24.65 | $29.02 | $22.44 | $20.83 | $23.50 | $22.73 |
| Income from Investment Operations | | | | | | |
| Net investment income (loss)A | .04 | .22 | .21 | .13 | .17 | .18 |
| Net realized and unrealized gain (loss) | 4.93 | (4.41) | 6.50 | 1.55 | (2.66) | .76 |
| Total from investment operations | 4.97 | (4.19) | 6.71 | 1.68 | (2.49) | .94 |
| Distributions from net investment income | (.19) | (.15) | (.13) | (.07) | (.14) | (.16) |
| Distributions from net realized gain | (.01) | (.03) | – | – | (.03) | (.01) |
| Total distributions | (.19)B | (.18) | (.13) | (.07) | (.18)C | (.17) |
| Redemption fees added to paid in capitalA | – | –D | –D | –D | –D | –D |
| Net asset value, end of period | $29.43 | $24.65 | $29.02 | $22.44 | $20.83 | $23.50 |
| Total ReturnE,F | 20.31% | (14.52)% | 30.13% | 8.09% | (10.68)% | 4.19% |
| Ratios to Average Net AssetsG,H | | | | | | |
| Expenses before reductions | .98%I | .98% | .98% | 1.01% | 1.02% | 1.02% |
| Expenses net of fee waivers, if any | .98%I | .98% | .98% | 1.01% | 1.02% | 1.02% |
| Expenses net of all reductions | .94%I | .94% | .97% | 1.00% | 1.00% | 1.02% |
| Net investment income (loss) | .32%I | .76% | .82% | .61% | .78% | .77% |
| Supplemental Data | | | | | | |
| Net assets, end of period (000 omitted) | $85,762 | $65,453 | $14,387 | $6,261 | $6,114 | $5,544 |
| Portfolio turnover rateJ | 113%I | 87% | 86% | 85% | 110% | 97% |
A Calculated based on average shares outstanding during the period.
B Total distributions of $.19 per share is comprised of distributions from net investment income of $.186 and distributions from net realized gain of $.005 per share.
C Total distributions of $.18 per share is comprised of distributions from net investment income of $.143 and distributions from net realized gain of $.033 per share.
D Amount represents less than $.005 per share.
E Total returns for periods of less than one year are not annualized.
F Total returns would have been lower if certain expenses had not been reduced during the applicable periods shown.
G Fees and expenses of any underlying Fidelity Central Funds are not included in the Fund's expense ratio. The Fund indirectly bears its proportionate share of the expenses of any underlying Fidelity Central Funds.
H Expense ratios reflect operating expenses of the class. Expenses before reductions do not reflect amounts reimbursed by the investment adviser or reductions from brokerage service arrangements or reductions from other expense offset arrangements and do not represent the amount paid by the class during periods when reimbursements or reductions occur. Expenses net of fee waivers reflect expenses after reimbursement by the investment adviser but prior to reductions from brokerage service arrangements or other expense offset arrangements. Expenses net of all reductions represent the net expenses paid by the class.
I Annualized
J Amount does not include the portfolio activity of any underlying Fidelity Central Funds.
See accompanying notes which are an integral part of the financial statements.
Notes to Financial Statements (Unaudited)
For the period ended April 30, 2019
1. Organization.
Fidelity Advisor Emerging Markets Fund (the Fund) is a fund of Fidelity Advisor Series VIII (the Trust) and is authorized to issue an unlimited number of shares. The Trust is registered under the Investment Company Act of 1940, as amended (the 1940 Act), as an open-end management investment company organized as a Massachusetts business trust. The Fund offers Class A, Class M, Class C, Class I and Class Z shares, each of which has equal rights as to assets and voting privileges. Each class has exclusive voting rights with respect to matters that affect that class. Effective March 1, 2019, Class C shares will automatically convert to Class A shares after a holding period of ten years from the initial date of purchase, with certain exceptions. The Fund's investments in emerging markets can be subject to social, economic, regulatory, and political uncertainties and can be extremely volatile.
2. Investments in Fidelity Central Funds.
The Fund invests in Fidelity Central Funds, which are open-end investment companies generally available only to other investment companies and accounts managed by the investment adviser and its affiliates. The Fund's Schedule of Investments lists each of the Fidelity Central Funds held as of period end, if any, as an investment of the Fund, but does not include the underlying holdings of each Fidelity Central Fund. As an Investing Fund, the Fund indirectly bears its proportionate share of the expenses of the underlying Fidelity Central Funds.
The Money Market Central Funds seek preservation of capital and current income and are managed by Fidelity Investments Money Management, Inc. (FIMM), an affiliate of the investment adviser. Annualized expenses of the Money Market Central Funds as of their most recent shareholder report date are less than .005%.
A complete unaudited list of holdings for each Fidelity Central Fund is available upon request or at the Securities and Exchange Commission (the SEC) website at www.sec.gov. In addition, the financial statements of the Fidelity Central Funds are available on the SEC website or upon request.
3. Significant Accounting Policies.
The Fund is an investment company and applies the accounting and reporting guidance of the Financial Accounting Standards Board (FASB) Accounting Standards Codification Topic 946 Financial Services – Investments Companies. The financial statements have been prepared in conformity with accounting principles generally accepted in the United States of America (GAAP), which require management to make certain estimates and assumptions at the date of the financial statements. Actual results could differ from those estimates. Subsequent events, if any, through the date that the financial statements were issued have been evaluated in the preparation of the financial statements. The following summarizes the significant accounting policies of the Fund:
Investment Valuation. Investments are valued as of 4:00 p.m. Eastern time on the last calendar day of the period. The Board of Trustees (the Board) has delegated the day to day responsibility for the valuation of the Fund's investments to the Fair Value Committee (the Committee) established by the Fund's investment adviser. In accordance with valuation policies and procedures approved by the Board, the Fund attempts to obtain prices from one or more third party pricing vendors or brokers to value its investments. When current market prices, quotations or currency exchange rates are not readily available or reliable, investments will be fair valued in good faith by the Committee, in accordance with procedures adopted by the Board. Factors used in determining fair value vary by investment type and may include market or investment specific events. The frequency with which these procedures are used cannot be predicted and they may be utilized to a significant extent. The Committee oversees the Fund's valuation policies and procedures and reports to the Board on the Committee's activities and fair value determinations. The Board monitors the appropriateness of the procedures used in valuing the Fund's investments and ratifies the fair value determinations of the Committee.
The Fund categorizes the inputs to valuation techniques used to value its investments into a disclosure hierarchy consisting of three levels as shown below:
- Level 1 – quoted prices in active markets for identical investments
- Level 2 – other significant observable inputs (including quoted prices for similar investments, interest rates, prepayment speeds, etc.)
- Level 3 – unobservable inputs (including the Fund's own assumptions based on the best information available)
Valuation techniques used to value the Fund's investments by major category are as follows:
Equity securities, including restricted securities, for which market quotations are readily available, are valued at the last reported sale price or official closing price as reported by a third party pricing vendor on the primary market or exchange on which they are traded and are categorized as Level 1 in the hierarchy. In the event there were no sales during the day or closing prices are not available, securities are valued at the last quoted bid price or may be valued using the last available price and are generally categorized as Level 2 in the hierarchy. For foreign equity securities, when market or security specific events arise, comparisons to the valuation of American Depositary Receipts (ADRs), futures contracts, Exchange-Traded Funds (ETFs) and certain indexes as well as quoted prices for similar securities may be used and would be categorized as Level 2 in the hierarchy. For equity securities, including restricted securities, where observable inputs are limited, assumptions about market activity and risk are used and these securities may be categorized as Level 3 in the hierarchy.
Investments in open-end mutual funds, including the Fidelity Central Funds, are valued at their closing net asset value (NAV) each business day and are categorized as Level 1 in the hierarchy.
Changes in valuation techniques may result in transfers in or out of an assigned level within the disclosure hierarchy. The aggregate value of investments by input level as of April 30, 2019 is included at the end of the Fund's Schedule of Investments.
Foreign Currency. The Fund may use foreign currency contracts to facilitate transactions in foreign-denominated securities. Gains and losses from these transactions may arise from changes in the value of the foreign currency or if the counterparties do not perform under the contracts' terms.
Foreign-denominated assets, including investment securities, and liabilities are translated into U.S. dollars at the exchange rates at period end. Purchases and sales of investment securities, income and dividends received and expenses denominated in foreign currencies are translated into U.S. dollars at the exchange rate in effect on the transaction date.
The effects of exchange rate fluctuations on investments are included with the net realized and unrealized gain (loss) on investment securities. Other foreign currency transactions resulting in realized and unrealized gain (loss) are disclosed separately.
Investment Transactions and Income. For financial reporting purposes, the Fund's investment holdings and NAV include trades executed through the end of the last business day of the period. The NAV per share for processing shareholder transactions is calculated as of the close of business of the New York Stock Exchange (NYSE), normally 4:00 p.m. Eastern time and includes trades executed through the end of the prior business day. Gains and losses on securities sold are determined on the basis of identified cost. Dividend income is recorded on the ex-dividend date, except for certain dividends from foreign securities where the ex-dividend date may have passed, which are recorded as soon as the Fund is informed of the ex-dividend date. Non-cash dividends included in dividend income, if any, are recorded at the fair market value of the securities received. Income and capital gain distributions from Fidelity Central Funds, if any, are recorded on the ex-dividend date. Certain distributions received by the Fund represent a return of capital or capital gain. The Fund determines the components of these distributions subsequent to the ex-dividend date, based upon receipt of tax filings or other correspondence relating to the underlying investment. These distributions are recorded as a reduction of cost of investments and/or as a realized gain. Interest income is accrued as earned and includes coupon interest and amortization of premium and accretion of discount on debt securities as applicable. Investment income is recorded net of foreign taxes withheld where recovery of such taxes is uncertain.
Class Allocations and Expenses. Investment income, realized and unrealized capital gains and losses, common expenses of the Fund, and certain fund-level expense reductions, if any, are allocated daily on a pro-rata basis to each class based on the relative net assets of each class to the total net assets of the Fund. Each class differs with respect to transfer agent and distribution and service plan fees incurred. Certain expense reductions may also differ by class. For the reporting period, the allocated portion of income and expenses to each class as a percent of its average net assets may vary due to the timing of recording these transactions in relation to fluctuating net assets of the classes. Expenses directly attributable to a fund are charged to that fund. Expenses attributable to more than one fund are allocated among the respective funds on the basis of relative net assets or other appropriate methods. Expense estimates are accrued in the period to which they relate and adjustments are made when actual amounts are known.
Income Tax Information and Distributions to Shareholders. Each year, the Fund intends to qualify as a regulated investment company under Subchapter M of the Internal Revenue Code, including distributing substantially all of its taxable income and realized gains. As a result, no provision for U.S. Federal income taxes is required. The Fund files a U.S. federal tax return, in addition to state and local tax returns as required. The Fund's federal income tax returns are subject to examination by the Internal Revenue Service (IRS) for a period of three fiscal years after they are filed. State and local tax returns may be subject to examination for an additional fiscal year depending on the jurisdiction. Foreign taxes are provided for based on the Fund's understanding of the tax rules and rates that exist in the foreign markets in which it invests.
Distributions are declared and recorded on the ex-dividend date. Income and capital gain distributions are declared separately for each class. Income and capital gain distributions are determined in accordance with income tax regulations, which may differ from GAAP.
Capital accounts within the financial statements are adjusted for permanent book-tax differences. These adjustments have no impact on net assets or the results of operations. Capital accounts are not adjusted for temporary book-tax differences which will reverse in a subsequent period.
Book-tax differences are primarily due to foreign currency transactions, passive foreign investment companies (PFIC), capital loss carryforwards and losses deferred due to wash sales.
As of period end, the cost and unrealized appreciation (depreciation) in securities, and derivatives if applicable, for federal income tax purposes were as follows:
| Gross unrealized appreciation | $203,701,041 |
| Gross unrealized depreciation | (6,797,564) |
| Net unrealized appreciation (depreciation) | $196,903,477 |
| Tax cost | $656,722,687 |
Capital loss carryforwards are only available to offset future capital gains of the Fund to the extent provided by regulations and may be limited. Under the Regulated Investment Company Modernization Act of 2010 (the Act), the Fund is permitted to carry forward capital losses incurred in taxable years beginning after December 22, 2010 for an unlimited period and such capital losses are required to be used prior to any losses that expire. The capital loss carryforward information presented below, including any applicable limitation, is estimated as of prior fiscal period end and is subject to adjustment.
| No expiration | |
| Short-term | $(25,431,508) |
4. Purchases and Sales of Investments.
Purchases and sales of securities, other than short-term securities, aggregated $427,787,602 and $413,982,613, respectively.
5. Fees and Other Transactions with Affiliates.
Management Fee. Fidelity Management & Research Company (the investment adviser) and its affiliates provide the Fund with investment management related services for which the Fund pays a monthly management fee. The management fee is the sum of an individual fund fee rate that is based on an annual rate of .55% of the Fund's average net assets and an annualized group fee rate that averaged .24% during the period. The group fee rate is based upon the average net assets of all the mutual funds advised by the investment adviser, including any mutual funds previously advised by the investment adviser that are currently advised by Fidelity SelectCo, LLC, an affiliate of the investment adviser. The group fee rate decreases as assets under management increase and increases as assets under management decrease. For the reporting period, the total annualized management fee rate was .79% of the Fund's average net assets.
Distribution and Service Plan Fees. In accordance with Rule 12b-1 of the 1940 Act, the Fund has adopted separate Distribution and Service Plans for each class of shares. Certain classes pay Fidelity Distributors Corporation (FDC), an affiliate of the investment adviser, separate Distribution and Service Fees, each of which is based on an annual percentage of each class' average net assets. In addition, FDC may pay financial intermediaries for selling shares of the Fund and providing shareholder support services. For the period, the Distribution and Service Fee rates, total fees and amounts retained by FDC were as follows:
| | Distribution Fee | Service Fee | Total Fees | Retained by FDC |
| Class A | -% | .25% | $166,301 | $9,318 |
| Class M | .25% | .25% | 109,750 | 1,612 |
| Class C | .75% | .25% | 253,476 | 43,213 |
| | | | $529,527 | $54,143 |
Sales Load. FDC may receive a front-end sales charge of up to 5.75% for selling Class A shares and 3.50% for selling Class M shares, some of which is paid to financial intermediaries for selling shares of the Fund. Depending on the holding period, FDC may receive contingent deferred sales charges levied on Class A, Class M and Class C redemptions. The deferred sales charges are 1.00% for Class C shares, 1.00% for certain purchases of Class A shares and .25% for certain purchases of Class M shares.
For the period, sales charge amounts retained by FDC were as follows:
| | Retained by FDC |
| Class A | $26,465 |
| Class M | 3,129 |
| Class C(a) | 9,436 |
| | $39,030 |
(a) When Class C shares are initially sold, FDC pays commissions from its own resources to financial intermediaries through which the sales are made.
Transfer Agent Fees. Fidelity Investments Institutional Operations Company, Inc., (FIIOC), an affiliate of the investment adviser, is the transfer, dividend disbursing and shareholder servicing agent for each class of the Fund. FIIOC receives account fees and asset-based fees that vary according to the account size and type of account of the shareholders of the respective classes of the Fund, except for Class Z. FIIOC receives an asset-based fee of Class Z's average net assets. FIIOC pays for typesetting, printing and mailing of shareholder reports, except proxy statements.
For the period, transfer agent fees for each class were as follows:
| | Amount | % of Class-Level Average Net Assets(a) |
| Class A | $174,673 | .26 |
| Class M | 66,117 | .30 |
| Class C | 75,182 | .30 |
| Class I | 407,618 | .18 |
| Class Z | 16,102 | .05 |
| | $739,692 | |
(a) Annualized
Accounting and Security Lending Fees. Fidelity Service Company, Inc. (FSC), an affiliate of the investment adviser, maintains the Fund's accounting records. The accounting fee is based on the level of average net assets for each month. Prior to April 1, 2019, FSC had a separate agreement with the Fund for administration of the security lending program, based on the number and duration of lending transactions. For the period, the total fees paid for accounting and administration of securities lending were equivalent to an annualized rate of .05%.
Brokerage Commissions. The Fund placed a portion of its portfolio transactions with brokerage firms which are affiliates of the investment adviser. Brokerage commissions are included in net realized gain (loss) and change in net unrealized appreciation (depreciation) in the Statement of Operations. The commissions paid to these affiliated firms were $2,235 for the period.
Interfund Lending Program. Pursuant to an Exemptive Order issued by the SEC, the Fund, along with other registered investment companies having management contracts with Fidelity Management & Research Company (FMR) or other affiliated entities of FMR, may participate in an interfund lending program. This program provides an alternative credit facility allowing the funds to borrow from, or lend money to, other participating affiliated funds. At period end, there were no interfund loans outstanding. The Fund's activity in this program during the period for which loans were outstanding was as follows:
| Borrower or Lender | Average Loan Balance | Weighted Average Interest Rate | Interest Expense |
| Borrower | $6,243,429 | 2.50% | $9,097 |
Interfund Trades. The Fund may purchase from or sell securities to other Fidelity Funds under procedures adopted by the Board. The procedures have been designed to ensure these interfund trades are executed in accordance with Rule 17a-7 of the 1940 Act. Interfund trades are included within the respective purchases and sales amounts shown in the Purchases and Sales of Investments note.
6. Committed Line of Credit.
The Fund participates with other funds managed by the investment adviser or an affiliate in a $4.25 billion credit facility (the "line of credit") to be utilized for temporary or emergency purposes to fund shareholder redemptions or for other short-term liquidity purposes. The Fund has agreed to pay commitment fees on its pro-rata portion of the line of credit, which amounted to $1,027 and is reflected in Miscellaneous expenses on the Statement of Operations. During the period, the Fund did not borrow on this line of credit.
7. Security Lending.
The Fund lends portfolio securities through a lending agent from time to time in order to earn additional income. For equity securities, a lending agent is used and may loan securities to certain qualified borrowers, including Fidelity Capital Markets (FCM), a broker-dealer affiliated with the Fund. On the settlement date of the loan, the Fund receives collateral (in the form of U.S. Treasury obligations, letters of credit and/or cash) against the loaned securities and maintains collateral in an amount not less than 100% of the market value of the loaned securities during the period of the loan. The market value of the loaned securities is determined at the close of business of the Fund and any additional required collateral is delivered to the Fund on the next business day. The Fund or borrower may terminate the loan at any time, and if the borrower defaults on its obligation to return the securities loaned because of insolvency or other reasons, the Fund may apply collateral received from the borrower against the obligation. The Fund may experience delays and costs in recovering the securities loaned. Any cash collateral received is invested in the Fidelity Securities Lending Cash Central Fund. The value of loaned securities and cash collateral at period end are disclosed on the Fund's Statement of Assets and Liabilities. At period end, there were no security loans outstanding with FCM. Security lending income represents the income earned on investing cash collateral, less rebates paid to borrowers and any lending agent fees associated with the loan, plus any premium payments received for lending certain types of securities. Security lending income is presented in the Statement of Operations as a component of income from Fidelity Central Funds and includes $1,616 from securities loaned to FCM.
8. Bank Borrowings.
The Fund is permitted to have bank borrowings for temporary or emergency purposes to fund shareholder redemptions or for other short-term liquidity requirements. The Fund has established borrowing arrangements with certain banks. The interest rate on the borrowings is the bank's base rate, as revised from time to time. The average loan balance during the period for which loans were outstanding amounted to $5,894,000. The weighted average interest rate was 2.90%. The interest expense amounted to $475 under the bank borrowing program. At period end, there were no bank borrowings outstanding.
9. Expense Reductions.
Commissions paid to certain brokers with whom the investment adviser, or its affiliates, places trades on behalf of the Fund include an amount in addition to trade execution, which may be rebated back to the Fund to offset certain expenses. This amount totaled $129,516 for the period.
In addition, during the period the investment adviser reimbursed and/or waived a portion of fund-level operating expenses in the amount of $2,673.
10. Distributions to Shareholders.
Distributions to shareholders of each class were as follows:
| | Six months ended
April 30, 2019 | Year ended
October 31, 2018 |
| Distributions to shareholders | | |
| Class A | $200,330 | $422,265 |
| Class M | – | 43,443 |
| Class I | 2,385,812 | 1,940,128 |
| Class Z | 523,288 | 106,088 |
| Total | $3,109,430 | $2,511,924 |
11. Share Transactions.
Share transactions for each class were as follows and may contain automatic conversions between classes or exchanges between affiliated funds:
| | Shares | Shares | Dollars | Dollars |
| | Six months ended April 30, 2019 | Year ended October 31, 2018 | Six months ended April 30, 2019 | Year ended October 31, 2018 |
| Class A | | | | |
| Shares sold | 952,059 | 1,818,267 | $25,587,412 | $54,273,489 |
| Reinvestment of distributions | 7,863 | 14,191 | 195,072 | 413,945 |
| Shares redeemed | (615,449) | (1,835,818) | (16,148,771) | (52,952,761) |
| Net increase (decrease) | 344,473 | (3,360) | $9,633,713 | $1,734,673 |
| Class M | | | | |
| Shares sold | 179,938 | 368,577 | $4,792,755 | $10,833,460 |
| Reinvestment of distributions | – | 1,470 | – | 42,562 |
| Shares redeemed | (160,596) | (567,779) | (4,190,851) | (16,368,292) |
| Net increase (decrease) | 19,342 | (197,732) | $601,904 | $(5,492,270) |
| Class C | | | | |
| Shares sold | 262,171 | 802,559 | $6,630,747 | $22,631,257 |
| Shares redeemed | (744,511) | (716,551) | (19,160,045) | (19,774,590) |
| Net increase (decrease) | (482,340) | 86,008 | $(12,529,298) | $2,856,667 |
| Class I | | | | |
| Shares sold | 4,750,454 | 11,185,060 | $126,440,674 | $325,175,327 |
| Reinvestment of distributions | 90,581 | 64,636 | 2,253,643 | 1,892,548 |
| Shares redeemed | (3,612,066) | (6,959,175) | (96,483,646) | (201,129,363) |
| Net increase (decrease) | 1,228,969 | 4,290,521 | $32,210,671 | $125,938,512 |
| Class Z | | | | |
| Shares sold | 1,336,549 | 3,269,160 | $35,653,063 | $93,628,959 |
| Reinvestment of distributions | 15,348 | 3,332 | 381,247 | 97,427 |
| Shares redeemed | (1,093,509) | (1,112,760) | (27,810,188) | (30,680,942) |
| Net increase (decrease) | 258,388 | 2,159,732 | $8,224,122 | $63,045,444 |
12. Other.
The Fund's organizational documents provide former and current trustees and officers with a limited indemnification against liabilities arising in connection with the performance of their duties to the Fund. In the normal course of business, the Fund may also enter into contracts that provide general indemnifications. The Fund's maximum exposure under these arrangements is unknown as this would be dependent on future claims that may be made against the Fund. The risk of material loss from such claims is considered remote.
Shareholder Expense Example
As a shareholder of the Fund, you incur two types of costs: (1) transaction costs, including sales charges (loads) on purchase payments or redemption proceeds, and (2) ongoing costs, including management fees, distribution and/or service (12b-1) fees and other Fund expenses. This Example is intended to help you understand your ongoing costs (in dollars) of investing in the Fund and to compare these costs with the ongoing costs of investing in other mutual funds.
The Example is based on an investment of $1,000 invested at the beginning of the period and held for the entire period (November 1, 2018 to April 30, 2019).
Actual Expenses
The first line of the accompanying table for each class of the Fund provides information about actual account values and actual expenses. You may use the information in this line, together with the amount you invested, to estimate the expenses that you paid over the period. Simply divide your account value by $1,000.00 (for example, an $8,600 account value divided by $1,000.00 = 8.6), then multiply the result by the number in the first line for a class of the Fund under the heading entitled "Expenses Paid During Period" to estimate the expenses you paid on your account during this period. In addition, the Fund, as a shareholder in the underlying Fidelity Central Funds, will indirectly bear its pro-rata share of the fees and expenses incurred by the underlying Fidelity Central Funds. These fees and expenses are not included in the Fund's annualized expense ratio used to calculate the expense estimate in the table below.
Hypothetical Example for Comparison Purposes
The second line of the accompanying table for each class of the Fund provides information about hypothetical account values and hypothetical expenses based on a Class' actual expense ratio and an assumed rate of return of 5% per year before expenses, which is not the Class' actual return. The hypothetical account values and expenses may not be used to estimate the actual ending account balance or expenses you paid for the period. You may use this information to compare the ongoing costs of investing in the Fund and other funds. To do so, compare this 5% hypothetical example with the 5% hypothetical examples that appear in the shareholder reports of the other funds. In addition, the Fund, as a shareholder in the underlying Fidelity Central Funds, will indirectly bear its pro-rata share of the fees and expenses incurred by the underlying Fidelity Central Funds. These fees and expenses are not included in the Fund's annualized expense ratio used to calculate the expense estimate in the table below.
Please note that the expenses shown in the table are meant to highlight your ongoing costs only and do not reflect any transaction costs. Therefore, the second line of the table is useful in comparing ongoing costs only, and will not help you determine the relative total costs of owning different funds. In addition, if these transactional costs were included, your costs would have been higher.
| | Annualized Expense Ratio-A | Beginning
Account Value
November 1, 2018 | Ending
Account Value
April 30, 2019 | Expenses Paid
During Period-B
November 1, 2018
to April 30, 2019 |
| Class A | 1.44% | | | |
| Actual | | $1,000.00 | $1,200.50 | $7.86 |
| Hypothetical-C | | $1,000.00 | $1,017.65 | $7.20 |
| Class M | 1.73% | | | |
| Actual | | $1,000.00 | $1,198.80 | $9.43 |
| Hypothetical-C | | $1,000.00 | $1,016.22 | $8.65 |
| Class C | 2.23% | | | |
| Actual | | $1,000.00 | $1,195.90 | $12.14 |
| Hypothetical-C | | $1,000.00 | $1,013.74 | $11.13 |
| Class I | 1.11% | | | |
| Actual | | $1,000.00 | $1,202.40 | $6.06 |
| Hypothetical-C | | $1,000.00 | $1,019.29 | $5.56 |
| Class Z | .98% | | | |
| Actual | | $1,000.00 | $1,203.10 | $5.35 |
| Hypothetical-C | | $1,000.00 | $1,019.93 | $4.91 |
A Annualized expense ratio reflects expenses net of applicable fee waivers.
B Expenses are equal to each Class' annualized expense ratio, multiplied by the average account value over the period, multiplied by 181/365 (to reflect the one-half year period).
C 5% return per year before expenses
Board Approval of Investment Advisory Contracts and Management Fees
Fidelity Advisor Emerging Markets Fund
Each year, the Board of Trustees, including the Independent Trustees (together, the Board), votes on the renewal of the management contract with Fidelity Management & Research Company (FMR) and the sub-advisory agreements (together, the Advisory Contracts) for the fund. FMR and the sub-advisers are referred to herein as the Investment Advisers. The Board, assisted by the advice of fund counsel and Independent Trustees' counsel, requests and considers a broad range of information relevant to the renewal of the Advisory Contracts throughout the year.
The Board meets regularly and, at each of its meetings, covers an extensive agenda of topics and materials and considers factors that are relevant to its annual consideration of the renewal of the fund's Advisory Contracts, including the services and support provided to the fund and its shareholders. The Board has established various standing committees (Committees), each composed of and chaired by Independent Trustees with varying backgrounds, to which the Board has assigned specific subject matter responsibilities in order to enhance effective decision-making by the Board. The Board, acting directly and through its Committees, requests and receives information concerning the annual consideration of the renewal of the fund's Advisory Contracts. The Board also meets as needed to review matters specifically related to the Board's annual consideration of the renewal of the Advisory Contracts. Members of the Board may also meet with trustees of other Fidelity funds through joint ad hoc committees to discuss certain matters relevant to all of the Fidelity funds.
At its January 2019 meeting, the Board unanimously determined to renew the fund's Advisory Contracts. In reaching its determination, the Board considered all factors it believed relevant, including (i) the nature, extent, and quality of the services to be provided to the fund and its shareholders (including the investment performance of the fund); (ii) the competitiveness of the fund's management fee and total expense ratio relative to peer funds; (iii) the total costs of the services to be provided by and the profits to be realized by Fidelity from its relationships with the fund; and (iv) the extent to which, if any, economies of scale exist and would be realized as the fund grows, and whether any economies of scale are appropriately shared with fund shareholders.
In considering whether to renew the Advisory Contracts for the fund, the Board reached a determination, with the assistance of fund counsel and Independent Trustees' counsel and through the exercise of its business judgment, that the renewal of the Advisory Contracts was in the best interests of the fund and its shareholders and that the compensation payable under the Advisory Contracts was fair and reasonable. The Board's decision to renew the Advisory Contracts was not based on any single factor, but rather was based on a comprehensive consideration of all the information provided to the Board at its meetings throughout the year. The Board, in reaching its determination to renew the Advisory Contracts, was aware that shareholders of the fund have a broad range of investment choices available to them, including a wide choice among funds offered by Fidelity's competitors, and that the fund's shareholders, who have the opportunity to review and weigh the disclosure provided by the fund in its prospectus and other public disclosures, have chosen to invest in this fund, which is part of the Fidelity family of funds.
Nature, Extent, and Quality of Services Provided. The Board considered Fidelity's staffing as it relates to the fund, including the backgrounds of investment personnel of Fidelity, and also considered the fund's investment objective, strategies, and related investment philosophy. The Independent Trustees also had discussions with senior management of Fidelity's investment operations and investment groups. The Board considered the structure of the investment personnel compensation program and whether this structure provides appropriate incentives to act in the best interests of the fund. Additionally, the Board considered the portfolio managers' investments, if any, in the funds that they manage.
Resources Dedicated to Investment Management and Support Services. The Board and the Fund Oversight and Research Committees reviewed the general qualifications and capabilities of Fidelity's investment staff, including its size, education, experience, and resources, as well as Fidelity's approach to recruiting, training, managing, and compensating investment personnel. The Board noted that Fidelity has continued to increase the resources devoted to non-U.S. offices, including expansion of Fidelity's global investment organization. The Board also noted that Fidelity's analysts have extensive resources, tools and capabilities that allow them to conduct sophisticated quantitative and fundamental analysis, as well as credit analysis of issuers, counterparties and guarantors. Further, the Board considered that Fidelity's investment professionals have sufficient access to global information and data so as to provide competitive investment results over time, and that those professionals also have access to sophisticated tools that permit them to assess portfolio construction and risk and performance attribution characteristics continuously, as well as to transmit new information and research conclusions rapidly around the world. Additionally, in its deliberations, the Board considered Fidelity's trading, risk management, compliance, and technology and operations capabilities and resources, which are integral parts of the investment management process.
Shareholder and Administrative Services. The Board considered (i) the nature, extent, quality, and cost of advisory, administrative, and shareholder services performed by the Investment Advisers and their affiliates under the Advisory Contracts and under separate agreements covering transfer agency, pricing and bookkeeping, and securities lending services for the fund; (ii) the nature and extent of the supervision of third party service providers, principally custodians, subcustodians, and pricing vendors; and (iii) the resources devoted to, and the record of compliance with, the fund's compliance policies and procedures. The Board also reviewed the allocation of fund brokerage, including allocations to brokers affiliated with the Investment Advisers, the use of brokerage commissions to pay fund expenses, and the use of "soft" commission dollars to pay for research services.
The Board noted that the growth of fund assets over time across the complex allows Fidelity to reinvest in the development of services designed to enhance the value and convenience of the Fidelity funds as investment vehicles. These services include 24-hour access to account information and market information through telephone representatives and over the Internet, investor education materials and asset allocation tools, and the expanded availability of Fidelity Investor Centers.
The Board noted that it and the boards of certain other Fidelity funds had formed an ad hoc Committee on Transfer Agency Fees to review the variety of transfer agency fee structures throughout the industry and Fidelity's competitive positioning with respect to industry participants.
Investment in a Large Fund Family. The Board considered the benefits to shareholders of investing in a Fidelity fund, including the benefits of investing in a fund that is part of a large family of funds offering a variety of investment disciplines and providing a large variety of mutual fund investor services. The Board noted that Fidelity had taken, or had made recommendations that resulted in the Fidelity funds taking, a number of actions over the previous year that benefited particular funds, including: (i) continuing to dedicate additional resources to Fidelity's investment research process, which includes meetings with management of issuers of securities in which the funds invest, and to the support of the senior management team that oversees asset management; (ii) continuing efforts to enhance Fidelity's global research capabilities; (iii) launching new funds and making other enhancements to meet client needs; (iv) launching new share classes of existing funds; (v) eliminating purchase minimums and broadening eligibility requirements for certain funds and share classes; (vi) reducing management fees and total expenses for certain growth equity funds and index funds; (vii) lowering expense caps for certain existing funds and classes, and converting certain voluntary expense caps to contractual caps, to reduce expenses borne by shareholders; (viii) eliminating short-term redemption fees for funds that had such fees; (ix) rationalizing product lines and gaining increased efficiencies from fund mergers and share class consolidations; (x) continuing to develop, acquire and implement systems and technology to improve services to the funds and shareholders, strengthen information security, and increase efficiency; and (xi) continuing to implement enhancements to further strengthen Fidelity's product line to increase investors' probability of success in achieving their investment goals, including retirement income goals.
Investment Performance. The Board considered whether the fund has operated in accordance with its investment objective, as well as its record of compliance with its investment restrictions and its performance history.
The Board took into account discussions that occur at Board meetings throughout the year with representatives of the Investment Advisers about fund investment performance. In this regard the Board noted that as part of regularly scheduled fund reviews and other reports to the Board on fund performance, the Board considers annualized return information for the fund for different time periods, measured against an appropriate securities market index ("benchmark index") and a peer group of funds with similar objectives ("peer group"), if any. In its evaluation of fund investment performance, the Board gave particular attention to information indicating changes in performance of certain Fidelity funds for specific time periods and discussed with the Investment Advisers the reasons for any overperformance or underperformance.
In addition to reviewing absolute and relative fund performance, the Independent Trustees periodically consider the appropriateness of fund performance metrics in evaluating the results achieved. In general, the Independent Trustees believe that fund performance should be evaluated based on net performance (after fees and expenses) of both the highest performing and lowest performing fund share classes, where applicable, compared to appropriate benchmark indices, over appropriate time periods that may include full market cycles, and compared to peer groups, as applicable, over the same periods, taking into account relevant factors including the following: general market conditions; issuer-specific information; and fund cash flows and other factors.
The Independent Trustees recognize that shareholders evaluate performance on a net basis over their own holding periods, for which one-, three-, and five-year periods are often used as a proxy. For this reason, the performance information reviewed by the Board also included net cumulative total return information for the fund and an appropriate benchmark index and peer group for the most recent one-, three-, and five-year periods ended June 30, 2018, as shown below. Returns are shown compared to the 25th percentile (top of box, 75% beaten) and 75th percentile (bottom of box, 25% beaten) of the peer universe.
Fidelity Advisor Emerging Markets Fund
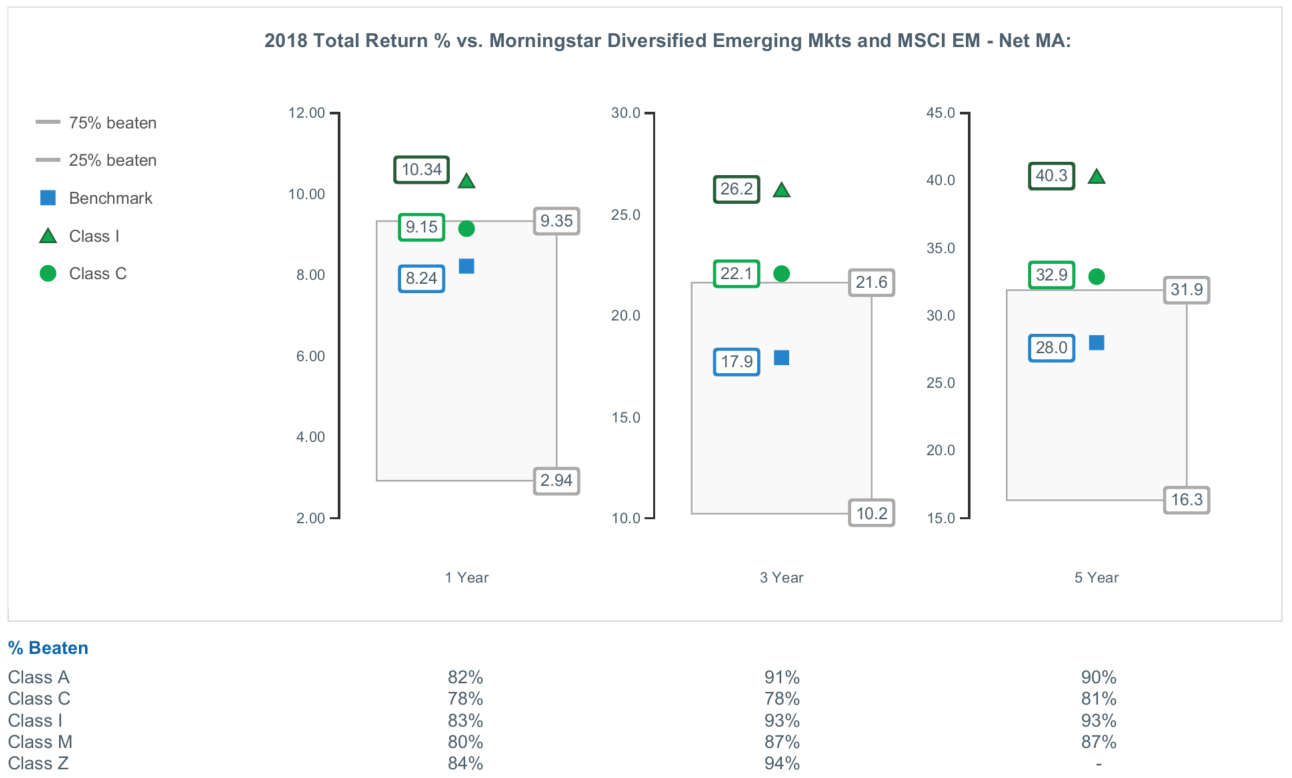
Based on its review, the Board concluded that the nature, extent, and quality of services provided to the fund under the Advisory Contracts should continue to benefit the shareholders of the fund.
Competitiveness of Management Fee and Total Expense Ratio. The Board considered the fund's management fee and total expense ratio compared to "mapped groups" of competitive funds and classes created for the purpose of facilitating the Trustees' competitive analysis of management fees and total expenses. Fidelity creates "mapped groups" by combining similar Lipper investment objective categories that have comparable investment mandates. Combining Lipper investment objective categories aids the Board's management fee and total expense ratio comparisons by broadening the competitive group used for comparison.
Management Fee. The Board considered two proprietary management fee comparisons for the 12-month periods (ended June 30 for 2018 and December 31 for prior periods) shown in basis points (BP) in the chart below. The group of Lipper funds used by the Board for management fee comparisons is referred to below as the "Total Mapped Group." The Total Mapped Group comparison focuses on a fund's standing in terms of gross management fees before expense reimbursements or caps relative to the total universe of funds with comparable investment mandates, regardless of whether their management fee structures also are comparable. Funds with comparable investment mandates offer exposure to similar types of securities. Funds with comparable management fee structures have similar management fee contractual arrangements (
e.g., flat rate charged for advisory services, all-inclusive fee rate,
etc.). "TMG %" represents the percentage of funds in the Total Mapped Group that had management fees that were lower than the fund's. For example, a hypothetical TMG % of 20% would mean that 80% of the funds in the Total Mapped Group had higher, and 20% had lower, management fees than the fund. The fund's actual TMG %s and the number of funds in the Total Mapped Group are in the chart below. The "Asset-Size Peer Group" (ASPG) comparison focuses on a fund's standing relative to a subset of non-Fidelity funds within the Total Mapped Group that are similar in size and management fee structure. For example, if a fund is in the first quartile of the ASPG, the fund's management fee ranks in the least expensive or lowest 25% of funds in the ASPG. The ASPG represents at least 15% of the funds in the Total Mapped Group with comparable asset size and management fee structures, subject to a minimum of 50 funds (or all funds in the Total Mapped Group if fewer than 50). Additional information, such as the ASPG quartile in which the fund's management fee rate ranked, is also included in the chart and was considered by the Board.
Fidelity Advisor Emerging Markets Fund
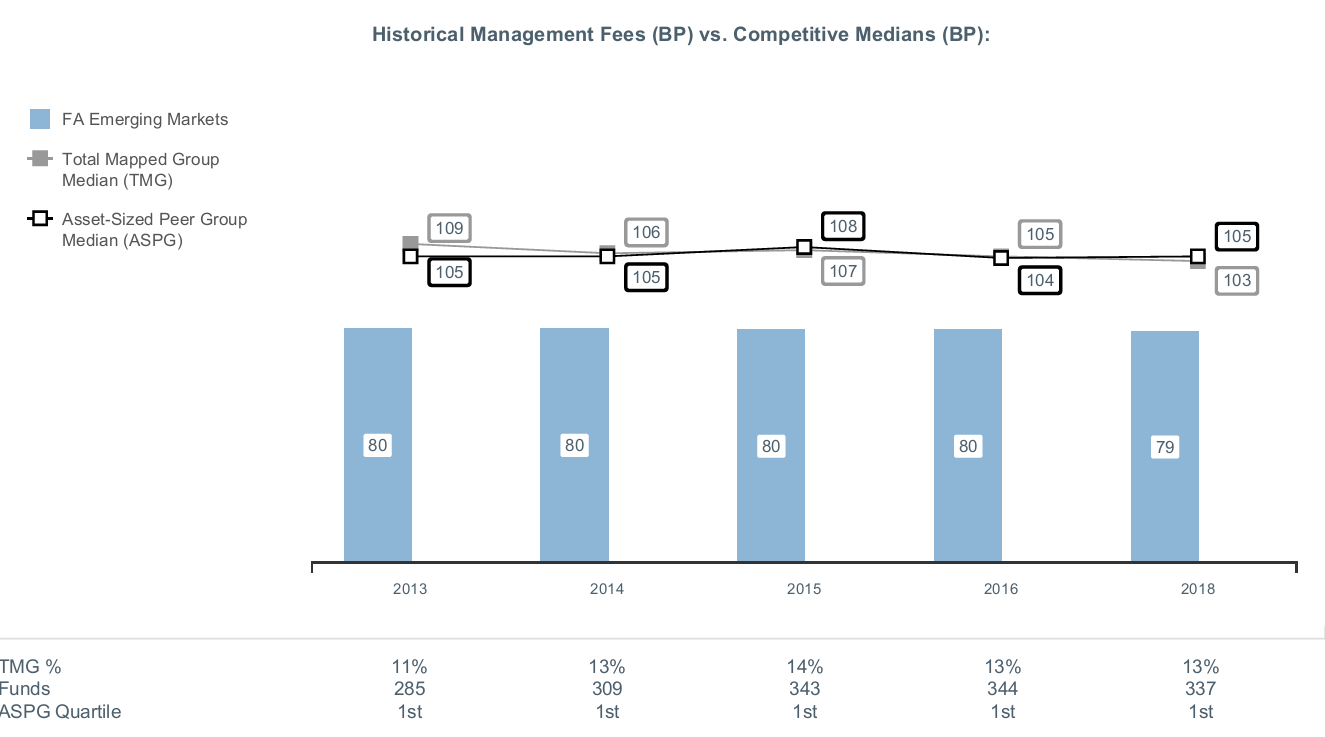
The Board noted that the fund's management fee rate ranked below the median of its Total Mapped Group and below the median of its ASPG for the 12-month period ended June 30, 2018.
The Board noted that it and the boards of other Fidelity funds formed an ad hoc Committee on Group Fee, which meets periodically, to conduct an in-depth review of the "group fee" component of the management fee of funds with such management fee structures. The Committee's focus included the mechanics of the group fee, the competitive landscape of group fee structures, Fidelity funds with no group fee component and investment products not included in group fee assets. The Board also considered that, for funds subject to the group fee, FMR agreed to voluntarily waive fees over a specified period of time in amounts designed to account for assets converted from certain funds to certain collective investment trusts.
The Board also noted that, in 2013, the ad hoc Committee on Management Fees was formed to conduct an in-depth review of the management fee rates of Fidelity's active equity mutual funds. The Committee focused on the following areas: (i) standard fee structures; (ii) research consumption and trading evolution; (iii) management fee competitiveness/profitability by category; and (iv) factors that drive institutional pricing.
Based on its review, the Board concluded that the fund's management fee is fair and reasonable in light of the services that the fund receives and the other factors considered.
Total Expense Ratio. In its review of each class's total expense ratio, the Board considered the fund's management fee rate as well as other fund or class expenses, as applicable, such as transfer agent fees, pricing and bookkeeping fees, fund-paid 12b-1 fees, and custodial, legal, and audit fees. The Board also noted that Fidelity may agree to waive fees and expenses from time to time, and the extent to which, if any, it has done so for the fund. As part of its review, the Board also considered the current and historical total expense ratios of each class of the fund compared to competitive fund median expenses. Each class of the fund is compared to those funds and classes in the Total Mapped Group (used by the Board for management fee comparisons) that have a similar sales load structure.
The Board noted that the total expense ratio of each of Class A, Class I, and Class Z ranked below the competitive median for the 12-month period ended June 30, 2018, the total expense ratio of Class C ranked equal to the competitive median for the 12-month period ended June 30, 2018, and the total expense ratio of Class M ranked above the competitive median for the 12-month period ended June 30, 2018. The Board considered that, in general, various factors can affect total expense ratios. The Board noted that the total expense ratio of Class M was above the competitive median primarily because of higher 12b-1 fees on Class M as compared to most competitor funds. Class M has a higher 12b-1 fee, but a lower front-end sales charge, than traditionally priced front-end sales charge classes. The Board considered that Class M is primarily sold load-waived to retirement plans and intermediary wrap programs where its 0.50% 12b-1 fee is comparable to competing no-load, higher 12b-1 fee classes designed specifically for retirement plans and wrap programs. The Board noted that, when compared with competitor funds that charge a 0.50% 12b-1 fee, the total expense ratio of Class M is below median. The Board noted that the fund offers multiple classes, each of which has a different sales load and 12b-1 fee structure, and that the multiple structures are intended to offer a range of pricing options for the intermediary market. The Board also noted that the total expense ratios of the classes vary primarily by the level of their 12b-1 fees, although differences in transfer agent fees may also cause expenses to vary from class to class.
Fees Charged to Other Fidelity Clients. The Board also considered Fidelity fee structures and other information with respect to clients of Fidelity, such as other funds advised or subadvised by Fidelity, pension plan clients, and other institutional clients with similar mandates. The Board noted that a joint ad hoc committee created by it and the boards of other Fidelity funds periodically reviews and compares Fidelity's institutional investment advisory business with its business of providing services to the Fidelity funds and also noted the most recent findings of the committee. The Board noted that the committee's review included a consideration of the differences in services provided, fees charged, and costs incurred, as well as competition in the markets serving the different categories of clients.
Based on its review of total expense ratios and fees charged to other Fidelity clients, the Board concluded that the total expense ratio of each class of the fund was reasonable in light of the services that the fund and its shareholders receive and the other factors considered.
Costs of the Services and Profitability. The Board considered the revenues earned and the expenses incurred by Fidelity in conducting the business of developing, marketing, distributing, managing, administering and servicing the fund and servicing the fund's shareholders. The Board also considered the level of Fidelity's profits in respect of all the Fidelity funds.
On an annual basis, Fidelity presents to the Board information about the profitability of its relationships with the fund. Fidelity calculates profitability information for each fund, as well as aggregate profitability information for groups of Fidelity funds and all Fidelity funds, using a series of detailed revenue and cost allocation methodologies which originate with the books and records of Fidelity on which Fidelity's audited financial statements are based. The Audit Committee of the Board reviews any significant changes from the prior year's methodologies.
PricewaterhouseCoopers LLP (PwC), auditor to Fidelity and certain Fidelity funds, has been engaged annually by the Board as part of the Board's assessment of Fidelity's profitability analysis. PwC's engagement includes the review and assessment of the methodologies used by Fidelity in determining the revenues and expenses attributable to Fidelity's mutual fund business, and completion of agreed-upon procedures in respect of the mathematical accuracy of the fund profitability information and its conformity to established allocation methodologies. After considering PwC's reports issued under the engagement and information provided by Fidelity, the Board concluded that while other allocation methods may also be reasonable, Fidelity's profitability methodologies are reasonable in all material respects.
The Board also reviewed Fidelity's non-fund businesses and potential indirect benefits such businesses may have received as a result of their association with Fidelity's mutual fund business (i.e., fall-out benefits) as well as cases where Fidelity's affiliates may benefit from the fund's business. The Board noted that changes to fall-out benefits year-over-year reflect business developments at Fidelity's various businesses.
The Board considered the costs of the services provided by and the profits realized by Fidelity in connection with the operation of the fund and was satisfied that the profitability was not excessive.
Economies of Scale. The Board considered whether there have been economies of scale in respect of the management of the Fidelity funds, whether the Fidelity funds (including the fund) have appropriately benefited from any such economies of scale, and whether there is potential for realization of any further economies of scale. The Board considered the extent to which the fund will benefit from economies of scale as assets grow through increased services to the fund, through waivers or reimbursements, or through fee or expense ratio reductions. The Board also noted that a committee (the Economies of Scale Committee) created by it and the boards of other Fidelity funds periodically analyzes whether Fidelity attains economies of scale in respect of the management and servicing of the Fidelity funds, whether the Fidelity funds have appropriately benefited from such economies of scale, and whether there is potential for realization of any further economies of scale.
The Board recognized that the fund's management contract incorporates a "group fee" structure, which provides for lower group fee rates as total group assets increase, and for higher group fee rates as total group assets decrease (with "group assets" defined to include fund assets under FMR's management plus the assets of sector funds previously under FMR's management). FMR calculates the group fee rates based on a tiered asset "breakpoint" schedule that varies based on asset class. The Board considered that the group fee is designed to deliver the benefits of economies of scale to fund shareholders when total Fidelity fund assets increase, even if assets of any particular fund are unchanged or have declined, because some portion of Fidelity's costs are attributable to services provided to all Fidelity funds, and all funds benefit if those costs can be allocated among more assets. The Board concluded that, given the group fee structure, fund shareholders will benefit from lower management fees as group assets increase at the fund complex level, regardless of whether Fidelity achieves any such economies of scale.
The Board concluded, taking into account the analysis of the Economies of Scale Committee, that economies of scale, if any, are being appropriately shared between fund shareholders and Fidelity.
Additional Information Requested by the Board. In order to develop fully the factual basis for consideration of the Fidelity funds' advisory contracts, the Board requested and received additional information on certain topics, including: (i) fund performance trends, in particular the underperformance of certain funds, and Fidelity's long-term strategies for certain funds; (ii) Fidelity's fund profitability methodology, profitability trends for certain funds, and the impact of certain factors on fund profitability results; (iii) metrics for evaluating index fund and ETF performance and information about ETF trading characteristics; (iv) the methodology with respect to the evaluation of competitive fund data and peer group classifications and fee comparisons; (v) the expense structures for different funds and classes; (vi) information regarding other accounts managed by Fidelity, including collective investment trusts; and (vii) Fidelity's philosophies and strategies for evaluating funds and classes with lower or declining asset levels.
Based on its evaluation of all of the conclusions noted above, and after considering all factors it believed relevant, the Board concluded that the advisory fee arrangements are fair and reasonable, and that the fund's Advisory Contracts should be renewed.
FAEM-SANN-0619
1.800638.115
Fidelity Advisor® Global Equity Income Fund
Semi-Annual Report April 30, 2019 |
|
Beginning on January 1, 2021, as permitted by regulations adopted by the Securities and Exchange Commission, paper copies of a fund’s shareholder reports will no longer be sent by mail, unless you specifically request paper copies of the reports from the fund or from your financial intermediary, such as a financial advisor, broker-dealer or bank. Instead, the reports will be made available on a website, and you will be notified by mail each time a report is posted and provided with a website link to access the report.
If you already elected to receive shareholder reports electronically, you will not be affected by this change and you need not take any action. You may elect to receive shareholder reports and other communications from a fund electronically, by contacting your financial intermediary. For Fidelity customers, visit Fidelity's web site or call Fidelity using the contact information listed below.
You may elect to receive all future reports in paper free of charge. If you wish to continue receiving paper copies of your shareholder reports, you may contact your financial intermediary or, if you are a Fidelity customer, visit Fidelity’s website, or call Fidelity at the applicable toll-free number listed below. Your election to receive reports in paper will apply to all funds held with the fund complex/your financial intermediary.
| Account Type | Website | Phone Number |
| Brokerage, Mutual Fund, or Annuity Contracts: | fidelity.com/mailpreferences | 1-800-343-3548 |
| Employer Provided Retirement Accounts: | netbenefits.fidelity.com/preferences (choose 'no' under Required Disclosures to continue to print) | 1-800-343-0860 |
| Advisor Sold Accounts Serviced Through Your Financial Intermediary: | Contact Your Financial Intermediary | Your Financial Intermediary's phone number |
| Advisor Sold Accounts Serviced by Fidelity: | institutional.fidelity.com | 1-877-208-0098 |
Contents
To view a fund's proxy voting guidelines and proxy voting record for the 12-month period ended June 30, visit http://www.fidelity.com/proxyvotingresults or visit the Securities and Exchange Commission's (SEC) web site at http://www.sec.gov.
You may also call 1-877-208-0098 to request a free copy of the proxy voting guidelines.
Standard & Poor's, S&P and S&P 500 are registered service marks of The McGraw-Hill Companies, Inc. and have been licensed for use by Fidelity Distributors Corporation.
Other third-party marks appearing herein are the property of their respective owners.
All other marks appearing herein are registered or unregistered trademarks or service marks of FMR LLC or an affiliated company. © 2019 FMR LLC. All rights reserved.
This report and the financial statements contained herein are submitted for the general information of the shareholders of the Fund. This report is not authorized for distribution to prospective investors in the Fund unless preceded or accompanied by an effective prospectus.
A fund files its complete schedule of portfolio holdings with the SEC for the first and third quarters of each fiscal year on Form N-PORT. Forms N-PORT are available on the SEC’s web site at http://www.sec.gov. A fund's Forms N-PORT may be reviewed and copied at the SEC’s Public Reference Room in Washington, DC. Information regarding the operation of the SEC's Public Reference Room may be obtained by calling 1-800-SEC-0330.
For a complete list of a fund's portfolio holdings, view the most recent holdings listing, semiannual report, or annual report on Fidelity's web site at http://www.fidelity.com, http://www.institutional.fidelity.com, or http://www.401k.com, as applicable.
NOT FDIC INSURED •MAY LOSE VALUE •NO BANK GUARANTEE
Neither the Fund nor Fidelity Distributors Corporation is a bank.
Investment Summary (Unaudited)
Top Five Stocks as of April 30, 2019
| | % of fund's net assets |
| Microsoft Corp. (United States of America, Software) | 3.8 |
| Apple, Inc. (United States of America, Technology Hardware, Storage & Peripherals) | 3.3 |
| American Tower Corp. (United States of America, Equity Real Estate Investment Trusts (REITs)) | 2.9 |
| Hoya Corp. (Japan, Health Care Equipment & Supplies) | 2.1 |
| JPMorgan Chase & Co. (United States of America, Banks) | 2.0 |
| | 14.1 |
Top Five Market Sectors as of April 30, 2019
| | % of fund's net assets |
| Financials | 18.8 |
| Information Technology | 14.5 |
| Health Care | 14.3 |
| Consumer Staples | 12.1 |
| Industrials | 10.2 |
Top Five Countries as of April 30, 2019
| (excluding cash equivalents) | % of fund's net assets |
| United States of America | 51.2 |
| United Kingdom | 8.7 |
| Japan | 7.2 |
| Switzerland | 4.4 |
| Canada | 4.3 |
Asset Allocation (% of fund's net assets)
| As of April 30, 2019 |
| | Stocks | 98.1% |
| | Short-Term Investments and Net Other Assets (Liabilities) | 1.9% |

Schedule of Investments April 30, 2019 (Unaudited)
Showing Percentage of Net Assets
| Common Stocks - 97.1% | | | |
| | | Shares | Value |
| Bailiwick of Guernsey - 0.2% | | | |
| Amdocs Ltd. | | 600 | $33,048 |
| Bailiwick of Jersey - 0.4% | | | |
| WPP PLC | | 5,207 | 64,972 |
| Belgium - 0.9% | | | |
| KBC Groep NV | | 2,111 | 156,315 |
| Bermuda - 0.8% | | | |
| Dairy Farm International Holdings Ltd. | | 1,100 | 8,613 |
| Hiscox Ltd. | | 3,196 | 69,765 |
| IHS Markit Ltd. (a) | | 1,259 | 72,090 |
|
| TOTAL BERMUDA | | | 150,468 |
|
| Brazil - 0.6% | | | |
| Equatorial Energia SA | | 2,500 | 52,345 |
| Ultrapar Participacoes SA | | 10,300 | 55,163 |
|
| TOTAL BRAZIL | | | 107,508 |
|
| Canada - 4.3% | | | |
| Alimentation Couche-Tard, Inc. Class B (sub. vtg.) | | 2,197 | 129,537 |
| Constellation Software, Inc. | | 344 | 303,525 |
| Fairfax Financial Holdings Ltd. (sub. vtg.) | | 93 | 44,350 |
| Imperial Oil Ltd. | | 3,635 | 105,601 |
| Suncor Energy, Inc. | | 5,785 | 190,775 |
|
| TOTAL CANADA | | | 773,788 |
|
| Cayman Islands - 1.0% | | | |
| Best Pacific International Holdings Ltd. | | 36,000 | 13,125 |
| SITC International Holdings Co. Ltd. | | 147,000 | 156,092 |
| Value Partners Group Ltd. | | 14,000 | 10,529 |
|
| TOTAL CAYMAN ISLANDS | | | 179,746 |
|
| China - 0.9% | | | |
| Kweichow Moutai Co. Ltd. (A Shares) | | 600 | 86,772 |
| Shanghai International Airport Co. Ltd. (A Shares) | | 8,034 | 84,254 |
|
| TOTAL CHINA | | | 171,026 |
|
| France - 2.2% | | | |
| Amundi SA (b) | | 855 | 61,422 |
| Elior SA (b) | | 3,838 | 53,120 |
| Sanofi SA | | 1,853 | 161,673 |
| VINCI SA | | 1,167 | 117,863 |
|
| TOTAL FRANCE | | | 394,078 |
|
| Germany - 2.0% | | | |
| Deutsche Post AG | | 1,797 | 62,465 |
| Hannover Reuck SE | | 550 | 82,909 |
| Linde PLC | | 476 | 85,635 |
| SAP SE | | 963 | 124,139 |
|
| TOTAL GERMANY | | | 355,148 |
|
| Hong Kong - 1.3% | | | |
| AIA Group Ltd. | | 13,400 | 137,208 |
| Techtronic Industries Co. Ltd. | | 13,500 | 97,574 |
|
| TOTAL HONG KONG | | | 234,782 |
|
| India - 1.2% | | | |
| HDFC Asset Management Co. Ltd. (b) | | 1,000 | 24,338 |
| HDFC Bank Ltd. sponsored ADR | | 500 | 57,325 |
| Housing Development Finance Corp. Ltd. | | 1,500 | 42,968 |
| Reliance Industries Ltd. | | 4,200 | 83,992 |
|
| TOTAL INDIA | | | 208,623 |
|
| Ireland - 1.2% | | | |
| Accenture PLC Class A | | 1,229 | 224,501 |
| Israel - 0.1% | | | |
| Ituran Location & Control Ltd. | | 281 | 10,332 |
| Japan - 7.2% | | | |
| Aucnet, Inc. | | 700 | 7,930 |
| Daiichikosho Co. Ltd. (c) | | 4,400 | 214,875 |
| Hoya Corp. | | 5,300 | 371,825 |
| Inaba Denki Sangyo Co. Ltd. | | 2,000 | 81,242 |
| Japan Meat Co. Ltd. | | 7,300 | 111,930 |
| Minebea Mitsumi, Inc. | | 5,900 | 104,340 |
| Mitani Shoji Co. Ltd. | | 1,100 | 57,372 |
| Nippon Telegraph & Telephone Corp. | | 2,200 | 91,539 |
| Nitori Holdings Co. Ltd. | | 400 | 47,578 |
| Sony Corp. | | 2,200 | 110,810 |
| Tsuruha Holdings, Inc. | | 1,000 | 85,013 |
|
| TOTAL JAPAN | | | 1,284,454 |
|
| Kenya - 0.6% | | | |
| Safaricom Ltd. | | 395,500 | 110,067 |
| Liberia - 0.6% | | | |
| Royal Caribbean Cruises Ltd. | | 834 | 100,864 |
| Luxembourg - 1.5% | | | |
| B&M European Value Retail SA | | 52,400 | 269,560 |
| Multi-National - 0.8% | | | |
| HKT Trust/HKT Ltd. unit | | 93,280 | 144,591 |
| Netherlands - 2.3% | | | |
| NXP Semiconductors NV | | 1,511 | 159,592 |
| Unilever NV (Certificaten Van Aandelen) (Bearer) | | 4,148 | 250,973 |
|
| TOTAL NETHERLANDS | | | 410,565 |
|
| Nigeria - 0.1% | | | |
| Guaranty Trust Bank PLC | | 158,600 | 14,508 |
| Norway - 0.5% | | | |
| Equinor ASA | | 4,149 | 92,551 |
| Sweden - 0.6% | | | |
| Indutrade AB | | 1,500 | 45,862 |
| Loomis AB (B Shares) | | 1,570 | 58,086 |
|
| TOTAL SWEDEN | | | 103,948 |
|
| Switzerland - 4.4% | | | |
| Alcon, Inc. (a) | | 300 | 17,460 |
| Banque Cantonale Vaudoise | | 120 | 94,686 |
| Chubb Ltd. | | 1,154 | 167,561 |
| Nestle SA (Reg. S) | | 2,531 | 243,679 |
| Roche Holding AG (participation certificate) | | 1,015 | 267,821 |
|
| TOTAL SWITZERLAND | | | 791,207 |
|
| Taiwan - 1.5% | | | |
| Taiwan Semiconductor Manufacturing Co. Ltd. | | 33,000 | 277,060 |
| United Kingdom - 8.7% | | | |
| AstraZeneca PLC sponsored ADR | | 5,355 | 201,669 |
| BP PLC | | 20,767 | 151,011 |
| British American Tobacco PLC (United Kingdom) | | 2,458 | 96,228 |
| Bunzl PLC | | 4,183 | 125,947 |
| Cineworld Group PLC | | 14,049 | 58,257 |
| Cranswick PLC | | 1,210 | 45,726 |
| Diageo PLC | | 3,000 | 126,473 |
| Hilton Food Group PLC | | 13,481 | 178,605 |
| Imperial Tobacco Group PLC | | 1,614 | 51,269 |
| Micro Focus International PLC | | 4,767 | 120,457 |
| Moneysupermarket.com Group PLC | | 14,901 | 70,670 |
| Nielsen Holdings PLC | | 1,136 | 29,002 |
| Reckitt Benckiser Group PLC | | 1,430 | 115,696 |
| St. James's Place Capital PLC | | 6,761 | 98,875 |
| Standard Life PLC | | 10,395 | 37,805 |
| Victrex PLC | | 1,500 | 47,570 |
|
| TOTAL UNITED KINGDOM | | | 1,555,260 |
|
| United States of America - 51.2% | | | |
| Altria Group, Inc. | | 2,961 | 160,871 |
| Ameren Corp. | | 2,019 | 146,923 |
| American Tower Corp. | | 2,619 | 511,491 |
| AMETEK, Inc. | | 2,964 | 261,336 |
| Amgen, Inc. | | 1,752 | 314,169 |
| Apple, Inc. | | 2,984 | 598,799 |
| Bank of America Corp. | | 9,292 | 284,149 |
| Becton, Dickinson & Co. | | 974 | 234,481 |
| Bristol-Myers Squibb Co. | | 2,810 | 130,468 |
| Capital One Financial Corp. | | 2,409 | 223,627 |
| Charter Communications, Inc. Class A (a) | | 250 | 92,798 |
| Chevron Corp. | | 2,129 | 255,608 |
| Cigna Corp. | | 400 | 63,536 |
| Citigroup, Inc. | | 1,356 | 95,869 |
| Comcast Corp. Class A | | 3,874 | 168,635 |
| ConocoPhillips Co. | | 2,867 | 180,965 |
| Danaher Corp. | | 998 | 132,175 |
| Diamond Hill Investment Group, Inc. | | 265 | 38,287 |
| Dow, Inc. (a) | | 939 | 53,269 |
| DowDuPont, Inc. | | 1,917 | 73,709 |
| Eli Lilly & Co. | | 889 | 104,049 |
| Equifax, Inc. | | 400 | 50,380 |
| Fortive Corp. | | 1,113 | 96,096 |
| General Dynamics Corp. | | 400 | 71,488 |
| General Electric Co. | | 11,324 | 115,165 |
| Huntington Bancshares, Inc. | | 1,600 | 22,272 |
| Interpublic Group of Companies, Inc. | | 2,834 | 65,182 |
| Johnson & Johnson | | 1,511 | 213,353 |
| JPMorgan Chase & Co. | | 3,105 | 360,335 |
| Lowe's Companies, Inc. | | 2,233 | 252,642 |
| M&T Bank Corp. | | 300 | 51,021 |
| Marsh & McLennan Companies, Inc. | | 600 | 56,574 |
| McCormick & Co., Inc. (non-vtg.) | | 200 | 30,794 |
| MetLife, Inc. | | 1,485 | 68,503 |
| Microsoft Corp. | | 5,269 | 688,135 |
| MSCI, Inc. | | 468 | 105,478 |
| NextEra Energy, Inc. | | 400 | 77,776 |
| Northrop Grumman Corp. | | 248 | 71,898 |
| NRG Energy, Inc. | | 2,230 | 91,809 |
| PepsiCo, Inc. | | 1,779 | 227,801 |
| Philip Morris International, Inc. | | 773 | 66,911 |
| Phillips 66 Co. | | 927 | 87,388 |
| PVH Corp. | | 300 | 38,697 |
| Qualcomm, Inc. | | 889 | 76,570 |
| S&P Global, Inc. | | 455 | 100,400 |
| SunTrust Banks, Inc. | | 3,282 | 214,905 |
| The J.M. Smucker Co. | | 927 | 113,678 |
| The Kraft Heinz Co. | | 1,100 | 36,564 |
| The Travelers Companies, Inc. | | 823 | 118,306 |
| The Walt Disney Co. | | 1,001 | 137,107 |
| U.S. Bancorp | | 2,254 | 120,183 |
| United Technologies Corp. | | 1,043 | 148,742 |
| UnitedHealth Group, Inc. | | 1,180 | 275,023 |
| Valero Energy Corp. | | 1,255 | 113,778 |
| Verizon Communications, Inc. | | 4,982 | 284,921 |
| Vistra Energy Corp. | | 2,000 | 54,500 |
| Wabtec Corp. | | 59 | 4,370 |
| WEC Energy Group, Inc. | | 700 | 54,901 |
| Wells Fargo & Co. | | 5,997 | 290,315 |
|
| TOTAL UNITED STATES OF AMERICA | | | 9,179,175 |
|
| TOTAL COMMON STOCKS | | | |
| (Cost $13,483,797) | | | 17,398,145 |
|
| Nonconvertible Preferred Stocks - 1.0% | | | |
| Brazil - 0.6% | | | |
| Itau Unibanco Holding SA | | 12,700 | 109,572 |
| Spain - 0.4% | | | |
| Grifols SA Class B | | 3,300 | 63,529 |
| TOTAL NONCONVERTIBLE PREFERRED STOCKS | | | |
| (Cost $171,238) | | | 173,101 |
| | | Principal Amount | Value |
|
| Nonconvertible Bonds - 0.0% | | | |
| Canada - 0.0% | | | |
| Constellation Software, Inc. Canada Consumer Price Index + 6.500% 8.8% 3/31/40 (d)(e) | | | |
| (Cost $429) | | CAD 500 | 476 |
| | | Shares | Value |
|
| Money Market Funds - 1.6% | | | |
| Fidelity Cash Central Fund, 2.49% (f) | | | |
| (Cost $296,535) | | 296,476 | 296,535 |
| TOTAL INVESTMENT IN SECURITIES - 99.7% | | | |
| (Cost $13,951,999) | | | 17,868,257 |
| NET OTHER ASSETS (LIABILITIES) - 0.3% | | | 46,876 |
| NET ASSETS - 100% | | | $17,915,133 |
Currency Abbreviations
CAD – Canadian dollar
Categorizations in the Schedule of Investments are based on country or territory of incorporation.
Legend
(a) Non-income producing
(b) Security exempt from registration under Rule 144A of the Securities Act of 1933. These securities may be resold in transactions exempt from registration, normally to qualified institutional buyers. At the end of the period, the value of these securities amounted to $138,880 or 0.8% of net assets.
(c) A portion of the security sold on a delayed delivery basis.
(d) Coupon rates for floating and adjustable rate securities reflect the rates in effect at period end.
(e) Coupon is indexed to a floating interest rate which may be multiplied by a specified factor and/or subject to caps or floors.
(f) Affiliated fund that is generally available only to investment companies and other accounts managed by Fidelity Investments. The rate quoted is the annualized seven-day yield of the fund at period end. A complete unaudited listing of the fund's holdings as of its most recent quarter end is available upon request. In addition, each Fidelity Central Fund's financial statements are available on the SEC's website or upon request.
Affiliated Central Funds
Information regarding fiscal year to date income earned by the Fund from investments in Fidelity Central Funds is as follows:
| Fund | Income earned |
| Fidelity Cash Central Fund | $5,585 |
| Total | $5,585 |
Amounts in the income column in the above table include any capital gain distributions from underlying funds, which are presented in the corresponding line-item in the Statement of Operations, if applicable.
Investment Valuation
The following is a summary of the inputs used, as of April 30, 2019, involving the Fund's assets and liabilities carried at fair value. The inputs or methodology used for valuing securities may not be an indication of the risk associated with investing in those securities. For more information on valuation inputs, and their aggregation into the levels used below, please refer to the Investment Valuation section in the accompanying Notes to Financial Statements.
| | Valuation Inputs at Reporting Date: |
| Description | Total | Level 1 | Level 2 | Level 3 |
| Investments in Securities: | | | | |
| Equities: | | | | |
| Communication Services | $1,432,944 | $1,276,433 | $156,511 | $-- |
| Consumer Discretionary | 1,062,570 | 951,760 | 110,810 | -- |
| Consumer Staples | 2,167,133 | 1,334,084 | 833,049 | -- |
| Energy | 1,316,832 | 1,165,821 | 151,011 | -- |
| Financials | 3,360,360 | 3,223,152 | 137,208 | -- |
| Health Care | 2,551,231 | 2,058,208 | 493,023 | -- |
| Industrials | 1,814,090 | 1,529,814 | 284,276 | -- |
| Information Technology | 2,616,158 | 2,214,959 | 401,199 | -- |
| Materials | 260,183 | 260,183 | -- | -- |
| Real Estate | 511,491 | 511,491 | -- | -- |
| Utilities | 478,254 | 478,254 | -- | -- |
| Corporate Bonds | 476 | -- | 476 | -- |
| Money Market Funds | 296,535 | 296,535 | -- | -- |
| Total Investments in Securities: | $17,868,257 | $15,300,694 | $2,567,563 | $-- |
See accompanying notes which are an integral part of the financial statements.
Financial Statements
Statement of Assets and Liabilities
| | | April 30, 2019 (Unaudited) |
| Assets | | |
Investment in securities, at value — See accompanying schedule:
Unaffiliated issuers (cost $13,655,464) | $17,571,722 | |
| Fidelity Central Funds (cost $296,535) | 296,535 | |
| Total Investment in Securities (cost $13,951,999) | | $17,868,257 |
| Foreign currency held at value (cost $1,980) | | 1,995 |
| Receivable for securities sold on a delayed delivery basis | | 9,858 |
| Receivable for fund shares sold | | 1,475 |
| Dividends receivable | | 69,886 |
| Interest receivable | | 3 |
| Distributions receivable from Fidelity Central Funds | | 801 |
| Prepaid expenses | | 10 |
| Receivable from investment adviser for expense reductions | | 49,224 |
| Other receivables | | 339 |
| Total assets | | 18,001,848 |
| Liabilities | | |
| Payable for fund shares redeemed | $32,432 | |
| Accrued management fee | 10,200 | |
| Distribution and service plan fees payable | 6,408 | |
| Other affiliated payables | 4,470 | |
| Audit fee payable | 28,656 | |
| Other payables and accrued expenses | 4,549 | |
| Total liabilities | | 86,715 |
| Net Assets | | $17,915,133 |
| Net Assets consist of: | | |
| Paid in capital | | $14,206,594 |
| Total distributable earnings (loss) | | 3,708,539 |
| Net Assets | | $17,915,133 |
| Net Asset Value and Maximum Offering Price | | |
| Class A: | | |
| Net Asset Value and redemption price per share ($8,025,892 ÷ 546,209 shares) | | $14.69 |
| Maximum offering price per share (100/94.25 of $14.69) | | $15.59 |
| Class M: | | |
| Net Asset Value and redemption price per share ($3,254,501 ÷ 221,613 shares) | | $14.69 |
| Maximum offering price per share (100/96.50 of $14.69) | | $15.22 |
| Class C: | | |
| Net Asset Value and offering price per share ($4,134,959 ÷ 283,054 shares)(a) | | $14.61 |
| Class I: | | |
| Net Asset Value, offering price and redemption price per share ($2,121,932 ÷ 144,277 shares) | | $14.71 |
| Class Z: | | |
| Net Asset Value, offering price and redemption price per share ($377,849 ÷ 25,671 shares) | | $14.72 |
(a) Redemption price per share is equal to net asset value less any applicable contingent deferred sales charge.
See accompanying notes which are an integral part of the financial statements.
Statement of Operations
| | | Six months ended April 30, 2019 (Unaudited) |
| Investment Income | | |
| Dividends | | $250,611 |
| Income from Fidelity Central Funds | | 5,585 |
| Income before foreign taxes withheld | | 256,196 |
| Less foreign taxes withheld | | (8,957) |
| Total income | | 247,239 |
| Expenses | | |
| Management fee | $60,730 | |
| Transfer agent fees | 23,073 | |
| Distribution and service plan fees | 38,477 | |
| Accounting fees and expenses | 4,563 | |
| Custodian fees and expenses | 2,057 | |
| Independent trustees' fees and expenses | 50 | |
| Registration fees | 73,400 | |
| Audit | 50,367 | |
| Legal | 1,330 | |
| Miscellaneous | 59 | |
| Total expenses before reductions | 254,106 | |
| Expense reductions | (110,342) | |
| Total expenses after reductions | | 143,764 |
| Net investment income (loss) | | 103,475 |
| Realized and Unrealized Gain (Loss) | | |
| Net realized gain (loss) on: | | |
| Investment securities: | | |
| Unaffiliated issuers | (235,402) | |
| Foreign currency transactions | 725 | |
| Total net realized gain (loss) | | (234,677) |
| Change in net unrealized appreciation (depreciation) on: | | |
| Investment securities: | | |
| Unaffiliated issuers (net of increase in deferred foreign taxes of $3,226) | 1,571,832 | |
| Assets and liabilities in foreign currencies | 52 | |
| Total change in net unrealized appreciation (depreciation) | | 1,571,884 |
| Net gain (loss) | | 1,337,207 |
| Net increase (decrease) in net assets resulting from operations | | $1,440,682 |
See accompanying notes which are an integral part of the financial statements.
Statement of Changes in Net Assets
| | Six months ended April 30, 2019 (Unaudited) | Year ended October 31, 2018 |
| Increase (Decrease) in Net Assets | | |
| Operations | | |
| Net investment income (loss) | $103,475 | $228,323 |
| Net realized gain (loss) | (234,677) | 465,547 |
| Change in net unrealized appreciation (depreciation) | 1,571,884 | (1,263,147) |
| Net increase (decrease) in net assets resulting from operations | 1,440,682 | (569,277) |
| Distributions to shareholders | (439,239) | (539,380) |
| Share transactions - net increase (decrease) | (1,718,479) | 2,003,577 |
| Total increase (decrease) in net assets | (717,036) | 894,920 |
| Net Assets | | |
| Beginning of period | 18,632,169 | 17,737,249 |
| End of period | $17,915,133 | $18,632,169 |
See accompanying notes which are an integral part of the financial statements.
Financial Highlights
Fidelity Advisor Global Equity Income Fund Class A
| | Six months ended (Unaudited) April 30, | Years endedOctober 31, | | | | |
| | 2019 | 2018 | 2017 | 2016 | 2015 | 2014 |
| Selected Per–Share Data | | | | | | |
| Net asset value, beginning of period | $13.86 | $14.63 | $12.44 | $12.50 | $12.96 | $12.20 |
| Income from Investment Operations | | | | | | |
| Net investment income (loss)A | .09 | .19 | .13 | .12 | .12 | .25B |
| Net realized and unrealized gain (loss) | 1.09 | (.52) | 2.20 | .09 | .24 | .91 |
| Total from investment operations | 1.18 | (.33) | 2.33 | .21 | .36 | 1.16 |
| Distributions from net investment income | (.07) | (.18) | (.13) | (.11) | (.11) | (.22) |
| Distributions from net realized gain | (.28) | (.26) | (.01) | (.16) | (.71) | (.18) |
| Total distributions | (.35) | (.44) | (.14) | (.27) | (.82) | (.40) |
| Net asset value, end of period | $14.69 | $13.86 | $14.63 | $12.44 | $12.50 | $12.96 |
| Total ReturnC,D,E | 8.81% | (2.41)% | 18.79% | 1.72% | 2.85% | 9.70% |
| Ratios to Average Net AssetsF,G | | | | | | |
| Expenses before reductions | 2.70%H | 1.91% | 2.05% | 2.13% | 2.42% | 2.63% |
| Expenses net of fee waivers, if any | 1.45%H | 1.45% | 1.45% | 1.45% | 1.45% | 1.45% |
| Expenses net of all reductions | 1.45%H | 1.44% | 1.45% | 1.45% | 1.44% | 1.45% |
| Net investment income (loss) | 1.36%H | 1.33% | .96% | .96% | .95% | 1.95%B |
| Supplemental Data | | | | | | |
| Net assets, end of period (000 omitted) | $8,026 | $8,427 | $7,441 | $6,068 | $4,552 | $4,025 |
| Portfolio turnover rateI | 32%H | 37% | 48% | 43% | 87% | 112% |
A Calculated based on average shares outstanding during the period.
B Net investment income per share reflects a large, non-recurring dividend which amounted to $.09 per share. Excluding this non-recurring dividend, the ratio of net investment income (loss) to average net assets would have been 1.25%.
C Total returns for periods of less than one year are not annualized.
D Total returns would have been lower if certain expenses had not been reduced during the applicable periods shown.
E Total returns do not include the effect of the sales charges.
F Fees and expenses of any underlying Fidelity Central Funds are not included in the Fund's expense ratio. The Fund indirectly bears its proportionate share of the expenses of any underlying Fidelity Central Funds.
G Expense ratios reflect operating expenses of the class. Expenses before reductions do not reflect amounts reimbursed by the investment adviser or reductions from brokerage service arrangements or reductions from other expense offset arrangements and do not represent the amount paid by the class during periods when reimbursements or reductions occur. Expenses net of fee waivers reflect expenses after reimbursement by the investment adviser but prior to reductions from brokerage service arrangements or other expense offset arrangements. Expenses net of all reductions represent the net expenses paid by the class.
H Annualized
I Amount does not include the portfolio activity of any underlying Fidelity Central Funds.
See accompanying notes which are an integral part of the financial statements.
Fidelity Advisor Global Equity Income Fund Class M
| | Six months ended (Unaudited) April 30, | Years endedOctober 31, | | | | |
| | 2019 | 2018 | 2017 | 2016 | 2015 | 2014 |
| Selected Per–Share Data | | | | | | |
| Net asset value, beginning of period | $13.85 | $14.62 | $12.44 | $12.49 | $12.95 | $12.20 |
| Income from Investment Operations | | | | | | |
| Net investment income (loss)A | .08 | .16 | .10 | .09 | .09 | .21B |
| Net realized and unrealized gain (loss) | 1.09 | (.53) | 2.18 | .10 | .24 | .91 |
| Total from investment operations | 1.17 | (.37) | 2.28 | .19 | .33 | 1.12 |
| Distributions from net investment income | (.05) | (.14) | (.10) | (.08) | (.08) | (.19) |
| Distributions from net realized gain | (.28) | (.26) | (.01) | (.16) | (.71) | (.18) |
| Total distributions | (.33) | (.40) | (.10)C | (.24) | (.79) | (.37) |
| Net asset value, end of period | $14.69 | $13.85 | $14.62 | $12.44 | $12.49 | $12.95 |
| Total ReturnD,E,F | 8.75% | (2.64)% | 18.42% | 1.53% | 2.59% | 9.34% |
| Ratios to Average Net AssetsG,H | | | | | | |
| Expenses before reductions | 3.00%I | 2.21% | 2.35% | 2.46% | 2.73% | 2.96% |
| Expenses net of fee waivers, if any | 1.70%I | 1.70% | 1.70% | 1.70% | 1.70% | 1.70% |
| Expenses net of all reductions | 1.70%I | 1.69% | 1.69% | 1.70% | 1.69% | 1.70% |
| Net investment income (loss) | 1.11%I | 1.08% | .71% | .71% | .70% | 1.70%B |
| Supplemental Data | | | | | | |
| Net assets, end of period (000 omitted) | $3,255 | $3,279 | $3,573 | $2,508 | $2,484 | $2,014 |
| Portfolio turnover rateJ | 32%I | 37% | 48% | 43% | 87% | 112% |
A Calculated based on average shares outstanding during the period.
B Net investment income per share reflects a large, non-recurring dividend which amounted to $.09 per share. Excluding this non-recurring dividend, the ratio of net investment income (loss) to average net assets would have been 1.00%.
C Total distributions of $.10 per share is comprised of distributions from net investment income of $.096 and distributions from net realized gain of $.007 per share.
D Total returns for periods of less than one year are not annualized.
E Total returns would have been lower if certain expenses had not been reduced during the applicable periods shown.
F Total returns do not include the effect of the sales charges.
G Fees and expenses of any underlying Fidelity Central Funds are not included in the Fund's expense ratio. The Fund indirectly bears its proportionate share of the expenses of any underlying Fidelity Central Funds.
H Expense ratios reflect operating expenses of the class. Expenses before reductions do not reflect amounts reimbursed by the investment adviser or reductions from brokerage service arrangements or reductions from other expense offset arrangements and do not represent the amount paid by the class during periods when reimbursements or reductions occur. Expenses net of fee waivers reflect expenses after reimbursement by the investment adviser but prior to reductions from brokerage service arrangements or other expense offset arrangements. Expenses net of all reductions represent the net expenses paid by the class.
I Annualized
J Amount does not include the portfolio activity of any underlying Fidelity Central Funds.
See accompanying notes which are an integral part of the financial statements.
Fidelity Advisor Global Equity Income Fund Class C
| | Six months ended (Unaudited) April 30, | Years endedOctober 31, | | | | |
| | 2019 | 2018 | 2017 | 2016 | 2015 | 2014 |
| Selected Per–Share Data | | | | | | |
| Net asset value, beginning of period | $13.77 | $14.57 | $12.39 | $12.46 | $12.93 | $12.18 |
| Income from Investment Operations | | | | | | |
| Net investment income (loss)A | .04 | .08 | .03 | .03 | .03 | .15B |
| Net realized and unrealized gain (loss) | 1.09 | (.53) | 2.19 | .09 | .24 | .91 |
| Total from investment operations | 1.13 | (.45) | 2.22 | .12 | .27 | 1.06 |
| Distributions from net investment income | (.02) | (.09) | (.03) | (.03) | (.05) | (.14) |
| Distributions from net realized gain | (.28) | (.26) | (.01) | (.16) | (.70) | (.17) |
| Total distributions | (.29)C | (.35) | (.04) | (.19) | (.74)D | (.31) |
| Net asset value, end of period | $14.61 | $13.77 | $14.57 | $12.39 | $12.46 | $12.93 |
| Total ReturnE,F,G | 8.49% | (3.22)% | 17.91% | .99% | 2.10% | 8.83% |
| Ratios to Average Net AssetsH,I | | | | | | |
| Expenses before reductions | 3.48%J | 2.72% | 2.85% | 2.93% | 3.23% | 3.43% |
| Expenses net of fee waivers, if any | 2.20%J | 2.20% | 2.20% | 2.20% | 2.20% | 2.20% |
| Expenses net of all reductions | 2.20%J | 2.19% | 2.20% | 2.20% | 2.19% | 2.20% |
| Net investment income (loss) | .61%J | .58% | .21% | .21% | .20% | 1.20%B |
| Supplemental Data | | | | | | |
| Net assets, end of period (000 omitted) | $4,135 | $4,340 | $4,190 | $3,588 | $3,225 | $3,173 |
| Portfolio turnover rateK | 32%J | 37% | 48% | 43% | 87% | 112% |
A Calculated based on average shares outstanding during the period.
B Net investment income per share reflects a large, non-recurring dividend which amounted to $.09 per share. Excluding this non-recurring dividend, the ratio of net investment income (loss) to average net assets would have been .50%.
C Total distributions of $.29 per share is comprised of distributions from net investment income of $.015 and distributions from net realized gain of $.278 per share.
D Total distributions of $,74 per share is comprised of distributions from net investment income of $.046 and distributions from net realized gain of $.695 per share.
E Total returns for periods of less than one year are not annualized.
F Total returns would have been lower if certain expenses had not been reduced during the applicable periods shown.
G Total returns do not include the effect of the contingent deferred sales charge.
H Fees and expenses of any underlying Fidelity Central Funds are not included in the Fund's expense ratio. The Fund indirectly bears its proportionate share of the expenses of any underlying Fidelity Central Funds.
I Expense ratios reflect operating expenses of the class. Expenses before reductions do not reflect amounts reimbursed by the investment adviser or reductions from brokerage service arrangements or reductions from other expense offset arrangements and do not represent the amount paid by the class during periods when reimbursements or reductions occur. Expenses net of fee waivers reflect expenses after reimbursement by the investment adviser but prior to reductions from brokerage service arrangements or other expense offset arrangements. Expenses net of all reductions represent the net expenses paid by the class.
J Annualized
K Amount does not include the portfolio activity of any underlying Fidelity Central Funds.
See accompanying notes which are an integral part of the financial statements.
Fidelity Advisor Global Equity Income Fund Class I
| | Six months ended (Unaudited) April 30, | Years endedOctober 31, | | | | |
| | 2019 | 2018 | 2017 | 2016 | 2015 | 2014 |
| Selected Per–Share Data | | | | | | |
| Net asset value, beginning of period | $13.88 | $14.66 | $12.46 | $12.51 | $12.97 | $12.22 |
| Income from Investment Operations | | | | | | |
| Net investment income (loss)A | .11 | .23 | .16 | .15 | .15 | .28B |
| Net realized and unrealized gain (loss) | 1.09 | (.53) | 2.21 | .10 | .24 | .90 |
| Total from investment operations | 1.20 | (.30) | 2.37 | .25 | .39 | 1.18 |
| Distributions from net investment income | (.10) | (.22) | (.16) | (.14) | (.14) | (.25) |
| Distributions from net realized gain | (.28) | (.26) | (.01) | (.16) | (.71) | (.18) |
| Total distributions | (.37)C | (.48) | (.17) | (.30) | (.85) | (.43) |
| Net asset value, end of period | $14.71 | $13.88 | $14.66 | $12.46 | $12.51 | $12.97 |
| Total ReturnD,E | 8.99% | (2.20)% | 19.12% | 2.04% | 3.09% | 9.86% |
| Ratios to Average Net AssetsF,G | | | | | | |
| Expenses before reductions | 2.29%H | 1.51% | 1.77% | 1.68% | 2.11% | 2.35% |
| Expenses net of fee waivers, if any | 1.20%H | 1.20% | 1.20% | 1.20% | 1.20% | 1.20% |
| Expenses net of all reductions | 1.20%H | 1.19% | 1.20% | 1.20% | 1.19% | 1.20% |
| Net investment income (loss) | 1.61%H | 1.58% | 1.21% | 1.21% | 1.20% | 2.20%B |
| Supplemental Data | | | | | | |
| Net assets, end of period (000 omitted) | $2,122 | $2,493 | $2,533 | $7,159 | $1,167 | $1,334 |
| Portfolio turnover rateI | 32%H | 37% | 48% | 43% | 87% | 112% |
A Calculated based on average shares outstanding during the period.
B Net investment income per share reflects a large, non-recurring dividend which amounted to $.09 per share. Excluding this non-recurring dividend, the ratio of net investment income (loss) to average net assets would have been 1.50%.
C Total distributions of $.37 per share is comprised of distributions from net investment income of $.096 and distributions from net realized gain of $.278 per share.
D Total returns for periods of less than one year are not annualized.
E Total returns would have been lower if certain expenses had not been reduced during the applicable periods shown.
F Fees and expenses of any underlying Fidelity Central Funds are not included in the Fund's expense ratio. The Fund indirectly bears its proportionate share of the expenses of any underlying Fidelity Central Funds.
G Expense ratios reflect operating expenses of the class. Expenses before reductions do not reflect amounts reimbursed by the investment adviser or reductions from brokerage service arrangements or reductions from other expense offset arrangements and do not represent the amount paid by the class during periods when reimbursements or reductions occur. Expenses net of fee waivers reflect expenses after reimbursement by the investment adviser but prior to reductions from brokerage service arrangements or other expense offset arrangements. Expenses net of all reductions represent the net expenses paid by the class.
H Annualized
I Amount does not include the portfolio activity of any underlying Fidelity Central Funds.
See accompanying notes which are an integral part of the financial statements.
Fidelity Advisor Global Equity Income Fund Class Z
| | Six months ended (Unaudited) April 30, | Years endedOctober 31, |
| | 2019 | 2018 A |
| Selected Per–Share Data | | |
| Net asset value, beginning of period | $13.88 | $14.88 |
| Income from Investment Operations | | |
| Net investment income (loss)B | .12 | .01 |
| Net realized and unrealized gain (loss) | 1.10 | (.94) |
| Total from investment operations | 1.22 | (.93) |
| Distributions from net investment income | (.10) | (.07) |
| Distributions from net realized gain | (.28) | – |
| Total distributions | (.38) | (.07) |
| Net asset value, end of period | $14.72 | $13.88 |
| Total ReturnC,D | 9.07% | (6.31)% |
| Ratios to Average Net AssetsE,F | | |
| Expenses before reductions | 2.42%G | 1.08%G |
| Expenses net of fee waivers, if any | 1.05%G | 1.05%G |
| Expenses net of all reductions | 1.04%G | 1.04%G |
| Net investment income (loss) | 1.76%G | .45%G |
| Supplemental Data | | |
| Net assets, end of period (000 omitted) | $378 | $94 |
| Portfolio turnover rateH | 32%G | 37%G |
A For the period October 2, 2018 (commencement of sale of shares) to October 31, 2018.
B Calculated based on average shares outstanding during the period.
C Total returns for periods of less than one year are not annualized.
D Total returns would have been lower if certain expenses had not been reduced during the applicable periods shown.
E Fees and expenses of any underlying Fidelity Central Funds are not included in the Fund's expense ratio. The Fund indirectly bears its proportionate share of the expenses of any underlying Fidelity Central Funds.
F Expense ratios reflect operating expenses of the class. Expenses before reductions do not reflect amounts reimbursed by the investment adviser or reductions from brokerage service arrangements or reductions from other expense offset arrangements and do not represent the amount paid by the class during periods when reimbursements or reductions occur. Expense ratios before reductions for start-up periods may not be representative of longer-term operating periods. Expenses net of fee waivers reflect expenses after reimbursement by the investment adviser but prior to reductions from brokerage service arrangements or other expense offset arrangements. Expenses net of all reductions represent the net expenses paid by the class.
G Annualized
H Amount does not include the portfolio activity of any underlying Fidelity Central Funds.
See accompanying notes which are an integral part of the financial statements.
Notes to Financial Statements (Unaudited)
For the period ended April 30, 2019
1. Organization.
Fidelity Advisor Global Equity Income Fund (the Fund) is a fund of Fidelity Advisor Series VIII (the Trust) and is authorized to issue an unlimited number of shares. The Trust is registered under the Investment Company Act of 1940, as amended (the 1940 Act), as an open-end management investment company organized as a Massachusetts business trust. The Fund offers Class A, Class M, Class C, Class I and Class Z shares, each of which has equal rights as to assets and voting privileges. Each class has exclusive voting rights with respect to matters that affect that class. Effective March 1, 2019, Class C shares will automatically convert to Class A shares after a holding period of ten years from the initial date of purchase, with certain exceptions.
2. Investments in Fidelity Central Funds.
The Fund invests in Fidelity Central Funds, which are open-end investment companies generally available only to other investment companies and accounts managed by the investment adviser and its affiliates. The Fund's Schedule of Investments lists each of the Fidelity Central Funds held as of period end, if any, as an investment of the Fund, but does not include the underlying holdings of each Fidelity Central Fund. As an Investing Fund, the Fund indirectly bears its proportionate share of the expenses of the underlying Fidelity Central Funds.
The Money Market Central Funds seek preservation of capital and current income and are managed by Fidelity Investments Money Management, Inc. (FIMM), an affiliate of the investment adviser. Annualized expenses of the Money Market Central Funds as of their most recent shareholder report date are less than .005%.
A complete unaudited list of holdings for each Fidelity Central Fund is available upon request or at the Securities and Exchange Commission (the SEC) website at www.sec.gov. In addition, the financial statements of the Fidelity Central Funds are available on the SEC website or upon request.
3. Significant Accounting Policies.
The Fund is an investment company and applies the accounting and reporting guidance of the Financial Accounting Standards Board (FASB) Accounting Standards Codification Topic 946 Financial Services – Investments Companies. The financial statements have been prepared in conformity with accounting principles generally accepted in the United States of America (GAAP), which require management to make certain estimates and assumptions at the date of the financial statements. Actual results could differ from those estimates. Subsequent events, if any, through the date that the financial statements were issued have been evaluated in the preparation of the financial statements. The following summarizes the significant accounting policies of the Fund:
Investment Valuation. Investments are valued as of 4:00 p.m. Eastern time on the last calendar day of the period. The Board of Trustees (the Board) has delegated the day to day responsibility for the valuation of the Fund's investments to the Fair Value Committee (the Committee) established by the Fund's investment adviser. In accordance with valuation policies and procedures approved by the Board, the Fund attempts to obtain prices from one or more third party pricing vendors or brokers to value its investments. When current market prices, quotations or currency exchange rates are not readily available or reliable, investments will be fair valued in good faith by the Committee, in accordance with procedures adopted by the Board. Factors used in determining fair value vary by investment type and may include market or investment specific events, changes in interest rates and credit quality. The frequency with which these procedures are used cannot be predicted and they may be utilized to a significant extent. The Committee oversees the Fund's valuation policies and procedures and reports to the Board on the Committee's activities and fair value determinations. The Board monitors the appropriateness of the procedures used in valuing the Fund's investments and ratifies the fair value determinations of the Committee.
The Fund categorizes the inputs to valuation techniques used to value its investments into a disclosure hierarchy consisting of three levels as shown below:
- Level 1 – quoted prices in active markets for identical investments
- Level 2 – other significant observable inputs (including quoted prices for similar investments, interest rates, prepayment speeds, etc.)
- Level 3 – unobservable inputs (including the Fund's own assumptions based on the best information available)
Valuation techniques used to value the Fund's investments by major category are as follows:
Equity securities, including restricted securities, for which market quotations are readily available, are valued at the last reported sale price or official closing price as reported by a third party pricing vendor on the primary market or exchange on which they are traded and are categorized as Level 1 in the hierarchy. In the event there were no sales during the day or closing prices are not available, securities are valued at the last quoted bid price or may be valued using the last available price and are generally categorized as Level 2 in the hierarchy. For foreign equity securities, when market or security specific events arise, comparisons to the valuation of American Depositary Receipts (ADRs), futures contracts, Exchange-Traded Funds (ETFs) and certain indexes as well as quoted prices for similar securities may be used and would be categorized as Level 2 in the hierarchy. For equity securities, including restricted securities, where observable inputs are limited, assumptions about market activity and risk are used and these securities may be categorized as Level 3 in the hierarchy.
Debt securities, including restricted securities, are valued based on evaluated prices received from third party pricing vendors or from brokers who make markets in such securities. Corporate bonds are valued by pricing vendors who utilize matrix pricing which considers yield or price of bonds of comparable quality, coupon, maturity and type or by broker-supplied prices. When independent prices are unavailable or unreliable, debt securities may be valued utilizing pricing methodologies which consider similar factors that would be used by third party pricing vendors. Debt securities are generally categorized as Level 2 in the hierarchy but may be Level 3 depending on the circumstances.
Investments in open-end mutual funds, including the Fidelity Central Funds, are valued at their closing net asset value (NAV) each business day and are categorized as Level 1 in the hierarchy.
Changes in valuation techniques may result in transfers in or out of an assigned level within the disclosure hierarchy. The aggregate value of investments by input level as of April 30, 2019 is included at the end of the Fund's Schedule of Investments.
Foreign Currency. The Fund may use foreign currency contracts to facilitate transactions in foreign-denominated securities. Gains and losses from these transactions may arise from changes in the value of the foreign currency or if the counterparties do not perform under the contracts' terms.
Foreign-denominated assets, including investment securities, and liabilities are translated into U.S. dollars at the exchange rates at period end. Purchases and sales of investment securities, income and dividends received and expenses denominated in foreign currencies are translated into U.S. dollars at the exchange rate in effect on the transaction date.
The effects of exchange rate fluctuations on investments are included with the net realized and unrealized gain (loss) on investment securities. Other foreign currency transactions resulting in realized and unrealized gain (loss) are disclosed separately.
Investment Transactions and Income. For financial reporting purposes, the Fund's investment holdings and NAV include trades executed through the end of the last business day of the period. The NAV per share for processing shareholder transactions is calculated as of the close of business of the New York Stock Exchange (NYSE), normally 4:00 p.m. Eastern time and includes trades executed through the end of the prior business day. Gains and losses on securities sold are determined on the basis of identified cost and include proceeds received from litigation. Dividend income is recorded on the ex-dividend date, except for certain dividends from foreign securities where the ex-dividend date may have passed, which are recorded as soon as the Fund is informed of the ex-dividend date. Non-cash dividends included in dividend income, if any, are recorded at the fair market value of the securities received. Income and capital gain distributions from Fidelity Central Funds, if any, are recorded on the ex-dividend date. Investment income is recorded net of foreign taxes withheld where recovery of such taxes is uncertain.
Class Allocations and Expenses. Investment income, realized and unrealized capital gains and losses, common expenses of the Fund, and certain fund-level expense reductions, if any, are allocated daily on a pro-rata basis to each class based on the relative net assets of each class to the total net assets of the Fund. Each class differs with respect to transfer agent and distribution and service plan fees incurred. Certain expense reductions may also differ by class. For the reporting period, the allocated portion of income and expenses to each class as a percent of its average net assets may vary due to the timing of recording these transactions in relation to fluctuating net assets of the classes. Expenses directly attributable to a fund are charged to that fund. Expenses attributable to more than one fund are allocated among the respective funds on the basis of relative net assets or other appropriate methods. Expense estimates are accrued in the period to which they relate and adjustments are made when actual amounts are known.
Income Tax Information and Distributions to Shareholders. Each year, the Fund intends to qualify as a regulated investment company under Subchapter M of the Internal Revenue Code, including distributing substantially all of its taxable income and realized gains. As a result, no provision for U.S. Federal income taxes is required. The Fund files a U.S. federal tax return, in addition to state and local tax returns as required. The Fund's federal income tax returns are subject to examination by the Internal Revenue Service (IRS) for a period of three fiscal years after they are filed. State and local tax returns may be subject to examination for an additional fiscal year depending on the jurisdiction. Foreign taxes are provided for based on the Fund's understanding of the tax rules and rates that exist in the foreign markets in which it invests. The Fund is subject to a tax imposed on capital gains by certain countries in which it invests. An estimated deferred tax liability for net unrealized appreciation on the applicable securities is included in Other payables and accrued expenses on the Statement of Assets & Liabilities.
Distributions are declared and recorded on the ex-dividend date. Income and capital gain distributions are declared separately for each class. Income and capital gain distributions are determined in accordance with income tax regulations, which may differ from GAAP.
Capital accounts within the financial statements are adjusted for permanent book-tax differences. These adjustments have no impact on net assets or the results of operations. Capital accounts are not adjusted for temporary book-tax differences which will reverse in a subsequent period.
Book-tax differences are primarily due to foreign currency transactions, passive foreign investment companies (PFIC), partnerships and losses deferred due to wash sales.
As of period end, the cost and unrealized appreciation (depreciation) in securities, and derivatives if applicable, for federal income tax purposes were as follows:
| Gross unrealized appreciation | $4,290,041 |
| Gross unrealized depreciation | (378,958) |
| Net unrealized appreciation (depreciation) | $3,911,083 |
| Tax cost | $13,957,174 |
Delayed Delivery Transactions and When-Issued Securities. During the period, the Fund transacted in securities on a delayed delivery or when-issued basis. Payment and delivery may take place after the customary settlement period for that security. The price of the underlying securities and the date when the securities will be delivered and paid for are fixed at the time the transaction is negotiated. Losses may arise due to changes in the value of the underlying securities or if the counterparty does not perform under the contract's terms, or if the issuer does not issue the securities due to political, economic, or other factors.
Restricted Securities. The Fund may invest in securities that are subject to legal or contractual restrictions on resale. These securities generally may be resold in transactions exempt from registration or to the public if the securities are registered. Disposal of these securities may involve time-consuming negotiations and expense, and prompt sale at an acceptable price may be difficult. Information regarding restricted securities is included at the end of the Fund's Schedule of Investments.
4. Purchases and Sales of Investments.
Purchases and sales of securities, other than short-term securities, aggregated $2,750,736 and $4,992,173, respectively.
5. Fees and Other Transactions with Affiliates.
Management Fee. Fidelity Management & Research Company (the investment adviser) and its affiliates provide the Fund with investment management related services for which the Fund pays a monthly management fee. The management fee is the sum of an individual fund fee rate that is based on an annual rate of .45% of the Fund's average net assets and an annualized group fee rate that averaged .24% during the period. The group fee rate is based upon the average net assets of all the mutual funds advised by the investment adviser, including any mutual funds previously advised by the investment adviser that are currently advised by Fidelity SelectCo, LLC, an affiliate of the investment adviser. The group fee rate decreases as assets under management increase and increases as assets under management decrease. For the reporting period, the total annualized management fee rate was .69% of the Fund's average net assets.
Distribution and Service Plan Fees. In accordance with Rule 12b-1 of the 1940 Act, the Fund has adopted separate Distribution and Service Plans for each class of shares. Certain classes pay Fidelity Distributors Corporation (FDC), an affiliate of the investment adviser, separate Distribution and Service Fees, each of which is based on an annual percentage of each class' average net assets. In addition, FDC may pay financial intermediaries for selling shares of the Fund and providing shareholder support services. For the period, the Distribution and Service Fee rates, total fees and amounts retained by FDC were as follows:
| | Distribution Fee | Service Fee | Total Fees | Retained by FDC |
| Class A | -% | .25% | $9,672 | $220 |
| Class M | .25% | .25% | 7,806 | 112 |
| Class C | .75% | .25% | 20,999 | 2,727 |
| | | | $38,477 | $3,059 |
Sales Load. FDC may receive a front-end sales charge of up to 5.75% for selling Class A shares and 3.50% for selling Class M shares, some of which is paid to financial intermediaries for selling shares of the Fund. Depending on the holding period, FDC may receive contingent deferred sales charges levied on Class A, Class M and Class C redemptions. The deferred sales charges are 1.00% for Class C shares, 1.00% for certain purchases of Class A shares and .25% for certain purchases of Class M shares.
For the period, sales charge amounts retained by FDC were as follows:
| | Retained by FDC |
| Class A | $1,108 |
| Class M | 308 |
| Class C(a) | 129 |
| | $1,545 |
(a) When Class C shares are initially sold, FDC pays commissions from its own resources to financial intermediaries through which the sales are made.
Transfer Agent Fees. Fidelity Investments Institutional Operations Company, Inc., (FIIOC), an affiliate of the investment adviser, is the transfer, dividend disbursing and shareholder servicing agent for each class of the Fund. FIIOC receives account fees and asset-based fees that vary according to the account size and type of account of the shareholders of the respective classes of the Fund, except for Class Z. FIIOC receives an asset-based fee of Class Z's average net assets. FIIOC pays for typesetting, printing and mailing of shareholder reports, except proxy statements.
For the period, transfer agent fees for each class were as follows:
| | Amount | % of Class-Level Average Net Assets(a) |
| Class A | $10,078 | .26 |
| Class M | 4,860 | .31 |
| Class C | 6,517 | .31 |
| Class I | 1,550 | .14 |
| Class Z | 68 | .05 |
| | $23,073 | |
(a) Annualized
Accounting Fees. Fidelity Service Company, Inc. (FSC), an affiliate of the investment adviser, maintains the Fund's accounting records. The fee is based on the level of average net assets for each month. For the period, the fees were equivalent to an annualized rate of .05%.
Brokerage Commissions. The Fund placed a portion of its portfolio transactions with brokerage firms which are affiliates of the investment adviser. Brokerage commissions are included in net realized gain (loss) and change in net unrealized appreciation (depreciation) in the Statement of Operations. The commissions paid to these affiliated firms were $53 for the period.
Interfund Trades. The Fund may purchase from or sell securities to other Fidelity Funds under procedures adopted by the Board. The procedures have been designed to ensure these interfund trades are executed in accordance with Rule 17a-7 of the 1940 Act. Interfund trades are included within the respective purchases and sales amounts shown in the Purchases and Sales of Investments note.
6. Committed Line of Credit.
The Fund participates with other funds managed by the investment adviser or an affiliate in a $4.25 billion credit facility (the "line of credit") to be utilized for temporary or emergency purposes to fund shareholder redemptions or for other short-term liquidity purposes. The Fund has agreed to pay commitment fees on its pro-rata portion of the line of credit, which amounted to $26 and is reflected in Miscellaneous expenses on the Statement of Operations. During the period, the Fund did not borrow on this line of credit.
7. Expense Reductions.
The investment adviser contractually agreed to reimburse each class to the extent annual operating expenses exceeded certain levels of class-level average net assets as noted in the table below. This reimbursement will remain in place through February 29, 2020. Some expenses, for example the compensation of the independent Trustees, and certain miscellaneous expenses such as proxy and shareholder meeting expenses, are excluded from this reimbursement.
The following classes were in reimbursement during the period:
| | Expense Limitations | Reimbursement |
| Class A | 1.45% | $41,321 |
| Class M | 1.70% | 17,564 |
| Class C | 2.20% | 23,033 |
| Class I | 1.20% | 10,272 |
| Class Z | 1.05% | 1,718 |
| | | $93,908 |
Commissions paid to certain brokers with whom the investment adviser, or its affiliates, places trades on behalf of the Fund include an amount in addition to trade execution, which may be rebated back to the Fund to offset certain expenses. This amount totaled $203 for the period. Through arrangements with the Fund's custodian, credits realized as a result of certain uninvested cash balances were used to reduce the Fund's expenses. During the period, these credits reduced the Fund's custody fee by $99.
In addition, during the period the investment adviser reimbursed and/or waived a portion of fund-level operating expenses in the amount of $69 and a portion of class-level operating expenses as follows:
| | Amount |
| Class A | $6,911 |
| Class M | 2,824 |
| Class C | 3,929 |
| Class I | 2,073 |
| Class Z | 326 |
| | $16,063 |
8. Distributions to Shareholders.
Distributions to shareholders of each class were as follows:
| | Six months ended
April 30, 2019 | Year ended
October 31, 2018(a) |
| Distributions to shareholders | | |
| Class A | $201,043 | $248,761 |
| Class M | 76,236 | 101,394 |
| Class C | 91,600 | 108,482 |
| Class I | 63,757 | 80,306 |
| Class Z | 6,603 | 437 |
| Total | $439,239 | $539,380 |
(a) Distributions for Class Z are for the period October 2, 2018 (commencement of sale of shares) to October 31, 2018.
9. Share Transactions.
Share transactions for each class were as follows and may contain automatic conversions between classes or exchanges between affiliated funds:
| | Shares | Shares | Dollars | Dollars |
| | Six months ended April 30, 2019 | Year ended October 31, 2018(a) | Six months ended April 30, 2019 | Year ended October 31, 2018(a) |
| Class A | | | | |
| Shares sold | 71,331 | 239,391 | $979,791 | $3,544,767 |
| Reinvestment of distributions | 14,753 | 16,454 | 194,300 | 240,039 |
| Shares redeemed | (148,044) | (156,221) | (1,994,690) | (2,283,605) |
| Net increase (decrease) | (61,960) | 99,624 | $(820,599) | $1,501,201 |
| Class M | | | | |
| Shares sold | 8,443 | 74,172 | $115,361 | $1,084,407 |
| Reinvestment of distributions | 5,766 | 6,928 | 75,784 | 101,155 |
| Shares redeemed | (29,410) | (88,594) | (398,974) | (1,286,364) |
| Net increase (decrease) | (15,201) | (7,494) | $(207,829) | $(100,802) |
| Class C | | | | |
| Shares sold | 15,630 | 79,555 | $210,720 | $1,159,649 |
| Reinvestment of distributions | 7,007 | 7,417 | 91,236 | 107,901 |
| Shares redeemed | (54,718) | (59,540) | (751,039) | (861,126) |
| Net increase (decrease) | (32,081) | 27,432 | $(449,083) | $406,424 |
| Class I | | | | |
| Shares sold | 9,863 | 70,175 | $137,709 | $1,032,359 |
| Reinvestment of distributions | 4,467 | 4,702 | 58,913 | 68,667 |
| Shares redeemed | (49,722) | (68,072) | (690,106) | (1,004,709) |
| Net increase (decrease) | (35,392) | 6,805 | $(493,484) | $96,317 |
| Class Z | | | | |
| Shares sold | 18,947 | 6,720 | $252,815 | $100,000 |
| Reinvestment of distributions | 349 | 30 | 4,642 | 437 |
| Shares redeemed | (375) | – | (4,941) | – |
| Net increase (decrease) | 18,921 | 6,750 | $252,516 | $100,437 |
(a) Share transactions for Class Z are for the period October 2, 2018 (commencement of sale of shares) to October 31, 2018.
10. Other.
The Fund's organizational documents provide former and current trustees and officers with a limited indemnification against liabilities arising in connection with the performance of their duties to the Fund. In the normal course of business, the Fund may also enter into contracts that provide general indemnifications. The Fund's maximum exposure under these arrangements is unknown as this would be dependent on future claims that may be made against the Fund. The risk of material loss from such claims is considered remote.
Shareholder Expense Example
As a shareholder of the Fund, you incur two types of costs: (1) transaction costs, including sales charges (loads) on purchase payments or redemption proceeds, and (2) ongoing costs, including management fees, distribution and/or service (12b-1) fees and other Fund expenses. This Example is intended to help you understand your ongoing costs (in dollars) of investing in the Fund and to compare these costs with the ongoing costs of investing in other mutual funds.
The Example is based on an investment of $1,000 invested at the beginning of the period and held for the entire period (November 1, 2018 to April 30, 2019).
Actual Expenses
The first line of the accompanying table for each class of the Fund provides information about actual account values and actual expenses. You may use the information in this line, together with the amount you invested, to estimate the expenses that you paid over the period. Simply divide your account value by $1,000.00 (for example, an $8,600 account value divided by $1,000.00 = 8.6), then multiply the result by the number in the first line for a class of the Fund under the heading entitled "Expenses Paid During Period" to estimate the expenses you paid on your account during this period. In addition, the Fund, as a shareholder in the underlying Fidelity Central Funds, will indirectly bear its pro-rata share of the fees and expenses incurred by the underlying Fidelity Central Funds. These fees and expenses are not included in the Fund's annualized expense ratio used to calculate the expense estimate in the table below.
Hypothetical Example for Comparison Purposes
The second line of the accompanying table for each class of the Fund provides information about hypothetical account values and hypothetical expenses based on a Class' actual expense ratio and an assumed rate of return of 5% per year before expenses, which is not the Class' actual return. The hypothetical account values and expenses may not be used to estimate the actual ending account balance or expenses you paid for the period. You may use this information to compare the ongoing costs of investing in the Fund and other funds. To do so, compare this 5% hypothetical example with the 5% hypothetical examples that appear in the shareholder reports of the other funds. In addition, the Fund, as a shareholder in the underlying Fidelity Central Funds, will indirectly bear its pro-rata share of the fees and expenses incurred by the underlying Fidelity Central Funds. These fees and expenses are not included in the Fund's annualized expense ratio used to calculate the expense estimate in the table below.
Please note that the expenses shown in the table are meant to highlight your ongoing costs only and do not reflect any transaction costs. Therefore, the second line of the table is useful in comparing ongoing costs only, and will not help you determine the relative total costs of owning different funds. In addition, if these transactional costs were included, your costs would have been higher.
| | Annualized Expense Ratio-A | Beginning
Account Value
November 1, 2018 | Ending
Account Value
April 30, 2019 | Expenses Paid
During Period-B
November 1, 2018
to April 30, 2019 |
| Class A | 1.45% | | | |
| Actual | | $1,000.00 | $1,088.10 | $7.51 |
| Hypothetical-C | | $1,000.00 | $1,017.60 | $7.25 |
| Class M | 1.70% | | | |
| Actual | | $1,000.00 | $1,087.50 | $8.80 |
| Hypothetical-C | | $1,000.00 | $1,016.36 | $8.50 |
| Class C | 2.20% | | | |
| Actual | | $1,000.00 | $1,084.90 | $11.37 |
| Hypothetical-C | | $1,000.00 | $1,013.88 | $10.99 |
| Class I | 1.20% | | | |
| Actual | | $1,000.00 | $1,089.90 | $6.22 |
| Hypothetical-C | | $1,000.00 | $1,018.84 | $6.01 |
| Class Z | 1.05% | | | |
| Actual | | $1,000.00 | $1,090.70 | $5.44 |
| Hypothetical-C | | $1,000.00 | $1,019.59 | $5.26 |
A Annualized expense ratio reflects expenses net of applicable fee waivers.
B Expenses are equal to each Class' annualized expense ratio, multiplied by the average account value over the period, multiplied by 181/365 (to reflect the one-half year period).
C 5% return per year before expenses
Board Approval of Investment Advisory Contracts
Fidelity Advisor Global Equity Income Fund
Each year, the Board of Trustees, including the Independent Trustees (together, the Board), votes on the renewal of the management contract with Fidelity Management & Research Company (FMR) and the sub-advisory agreements (together, the Advisory Contracts) for the fund. FMR and the sub-advisers are referred to herein as the Investment Advisers. The Board, assisted by the advice of fund counsel and Independent Trustees' counsel, requests and considers a broad range of information relevant to the renewal of the Advisory Contracts throughout the year.
The Board meets regularly and, at each of its meetings, covers an extensive agenda of topics and materials and considers factors that are relevant to its annual consideration of the renewal of the fund's Advisory Contracts, including the services and support provided to the fund and its shareholders. The Board has established various standing committees (Committees), each composed of and chaired by Independent Trustees with varying backgrounds, to which the Board has assigned specific subject matter responsibilities in order to enhance effective decision-making by the Board. The Board, acting directly and through its Committees, requests and receives information concerning the annual consideration of the renewal of the fund's Advisory Contracts. The Board also meets as needed to review matters specifically related to the Board's annual consideration of the renewal of the Advisory Contracts. Members of the Board may also meet with trustees of other Fidelity funds through joint ad hoc committees to discuss certain matters relevant to all of the Fidelity funds.
At its January 2019 meeting, the Board unanimously determined to renew the fund's Advisory Contracts. In reaching its determination, the Board considered all factors it believed relevant, including (i) the nature, extent, and quality of the services to be provided to the fund and its shareholders (including the investment performance of the fund); (ii) the competitiveness of the fund's management fee and total expense ratio relative to peer funds; (iii) the total costs of the services to be provided by and the profits to be realized by Fidelity from its relationships with the fund; and (iv) the extent to which, if any, economies of scale exist and would be realized as the fund grows, and whether any economies of scale are appropriately shared with fund shareholders.
In considering whether to renew the Advisory Contracts for the fund, the Board reached a determination, with the assistance of fund counsel and Independent Trustees' counsel and through the exercise of its business judgment, that the renewal of the Advisory Contracts was in the best interests of the fund and its shareholders and that the compensation payable under the Advisory Contracts was fair and reasonable. The Board's decision to renew the Advisory Contracts was not based on any single factor, but rather was based on a comprehensive consideration of all the information provided to the Board at its meetings throughout the year. The Board, in reaching its determination to renew the Advisory Contracts, was aware that shareholders of the fund have a broad range of investment choices available to them, including a wide choice among funds offered by Fidelity's competitors, and that the fund's shareholders, who have the opportunity to review and weigh the disclosure provided by the fund in its prospectus and other public disclosures, have chosen to invest in this fund, which is part of the Fidelity family of funds.
Nature, Extent, and Quality of Services Provided. The Board considered Fidelity's staffing as it relates to the fund, including the backgrounds of investment personnel of Fidelity, and also considered the fund's investment objective, strategies, and related investment philosophy. The Independent Trustees also had discussions with senior management of Fidelity's investment operations and investment groups. The Board considered the structure of the investment personnel compensation program and whether this structure provides appropriate incentives to act in the best interests of the fund. Additionally, the Board considered the portfolio managers' investments, if any, in the funds that they manage.
Resources Dedicated to Investment Management and Support Services. The Board and the Fund Oversight and Research Committees reviewed the general qualifications and capabilities of Fidelity's investment staff, including its size, education, experience, and resources, as well as Fidelity's approach to recruiting, training, managing, and compensating investment personnel. The Board noted that Fidelity has continued to increase the resources devoted to non-U.S. offices, including expansion of Fidelity's global investment organization. The Board also noted that Fidelity's analysts have extensive resources, tools and capabilities that allow them to conduct sophisticated quantitative and fundamental analysis, as well as credit analysis of issuers, counterparties and guarantors. Further, the Board considered that Fidelity's investment professionals have sufficient access to global information and data so as to provide competitive investment results over time, and that those professionals also have access to sophisticated tools that permit them to assess portfolio construction and risk and performance attribution characteristics continuously, as well as to transmit new information and research conclusions rapidly around the world. Additionally, in its deliberations, the Board considered Fidelity's trading, risk management, compliance, and technology and operations capabilities and resources, which are integral parts of the investment management process.
Shareholder and Administrative Services. The Board considered (i) the nature, extent, quality, and cost of advisory, administrative, and shareholder services performed by the Investment Advisers and their affiliates under the Advisory Contracts and under separate agreements covering transfer agency, pricing and bookkeeping, and securities lending services for the fund; (ii) the nature and extent of the supervision of third party service providers, principally custodians, subcustodians, and pricing vendors; and (iii) the resources devoted to, and the record of compliance with, the fund's compliance policies and procedures. The Board also reviewed the allocation of fund brokerage, including allocations to brokers affiliated with the Investment Advisers, the use of brokerage commissions to pay fund expenses, and the use of "soft" commission dollars to pay for research services.
The Board noted that the growth of fund assets over time across the complex allows Fidelity to reinvest in the development of services designed to enhance the value and convenience of the Fidelity funds as investment vehicles. These services include 24-hour access to account information and market information through telephone representatives and over the Internet, investor education materials and asset allocation tools, and the expanded availability of Fidelity Investor Centers.
The Board noted that it and the boards of certain other Fidelity funds had formed an ad hoc Committee on Transfer Agency Fees to review the variety of transfer agency fee structures throughout the industry and Fidelity's competitive positioning with respect to industry participants.
Investment in a Large Fund Family. The Board considered the benefits to shareholders of investing in a Fidelity fund, including the benefits of investing in a fund that is part of a large family of funds offering a variety of investment disciplines and providing a large variety of mutual fund investor services. The Board noted that Fidelity had taken, or had made recommendations that resulted in the Fidelity funds taking, a number of actions over the previous year that benefited particular funds, including: (i) continuing to dedicate additional resources to Fidelity's investment research process, which includes meetings with management of issuers of securities in which the funds invest, and to the support of the senior management team that oversees asset management; (ii) continuing efforts to enhance Fidelity's global research capabilities; (iii) launching new funds and making other enhancements to meet client needs; (iv) launching new share classes of existing funds; (v) eliminating purchase minimums and broadening eligibility requirements for certain funds and share classes; (vi) reducing management fees and total expenses for certain growth equity funds and index funds; (vii) lowering expense caps for certain existing funds and classes, and converting certain voluntary expense caps to contractual caps, to reduce expenses borne by shareholders; (viii) eliminating short-term redemption fees for funds that had such fees; (ix) rationalizing product lines and gaining increased efficiencies from fund mergers and share class consolidations; (x) continuing to develop, acquire and implement systems and technology to improve services to the funds and shareholders, strengthen information security, and increase efficiency; and (xi) continuing to implement enhancements to further strengthen Fidelity's product line to increase investors' probability of success in achieving their investment goals, including retirement income goals.
Investment Performance. The Board considered whether the fund has operated in accordance with its investment objective, as well as its record of compliance with its investment restrictions and its performance history.
The Board took into account discussions that occur at Board meetings throughout the year with representatives of the Investment Advisers about fund investment performance. In this regard the Board noted that as part of regularly scheduled fund reviews and other reports to the Board on fund performance, the Board considers annualized return information for the fund for different time periods, measured against an appropriate securities market index ("benchmark index") and a peer group of funds with similar objectives ("peer group"), if any. In its evaluation of fund investment performance, the Board gave particular attention to information indicating changes in performance of certain Fidelity funds for specific time periods and discussed with the Investment Advisers the reasons for any overperformance or underperformance.
In addition to reviewing absolute and relative fund performance, the Independent Trustees periodically consider the appropriateness of fund performance metrics in evaluating the results achieved. In general, the Independent Trustees believe that fund performance should be evaluated based on net performance (after fees and expenses) of both the highest performing and lowest performing fund share classes, where applicable, compared to appropriate benchmark indices, over appropriate time periods that may include full market cycles, and compared to peer groups, as applicable, over the same periods, taking into account relevant factors including the following: general market conditions; issuer-specific information; and fund cash flows and other factors.
The Independent Trustees recognize that shareholders evaluate performance on a net basis over their own holding periods, for which one-, three-, and five-year periods are often used as a proxy. For this reason, the performance information reviewed by the Board also included net cumulative total return information for the fund and an appropriate benchmark index and peer group for the most recent one-, three-, and five-year periods ended June 30, 2018, as shown below. Returns are shown compared to the 25th percentile (top of box, 75% beaten) and 75th percentile (bottom of box, 25% beaten) of the peer universe. Returns of the benchmark index are "net MA,"
i.e., adjusted for tax withholding rates applicable to U.S.-based funds organized as Massachusetts business trusts.
Fidelity Advisor Global Equity Income Fund
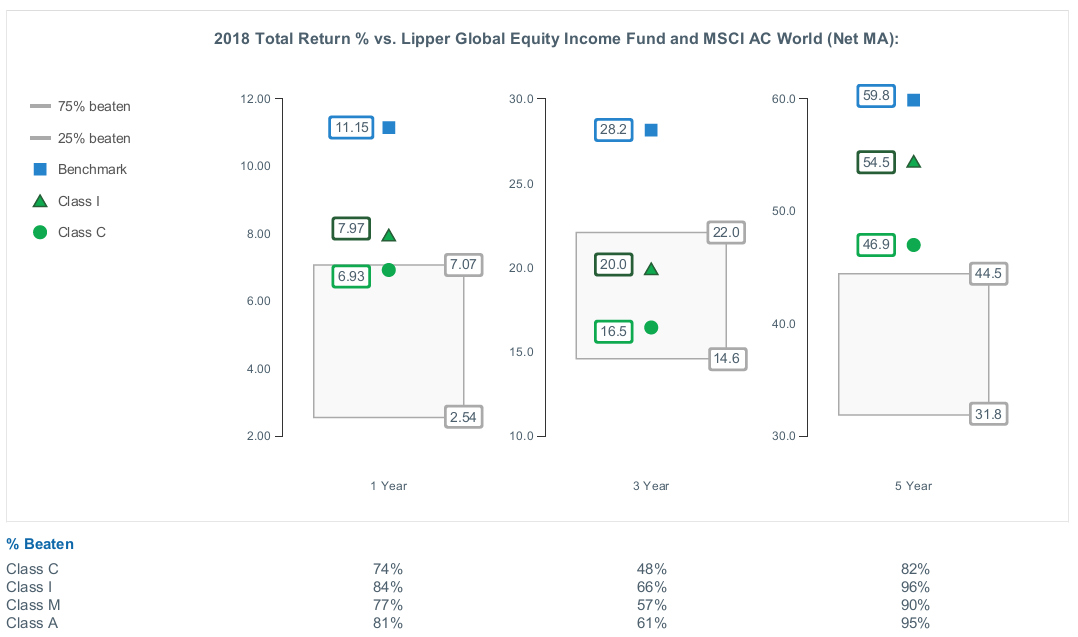
Based on its review, the Board concluded that the nature, extent, and quality of services provided to the fund under the Advisory Contracts should continue to benefit the shareholders of the fund.
Competitiveness of Management Fee and Total Expense Ratio. The Board considered the fund's management fee and total expense ratio compared to "mapped groups" of competitive funds and classes created for the purpose of facilitating the Trustees' competitive analysis of management fees and total expenses. Fidelity creates "mapped groups" by combining similar Lipper investment objective categories that have comparable investment mandates. Combining Lipper investment objective categories aids the Board's management fee and total expense ratio comparisons by broadening the competitive group used for comparison.
Management Fee. The Board considered two proprietary management fee comparisons for the 12-month periods (ended June 30 for 2018 and December 31 for prior periods) shown in basis points (BP) in the chart below. The group of Lipper funds used by the Board for management fee comparisons is referred to below as the "Total Mapped Group." The Total Mapped Group is broader than the Lipper peer group used by the Board for performance comparisons because the Total Mapped Group combines several Lipper investment objective categories while the Lipper peer group does not. The Total Mapped Group comparison focuses on a fund's standing in terms of gross management fees before expense reimbursements or caps relative to the total universe of funds with comparable investment mandates, regardless of whether their management fee structures also are comparable. Funds with comparable investment mandates offer exposure to similar types of securities. Funds with comparable management fee structures have similar management fee contractual arrangements (
e.g., flat rate charged for advisory services, all-inclusive fee rate,
etc.). "TMG %" represents the percentage of funds in the Total Mapped Group that had management fees that were lower than the fund's. For example, a hypothetical TMG % of 20% would mean that 80% of the funds in the Total Mapped Group had higher, and 20% had lower, management fees than the fund. The fund's actual TMG %s and the number of funds in the Total Mapped Group are in the chart below. The "Asset-Size Peer Group" (ASPG) comparison focuses on a fund's standing relative to a subset of non-Fidelity funds within the Total Mapped Group that are similar in size and management fee structure. For example, if a fund is in the first quartile of the ASPG, the fund's management fee ranks in the least expensive or lowest 25% of funds in the ASPG. The ASPG represents at least 15% of the funds in the Total Mapped Group with comparable asset size and management fee structures, subject to a minimum of 50 funds (or all funds in the Total Mapped Group if fewer than 50). Additional information, such as the ASPG quartile in which the fund's management fee rate ranked, is also included in the chart and was considered by the Board.
Fidelity Advisor Global Equity Income Fund
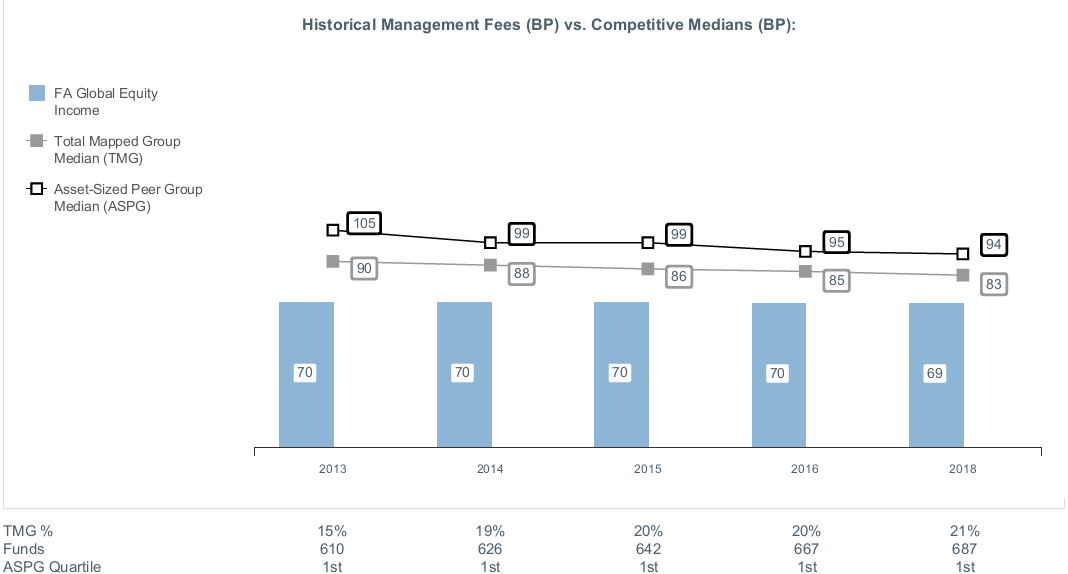
The Board noted that the fund's management fee rate ranked below the median of its Total Mapped Group and below the median of its ASPG for the 12-month period ended June 30, 2018.
The Board noted that it and the boards of other Fidelity funds formed an ad hoc Committee on Group Fee, which meets periodically, to conduct an in-depth review of the "group fee" component of the management fee of funds with such management fee structures. The Committee's focus included the mechanics of the group fee, the competitive landscape of group fee structures, Fidelity funds with no group fee component and investment products not included in group fee assets. The Board also considered that, for funds subject to the group fee, FMR agreed to voluntarily waive fees over a specified period of time in amounts designed to account for assets converted from certain funds to certain collective investment trusts.
The Board also noted that, in 2013, the ad hoc Committee on Management Fees was formed to conduct an in-depth review of the management fee rates of Fidelity's active equity mutual funds. The Committee focused on the following areas: (i) standard fee structures; (ii) research consumption and trading evolution; (iii) management fee competitiveness/profitability by category; and (iv) factors that drive institutional pricing.
Based on its review, the Board concluded that the fund's management fee is fair and reasonable in light of the services that the fund receives and the other factors considered.
Total Expense Ratio. In its review of each class's total expense ratio, the Board considered the fund's management fee rate as well as other fund or class expenses, as applicable, such as transfer agent fees, pricing and bookkeeping fees, fund-paid 12b-1 fees, and custodial, legal, and audit fees. The Board also noted that Fidelity may agree to waive fees and expenses from time to time, and the extent to which, if any, it has done so for the fund. As part of its review, the Board also considered the current and historical total expense ratios of each class of the fund compared to competitive fund median expenses. Each class of the fund is compared to those funds and classes in the Total Mapped Group (used by the Board for management fee comparisons) that have a similar sales load structure.
The Board noted that the total expense ratio of each class ranked above the competitive median for the 12-month period ended June 30, 2018. The Board considered that, in general, various factors can affect total expense ratios. The Board noted that the total expense ratio of Class A was above the competitive median because of relatively higher other expenses due to asset levels or small average account sizes. The Board noted that the total expense ratio of Class M was above the competitive median primarily because of higher 12b-1 fees on Class M as compared to most competitor funds. Class M has a higher 12b-1 fee, but a lower front-end sales charge, than traditionally priced front-end sales charge classes. The Board considered that Class M is primarily sold load-waived to retirement plans and intermediary wrap programs where its 0.50% 12b-1 fee is comparable to competing no-load, higher 12b-1 fee classes designed specifically for retirement plans and wrap programs. The Board noted that the total expense ratio of Class C was above the competitive median primarily because of its 1.00% 12b-1 fee. The Board noted that, although Class I is categorized by Lipper as an institutional class, Class I has a significantly lower investment minimum than most other funds and classes categorized as institutional. As a result, FMR believes Class I is generally more comparable to retail funds and classes. The Board noted that the fund offers multiple classes, each of which has a different sales load and 12b-1 fee structure, and that the multiple structures are intended to offer a range of pricing options for the intermediary market. The Board also noted that the total expense ratios of the classes vary primarily by the level of their 12b-1 fees, although differences in transfer agent fees may also cause expenses to vary from class to class.
The Board further considered that FMR has contractually agreed to reimburse Class A, Class M, Class C, and Class I of the fund to the extent that total operating expenses, with certain exceptions, as a percentage of their respective average net assets, exceed 1.45%, 1.70%, 2.20%, and 1.20% through February 29, 2020.
Fees Charged to Other Fidelity Clients. The Board also considered Fidelity fee structures and other information with respect to clients of Fidelity, such as other funds advised or subadvised by Fidelity, pension plan clients, and other institutional clients with similar mandates. The Board noted that a joint ad hoc committee created by it and the boards of other Fidelity funds periodically reviews and compares Fidelity's institutional investment advisory business with its business of providing services to the Fidelity funds and also noted the most recent findings of the committee. The Board noted that the committee's review included a consideration of the differences in services provided, fees charged, and costs incurred, as well as competition in the markets serving the different categories of clients.
Based on its review of total expense ratios and fees charged to other Fidelity clients, the Board concluded that the total expense ratio of each class of the fund was reasonable in light of the services that the fund and its shareholders receive and the other factors considered.
Costs of the Services and Profitability. The Board considered the revenues earned and the expenses incurred by Fidelity in conducting the business of developing, marketing, distributing, managing, administering and servicing the fund and servicing the fund's shareholders. The Board also considered the level of Fidelity's profits in respect of all the Fidelity funds.
On an annual basis, Fidelity presents to the Board information about the profitability of its relationships with the fund. Fidelity calculates profitability information for each fund, as well as aggregate profitability information for groups of Fidelity funds and all Fidelity funds, using a series of detailed revenue and cost allocation methodologies which originate with the books and records of Fidelity on which Fidelity's audited financial statements are based. The Audit Committee of the Board reviews any significant changes from the prior year's methodologies.
PricewaterhouseCoopers LLP (PwC), auditor to Fidelity and certain Fidelity funds, has been engaged annually by the Board as part of the Board's assessment of Fidelity's profitability analysis. PwC's engagement includes the review and assessment of the methodologies used by Fidelity in determining the revenues and expenses attributable to Fidelity's mutual fund business, and completion of agreed-upon procedures in respect of the mathematical accuracy of the fund profitability information and its conformity to established allocation methodologies. After considering PwC's reports issued under the engagement and information provided by Fidelity, the Board concluded that while other allocation methods may also be reasonable, Fidelity's profitability methodologies are reasonable in all material respects.
The Board also reviewed Fidelity's non-fund businesses and potential indirect benefits such businesses may have received as a result of their association with Fidelity's mutual fund business (i.e., fall-out benefits) as well as cases where Fidelity's affiliates may benefit from the fund's business. The Board noted that changes to fall-out benefits year-over-year reflect business developments at Fidelity's various businesses.
The Board considered the costs of the services provided by and the profits realized by Fidelity in connection with the operation of the fund and was satisfied that the profitability was not excessive.
Economies of Scale. The Board considered whether there have been economies of scale in respect of the management of the Fidelity funds, whether the Fidelity funds (including the fund) have appropriately benefited from any such economies of scale, and whether there is potential for realization of any further economies of scale. The Board considered the extent to which the fund will benefit from economies of scale as assets grow through increased services to the fund, through waivers or reimbursements, or through fee or expense ratio reductions. The Board also noted that a committee (the Economies of Scale Committee) created by it and the boards of other Fidelity funds periodically analyzes whether Fidelity attains economies of scale in respect of the management and servicing of the Fidelity funds, whether the Fidelity funds have appropriately benefited from such economies of scale, and whether there is potential for realization of any further economies of scale.
The Board recognized that the fund's management contract incorporates a "group fee" structure, which provides for lower group fee rates as total group assets increase, and for higher group fee rates as total group assets decrease (with "group assets" defined to include fund assets under FMR's management plus the assets of sector funds previously under FMR's management). FMR calculates the group fee rates based on a tiered asset "breakpoint" schedule that varies based on asset class. The Board considered that the group fee is designed to deliver the benefits of economies of scale to fund shareholders when total Fidelity fund assets increase, even if assets of any particular fund are unchanged or have declined, because some portion of Fidelity's costs are attributable to services provided to all Fidelity funds, and all funds benefit if those costs can be allocated among more assets. The Board concluded that, given the group fee structure, fund shareholders will benefit from lower management fees as group assets increase at the fund complex level, regardless of whether Fidelity achieves any such economies of scale.
The Board concluded, taking into account the analysis of the Economies of Scale Committee, that economies of scale, if any, are being appropriately shared between fund shareholders and Fidelity.
Additional Information Requested by the Board. In order to develop fully the factual basis for consideration of the Fidelity funds' advisory contracts, the Board requested and received additional information on certain topics, including: (i) fund performance trends, in particular the underperformance of certain funds, and Fidelity's long-term strategies for certain funds; (ii) Fidelity's fund profitability methodology, profitability trends for certain funds, and the impact of certain factors on fund profitability results; (iii) metrics for evaluating index fund and ETF performance and information about ETF trading characteristics; (iv) the methodology with respect to the evaluation of competitive fund data and peer group classifications and fee comparisons; (v) the expense structures for different funds and classes; (vi) information regarding other accounts managed by Fidelity, including collective investment trusts; and (vii) Fidelity's philosophies and strategies for evaluating funds and classes with lower or declining asset levels.
Based on its evaluation of all of the conclusions noted above, and after considering all factors it believed relevant, the Board concluded that the advisory fee arrangements are fair and reasonable, and that the fund's Advisory Contracts should be renewed.
AGED-SANN-0619
1.938154.106
Item 2.
Code of Ethics
Not applicable.
Item 3.
Audit Committee Financial Expert
Not applicable.
Item 4.
Principal Accountant Fees and Services
Not applicable.
Item 5.
Audit Committee of Listed Registrants
Not applicable.
Item 6.
Investments
(a)
Not applicable.
(b)
Not applicable
Item 7.
Disclosure of Proxy Voting Policies and Procedures for Closed-End Management Investment Companies
Not applicable.
Item 8.
Portfolio Managers of Closed-End Management Investment Companies
Not applicable.
Item 9.
Purchase of Equity Securities by Closed-End Management Investment Company and Affiliated Purchasers
Not applicable.
Item 10.
Submission of Matters to a Vote of Security Holders
There were no material changes to the procedures by which shareholders may recommend nominees to the Fidelity Advisor Series VIII’s Board of Trustees.
Item 11.
Controls and Procedures
(a)(i) The President and Treasurer and the Chief Financial Officer have concluded that the Fidelity Advisor Series VIII’s (the “Trust”) disclosure controls and procedures (as defined in Rule 30a-3(c) under the Investment Company Act) provide reasonable
assurances that material information relating to the Trust is made known to them by the appropriate persons, based on their evaluation of these controls and procedures as of a date within 90 days of the filing date of this report.
(a)(ii) There was no change in the Trust’s internal control over financial reporting (as defined in Rule 30a-3(d) under the Investment Company Act) that occurred during the period covered by this report that has materially affected, or is reasonably likely to materially affect, the Trust’s internal control over financial reporting.
Item 12.
Disclosure of Securities Lending Activities for Closed-End Management
Investment Companies
Not applicable.
Item 13.
Exhibits
| | |
(a) | (1) | Not applicable. |
(a) | (2) | Certification pursuant to Rule 30a-2(a) under the Investment Company Act of 1940 (17 CFR 270.30a-2(a)) is filed and attached hereto as Exhibit 99.CERT. |
(a) | (3) | Not applicable. |
(b) |
| Certification pursuant to Rule 30a-2(b) under the Investment Company Act of 1940 (17 CFR 270.30a-2(b)) is furnished and attached hereto as Exhibit 99.906CERT. |
SIGNATURES
Pursuant to the requirements of the Securities Exchange Act of 1934 and the Investment Company Act of 1940, the registrant has duly caused this report to be signed on its behalf by the undersigned, thereunto duly authorized.
Fidelity Advisor Series VIII
| |
By: | /s/Stacie M. Smith |
| Stacie M. Smith |
| President and Treasurer |
|
|
Date: | June 25, 2019 |
Pursuant to the requirements of the Securities Exchange Act of 1934 and the Investment Company Act of 1940, this report has been signed below by the following persons on behalf of the registrant and in the capacities and on the dates indicated.
| |
By: | /s/Stacie M. Smith |
| Stacie M. Smith |
| President and Treasurer |
|
|
Date: | June 25, 2019 |
| |
By: | /s/John J. Burke III |
| John J. Burke III |
| Chief Financial Officer |
|
|
Date: | June 25, 2019 |