UNITED STATES SECURITIES AND EXCHANGE COMMISSION
Washington, D.C. 20549
FORM 10-K
S ANNUAL REPORT PURSUANT TO SECTION 13 OR 15(d)
OF THE SECURITIES EXCHANGE ACT OF 1934
For the fiscal year ended December 31, 2010
OR
o TRANSITION REPORT PURSUANT TO SECTION 13 OR 15(d)
OF THE SECURITIES EXCHANGE ACT OF 1934
For the transition period from to
Commission file number 1-11533
Parkway Properties, Inc.
(Exact name of registrant as specified in its charter)
| Maryland | 74-2123597 |
| (State or other jurisdiction | (I.R.S. Employer |
| of incorporation or organization) | Identification No.) |
One Jackson Place Suite 1000
188 East Capitol Street
Jackson, Mississippi 39201
(Address of principal executive offices) (Zip Code)
Registrant's telephone number: (601) 948-4091
Registrant's website: www.pky.com
Securities registered pursuant to Section 12(b) of the Act:
Common Stock, $.001 Par Value
8.00% Series D Cumulative Redeemable Preferred Stock $.001 Par Value
New York Stock Exchange
Securities registered pursuant to Section 12(g) of the Act:
None
Indicate by check mark if the registrant is a well-known seasoned issuer, as defined in Rule 405 of the Securities Act. o Yes S No
Indicate by check mark if the registrant is not required to file reports pursuant to Section 13 or Section 15(d) of the Act.
o Yes S No
Indicate by check mark whether the registrant (1) has filed all reports required to be filed by Section 13 or 15(d) of the Securities Exchange Act of 1934 during the preceding 12 months (or for such shorter period that the registrant was required to file such reports), and (2) has been subject to such filing requirements for the past 90 days. S Yes o No
Indicate by check mark whether the registrant has submitted electronically and posted on its corporate Web site, if any, every Interactive Data File required to be submitted and posted pursuant to Rule 405 of Regulation S-T (§232.405 of this chapter) during the preceding 12 months (or for such shorter period that the registrant was required to submit and post such files).
Yes o No o* (*Registrant is not subject to the requirements of Rule 405 of Regulation S-T at this time.)
Indicate by check mark if disclosure of delinquent filers pursuant to Item 405 of Regulation S-K is not contained herein, and will not be contained, to the best of registrant's knowledge, in definitive proxy or information statements incorporated by reference in Part III of this Form 10-K or any amendment to this Form 10-K. S
Indicate by check mark whether the registrant is a large accelerated filer, an accelerated filer, a non-accelerated filer or a smaller reporting company. See definition of “large accelerated filer” in Rule 12b-2 of the Exchange Act. (Check one):
Large accelerated filer o Accelerated filer S Non-accelerated filer o Smaller reporting company o (do not check if a smaller reporting company)
Indicate by check mark whether the registrant is a shell company (as defined in Rule 12b-2 of the Exchange Act).
o Yes S No
The aggregate market value of the voting and non-voting common equity held by non-affiliates computed by reference to the price at which the common equity was last sold, or the average bid and asked price of such common equity, at June 30, 2010 was $301.8 million.
The number of shares outstanding in the registrant's class of common stock at March 1, 2011 was 21,962,564.
DOCUMENTS INCORPORATED BY REFERENCE
Portions of the Registrant's Proxy Statement for the 2011 Annual Meeting of Shareholders are incorporated by reference into Part III.
PARKWAY PROPERTIES, INC.
TABLE OF CONTENTS
| | | Page |
| | | |
| PART I. | | |
| Item 1. | Business | 3 |
| Item 1A. | Risk Factors | 6 |
| Item 1B. | Unresolved Staff Comments | 12 |
| Item 2. | Properties | 12 |
| Item 3. | Legal Proceedings | 17 |
| Item 4. | [Removed and Reserved] | 18 |
| | | |
| PART II. | | |
| Item 5. | Market for Registrant's Common Equity, Related Stockholder Matters and Issuer Purchases | |
| | of Equity Securities | 18 |
| Item 6. | Selected Financial Data | 21 |
| Item 7. | Management's Discussion and Analysis of Financial Condition and Results of Operations | 22 |
| Item 7A. | Quantitative and Qualitative Disclosures About Market Risk | 47 |
| Item 8. | Financial Statements and Supplementary Data | 47 |
| Item 9. | Changes in and Disagreements with Accountants on Accounting and Financial Disclosure | 87 |
| Item 9A. | Controls and Procedures | 87 |
| Item 9B. | Other Information | 89 |
| | | |
| PART III. | | |
| Item 10. | Directors, Executive Officers and Corporate Governance | 89 |
| Item 11. | Executive Compensation | 89 |
| Item 12. | Security Ownership of Certain Beneficial Owners and Management and Related Stockholder Matters | 89 |
| Item 13. | Certain Relationships and Related Transactions, and Director Independence | 90 |
| Item 14 | Principal Accountant Fees and Services | 90 |
| | | |
| PART IV. | | |
| Item 15. | Exhibits and Financial Statement Schedules | 90 |
| | | |
| SIGNATURES | |
| Authorized Signatures | 93 |
PART I
Overview
Parkway Properties, Inc. is a real estate investment trust ("REIT") specializing in the operation, leasing, acquisition and ownership of office properties. The Company performs these services for its own account and for other institutional investors through co-ownership structures such as discretionary funds and/or partnerships. The terms “we,” “us,” “our,” “Parkway,” or the “Company” refer to Parkway Properties, Inc. individually or together with its subsidiaries. The Company is geographically focused on the Southeastern and Southwestern United States and Chicago. Parkway and its predecessors have been public companies engaged in the real estate business since 1971, and the management team has had experience managing a public real estate company through all phases of the real estate business cycle. As part of its strategy, the Company places an emphasis on property operations and customer satisfaction with an ultimate goal of achieving a high level of customer retention. The Company is self-administered, in that it provides its own investment and administrative services internally through its own employees. The Company is also self-managed, as it internally provides the management, maintenance and other real estate services that its properties require through its own employees, such as property managers and engineers and in some cases, leasing professionals. In addition Parkway is self-leased for renewal leases for the majority of its office property portfolio.
At March 1, 2011, Parkway owned or had an interest in 65 office properties located in 11 states with an aggregate of approximately 13.7 million square feet of leasable space. Included in the portfolio are two discretionary funds and several partnership arrangements which encompass 20 properties totaling 4.1 million square feet, representing 30.3% of the portfolio. With the discretionary funds and/or partnerships, the Company receives fees for asset management, property management, leasing and construction management services and potentially receives incentive fees upon sale if certain investment targets are achieved. Increasing the number of co-investments, and consequently the related fee income, is part of the Company’s strategy to transform itself to an operator-owner versus an owner-operator. The strategy highlights the Company’s strength in providing excellent service in the operation and acquisition of office properties for investment clients in addition to its direct ownership of real estate assets. Fee-based real estate services are offered through the Company’s wholly-owned subsidiary, Parkway Realty Services LLC (“PRS”), which also manages and/or leases approximately 1.6 million square feet for third-party owners at March 1, 2011.
Strategic Planning
Parkway is a focused office REIT with a hands-on, service-oriented approach, a disciplined capital allocation program and a willingness to recycle assets. We continue to focus on the Company’s strategy of transforming itself to an operator-owner from an owner-operator, as well as maximizing total return to shareholders. To show our commitment to this goal, our newest strategic plan is centered on a goal of achieving a 12% compounded annual total return to our shareholders over a three-year period. This plan is known as the FOCUS Plan (the “Plan”), which began July 1, 2010 and will extend three full years through June 30, 2013. The goals of the Plan are as follows:
| · | Fund and Fund-Like Investments. The Company believes that fund and fund-like investments have the highest priority of the Company’s capital allocation, because it gives Parkway’s stockholders the highest risk adjusted return as measured by internal rate of return, capitalization rate and accretion per share. |
| · | Operator-Owner. The Company plans to make a full transformation to an operator-owner, with the goal of being a majority operator/owner by the end of the Plan. This has been a goal for several years and will continue to be a core strategy as Parkway seeks to increase fee income and maximize its return on equity and accretion per share. Additionally, the Company will continue to expand PRS, which offers expert real estate management guidance, professional property management services and strategic marketing and leasing services aimed at increasing net operating income and maximizing profit upon exit. |
| · | Capital Allocation Discipline. The Company’s overall capital structure goal is to achieve a net debt to gross asset value ratio of 50% or less, as determined by using a capitalization rate of 8.5% on recurring cash income, and a net debt to earnings before interest, taxes, depreciation and amortization (“EBITDA”) multiple of 6.5 times or less. Beyond the balance sheet, capital allocation refers to the Company’s goal to exit non-strategic markets through the continuation of its Asset Recycling program. Most of the properties |
identified for sale are smaller assets or assets located in smaller markets where Parkway does not have a significant presence. By the end of the FOCUS Plan, the Company’s goal is to be invested in larger, higher-quality properties located in higher-rent growth markets through fund and fund-like investments. The Company will continue to maintain discipline as it relates to managing the balance sheet and the acquisition and disposition of assets.
| · | Uncompromising Focus on Operations. Parkway believes that its uncompromising focus on operations is what sets it apart from other office property owners. An important goal of the FOCUS Plan is to move decision-making authority to the regional office level. The Company’s market leaders already have the responsibility of setting rents, increasing net operating income margins and maintaining a consistent standard of operations and will be given more profit and loss responsibility and investment authority going forward. It is important that we know our markets, which is best achieved when Parkway’s people live and work within the market. An integral part of the FOCUS Plan is a program referred to as “We Know… City.” These three words imply that Parkway employees know more than just how to manage real estate, but that they have a deep understanding of a city’s history, economics, infrastructure, politics and much more. By truly knowing the cities where the Company is invested, we are better positioned for leasing, active asset management, recruitment and investments. |
| · | Shareholder Returns. All of the previously mentioned goals funnel to the ultimate goal of the FOCUS Plan, which is to maximize total return to Parkway’s shareholders. The Company has set a goal of achieving a 12% compounded annual total return to its shareholders for the three-year period starting July 1, 2010. |
Discretionary Funds and Partnerships
Parkway intends to continue raising discretionary funds and forming partnerships with select institutional investors. Under the terms of these funds and partnerships, where applicable, Parkway will manage all phases of the investment cycle including acquisition, financing, operations, leasing and dispositions. The Company will receive fees for providing these services. At March 1, 2011, Parkway had two discretionary funds and two partnership agreements of this nature.
On July 6, 2005, Parkway, through affiliated entities, entered into a limited partnership agreement forming a $500.0 million discretionary fund known as Parkway Properties Office Fund, L.P. (“Fund I”) with Ohio Public Employees Retirement System (“Ohio PERS”) for the purpose of acquiring high-quality multi-tenant office properties. Ohio PERS is a 75% investor and Parkway is a 25% investor in the fund, which is capitalized with approximately $200.0 million of equity capital and $300.0 million of non-recourse, fixed-rate first mortgage debt. At February 15, 2008, Fund I was fully invested.
Fund I targeted properties with a leveraged internal rate of return of greater than 11%. Parkway serves as the general partner of the fund and provides asset management, property management, leasing and construction management services to the fund, for which it is paid market-based fees. After each partner has received a 10% annual cumulative preferred return and a return of invested capital, 60% will be distributed to Ohio PERS and 40% to Parkway. The term of Fund I will be seven years from the date the fund was fully invested until February 2015, with provisions to extend the term for two additional one-year periods.
On May 14, 2008, Parkway, through affiliated entities, entered into a limited partnership agreement forming a $750.0 million discretionary fund known as Parkway Properties Office Fund II, L.P. (“Fund II”) with Teacher Retirement System of Texas (“TRST”) for the purpose of acquiring high-quality multi-tenant office properties. TRST is a 70% investor and Parkway is a 30% investor in the fund, which will be capitalized with approximately $375.0 million of equity capital and $375.0 million of non-recourse, fixed-rate first mortgage debt. Parkway’s share of the equity contribution for the fund will be $112.5 million. The Company intends to fund its share of equity contributions with proceeds from asset sales, issuance of equity securities and/or advances on the credit facility as needed on a temporary basis. Fund II targets acquisitions in the core markets of Houston, Austin, San Antonio, Chicago, Atlanta, Phoenix, Charlotte, Memphis, Nashville, Jacksonville, Orlando, Tampa/St. Petersburg, and Ft. Lauderdale, as well as other growth markets to be determined at Parkway’s discretion.
Fund II targets properties with an anticipated leveraged internal rate of return of greater than 10%. Parkway serves as the general partner of the fund and provides asset management, property management, leasing and construction management services to the fund, for which it is paid market-based fees. Cash will be distributed pro
rata to each partner until a 9% annual cumulative preferred return is received and invested capital is returned. Thereafter, 56% will be distributed to TRST and 44% to Parkway. Parkway has four years from the inception date, or through May 2012, to identify and acquire properties (the “Investment Period”), with funds contributed as needed to close acquisitions. Parkway will exclusively represent the fund in making acquisitions within the target markets and acquisitions with certain predefined criteria. Parkway will not be prohibited from making fee-simple or joint venture acquisitions in markets outside of the target markets, acquiring properties within the target markets that do not meet Fund II’s specific criteria or selling a full or partial interest in currently owned properties. The term of Fund II will be seven years from the expiration of the Investment Period, with provisions to extend the term for two additional one-year periods at the discretion of Parkway. At March 1, 2011, Fund II had remaining investment capacity of $552.1 million of which $81.8 million represents Parkway’s remaining equity contribution that would be due in connection with additional investments in office properties.
Third-Party Management
The Company benefits from a fully integrated management infrastructure, provided by its wholly-owned management subsidiary, PRS. In addition to the Company’s owned properties, PRS currently manages and/or leases approximately 5.7 million net rentable square feet for third-party owners, joint venture interests and fund properties. The Company intends to expand its third-party fee business through funds or similar ventures as well as through third party management and leasing contracts.
Financing Strategy
The Company expects to continue seeking primarily fixed rate, non-recourse mortgage financing with maturities from five to ten years typically amortizing over 25 to 30 years on select office building investments as additional capital is needed. The Company monitors a number of leverage and other financial metrics defined in the loan agreements for the Company’s unsecured credit facility and working capital unsecured credit facility, which includes the Company’s total debt to total asset value. In addition, the Company monitors interest, fixed charge and modified fixed charge coverage ratios as well as the net debt to gross asset value and the net debt to EBITDA multiple. Management believes all of the leverage and other financial metrics it monitors, including those discussed above, provide useful information on total debt levels as well as the Company’s ability to cover interest, principal and/or preferred dividend payments with current income. The Company targets a net debt to gross asset value of 50% or less and a net debt to EBITDA multiple of 6.5 times or less.
Parkway may, in appropriate circumstances, acquire one or more properties in exchange for Parkway's equity securities. Parkway has no set policy as to the amount or percentage of its assets which may be invested in any specific property. Rather than a specific policy, Parkway evaluates each property in terms of whether and to what extent the property meets Parkway's investment criteria and strategic objectives. The strategies and policies set forth above were determined, and are subject to review by, Parkway's Board of Directors which may change such strategies or policies based upon their evaluation of the state of the real estate market, the performance of Parkway's assets, capital and credit market conditions, and other relevant factors.
Capital Allocation
Capital allocation receives constant review by management and the Board of Directors considering many factors including the capital markets, our weighted average cost of capital, buying criteria (written and published), the real estate market and management of the risk associated with the rate of return. We examine all aspects of each type of investment whether it is a fund asset, Parkway common stock, a mortgage loan receivable or a fee simple purchase. Each carries a relationship to replacement cost which is still an important underwriting discipline for us. Each has a current yield and a leveraged and unleveraged internal rate of return that can be measured on a relative and absolute basis. Currently, management views investing in funds and similar ventures as the highest priority of our capital allocation because it produces the highest risk adjusted return as measured by internal rate of return and current cash return. Other investment alternatives are available to us but with lesser return or slightly higher risk so we are principally focused on funds or similar ventures at the present time. During 2010, the REIT industry began to see an increase in investments in real estate as a result of more equity being deployed by investors, as well as a more favorable credit environment. As a result, the Company continues to monitor its buying criteria and to exercise discipline when making capital allocation decisions but expects to begin making more investments in Fund II during 2011.
Industry Segments
Parkway’s primary business is the operation and ownership of office properties. The Company accounts for each office property or groups of related office properties as an individual operating segment. Parkway has aggregated its individual operating segments into a single reporting segment due to the fact that the individual operating segments have similar operating and economic characteristics.
The individual operating segments exhibit similar economic characteristics such as being leased by the square foot, sharing the same primary operating expenses and ancillary revenue opportunities and being cyclical in the economic performance based on current supply and demand conditions. The individual operating segments are also similar in that revenues are derived from the leasing of office space to customers and each office property is managed and operated consistently in accordance with Parkway’s standard operating procedures. The range and type of customer uses of our properties is similar throughout our portfolio regardless of location or class of building and the needs and priorities of our customers do not vary from building to building. Therefore, Parkway’s management responsibilities do not vary from location to location based on the size of the building, geographic location or class.
Management Team
Parkway's management team consists of experienced office property specialists with proven capabilities in office property (i) operations; (ii) leasing; (iii) management; (iv) acquisition/disposition; (v) financing; (vi) capital allocation; and (vii) accounting and financial reporting. Parkway's 14 senior officers have an average of 22 years of real estate industry experience, and have worked together at Parkway for an average of 17 years. Management has developed a highly service-oriented operating culture and believes that its focus on operations, proactive leasing, property management and asset management activities will result in higher customer retention and occupancy and will translate into enhanced stockholder value.
Administration
The Company is self-administered and self-managed and maintains its principal executive offices in Jackson, Mississippi. At December 31, 2010, the Company had 256 employees. The operations of the Company are conducted from approximately 17,000 square feet of office space located at 188 East Capitol Street, One Jackson Place, Suite 1000, Jackson, Mississippi. The building is owned by Parkway and is leased by Parkway at market rental rates.
Available Information
Parkway makes available free of charge on the “Corporate” page of its web site, www.pky.com, its filed and furnished reports on Form 10-K, 10-Q and 8-K and all amendments thereto, as soon as reasonably practicable after Parkway electronically files such material with, or furnishes it to, the Securities and Exchange Commission.
The Company’s Corporate Governance Guidelines, Code of Business Conduct and Ethics and the Charters of the Audit Committee, Nominating and Corporate Governance Committee and Compensation Committee of the Board of Directors are available on the “Corporate” page of Parkway’s web site. Copies of these documents are also available free of charge in print upon written request addressed to Investor Relations, Parkway Properties, Inc., One Jackson Place, Suite 1000, 188 East Capitol Street, Jackson, Mississippi 39201.
ITEM 1A. Risk Factors.
In addition to the other information contained or incorporated by reference in this document, readers should carefully consider the following risk factors. Any of these risks or the occurrence of any one or more of the uncertainties described below could have a material adverse effect on the Company's financial condition and the performance of its business. The Company refers to itself as “we” or “our” in the following risk factors.
Our performance is subject to risks inherent in owning real estate investments.
Our investments are generally made in office properties. We are, therefore, generally subject to risks incidental to the ownership of real estate. These risks include:
| · | changes in supply of or demand for office properties or customers for such properties in an area in which we own buildings; |
| · | the ongoing need for capital improvements; |
| · | increased operating costs, which may not necessarily be offset by increased rents, including insurance premiums, utilities and real estate taxes, due to inflation and other factors; |
| · | changes in tax, real estate and zoning laws; |
| · | changes in governmental rules and fiscal policies; and |
| · | civil unrest, acts of war, acts of God, including earthquakes, hurricanes and other natural disasters (which may result in uninsured losses) and other factors beyond our control. |
Should any of these events occur, our financial condition and our ability to make expected distributions to stockholders could be adversely affected.
The economic conditions of our primary markets affect our operations.
Substantially all of our properties are located in the Southeastern and Southwestern United States and Chicago and, therefore, our financial condition and ability to make distributions to our stockholders is linked to economic conditions in these markets as well as the market for office space generally in these markets. A downturn in these markets may adversely affect our cash flows and ability to make distributions to stockholders.
Customer defaults could adversely affect our operations.
Substantially all of our revenues and income come from rental income from real property. As such, our revenues and income could be adversely affected if a significant number of our customers defaulted under their lease obligations. Our ability to manage our assets is also subject to federal bankruptcy laws and state laws that limit creditors' rights and remedies available to real property owners to collect delinquent rents. If a customer becomes insolvent or bankrupt, we cannot be sure that we could recover the premises from the customer promptly or from a trustee or debtor-in-possession in any bankruptcy proceeding relating to that customer. We also cannot be sure that we would receive rent in the proceeding sufficient to cover our expenses with respect to the premises. If a customer becomes bankrupt, the federal bankruptcy code will apply and, in some instances, may restrict the amount and recoverability of our claims against the customer. A customer’s default on its obligations to us could adversely affect our financial condition and the cash we have available for distributions to our stockholders.
Illiquidity of real estate may limit our ability to vary our portfolio.
Real estate investments are relatively illiquid. Our ability to vary our portfolio by selling properties and buying new ones in response to changes in economic and other conditions may therefore be limited. In addition, the Internal Revenue Code limits our ability to sell our properties by imposing a penalty tax of 100% on the gain derived from prohibited transactions, which are defined as sales of property held primarily for sale to customers in the ordinary course of a trade or business. The frequency of sales and the holding period of the property sold are two primary factors in determining whether the property sold fits within this definition. These considerations may limit our opportunities to sell our properties. If we must sell an investment, we cannot assure you that we will be able to dispose of the investment in the time period we desire or that the sales price of the investment will recoup or exceed our cost for the investment, or that the penalty tax would not be assessed.
Our current and future joint venture investments could be adversely affected by the capital markets, our lack of sole decision-making authority, our reliance on joint venture partners' financial condition and any disputes that may arise between us and our joint venture partners.
Co-investing with third parties through joint ventures is a part of our ongoing business strategy. We may not be in a position to exercise sole decision-making authority regarding the properties owned through joint ventures. Investments in joint ventures may, under certain circumstances, involve risks not present when a third party is not involved, including reliance on our joint venture partners and the possibility that joint venture partners might become bankrupt or fail to fund their share of required capital contributions, thus exposing us to liabilities in excess of our share of the investment. The funding of Parkway’s capital contributions may be dependent on proceeds from asset sales, credit facility advances and/or sales of equity securities. In limited cases, such as gross neglect, the Company can be terminated as the provider of certain fee-based services. Joint venture partners may have business interests or goals that are inconsistent with our business interests or goals and may be in a position to take actions contrary to our policies or objectives. Any disputes that may arise between us and joint venture partners may result in litigation or arbitration that would increase our expenses.
Our properties are subject to various federal, state and local regulatory requirements, such as environmental laws, state and local fire and safety requirements, building codes and land use regulations.
Failure to comply with these requirements could subject us to governmental fines or private litigant damage awards. We believe that our properties are currently in material compliance with all applicable regulatory requirements. However, we do not know whether existing requirements will change or whether future requirements, including any requirements that may emerge from pending or future climate change legislation, will require us to make significant unanticipated expenditures that will adversely impact our business, financial condition and results of operations.
Uninsured and underinsured losses may adversely affect operations.
We, or in certain instances, customers of our properties, carry commercial general liability, fire and extended coverage insurance with respect to our properties. This coverage has policy specifications and insured limits that we believe are customarily carried for similar properties. We plan to obtain similar coverage for properties we acquire in the future. However, certain types of losses, generally of a catastrophic nature, such as earthquakes and floods, may be either uninsurable or not economically insurable. Should a property sustain damage, we may incur losses due to insurance deductibles, to co-payments on insured losses or to uninsured losses. In the event of a substantial property loss, the insurance coverage may not be sufficient to pay the full current market value or current replacement cost of the property. In the event of an uninsured loss, we could lose some or all of our capital investment, cash flow and anticipated profits related to one or more properties. Inflation, changes in building codes and ordinances, environmental considerations, and other factors also might make it not feasible to use insurance proceeds to replace a property after it has been damaged or destroyed. Under such circumstances, the insurance proceeds we receive might not be adequate to restore our economic position with respect to such property.
We have existing debt and refinancing risks that could affect our cost of operations.
We currently have both fixed and variable rate indebtedness and may incur indebtedness in the future, including borrowings under our credit facilities, to finance possible acquisitions and for general corporate purposes. As a result, we are and expect to be subject to the risks normally associated with debt financing including:
| · | that interest rates may rise; |
| · | that our cash flow will be insufficient to make required payments of principal and interest; |
| · | that we will be unable to refinance some or all of our debt; |
| · | that any refinancing will not be on terms as favorable as those of the existing debt; |
| · | that required payments on mortgages and on our other debt are not reduced if the economic performance of any property declines; |
| · | that debt service obligations will reduce funds available for distribution to our stockholders; |
| · | that any default on our debt, due to noncompliance with financial covenants or otherwise, could result in acceleration of those obligations; and |
| · | that we may be unable to refinance or repay the debt as it becomes due. |
An increase in interest rates would reduce our net income and funds from operations. We may not be able to refinance or repay debt as it becomes due which may force us to refinance or to incur additional indebtedness at higher rates and additional cost or, in the extreme case, to sell assets or seek protection from our creditors under applicable law.
A lack of any limitation on our debt could result in our becoming more highly leveraged.
Our governing documents do not limit the amount of indebtedness we may incur. Accordingly, our Board of Directors may incur additional debt and would do so, for example, if it were necessary to maintain our status as a REIT. We might become more highly leveraged as a result, and our financial condition and cash available for distribution to stockholders might be negatively affected and the risk of default on our indebtedness could increase.
The cost and terms of mortgage financings may render the sale or financing of a property difficult or unattractive.
The sale of a property subject to a mortgage may trigger pre-payment penalties, yield maintenance payments or make-whole payments to the lender, which would reduce the amount of gain or increase our loss on the sale of a property and could make the sale of a property less likely. Certain of our mortgages will have significant outstanding principal balances on their maturity dates, commonly known as "balloon payments." There is no assurance that we will be able to refinance such balloon payments on the maturity of the loans, which may force disposition of properties on disadvantageous terms or require replacement with debt with higher interest rates, either of which would have an adverse impact on our financial performance and ability to pay distributions to investors.
If the economic downturn continues in the long-term, our business, results of operations, cash flows and financial condition could be adversely affected.
In the U.S., market and economic conditions continue to be challenging with tighter credit conditions and modest growth. While recent economic data reflects a stabilization of the economy and credit markets, the cost and availability of credit may continue to be adversely affected. Furthermore, deteriorating economic conditions including business layoffs, downsizing, industry slowdowns and other similar factors that affect our customers could negatively impact commercial real estate fundamentals and result in lower occupancy, lower rental rates and declining values in our real estate portfolio. The timing of changes in occupancy levels tends to lag the timing of changes in overall economic activity and employment levels. Additionally, the economic situation could have an impact on our lenders or customers, causing them to fail to meet their obligations to us. No assurances can be given that the effects of the current economic conditions will not have a material adverse effect on our business, financial condition and results of operations.
Litigation against us could distract our management and/or negatively impact our operating results.
As noted above under “Prospectus Supplement Summary — Recent Developments”, our former chief financial officer filed (and later withdrew) a complaint against us with OSHA, filed a personal injury lawsuit against us, and threatened a shareholder derivative lawsuit on behalf of our company against us, our directors and officers. We are disputing the allegations made by Mr. Collins. The Company’s Board of Directors appointed the Audit Committee (the “Committee”) of the board to review and evaluate the claims made in Mr. Collins’ shareholder demand letter. The Committee engaged independent counsel to assist with the review and evaluation of these claims. After thoroughly investigating the allegations in good faith and fully informing itself of all material facts relevant thereto, the Committee believes that the Company did not operate in a fraudulent or misleading manner regarding either the termination of Mr. Collins or the disclosure of the Company’s 2010 earnings guidance. Further, the Committee determined that it would not serve the interests of Parkway or its shareholders for the Company to take any of the further actions requested in the demand letter. Although it is not possible to predict the outcome of litigation with any certainty, claims of this nature present a risk of protracted litigation, regulatory investigations or enforcement, monetary damages, injunctive orders, fines, attorneys’ fees, costs and expenses, and diversion of management’s attention from the operation of our business.
We may amend our investment strategy and business policies without your approval.
Our Board of Directors determines our growth, investment, financing, capitalization, borrowing, REIT status, operating and distribution policies. Although the Board of Directors has no present intention to amend or revise any of these policies, these policies may be amended or revised without notice to and approval from stockholders. Accordingly, stockholders may not have control over changes in our policies.
Loss of our tax status as a real estate investment trust would have significant adverse consequences to us and the value of our securities.
We believe that we qualify for taxation as a REIT for federal income tax purposes, and we plan to operate so that we can continue to meet the requirements for taxation as a REIT. To qualify as a REIT we must satisfy numerous requirements (some on an annual and quarterly basis) established under the highly technical and complex provisions of the Internal Revenue Code (“Code”) applicable to REITs, which include:
| · | maintaining ownership of specified minimum levels of real estate related assets; |
| · | generating specified minimum levels of real estate related income; |
| · | maintaining certain diversity of ownership requirements with respect to our shares; and |
| · | distributing at least 90% of our taxable income on an annual basis. |
The distribution requirement noted above could adversely affect our ability to use earnings for improvements or acquisitions because funds distributed to stockholders will not be available for capital improvements to existing properties or for acquiring additional properties.
Only limited judicial and administrative interpretations exist of the REIT rules. In addition, qualification as a REIT involves the determination of various factual matters and circumstances not entirely within our control.
If we fail to qualify as a REIT, we will be subject to federal income tax (including any applicable alternative minimum tax) on our taxable income at corporate rates. In addition, unless entitled to relief under certain statutory provisions, we will be disqualified from treatment as a REIT for the four taxable years following the year during which we failed to qualify. This treatment would reduce net earnings available for investment or distribution to stockholders because of the additional tax liability for the year or years involved. In addition, we would no longer be required to make distributions to our stockholders. To the extent that distributions to stockholders had been made based on our qualifying as a REIT, we might be required to borrow funds or to liquidate certain of our investments to pay the applicable tax.
As a REIT, we have been and will continue to be subject to certain federal, state and local taxes on our income and property.
The requirements necessary to maintain our REIT status may limit our ability to earn additional fee income at the REIT level, which may cause us to conduct fee-generating activities through a taxable REIT subsidiary.
The REIT provisions of the Code may limit our ability to earn additional management fee and other fee income from joint ventures and third parties. Our aggregate gross income from fees and certain other non-qualifying sources cannot exceed 5% of our annual gross income. As a result, our ability to increase the amount of fee income we earn at the REIT level may be limited, and we may have to conduct fee-generating activities through a taxable REIT subsidiary. Any fee income we earn through a taxable REIT subsidiary would be subject to federal, state, and local income tax at regular corporate rates, which would reduce our net income from our fee-generating activities.
There is a risk of changes in the tax law applicable to real estate investment trusts.
Since the Internal Revenue Service, the United States Treasury Department and Congress frequently review federal income tax legislation, we cannot predict whether, when or to what extent new federal tax laws, regulations, interpretations or rulings will be adopted. Any of such legislative action may prospectively or retroactively modify our tax treatment and, therefore, may adversely affect taxation of us and/or our investors.
Limitations on the ownership of our common stock may preclude the acquisition or change of control of our Company.
Certain provisions contained in our charter and bylaws and certain provisions of Maryland law may have the effect of discouraging a third party from making an acquisition proposal for us and may thereby inhibit a change of control. Provisions of our charter are designed to assist us in maintaining our qualification as a REIT under the Code by preventing concentrated ownership of our capital stock that might jeopardize REIT qualification. Among other things, these provisions provide that, if a transfer of our stock or a change in our capital structure would result in (1) any person (as defined in the charter) directly or indirectly acquiring beneficial ownership of more than 9.8% (in value or in number, whichever is more restrictive) of our outstanding equity stock excluding Excess Stock, (2) our outstanding shares being constructively or beneficially owned by fewer than 100 persons, or (3) our being "closely held" within the meaning of Section 856(h) of the Code, then:
| · | any proposed transfer will be void from the beginning and we will not recognize such transfer; |
| · | we may institute legal proceedings to enjoin such transfer; |
| · | we will have the right to redeem the shares proposed to be transferred; and |
| · | the shares proposed to be transferred will be automatically converted into and exchanged for shares of a separate class of stock, the Excess Stock. |
Excess Stock has no dividend or voting rights but holders of Excess Stock do have certain rights in the event of our liquidation, dissolution or winding up. Our charter provides that we will hold the Excess Stock as trustee for the person or persons to whom the shares are ultimately transferred, until the time that the shares are retransferred to a person or persons in whose hands the shares would not be Excess Stock and certain price-related restrictions are satisfied. These provisions may have an anti-takeover effect by discouraging tender offers or purchases of large blocks of stock, thereby limiting the opportunity for stockholders to receive a premium for their shares over then-prevailing market prices. Under the terms of our charter, our Board of Directors has the authority to waive these ownership restrictions.
Furthermore, under our charter, the Board of Directors has the authority to classify and reclassify any of our unissued shares of capital stock into shares of capital stock with such preferences, rights, powers and restrictions as the Board of Directors may determine. The authorization and issuance of a new class of capital stock could have the effect of delaying or preventing someone from taking control of us, even if a change in control were in our stockholders' best interests.
There may be future dilution of our common stock, and resales of our common stock in the public market following a stock offering that may cause the market price for our common stock to fall.
Our Charter authorizes our Board of Directors to, among other things, issue additional shares of capital stock without stockholder approval. We may issue common stock, preferred stock or securities convertible or exchangeable into equity securities to raise additional capital. Holders of our common stock have no preemptive rights that entitle them to purchase their pro rata share of any offering of shares of any class or series. Accordingly, the issuance of any additional shares of common or preferred stock or convertible securities could be substantially dilutive to existing holders of our common stock. Furthermore, the resale by shareholders of our common stock in the public market following any offering could have the effect of depressing the market price for our common stock. At December 31, 2010, 21,923,610 shares of our common stock and 4,374,896 shares of our Series D preferred stock were issued and outstanding.
The price of our common stock is volatile and may decline.
The market price of our common stock may fluctuate widely as a result of a number of factors, many of which are outside our control. In addition, the stock market is subject to fluctuations in share prices and trading volumes that affect the market prices of the shares of many companies. These broad market fluctuations have adversely affected and may continue to adversely affect the market price of our common stock. Among the factors that could affect the market price of our common stock are:
| · | actual or anticipated quarterly fluctuations in our operating results and financial condition; |
| · | changes in revenues or earnings estimates or publication of research reports and recommendations by financial analysts or actions taken by rating agencies with respect to our securities or those of other REITs; |
| · | the ability of our tenants to pay rent to us and meet their other obligations to us under current lease terms; |
| · | our ability to re-lease spaces as leases expire; |
| · | our ability to refinance our indebtedness as it matures; |
| · | any changes in our distribution policy; |
| · | any future issuances of equity securities; |
| · | strategic actions by us or our competitors, such as acquisitions or restructurings; |
| · | general market conditions and, in particular, developments related to market conditions for the real estate industry; and |
| · | domestic and international economic factors unrelated to our performance. |
Maryland business statutes may limit the ability of a third party to acquire control of us.
Maryland law provides protection for Maryland corporations against unsolicited takeovers by limiting, among other things, the duties of the directors in unsolicited takeover situations. The duties of directors of Maryland corporations do not require them to (a) accept, recommend or respond to any proposal by a person seeking to acquire control of the corporation, (b) authorize the corporation to redeem any rights under, or modify or render inapplicable, any stockholders rights plan, (c) make a determination under the Maryland Business Combination Act, or (d) act or fail to act solely because of the effect of the act or failure to act may have on an acquisition or potential acquisition of control of the corporation or the amount or type of consideration that may be offered or paid to the stockholders in an acquisition. Moreover, under Maryland law the act of a director of a Maryland corporation relating to or affecting an acquisition or potential acquisition of control is not subject to any higher duty or greater scrutiny than is applied to any other act of a director. Maryland law also contains a statutory presumption that an act of a director of a Maryland corporation satisfies the applicable standards of conduct for directors under Maryland law.
The Maryland Business Combination Act provides that unless exempted, a Maryland corporation may not engage in business combinations, including mergers, dispositions of 10 percent or more of its assets, certain issuances of shares of stock and other specified transactions, with an "interested stockholder" or an affiliate of an interested stockholder for five years after the most recent date on which the interested stockholder became an interested stockholder, and thereafter unless specified criteria are met. An interested stockholder is generally a person owning or controlling, directly or indirectly, 10 percent or more of the voting power of the outstanding stock of the Maryland corporation.
ITEM 1B. Unresolved Staff Comments.
None.
ITEM 2. Properties.
General
The Company operates and invests principally in office properties in the Southeastern and Southwestern United States and Chicago, but is not limited to any specific geographical region or property type. At March 1, 2011, the Company owned or had an interest in 65 office properties comprising approximately 13.7 million square feet of office space located in 11 states.
Property acquisitions in 2010 and 2008 were funded through a variety of sources, including:
| · | Cash reserves and cash generated from operating activities; |
· | Sales of equity securities; |
| · | Sales of office properties; |
· | Contributions from partners; and/or |
| · | Advances on the Company’s credit facility. |
Office Buildings
Other than as discussed under "Item 1. Business", the Company intends to hold and operate its portfolio of office buildings for investment purposes. The Company does not propose any program for the renovation or improvement of any of the office buildings other than those discussed in “Item 2 – Properties – Significant Properties”, except as called for under the renewal of existing leases or the signing of new leases or improvements necessary to upgrade recent acquisitions to the Company's operating standards. All such improvements are expected to be financed by cash flow from the portfolio of office properties, advances on the Company’s credit facility or contributions from partners.
We believe that our insurance coverage contains policy specifications and insured limits that are customary for similar properties, business activities and markets, and we believe our properties are adequately insured. However, an uninsured loss could result in loss of capital investment and anticipated profits.
All office building investments compete for customers with similar properties located within the same market primarily on the basis of location, rent charged, services provided and the design and condition of the improvements. The Company also competes with other REITs, financial institutions, pension funds, partnerships, individual investors and others when attempting to acquire office properties.
The following table sets forth certain information about office properties the Company owned or had an interest in at January 1, 2011:
| | | | | | Estimated | | |
| | | | | | Average | % of | |
| | Number | Total Net | % of | Average | Market | Leases | % |
| | of | Rentable | Total Net | Rent Per | Rent Per | Expiring | Leased |
| | Office | Square Feet | Rentable | Square | Square | In | at |
| Location | Properties(1) | (in thousands) | Feet | Foot (2) | Foot (3) | 2011 (4) | 1/1/2011 |
| Chicago, IL | 4 | 2,897 | 22.0% | $29.67 | $27.63 | 7.4% | 88.6% |
| Houston, TX | 12 | 2,031 | 15.4% | 20.36 | 21.33 | 15.8% | 93.6% |
| Atlanta, GA | 9 | 1,778 | 13.5% | 22.52 | 19.74 | 21.1% | 82.5% |
| Memphis, TN | 6 | 1,200 | 9.1% | 21.16 | 18.11 | 9.0% | 83.1% |
| Jackson, MS | 7 | 1,112 | 8.4% | 18.49 | 17.51 | 12.8% | 78.9% |
| Orlando, FL | 5 | 922 | 7.0% | 22.40 | 20.87 | 7.4% | 84.9% |
| Phoenix, AZ | 3 | 689 | 5.2% | 25.95 | 20.70 | 16.8% | 87.5% |
| Richmond, VA | 6 | 495 | 3.8% | 17.58 | 16.16 | 13.0% | 79.7% |
| Jacksonville, FL | 4 | 482 | 3.6% | 19.42 | 17.81 | 4.1% | 93.7% |
| Nashville, TN | 1 | 436 | 3.3% | 18.35 | 16.50 | 2.9% | 83.1% |
| Columbia, SC | 2 | 407 | 3.1% | 14.86 | 16.10 | 4.2% | 75.7% |
| Charlotte, NC | 1 | 327 | 2.5% | 17.69 | 17.00 | 12.6% | 78.1% |
| Ft. Lauderdale, FL | 2 | 216 | 1.6% | 22.50 | 21.26 | 12.9% | 67.6% |
| Hampton Roads, VA | 1 | 172 | 1.3% | 19.26 | 18.00 | 10.3% | 84.1% |
| Other Markets | 1 | 32 | 0.2% | 14.00 | 8.00 | 7.6% | 7.6% |
| | 64 | 13,196 | 100.0% | $22.73 | $21.15 | 11.7% | 85.3% |
(1) Includes 44 office properties owned directly and 20 office properties owned through joint ventures.
(2) Average rent per square foot is defined as the weighted average current gross rental rate including escalations for operating expenses related to leased office space in the building at January 1, 2011.
(3) Estimated average gross market rent per square foot is based upon information obtained from (i) the Company's own experience in leasing space at the properties; (ii) leasing agents in the relevant markets with respect to quoted rental rates and completed leasing transactions for comparable properties in the relevant markets; and (iii) publicly available data with respect thereto. Estimated average market rent is weighted by the net rentable square feet expiring in each property.
(4) The percentage of leases expiring in 2011 represents the ratio of square feet under leases expiring in 2011 divided by total net rentable square feet.
The following table sets forth scheduled lease expirations for properties owned at January 1, 2011 on leases executed at January 1, 2011, assuming no customer exercises renewal options:
| | | Net | | Annualized | Weighted Avg | Weighted Est |
| | | Rentable | Percent of | Rental | Expiring Gross | Avg Market |
| Year of | Number | Square Feet | Total Net | Amount | Rental Rate Per | Rent Per Net |
| Lease | of | Expiring | Rentable | Expiring (1) | Net Rentable | Rentable |
| Expiration | Leases | (in thousands) | Square Feet | (in thousands) | Square Foot (2) | Square Foot (3) |
| 2011 | 314 | 1,549 | 11.7% | $ | 35,774 | $ | 23.10 | $ | 20.62 |
| 2012 | 242 | 1,629 | 12.3% | 38,099 | 23.39 | 21.95 |
| 2013 | 207 | 1,177 | 8.9% | 26,259 | 22.31 | 19.85 |
| 2014 | 154 | 1,376 | 10.4% | 30,186 | 21.93 | 20.25 |
| 2015 | 168 | 1,694 | 12.9% | 35,420 | 20.91 | 16.76 |
| 2016 | 84 | 1,282 | 9.7% | 27,166 | 21.19 | 19.65 |
| Thereafter | 109 | 2,553 | 19.4% | 63,064 | 24.71 | 23.18 |
| | 1,278 | 11,260 | 85.3% | $ | 255,968 | $ | 22.73 | $ | 21.15 |
(1) Annualized rental amount expiring is defined as net rentable square feet expiring multiplied by the weighted average expiring annual rental rate per net rentable square foot.
(2) Weighted average expiring gross rental rate is the weighted current rental rate including escalations for operating expenses.
(3) Estimated weighted average market rent is based upon information obtained from (i) the Company’s own experience in leasing space at the properties; (ii) leasing agents in the relevant markets with respect to quoted rental rates and completed leasing transactions for comparable properties in the relevant markets; and (iii) publicly available data with respect thereto. Estimated weighted average market rent is weighted by the net rentable square feet expiring in each property.
Customers
The office properties are leased to 1,278 customers, which are in a wide variety of industries including banking, insurance, professional services (including legal, accounting, and consulting), energy, financial services and telecommunications. Our largest customer and 25 largest customers accounted for 4.9% and 39.5%, respectively of our annualized rental revenue. The following table sets forth information concerning the 25 largest customers of the properties owned directly or through joint ventures as of January 1, 2011 (in thousands, except footnotes):
| | | | | Leased Square Feet (1) | Annualized Rental Revenue (1) |
| | No. of Props. | Square Footage Expiring | |
| Customer | 2011 | 2012 | 2013 | 2014 | 2015 | 2016 | Thereafter |
| General Services Administration (“GSA”) (2) | 15 | 102 | 21 | 35 | 3 | 46 | - | 265 | 472 | $ | 9,966 |
| Cox Enterprises/AutoTrader.com (3) | 2 | 198 | - | 90 | - | 17 | - | 17 | 322 | 6,982 |
| Health Care Service Corporation (“BCBS”) (4) | 1 | - | 230 | - | - | - | - | - | 230 | 5,945 |
| Blue Cross Blue Shield of Georgia, Inc. (5) | 1 | - | - | - | - | - | - | 199 | 199 | 5,426 |
| Regions Financial Corporation (6) | 2 | 19 | 5 | 5 | - | 4 | 237 | - | 270 | 5,404 |
| Nabors Industries/Nabors Corporate Services | 1 | - | - | - | 216 | - | - | - | 216 | 4,420 |
| Extra Space Storage | 1 | - | - | - | - | 134 | - | - | 134 | 3,042 |
| Bank of America, NA (7) | 6 | 2 | - | 28 | - | 124 | 3 | 16 | 173 | 2,843 |
| Southwestern Energy Company | 2 | - | - | - | 118 | - | - | - | 118 | 2,679 |
| Combined Insurance Company of America (8) | 1 | - | - | - | - | - | - | 99 | 99 | 2,670 |
| Clear Channel Communications | 1 | - | - | - | - | - | - | 74 | 74 | 2,577 |
| Young & Rubicam (9) | 1 | 9 | - | - | - | - | - | 69 | 78 | 2,505 |
| Schlumberger Technology (10) | 1 | - | 155 | - | - | - | - | - | 155 | 2,439 |
| Golin-Harris Communications, Inc. | 1 | - | 67 | - | - | - | - | - | 67 | 2,375 |
| U.S. Cellular Corporation (11) | 1 | - | - | - | - | - | - | 222 | 222 | 2,372 |
| Honeywell (12) | 1 | - | - | - | - | - | - | 102 | 102 | 2,335 |
| United Healthcare Services | 1 | - | 67 | - | - | - | - | - | 67 | 2,328 |
| Louisiana-Pacific Corporation | 1 | - | - | - | - | 105 | - | - | 105 | 2,226 |
| Stein Mart, Inc. | 1 | - | - | - | - | - | 107 | - | 107 | 2,186 |
| Motorola, Inc. | 1 | 15 | - | - | - | 53 | - | - | 68 | 2,106 |
| Shefsky & Froelich, Ltd | 1 | - | - | - | - | 69 | - | - | 69 | 1,881 |
| BDO USA, LLP (13) | 2 | - | 1 | - | 7 | - | 42 | - | 50 | 1,738 |
| Forman, Perry, Watkins, Krutz & Tardy (14) | 1 | - | - | - | - | - | 126 | - | 126 | 1,679 |
| URS Corporation (15) | 2 | 3 | - | - | - | - | 57 | - | 60 | 1,436 |
| Burrell Communications Group, LLC | 1 | - | - | - | - | - | 35 | - | 35 | 1,430 |
| | | 348 | 546 | 158 | 344 | 552 | 607 | 1,063 | 3,618 | $ | 80,990 |
| Total Rentable Square Footage (1) | 13,196 | |
| Total Annualized Rental Revenue (1) | $ | 205,186 | |
| (1) | Annualized Rental Revenue represents the gross rental rate (including escalations) per square foot, multiplied by the number of square feet leased by the customer. Annualized rent for customers in consolidated and unconsolidated joint ventures is calculated based on our ownership interest. However, leased square feet represents 100% of square feet leased through direct ownership or through joint ventures. |
| (2) | GSA’s lease at the Meridian Building in Atlanta, Georgia, provides an option to cancel 16,778 square feet effective February 2015 with 90 days written notice. The GSA’s lease at the Falls Building in Memphis, Tennessee provides two options to cancel. The first is an option to cancel 2,922 square feet effective January 2013. The second option is to cancel 22,973 square feet effective January 2013 with 120 days written notice. The GSA’s lease at Carmel Crossing-Davie in Charlotte, North Carolina, provides an option to cancel 21,384 square feet effective November 2011 with 30 days written notice. GSA has 80,503 square feet of leases in the Jackson, Mississippi Central Business District that are relocating to the newly developed federal courthouse in 2011. |
| (3) | Cox Enterprises, which is located at Peachtree Dunwoody Pavilion in Atlanta, Georgia, has an option to cancel 106,758 square feet between June and December 2012 with a notice date of June 2011. In the event the customer exercises this option at the earliest termination date, the Company expects to receive a fee at the notice date of approximately $950,000 associated with this lease termination which will be recorded into income through the early termination date. Additionally, the customer will continue to pay rent through the early termination date. AutoTrader.com will vacate 193,043 square feet upon expiration in February 2011. Parkway has signed a 46,000 square foot lease to backfill the AutoTrader space and is in letter of intent or lease documentation stages with approximately 37,000 square feet of additional prospects for the space. |
| (4) | BCBS, which is located at 111 East Wacker in Chicago, Illinois, has exercised its option to cancel 168,405 square feet in March 2012. The customer will pay a total termination fee of $7.3 million which will be recorded into income over the remaining term of the lease through March 2012. Additionally, the customer will continue to pay rent through the March 2012 expiration date. |
| (5) | Blue Cross Blue Shield of Georgia, Inc., which is located at Capital City Plaza in Atlanta, Georgia, has the option to cancel 59,222 square feet in either January 2016 or January 2018 with nine months written notice. Additionally, the lease provides the option to cancel an additional 29,610 square feet in January 2018 with nine months written notice. |
| (6) | Regions Financial Corporation, which is located at the Morgan Keegan Tower in Memphis, Tennessee, has the option to cancel 3,197 square feet with four months written notice. |
| (7) | Bank of America, NA at Bank of America Plaza in Nashville, Tennessee, has an option to cancel 123,710 square feet in October 2014 with 12 months notice. Also, Bank of America, successor to Countrywide Home Loans, which is located at Maitland 100 in Orlando, Florida, has the option to cancel 11,779 square feet in June of 2012 with six months written notice. |
| (8) | Combined Insurance Company of America’s lease at 111 East Wacker in Chicago, Illinois, provides a cancellation option in July 2018 with 12 months written notice. |
| (9) | Young & Rubicam, which is located at 233 North Michigan in Chicago, Illinois, has the option to cancel approximately 34,000 square feet in October of 2015 with 12 months written notice. |
| (10) | In February 2011, Schlumberger Technology, which is located at the Schlumberger building in Houston, Texas, signed a 64-month lease extension for 155,324 square feet. The new expiration of Schlumberger’s lease is June 2017 with an option to cancel in June 2015 with a 12-month written notice. |
| (11) | U.S. Cellular Corporation at US Cellular Plaza in Chicago, Illinois, has the option to cancel up to 39,648 square feet in December 2013 and in September 2014 with a notice date of September 2013. |
| (12) | Honeywell, which is located at the Honeywell Building in Houston, Texas, has a lease cancellation option in December 2014, which requires a 12-month notice. |
| (13) | BDO USA, LLP, which is located at Bank of America Plaza in Nashville, Tennessee, has the option to cancel 6,549 square feet in February 2012 with 120 days written notice. Additionally, the customer’s lease at 233 North Michigan in Chicago, Illinois, provides the option to cancel 43,477 square feet in December 2012 with 12 months written notice. |
| (14) | Forman, Perry, Watkins, Krutz & Tardy, which is located at City Centre in Jackson, Mississippi, has certain cancellation rights pending changes in partnership structure. |
| (15) | URS Corporation, which is located at Squaw Peak Corporate Center in Phoenix, Arizona, has the option to cancel 10,000 square feet between December 2011 and December 2013 with 90 days written notice. |
Significant Properties
The Company has one property, 111 East Wacker, whose book value at December 31, 2010, exceeds ten percent of total assets.
The 111 East Wacker building (“111 East Wacker") is a 32-story Class A office property with an attached four-level, below grade parking garage. The Company, through its wholly-owned direct and indirect subsidiaries, acquired fee simple title to 111 East Wacker in July 2006. The building was constructed in 1970 and includes 980,000 rentable square feet (“RSF”) of Class A office and storage space and 33,000 RSF of retail space. The building was 96.4% occupied at January 1, 2011, with an average effective annual rental rate per square foot of $28.64. The average occupancy and rental rate per square foot over the past five years are as follows:
| Year | Average Occupancy | Average Rental Rate per Square Foot |
| 2006 | 89.9% | $ | 24.25 |
| 2007 | 85.0% | $ | 23.90 |
| 2008 | 94.1% | $ | 26.05 |
| 2009 | 95.7% | $ | 27.31 |
| 2010 | 91.2% | $ | 26.72 |
111 East Wacker’s major customers include governmental agencies, an insurance company and businesses that provide legal, accounting, insurance, advertising and other financial services. Retail customers include financial service companies, restaurants and other numerous service-oriented amenity customers.
Lease expirations for 111 East Wacker at January 1, 2011 are as follows (in thousands, except number of leases):
| | Square Feet | Percentage | Annualized | Percentage of | |
| | of Leases | of Total | Rental | Total Annualized | Number of |
| Year | Expiring | Square Feet | Revenue (1) | Rental Revenue | Leases |
| 2011 | 67 | 6.6% | $ | 1,946 | 7.0% | 16 |
| 2012 | 359 | 35.4% | 10,292 | 36.8% | 10 |
| 2013 | 102 | 10.1% | 3,140 | 11.2% | 14 |
| 2014 | 11 | 1.1% | 301 | 1.1% | 3 |
| 2015 | 104 | 10.3% | 2,845 | 10.2% | 7 |
| 2016 | 70 | 6.9% | 2,073 | 7.4% | 6 |
| 2017 | 54 | 5.3% | 1,606 | 5.7% | 5 |
| 2018 | 14 | 1.4% | 452 | 1.6% | 2 |
| 2019 | 44 | 4.3% | 1,322 | 4.7% | 2 |
| 2020 | 19 | 1.9% | 514 | 1.9% | 1 |
| Thereafter | 132 | 13.1% | 3,472 | 12.4% | 2 |
| | 976 | 96.4% | $ | 27,963 | 100.0% | 68 |
| (1) | Annualized rental revenue represents the gross rental rate (including escalations) per square feet, multiplied by the number of square feet leased by the customer. |
111 East Wacker has one customer that occupies 10% or more of the rentable square footage. Information regarding this customer is as follows:
| Nature of Business | Lease Expiration | Effective Rental Rate Per Square Foot | Lease Options |
| Insurance | (1) | $25.85 | (2) |
| (1) | This customer has 230,000 square feet expiring in 2012. This includes 62,000 square feet originally scheduled to expire in 2012 and 168,000 square feet resulting from the exercise of an early termination option. |
| (2) | In September 2010 this customer provided notice they would exercise their option to cancel 168,000 square feet, originally set to expire in 2017. The customer will pay a total termination fee of $7.3 million, of which $3.7 million was paid upon receipt of the termination notice in September 2010. The total termination fee of $7.3 million will be recorded into income from the notice date of September 2010 through the March 2012 expiration. Additionally, the customer will continue to pay rent through the March 2012 expiration date. |
For tax purposes, depreciation is calculated over 39 years for building and garage, 7 to 39 years for building and tenant improvements and 5 to 7 years for equipment, furniture and fixtures. The federal tax basis net of accumulated tax depreciation of 111 East Wacker is as follows at December 31, 2010 (in thousands):
| | 111 East |
| | Wacker |
| Land | $ 23,285 |
| Building and Garage | 150,326 |
| Building Improvements | 18,655 |
| Tenant Improvements | 10,142 |
Real estate tax expense for 2010, 2009 and 2008 for 111 East Wacker was $5.9 million, $7.1 million and $6.1 million, respectively.
111 East Wacker is subject to a non-recourse first mortgage (the "111 Mortgage"). The 111 Mortgage totaled $148.5 million at December 31, 2010 and has a fixed interest rate of 6.3% with payments based on a 30 year amortization and interest only payments for five years or through July 2011. The 111 Mortgage matures on July 11, 2016 at which time a balloon payment of $139.5 million is due.
We compete with a considerable number of other real estate companies seeking to acquire and lease office space in Chicago. Principal factors of competition in our business are the quality of properties (including the design and condition of improvements), leasing terms (including rent and other charges and allowances for tenant improvements), attractiveness and convenience of location, the quality and breadth of tenant services provided and reputation as an owner and operator of quality office properties in the relevant market. Our ability to compete also depends on, among other factors, trends in the national and local economies, financial condition and operating results of current and prospective tenants, availability and cost of capital, taxes and governmental regulations and legislation.
The Company did not have any material liens or encumbrances that exceeded 10% of total assets at December 31, 2010.
Non-Strategic Assets
Since January 1, 1996, Parkway has pursued a strategy of liquidating its non-strategic assets and using the proceeds from such sales to acquire office properties and pay down short-term debt. The Company defines non-strategic assets as all office and parking properties in markets where the Company has not achieved critical mass of greater than one million square feet as well as markets that management believes do not have compelling rent growth potential. Additionally, the Company has 12 acres of undeveloped land in New Orleans, Louisiana, that is considered a non-strategic asset.
ITEM 3. Legal Proceedings.
The Company and its subsidiaries are, from time to time, parties to litigation arising from the ordinary course of their business. Management of Parkway does not believe that any such litigation will materially affect the financial position or operations of Parkway.
The information set forth in Note K in the Notes to the Consolidated Financial Statements included herein is incorporated by reference.
ITEM 4. [Removed and Reserved]
PART II
| | ITEM 5. Market for Registrant’s Common Equity, Related Stockholder Matters and Issuer Purchases of Equity Securities. |
The Company’s common stock ($.001 par value) is listed and trades on the New York Stock Exchange under the symbol “PKY”. The number of record holders of the Company’s common stock at January 1, 2011, was 2,203.
At March 1, 2011, the last reported sales price per common share on the New York Stock Exchange was $16.20. The following table sets forth, for the periods indicated, the high and low last reported sales prices per share of the Company’s common stock and the per share cash distributions paid by Parkway during each quarter.
| | Year Ended | | Year Ended |
| | December 31, 2010 | | December 31, 2009 |
| Quarter Ended | High | Low | Distributions | | High | Low | Distributions |
| March 31 | $ | 22.93 | $ | 16.35 | $ | 0.075 | | $ | 18.94 | $ | 8.60 | $ | 0.325 |
| June 30 | $ | 20.73 | $ | 14.38 | 0.075 | | $ | 16.22 | $ | 10.17 | 0.325 |
| September 30 | $ | 16.83 | $ | 13.46 | 0.075 | | $ | 20.86 | $ | 10.88 | 0.325 |
| December 31 | $ | 18.54 | $ | 14.71 | 0.075 | | $ | 21.50 | $ | 17.29 | 0.325 |
| | | | $ | 0.300 | | | | $ | 1.300 |
Common stock distributions during 2010 and 2009 ($0.30 and $1.30 per share, respectively) were taxable as follows for federal income tax purposes:
| | Year Ended |
| | December 31 |
| | 2010 | 2009 |
| Ordinary income | $ | 0.23 | $ | 0.71 |
| Unrecaptured Section 1250 gain | 0.06 | - |
| Return of capital | 0.01 | 0.59 |
| | $ | 0.30 | $ | 1.30 |
The following table shows the high and low Series D preferred share prices and per share distributions paid for each quarter of 2010 and 2009 reported by the New York Stock Exchange.
| | Year Ended | | Year Ended |
| | December 31, 2010 | | December 31, 2009 |
| Quarter Ended | High | Low | Distributions | | High | Low | Distributions |
| March 31 | $ | 25.04 | $ | 21.77 | $ | 0.50 | | $ | 17.54 | $ | 10.13 | $ | 0.50 |
| June 30 | $ | 25.00 | $ | 23.38 | 0.50 | | $ | 20.50 | $ | 12.68 | 0.50 |
| September 30 | $ | 25.75 | $ | 23.50 | 0.50 | | $ | 23.07 | $ | 17.90 | 0.50 |
| December 31 | $ | 25.81 | $ | 24.80 | 0.50 | | $ | 24.25 | $ | 20.53 | 0.50 |
| | | | $ | 2.00 | | | | $ | 2.00 |
At January 1, 2011, there were five holders of record of the Company's 4.4 million outstanding shares of Series D preferred stock. Series D preferred stock distributions during 2010 and 2009 were taxable as follows for federal income tax purposes:
| | Year Ended December 31 |
| | 2010 | 2009 |
| Ordinary income | $ | 1.57 | $ | 2.00 |
| Unrecaptured Section 1250 gain | 0.43 | - |
| | $ | 2.00 | $ | 2.00 |
Purchases of Equity Securities by the Issuer
| | | | Total Number | Maximum Number |
| | | | of Shares Purchased | of Shares that |
| | Total Number | Average | as Part of Publicly | May Yet Be |
| | of Shares | Price Paid | Announced Plans | Purchased Under |
| Period | Purchased | per Share | or Programs | the Plans or Programs |
| | | | | |
| 10/01/10 to 10/31/10 | 1,465(1) | $15.48 | - | - |
| 11/01/10 to 11/30/10 | - | - | - | - |
| 12/01/10 to 12/31/10 | - | - | - | - |
| Total | 1,465 | $15.48 | - | - |
| (1) | As permitted under the Company's equity compensation plan, these shares were withheld by the Company to satisfy tax withholding obligations for employees in connection with the vesting of stock. Shares withheld for tax withholding obligations do not affect the total number of shares available for repurchase under any approved common stock repurchase plan. At December 31, 2010, the Company did not have an authorized stock repurchase plan in place. |
Securities Authorized for Issuance Under Equity Compensation Plans
See Item 12 of this Annual Report on Form 10-K, “Security Ownership of Certain Beneficial Owners and Management and Related Stockholder Matters,” for certain information regarding the Company’s equity compensation plans.
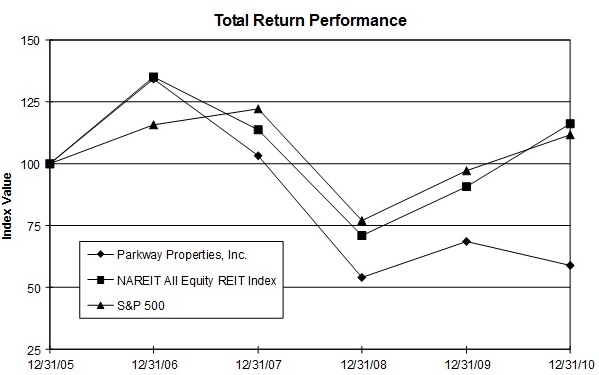
Performance Graph
The following graph provides a comparison of cumulative stockholder return for the period from December 31, 2005 through December 31, 2010 among Parkway, the Standard & Poor’s 500 Index (“S&P 500”) and the National Association of Real Estate Investment Trusts (“NAREIT”) Equity REIT Total Return Index (“NAREIT Equity”). The stock performance graph assumes an investment of $100 in the shares of Parkway common stock and each index and the reinvestment of any dividends. The historical information set forth below is not necessarily indicative of future performance.
The performance graph and related information shall not be deemed “soliciting material” or deemed to be “filed” with the SEC, nor shall such information be incorporated by reference into any future filing, except to the extent that the Company specifically incorporates it by reference into such filing.
| | | Period Ending | |
| Index | 12/31/05 | 12/31/06 | 12/31/07 | 12/31/08 | 12/31/09 | 12/31/10 |
| Parkway Properties, Inc. | 100.00 | 134.46 | 103.17 | 54.11 | 68.69 | 58.84 |
| NAREIT All Equity REIT Index | 100.00 | 135.06 | 113.87 | 70.91 | 90.76 | 116.12 |
| S&P 500 | 100.00 | 115.79 | 122.16 | 76.96 | 97.33 | 111.99 |
ITEM 6. Selected Financial Data.
| | Year Ended 12/31/10 | Year Ended 12/31/09 | Year Ended 12/31/08 | Year Ended 12/31/07 | Year Ended 12/31/06 |
| | (In thousands, except per share data) |
Operating Data: | | | | | |
| Revenues | | | | | |
| Income from office and parking properties | $ | 254,611 | $ | 262,951 | $ | 260,229 | $ | 230,180 | $ | 195,092 |
| Management company income | 1,652 | 1,870 | 1,936 | 1,605 | 5,329 |
| Total revenues | 256,263 | 264,821 | 262,165 | 231,785 | 200,421 |
| Expenses | | | | | |
| Property operating expenses | 117,935 | 126,343 | 124,409 | 106,368 | 91,605 |
| Depreciation and amortization | 92,190 | 92,126 | 91,224 | 73,860 | 61,071 |
| Impairment loss on real estate | 4,120 | - | 2,542 | - | - |
| Management company expenses | 3,961 | 2,299 | 1,947 | 1,188 | 1,141 |
| General and administrative | 7,382 | 6,108 | 9,725 | 6,602 | 4,656 |
| Total expenses | 225,588 | 226,876 | 229,847 | 188,018 | 158,473 |
| Operating income | 30,675 | 37,945 | 32,318 | 43,767 | 41,948 |
| Other income and expenses | | | | | |
| Interest and other income | 1,487 | 1,609 | 1,332 | 526 | 39 |
| Equity in earnings of unconsolidated joint ventures | 326 | 445 | 894 | 1,008 | 751 |
| Gain (loss) on real estate, joint venture interests, | | | | | |
| involuntary conversion and other assets | 40 | (7,524) | - | 20,307 | 17,646 |
| Interest expense | (54,647) | (55,044) | (58,766) | (51,879) | (42,368) |
| | | | | | |
| Income (loss) from continuing operations | (22,119) | (22,569) | (24,222) | 13,729 | 18,016 |
| Income (loss) from discontinued operations | 194 | 404 | (461) | 2,789 | 2,098 |
| Gain on sale of real estate from discontinued operations | 8,518 | - | 22,588 | - | 5,083 |
| Total discontinued operations | 8,712 | 404 | 22,127 | 2,789 | 7,181 |
| Net income (loss) | (13,407) | (22,165) | (2,095) | 16,518 | 25,197 |
| Noncontrolling interest – real estate partnerships | 10,789 | 10,562 | 11,369 | 3,174 | 485 |
| Net income (loss) for Parkway Properties, Inc. | (2,618) | (11,603) | 9,274 | 19,692 | 25,682 |
| Dividends on preferred stock | (6,325) | (4,800) | (4,800) | (4,800) | (4,800) |
| Dividends on convertible preferred stock | - | - | - | - | (1,773) |
| Net income (loss) attributable to common stockholders | $ | (8,943) | $ | (16,403) | $ | 4,474 | $ | 14,892 | $ | 19,109 |
| | | | | | |
| Net income (loss) per common share attributable to | | | | | |
| Parkway Properties, Inc. | | | | | |
| Basic: | | | | | |
| Income (loss) from continuing operations attributable to | | | | | |
| Parkway Properties, Inc. | $ | (0.82) | $ | (0.87) | $ | (1.17) | $ | 0.78 | $ | 0.84 |
| Discontinued operations | 0.40 | 0.02 | 1.47 | 0.18 | 0.50 |
| Net income (loss) attributable to Parkway Properties, Inc. | $ | (0.42) | $ | (0.85) | $ | 0.30 | $ | 0.96 | $ | 1.34 |
| | | | | | |
| Diluted: | | | | | |
| Income (loss) from continuing operations attributable to | | | | | |
| Parkway Properties, Inc. | $ | (0.82) | $ | (0.87) | $ | (1.17) | $ | 0.77 | $ | 0.82 |
| Discontinued operations | 0.40 | 0.02 | 1.47 | 0.18 | 0.50 |
| Net income (loss) attributable to Parkway Properties, Inc. | $ | (0.42) | $ | (0.85) | $ | 0.30 | $ | 0.95 | $ | 1.32 |
| | | | | | |
| Book value per common share (at end of year) | $ | 17.50 | $ | 18.32 | $ | 22.83 | $ | 25.09 | $ | 27.42 |
| Dividends per common share | $ | 0.30 | $ | 1.30 | $ | 2.275 | $ | 2.60 | $ | 2.60 |
| Weighted average shares outstanding: | | | | | |
| Basic | 21,421 | 19,304 | 15,023 | 15,482 | 14,306 |
| Diluted | 21,421 | 19,304 | 15,023 | 15,648 | 14,487 |
| Balance Sheet Data: | | | | | |
Office and parking investments, net of depreciation | $ | 1,389,767 | $ | 1,401,890 | $ | 1,455,239 | $ | 1,314,602 | $ | 1,303,213 |
Investment in unconsolidated joint ventures | 2,892 | 2,512 | 11,057 | 11,236 | 11,179 |
Total assets | 1,603,682 | 1,612,146 | 1,687,855 | 1,535,794 | 1,512,346 |
Notes payable to banks | 110,839 | 100,000 | 185,940 | 212,349 | 152,312 |
Mortgage notes payable | 773,535 | 852,700 | 869,581 | 714,501 | 696,012 |
Total liabilities | 983,192 | 1,041,314 | 1,154,415 | 1,015,380 | 931,760 |
Preferred stock | 102,787 | 57,976 | 57,976 | 57,976 | 57,976 |
Noncontrolling interest-real estate partnerships | 133,988 | 116,687 | 127,192 | 80,506 | 90,280 |
Total stockholders’ equity attributable to Parkway | | | | | |
Properties, Inc. | 486,502 | 454,145 | 406,248 | 439,908 | 490,306 |
ITEM 7. Management's Discussion and Analysis of Financial Condition and Results of Operations.
Overview
Parkway is a self-administered and self-managed REIT specializing in the acquisition, operations, leasing and ownership of office properties. The Company is geographically focused on the Southeastern and Southwestern United States and Chicago. At March 1, 2011, Parkway owned or had an interest in 65 office properties located in 11 states with an aggregate of approximately 13.7 million square feet of leasable space. Included in the portfolio are 20 properties totaling 4.1 million square feet that are owned jointly with other investors, representing 30.3% of the portfolio. With the office properties owned jointly with other investors, the Company receives fees for asset management, property management, leasing and construction management services and potentially receives incentive fees upon sale if certain investment targets are achieved. Increasing the number of co-investments, and consequently the related fee income, is part of the Company’s strategy to transform itself to an operator-owner versus an owner-operator. The strategy capitalizes on the Company’s strength in providing excellent service in the operation and acquisition of office properties for investment clients in addition to its direct ownership of real estate assets. Fee-based real estate services are offered through the Company’s wholly-owned subsidiary, Parkway Realty Services LLC, which also currently manages and/or leases approximately 1.6 million square feet for third-party owners. The Company generates revenue primarily by leasing office space to its customers and providing management and leasing services to third party office property owners (including joint venture interests). The primary drivers behind Parkway’s revenues are occupancy, rental rates and customer retention.
Occupancy. Parkway’s revenues are dependent on the occupancy of its office buildings. At January 1, 2011, occupancy of Parkway’s office portfolio was 85.3% compared to 85.7% at October 1, 2010 and 87.0% at January 1, 2010. Not included in the January 1, 2011 occupancy rate, are the acquisition of the 3344 Peachtree office property on January 21, 2011, as well as 34 signed leases totaling 183,000 square feet, which commence during the period from the first quarter of 2011 through the second quarter of 2012. Including these leases and the acquisition of 3344 Peachtree, the Company’s portfolio was 86.9% leased at January 21, 2011. The Company currently anticipates customers occupying approximately 431,000 square feet to either vacate or contract upon expiration during the first quarter of 2011, but also expects its 2011 leasing volume to be in line with historical levels. Parkway currently projects an average annual occupancy range of 83.5% to 85.0% during 2011 for its office properties. To combat rising vacancy, Parkway utilizes innovative approaches to produce new leases. These include the Broker Bill of Rights, a short-form service agreement and customer advocacy programs which are models in the industry and have historically helped the Company maintain occupancy above the national occupancy rate of approximately 82.6%.
Rental Rates. An increase in vacancy rates has the effect of reducing market rental rates and vice versa. Parkway’s leases typically have three to seven year terms. As leases expire, the Company replaces the existing leases with new leases at the current market rental rate. At January 1, 2011, Parkway had $1.58 per square foot in rental rate embedded loss in its office property leases. Embedded loss is defined as the difference between the weighted average in-place cash rents and the weighted average market rental rate.
Customer Retention. Keeping existing customers is important as high customer retention leads to increased occupancy, less downtime between leases, and reduced leasing costs. Parkway estimates that it costs five to six times more to replace an existing customer with a new one than to retain the customer. In making this estimate, Parkway takes into account the sum of revenue lost during downtime on the space plus leasing costs, which rise as market vacancies increase. Therefore, Parkway focuses a great amount of energy on customer retention. Parkway's operating philosophy is based on the premise that it is in the customer retention business. Parkway seeks to retain its customers by continually focusing on operations at its office properties. The Company believes in providing superior customer service; hiring, training, retaining and empowering each employee; and creating an environment of open communication both internally and externally with customers and stockholders. Over the past ten years, Parkway maintained an average 69.4% customer retention rate. Parkway’s customer retention rate was 68.3% for the quarter ended December 31, 2010, as compared to 75.0% for the quarter ended September 30, 2010, and 63.6% for the quarter ended December 31, 2009. Customer retention for the year ended December 31, 2010 and 2009 was 67.8% and 61.9%, respectively.
Strategic Planning. Parkway is a focused office REIT with a hands-on, service-oriented approach, a disciplined capital allocation program and willingness to recycle assets. Parkway continues to focus on the Company’s strategy of transforming itself to an operator-owner from an owner-operator, as well as maximizing total return to our stockholders. To show our commitment to this goal, our newest strategic plan is centered on a goal of achieving a 12% compounded annual total return to our shareholders over a three-year period. This plan is known as the FOCUS Plan (the “Plan”), which began July 1, 2010 and will extend three full years through June 30, 2013. The goals of the Plan are as follows:
| · | Fund and Fund-Like Investments. The Company believes that fund and fund-like investments have the highest priority of the Company’s capital allocation, because it gives Parkway’s stockholders the highest risk adjusted return as measured by internal rate of return, capitalization rate and accretion per share. |
| · | Operator-Owner. The Company plans to make a full transformation to an operator-owner, with the goal of being a majority operator/owner by the end of the Plan. This has been a goal for several years and will continue to be a core strategy as Parkway seeks to increase fee income and maximize its return on equity and accretion per share. Additionally, the Company will continue to expand PRS, which offers expert real estate management guidance, professional property management services and strategic marketing and leasing services aimed at increasing net operating income and maximizing profit upon exit. |
| · | Capital Allocation Discipline. The Company’s overall capital structure goal is to achieve a net debt to gross asset value ratio of 50% or less, as determined by using a capitalization rate of 8.5% on recurring cash income, and a net debt to EBITDA multiple of 6.5 times or less. Beyond the balance sheet, capital allocation refers to the Company’s goal to exit non-strategic markets through the continuation of its Asset Recycling program. Most of the properties identified for sale are smaller assets or assets located in smaller markets where Parkway does not have a significant presence. By the end of the FOCUS Plan, the Company’s goal is to be invested in larger, higher-quality properties located in higher-rent growth markets through fund and fund-like investments. The Company will continue to maintain discipline as it relates to managing the balance sheet and the acquisition and disposition of assets. |
| · | Uncompromising Focus on Operations. Parkway believes that its uncompromising focus on operations is what sets it apart from other office property owners. An important goal of the FOCUS Plan is to move decision-making authority to the regional office level. The Company’s market leaders already have the responsibility of setting rents, increasing net operating income margins and maintaining a consistent standard of operations and will be given more profit and loss responsibility and investment authority going forward. It is important that we know our markets, which is best achieved when Parkway’s people live and work within the market. An integral part of the FOCUS Plan is a program referred to as “We Know…City.” These three words imply that Parkway employees know more than just how to manage real estate, but that they have a deep understanding of a city’s history, economics, infrastructure, politics and much more. By truly knowing the cities where the Company is invested, we are better positioned for leasing, active asset management, recruitment and investments. |
| · | Shareholder Returns. All of the previously mentioned goals funnel to the ultimate goal of the FOCUS Plan, which is to maximize total return to Parkway’s shareholders. The Company has set a goal of achieving a 12% compounded annual total return to its shareholders for the three-year period starting July 1, 2010. |
During 2010 and to date in 2011, the Company achieved the following major accomplishments:
| · | Reduced Parkway’s share of total debt by $64.6 million. Parkway’s net debt to EBITDA multiple was reduced from 6.3 times at December 31, 2009 to 5.9 times at December 31, 2010. Parkway’s net debt to gross asset value was reduced from 52.8% at December 31, 2009 to 49.8% at December 31, 2010. |
| · | Completed $45.0 million Series D Preferred stock offering. Parkway received approximately $45.0 million in net proceeds by issuing 1.97 million shares of its 8.0% Series D Cumulative Redeemable Preferred Stock in August 2010. |
| · | Parkway and Fund II invested $200.0 million in office properties. Parkway sold Carmel Crossing, Falls Pointe, and Lakewood II to Fund II for $33.0 million during the fourth quarter of 2010, and acquired 3344 Peachtree for $167.3 million (Fund II’s investment in the property was $160 million) in January 2011. The Company’s total assets under management including the purchase of 3344 Peachtree now totals $2.1 billion, with 33% of these assets in fund or fund-like joint ventures. |
| · | Signed over 2.9 million square feet of leases. Parkway had a significant amount of leasing activity during 2010 with over 2.9 million square feet of leases signed and reduced its 2011 expirations from 17.9% as of the fourth quarter of 2008 to 11.7% as of the fourth quarter of 2010. |
| · | Closed on new $200.0 million unsecured revolving credit facilities. Parkway closed on the new credit facilities in January 2011. The new credit facilities have an initial term of three years and replace the prior unsecured revolving credit facility, term loan and working capital facility that were scheduled to mature on April 27, 2011. |
| · | Selected for national best place to work list for third consecutive year. Parkway ranked 20th on the medium list of Entrepreneur’s Great Place to Work® Rankings: 2010 Best Small & Medium Workplaces. |
| · | Parkway’s development property received LEED Gold certification. The Pinnacle at Jackson Place in Jackson, Mississippi received LEED Gold certification for Core & Shell from the U.S. Green Building Council in December 2010. |
Discretionary Funds. On July 6, 2005, Parkway, through affiliated entities, entered into a limited partnership agreement forming Fund I for the purpose of acquiring high-quality multi-tenant office properties. Ohio PERS is a 75% investor and Parkway is a 25% investor in the Fund, which is capitalized with approximately $200.0 million of equity capital and $300.0 million of non-recourse, fixed-rate first mortgage debt. At February 15, 2008, Fund I was fully invested.
Fund I targeted properties with an anticipated leveraged internal rate of return of greater than 11%. Parkway serves as the general partner of the fund and provides asset management, property management, leasing and construction management services to the fund, for which it is paid market-based fees. After each partner has received a 10% annual cumulative preferred return and a return of invested capital, 60% will be distributed to Ohio PERS and 40% to Parkway. The term of Fund I will be seven years from the date the fund was fully invested until February 2015, with provisions to extend the term for two additional one-year periods.
On May 14, 2008, Parkway, through affiliated entities, entered into a limited partnership agreement forming a $750.0 million discretionary fund, known as Fund II with TRST for the purpose of acquiring high-quality multi-tenant office properties. TRST is a 70% investor and Parkway is a 30% investor in the fund, which will be capitalized with approximately $375.0 million of equity capital and $375.0 million of non-recourse, fixed-rate first mortgage debt. Parkway’s share of the equity contribution for the fund will be $112.5 million and will be funded with operating cash flows, proceeds from asset sales, issuance of equity securities and/or advances on the credit facility as needed on a temporary basis. Fund II targets acquisitions in the core markets of Houston, Austin, San Antonio, Chicago, Atlanta, Phoenix, Charlotte, Memphis, Nashville, Jacksonville, Orlando, Tampa/St. Petersburg, and Ft. Lauderdale, as well as other growth markets to be determined at Parkway’s discretion.
Fund II targets properties with an anticipated leveraged internal rate of return of greater than 10%. Parkway serves as the general partner of the fund and provides asset management, property management, leasing and construction management services to the fund, for which it is paid market-based fees. Cash will be distributed pro rata to each partner until a 9% annual cumulative preferred return is received and invested capital is returned. Thereafter, 56% will be distributed to TRST and 44% to Parkway. Parkway has four years, or through May 2012, to identify and acquire properties (the “Investment Period”), with funds contributed as needed to close acquisitions. Parkway will exclusively represent the fund in making acquisitions within the target markets and acquisitions with certain predefined criteria. Parkway will not be prohibited from making fee-simple or joint venture acquisitions in markets outside of the target markets, acquiring properties within the target markets that do not meet Fund II’s specific criteria or selling a full or partial interest in currently owned properties. The term of Fund II will be seven years from the expiration of the Investment Period, with provisions to extend the term for two additional one-year periods at the discretion of Parkway. At March 1, 2011, Fund II had remaining investment capacity of $552.1 million of which $81.8 million represents Parkway’s remaining equity contribution that would be due in connection with additional investments in office properties.
Financial Condition
Comments are for the balance sheet dated December 31, 2010 as compared to the balance sheet dated December 31, 2009.
Office and Parking Properties. In 2010, Parkway continued the execution of its strategy of operating and acquiring office properties as well as liquidating non-strategic assets that no longer meet the Company's investment criteria or the Company has determined value will be maximized by selling. The Company delayed new investments in office properties in 2009 until there was further clarity in values. During 2010, the Company began to see
investment opportunities come available as evidenced by Fund II making its first investment during the fourth quarter of 2010 and second investment in January 2011. During the year ended December 31, 2010, total assets decreased $8.5 million or 0.5%.
Acquisitions and Improvements. Parkway's investment in office and parking properties decreased $12.1 million net of depreciation to a carrying amount of $1.4 billion at December 31, 2010 and consisted of 61 office and parking properties. The primary reason for the decrease in office and parking properties relates to the net effect of building improvements and the purchase of three office properties, offset by the sale of one office property, depreciation recorded during the year and a non-cash impairment loss recorded during the fourth quarter of 2010.
During the third quarter of 2010, the Company acquired its partner’s 25% interest in Parkway Moore, LLC and Moore Building Associates, LP for $2,500. These entities were established for the purpose of owning the Toyota Center, a 175,000 square foot office building in Memphis, Tennessee. Therefore, at September 30, 2010, the Company owned 100% of the entities and the Toyota Center.
During the year ending December 31, 2010, Fund II purchased three office properties as follows (in thousands):
| | | Parkway | Square | Date | Purchase |
| Office Property | Location | Ownership | Feet | Purchased | Price |
| | | | | | |
| Fund II Purchases: | | | | | |
| | Falls Pointe (1) | Atlanta, Georgia | 30% | 107 | 10/29/10 | $ | 5,000 |
| | Lakewood II (1) | Atlanta, Georgia | 30% | 128 | 10/29/10 | 3,000 |
| | Carmel Crossing (1) | Charlotte, North Carolina | 30% | 326 | 12/14/10 | 25,000 |
| | | | | 561 | | $ | 33,000 |
| (1) | During the third quarter of 2010, the Company purchased the first mortgage loan associated with RubiconPark I, LLC (“Rubicon JV”), which owned Falls Pointe, Lakewood II, and Carmel Crossing, for a net purchase price of $33.0 million. During the fourth quarter of 2010, the Company, as holder of the mortgage, foreclosed on the three properties that served as collateral for the associated loan. Also, during the fourth quarter of 2010, the Company sold the three assets to Fund II. Parkway recorded approximately $740,000 in management company expense on the consolidated statement of operations related to acquisition costs on these investments. As a result of the sale to Fund II, Parkway’s ownership interest in these assets increased from 20% to 30%. |
On January 21, 2011, the Company and Fund II acquired the office and retail portion of 3344 Peachtree located in the Buckhead submarket of Atlanta for $167.3 million. 3344 Peachtree contains approximately 484,000 square feet of office and retail space and includes an adjacent eleven-story parking structure. Fund II’s investment in the property totaled $160.0 million, with Parkway funding the remaining $7.3 million. Due to Parkway’s additional investment, the Company’s effective ownership in the property is 33.0%. An additional $2.6 million is expected to be spent for closing costs, building improvements, leasing costs and tenant improvements during the first two years of ownership. Simultaneous with closing, Fund II assumed the $89.6 million existing non-recourse first mortgage loan, which matures on October 1, 2017, and carries a fixed interest rate of 4.8%. In accordance with Generally Accepted Accounting Principles (“GAAP”), the mortgage loan was recorded at $87.2 million to reflect the value of the instrument based on a market interest rate of 5.25% on the date of purchase. Parkway's equity contribution in the investment is $25.5 million and was initially funded through availability under the Company's credit facility.
On February 4, 2011, the Company purchased its partner’s 50% interest in the Wink-Parkway Partnership (“Wink JV”) for $250,000. The Wink JV was established for the purpose of owning the Wink Building, a 32,000 square foot office property in New Orleans, Louisiana. Upon completing the purchase of its partner’s interest, Parkway now owns 100% of the Wink Building.
During the year ending December 31, 2010, the Company capitalized building improvements of $36.3 million and recorded depreciation expense of $67.4 million related to its office and parking properties.
Dispositions
During the year ended December 31, 2010, Parkway sold one office property as follows (in thousands):
| | | | Square | Date | Gross | |
| Office Property | Location | Feet | Sold | Sales Price | Gain |
| | | | | | |
| | One Park Ten (1) | Houston, Texas | 163 | 04/15/10 | $ | 15,700 | $ | 8,518 |
| (1) | In accordance with GAAP, the gain on sale of real estate and all current and prior period income from this property has been classified as discontinued operations. |
During the fourth quarter of 2010, the Company recorded non-cash impairment losses of $4.1 million related to non-strategic office properties targeted for sale in Columbia, South Carolina, and Richmond, Virginia. The Company began actively marketing these assets around year end. As part of the marketing process, the Company estimated that the fair value of these assets was less than their carrying value at December 31, 2010. Therefore, in accordance with GAAP, an impairment loss for the assets was recorded during the fourth quarter of 2010.
Mortgage Loans. Parkway’s investment in mortgage loans increased $2.2 million or 27.2% for the year ended December 31, 2010, and is primarily due to the $1.5 million note receivable placed in connection with the sale of One Park Ten discussed above.
Rents Receivable and Other Assets. For the year ended December 31, 2010, rents receivable and other assets increased $13.2 million or 11.3%. The net increase is primarily due to the increase in escrow bank account balances, which was caused by the contribution of funds in connection with office property capital expenditures, a non-refundable earnest money deposit related to the purchase of 3344 Peachtree, which Fund II purchased during the first quarter of 2011 and payment of capitalized lease commissions, offset by amortization of existing capitalized lease commissions.
Intangible Assets, Net. For the year ended December 31, 2010, intangible assets net of related amortization decreased $11.1 million or 18.0% and was primarily due to annual amortization of existing intangible assets.
Accounts Payable and Other Liabilities. For the year ended December 31, 2010, accounts payable and other liabilities increased $10.2 million or 11.5% primarily due to the timing of payment of expenses as well as the recognition of a liability for deferred revenue in the amount of $5.2 million in connection with lease termination fees received for two customers’ leases with termination dates of March 2012 and August 2016.
Notes Payable to Banks. Notes payable to banks increased $10.8 million or 10.8% for the year ended December 31, 2010. At December 31, 2010, notes payable to banks totaled $110.8 million and the increase is primarily attributable to advances on the credit facility to repay mortgage debt maturities during the year, make investments in and improvements to office properties, offset by proceeds received from the Company’s Series D Preferred Stock offering, the sale of one office property and mortgages obtained during the year.
On January 31, 2011, the Company closed a new $190.0 million unsecured revolving credit facility and a new $10.0 million unsecured working capital revolving credit facility. The new credit facilities have an initial term of three years and replaced the existing unsecured revolving credit facility, term loan and working capital facility that were scheduled to mature on April 27, 2011. The Company also has a $100.0 million interest rate swap associated with the credit facilities that expires March 31, 2011, locking LIBOR at 3.635%. The Company does not anticipate an extinguishment of this interest rate swap prior to its stated expiration as the hedged item relates to interest rate payments on $100.0 million of LIBOR-based debt and the forecasted transaction remains probable at December 31, 2010. Wells Fargo Securities and JP Morgan Securities LLC acted as Joint Lead Arrangers and Joint Book Runners on the unsecured revolving credit facility. In addition, Wells Fargo Bank, N.A. acted as Administration Agent and JPMorgan Chase Bank, N.A. acted as Syndication Agent. Other participating lenders include PNC Bank, N.A., Bank of America, N.A., US Bank, N.A., Trustmark National Bank, and BancorpSouth Bank. The working capital revolving credit facility was provided solely by PNC Bank, N.A.
Mortgage Notes Payable. During the year ended December 31, 2010, mortgage notes payable decreased $79.2 million or 9.3% as a result of the following (in thousands):
| | Increase |
| | (Decrease) |
| | |
| Placement of mortgage debt on wholly-owned properties | $ | 70,000 |
| Principal paid on early extinguishment of debt | (126,277) |
| Transfer of mortgage to purchaser of One Park Ten | (8,666) |
| Scheduled principal payments | (14,222) |
| | $ | (79,165) |
On February 8, 2010, the Company obtained a $35.0 million non-recourse, first mortgage loan related to the refinance of a $60.0 million recourse mortgage that was scheduled to mature in May 2010. The mortgage loan bears interest at a fixed rate of 7.25% and is secured by the Company’s Capital City Plaza building in Atlanta, Georgia. The mortgage loan matures in March 2017 and includes the option to be prepaid at the end of five years at a cost of 1% of the outstanding loan balance. The Company used available proceeds under its credit facility to pay the $25.0 million difference on the maturing mortgage loan.
On April 15, 2010, in connection with the sale of One Park Ten in Houston, Texas, the buyer assumed the $8.7 million first mortgage loan secured by the property. The mortgage loan carried an interest rate of 7.1% and was scheduled to mature in June 2012. During the second quarter of 2010, the Company recorded a $136,000 loss on the extinguishment of debt associated with the buyer’s assumption of the mortgage loan.
On April 30, 2010, the Company repaid a $17.2 million mortgage loan secured by two office properties in Houston, Texas and one office property in Atlanta, Georgia, utilizing available proceeds under its credit facility. The mortgage had an interest rate of 5.3% and was scheduled to mature on May 1, 2010.
On May 28, 2010, the Company obtained a $23.0 million non-recourse, first mortgage loan secured by Citrus Center, a 261,000 square foot office property in Orlando, Florida. The mortgage loan had a fixed interest rate of 6.3% and a term of ten years. The proceeds were used to reduce amounts outstanding under the Company’s credit facility.
Upon maturity, on June 1, 2010, the Company paid off its share and its partner’s share of a $10.6 million mortgage note payable secured by the Toyota Center, a 175,000 square foot office property in Memphis, Tennessee, utilizing available proceeds under the Company’s credit facility. The mortgage had an interest rate of 7.9%. The Toyota Center office property was previously owned by a consolidated joint venture, Moore Building Associates, LP, in which the Company served as the general partner. However, during the third quarter of 2010, Parkway purchased the partner’s interest, thereby placing Parkway’s ownership of the property at 100%.
On July 8, 2010, the Company obtained a $12.0 million non-recourse first mortgage loan secured by the Stein-Mart building, a 196,000 square foot office property in Jacksonville, Florida. The mortgage loan had a fixed interest rate of 6.5% and a term of ten years. The proceeds were used to reduce amounts outstanding under the Company’s credit facility.
On October 8, 2010, the Company repaid a $7.6 million mortgage loan secured by One Jackson Place, a 220,000 square foot office property in Jackson, Mississippi. The mortgage loan had a fixed interest rate of 7.9%. The Company repaid the mortgage loan using available proceeds under the Company’s credit facility.
On December 15, 2010, the Company repaid a $31.0 million mortgage loan secured by Squaw Peak Corporate Center, a 290,000 square foot office complex in Phoenix, Arizona. The mortgage loan had a fixed interest rate of 4.9%. The Company repaid the mortgage loan using available proceeds under the Company’s credit facility.
On January 21, 2011, in connection with its purchase of 3344 Peachtree in Atlanta, Georgia, Fund II assumed the $89.6 million existing non-recourse first mortgage loan, which matures on October 1, 2017, and carries a fixed interest rate of 4.8%. In accordance with GAAP, the mortgage loan was recorded at $87.2 million to reflect the value of the instrument based on a market interest rate of 5.25% on the date of purchase.
On February 18, 2011, Fund II obtained a $10.0 million mortgage loan secured by Carmel Crossing, a 326,000
square foot office complex in Charlotte, North Carolina. The mortgage loan has a fixed rate of 5.5% and a term of nine years. Parkway received $2.4 million in net proceeds from the loan, which represents its 30% equity investment in the property. The proceeds were used to reduce amounts outstanding under the Company’s credit facility.
The Company expects to continue seeking primarily fixed rate, non-recourse mortgage financing with maturities from five to ten years typically amortizing over 25 to 30 years on select office building investments as additional capital is needed. The Company monitors a number of leverage and other financial metrics defined in the loan agreements for the Company’s unsecured credit facility and working capital unsecured credit facility, which includes the Company’s total debt to total asset value. In addition, the Company monitors interest, fixed charge and modified fixed charge coverage ratios as well as the net debt to gross asset value ratio and the net debt to EBITDA multiple. The interest coverage ratio is computed by comparing the cash interest accrued to EBITDA. The fixed charge coverage ratio is computed by comparing the cash interest accrued, principal payments made on mortgage loans and preferred dividends paid to EBITDA. The modified fixed charge coverage ratio is computed by comparing cash interest accrued and preferred dividends paid to EBITDA. The net debt to EBITDA multiple is computed by comparing Parkway’s share of net debt to EBITDA computed for a trailing 12-month period. Management believes all of the leverage and other financial metrics it monitors, including those discussed above, provide useful information on total debt levels as well as the Company’s ability to cover interest, principal and/or preferred dividend payments. The Company targets a net debt to gross asset value ratio of 50% or less and a net debt to EBITDA multiple of 6.5 times or less.
The reconciliation of net loss for Parkway Properties, Inc. to EBITDA and the computation of the Company’s proportionate share of the interest, fixed charge, modified fixed charge coverage ratios, as well as the net debt to EBITDA multiple is as follows for the year ended December 31, 2010 and 2009 (in thousands):
| | Year Ended |
| | December 31 |
| | 2010 | | 2009 |
| Net loss for Parkway Properties, Inc. | $ | (2,618) | | $ | (11,603) |
| Adjustments to loss for Parkway Properties, Inc.: | | | |
| Interest expense | 53,062 | | 53,374 |
| Amortization of financing costs | 1,713 | | 2,319 |
| Prepayment expenses - early extinguishment of debt | 189 | | - |
| Depreciation and amortization | 92,311 | | 92,726 |
| Amortization of share-based compensation | 1,319 | | 2,581 |
| Net (gain) loss on real estate investments and involuntary conversion | (4,438) | | 7,524 |
| Tax expense | 2 | | 2 |
| EBITDA adjustments - unconsolidated joint ventures | 488 | | 1,358 |
| EBITDA adjustments - noncontrolling interest in real estate partnerships | (29,939) | | (32,698) |
| | | | |
| EBITDA (1) | $ | 112,089 | | $ | 115,583 |
| | | | |
| Interest coverage ratio: | | | |
| EBITDA | $ | 112,089 | | $ | 115,583 |
| Interest expense: | | | |
| Interest expense | $ | 53,062 | | $ | 53,374 |
| Interest expense - unconsolidated joint ventures | 145 | | 501 |
| Interest expense - noncontrolling interest in real estate partnerships | (12,000) | | (12,283) |
| Total interest expense | $ | 41,207 | | $ | 41,592 |
| Interest coverage ratio | 2.72 | | 2.78 |
| | | | |
| Fixed charge coverage ratio: | | | |
| EBITDA | $ | 112,089 | | $ | 115,583 |
| Fixed charges: | | | |
| Interest expense | $ | 41,207 | | $ | 41,592 |
| Preferred dividends | 6,325 | | 4,800 |
| Principal payments (excluding early extinguishment of debt) | 14,222 | | 13,615 |
| Principal payments - unconsolidated joint ventures | 33 | | 142 |
| Principal payments - noncontrolling interest in real estate partnerships | (1,056) | | (981) |
| Total fixed charges | $ | 60,731 | | $ | 59,168 |
| Fixed charge coverage ratio | 1.85 | | 1.95 |
| | | | |
| Modified fixed charge coverage ratio: | | | |
| EBITDA | $ | 112,089 | | $ | 115,583 |
| Modified fixed charges: | | | |
| Interest expense | $ | 41,207 | | $ | 41,592 |
| Preferred dividends | 6,325 | | 4,800 |
| Total fixed charges | $ | 47,532 | | $ | 46,392 |
| Modified fixed charge coverage ratio | 2.36 | | 2.49 |
| | | | |
| Net Debt to EBITDA multiple: | | | |
| EBITDA – trailing 12 months | $ | 112,089 | | $ | 115,583 |
| Parkway’s share of total debt: | | | |
| Mortgage notes payable | $ | 773,535 | | $ | 852,700 |
| Notes payable to banks | 110,839 | | 100,000 |
| Adjustments for unconsolidated joint ventures | 2,474 | | 2,507 |
| Adjustments for noncontrolling interest in real estate partnerships | (211,836) | | (215,604) |
| Parkway’s share of total debt | 675,012 | | 739,603 |
| Less: Parkway’s share of cash | (9,652) | | (10,231) |
| Parkway’s share of net debt | $ | 665,360 | | $ | 729,372 |
| Net Debt to EBITDA multiple | 5.9 | | 6.3 |
(1) Parkway defines EBITDA, a non-GAAP financial measure, as net income before interest, income taxes, depreciation, amortization, losses on early extinguishment of debt and other gains and losses. EBITDA, as calculated by us, is not comparable to EBITDA reported by other REITs that do not define EBITDA exactly as we do.
The Company believes that EBITDA helps investors and Parkway’s management analyze the Company’s ability to service debt and pay cash distributions. However, the material limitations associated with using EBITDA as a non-GAAP financial measure compared to cash flows provided by operating, investing and financing activities are that EBITDA does not reflect the Company’s historical cash expenditures or future cash requirements for working capital, capital expenditures or the cash required to make interest and principal payments on the Company’s outstanding debt. Although EBITDA has limitations as an analytical tool, the Company compensates for the limitations by only using EBITDA to supplement GAAP financial measures. Additionally, the Company believes that investors should consider EBITDA in conjunction with net income and the other required GAAP measures of its performance and liquidity to improve their understanding of Parkway’s operating results and liquidity.
Parkway views EBITDA primarily as a liquidity measure and, as such, the GAAP financial measure most directly comparable to it is cash flows provided by operating activities. Because EBITDA is not a measure of financial performance calculated in accordance with GAAP, it should not be considered in isolation or as a substitute for operating income, net income, or cash flows provided by operating, investing and financing activities prepared in accordance with GAAP. The following table reconciles cash flows provided by operating activities to EBITDA for the year ended December 31, 2010 and 2009 (in thousands):
| | Year Ended |
| | December 31 |
| | 2010 | | 2009 |
| | | | |
| Cash flows provided by operating activities | $ | 68,059 | | $ | 69,934 |
| | | | |
| Amortization of (above) below market leases | 566 | | (51) |
| Amortization of mortgage loan discount | 710 | | 607 |
| Operating distributions from unconsolidated joint ventures | - | | (392) |
| Interest expense | 53,062 | | 53,374 |
| Loss on early extinguishment of debt | 189 | | - |
| Tax expense | 2 | | 2 |
| Change in deferred leasing costs | 13,425 | | 16,348 |
| Change in receivables and other assets | 4,194 | | (3,678) |
| Change in accounts payable and other liabilities | (9,782) | | (228) |
| Adjustments for noncontrolling interests | (19,150) | | (22,136) |
| Adjustments for unconsolidated joint ventures | 814 | | 1,803 |
| EBITDA | $ | 112,089 | | $ | 115,583 |
Equity. Total equity increased $49.7 million or 8.7% during the year ended December 31, 2010 as a result of the following (in thousands):
| | Increase |
| | (Decrease) |
| Net loss attributable to Parkway Properties, Inc. | $ | (2,618) |
| Net loss attributable to noncontrolling interest | (10,789) |
| Net loss | (13,407) |
| Change in market value of interest rate swaps | 1,889 |
| Comprehensive loss | (11,518) |
| Common stock dividends declared | (6,494) |
| Preferred stock dividends declared | (6,325) |
| Share-based compensation | 1,319 |
| Issuance of preferred stock | 44,811 |
| Shares issued in lieu of Director’s Fees | 285 |
| Issuance costs for shelf registration | (14) |
Shares purchased to satisfy tax withholding obligation on vesting of restricted stock and deferred incentive share units | (821) |
| Net shares distributed from deferred compensation plan | 503 |
| Contribution of capital by noncontrolling interest | 27,912 |
| | $ | 49,658 |
On August 9, 2010, the Company issued 1.97 million additional shares of its 8.0% Series D Cumulative Redeemable Preferred Stock at a price of $23.757 per share equating to a yield of 8.500% (excluding accrued dividends). The Series D Preferred Stock has a $25 liquidation value per share and was redeemable at the option of the Company as of June 27, 2008. Wells Fargo Securities, LLC and Banc of America Securities LLC acted as joint book-running managers on the transaction. The Company used the net proceeds of approximately $45.0 million to reduce amounts outstanding under the Company’s credit facility and for general corporate purposes.
Results of Operations
Comments are for the year ended December 31, 2010 compared to the year ended December 31, 2009.
Net loss attributable to common stockholders for the years ended December 31, 2010 and 2009 was $8.9 million ($0.42 per basic common share) and $16.4 million ($0.85 per basic common share), respectively. The primary reasons for the decrease in net loss attributable to common stockholders for the year ended December 31, 2010 as compared to the same period for 2009 is primarily due to the gain on sale of real estate from discontinued operations of $8.5 million, which is attributable to one asset sold in 2010. Gains on the sale of real estate and involuntary conversion of $8.6 million, offset by impairment losses totaling $4.1 million, were included in net loss attributable to common stockholders for the year ended December 31, 2010. Net gains on the sale of real estate and involuntary conversion of $1.3 million, offset by impairment losses totaling $8.8 million, were included in net loss attributable to common stockholders for the year ended December 31, 2009. The change in gain (loss) on real estate investments, and involuntary conversion as well as the discussion of other variances for income and expense items that comprise net loss attributable to common stockholders is discussed in detail below.
Office and Parking Properties. The analysis below includes changes attributable to same-store properties and dispositions of office properties. Same-store properties are consolidated properties that the Company owned for the current and prior year reporting periods, excluding properties classified as discontinued operations. At December 31, 2010, same-store properties consisted of 61 properties comprising 12.8 million square feet.
The following table represents revenue from office and parking properties for the years ended December 31, 2010 and 2009 (in thousands):
| | Year Ended December 31 |
| | | | Increase | % |
| | 2010 | 2009 | (Decrease) | Change |
| Revenue from office and parking properties: | | | |
| Same-store properties | $ | 254,609 | $ | 261,886 | $ | (7,277) | -2.8% |
| Properties disposed | 2 | 1,065 | (1,063) | -99.8% |
| Total revenue from office and | | | | |
| parking properties | $ | 254,611 | $ | 262,951 | $ | (8,340) | -3.2% |
Revenue from office and parking properties for same-store properties decreased $7.3 million or 2.8% for the year ended December 31, 2010, compared to the same period for 2009. The primary reason for the decrease is due to a decrease in expense reimbursement income as a result of lower property operating expenses and a decrease in average same-store occupancy offset by an increase in lease termination fee income for year ended December 31, 2010 compared to the same period in 2009. Average same-store occupancy decreased 320 basis points for the year ended December 31, 2010, compared to the same period of 2009.
The following table represents property operating expenses for the years ended December 31, 2010 and 2009 (in thousands):
| | Year Ended December 31 |
| | | | Increase | % |
| | 2010 | 2009 | (Decrease) | Change |
| Expense from office and parking properties: | | | |
| Same-store properties | $ | 117,981 | $ | 125,779 | $ | (7,798) | -6.2% |
| Properties disposed | (46) | 564 | (610) | -108.2% |
| Total expense from office and | | | | |
| parking properties | $ | 117,935 | $ | 126,343 | $ | (8,408) | -6.7% |
Property operating expenses for same-store properties decreased $7.8 million or 6.2% for the year ended December 31, 2010, compared to the same period of 2009. The primary reason for the decrease is due to decreased ad valorem taxes and bad debt expense.
Share-Based and Long-Term Compensation Expense. Compensation expense related to restricted shares and deferred incentive share units of $1.3 million and $2.6 million was recognized for the years ended December 31, 2010 and 2009, respectively. Total compensation expense related to nonvested awards not yet recognized was $2.9 million at December 31, 2010. The weighted average period over which the expense is expected to be recognized is approximately 2.6 years.
On January 4, 2010, 91,000 restricted shares vested and were issued to officers of the Company. These shares were granted to the officers of the Company in January 2003 and vested seven years from the grant date.
On February 10, 2010, 29,941 restricted shares vested and were issued to officers of the Company due to the achievement of performance goals established in 2009 by the Board of Directors.
On July 1, 2010, 26,500 restricted shares vested and were issued to officers of the Company. These shares were granted in July 2006 and vested four years from the grant date.
On July 12, 2010, the Board of Directors approved 345,120 FOCUS Plan long-term equity incentive awards to officers of the Company. The long-term equity incentive awards are valued at $2.5 million which equates to an average price per share of $7.30 and consists of 25,380 time-based awards, 179,314 market condition awards subject to an absolute total return goal, and 140,426 market condition awards subject to a relative total return goal. These shares are accounted for as equity-classified awards on the Company’s 2010 consolidated balance sheet.
The time-based awards granted as part of the FOCUS Plan will vest ratably over four years from the date the shares were granted. The market condition awards granted as part of the FOCUS Plan are contingent on the Company meeting goals for compounded annual total return to stockholders (“TRS”) over the three year period beginning July 1, 2010. The market condition goals are based upon (i) the Company’s absolute compounded annual TRS; and (ii) the Company’s absolute compounded annual TRS relative to the compounded annual return of the MSCI US REIT (“RMS”) Index calculated on a gross basis, as follows:
| | | | |
| Absolute Return Goal | 10% | 12% | 14% |
| Relative Return Goal | RMS + 100 bps | RMS + 200 bps | RMS + 300 bps |
With respect to the absolute return goal, 15% of the award is earned if the Company achieves threshold performance and a cumulative 60% is earned for target performance. With respect to the relative return goal, 20% of the award is earned if the Company achieves threshold performance and a cumulative 55% is earned for target performance. In each case, 100% of the award is earned if the Company achieves maximum performance or better. To the extent actually earned, the market condition awards will vest 50% on each of July 15, 2013 and 2014.
The total compensation expense for the long-term equity incentive awards granted under the FOCUS Plan is based upon the fair value of the shares on the grant date, adjusted for estimated forfeitures. The grant date fair value for awards that are subject to a market condition are determined using a simulation pricing model developed to specifically accommodate the unique features of the awards.
The FOCUS Plan also includes a long-term cash incentive that was designed to reward significant outperformance over the three year period beginning July 1, 2010. The performance goals for actual payment under the long-term cash incentive will require the Company to (i) achieve an absolute compounded annual TRS that exceeds 14% AND (ii) achieve an absolute compounded annual TRS that exceeds the compounded annual return of the RMS by at least 500 basis points. Notwithstanding the above goals, in the event the Company achieves an absolute compounded annual TRS that exceeds 19%, then the Company must achieve an absolute compounded annual TRS that exceeds the compounded annual return of the RMS by at least 600 basis points. The aggregate amount of the cash incentive earned would increase with corresponding increases in the absolute compounded annual TRS achieved by the Company. There will be a cap on the aggregate cash incentive earned in the amount of $7.1 million. Achievement of the maximum cash incentive would equate to an absolute compounded annual TRS that
approximates 23%, provided that the absolute compounded annual TRS exceeds the compounded annual return of the RMS by at least 600 basis points. The total compensation expense for the long-term cash incentive awards granted under the FOCUS Plan is based upon the estimated fair value of the award on the grant date and adjusted as necessary each reporting period. The long-term cash incentive awards are accounted for as a liability-classified award on the Company’s 2010 consolidated balance sheet. The grant date and quarterly fair value estimates for awards that are subject to a market condition are determined using a simulation pricing model developed to specifically accommodate the unique features of the awards.
On August 23, 2010, 5,500 restricted shares vested and were issued to officers of the Company. These shares were granted in September 2003 and vested seven years from the grant date.
On January 9, 2011, 25,935 restricted shares vested and were issued to officers of the Company due to the achievement of performance goals established in 2009 by the Board of Directors.
On January 12, 2011, 27,125 restricted shares vested and were issued to officers of the Company. These shares were granted in January 2007 and vested four years from the grant date.
On January 14, 2011, the Board of Directors approved 55,623 FOCUS Plan long-term equity incentive awards to officers of the Company. The long-term equity incentive awards are valued at $736,000 which equates to an average price per share of $13.23 and consist of 25,620 time-based awards, 16,883 market condition awards subject to an absolute total return goal, and 13,120 market condition awards subject to a relative total return goal. These shares will be accounted for as equity-classified awards on the Company’s consolidated balance sheet.
General and Administrative Expense. General and administrative expense increased $1.3 million for the year ended December 31, 2010, compared to the same period of 2009. The increase is primarily due to expenses in connection with the Company’s former Chief Financial Officer, J. Mitchell Collins’ personal injury lawsuit and shareholder demand letter. For the year ended December 31, 2010, the Company expensed $1.3 million with respect to the pending litigation and the demand letter. During the fourth quarter of 2010, the Company removed its reserve for potential future exposure with the respect to the pending litigation and demand letter. Management has evaluated the risks involved with the pending litigation and demand letter and determined that no reserve was necessary at December 31, 2010.
On April 23, 2010, the Company received notice of a complaint to the Occupational Safety and Health Administration (“OSHA”) initiated by Mr. Collins, whose employment with the Company terminated on February 5, 2010. The complaint alleged discriminatory employment practices in violation of Section 806 of the Corporate and Criminal Fraud Accountability Act of 2002, Title VIII of Sarbanes-Oxley Act of 2002. The complaint alleged that Mr. Collins was terminated from his position as Chief Financial Officer of the Company as a result of his purportedly engaging in “protected activity” as defined under Section 806 of the Sarbanes-Oxley Act, and sought reinstatement of Mr. Collins’ position and unspecified damages from the Company. Specifically, Mr. Collins alleged that his termination was a result of bringing what he believed to be certain concerns regarding the Company’s financial projections to the attention of senior management. Mr. Collins also alleged that the Company engaged in conduct that violates U.S. federal law, including U.S. federal securities laws by inaccurately describing to the public the events surrounding his February 5, 2010 separation. Effective July 16, 2010, the Company received a formal notice from the Area Director of OSHA, that Mr. Collins withdrew the Sarbanes-Oxley complaint he filed with OSHA.
On May 4, 2010, Mr. Collins filed a personal injury lawsuit against the Company in the Circuit Court of Hinds County, Mississippi, alleging defamation, wrongful discharge, conversion, and fraud based on substantially the same factual predicate set forth in the OSHA complaint. Mr. Collins is seeking compensatory and punitive damages in excess of $10.0 million in the lawsuit. The Company has carefully reviewed Mr. Collin’s personal injury complaint and believes that the allegations made are without basis in fact or law and will vigorously defend the Company’s prior actions and reputation. Management believes the final outcome of this matter will not have a material adverse effect on the Company’s financial statements.
In addition to the personal injury lawsuit, Mr. Collins also issued a shareholder demand letter to the Company threatening to commence a derivative lawsuit on behalf of the Company against the Company, its directors and officers based on substantially the same allegations as set forth in the personal injury suit. On July 27, 2010, the Company’s Board of Directors appointed the Audit Committee (the “Committee”) of the board to review and evaluate the claims made in Mr. Collins’ demand letter. The Committee engaged independent legal counsel to assist with the review and evaluation of these claims. After thoroughly investigating the allegations in good faith and fully
informing itself of all material facts relevant thereto, the Committee believes that the Company did not operate in a fraudulent or misleading manner regarding either the termination of Mr. Collins or the disclosure of the Company's 2010 earnings guidance. Further, the Committee determined that it would not serve the interests of Parkway or its shareholders for the Company to take any of the further actions requested in the demand letter.
Gain on Sale of Real Estate Investment and Involuntary Conversions. For the year ended December 31, 2010, the Company recorded a gain on involuntary conversion of $40,000 related to assets damaged by Hurricane Ike and a gain on the sale of real estate of $8.5 million related to the sale of one office property. This gain has been classified as a gain on the sale of real estate from discontinued operations. For the year ended December 31, 2009, the Company recorded a net gain on the sale of real estate of $470,000 related to the sale of two office properties and a gain on involuntary conversion of $823,000 related to assets damaged by Hurricane Ike.
Impairment Loss on Real Estate and Investments in Unconsolidated Joint Ventures. During the fourth quarter of 2010, the Company recorded non-cash impairment losses of $4.1 million related to non-strategic office properties targeted for sale in Columbia, South Carolina, and Richmond, Virginia. The Company began actively marketing these assets around year end. As part of the marketing process, the Company estimated that the fair value of these assets was less than their carrying value at December 31, 2010. During the fourth quarter of 2009, the Company recognized a non-cash other-than-temporary impairment loss of $8.8 million in connection with the valuation of the Company’s investments in RubiconPark I, LLC and RubiconPark II, LLC. The impairment was principally due to two customers totaling over 120,000 square feet in the office properties that were unable to meet their rent obligations due to financial difficulty. Additionally, in January 2010, the Company’s joint venture partner, Rubicon U.S. REIT, filed for Chapter 11 bankruptcy protection, rendering our partner unable to support their continuing share of the joint venture obligations.
Interest Expense. Interest expense, including amortization of deferred financing costs, decreased $397,000 or 0.7% for the year ended December 31, 2010, compared to the same period of 2009 and is comprised of the following (in thousands):
| | Year Ended December 31 |
| | | | Increase | % |
| | 2010 | 2009 | (Decrease) | Change |
| Interest expense: | | | | |
| Mortgage interest expense | $ | 47,685 | $ | 47,200 | $ | 485 | 1.0 % |
| Bank line interest expense | 5,200 | 5,543 | (343) | -6.2 % |
| Debt prepayment expense | 53 | - | 53 | 0.0 % |
| Mortgage loan cost amortization | 894 | 1,274 | (380) | -29.8 % |
| Bank loan cost amortization | 815 | 1,027 | (212) | -20.6 % |
| | | | | |
| Total interest expense | $ | 54,647 | $ | 55,044 | $ | (397) | -0.7 % |
Mortgage interest expense increased $485,000 or 1.0% for the year ended December 31, 2010 compared to the same period for 2009, and is primarily due to the increase in average interest rates on mortgage notes payable from 5.6% at December 31, 2009, to 5.9% at December 31, 2010.
Bank line interest expense decreased $343,000 or 6.2% for the year ended December 31, 2010 compared to the same period for 2009. The decrease in bank line interest expense is primarily due to a decrease in average borrowings of $13.8 million for the year ended December 31, 2010 compared to the same period for 2009. The decrease in average borrowing is due to proceeds received from the Company’s August 2010 $45.0 million preferred stock offering, offset by advances on the credit facility to retire existing mortgage debt and to make improvements and investments in office properties.
Discontinued Operations. Discontinued operations is comprised of the following for year ended December 31, 2010 and 2009 (in thousands):
| | Year Ended December 31 |
| | | | Increase | % |
| | 2010 | 2009 | (Decrease) | Change |
| Discontinued operations: | | | | |
| Income from discontinued operations | $ | 194 | $ | 404 | $ | (210) | -52.0% |
| Gain on sale of real estate | | | | |
| from discontinued operations | | 8,518 | - | 8,518 | 100.0% |
| | | | | |
| Total discontinued operations | $ | 8,712 | $ | 404 | $ | 8,308 | 2056.4% |
All current and prior period income from the following office property disposition is included in discontinued operations for the years ended December 31, 2010 and 2009 (in thousands).
| Office Property | | Location | | Square Feet | | Date of Sale | | Net Sales Price | | Net Book Value of Real Estate | | Gain on Sale |
| One Park Ten | | Houston, Texas | | 163 | | 04/15/10 | | $ | 14,924 | | $ | 6,406 | | $ | 8,518 |
During the third quarter of 2010, the management agreement for One Park Ten was terminated. This termination took place within six months of the date the property was sold and therefore, the Company reclassified its current and prior period income to discontinued operations.
Comments are for the year ended December 31, 2009 compared to the year ended December 31, 2008.
Net loss attributable to common stockholders for the year ended December 31, 2009, was $16.4 million ($0.85 per basic common share) as compared to net income attributable to common stockholders of $4.5 million ($0.30 per basic common share) for the year ended December 31, 2008. The primary reason for the decrease in net income attributable to common stockholders for the year ended December 31, 2009 compared to the year ended December 31, 2008 is due to the decrease in gain on sale of real estate from discontinued operations in the amount of $22.6 million, which is attributable to three assets sold in 2008. Net gains on the sale of real estate and involuntary conversion of $1.3 million, offset by impairment losses totaling $8.8 million, were included in net loss attributable to common stockholders for the year ended December 31, 2009. Net gains on the sale of real estate of $22.6 million, offset by impairment losses totaling $2.5 million, were included in net income attributable to common stockholders for the year ended December 31, 2008. The change in gain (loss) on sale of real estate investments, involuntary conversion and other assets as well as the discussion of other variances for income and expense items that comprise net loss attributable to common stockholders is discussed in detail below.
Office and Parking Properties. The analysis below includes changes attributable to same-store properties, acquisitions and dispositions of office properties. Same-store properties are those that the Company owned during both the current and prior year reporting periods, excluding properties classified as discontinued operations. At December 31, 2009, same-store properties consisted of 56 properties comprising 12.1 million square feet. One property with 189,000 square feet was developed in 2008 and does not meet the definition of a same-store property for the year ended December 31, 2009.
The following table represents revenue from office and parking properties for the years ended December 31, 2009 and 2008 (in thousands):
| | Year Ended December 31 |
| | | | Increase | % |
| | 2009 | 2008 | (Decrease) | Change |
| Revenue from office and parking properties: | | | |
| Same-store properties | $ | 251,381 | $ | 253,469 | $ | (2,088) | -0.8% |
| Properties acquired in 2008 | 7,315 | 3,763 | 3,552 | 94.4% |
| Office property development | 3,673 | 166 | 3,507 | 2112.7% |
| Properties disposed | 582 | 2,831 | (2,249) | -79.4% |
| Total revenue from office and | | | | |
| parking properties | $ | 262,951 | $ | 260,229 | $ | 2,722 | 1.0% |
Revenue from office and parking properties for same-store properties decreased $2.1 million or 0.8% for the year ended December 31, 2009 compared to the same period for 2008. The primary reason for the decrease is due to a decrease in lease termination fee income of $2.7 million, offset by a 2.6% increase in same-store average rental rates for same-store properties for the year ended December 31, 2009 compared to December 31, 2008.
The following table represents property operating expenses for the years ended December 31, 2009 and 2008 (in thousands):
| | Year Ended December 31 |
| | | | Increase | % |
| | 2009 | 2008 | (Decrease) | Change |
| Property operating expenses: | | | |
| Same-store properties | $ | 120,691 | $ | 120,911 | $ | (220) | -0.2% |
| Properties acquired in 2008 | 3,686 | 1,768 | 1,918 | 108.5% |
| Office property development | 1,667 | 183 | 1,484 | 810.9% |
| Properties disposed | 299 | 1,547 | (1,248) | -80.7% |
| Total property | | | | |
| operating expenses | $ | 126,343 | $ | 124,409 | $ | 1,934 | 1.6% |
Property operating expenses for same-store properties decreased $220,000 or 0.2% for the year ended December 31, 2009 compared to the same period for 2008. The primary reason for the decrease is decreased personnel expenses and utilities offset by increased bad debt expense and ad valorem taxes.
Depreciation and amortization expense attributable to office and parking properties increased $902,000 or 1.0% for the year ended December 31, 2009 compared to the same period for 2008 and is due to the additional depreciation associated with the development of an office property in 2008, the acquisition of office properties in 2008, and improvements to properties.
Hurricane Ike Impact. The Company had 13 wholly-owned properties and one jointly-owned property totaling 2.3 million square feet in Houston, Texas, which sustained some property damage from Hurricane Ike on September 13, 2008. Damages for the 14 properties were approximately $6.3 million. The Company’s insurance deductible related to these claims was approximately $2.2 million. Approximately $365,000 represents repair and cleanup costs with the remainder representing capitalized costs. In 2009, the Company recorded a net gain of approximately $823,000 related to an involuntary conversion of the damaged assets.
Share-Based Compensation Expense. Share-based compensation expense of $2.6 million and $2.3 million was recognized for the years ended December 31, 2009 and 2008, respectively. Total compensation expense related to nonvested awards not yet recognized was $2.2 million at December 31, 2009. The weighted average period over which this expense is expected to be recognized is approximately 1.8 years.
During the year ended December 31, 2009, a total of 30,416 restricted shares vested and were issued to officers of the Company. These shares vested upon the achievement of the goals of the GEAR UP Plan. The compensation expense relating to the vesting of the GEAR UP performance-based restricted shares of $1.4 million was recognized in 2008.
During the year ended December 31, 2009, the Board of Directors approved a grant of 120,500 restricted shares to officers of the Company. Excluding forfeitures, there were 119,750 restricted shares outstanding that are valued at $1.9 million at December 31, 2009. The shares vest at a rate of 29,938 shares per year over the four years following the grant date and were subject to certain performance-based goals that were established and achieved for 2009. Due to the achievement of the 2009 performance goals, 29,941 restricted shares vested and were issued to officers of the Company on February 10, 2010.
General and Administrative Expense. General and administrative expense decreased $3.6 million from $9.7 million in 2008 to $6.1 million in 2009 and is primarily attributable to decreased personnel costs and professional fees. Additionally, 2008 included $1.4 million in expense associated with the vesting of the GEAR UP performance-based restricted stock.
Gain on Sale of Real Estate Investment and Involuntary Conversions. For the year ended December 31, 2009, the Company recorded a net gain on the sale of real estate of $470,000 related to the sale of two office properties and a gain on involuntary conversion of $823,000 related to assets damaged by Hurricane Ike. For the year ended December 31, 2008, the Company recorded a $22.6 million gain on the sale of three office properties. This gain has been classified as a gain on sale of real estate from discontinued operations.
Impairment Loss on Real Estate and Investments in Unconsolidated Joint Ventures. During the fourth quarter of 2009, the Company recognized a non-cash other-than-temporary impairment loss of $8.8 million in connection with the valuation of the Company’s investments in RubiconPark I, LLC and RubiconPark II, LLC. The impairment is principally due to two customers totaling over 120,000 square feet in the office properties that were unable to meet their rent obligations due to financial difficulty. Additionally, in January 2010, the Company’s joint venture partner, Rubicon U.S. REIT, filed for Chapter 11 bankruptcy protection, rendering our partner unable to support their continuing share of the joint venture obligations. During the year ended December 31, 2008, the Company recognized an impairment loss of $2.5 million on two office properties and 12 acres of land in New Orleans, Louisiana.
Interest Expense. Interest expense, including amortization, decreased $3.7 million or 6.3% for the year ended December 31, 2009 compared to the same period for 2008 and is comprised of the following (in thousands):
| | Year Ended December 31 |
| | | | Increase | % |
| | 2009 | 2008 | (Decrease) | Change |
| Interest expense: | | | | |
| Mortgage interest expense | $ | 47,200 | $ | 46,763 | $ | 437 | 0.9 % |
| Bank line interest expense | 5,543 | 10,196 | (4,653) | -45.6 % |
| Debt prepayment expense | - | 13 | (13) | -100.0 % |
| Mortgage loan cost amortization | 1,274 | 1,098 | 176 | 16.0 % |
| Bank loan cost amortization | 1,027 | 696 | 331 | 47.6 % |
| | | | | |
| Total interest expense | $ | 55,044 | $ | 58,766 | $ | (3,722) | -6.3 % |
Mortgage interest expense increased $437,000 or 0.9% for the year ended December 31, 2009 compared to the same period for 2008 and is due to the net effect of new loans placed in 2008 and 2009, the refinancing of one loan in 2008, and the early extinguishment of three mortgages in 2008 and one mortgage in 2009. Item 7. “Management’s Discussion and Analysis of Financial Condition and Results of Operations – Financial Condition – Mortgage Notes Payable,” includes a discussion of mortgages placed and extinguished in 2009. The average interest rate on mortgage notes payable at December 31, 2009 and 2008 was 5.6% and 5.5%, respectively.
Bank line interest expense decreased $4.7 million or 45.6% for the year ended December 31, 2009 compared to the same period for 2008. The change is primarily due to a decrease in average borrowings of $87.0 million for the year ended December 31, 2009 compared to the year ended December 31, 2008, and a decrease in average interest rate from 4.8% for the year ended December 31, 2008 to 4.3% for the year ended December 31, 2009. The decrease in average borrowings is primarily attributable to proceeds received from the Company’s April 2009 $84.5 million common stock offering.
Discontinued Operations. Discontinued operations is comprised of the following for the years ended December 31, 2009 and 2008 (in thousands):
| | Year Ended December 31 |
| | | | Increase | % |
| | 2009 | 2008 | (Decrease) | Change |
| Discontinued operations: | | | | |
| Income (loss) from discontinued operations | $ | 404 | $ | (461) | $ | 865 | 187.6% |
| Gain on sale of real estate | | | | |
| from discontinued operations | | - | 22,588 | (22,588) | -100.0% |
| | | | | |
| Total discontinued operations | $ | 404 | $ | 22,127 | $ | (21,723) | -98.2% |
The gains and all current and prior period income from the following office property dispositions are included in discontinued operations for the years ended December 31, 2009 and 2008 (in thousands):
| | | Square | Date of | Net Sales | Net Book Value | Gain |
| Office Property | Location | Feet | Sale | Price | of Real Estate | on Sale |
| | | | | | | |
| Town Point Center | Norfolk, Virginia | 131 | 07/15/08 | $ | 12,180 | $ | 10,621 | $ | 1,559 |
| Wachovia Plaza | St. Petersburg, Florida | 186 | 08/18/08 | 25,492 | 16,154 | 9,338 |
| Capitol Center | Columbia, South Carolina | 460 | 09/05/08 | 46,792 | 35,101 | 11,691 |
| 2008 Dispositions | | 777 | | $ | 84,464 | $ | 61,876 | $ | 22,588 |
| | | | | | | |
| One Park Ten | Houston, Texas | 163 | 04/15/10 | $ | 14,924 | $ | 6,406 | $ | 8,518 |
| 2010 Dispositions | | 163 | | $ | 14,924 | $ | 6,406 | $ | 8,518 |
Liquidity and Capital Resources
Statement of Cash Flows. Cash and cash equivalents were $19.7 million and $20.7 million at December 31, 2010 and 2009, respectively. Cash flows provided by operating activities for the years ended December 31, 2010 and 2009, were $68.1 million and $69.9 million, respectively. The decrease in cash flows from operating activities of $1.8 million is primarily attributable to the effect of the timing of receipt of revenues and payment of expenses.
Cash used in investing activities was $68.1 million and $15.2 million for the years ended December 31, 2010 and 2009, respectively. The increase in cash used by investing activities of $52.9 million is primarily due to the effect of investments in and improvements to office properties as well as a decline in net proceeds received from the sale of office properties in 2010.
Cash used in financing activities was $1.0 million and $49.4 million for the years ended December 31, 2010 and 2009, respectively. The decrease in cash used in financing activities of $48.4 million is primarily attributable to a reduction in dividends paid on common stock, decreased payments on bank borrowings, and increased contributions from noncontrolling interest partners, offset by a decrease in proceeds from stock offerings.
Liquidity. The Company plans to continue pursuing the acquisition of additional investments that meet the Company’s investment criteria and intends to use operating cash flow, proceeds from the refinancing of mortgages, proceeds from the sale of non-strategic assets, proceeds from the sale of portions of owned assets through joint ventures, possible sales of securities, cash balances and the Company’s credit facility to fund those acquisitions.
The Company’s cash flows are exposed to interest rate changes primarily as a result of its credit facility used to maintain liquidity and fund capital expenditures and expansion of the Company’s real estate investment portfolio and operations. The Company’s interest rate risk management objective is to limit the impact of interest rate changes on earnings and cash flows and to lower its overall borrowing costs. To achieve its objectives, the Company borrows at fixed rates, but also utilizes an unsecured credit facility.
At December 31, 2010, the Company had a total of $110.8 million outstanding under the following credit facilities (in thousands):
| | | | | Outstanding |
| Credit Facilities | Lender | Interest Rate | Maturity | Balance |
| $15.0 Million Unsecured Working Capital | |
| Revolving Credit Facility (1) | PNC Bank | 2.3% | 04/27/11 | $ | 1,839 |
| $236.0 Million Unsecured Revolving Credit |
| Facility (1) | Wells Fargo | 4.2% | 04/27/11 | 49,000 |
| $60.0 Million Unsecured Term Loan (1) | Wells Fargo | 4.8% | 04/27/11 | 60,000 |
| | | 4.6% | | $ | 110,839 |
| (1) | On January 31, 2011, the Company closed a new $190.0 million unsecured revolving credit facility and a new $10.0 million unsecured working capital revolving credit facility that replaced the existing unsecured revolving credit facility, term loan and working capital facility noted above. Excluding the impact of the interest rate swap, the interest rate on the new credit facilities is based on LIBOR plus 275 to 350 basis points, depending upon overall Company leverage, with the current rate set at 325 basis points. Additionally, the Company pays fees on the unused portion of the credit facilities ranging between 40 and 50 basis points based upon usage of the aggregate commitment, with the current rate set at 40 basis points. |
The Company’s unsecured credit facilities require compliance with a number of restrictive financial covenants, including tangible net worth, fixed charge coverage ratio, unencumbered interest coverage ratio, total debt to total asset ratio, secured debt to total asset value ratio, secured recourse debt to total asset value ratio and unencumbered pool restrictions. At December 31, 2010 the Company was in compliance with these financial covenants.
On January 31, 2011, the Company closed a new $190.0 million unsecured revolving credit facility and a new $10.0 million unsecured working capital revolving credit facility. The new credit facilities have an initial term of three years and replaced the existing unsecured revolving credit facility, term loan and working capital facility that were scheduled to mature on April 27, 2011. The Company also has a $100.0 million interest rate swap associated with the credit facilities that expires March 31, 2011, locking LIBOR at 3.635%. The Company does not anticipate an extinguishment of this interest rate swap prior to its stated expiration as the hedged item relates to interest rate payments on $100.0 million of LIBOR-based debt and the forecasted transaction remains probable at December 31, 2010. Wells Fargo Securities and JP Morgan Securities LLC acted as Joint Lead Arrangers and Joint Book Runners on the unsecured revolving credit facility. In addition, Wells Fargo Bank, N.A. acted as Administration Agent and JPMorgan Chase Bank, N.A. acted as Syndication Agent. Other participating lenders include PNC Bank, N.A., Bank of America, N.A., US Bank, N.A., Trustmark National Bank, and BancorpSouth Bank. The working capital revolving credit facility was provided solely by PNC Bank, N.A.
During 2008, the Company entered into two interest rate swap agreements. The Company designated the swaps as cash flow hedges of the variable interest rates on the Company’s borrowings under the Wells Fargo unsecured revolving credit facility and a portion of the debt secured by the Pinnacle at Jackson Place. These swaps are considered to be fully effective and changes in the fair value of the swaps are recognized in accumulated other comprehensive income (loss). The Company's interest rate hedge contracts at December 31, 2010 and 2009 are summarized as follows (in thousands):
| | | | | | | Fair Value |
| | Balance | | | | | Liability |
| Type of | Sheet | Notional | Maturity | | Fixed | December 31 |
| Hedge | Location | Amount | Date | Reference Rate | Rate | 2010 | 2009 |
| Swap | Accounts Payable and Other Liabilities | $ | 100,000 | 03/31/11 | 1 - Month LIBOR | 4.785% | $ | (836) | $ | (3,585) |
| Swap | Accounts Payable and Other Liabilities | $ | 23,500 | 12/01/14 | 1 - Month LIBOR | 5.800% | (2,167) | (1,307) |
| | | | | | | $ | (3,003) | $ | (4,892) |
At December 31, 2010, the Company had $773.5 million in mortgage notes payable with an average interest rate of 5.9% secured by office properties and $110.8 million drawn under the Company’s unsecured credit facilities. Parkway’s pro rata share of unconsolidated joint venture debt was $2.5 million with an average interest rate of 5.8% at December 31, 2010.
The Company monitors a number of leverage and other financial metrics, including the net debt to total asset value ratio, as defined in the loan agreements for the Company’s credit facilities. In addition, the Company also monitors interest, fixed charge and modified fixed charge coverage ratios, as well as the net debt to EBITDA multiple. The interest coverage ratio is computed by comparing the cash interest accrued to EBITDA. The interest coverage ratio for the years ended December 31, 2010 and 2009, was 2.72 and 2.78 times, respectively. The fixed charge coverage ratio is computed by comparing the cash interest accrued, principal payments made on mortgage loans and preferred dividends paid to EBITDA. The fixed charge coverage ratio for the years ended December 31, 2010 and 2009 was 1.85 and 1.95 times, respectively. The modified fixed charge coverage ratio is computed by comparing the cash interest accrued and preferred dividends paid to EBITDA. The modified fixed charge coverage ratio for the years ended December 31, 2010 and 2009, was 2.36 and 2.49 times, respectively. The net debt to EBITDA multiple is computed by comparing Parkway’s share of net debt to EBITDA for a trailing 12-month period. The net debt to EBITDA multiple for the years ended December 31, 2010 and 2009, was 5.9 and 6.3 times, respectively. Management believes various leverage and other financial metrics it monitors provide useful information on total debt levels as well as the Company’s ability to cover interest, principal and/or preferred dividend payments.
The table below presents the principal payments due for the mortgage notes payable at December 31, 2010 (in thousands).
| | Total | | | | Recurring |
| | Mortgage | | Balloon | | Principal |
| | Maturities | | Payments | | Amortization |
| Schedule of Mortgage Maturities by Years: | | | | | |
| 2011 | $ | 113,914 | | $ | 102,694 | | $ | 11,220 |
| 2012 | 58,034 | | 48,408 | | 9,626 |
| 2013 | 9,943 | | - | | 9,943 |
| 2014 | 10,595 | | - | | 10,595 |
| 2015 | 37,971 | | 26,891 | | 11,080 |
| 2016 | 398,695 | | 393,875 | | 4,820 |
| Thereafter | 144,383 | | 136,029 | | 8,354 |
| Total | $ | 773,535 | | $ | 707,897 | | $ | 65,638 |
| Fair value at 12/31/10 | $ | 734,637 | | | | |
On February 8, 2010, the Company obtained a $35.0 million non-recourse, first mortgage loan related to the refinance of a $60.0 million recourse mortgage that was scheduled to mature in May 2010. The mortgage loan bears interest at a fixed rate of 7.25% and is secured by the Company’s Capital City Plaza building in Atlanta, Georgia. The loan mortgage matures in March 2017 and includes the option to be prepaid at the end of five years at a cost of 1% of the outstanding loan balance. The Company used available proceeds under the credit facility to pay the $25.0 million difference on the maturing mortgage loan.
On April 15, 2010, the Company sold One Park Ten, a 163,000 square foot office property in Houston, Texas, for a gross sales price of $15.7 million. Parkway received net cash proceeds from the sale of $4.8 million which were used to reduce amounts outstanding under the Company’s credit facility. The buyer assumed the $8.7 million first mortgage loan secured by the property. The mortgage loan carried an interest rate of 7.1% and was scheduled to mature in June 2012. During the second quarter of 2010, the Company recorded a $136,000 loss on extinguishment of debt associated with the buyer’s assumption of the mortgage loan.
On April 30, 2010, the Company repaid a $17.2 million mortgage loan secured by two office properties in Houston, Texas, and one office property in Atlanta, Georgia, utilizing available proceeds under its credit facility. The mortgage loan had an interest rate of 5.3% and was scheduled to mature on May 1, 2010.
On May 28, 2010, the Company obtained a $23.0 million non-recourse, first mortgage loan secured by Citrus Center, a 261,000 square foot office property in Orlando, Florida. The mortgage loan had a fixed interest rate of 6.3% and a term of ten years. The proceeds were used to reduce amounts outstanding under the Company’s credit facility.
Upon maturity on June 1, 2010, the Company paid off its share and its partner’s share of a $10.6 million mortgage note payable secured by the Toyota Center, a 175,000 square foot office property in Memphis, Tennessee, utilizing available proceeds under the Company’s credit facility. The mortgage had an interest rate of 7.9%. The Toyota Center office property was previously owned by a consolidated joint venture, Moore Building Associates, LP, in which the Company served as the general partner. However, during the third quarter of 2010, Parkway purchased the partner’s interest, thereby placing Parkway’s ownership of the property at 100%.
On July 8, 2010, the Company obtained a $12.0 million non-recourse first mortgage loan secured by the Stein-Mart building, a 196,000 square foot office property in Jacksonville, Florida. The mortgage loan had a fixed interest rate of 6.5% and a term of ten years. The proceeds were used to reduce amounts outstanding under the Company’s credit facility.
On August 9, 2010, the Company issued 1.97 million additional shares of its 8.0% Series D Cumulative Redeemable Preferred Stock at a price of $23.757 per share equating to a yield of 8.500% (excluding accrued dividends). Wells Fargo Securities, LLC and Banc of America Securities LLC acted as joint book-running managers on the transaction. The Company used the net proceeds of approximately $45.0 million to reduce amounts outstanding under the Company’s credit facility and for general corporate purposes.
On October 8, 2010, the Company repaid a $7.6 million mortgage loan secured by One Jackson Place, a 220,000 square foot office property in Jackson, Mississippi. The mortgage had an interest rate of 7.9% and was
scheduled to mature on October 10, 2010. The Company repaid the mortgage loan using available proceeds under the Company’s credit facility.
On December 15, 2010, the Company repaid a $31.0 million mortgage loan secured by Squaw Peak Corporate Center, a 290,000 square foot office complex in Phoenix, Arizona. The mortgage loan had a fixed interest rate of 4.9%. The Company repaid the mortgage loan using available proceeds under the Company’s credit facility.
On January 21, 2011, in connection with its purchase of 3344 Peachtree in Atlanta, Georgia, Fund II assumed the $89.6 million existing non-recourse first mortgage loan, which matures on October 1, 2017, and carries a fixed interest rate of 4.8%. In accordance with GAAP, the mortgage loan was recorded at $87.2 million to reflect the value of the instrument based on a market interest rate of 5.25% on the date of purchase.
On February 18, 2011, Fund II obtained a $10.0 million mortgage loan secured by Carmel Crossing, a 326,000 square foot office complex in Charlotte, North Carolina. The mortgage loan has a fixed rate of 5.5% and a term of nine years. Parkway received $2.4 million in net proceeds from the loan, which represents its 30% equity investment in the property. The proceeds were used to reduce amounts outstanding under the Company’s credit facility.
In 2011, the Company has $102.7 million in remaining secured debt maturities. The Company intends to evaluate each maturity throughout the year and may pursue either dispositions, refinancing with non-recourse, fixed rate mortgage loans, or paying down the existing mortgage loans with available proceeds under the Company’s credit facility.
The Company presently has plans to make recurring capital expenditures to its office properties in 2011 of approximately $46.0 to $49.0 million on a consolidated basis, with approximately $34.0 to $37.0 million representing Parkway’s proportionate share of recurring capital improvements. These costs include tenant improvements, leasing costs and recurring building improvements. Additionally, the Company plans to make improvements related to upgrades on properties acquired in recent years that were anticipated at the time of purchase and major renovations that are nonrecurring in nature to office properties in 2011 of approximately $6.0 to $7.0 million with approximately $3.0 to $4.0 million representing Parkway’s proportionate share. All such improvements are expected to be financed by cash flow from the properties, capital expenditure escrow accounts, advances from the Company’s credit facility and contributions from partners.
The Company anticipates that its current cash balance, operating cash flows, contributions from partners and borrowings (including borrowings under the working capital revolving credit facility) will be adequate to pay the Company’s (i) operating and administrative expenses, (ii) debt service obligations, (iii) distributions to stockholders, (iv) capital improvements, and (v) normal repair and maintenance expenses at its properties, both in the short and long term. In addition, the Company may use proceeds from sales of assets, sales of equity securities and borrowings to fund property acquisitions and pay debts as they mature.
Off-Balance Sheet Arrangements
At December 31, 2010, the Company was invested in three unconsolidated joint ventures with unrelated investors. These joint ventures are accounted for using the equity method of accounting, as Parkway does not control, but has the ability to significantly influence the operations of the joint ventures and is not the primary beneficiary. As a result, the assets and liabilities of the joint ventures are not included in Parkway's consolidated balance sheet. Information relating to the unconsolidated joint ventures at December 31, 2010 is detailed below.
| | | | Parkway's |
| | | | Ownership |
| Joint Ventures | Property Name | Location | Interest |
| | | | |
| Wink-Parkway Partnership (“Wink JV”)(1) | Wink Building | New Orleans, LA | 50.0 % |
| Parkway Joint Venture, LLC | UBS Building/River Oaks | Jackson, MS | 20.0 % |
| RubiconPark II, LLC (2) | Maitland 200 | Orlando, FL | 20.0 % |
| (1) | On February 4, 2011, the Company purchased its partner’s 50% interest in the Wink JV for $250,000. The Wink JV was established for the purpose of owning the Wink Building, a 32,000 square foot office property in New Orleans, Louisiana. Upon completing the purchase of its partner’s interest, Parkway now owns 100% of the Wink Building. |
| (2) | As a result of the Company’s partner, Rubicon US REIT, filing for Chapter 11 bankruptcy, new partners were admitted into the partnership. They are JP Morgan Chase, Kaufman Jacobs, LLC and Starwood Capital Group Global, LP. |
Cash distributions from unconsolidated joint ventures are made to each partner based on their percentage of ownership in each entity. Cash distributions made to partners in joint ventures where the percentage of debt assumed is disproportionate to the ownership percentage in the venture is distributed based on each partner's share of cash available for distribution before debt service, based on their ownership percentage, less the partner's share of debt service based on the percentage of debt assumed by each partner.
Parkway provides management, construction and leasing services for all of the unconsolidated joint ventures except for the Wink-Parkway Partnership, and receives market-based fees for these services. The portion of fees earned on unconsolidated joint ventures attributable to Parkway's ownership interest is eliminated in consolidation.
At December 31, 2010, the Company’s investment in unconsolidated joint ventures was $2.9 million, or .2% of total assets.
Contractual Obligations
We have contractual obligations including mortgage notes payable and lease obligations. The table below presents total payments due under specified contractual obligations by year through maturity at December 31, 2010 (in thousands):
| | Payments Due By Period |
| Contractual Obligations | Total | 2011 | 2012 | 2013 | 2014 | 2015 | Thereafter |
| Long-Term Debt | $ | 1,101,870 | $ | 269,802 | $ | 96,854 | $ | 46,517 | $ | 46,517 | $ | 72,555 | $ | 569,625 |
| Capital Lease Obligations | 6,659 | 198 | 191 | 171 | 138 | 113 | 5,848 |
| Operating Leases | 1,138 | 646 | 371 | 121 | - | - | - |
| Purchase Obligations | 17,938 | 15,829 | 609 | 43 | 1,380 | 42 | 35 |
| Ground Lease Payments | 15,519 | 184 | 184 | 184 | 184 | 184 | 14,599 |
| Total | $ | 1,143,124 | $ | 286,659 | $ | 98,209 | $ | 47,036 | $ | 48,219 | $ | 72,894 | $ | 590,107 |
The amounts presented above for long-term debt and capital lease obligations include principal and interest payments. Long-term debt also includes principal and interest payments due under the Company’s previous unsecured revolving credit facility which was replaced with a new $200.0 million unsecured revolving credit facility on January 31, 2011. The amounts presented for purchase obligations represent the remaining tenant improvement allowances and lease inducement costs for leases in place and commitments for building improvements at December 31, 2010.
Parkway has a 30% ownership interest in Fund II and acts as the general partner. Fund II will be capitalized with approximately $375.0 million of equity capital and $375.0 million of non-recourse, fixed-rate first mortgage debt. Parkway’s share of the equity capital for the fund will be $112.5 million. Parkway has four years from the inception date of Fund II, or through May 2012, to identify and acquire properties, with funds contributed as needed to purchase office investments. At March 1, 2011, Fund II had remaining investment capacity of $552.1 million of which $81.8 million represents Parkway’s remaining equity contribution that would be due in connection with additional investments in office properties.
Critical Accounting Estimates
General. Parkway’s investments are generally made in office properties. Therefore, the Company is generally subject to risks incidental to the ownership of real estate. Some of these risks include changes in supply or demand for office properties or customers for such properties in an area in which we have buildings; changes in real estate tax rates; and changes in federal income tax, real estate and zoning laws. The Company’s discussion and analysis of financial condition and results of operations is based upon its Consolidated Financial Statements. The Company’s Consolidated Financial Statements include the accounts of Parkway Properties, Inc., its majority owned subsidiaries and joint ventures in which the Company has a controlling interest. Parkway also consolidates subsidiaries where the entity is a variable interest entity and Parkway is the primary beneficiary. The preparation of financial statements in conformity with accounting principles generally accepted in the United States of America requires us to make estimates and assumptions that affect the reported amounts of assets and liabilities at the date of the financial statements and the reported amounts of revenues and expenses for the reporting period. Actual results could differ from our estimates.
The accounting policies and estimates used in the preparation of our Consolidated Financial Statements are more fully described in the notes to our Consolidated Financial Statements. However, certain of the Company’s
significant accounting policies are considered critical accounting policies due to the increased level of assumptions used or estimates made in determining their impact on our Consolidated Financial Statements.
Parkway considers critical accounting policies and estimates to be those used in the determination of the reported amounts and disclosure related to the following:
(1) Revenue recognition;
(2) Impairment or disposal of long-lived assets;
(3) Depreciable lives applied to real estate and improvements to real estate;
(4) Initial recognition, measurement and allocation of the cost of real estate acquired; and
(5) Allowance for doubtful accounts.
Revenue Recognition. Revenue from real estate rentals is recognized on a straight-line basis over the terms of the respective leases. The cumulative difference between lease revenue recognized under this method and contractual lease payment terms is recorded as straight line rent receivable on the accompanying balance sheets.
When the Company is the owner of the tenant improvements, the leased space is ready for its intended use when the tenant improvements are substantially completed. In limited instances, when the customer is the owner of the tenant improvements, straight-line rent is recognized when the tenant takes possession of the unimproved space.
The leases also typically provide for tenant reimbursement of a portion of common area maintenance and other operating expenses. Property operating cost recoveries from customers (“expense reimbursements”) are recognized as revenue in the period in which the expenses are incurred. The computation of expense reimbursements is dependent on the provisions of individual customer leases. Most customers make monthly fixed payments of estimated expense reimbursements. The Company makes adjustments, positive or negative, to expense reimbursement income quarterly to adjust the recorded amounts to the Company’s best estimate of the final property operating costs based on the most recent quarterly budget. After the end of the calendar year, the Company computes each customer’s final expense reimbursements and issues a bill or credit for the difference between the actual amount and the amounts billed monthly during the year.
Management company income represents market-based fees earned from providing management, construction, leasing, brokerage and acquisition services to third parties. Management fee income is computed and recorded monthly in accordance with the terms set forth in the stand alone management service agreements. Leasing and brokerage commissions are recognized pursuant to the terms of the stand alone agreements at the time underlying leases are signed, which is the point at which the earnings process is complete and collection of the fees is reasonably assured. Fees relating to the purchase or sale of property are recognized when the earnings process is complete and collection of the fees is reasonably assured, which usually occurs at closing. All fees on Company-owned properties and consolidated joint ventures are eliminated in consolidation. The portion of fees earned on unconsolidated joint ventures attributable to Parkway's ownership interest is eliminated in consolidation.
Impairment or Disposal of Long-Lived Assets. Changes in the supply or demand of tenants for our properties could impact our ability to fill available space. Should a significant amount of available space exist for an extended period, our investment in a particular office building may be impaired. We evaluate our real estate assets upon the occurrence of significant adverse changes to assess whether any impairment indicators are present that affect the recovery of the carrying amount.
We classify certain assets as held for sale based on management having the authority and intent of entering into commitments for sale transactions to close in the next twelve months. We consider an office property as held for sale once we have executed a contract for sale, allowed the buyer to complete its due diligence review and received a substantial non-refundable deposit. Until a buyer has completed its due diligence review of the asset, necessary approvals have been received and substantive conditions to the buyer’s obligation to perform have been satisfied, we do not consider a sale to be probable. When the Company identifies an asset as held for sale, we estimate the net realizable value of such asset and discontinue recording depreciation on the asset. The Company records assets held for sale at the lower of carrying amount or fair value less cost to sell. With respect to assets classified as held and used, we periodically review these assets to determine whether our carrying amount will be recovered. A long-lived asset is considered impaired if its carrying value is not recoverable and exceeds the sum of undiscounted cash flows expected to result from the use and eventual disposal of the asset. The cash flow and fair value estimates are based on assumptions about employing the asset for its remaining useful life. Factors considered in projecting future cash flows include but are not limited to: existing leases, future leasing and terminations, market rental rates, capital improvements, tenant improvements, leasing commissions, inflation and other known variables. Upon impairment,
the Company would recognize an impairment loss to reduce the carrying value of the long-lived asset to our estimate of its fair value. The estimate of fair value and cash flows to be generated from properties requires us to make assumptions. If one or more assumptions prove incorrect or if the assumptions change, the recognition of an impairment loss on one or more properties may be necessary in the future, which would result in a decrease to net income.
During the fourth quarter of 2010, the Company recorded non-cash impairment losses of $4.1 million related to non-strategic office properties targeted for sale in Columbia, South Carolina and Richmond, Virginia. The Company began actively marketing these assets around year end. As part of the marketing process, the Company estimated that the fair value of these assets was less than their carrying value at December 31, 2010. Therefore, an impairment loss for the assets was recorded during the fourth quarter of 2010.
Depreciable Lives Applied to Real Estate and Improvements to Real Estate. Depreciation of buildings and parking garages is computed using the straight-line method over an estimated useful life of 40 years. Depreciation of building improvements is computed using the straight-line method over the estimated useful life of the improvement. If our estimate of useful lives proves to be incorrect, the depreciation expense recognized would also be incorrect. Therefore, a change in the estimated useful lives assigned to buildings and improvements would result in either an increase or decrease in depreciation expense, which would result in an increase or decrease in earnings.
Initial Recognition, Measurement and Allocation of the Cost of Real Estate Acquired. Parkway accounts for its acquisitions of real estate by allocating the fair value of real estate to acquired tangible assets, consisting of land, building, garage, building improvements and tenant improvements, identified intangible assets and liabilities, consisting of the value of above and below market debt assumed with the acquisition.
Parkway allocates the purchase price of properties to tangible and intangible assets based on fair values. The Company determines the fair value of the tangible and intangible components using a variety of methods and assumptions all of which result in an approximation of fair value. Differing assumptions and methods could result in different estimates of fair value and thus, a different purchase price allocation and corresponding increase or decrease in depreciation and amortization expense.
Allowance for Doubtful Accounts. Accounts receivable are reduced by an allowance for amounts that may become uncollectible in the future. Our receivable balance is comprised primarily of rents and operating expense recoveries due from customers. Change in the supply of or demand for office properties could impact our customers’ ability to honor their lease obligations, which could in turn affect our recorded revenues and estimates of the collectability of our receivables. Revenue from real estate rentals is recognized and accrued as earned on a pro rata basis over the term of the lease. We regularly evaluate the adequacy of our allowance for doubtful accounts considering such factors as credit quality of our customers, delinquency of payment, historical trends and current economic conditions. We provide an allowance for doubtful accounts for customer balances that are over 90 days past due and for specific customer receivables for which collection is considered doubtful. Actual results may differ from these estimates under different assumptions or conditions, which could result in an increase or decrease in bad debt expense.
Recent Accounting Pronouncements
Effective January 1, 2010, the Company adopted Financial Accounting Standards Board (“FASB”) Accounting Standards Update (“ASU”) 2009-16, “Topic 860 – Transfers and Servicing” (“ASU 2009-16”), which amends and codifies SFAS No. 140, “Accounting for Transfers and Servicing of Financial Assets and Extinguishments of Liabilities,” by: eliminating the concept of a qualifying special-purpose entity (“QSPE”); clarifying and amending the derecognition criteria for a transfer to be accounted for as a sale; amending and clarifying the unit of account eligible for sale accounting; and requiring that a transferor initially measure at fair value and recognize all assets obtained (for example, beneficial interests) and liabilities incurred as a result of a transfer of an entire financial asset or group of financial assets accounted for as a sale. Additionally, on and after the effective date, existing QSPEs (as defined under previous accounting standards) must be evaluated for consolidation by reporting entities in accordance with the applicable consolidation guidance. This standard requires enhanced disclosures about, among other things, a transferor’s continuing involvement with transfers of financial assets accounted for as sales, the risks inherent in the transferred financial assets that have been retained, and the nature and financial effect of restrictions on the transferor’s assets that continue to be reported in the consolidated balance sheets. The application of ASU 2009-16 did not have a material impact on the Company’s overall financial position and results of operations upon adoption.
Effective January 1, 2010, the Company adopted FASB ASU 2009-17, “Topic 810 – Consolidations” (“ASU 2009-17”), which amends and codifies FIN 46(R), “Consolidation of Variable Interest Entities,” and changes the consolidation guidance applicable to a VIE. It also amends the guidance governing the determination of whether an enterprise is the primary beneficiary of a VIE, and is, therefore, required to consolidate an entity, by requiring a qualitative analysis rather than a quantitative analysis. The qualitative analysis will include, among other things, consideration of who has the power to direct the activities of the entity that most significantly impact the entity’s economic performance and who has the obligation to absorb losses or the right to receive benefits of the VIE that could potentially be significant to the VIE. This standard also requires continuous reassessments of whether an enterprise is the primary beneficiary of a VIE. Previously, FIN 46(R) required reconsideration of whether an enterprise was the primary beneficiary of a VIE only when specific events had occurred. QSPEs, which were previously exempt from the application of this standard, are now subject to its provisions. This standard also requires enhanced disclosures about an enterprise’s involvement with a VIE. The application of ASU 2009-17 did not have a material impact on the Company’s overall financial position and results of operations upon adoption as the Company will continue to account for its unconsolidated joint ventures under the equity method of accounting.
In 2009, the FASB issued ASU 2010-06, “Fair Value Measurements and Disclosures (Topic 820): Improving Disclosures About Fair Value Measurements,” which amends certain disclosure requirements of ASC 820. This ASU provides additional disclosures for transfers in and out of Levels 1 and 2 and for activity in Level 3. This ASU also clarifies certain other existing disclosure requirements including level of desegregation and disclosure around inputs and valuation techniques. ASU 2010-06 became effective for interim and annual reporting periods beginning after December 15, 2009, and the Company has adopted the provisions and provided the necessary disclosures for the year ended December 31, 2010.
During the first quarter of 2010, the Company adopted FASB ASU 2010-09, “Topic 855 – Subsequent Events: Amendments to Certain Recognition and Disclosure Requirements” (“ASU 2010-09”), which amends Topic 855 so that SEC filers are no longer required to disclose the date through which subsequent events have been evaluated in originally issued and revised financial statements. The application of FASB ASU 2010-09 did not have a material impact on the Company’s overall financial position and results of operations upon adoption.
In July 2010, the FASB issued ASU 2010-20, “Topic 310 – Disclosures about the Credit Quality of Financing Receivables and the Allowance for Credit Losses”, which significantly expands existing disclosures about the credit quality of financing receivables and their allowance for credit losses. ASU 2010-20 will require disclosures as of the end of a reporting period such as accounting policies for each portfolio segment, ending balances of allowance for credit losses and credit-quality indicators in addition to added disclosures about activity related to financing receivables or credit losses. The period end disclosure requirements of ASU 2010-20 will be effective as of the beginning of interim and annual reporting periods that begin after December 15, 2010. The activity disclosure requirements of ASU 2010-20 will be effective as of the beginning of annual reporting periods that begin after December 15, 2010. The Company is currently evaluating the impact of ASU 2010-20 on the Company’s consolidated financial statements.
Funds From Operations
Management believes that funds from operations attributable to common shareholders (“FFO”) is an appropriate measure of performance for equity REITs and computes this measure in accordance with the NAREIT definition of FFO. Funds from operations is defined by NAREIT as net income (computed in accordance with GAAP), excluding gains or losses from sales of property and extraordinary items under GAAP, plus depreciation and amortization, and after adjustments to derive the Company’s pro rata share of FFO of consolidated and unconsolidated joint ventures. Further, the Company does not adjust FFO to eliminate the effects of non-recurring charges. The Company believes that FFO is a meaningful supplemental measure of its operating performance because historical cost accounting for real estate assets in accordance with GAAP implicitly assumes that the value of real estate assets diminishes predictably over time, as reflected through depreciation and amortization expenses. However, since real estate values have historically risen or fallen with market and other conditions, many industry investors and analysts have considered presentation of operating results for real estate companies that use historical cost accounting to be insufficient. Thus, NAREIT created FFO as a supplemental measure of operating performance for real estate investment trusts that excludes historical cost depreciation and amortization, among other items, from net income, as defined by GAAP. The Company believes that the use of FFO, combined with the required GAAP presentations, has been beneficial in improving the understanding of operating results of real estate investment trusts among the investing public and making comparisons of operating results among such companies more meaningful. FFO as
reported by Parkway may not be comparable to FFO reported by other REITs that do not define the term in accordance with the current NAREIT definition. Funds from operations do not represent cash generated from operating activities in accordance with accounting principles generally accepted in the United States and is not an indication of cash available to fund cash needs. Funds from operations should not be considered an alternative to net income as an indicator of the Company's operating performance or as an alternative to cash flow as a measure of liquidity.
The following table presents a reconciliation of the Company's net income to FFO for the years ended December 31, 2010 and 2009 (in thousands):
| | Year Ended |
| | December 31 |
| | 2010 | | 2009 |
| Net loss for Parkway Properties, Inc. | $ | (2,618) | | $ | (11,603) |
| Adjustments to derive funds from operations: | | | |
| Depreciation and amortization | 92,190 | | 92,126 |
| Depreciation and amortization – discontinued operations | 121 | | 600 |
| Noncontrolling interest depreciation and amortization | (17,668) | | (20,138) |
| Adjustments for unconsolidated joint ventures | 342 | | 848 |
| Preferred dividends | (6,325) | | (4,800) |
| Gain on sale of real estate | (8,518) | | (470) |
Funds from operations attributable to common shareholders (1) | $ | 57,524 | | $ | 56,563 |
| (1) | Funds from operations attributable to common shareholders for the years ended December 31, 2010 and 2009 include the following items (in thousands): |
| | Year Ended December 31 |
| | 2010 | | 2009 |
| Gain on involuntary conversion | $ | 40 | | $ | 823 |
| Non-cash impairment losses | (4,120) | | (8,817) |
| Loss on extinguishment of debt | (189) | | - |
| Acquisition costs | (266) | | - |
| Expenses related to litigation | (1,251) | | - |
| Lease termination fee income | 8,706 | | 1,167 |
Inflation
Inflation has not had a significant impact on the Company because of the relatively low inflation rate in the Company’s geographic areas of operation. Additionally, most of the leases require the customers to pay their pro rata share of operating expenses, including common area maintenance, real estate taxes, utilities and insurance, thereby reducing the Company’s exposure to increases in operating expenses resulting from inflation. The Company’s leases typically have three to seven year terms, which may enable the Company to replace existing leases with new leases at market base rent, which may be higher or lower than the existing lease rate.
Forward-Looking Statements
In addition to historical information, certain sections of this Form 10-K may contain forward-looking statements within the meaning of Section 27A of the Securities Act of 1933 and Section 21E of the Securities Exchange Act of 1934, such as those that are not in the present or past tense, that discuss the Company's beliefs, expectations or intentions or those pertaining to the Company's capital resources, profitability and portfolio performance and estimates of market rental rates. Forward-looking statements involve numerous risks and uncertainties. The following factors, among others discussed herein and in the Company's filings under the Securities Exchange Act of 1934, could cause actual results and future events to differ materially from those set forth or contemplated in the forward-looking statements: defaults or non-renewal of leases, increased interest rates and operating costs, failure to obtain necessary outside financing, difficulties in identifying properties to acquire and in effecting acquisitions, the failure to acquire or sell properties when anticipated, failure to qualify as a real estate investment trust under the Internal Revenue Code of 1986, as amended, environmental uncertainties, risks related to natural disasters, financial market fluctuations, changes in real estate and zoning laws, increases in real property tax rates, and the outcome of
claims and litigation involving or affecting the Company. The success of the Company also depends upon the trends of the economy, including interest rates, income tax laws, governmental regulation, legislation, population changes and those risk factors discussed elsewhere in this Form 10-K and in the Company's filings under the Securities Exchange Act of 1934. Readers are cautioned not to place undue reliance on forward-looking statements, which reflect management's analysis only as the date hereof. The Company assumes no obligation to update forward-looking statements.
ITEM 7A. Quantitative and Qualitative Disclosures About Market Risk.
See information appearing under the caption "Liquidity" appearing in Item 7. "Management's Discussion and Analysis of Financial Condition and Results of Operations".
At December 31, 2010, total outstanding debt was $884.4 million of which $134.3 million or 15.2% was variable rate debt. If market rates of interest on the variable rate debt fluctuate by 10% (or approximately 49 basis points), the change in interest expense on the variable rate debt would increase or decrease future earnings and cash flows by approximately $662,000 annually.
ITEM 8. Financial Statements and Supplementary Data.
| Index to Consolidated Financial Statements | Page |
| | |
| Report of Independent Registered Public Accounting Firm | 48 |
| Consolidated Balance Sheets - at December 31, 2010 and 2009 | 49 |
| Consolidated Statements of Operations - for the years ended December 31, 2010, 2009 and 2008 | 50 |
| Consolidated Statements of Changes in Equity - for the years ended December 31, 2010, 2009 and 2008 | 51 |
| Consolidated Statements of Cash Flows - for the years ended December 31, 2010, 2009 and 2008 | 52 |
| Notes to Consolidated Financial Statements | 53 |
| Schedule II - Valuations and Qualifying Accounts | 82 |
| Schedule III - Real Estate and Accumulated Depreciation | 83 |
| Note to Schedule III - Real Estate and Accumulated Depreciation | 86 |
| Schedule IV - Mortgage Loans on Real Estate | 87 |
| Note to Schedule IV – Mortgage Loans on Real Estate | 87 |
REPORT OF INDEPENDENT REGISTERED PUBLIC ACCOUNTING FIRM
THE BOARD OF DIRECTORS AND SHAREHOLDERS
PARKWAY PROPERTIES, INC.:
We have audited the accompanying consolidated balance sheets of Parkway Properties, Inc. and subsidiaries as of December 31, 2010 and 2009, and the related consolidated statements of operations, changes in equity, and cash flows for each of the years in the three-year period ended December 31, 2010. In connection with our audits of the consolidated financial statements, we also have audited financial statement schedules II, III and IV. These consolidated financial statements and financial statement schedules are the responsibility of the Company’s management. Our responsibility is to express an opinion on these consolidated financial statements and financial statement schedules based on our audits.
We conducted our audits in accordance with the standards of the Public Company Accounting Oversight Board (United States). Those standards require that we plan and perform the audit to obtain reasonable assurance about whether the financial statements are free of material misstatement. An audit includes examining, on a test basis, evidence supporting the amounts and disclosures in the financial statements. An audit also includes assessing the accounting principles used and significant estimates made by management, as well as evaluating the overall financial statement presentation. We believe that our audits provide a reasonable basis for our opinion.
In our opinion, the consolidated financial statements referred to above present fairly, in all material respects, the financial position of Parkway Properties, Inc. and subsidiaries as of December 31, 2010 and 2009, and the results of their operations and their cash flows for each of the years in the three-year period ended December 31, 2010, in conformity with U.S. generally accepted accounting principles. Also, in our opinion, the related financial statement schedules, when considered in relation to the basic consolidated financial statements taken as a whole, present fairly, in all material respects, the information set forth therein.
We also have audited, in accordance with the standards of the Public Company Accounting Oversight Board (United States), Parkway Properties, Inc.’s internal control over financial reporting as of December 31, 2010, based on the criteria established in Internal Control – Integrated Framework issued by the Committee of Sponsoring Organizations of the Treadway Commission (COSO), and our report dated March 4, 2011, expressed an unqualified opinion on the effectiveness of the Company’s internal control over financial reporting.
/s/ KPMG LLP
Jackson, Mississippi
March 4, 2011
PARKWAY PROPERTIES, INC.
CONSOLIDATED BALANCE SHEETS
(In thousands, except share and per share data)
| |
| | December 31 | | December 31 |
| | 2010 | | 2009 |
| Assets | | | |
| Real estate related investments: | | | |
| Office and parking properties | $ | 1,755,310 | | $ | 1,738,040 |
| Land held for development | 609 | | 609 |
| Accumulated depreciation | (366,152) | | (336,759) |
| | 1,389,767 | | 1,401,890 |
| | | | |
| Land available for sale | 750 | | 750 |
| Mortgage loans | 10,336 | | 8,126 |
| Investment in unconsolidated joint ventures | 2,892 | | 2,512 |
| | 1,403,745 | | 1,413,278 |
| | | | |
| Rents receivable and other assets | 129,638 | | 116,437 |
| Intangible assets, net | 50,629 | | 61,734 |
| Cash and cash equivalents | 19,670 | | 20,697 |
| | $ | 1,603,682 | | $ | 1,612,146 |
| | | | |
| Liabilities | | | |
| Notes payable to banks | $ | 110,839 | | $ | 100,000 |
| Mortgage notes payable | 773,535 | | 852,700 |
| Accounts payable and other liabilities | 98,818 | | 88,614 |
| | 983,192 | | 1,041,314 |
| | | | |
| Equity | | | |
| Parkway Properties, Inc. shareholders’ equity | | | |
| 8.00% Series D Preferred stock, $.001 par value, | | | |
| 4,374,896 and 2,400,000 shares authorized, issued and | | | |
| outstanding in 2010 and 2009, respectively | 102,787 | | 57,976 |
| Common stock, $.001 par value, 65,625,104 and 67,600,000 | | | |
| shares authorized in 2010 and 2009, respectively, 21,923,610 | | | |
| and 21,624,228 shares issued and outstanding in 2010 and | | | |
| 2009, respectively | 22 | | 22 |
| Common stock held in trust, at cost, 58,134 and 71,255 | | | |
| shares in 2010 and 2009, respectively | (1,896) | | (2,399) |
| Additional paid-in capital | 516,167 | | 515,398 |
| Accumulated other comprehensive loss | (3,003) | | (4,892) |
| Accumulated deficit | (127,575) | | (111,960) |
| Total Parkway Properties, Inc. stockholders’ equity | 486,502 | | 454,145 |
| Noncontrolling interest – real estate partnerships | 133,988 | | 116,687 |
| Total equity | 620,490 | | 570,832 |
| | $ | 1,603,682 | | $ | 1,612,146 |
See notes to consolidated financial statements.
PARKWAY PROPERTIES, INC.
CONSOLIDATED STATEMENTS OF OPERATIONS
(In thousands, except per share data)
| | Year Ended December 31 |
| | 2010 | | 2009 | | 2008 |
| Revenues | | | | | |
| Income from office and parking properties | $ | 254,611 | | $ | 262,951 | | $ | 260,229 |
| Management company income | 1,652 | | 1,870 | | 1,936 |
| Total revenues | 256,263 | | 264,821 | | 262,165 |
| | | | | | |
| Expenses | | | | | |
| Property operating expenses | 117,935 | | 126,343 | | 124,409 |
| Depreciation and amortization | 92,190 | | 92,126 | | 91,224 |
| Impairment loss on real estate | 4,120 | | - | | 2,542 |
| Management company expenses | 3,961 | | 2,299 | | 1,947 |
| General and administrative | 7,382 | | 6,108 | | 9,725 |
| Total expenses | 225,588 | | 226,876 | | 229,847 |
| | | | | | |
| Operating income | 30,675 | | 37,945 | | 32,318 |
| | | | | | |
| Other income and expenses | | | | | |
| Interest and other income | 1,487 | | 1,609 | | 1,332 |
| Equity in earnings of unconsolidated joint ventures | 326 | | 445 | | 894 |
Other-than-temporary impairment loss on investment in unconsolidated joint ventures | - | | (8,817) | | - |
| Gain on involuntary conversion | 40 | | 823 | | - |
| Gain on sale of real estate | - | | 470 | | - |
| Interest expense | (54,647) | | (55,044) | | (58,766) |
| | | | | | |
| Loss from continuing operations | (22,119) | | (22,569) | | (24,222) |
| Discontinued operations: | | | | | |
| Income (loss) from discontinued operations | 194 | | 404 | | (461) |
Gain on sale of real estate from discontinued operations | 8,518 | | - | | 22,588 |
| Total discontinued operations | 8,712 | | 404 | | 22,127 |
| | | | | | |
| Net loss | (13,407) | | (22,165) | | (2,095) |
| Net loss attributable to noncontrolling interest – real estate partnerships | 10,789 | | 10,562 | | 11,369 |
| | | | | | |
| Net income (loss) for Parkway Properties, Inc. | (2,618) | | (11,603) | | 9,274 |
| Dividends on preferred stock | (6,325) | | (4,800) | | (4,800) |
| Net income (loss) attributable to common stockholders | $ | (8,943) | | $ | (16,403) | | $ | 4,474 |
| | | | | | |
| Net income (loss) per common share attributable to Parkway Properties, Inc.: | | | | | |
| Basic: | | | | | |
| Loss from continuing operations attributable to Parkway Properties, Inc. | $ | (0.82) | | $ | (0.87) | | $ | (1.17) |
| Discontinued operations | 0.40 | | 0.02 | | 1.47 |
| Basic net income (loss) attributable to Parkway Properties, Inc. | $ | (0.42) | | $ | (0.85) | | $ | 0.30 |
| | | | | | |
| Diluted: | | | | | |
| Loss from continuing operations attributable to Parkway Properties, Inc. | $ | (0.82) | | $ | (0.87) | | $ | (1.17) |
| Discontinued operations | 0.40 | | 0.02 | | 1.47 |
| Diluted net income (loss) attributable to Parkway Properties, Inc. | $ | (0.42) | | $ | (0.85) | | $ | 0.30 |
Weighted average shares outstanding: | | | | | |
| Basic | 21,421 | | 19,304 | | 15,023 |
| Diluted | 21,421 | | 19,304 | | 15,023 |
See notes to consolidated financial statements.
PARKWAY PROPERTIES, INC.
CONSOLIDATED STATEMENTS OF CHANGES IN EQUITY
(In thousands, except share and per share data)
| | Parkway Properties, Inc. Shareholders | | | | |
| | | | | | | | | | Accumulated | | | | | Noncontrolling | | |
| | | | | | Common | | Additional | | Other | | | | | Interest – | | |
| | Preferred | | Common | | Stock Held | | Paid-In | | Comprehensive | | Accumulated | | | Real Estate | | Total |
| | Stock | | Stock | | in Trust | | Capital | | Loss | | Deficit | | | Partnerships | | Equity |
| Balance at December 31, 2007 | $ | 57,976 | | $ | 15 | | $ | (3,540) | | $ | 425,221 | | $ | (358) | | $ | (39,406) | | | $ | 80,506 | | $ | 520,414 |
| Comprehensive loss | | | | | | | | | | | | | | | | |
| Net income (loss) | - | | - | | - | | - | | - | | 9,274 | | | (11,369) | | (2,095) |
| Change in fair value of interest rate swaps | - | | - | | - | | - | | (7,370) | | - | | | - | | (7,370) |
| Total comprehensive loss | - | | - | | - | | - | | - | | - | | | - | | (9,465) |
| Common dividends declared - $2.275 per share | - | | - | | - | | - | | - | | (34,555) | | | - | | (34,555) |
| Preferred dividends declared - $2.00 per share | - | | - | | - | | - | | - | | (4,800) | | | - | | (4,800) |
| Share-based compensation | - | | - | | - | | 2,276 | | - | | - | | | - | | 2,276 |
| Stock options and warrants exercised – 25,436 shares | - | | - | | - | | 792 | | - | | - | | | - | | 792 |
| 3,600 shares issued in lieu of Directors’ fees | - | | - | | - | | 140 | | - | | - | | | - | | 140 |
| Issuance costs from shelf registration | - | | - | | - | | (52) | | - | | - | | �� | - | | (52) |
| Purchase of Company stock – 447 shares withheld to | | | | | | | | | | | | | | | | |
| satisfy tax withholding obligation in connection with | | | | | | | | | | | | | | | | |
| the vesting of deferred incentive share units | - | | - | | - | | (10) | | - | | - | | | - | | (10) |
| Distribution of 21,000 shares of common stock, deferred | | | | | | | | | | | | | | | | |
| compensation plan | - | | - | | 715 | | - | | - | | - | | | - | | 715 |
| Contribution of 1,800 shares of common stock, deferred | | | | | | | | | | | | | | | | |
| compensation plan | - | | - | | (70) | | - | | - | | - | | | - | | (70) |
| Contribution of capital by noncontrolling interests | - | | - | | - | | - | | - | | - | | | 60,596 | | 60,596 |
| Distribution of capital to noncontrolling interests | - | | - | | - | | - | | - | | - | | | (2,541) | | (2,541) |
| Balance at December 31, 2008 | 57,976 | | 15 | | (2,895) | | 428,367 | | (7,728) | | (69,487) | | | 127,192 | | 533,440 |
| Comprehensive loss | | | | | | | | | | | | | | | | |
| Net loss | - | | - | | - | | - | | - | | (11,603) | | | (10,562) | | (22,165) |
| Change in fair value of interest rate swaps | - | | - | | - | | - | | 2,836 | | - | | | - | | 2,836 |
| Total comprehensive loss | - | | - | | - | | - | | - | | - | | | - | | (19,329) |
| Common dividends declared - $1.30 per share | - | | - | | - | | - | | - | | (26,070) | | | - | | (26,070) |
| Preferred dividends declared - $2.00 per share | - | | - | | - | | - | | - | | (4,800) | | | - | | (4,800) |
| Share-based compensation | - | | - | | - | | 2,581 | | - | | - | | | - | | 2,581 |
| Stock offering – 6,250,000 shares of common stock | - | | 7 | | - | | 84,450 | | - | | - | | | - | | 84,457 |
| 3,921 shares issued in lieu of Directors’ fees | - | | - | | - | | 58 | | - | | - | | | - | | 58 |
| Purchase of Company stock – 3,594 and 860 shares | | | | | | | | | | | | | | | | |
| withheld to satisfy tax withholding obligation in | | | | | | | | | | | | | | | | |
| connection with vesting of restricted stock and | | | | | | | | | | | | | | | | |
| deferred incentive share units, respectively | - | | - | | - | | (58) | | - | | - | | | - | | (58) |
| Distribution of 15,125 shares of common stock, deferred | | | | | | | | | | | | | | | | |
| compensation plan | - | | - | | 511 | | - | | - | | - | | | - | | 511 |
| Contribution of 1,080 shares of common stock, deferred | | | | | | | | | | | | | | | | |
| compensation plan | - | | - | | (15) | | - | | - | | - | | | - | | (15) |
| Contribution of capital by noncontrolling interests | - | | - | | - | | - | | - | | - | | | 57 | | 57 |
| Balance at December 31, 2009 | 57,976 | | 22 | | (2,399) | | 515,398 | | (4,892) | | (111,960) | | | 116,687 | | 570,832 |
Comprehensive loss Net loss | - | | - | | - | | - | | - | | (2,618) | | | (10,789) | | (13,407) |
| Change in fair value of interest rate swaps | - | | - | | - | | - | | 1,889 | | - | | | - | | 1,889 |
| Total comprehensive loss | - | | - | | - | | - | | - | | - | | | - | | (11,518) |
| Common dividends declared - $0.30 per share | - | | - | | - | | - | | - | | (6,494) | | | - | | (6,494) |
| Preferred dividends declared - $2.00 per share | - | | - | | - | | - | | - | | (6,325) | | | - | | (6,325) |
| Share-based compensation | - | | - | | - | | 1,319 | | - | | - | | | - | | 1,319 |
| Issuance of 1,974,896 shares of 8.0% Series D Preferred | 44,811 | | - | | - | | - | | - | | - | | | - | | 44,811 |
| 15,214 shares issued in lieu of Directors’ Fees | - | | - | | - | | 285 | | - | | - | | | - | | 285 |
| Issuance costs for shelf registration | - | | - | | - | | (14) | | - | | - | | | - | | (14) |
Purchase of Company stock – 42,618 and 1,465 shares withheld to satisfy tax withholding obligation in connection with the vesting of restricted stock and deferred incentive units, respectively | - | | - | | - | | (821) | | - | | - | | | - | | (821) |
Distribution of 17,125 shares of common stock from deferred compensation plan | - | | - | | 578 | | - | | - | | - | | | - | | 578 |
Contribution of 4,004 shares of common stock to deferred compensation plan | - | | - | | (75) | | - | | - | | - | | | - | | (75) |
| Contribution of capital by noncontrolling interests | - | | - | | - | | - | | - | | - | | | 27,912 | | 27,912 |
Purchase of noncontrolling interest’s share in Parkway Moore, LLC | - | | - | | - | | - | | - | | (178) | | | 178 | | - |
| | | | | | | | | | | | | | | | | |
| Balance at December 31, 2010 | $ | 102,787 | | $ | 22 | | $ | (1,896) | | $ | 516,167 | | $ | (3,003) | | $ | (127,575) | | | $ | 133,988 | | $ | 620,490 |
See notes to consolidated financial statements.
PARKWAY PROPERTIES, INC.
CONSOLIDATED STATEMENTS OF CASH FLOWS
(In thousands)
| | Year Ended December 31 |
| | 2010 | | 2009 | | 2008 |
| Operating activities | | | | | |
| Net loss | $ | (13,407) | | $ | (22,165) | | $ | (2,095) |
| Adjustments to reconcile net loss to cash | | | | | |
| provided by operating activities: | | | | | |
| Depreciation and amortization | 92,190 | | 92,126 | | 91,224 |
| Depreciation and amortization – discontinued operations | 121 | | 600 | | 2,365 |
| Amortization of (below) above market leases | (566) | | 51 | | 45 |
| Amortization of loan costs | 1,713 | | 2,319 | | 1,825 |
| Amortization of mortgage loan discount | (710) | | (607) | | (518) |
| Share-based compensation expense | 1,319 | | 2,581 | | 2,276 |
| Operating distributions from unconsolidated | | | | | |
| joint ventures | - | | 392 | | 1,042 |
Net (gain) loss on real estate investments and involuntary conversion | (4,438) | | 7,524 | | (20,046) |
| Equity in earnings of unconsolidated joint ventures | (326) | | (445) | | (894) |
| Increase in deferred leasing costs | (13,425) | | (16,348) | | (8,738) |
| Changes in operating assets and liabilities: | | | | | |
| Change in receivables and other assets | (4,194) | | 3,678 | | (1,474) |
| Change in accounts payable and other liabilities | 9,782 | | 228 | | (2,164) |
| | | | | | |
| Cash provided by operating activities | 68,059 | | 69,934 | | 62,848 |
| | | | | | |
| Investing activities | | | | | |
| Distributions from unconsolidated joint ventures | - | | - | | 38 |
| (Investment in) reimbursements from real estate related investments | (36,498) | | 1,033 | | (229,707) |
| Proceeds from sale of real estate | 4,758 | | 15,542 | | 84,464 |
| Proceeds from property insurance settlement | - | | 1,984 | | 1,200 |
| Real estate development | - | | (5,329) | | (28,981) |
| Improvements to real estate related investments | (36,335) | | (28,420) | | (31,916) |
| | | | | | |
| Cash used in investing activities | (68,075) | | (15,190) | | (204,902) |
| | | | | | |
| Financing activities | �� | | | | |
| Principal payments on mortgage notes payable | (140,499) | | (35,381) | | (76,620) |
| Proceeds from long-term financing | 70,000 | | 18,500 | | 231,700 |
| Proceeds from bank borrowings | 143,750 | | 35,742 | | 189,452 |
| Payments on bank borrowings | (132,911) | | (121,682) | | (215,861) |
| Debt financing costs | (1,004) | | (406) | | (2,183) |
| Stock options exercised | - | | - | | 792 |
| Purchase of Company stock | (821) | | (58) | | (10) |
| Dividends paid on common stock | (6,448) | | (25,794) | | (34,410) |
| Dividends paid on preferred stock | (5,787) | | (4,800) | | (4,800) |
| Contributions from noncontrolling interest partners | 27,912 | | 57 | | 60,593 |
| Distributions from noncontrolling interest partners | - | | - | | (2,541) |
| Proceeds (issuance costs) from stock offering | 44,797 | | 84,457 | | (52) |
| | | | | | |
| Cash provided by (used in) financing activities | (1,011) | | (49,365) | | 146,060 |
| | | | | | |
Change in cash and cash equivalents | (1,027) | | 5,379 | | 4,006 |
| | | | | | |
| Cash and cash equivalents at beginning of year | 20,697 | | 15,318 | | 11,312 |
| | | | | | |
| Cash and cash equivalents at end of year | $ | 19,670 | | $ | 20,697 | | $ | 15,318 |
See notes to consolidated financial statements.
NOTES TO CONSOLIDATED FINANCIAL STATEMENTS
December 31, 2010
NOTE A - Summary of Significant Accounting Policies
Basis of Presentation and Principles of Consolidation
The accompanying financial statements are prepared following U.S. generally accepted accounting principles (“GAAP”) and the requirements of the Securities and Exchange Commission (“SEC”).
The consolidated financial statements include the accounts of Parkway Properties, Inc. ("Parkway" or "the Company"), its wholly-owned subsidiaries and joint ventures in which the Company has a controlling interest. The other partners’ equity interests in the consolidated joint ventures are reflected as noncontrolling interests in the consolidated financial statements. Parkway also consolidates subsidiaries where the entity is a variable interest entity (“VIE”) and Parkway is the primary beneficiary and has the power to direct the activities of the VIE and the obligation to absorb losses of the VIE that could potentially be significant to the VIE or the right to receive benefits from the VIE that could potentially be significant to the VIE. At December 31, 2010 and 2009, Parkway did not have any VIEs that required consolidation. All significant intercompany transactions and accounts have been eliminated in the accompanying financial statements.
The Company also consolidates certain joint ventures where the Company is the sole general partner and the limited partners do not possess kick-out rights or other substantive participating rights. The equity method of accounting is used for those joint ventures that do not meet the criteria for consolidation and where Parkway exercises significant influence but does not control these joint ventures.
Business
The Company's operations are exclusively in the real estate industry, principally the operation, leasing, acquisition and ownership of office buildings.
Use of Estimates
The preparation of financial statements in conformity with GAAP requires management to make estimates and assumptions that affect the reported amounts of assets and liabilities, the disclosure of contingent assets and liabilities at the date of the financial statements and the reported amounts of revenues and expenses during the reporting period. Although the Company believes the assumptions and estimates made are reasonable and appropriate, as discussed in the applicable sections throughout these consolidated financial statements, different assumptions and estimates could materially impact reported results. The current economic environment has increased the degree of uncertainty inherent in these estimates and assumptions, therefore, changes in market conditions could impact the Company’s future operating results. The Company’s most significant estimates relate to impairments on real estate, purchase price allocations and allowance for doubtful accounts.
Real Estate Properties
Real estate properties are carried at cost less accumulated depreciation. Cost includes the carrying amount of the Company's investment plus any additional consideration paid, liabilities assumed, and improvements made subsequent to acquisition. Depreciation of buildings and building improvements is computed using the straight-line method over the estimated useful lives of the assets. Depreciation of tenant improvements, including personal property, is computed using the straight-line method over the lesser of useful life or the term of the lease involved. Maintenance and repair expenses are charged to expense as incurred.
Balances of major classes of depreciable assets (in thousands) and their respective estimated useful lives are:
| | | | | December 31 | | December 31 |
| Asset Category | | Estimated Useful Life | | 2010 | | 2009 |
| Land | | Non-depreciable | | $ | 176,614 | | $ | 170,106 |
| Buildings and garages | | 40 years | | 1,278,275 | | 1,280,779 |
| Building improvements | | 7 to 40 years | | 121,540 | | 116,471 |
| Tenant improvements | | Lesser of useful life or term of lease | | 178,881 | | 170,684 |
| | | | | $ | 1,755,310 | | $ | 1,738,040 |
Depreciation expense related to these assets of $67.4 million, $67.6 million, and $67.3 million was recognized in 2010, 2009 and 2008, respectively.
The Company evaluates its real estate assets upon occurrence of significant adverse changes in its operations to assess whether any impairment indicators are present that affect the recovery of the carrying amount. The carrying amount includes the net book value of tangible and intangible assets. Real estate assets are classified as held for sale or held and used. Parkway records assets held for sale at the lower of carrying amount or fair value less cost to sell. With respect to assets classified as held and used, Parkway recognizes an impairment loss to the extent the carrying amount is not recoverable and exceeds the sum of undiscounted future cash flows expected to result from the use and eventual disposition of the asset. The cash flow and fair value estimates are based on assumptions about employing the asset for its remaining useful life. Factors considered in projecting future cash flows include but are not limited to: existing leases, future leasing and terminations, market rental rates, capital improvements, tenant improvements, leasing commissions, inflation and other known variables. This market information is considered a Level 3 input as defined by ASC 820, “Fair Value Measurements and Disclosures,” (“ASC 820”). Upon impairment, Parkway recognizes an impairment loss to reduce the carrying value of the real estate asset to the estimate of its fair value.
The Company recognizes gains from sales of real estate upon the realization at closing of the transfer of rights of ownership to the purchaser, receipt from the purchaser of an adequate cash down payment and adequate continuing investment by the purchaser.
The company classifies certain assets as held for sale based on management having the authority and intent of entering into commitments for sale transactions to close in the next twelve months. The Company considers an office property as held for sale once we have executed a contract for sale, allowed the buyer to complete its due diligence review and received a substantial non-refundable deposit. Until a buyer has completed its due diligence review of the asset, necessary approvals have been received and substantive conditions to the buyer’s obligation to perform have been satisfied, the Company does not consider a sale to be probable. When the Company identifies an asset as held for sale, it estimates the net realizable value of such asset and discontinues recording depreciation on the asset. The Company records assets held for sale at the lower of carrying amount or fair value less cost to sell.
Land available for sale (see Note E) is carried at cost and is subject to evaluation for impairment.
Purchase Price Allocation
Parkway allocates the purchase price of real estate to tangible and intangible assets and liabilities based on fair values. Tangible assets consist of land, building, garage, building improvements and tenant improvements. Intangible assets and liabilities consist of the value of above and below market leases, lease costs, the value of in-place leases, customer relationships and any value attributable to above or below market debt assumed with the acquisition.
The Company may engage independent third-party appraisers to perform the valuations used to determine the fair value of these identifiable tangible and intangible assets. These valuations and appraisals use commonly employed valuation techniques, such as discounted cash flow analyses. Factors considered in these analyses include an estimate of carrying costs during hypothetical expected lease-up periods considering current market conditions, and costs to execute similar leases. Parkway also considers information obtained about each property as a result of its pre-acquisition due diligence, marketing and leasing activities in estimating the fair value of the tangible and intangible assets acquired. In estimating carrying costs, the Company includes real estate taxes, insurance and other operating expenses and estimates of lost rentals at market rates during the expected lease-up periods depending on specific local market conditions and depending on the type of property acquired. Additionally, Parkway estimates costs to execute similar leases including leasing commissions, legal and other related expenses to the extent that such costs are not already incurred in connection with a new lease origination as part of the transaction.
The fair value of above or below market in-place lease values is the present value of the difference between the contractual amount to be paid pursuant to the in-place lease and the estimated current market lease rate expected over the remaining non-cancelable life of the lease. The capitalized above market lease values are amortized as a reduction of rental income over the remaining term of the respective leases. The capitalized below market lease values are amortized as an increase to rental income over the remaining term of the respective leases. Total amortization for above and below market leases was a net increase of rental income of $566,000 for the year ended December 31, 2010, and a net reduction of rental income of $51,000 and $45,000 for the years ended December 31, 2009 and 2008, respectively.
Amortization of above and below market leases is projected as a net increase (decrease) to rental income as follows for the next five years (in thousands):
| | Amount |
| 2011 | $ | 1,058 |
| 2012 | 67 |
| 2013 | (274) |
| 2014 | (139) |
| 2015 | 54 |
The fair value of customer relationships represents the quantifiable benefits related to developing a relationship with the current customer. Examples of these benefits would be growth prospects for developing new business with the existing customer, the ability to attract similar customers to the building, the tenant’s credit quality and expectations of lease renewals (including those existing under the terms of the lease agreement), among other factors. Management believes that there would typically be little value associated with customer relationships that is in excess of the value of the in-place lease and their typical renewal rates. Any value assigned to customer relationships is amortized over the remaining terms of the respective leases plus any expected renewal periods as a lease cost amortization expense. Currently, the Company has no value assigned to customer relationships.
The fair value of at market in-place leases is the present value associated with re-leasing the in-place lease as if the property was vacant. Factors to be considered include estimates of carrying costs during hypothetical expected lease-up periods considering current market conditions and costs to execute similar leases. In estimating carrying costs, the Company includes real estate taxes, insurance and other operating expenses and estimates of lost rentals at market rates during the expected lease-up periods. The value of at market in-place leases is amortized as a lease cost amortization expense over the expected life of the lease. Total amortization expense for the value of in-place leases was $14.2 million, $14.0 million and $15.0 million for the years ended December 31, 2010, 2009 and 2008, respectively.
Amortization expense for the value of in-place leases is projected as follows for the next five years (in thousands):
| | Amount |
| 2011 | $ | 10,131 |
| 2012 | 6,564 |
| 2013 | 5,134 |
| 2014 | 3,987 |
| 2015 | 3,120 |
A separate component of the fair value of in-place leases is identified for the lease costs. The fair value of lease costs represents the estimated commissions and legal fees paid in connection with the current leases in place. Lease costs are amortized over the non-cancelable terms of the respective leases as lease cost amortization expense.
In no event does the amortization period for intangible assets exceed the remaining depreciable life of the building. Should a customer terminate its lease, the unamortized portion of the tenant improvement, in-place lease value, lease cost and customer relationship intangibles would be charged to expense. Additionally, the unamortized portion of above market in-place leases would be recorded as a reduction to rental income and the below market in-place lease value would be recorded as an increase to rental income.
Mortgage Loans Receivable
Parkway records its mortgage loans receivable at the stated principal amount net any premium or discount. At December 31, 2010 and 2009, the carrying amount of mortgage loans receivable was $10.3 million and $8.1 million, respectively. The Company recognizes the premium or discount over the life of the mortgage loan using the effective interest method. Parkway evaluates the collectability of principal and interest on its mortgage loans, if circumstances warrant, to determine whether it is impaired. A loan is impaired when based on current information and events, it is probable that the Company will be unable to collect all amounts due according to the existing contractual terms. When a loan is impaired, the amount of the loss provision is calculated by comparing the recorded investment to the value determined by discounting the expected future cash flow at the loan’s effective
interest rate. No impairment loss has been recognized in 2010 and 2009 in connection with the mortgage loans receivable.
Investment in Unconsolidated Joint Ventures
At December 31, 2010 and 2009, Parkway had a non-controlling interest in three and four unconsolidated joint ventures, respectively, which are accounted for using the equity method of accounting. Therefore, Parkway reports its share of income and losses based on its economic interest in these entities, as measured by its ownership interest or expected cash distributions if materially different than distributions based on ownership interest. Parkway classifies its interests as investments in unconsolidated joint ventures when it holds less than a majority voting interest in the entity and does not have control, based on the terms of the joint venture agreements, to make decisions about the entities’ significant activities such as major leases, encumbering the entities with debt, major capital expenditures and whether to dispose of the entities.
When circumstances indicate there may have been a loss in value of an equity investment, the Company evaluates the investment for impairment by estimating its ability to recover its investment from future cash flows. If Parkway determines the loss in value is other than temporary, the Company recognizes an impairment charge to reflect the investment at fair value. The use of projected future cash flows and other estimates of fair value, the determination of when a loss is other than temporary, and the calculation of the amount of the loss are complex and subjective. Use of other estimates and assumptions may result in different conclusions. Changes in economic and operating conditions that occur subsequent to the Company’s review could impact these assumptions and result in future impairment charges of our equity investments.
During the fourth quarter of 2009, Parkway recorded non-cash other-than-temporary impairment losses totaling $8.8 million in connection with the valuation of two investments in unconsolidated joint ventures, RubiconPark I, LLC and RubiconPark II, LLC. The impairment is principally due to two customers totaling over 120,000 square feet in the office properties that were unable to meet their rent obligations due to financial difficulty. Additionally, in January 2010, the Company’s joint venture partner, Rubicon U.S. REIT, filed for Chapter 11 bankruptcy protection, rendering our partner unable to support their continuing share of the joint venture obligations. During the third quarter of 2010, the Company purchased the first mortgage loan associated with this joint venture for a net purchase price of $33.0 million. During the fourth quarter of 2010, the Company, as holder of the mortgage, foreclosed on the three properties, which served as collateral for the associated loan and sold the properties to Parkway Properties Office Fund II, LP (“Fund II”). As a result of the sale to Fund II, Parkway’s ownership in these assets increased from 20% to 30%.
Allowance for Doubtful Accounts
Accounts receivable are reduced by an allowance for amounts that the Company estimates to be uncollectible. The receivable balance is comprised primarily of rent and expense reimbursement income due from the customers. Management evaluates the adequacy of the allowance for doubtful accounts considering such factors as the credit quality of our customers, delinquency of payment, historical trends and current economic conditions. The Company provides an allowance for doubtful accounts for customer balances that are over 90 days past due and for specific customer receivables for which collection is considered doubtful.
Cash Equivalents
The Company considers all highly liquid investments with a maturity of three months or less when purchased to be cash equivalents.
Noncontrolling Interest
Noncontrolling Interest – Real Estate Partnerships
At December 31, 2010 and 2009, the Company has an interest in two joint ventures whose operations are included in its consolidated financial statements. The Company owns a 25% and 30% interest in Parkway Properties Office Fund, LP (“Fund I”) and Fund II, respectively.
Parkway serves as the general partner of Fund I and provides asset management, property management, leasing and construction management services to the fund, for which it is paid market-based fees. Cash distributions from the fund are made to each joint venture partner based on their percentage of ownership in the fund. Since Parkway is the sole general partner and has the authority to make major decisions on behalf of the fund, Parkway is considered to have a controlling interest. Accordingly, Parkway is required to consolidate the fund in its consolidated financial statements. At February 15, 2008, Fund I was fully invested.
On May 14, 2008, Parkway formed Fund II, a $750.0 million discretionary fund with the Teacher Retirement System of Texas (“TRST”), for the purpose of acquiring high-quality multi-tenant office properties. TRST is a 70% investor, and Parkway is a 30% investor in the fund, which will be capitalized with approximately $375.0 million of equity capital and $375.0 million of non-recourse, fixed-rate first mortgage debt. Parkway’s share of the equity contribution for the fund is $112.5 million. The Company intends to fund its share of equity contributions with proceeds from asset sales, line of credit advances and/or sales of equity securities. The fund targets investments in office buildings in Houston, Austin, San Antonio, Chicago, Atlanta, Phoenix, Charlotte, Memphis, Nashville, Jacksonville, Orlando, Tampa/St. Petersburg, Ft. Lauderdale, as well as other growth markets to be determined at Parkway’s discretion.
Parkway serves as the general partner of Fund II and provides asset management, property management, leasing and construction management services for the fund, for which it will be paid market-based fees. Cash distributions from the fund will be made to each joint venture partner based on the percentage of ownership in the fund. Since Parkway is the sole general partner and has the authority to make major decisions on behalf of the fund, Parkway is considered to have a controlling interest. Accordingly, Parkway is required to consolidate the fund in its consolidated financial statements. At December 31, 2010, Fund II includes investments in three office properties totaling $33.0 million. In January 2011, Fund II purchased an investment in an office property totaling $160.0 million, which places total Fund II investments to date at $193.0 million. There is approximately $552.1 million in remaining capacity for Fund II investments.
Parkway Moore, LLC and Moore Building Associates, LP (“MBALP”) were established for the purpose of owning a commercial office building (the Toyota Center in Memphis, Tennessee), with Parkway serving as general partner. The entities were previously classified as consolidated joint ventures. However, during the third quarter of 2010, Parkway purchased the partner’s 25% interest, thereby placing Parkway’s ownership at 100% and removing the classification as a consolidated joint venture.
Non-controlling interest in real estate partnerships represents the other partners’ proportionate share of equity in the partnerships discussed above at December 31, 2010. Income is allocated to non-controlling interest based on the weighted average percentage ownership during the year.
Revenue Recognition
Revenue from real estate rentals is recognized on a straight-line basis over the terms of the respective leases. The cumulative difference between lease revenue recognized under this method and contractual lease payment terms is recorded as straight-line rent receivable on the accompanying balance sheets. The straight-line rent adjustment increased revenue by $4.2 million, $6.6 million and $3.9 million in 2010, 2009 and 2008, respectively.
When the Company is the owner of the tenant improvements, the leased space is ready for its intended use when the tenant improvements are substantially completed. In limited instances, when the tenant is the owner of the tenant improvements, straight-line rent is recognized when the tenant takes possession of the unimproved space.
The leases also typically provide for tenant reimbursement of a portion of common area maintenance and other operating expenses. Property operating cost recoveries from customers (“expense reimbursements”) are recognized
as revenue in the period in which the expenses are incurred. The computation of expense reimbursements is dependent on the provisions of individual customer leases. Most customers make monthly fixed payments of estimated expense reimbursements. The Company makes adjustments, positive or negative, to expense reimbursement income quarterly to adjust the recorded amounts to the Company’s best estimate of the final property operating costs based on the most recent quarterly budget. After the end of the calendar year, the Company computes each customer’s final expense reimbursements and issues a bill or credit for the difference between the actual amount and the amounts billed monthly during the year.
Management company income represents market-based fees earned from providing management, construction, leasing, brokerage and acquisition services to third parties. Management fee income is computed and recorded monthly in accordance with the terms set forth in the stand alone management service agreements. Leasing and brokerage commissions are recognized pursuant to the terms of the stand alone agreements at the time underlying leases are signed, which is the point at which the earnings process is complete and collection of the fees is reasonably assured. Fees relating to the purchase or sale of property are recognized when the earnings process is complete and collection of the fees is reasonably assured, which usually occurs at closing. All fees on Company-owned properties and consolidated joint ventures are eliminated in consolidation. The Company recognizes its share of fees earned from unconsolidated joint ventures in management company income.
Amortization
Debt origination costs are deferred and amortized using a method that approximates the effective interest method over the term of the loan. Leasing costs are deferred and amortized using the straight-line method over the term of the respective lease.
Early Extinguishment of Debt
When outstanding debt is extinguished, the Company records any prepayment premium and unamortized loan costs to interest expense.
Derivative Financial Instruments
The Company recognizes all derivative instruments on the balance sheet at their fair value. Changes in the fair value of derivatives are recorded each period in current earnings or other comprehensive income (loss), depending on whether a derivative is designated as part of a hedge transaction and, if it is, the type of hedge transaction. The ineffective portion of the hedge, if any, is immediately recognized in earnings.
Share-Based and Long-Term Compensation
Effective May 1, 2010, the stockholders of the Company approved Parkway’s 2010 Omnibus Equity Incentive Plan (the “2010 Equity Plan”) that authorized the grant of up to 600,000 equity based awards to employees and directors of the Company. The 2010 Equity Plan replaces the Company’s 2003 Equity Incentive Plan and the 2001 Non-Employee Directors Equity Compensation Plan. At present, it is Parkway’s intention to grant restricted shares and/or deferred incentive share units instead of stock options although the 2010 Equity Plan authorizes various forms of incentive awards, including options. The 2010 Equity Plan has a ten-year term.
Compensation expense, including estimated forfeitures, for service-based awards is recognized over the expected vesting period. The total compensation expense for the long-term equity incentive awards granted under the FOCUS Plan is based upon the fair value of the shares on the grant date, adjusted for estimated forfeitures. Time-based restricted shares and deferred incentive share units are valued based on the New York Stock Exchange closing market price of Parkway common shares (NYSE ticker symbol, PKY) as of the date of grant. The grant date fair value for awards that are subject to market conditions is determined using a simulation pricing model developed to specifically accommodate the unique features of the awards.
Restricted shares and deferred incentive share units are forfeited if an employee leaves the Company before the vesting date except in the case of the employee’s death or permanent disability or upon termination following a change of control. Shares and/or units that are forfeited become available for future grant under the 2010 Equity Plan.
The FOCUS Plan also includes a long-term cash incentive that was designed to reward significant outperformance over the three year period which began July 1, 2010. The total compensation expense for the long-term cash incentive awards granted under the FOCUS Plan is based upon the estimated fair value of the award on the grant date and adjusted as necessary each reporting period. The long-term cash incentive awards are accounted for as a liability-classified award on the Company’s 2010 consolidated balance sheet. The grant date and quarterly fair value estimates for awards that are subject to a market condition are determined using a simulation pricing model developed to specifically accommodate the unique features of the awards.
Income Taxes
Effective January 1, 1997, the Company elected to be taxed as a real estate investment trust (“REIT”) under the Internal Revenue Code of 1986, as amended. The Company completed its reorganization into the Umbrella Partnership REIT (“UPREIT”) structure effective January 1, 1998. The Company believes that the UPREIT structure will enable it to pursue additional investment opportunities by having the ability to offer tax-advantaged operating partnership units to property owners in exchange for properties.
A corporate REIT is a legal entity that holds real estate assets, and through distributions to stockholders, is exempt from the payment of Federal income taxes at the corporate level. To maintain qualification as a REIT, the Company is subject to a number of organizational and operational requirements, including a requirement that it currently distribute to stockholders at least 90% of its annual taxable income.
Net Income (Loss) Per Common Share
Basic earnings per share (“EPS”) is computed by dividing income (loss) attributable to common stockholders by the weighted-average number of common shares outstanding for the year. In arriving at net income (loss) attributable to common stockholders, preferred stock dividends are deducted. Diluted EPS reflects the potential dilution that could occur if share equivalents such as employee stock options, restricted shares and deferred incentive share units were exercised or converted into common stock that then shared in the earnings of Parkway.
The computation of diluted EPS is as follows:
| | Year Ended December 31 |
| | 2010 | 2009 | 2008 |
| | (in thousands, except per share data) |
| Numerator: | | | |
| Basic and diluted net income (loss) | | | |
| attributable to common stockholders | $ | (8,943) | $ | (16,403) | $ | 4,474 |
| Denominator: | | | |
| Basic and diluted weighted average shares | 21,421 | 19,304 | 15,023 |
| Diluted net income (loss) per share attributable to | | | |
| Parkway Properties, Inc. | $ | (0.42) | $ | (0.85) | $ | 0.30 |
The computation of diluted EPS for 2010, 2009 and 2008 did not include the effect of employee stock options, deferred incentive share units and restricted shares because their inclusion would have been anti-dilutive.
Reclassifications
Certain reclassifications have been made in the 2009 and 2008 consolidated financial statements to conform to the 2010 classifications with no impact on previously reported net income or equity.
Subsequent Events
The Company has evaluated all subsequent events through the issuance date of the consolidated financial statements.
Recent Accounting Pronouncements
Effective January 1, 2010, the Company adopted Financial Accounting Standards Board (“FASB”) Accounting Standards Update (“ASU”) 2009-16, “Topic 860 – Transfers and Servicing” (“ASU 2009-16”), which amends and
codifies SFAS No. 140, “Accounting for Transfers and Servicing of Financial Assets and Extinguishments of Liabilities,” by: eliminating the concept of a qualifying special-purpose entity (“QSPE”); clarifying and amending the derecognition criteria for a transfer to be accounted for as a sale; amending and clarifying the unit of account eligible for sale accounting; and requiring that a transferor initially measure at fair value and recognize all assets obtained (for example, beneficial interests) and liabilities incurred as a result of a transfer of an entire financial asset or group of financial assets accounted for as a sale. Additionally, on and after the effective date, existing QSPEs (as defined under previous accounting standards) must be evaluated for consolidation by reporting entities in accordance with the applicable consolidation guidance. This standard requires enhanced disclosures about, among other things, a transferor’s continuing involvement with transfers of financial assets accounted for as sales, the risks inherent in the transferred financial assets that have been retained, and the nature and financial effect of restrictions on the transferor’s assets that continue to be reported in the consolidated balance sheets. The application of ASU 2009-16 did not have a material impact on the Company’s overall financial position and results of operations upon adoption.
Effective January 1, 2010, the Company adopted FASB ASU 2009-17, “Topic 810 – Consolidations” (“ASU 2009-17”), which amends and codifies FIN 46(R), “Consolidation of Variable Interest Entities,” and changes the consolidation guidance applicable to a VIE. It also amends the guidance governing the determination of whether an enterprise is the primary beneficiary of a VIE, and is, therefore, required to consolidate an entity, by requiring a qualitative analysis rather than a quantitative analysis. The qualitative analysis will include, among other things, consideration of who has the power to direct the activities of the entity that most significantly impact the entity’s economic performance and who has the obligation to absorb losses or the right to receive benefits of the VIE that could potentially be significant to the VIE. This standard also requires continuous reassessments of whether an enterprise is the primary beneficiary of a VIE. Previously, FIN 46(R) required reconsideration of whether an enterprise was the primary beneficiary of a VIE only when specific events had occurred. QSPEs, which were previously exempt from the application of this standard, are now subject to its provisions. This standard also requires enhanced disclosures about an enterprise’s involvement with a VIE. The application of ASU 2009-17 did not have a material impact on the Company’s overall financial position and results of operations upon adoption as the Company will continue to account for its unconsolidated joint ventures under the equity method of accounting.
In 2009, the FASB issued ASU 2010-06, “Fair Value Measurements and Disclosures (Topic 820): Improving Disclosures About Fair Value Measurements,” which amends certain disclosure requirements of ASC 820. This ASU provides additional disclosures for transfers in and out of Levels 1 and 2 and for activity in Level 3. This ASU also clarifies certain other existing disclosure requirements including level of desegregation and disclosure around inputs and valuation techniques. ASU 2010-06 became effective for interim and annual reporting periods beginning after December 15, 2009, and the Company has adopted the provisions and provided the necessary disclosures for the year ended December 31, 2010.
During the first quarter of 2010, the Company adopted FASB ASU 2010-09, “Topic 855 – Subsequent Events: Amendments to Certain Recognition and Disclosure Requirements” (“ASU 2010-09”), which amends Topic 855 so that SEC filers are no longer required to disclose the date through which subsequent events have been evaluated in originally issued and revised financial statements. The application of FASB ASU 2010-09 did not have a material impact on the Company’s overall financial position and results of operations upon adoption.
In July 2010, the FASB issued ASU 2010-20, “Topic 310 – Disclosures about the Credit Quality of Financing Receivables and the Allowance for Credit Losses”, which significantly expands existing disclosures about the credit quality of financing receivables and their allowance for credit losses. ASU 2010-20 will require disclosures as of the end of a reporting period such as accounting policies for each portfolio segment, ending balances of allowance for credit losses and credit-quality indicators in addition to added disclosures about activity related to financing receivables or credit losses. The period end disclosure requirements of ASU 2010-20 will be effective as of the beginning of interim and annual reporting periods that begin after December 15, 2010. The activity disclosure requirements of ASU 2010-20 will be effective as of the beginning of annual reporting periods that begin after December 15, 2010. The Company is currently evaluating the impact of ASU 2010-20 on the Company’s consolidated financial statements.
Unaudited Statistical Information
The square feet and percentage leased statistics presented in Notes B, D, G and H are unaudited.
Note B - Investment in Office and Parking Properties
Included in investment in office and parking properties at December 31, 2010 are 61 office and parking properties located in ten states with an aggregate of 12.8 million square feet of leasable space. This excludes office properties in unconsolidated joint ventures, which are outlined in Note D – Investment in Unconsolidated Joint Ventures.
The contract purchase price, excluding closing costs and other adjustments, of office properties acquired during the year ended December 31, 2010 is as follows:
| | Cost |
| Market Location | (in thousands) |
| Memphis, Tennessee | $ | 3 |
| Atlanta, Georgia | 8,000 |
| Charlotte, North Carolina | 25,000 |
| | $ | 33,003 |
The Company’s acquisitions are accounted for using the acquisition method. The results of each acquired property are included in the Company’s results of operations from their respective purchase dates.
Summary of Acquisitions
On July 1, 2010, the Company acquired the limited partner’s 25% interest in Parkway Moore, LLC and Moore Building Associates, LP for $2,500. The entities were established for the purpose of owning the Toyota Center, a 175,000 square foot office building in Memphis, Tennessee. Therefore, the Company’s total investment in this property increased to 100%.
During the third quarter of 2010, the Company purchased the first mortgage loan associated with the RubiconPark I joint venture, which owned Falls Pointe, Lakewood II and Carmel Crossing, for a net purchase price of $33.0 million. During the fourth quarter of 2010, the Company, as holder of the mortgage, foreclosed on the three properties that served as collateral for the associated loan. Also, during the fourth quarter of 2010, the Company sold the three assets to Fund II for $33.0 million. Parkway received approximately $23.1 million in cash at closing representing its partner’s 70% prorated share of the investment. Parkway recorded approximately $740,000 in management company expense on the 2010 consolidated statement of operations related to acquisition costs on these investments. Proceeds from the sale were used to reduce amounts outstanding on the credit facility. On February 18, 2011, Fund II obtained a $10.0 million mortgage loan secured by Carmel Crossing. The mortgage loan has a fixed rate of 5.5% and a term of nine years. Parkway received $2.4 million in net proceeds from the loan, which represents its 30% equity investment in the property. The proceeds were used to reduce amounts outstanding under the Company’s credit facility. As a result of the sale to Fund II, Parkway’s ownership interest in these assets increased from 20% to 30%.
The total amount of purchase price allocated to more significant assets, intangible assets and (liabilities) and weighted average amortization period for each class of asset or liability is as follows for 2010 office property acquisitions (in thousands):
| | | | Weighted |
| | Amount | | Average Life |
| Land | $ | 7,248 | | N/A |
| Building | 17,027 | | 40 |
| Tenant improvements | 4,201 | | 5 |
| Lease commissions | 1,253 | | 5 |
| Lease in place value | 4,431 | | 4 |
| Above market leases | 1,188 | | 4 |
| Below market leases | (861) | | 6 |
| Liabilities assumed | (4,396) | | N/A |
On January 21, 2011, the Company and Fund II acquired the office and retail portion of 3344 Peachtree located in the Buckhead submarket of Atlanta for $167.3 million. 3344 Peachtree contains approximately 484,000 square feet of office and retail space and includes an adjacent eleven-story parking structure. Fund II’s investment in the property totaled $160.0 million, with Parkway funding the remaining $7.3 million. Due to Parkway��s additional investment, the Company’s effective ownership in the property is 33.0%. An additional $2.6 million is expected to be spent for closing costs, building improvements, leasing costs and tenant improvements during the first two years of ownership. Simultaneous with closing, Fund II assumed the $89.6 million existing non-recourse first mortgage loan, which matures on October 1, 2017, and carries a fixed interest rate of 4.8%. In accordance with GAAP, the mortgage loan was recorded at $87.2 million to reflect the value of the instrument based on a market interest rate of 5.25% on the date of purchase. Parkway's equity contribution in the investment is $25.5 million and was initially funded through availability under the Company's credit facility. The Company is still in the process of completing the purchase price allocation related to this investment.
On February 4, 2011, the Company purchased its partner’s 50% interest in the Wink-Parkway Partnership (“Wink JV”) for $250,000. The Wink JV was established for the purpose of owning the Wink Building, a 32,000 square foot office property in New Orleans, Louisiana. Upon completing the acquisition of its partner’s interest, Parkway now owns 100% of the Wink Building.
Summary of Dispositions
On April 15, 2010, the Company sold One Park Ten, a 163,000 square foot office building in Houston, Texas, for a gross sales price of $15.7 million. Parkway received net cash proceeds from the sale of $4.8 million, which were used to reduce amounts outstanding under the Company’s credit facility. Parkway recorded a gain on the sale of $8.5 million in 2010. In connection with the sale of One Park Ten, the $8.7 million first mortgage was assumed by the buyer and the company seller-financed a $1.5 million note receivable that bears interest at 7.25% per annum on an interest-only basis through maturity in June 2012. Parkway Realty Services, LLC, a subsidiary of the Company, was retained to provide management services for the property. During the third quarter of 2010, the management agreement for this property was terminated. Therefore, all income for current and prior periods was reclassified to discontinued operations.
Summary of Impairments
During the fourth quarter of 2010, the Company recorded non-cash impairment losses of $4.1 million related to non-strategic office properties targeted for sale in Columbia, South Carolina, and Richmond, Virginia. The Company began actively marketing these assets around year end. As part of the marketing process, the Company estimated that the fair value of these assets was less than their carrying value at December 31, 2010. Therefore, an impairment loss for the assets was recorded during the fourth quarter 2010.
Contractual Obligations and Minimum Rental Receipts
Obligations for tenant improvement allowances and lease inducement costs for leases in place and commitments for building improvements and development costs at December 31, 2010 are as follows (in thousands):
| 2011 | $ | 15,829 |
| 2012 | 609 |
| 2013 | 43 |
| 2014 | 1,380 |
| 2015 | 42 |
| Thereafter | 35 |
| Total | $ | 17,938 |
Minimum future operating lease payments for various equipment leased at the office properties is as follows for operating leases in place at December 31, 2010 (in thousands):
| 2011 | $ | 646 |
| 2012 | 371 |
| 2013 | 121 |
| Total | $ | 1,138 |
The following is a schedule by year of future approximate minimum rental receipts under noncancelable leases for office buildings owned at December 31, 2010 (in thousands):
| 2011 | $ | 185,244 |
| 2012 | 167,569 |
| 2013 | 152,050 |
| 2014 | 127,281 |
| 2015 | 99,294 |
| Thereafter | 264,337 |
| | $ | 995,775 |
The following is a schedule by year of future approximate minimum ground lease payments at December 31, 2010 (in thousands):
| 2011 | $ | 184 |
| 2012 | 184 |
| 2013 | 184 |
| 2014 | 184 |
| 2015 | 184 |
| Thereafter | 14,599 |
| | $ | 15,519 |
At December 31, 2010, Fund I owned Desert Ridge Corporate Center in Phoenix, Arizona that is subject to a ground lease. The lease has a remaining term of approximately 81 years with an expiration date of July 2092. Payments through July 13, 2013 are based on a rental constant applied to a per acre value. The rental constant is established for the duration of the ground lease and adjusts each five years. Starting July 2013, the rental payment is the higher of the amount previously described, or 0.35% of the valuation of the improvements of the previous year.
Note C – Mortgage Loans
The Company owns the B participation piece (the “B piece”) of a first mortgage secured by an 844,000 square foot office building in Dallas, Texas, known as 2100 Ross originally purchased for $6.9 million. The B piece was originated by Wachovia Bank, N.A., a Wells Fargo Company, and has a face value of $10.0 million and a stated coupon rate of 6.065%. Upon maturity in May 2012, the Company will receive a principal payment of $10.0 million, which produces a yield to maturity of 15.6%. The balance of the mortgage loan was $8.8 million at December 31, 2010.
In connection with the sale of One Park Ten, the Company seller-financed a $1.5 million note receivable that bears interest at 7.25% per annum on an interest-only basis through maturity in June 2012. The carrying amount of the mortgage loan was $1.5 million at December 31, 2010.
Note D – Investment in Unconsolidated Joint Ventures
In addition to the 61 office and parking properties included in the consolidated financial statements, the Company was also invested in three unconsolidated joint ventures with unrelated investors at December 31, 2010. These investments are accounted for using the equity method of accounting, as Parkway does not control any of these joint ventures. Accordingly, the assets and liabilities of the joint ventures are not included on Parkway’s consolidated balance sheets at December 31, 2010 and 2009. Information relating to these unconsolidated joint ventures is detailed below (in thousands):
| | | | Parkway’s | Square | Percentage |
| Joint Venture Entity | Property Name | Location | Ownership% | Feet | Occupied |
| Wink-Parkway Partnership (“Wink JV”) | Wink Building | New Orleans, LA | 50.0% | 32 | 7.6% |
| Parkway Joint Venture, LLC (“Jackson JV”) | UBS/River Oaks | Jackson, MS | 20.0% | 167 | 84.4% |
| RubiconPark II, LLC (“Maitland JV”) (1) | Maitland 200 | Orlando, FL | 20.0% | 205 | 92.4% |
| | | | | 404 | 82.3% |
| (1) | As a result of the Company’s partner, Rubicon US REIT, filing for Chapter 11 bankruptcy, new partners were admitted into the partnership. They are JP Morgan Chase, Kaufman Jacobs, LLC and Starwood Capital Group Global, LP. |
Cash distributions from unconsolidated joint ventures are made to each partner based on their percentage of ownership in each entity. Cash distributions made to partners in joint ventures where the percentage of debt assumed is disproportionate to the ownership percentage in the venture is distributed based on each partner’s share of cash available for distribution before debt service, based on their ownership percentage, less the partner’s share of debt service based on the percentage of debt assumed by each partner.
Parkway provides management, construction and leasing service for all of the unconsolidated joint ventures except for the Wink-Parkway Partnership, and receives market-based fees for these services. The Company recognizes its proportionate share of fees earned from unconsolidated joint ventures in management company income.
At December 31, 2010 and 2009, the Company’s investment in unconsolidated joint ventures was $2.9 million, or 0.2% of total assets and $2.5 million, or 0.2% of total assets, respectively.
On February 4, 2011, the Company purchased its partner’s 50% interest in the Wink JV for $250,000. Upon completing the purchase of its partner’s interest, Parkway now owns 100% of the Wink Building.
In most cases the Company’s share of debt related to its unconsolidated joint ventures is the same as its ownership percentage in the venture. However, in the case of the Maitland JV, the Company’s share of debt is disproportionate to its ownership percentage. The disproportionate debt structure was created to meet the Company’s partner’s financing criteria. In the Maitland JV, the Company owns a 20% interest in the venture and assumed none of the debt. The terms related to Parkway's share of unconsolidated joint venture mortgage debt are summarized below for December 31, 2010 and 2009 (in thousands):
| Parkway’s Share of Unconsolidated Joint Ventures’ Debt |
| | | | | Parkway’s | Monthly | Loan | Loan |
| | Type of | | | Share | Debt | Balance | Balance |
| Description | Debt Service | Interest Rate | Maturity | of Debt | Service | 12/31/10 | 12/31/09 |
| Maitland JV | Amortizing | 4.390% | 06/01/11 | 0.00% | $ | - | $ | - | $ | - |
| Jackson JV | Amortizing | 5.840% | 07/01/15 | 20.00% | 12 | 2,474 | 2,507 |
| | | | | | $ | 12 | $ | 2,474 | $ | 2,507 |
| Weighted Average Interest Rate at End of Year | | | | 5.840% | 5.130% |
Parkway's share of the scheduled principal payments on mortgage debt for the unconsolidated joint ventures for each of the next five years and thereafter through maturity at December 31, 2010 are as follows (in thousands):
| Schedule of Mortgage Maturities by Year: | Maitland JV | Jackson JV | Total |
| 2011 | $ | - | $ | 34 | $ | 34 |
| 2012 | - | 37 | 37 |
| 2013 | - | 39 | 39 |
| 2014 | - | 41 | 41 |
| 2015 | - | 2,323 | 2,323 |
| | $ | - | $ | 2,474 | $ | 2,474 |
Note E – Land Available for Sale
At December 31, 2010 and 2009, Parkway’s investment in land available for sale consisted of 12 acres of land in New Orleans, Louisiana with a book value of $750,000.
Note F - Notes Payable
Notes Payable to Banks
At December 31, 2010, the Company had a total of $110.8 million outstanding under the following credit facilities (collectively, the “Company’s credit facility”) (in thousands):
| Credit Facilities | Lender | Interest Rate | Maturity | Outstanding Balance |
| 12/31/10 | 12/31/09 |
| $15.0 Million Unsecured Working Capital | | | | | |
| Revolving Credit Facility (1) | PNC Bank | 2.3% | 04/27/11 | $ | 1,839 | $ | - |
| $236.0 Million Unsecured Revolving Credit Facility (2) | Wells Fargo | 4.2% | 04/27/11 | 49,000 | 40,000 |
| $60.0 Million Unsecured Term Loan (3) | Wells Fargo | 4.8% | 04/27/11 | 60,000 | 60,000 |
| | | 4.6% | | $ | 110,839 | $ | 100,000 |
| (1) | The interest rate on the $15.0 million unsecured working capital revolving credit with PNC Bank was LIBOR plus 200 basis points at December 31, 2010. The Company paid fees on the unused portion of the line of 25 basis points. |
| (2) | The $236.0 million unsecured revolving credit facility was led by Wells Fargo and syndicated to eight other banks. The interest rate on the line of credit interest rate was LIBOR plus 115 basis points or the Prime interest rate plus 25 basis points. At December 31, 2010, all amounts outstanding under this credit facility not fixed by an interest rate swap agreement were borrowed at LIBOR plus 115 basis points. The Company paid an annual administration fee of $35,000 and fees on the unused portion of the revolver ranging between 12.5 and 20 basis points based upon overall Company leverage, with the rate set at 20 basis points at December 31, 2010. |
| (3) | The $60.0 million unsecured term loan was led by Wells Fargo and syndicated to eight other banks. The interest rate on the term loan was fixed by an interest rate swap agreement. Excluding the interest rate swaps, the interest rate on the term loan was LIBOR plus 115 basis points. |
The Company’s credit facility requires compliance with a number of restrictive financial covenants, including tangible net worth, fixed charge coverage ratio, unencumbered interest coverage ratio, total debt to total asset ratio, secured debt to total asset value ratio, secured recourse debt to total asset value ratio and unencumbered pool restrictions. At December 31, 2010, the Company was in compliance with these financial covenants.
On January 31, 2011, the Company closed a new $190.0 million unsecured revolving credit facility and a new $10.0 million unsecured working capital revolving credit facility. The new credit facilities have an initial term of three years and replaced the existing unsecured revolving credit facility, term loan and working capital facility that were scheduled to mature on April 27, 2011. The Company also has a $100.0 million interest rate swap associated with the credit facilities that expires March 31, 2011, locking LIBOR at 3.635%. The Company does not anticipate an extinguishment of this interest rate swap prior to its stated expiration as the hedged item relates to interest rate payments on $100.0 million of LIBOR-based debt and the forecasted transaction remains probable at December 31, 2010. Excluding the impact of the interest rate swap, the interest rate on the new credit facilities is based on LIBOR plus 275 to 350 basis points, depending upon overall Company leverage, with the current rate set at 325 basis points. Additionally, the Company pays fees on the unused portion of the credit facilities ranging between 40 and 50 basis points based upon usage of the aggregate commitment, with the current rate set at 40 basis points. Wells Fargo Securities and JP Morgan Securities LLC acted as Joint Lead Arrangers and Joint Book Runners on the unsecured revolving credit facility. In addition, Wells Fargo Bank, N.A. acted as Administration Agent and JPMorgan Chase Bank, N.A. acted as Syndication Agent. Other participating lenders include PNC Bank, N.A., Bank of America, N.A., US Bank, N.A., Trustmark National Bank, and BancorpSouth Bank. The working capital revolving credit facility was provided solely by PNC Bank, N.A.
During 2008, the Company entered into two interest rate swap agreements. The Company designated the swaps as cash flow hedges of the variable interest rates on the Company’s borrowings under the credit facility and a portion of the debt secured by the Pinnacle at Jackson Place. These swaps are considered to be fully effective and changes in the fair value of the swaps are recognized in accumulated other comprehensive income (loss).
The Company's interest rate hedge contracts at December 31, 2010 and 2009 are summarized as follows (in thousands):
| | | | | | | Fair Value |
| | Balance | | | | | Liability |
| Type of | Sheet | Notional | Maturity | | Fixed | December 31 |
| Hedge | Location | Amount | Date | Reference Rate | Rate | 2010 | 2009 |
| Swap | Accounts Payable and Other Liabilities | $100,000 | 03/31/11 | 1 - Month LIBOR | 4.785% | $ | (836) | $ | (3,585) |
| Swap | Accounts Payable and Other Liabilities | $23,500 | 12/01/14 | 1 - Month LIBOR | 5.800% | (2,167) | (1,307) |
| | | | | | | $ | (3,003) | $ | (4,892) |
Mortgage Notes Payable
A summary of mortgage notes payable at December 31, 2010 and 2009 is as follows (in thousands):
| | | | | | | |
| | | | | | Note Balance |
| | Variable Rate | Fixed | Monthly | Maturity | December 31 |
| Office Property | 12/31/10 | Rate | Payment | Date | 2010 | 2009 |
| Wholly-Owned | | | | | | |
| John Hancock Facility (3 properties)(1) | - | 5.270% | $ | - | 05/01/10 | $ | - | $ | 17,346 |
| Capital City Plaza (2) | - | - | - | 05/01/10 | - | 60,000 |
| One Jackson Place (3) | - | 7.850% | - | 10/10/10 | - | 8,526 |
| Squaw Peak (4) | - | 4.920% | - | 12/15/10 | - | 32,423 |
| Forum I | - | 5.250% | 91 | 06/01/11 | 10,194 | 10,734 |
| Wells Fargo | - | 4.390% | 53 | 06/01/11 | 8,616 | 8,869 |
| 233 N. Michigan | - | 4.940% | 763 | 07/11/11 | 86,711 | 91,459 |
| Bank of America Plaza | - | 7.100% | 146 | 05/10/12 | 16,939 | 17,466 |
| One Park Ten Plaza (5) | - | 7.100% | - | 06/01/12 | - | 8,714 |
| Teachers Insurance and | | | | | | |
| Annuity Association (5 properties) | - | 6.210% | 565 | 01/01/16 | 77,735 | 79,626 |
| John Hancock Facility (2 properties) | - | 7.580% | 130 | 06/01/16 | 18,243 | 18,418 |
| 111 East Wacker, LLC | - | 6.290% | 804 | 07/11/16 | 148,500 | 148,500 |
| Capital City Plaza | - | 7.250% | 253 | 03/05/17 | 34,617 | - |
| Morgan Keegan Tower | - | 7.620% | 163 | 10/01/19 | 12,578 | 13,540 |
| Citrus Center (6) | - | 6.310% | 153 | 06/01/20 | 22,820 | - |
| Stein Mart (7) | - | 6.500% | 81 | 08/01/20 | 11,935 | - |
| Pinnacle at Jackson Place – Subordinate NMTC Loan (8) | - | 3.000% | 15 | 12/27/47 | 6,000 | 6,000 |
| Pinnacle at Jackson Place – Sr NMTC Loan (8) | 5.800% | - | 114 | 12/27/47 | 23,501 | 23,501 |
| Total Wholly-Owned | | | 3,331 | | 478,389 | 545,122 |
| | | | | | | |
| Consolidated Joint Ventures | | | | | | |
| Moore Building Associates LP (9) | - | 7.895% | - | 06/01/10 | - | 10,858 |
| Parkway Properties Office Fund, LP: | | | | | | |
| Renaissance Center | - | 5.469% | 97 | 06/01/12 | 16,000 | 16,280 |
| Maitland 100 | - | 4.920% | 36 | 10/07/12 | 8,798 | 8,820 |
| 555 Winderley Place | - | 4.920% | 34 | 10/07/12 | 8,320 | 8,340 |
| 1401 Enclave | - | 5.760% | 134 | 07/10/15 | 28,000 | 28,000 |
| 100 Ashford Center/Peachtree Ridge | - | 5.606% | 179 | 01/08/16 | 30,264 | 30,679 |
| Gateway Center | - | 5.920% | 163 | 02/10/16 | 33,000 | 33,000 |
| Desert Ridge Corporate Center | - | 5.770% | 237 | 02/10/16 | 49,200 | 49,200 |
| US Cellular Plaza | - | 5.530% | 342 | 03/10/16 | 58,564 | 59,401 |
| BellSouth Building/Centurion Centre | - | 5.900% | 71 | 06/10/16 | 14,400 | 14,400 |
| Chatham Centre | - | 5.560% | 79 | 01/10/17 | 17,100 | 17,100 |
| Overlook II | - | 5.610% | 152 | 03/01/17 | 31,500 | 31,500 |
| Total Consolidated Joint Ventures | | | 1,524 | | 295,146 | 307,578 |
| | | | | | | |
| Total Secured Debt | | | $ | 4,855 | | $ | 773,535 | $ | 852,700 |
| (1) | On April 30, 2010, the Company repaid a $17.2 million mortgage loan secured by two office properties in Houston, Texas, and one office property in Atlanta, Georgia, utilizing available proceeds under its credit facility. The mortgage loan had an interest rate of 5.3% and was scheduled to mature on May 1, 2010. |
| (2) | On February 8, 2010, the Company completed a $35.0 million non-recourse, fixed-rate first mortgage loan related to the refinance of a $60.0 million recourse mortgage that was scheduled to mature in May 2010. The loan bears interest at 7.25% and is secured by the Company’s Capital City Plaza building in Atlanta, Georgia. The loan will mature in March 2017 and includes the option to be prepaid at the end of five years at a cost of 1% of the outstanding loan balance. The Company used available proceeds under its credit facility to pay the $25.0 million difference on the maturing mortgage loan. |
| (3) | On October 8, 2010, the Company repaid a $7.6 million mortgage loan secured by One Jackson Place, a 220,000 square foot office property in Jackson, Mississippi. The mortgage had an interest rate of 7.9% and was scheduled to mature on October 10, 2010. The Company repaid the mortgage loan using available proceeds under the credit facility. |
| (4) | On December 15, 2010, the Company repaid a $31.0 million mortgage loan secured by Squaw Peak Corporate Center, a 290,000 square foot office complex in Phoenix, Arizona. The mortgage loan had a fixed interest rate of 4.9%. The Company repaid the mortgage loan using available proceeds under the credit facility. |
| (5) | On April 15, 2010, the Company sold One Park Ten, a 163,000 square foot office property in Houston, Texas, for a gross sales price of $15.7 million. Parkway received net cash proceeds from the sale of $4.8 million which were used to reduce amounts outstanding under the Company’s credit facility. The $8.7 million first mortgage loan was assumed by the buyer, and Parkway is also providing a $1.5 million seller-financing loan, which bears interest at 7.25% with interest-only payments through maturity in June 2012. |
| (6) | On May 28, 2010, the Company obtained a $23.0 million non-recourse, first mortgage loan secured by Citrus Center, a 261,000 square foot office property in Orlando, Florida. The mortgage loan had a fixed interest rate of 6.3% and a term of ten years. The proceeds were used to reduce amounts outstanding under the Company’s credit facility. |
| (7) | On July 8, 2010, the Company obtained a $12.0 million non-recourse first mortgage loan secured by the Stein-Mart building, a 196,000 square foot office property in Jacksonville, Florida. The mortgage loan had a fixed interest rate of 6.5% and a term of ten years. The proceeds were used to reduce amounts outstanding under the Company’s credit facility. |
| (8) | The New Markets Tax Credit loans have a stated maturity of December 27, 2047, but contain an early repayment option whereby the lender may call the loans in December 2014. In the event the lender exercises this option, the outstanding principal balance of the loans will be reduced by $3.0 million. Additionally, the Company has entered into an interest rate swap agreement with US Bank for a $23.5 million notional amount that fixes the 30-day LIBOR interest rate at 4.05%, which equates to a total current interest rate of 5.8%, for the period January 1, 2009, through December 1, 2014. The swap agreement serves as a hedge of the variable interest rates on the borrowings under the Pinnacle at Jackson Place Senior New Market Tax Credits mortgage loan. The weighted average interest rate for the total New Markets Tax Credits loans is 5.2%. |
| (9) | Upon maturity on June 1, 2010, the Company paid off its share and its partner’s share of a $10.6 million mortgage note payable secured by the Toyota Center, a 175,000 square foot office property in Memphis, Tennessee, utilizing available proceeds under the Company’s line of credit. The mortgage had an interest rate of 7.9%. The Toyota Center office property was previously owned by a consolidated joint venture, Moore Building Associates, LP, in which the Company served as the general partner. However, during the third quarter of 2010, Parkway purchased the partner’s interest, thereby placing Parkway’s ownership of the property at 100%. |
At December 31, 2010 and 2009, the net book value of the office properties collateralizing the mortgage loans was $1.1 billion.
The aggregate annual maturities of mortgage notes payable at December 31, 2010 are as follows (in thousands):
| | Total | | Recurring |
| | Mortgage | Balloon | Principal |
| | Maturities | Payments | Amortization |
| 2011 | $ | 113,914 | $ | 102,694 | $ | 11,220 |
| 2012 | 58,034 | 48,408 | 9,626 |
| 2013 | 9,943 | - | 9,943 |
| 2014 | 10,595 | - | 10,595 |
| 2015 | 37,971 | 26,891 | 11,080 |
| 2016 | 398,695 | 393,875 | 4,820 |
| Thereafter | 144,383 | 136,029 | 8,354 |
| | $ | 773,535 | $ | 707,897 | $ | 65,638 |
On January 21, 2011, in connection with its purchase of 3344 Peachtree in Atlanta, Georgia, Fund II assumed the $89.6 million existing non-recourse first mortgage, which matures on October 1, 2017, and carries a fixed interest rate of 4.8%. In accordance with GAAP, the mortgage was recorded at $87.2 million to reflect the value of the instrument based on a market interest rate of 5.25% on the date of purchase.
On February 18, 2011, Fund II obtained a $10.0 million mortgage loan secured by Carmel Crossing, a 326,000 square foot office complex in Charlotte, North Carolina. The mortgage loan has a fixed interest rate of 5.5% and a term of nine years. Parkway received $2.4 million in net proceeds from the loan, which represents its 30% equity investment in the property. The proceeds were used to reduce amounts outstanding under the Company’s credit facility.
Note G – Noncontrolling Interest – Real Estate Partnerships
The Company has an interest in two joint ventures that are included in its consolidated financial statements at December 31, 2010. Information relating to these consolidated joint ventures is detailed below:
| | | | | Parkway’s | | Square Feet |
| Joint Venture Entity and Property Name | | Location | | Ownership % | | (In thousands) |
| Parkway Properties Office Fund, LP | | | | | | |
| Desert Ridge Corporate Center | | Phoenix, Arizona | | 26.5% | | 293 |
| Maitland 100 | | Orlando, Florida | | 25.0% | | 128 |
| 555 Winderley | | Orlando, Florida | | 25.0% | | 101 |
| Gateway Center | | Orlando, Florida | | 25.0% | | 228 |
| BellSouth Building | | Jacksonville, Florida | | 25.0% | | 92 |
| Centurion Centre | | Jacksonville, Florida | | 25.0% | | 88 |
| 100 Ashford Center | | Atlanta, Georgia | | 25.0% | | 160 |
| Peachtree Ridge | | Atlanta, Georgia | | 25.0% | | 161 |
| Overlook II | | Atlanta, Georgia | | 25.0% | | 260 |
| U.S. Cellular Plaza | | Chicago, Illinois | | 40.0% | | 607 |
| Chatham Centre | | Schaumburg, Illinois | | 25.0% | | 206 |
| Renaissance Center | | Memphis, Tennessee | | 25.0% | | 190 |
| 1401 Enclave Parkway | | Houston, Texas | | 25.0% | | 209 |
| Total Parkway Properties Office Fund, LP | | | | | | 2,723 |
| | | | | | | |
| Parkway Properties Office Fund II, LP (1) | | | | | | |
| Falls Pointe | | Atlanta, Georgia | | 30.0% | | 107 |
| Lakewood II | | Atlanta, Georgia | | 30.0% | | 128 |
| Carmel Crossing | | Charlotte, North Carolina | | 30.0% | | 327 |
| Total Parkway Properties Office Fund II, LP | | | | | | 562 |
| Total Consolidated Joint Ventures | | | | | | 3,285 |
| (1) | On January 21, 2011, the Company and Fund II purchased 3344 Peachtree located in the Buckhead submarket of Atlanta, Georgia. 3344 Peachtree contains approximately 484,000 square feet of office and retail space. Upon the completion of the purchase of 3344 Peachtree, the Company had a total of approximately 3.8 million square feet of joint ventures included in its consolidated financial statements of which, Fund II had approximately 1.0 million square feet. |
Parkway serves as the general partner of Fund I and provides asset management, property management, leasing and construction management services to the fund, for which it is paid market-based fees. Cash distributions from the fund are made to each joint venture partner based on their percentage of ownership in the fund. Since Parkway is the sole general partner and has the authority to make major decisions on behalf of the fund, Parkway is considered to have a controlling interest. Accordingly, Parkway is required to consolidate the fund in its consolidated financial statements. At February 15, 2008, Fund I was fully invested.
In 2008, Parkway formed Fund II, a $750.0 million discretionary fund with TRST, for the purpose of acquiring high-quality multi-tenant office properties. TRST is a 70% investor, and Parkway is a 30% investor in the fund, which is capitalized with approximately $375.0 million of equity capital and $375.0 million of non-recourse, fixed-rate first mortgage debt. Parkway’s share of the equity contribution for the fund will be $112.5 million and will be funded with operating cash flow, proceeds from asset sales, issuance of equity securities and/or advances on the credit facility as needed on a temporary basis. The fund will target investments in office buildings in Houston, Austin, San Antonio, Chicago, Atlanta, Phoenix, Charlotte, Memphis, Nashville, Jacksonville, Orlando, Tampa/St. Petersburg, and Ft. Lauderdale, as well as other growth markets to be determined at Parkway’s discretion.
Parkway serves as the general partner of Fund II and provides asset management, property management, and leasing and construction management services to the fund, for which it will be paid market-based fees. Parkway has four years, or through May 2012, to identify and acquire properties, with funds contributed as needed to complete acquisitions. Parkway will exclusively represent the fund in making acquisitions within the target markets and within certain predefined criteria. Parkway may continue to make fee-simple acquisitions in markets outside of the target markets, acquire properties within the target markets that do not meet the fund’s specific criteria or sell a full or partial interest in currently owned properties. At December 31, 2010, Fund II includes investments in three office properties totaling $33.0 million. In January 2011, Fund II purchased an investment in an office property totaling $160.0 million, which places total Fund II investments to date at $193.0 million. There is approximately $552.1 million in remaining capacity for Fund II investments.
Noncontrolling interest - real estate partnerships represents the other partners’ proportionate share of equity in the partnerships discussed above at December 31, 2010. Income is allocated to noncontrolling interest based on the weighted average percentage ownership during the year.
Parkway Moore, LLC and Moore Building Associates, LP (“MBALP”) were established for the purpose of owning a commercial office building (the Toyota Center in Memphis, Tennessee), with Parkway serving as general partner. The entities were previously classified as consolidated joint ventures. However, during the third quarter of 2010, Parkway purchased the partner’s 25% interest, thereby placing Parkway’s ownership at 100% and removing the classification as a consolidated joint venture.
Note H - Discontinued Operations
All current and prior period income from the following office property dispositions are included in discontinued operations for the years ended December 31, 2010, 2009 and 2008 (in thousands).
| | | Square | Date of | Net Sales | Net Book Value | Gain |
| Office Property | Location | Feet | Sale | Price | of Real Estate | on Sale |
| | | | | | | |
| Town Point Center | Norfolk, Virginia | 131 | 07/15/08 | $ | 12,180 | $ | 10,621 | $ | 1,559 |
| Wachovia Plaza | St. Petersburg, Florida | 186 | 08/18/08 | 25,492 | 16,154 | 9,338 |
| Capitol Center | Columbia, South Carolina | 460 | 09/05/08 | 46,792 | 35,101 | 11,691 |
| 2008 Dispositions | | 777 | | $ | 84,464 | $ | 61,876 | $ | 22,588 |
| | | | | | | |
| One Park Ten | Houston, Texas | 163 | 04/15/10 | $ | 14,924 | $ | 6,406 | $ | 8,518 |
| 2010 Dispositions | | 163 | | $ | 14,924 | $ | 6,406 | $ | 8,518 |
The amount of revenue and expense for these office properties reported in discontinued operations for the years ended December 31, 2010, 2009 and 2008 is as follows (in thousands):
| | Year Ended December 31 |
| | 2010 | | 2009 | | 2008 |
| Revenues | | | | | |
| Revenue from office and parking properties | $ | 994 | | $ | 3,394 | | $ | 12,294 |
| | 994 | | 3,394 | | 12,294 |
| Expenses | | | | | |
| Office and parking properties: | | | | | |
Operating expense | 362 | | 1,741 | | 6,563 |
Interest expense | 317 | | 649 | | 3,828 |
Depreciation and amortization | 121 | | 600 | | 2,364 |
| | 800 | | 2,990 | | 12,755 |
| Income (loss) from discontinued operations | 194 | | 404 | | (461) |
| Gain on sale of real estate from discontinued operations | 8,518 | | - | | 22,588 |
| Total discontinued operations | $ | 8,712 | | $ | 404 | | $ | 22,127 |
Note I - Income Taxes
The Company elected to be taxed as a REIT under the Internal Revenue Code, commencing with its taxable year ended December 31, 1997. To qualify as a REIT, the Company must meet a number of organizational and operational requirements, including a requirement that it currently distribute at least 90% of its adjusted taxable income to its stockholders. It is management's current intention to adhere to these requirements and maintain the Company's REIT status, and the Company was in compliance with all REIT requirements at December 31, 2010. As a REIT, the Company generally will not be subject to corporate level federal income tax on taxable income it distributes currently to its stockholders. If the Company fails to qualify as a REIT in any taxable year, it will be subject to federal income taxes at regular corporate rates (including any applicable alternative minimum tax) and may not be able to qualify as a REIT for four subsequent taxable years. Even if the Company qualifies for taxation as a REIT, the Company may be subject to certain state and local taxes on its income and property, and to federal income and excise taxes on its undistributed taxable income. In addition, taxable income from non-REIT activities managed through taxable REIT subsidiaries is subject to federal, state and local income taxes.
In January 1998, the Company completed its reorganization into an UPREIT structure under which substantially all of the Company's real estate assets are owned by an operating partnership, Parkway Properties LP. Presently, substantially all interests in the Operating Partnership are owned by the Company and a wholly-owned subsidiary.
At December 31, 2010, the Company had net operating loss ("NOL") carryforwards for federal income tax purposes of $584,000 which expire at various dates beginning in 2011 through 2018. The utilization of these NOLs can cause the Company to incur a small alternative minimum tax liability.
The Company's income differs for income tax and financial reporting purposes principally because real estate owned has a different basis for tax and financial reporting purposes, producing different gains upon disposition and different amounts of annual depreciation.
The following reconciles GAAP net income to taxable income for the years ending December 31, 2010, 2009 and 2008 (in thousands):
| | 2010 | 2009 | 2008 |
| | Estimate | Actual | Actual |
| GAAP net income (loss) from REIT operations (1) | $ | (2,618) | $ | (11,603) | $ | 9,274 |
| GAAP to tax adjustments: | | | |
| Depreciation and amortization | 12,226 | 19,113 | 19,485 |
| Gains and losses from capital transactions | (138) | 5,487 | 342 |
| Share-based compensation expense | 1,319 | 2,581 | 2,276 |
| Stock options exercised | - | - | (88) |
| Deferred compensation distributions | (687) | (446) | (1,107) |
| Amortization of mortgage loan discount | (772) | (607) | (519) |
| Allowance for doubtful accounts | 283 | 1,491 | 235 |
| Vesting of restricted shares and dividends | (4,523) | (704) | (278) |
| Deferred revenue | 3,241 | - | - |
| Other differences | (61) | (456) | (97) |
| Taxable income before adjustments | 8,270 | 14,856 | 29,523 |
| Less: NOL carryforward | - | - | - |
| Adjusted taxable income subject to 90% dividend requirement | $ | 8,270 | $ | 14,856 | $ | 29,523 |
| (1) | GAAP net income from REIT operations is net of amounts attributable to noncontrolling interest. |
The following reconciles cash dividends paid with the dividends paid deduction for the years ending December 31, 2010, 2009 and 2008 (in thousands):
| | 2010 | 2009 | 2008 |
| | Estimate | Actual | Actual |
| Cash dividends paid | $ | 13,197 | $ | 30,475 | $ | 38,977 |
| Less: Dividends on deferred compensation plan shares | (17) | (94) | (194) |
| Less: Dividends absorbed by current earnings and profits | (4,765) | (3,938) | (4,163) |
| Less: Return of capital | (145) | (11,587) | (5,097) |
| Dividends paid deduction | $ | 8,270 | $ | 14,856 | $ | 29,523 |
The following characterizes distributions paid per common share for the years ending December 31, 2010, 2009 and 2008:
| | 2010 | 2009 | 2008 |
| | Amount | Percentage | Amount | Percentage | Amount | Percentage |
| Ordinary income | $0.23 | 76.7% | $0.71 | 54.6% | $0.844 | 37.1% |
| Post May 5, 2003 capital gain | 0.00 | 0.0% | 0.00 | 0.0% | 0.197 | 8.7% |
| Unrecaptured Section 1250 gain | 0.06 | 20.0% | 0.00 | 0.0% | 0.893 | 39.2% |
| Return of capital | 0.01 | 3.3% | 0.59 | 45.4% | 0.341 | 15.0% |
| | $0.30 | 100.0% | $1.30 | 100.0% | $2.275 | 100.0% |
Note J – Share-Based and Long-Term Compensation Plans
Effective May 1, 2010, the stockholders of the Company approved Parkway’s 2010 Omnibus Equity Incentive Plan (the “2010 Equity Plan”) that authorized the grant of up to 600,000 equity based awards to employees and directors of the Company. The 2010 Equity Plan replaces the Company’s 2003 Equity Incentive Plan and the 2001
Non-Employee Directors Equity Compensation Plan. At present, it is Parkway’s intention to grant restricted shares and/or deferred incentive share units instead of stock options although the 2010 Equity Plan authorizes various forms of incentive awards, including options. The 2010 Equity Plan has a ten-year term.
Compensation expense, including estimated forfeitures, for service-based awards is recognized over the expected vesting period. The total compensation expense for the long-term equity incentive awards granted under the FOCUS Plan is based upon the fair value of the shares on the grant date, adjusted for estimated forfeitures. Time-based restricted shares and deferred incentive share units are valued based on the New York Stock Exchange closing market price of Parkway common shares (NYSE ticker symbol, PKY) as of the date of grant. The grant date fair value for awards that are subject to market conditions is determined using a simulation pricing model developed to specifically accommodate the unique features of the awards.
Restricted shares and deferred incentive share units are forfeited if an employee leaves the Company before the vesting date except in the case of the employee’s death or permanent disability or upon termination following a change of control. Shares and/or units that are forfeited become available for future grant under the 2010 Equity Plan.
On January 4, 2010, 91,000 restricted shares vested and were issued to officers of the Company. These shares were granted to the officers of the Company in January 2003 and vested seven years from the grant date.
On February 10, 2010, 29,941 restricted shares vested and were issued to officers of the Company due to the achievement of performance goals established in 2009 by the Board of Directors.
On July 1, 2010, 26,500 restricted shares vested and were issued to officers of the Company. These shares were granted in July 2006 and vested four years from the grant date.
On July 12, 2010, the Board of Directors approved 345,120 FOCUS Plan long-term equity incentive awards to officers of the Company. The long-term equity incentive awards are valued at $2.5 million which equates to an average price per share of $7.30 and consist of 25,380 time-based awards, 179,314 market condition awards subject to an absolute total return goal, and 140,426 market condition awards subject to a relative total return goal. These shares are accounted for as equity-classified awards on the Company’s 2010 consolidated balance sheet.
The time-based awards granted as part of the FOCUS Plan will vest ratably over four years from the date the shares are granted. The market condition awards granted as part of the FOCUS Plan are contingent on the Company meeting goals for compounded annual total return to stockholders (“TRS”) over the three year period beginning July 1, 2010. The market condition goals are based upon (i) the Company’s absolute compounded annual TRS; and (ii) the Company’s absolute compounded annual TRS relative to the compounded annual return of the MSCI US REIT (“RMS”) Index calculated on a gross basis, as follows:
| | | | |
| Absolute Return Goal | 10% | 12% | 14% |
| Relative Return Goal | RMS + 100 bps | RMS + 200 bps | RMS + 300 bps |
With respect to the absolute return goal, 15% of the award is earned if the Company achieves threshold performance and a cumulative 60% is earned for target performance. With respect to the relative return goal, 20% of the award is earned if the Company achieves threshold performance and a cumulative 55% is earned for target performance. In each case, 100% of the award is earned if the Company achieves maximum performance or better. To the extent actually earned, the market condition awards will vest 50% on each of July 15, 2013 and 2014.
The FOCUS Plan also includes a long-term cash incentive that was designed to reward significant outperformance over the three year period beginning July 1, 2010. The performance goals for actual payment under the long-term cash incentive will require the Company to (i) achieve an absolute compounded annual TRS that exceeds 14% AND (ii) achieve an absolute compounded annual TRS that exceeds the compounded annual return of the RMS by at least 500 basis points. Notwithstanding the above goals, in the event the Company achieves an absolute compounded annual TRS that exceeds 19%, then the Company must achieve an absolute compounded annual TRS that exceeds the compounded annual return of the RMS by at least 600 basis points. The aggregate amount of the cash incentive earned would increase with corresponding increases in the absolute compounded annual TRS achieved by the Company. There will be a cap on the aggregate cash incentive earned in the amount of $7.1
million. Achievement of the maximum cash incentive would equate to an absolute compounded annual TRS that approximates 23%, provided that the absolute compounded annual TRS exceeds the compounded annual return of the RMS by at least 600 basis points. The total compensation expense for the long-term cash incentive awards granted under the FOCUS Plan is based upon the estimated fair value of the award on the grant date and adjustment as necessary each reporting period. The long-term cash incentive awards are accounted for as a liability-classified award on the Company’s 2010 consolidated balance sheet. The grant date and quarterly fair value estimates for awards that are subject to a market condition are determined using a simulation pricing model developed to specifically accommodate the unique features of the awards.
On August 23, 2010, 5,500 restricted shares vested and were issued to officers of the Company. These shares were granted in September 2003 and vested seven years from the grant date.
On January 9, 2011, 25,935 restricted shares vested and were issued to officers of the Company due to the achievement of performance goals established in 2009 by the Board of Directors.
On January 12, 2011, 27,125 restricted shares vested and were issued to officers of the Company. These shares were granted in January 2007 and vested four years from the grant date.
On January 14, 2011, the Board of Directors approved 55,623 FOCUS Plan long-term equity incentive awards to officers of the Company. The long-term equity incentive awards are valued at $736,000 which equates to an average price per share of $13.23 and consist of 25,620 time-based awards, 16,883 market condition awards subject to an absolute total return goal, and 13,120 market condition awards subject to a relative total return goal. These shares will be accounted for as equity-classified awards on the Company’s consolidated balance sheet.
At December 31, 2010, a total of 479,930 shares of restricted stock have been granted to officers of the Company. The shares are valued at $6.1 million, which equates to an average price per share of $12.81. The value, including estimated forfeitures, of restricted shares that vest based on service conditions will be amortized to compensation expense ratably over the vesting period for each grant of stock. At December 31, 2010, a total of 15,640 deferred incentive share units have been granted to employees of the Company. The deferred incentive share units are valued at $402,000, which equates to an average price per share of $25.71, and the units vest four years from grant date. Total compensation expense related to the restricted stock and deferred incentive units of $1.3 million, $2.6 million and $2.3 million was recognized in 2010, 2009 and 2008, respectively. Total compensation expense related to nonvested awards not yet recognized was $2.9 million at December 31, 2010. The weighted average period over which this expense is expected to be recognized is approximately 2.6 years.
A summary of the Company’s restricted stock and deferred incentive share unit activity is as follows:
| | | Weighted | Deferred | Weighted |
| | Restricted | Average | Incentive | Average |
| | Shares | Price | Share Units | Price |
| Outstanding at December 31, 2007 | 220,999 | $ | 40.72 | 21,835 | $ | 45.96 |
| Granted | 38,017 | 32.39 | 6,385 | 15.69 |
| Vested | - | - | (1,815) | 46.72 |
| Forfeited | (38,375) | 39.54 | (3,600) | 44.73 |
| Outstanding at December 31, 2008 | 220,641 | 39.49 | 22,805 | 37.62 |
| Granted | 120,500 | 15.77 | 1,500 | 12.69 |
| Vested | (30,416) | 43.08 | (2,615) | 44.61 |
| Forfeited | (1,750) | 30.85 | (3,635) | 39.93 |
| Outstanding at December 31, 2009 | 308,975 | 29.94 | 18,055 | 34.08 |
| Granted | 345,120 | 7.30 | 3,805 | 14.83 |
| Vested | (152,941) | 33.06 | (4,355) | 47.78 |
| Forfeited | (21,224) | 26.69 | (1,865) | 32.99 |
| Outstanding at December 31, 2010 | 479,930 | $ | 12.81 | 15,640 | $ | 25.71 |
Restricted shares and deferred incentive share units vest in the following years, subject to service and market conditions:
| | Time Based Awards | Market Condition Awards (1) | Total Restricted Shares | Deferred Incentive Share Units |
| 2011 | 60,405 | - | 60,405 | 5,570 |
| 2012 | 61,160 | - | 61,160 | 4,955 |
| 2013 | 32,280 | 159,870 | 192,150 | 1,310 |
| 2014 | 6,345 | 159,870 | 166,215 | 3,805 |
| | 160,190 | 319,740 | 479,930 | 15,640 |
| (1) | The market condition restricted shares will vest in the years noted above subject to achievement of the market condition goals described in connection with the FOCUS Plan. |
A summary of the Company's stock option activity and related information is as follows:
| | 1994 Stock | 1991 Directors | 2001 Directors |
| | Option Plan | Stock Option Plan | Stock Option Plan |
| | | Weighted | | Weighted | | Weighted |
| | | Average | | Average | | Average |
| | Shares | Price | Shares | Price | Shares | Price |
| Outstanding at December 31, 2007 | 121,615 | $ | 31.38 | 13,500 | $ | 31.10 | 30,300 | $ | 37.88 |
| Exercised | (25,436) | 31.15 | - | - | - | - |
| Forfeited | (500) | 33.65 | (7,500) | 29.94 | (8,800) | 35.24 |
| Outstanding at December 31, 2008 | 95,679 | 31.43 | 6,000 | 32.56 | 21,500 | 38.96 |
| Forfeited | (9,399) | 31.10 | (6,000) | 32.56 | (9,000) | 35.26 |
| Outstanding at December 31, 2009 | 86,280 | 31.46 | - | - | 12,500 | 41.63 |
| Forfeited | (56,319) | 30.28 | - | - | (3,000) | 38.95 |
| Outstanding at December 31, 2010 | 29,961 | $ | 33.69 | - | $ | - | 9,500 | $ | 42.47 |
| Vested and Exercisable at | | | | | | |
| December 31, 2010 | 29,961 | $ | 33.69 | - | $ | - | 9,500 | $ | 42.47 |
There were no stock option exercises for the year ended December 31, 2010 or 2009. The total intrinsic value of stock options exercised for the year ended December 31, 2008 was $22,000.
Following is a summary of the status of options outstanding at December 31, 2010:
| | Outstanding and Exercisable Options |
| | | Weighted | | |
| | | Average | Weighted | Aggregate |
| | | Remaining | Average | Intrinsic |
| | | Contractual | Exercise | Value |
| Exercise Price Range | Number | Life | Price | (in thousands) |
| 1994 Stock Option Plan | | | | |
| $31.43 - $36.65 | 29,961 | 0.7 years | $ | 33.69 | $ | - |
| | 29,961 | 0.7 years | $ | 33.69 | $ | - |
| 2001 Directors Stock Option Plan | | | | |
| $36.53 - $41.89 | 3,000 | 2.4 years | $ | 38.95 | $ | - |
| $41.90 - $47.12 | 6,500 | 2.8 years | 44.10 | - |
| | 9,500 | 2.7 years | $ | 42.47 | $ | - |
Defined Contribution Plan
Parkway maintains a 401(k) plan for its employees. The Company makes matching contributions of 50% of the employee’s contribution (limited to 10% of compensation as defined by the plan) and may also make annual discretionary contributions. The Company’s total expense for this plan was $404,000, $443,000 and $952,000 for the years ending December 31, 2010, 2009 and 2008, respectively.
Note K – Commitments and Contingencies
Legal Matters
On April 23, 2010, the Company received notice of a complaint to the Occupational Safety and Health Administration (“OSHA”) initiated by the Company’s former Chief Financial Officer, J. Mitchell Collins, whose employment with the Company terminated on February 5, 2010. The complaint alleged discriminatory employment practices in violation of Section 806 of the Corporate and Criminal Fraud Accountability Act of 2002, Title VIII of Sarbanes-Oxley Act of 2002. The complaint alleged that Mr. Collins was terminated from his position as Chief Financial Officer of the Company as a result of his purportedly engaging in “protected activity” as defined under Section 806 of the Sarbanes-Oxley Act, and sought reinstatement of Mr. Collins’ position and unspecified damages from the Company. Specifically, Mr. Collins alleged that his termination was a result of bringing what he believed to be certain concerns regarding the Company’s financial projections to the attention of senior management. Mr. Collins also alleged that the Company engaged in conduct that violates U.S. federal law, including U.S. federal securities laws by inaccurately describing to the public the events surrounding his February 5, 2010 separation. Effective July 16, 2010, the Company received a formal notice from the Area Director of OSHA, that Mr. Collins withdrew the Sarbanes-Oxley complaint he filed with OSHA.
On May 4, 2010, Mr. Collins filed a personal injury lawsuit against the Company in the Circuit Court of Hinds County, Mississippi, alleging defamation, wrongful discharge, conversion, and fraud based on substantially the same factual predicate set forth in the OSHA complaint. Mr. Collins is seeking compensatory and punitive damages in excess of $10.0 million in the lawsuit. The Company has carefully reviewed Mr. Collin’s personal injury complaint and believes that the allegations made are without basis in fact or law and will vigorously defend the Company’s prior actions and reputation. Management believes the final outcome of this matter will not have a material adverse effect on the Company’s financial statements.
In addition to the personal injury lawsuit, Mr. Collins issued a shareholder demand letter to the Company threatening to commence a derivative lawsuit on behalf of the Company against the Company, its directors and officers based on substantially the same allegations as set forth in the personal injury suit. On July 27, 2010, the Company’s Board of Directors appointed the audit committee (the “Committee”) of the board to review and evaluate the claims made in Mr. Collins’ demand letter. The Committee engaged independent legal counsel to assist with the review and evaluation of these claims. After thoroughly investigating the allegations in good faith and fully informing itself of all material facts relevant thereto, the Committee believes that the Company did not operate in a fraudulent or misleading manner regarding either the termination of Mr. Collins or the disclosure of the Company's 2010 earnings guidance. Further, the Committee has determined that it would not serve the interests of Parkway or its shareholders for the Company to take any of the further actions requested in the demand letter.
For the year ended December 31, 2010, the Company had expensed $1.3 million with respect to the pending litigation and the demand letter. During the fourth quarter of 2010, the Company removed its reserve for potential future exposure with respect to the pending litigation and demand letter. Management has evaluated the risks involved with the pending litigation and demand letter and determined that no reserve was necessary at December 31, 2010.
Note L – Other Matters
Supplemental Profit and Loss Information
Included in operating expenses are taxes, principally property taxes, of $34.2 million, $40.2 million and $39.2 million for the years ended December 31, 2010, 2009 and 2008, respectively.
Supplemental Cash Flow Information and Schedule of Non-Cash Investing and Financing Activity
| | Year Ended December 31 |
| | 2010 | 2009 | 2008 |
| | (In thousands) |
| Supplemental cash flow information: | | | |
| Interest paid, net of amount capitalized | $ | 53,352 | $ | 53,728 | $ | 60,919 |
| Supplemental schedule of non-cash investing | | | |
| and financing activity: | | | |
| Mortgage note payable transferred | | | |
| to purchaser | (8,666) | - | - |
| Mortgage loan issued to purchaser | (1,500) | - | - |
| Restricted shares and deferred incentive share | | | |
| units issued (forfeited) | 1,949 | 3,030 | (201) |
| Shares issued in lieu of Directors' fees | 285 | 58 | 140 |
Rents Receivable and Other Assets
| | December 31 |
| | 2010 | 2009 |
| | (In thousands) |
| | | |
| Rents receivable | $ | 3,962 | $ | 4,990 |
| Allowance for doubtful accounts | (2,810) | (2,951) |
| Straight-line rent receivable | 35,037 | 31,556 |
| Other receivables | 6,458 | 8,713 |
| Lease costs (net of accumulated amortization of | | |
| $42,497 and $38,323, respectively) | 46,378 | 42,518 |
| Loan costs (net of accumulated amortization of | | |
| $5,478 and $5,966, respectively) | 3,815 | 4,212 |
| Escrow and other deposits | 27,475 | 23,166 |
| Prepaid items | 7,486 | 2,034 |
| Other assets | 1,837 | 2,199 |
| | $ | 129,638�� | $ | 116,437 |
Intangible Assets
The following table reflects the portion of the purchase price of office properties allocated to intangible assets, as discussed in “Note A”. The portion of purchase price allocated to below market lease value and the related accumulated amortization is reflected in the Schedule of Accounts Payable and Other Liabilities within this note.
| | December 31 |
| | 2010 | 2009 |
| | (In thousands) |
| | | |
| Lease in place value | $ | 77,269 | $ | 82,684 |
| Accumulated amortization | (39,895) | (35,510) |
| Above market lease value | 29,361 | 30,982 |
| Accumulated amortization | (16,106) | (16,422) |
| | $ | 50,629 | $ | 61,734 |
Accounts Payable and Other Liabilities
| | December 31 |
| | 2010 | 2009 |
| | (In thousands) |
| Office property payables: | | |
| Accrued expenses and accounts payable | $ | 24,250 | $ | 13,222 |
| Accrued property taxes | 27,946 | 30,636 |
| Prepaid rents | 12,070 | 10,807 |
| Deferred revenues | 5,202 | - |
| Security deposits | 4,616 | 4,677 |
| Below market lease value | 22,639 | 23,116 |
| Accumulated amortization -- below market lease value | (16,306) | (14,585) |
| Capital lease obligations | 3,760 | 3,850 |
| Corporate payables | 4,090 | 7,462 |
| Deferred compensation plan liability | 2,953 | 3,623 |
| Dividends payable | 2,187 | 1,200 |
| Accrued payroll | 2,344 | 1,489 |
| Interest payable | 3,067 | 3,117 |
| | $ | 98,818 | $ | 88,614 |
Preferred Stock
In June 2003, the Company sold 2.4 million shares of 8.0% Series D Cumulative Redeemable Preferred Stock with net proceeds to the Company of approximately $58.0 million. On August 9, 2010, the Company issued an additional 1.97 million shares of its Series D Preferred stock at a price of $23.757 per share, equating to a yield of 8.5% (excluding accrued dividends). The Series D Preferred Stock has a $25 liquidation value per share and will be redeemable at the option of the Company on or after June 27, 2008. The preferred stock has no stated maturity, sinking fund or mandatory redemption and is not convertible into any other securities of the Company.
The Company declared dividends of $2.00 per share for the Series D Preferred stock for each of the three years 2010, 2009 and 2008.
The Company’s shares of Series D preferred stock are listed on the New York Stock Exchange and trade under the symbol “PKY PrD”.
Note M - Fair Values of Financial Instruments
ASC 820 defines fair value as the price that would be received to sell an asset or paid to transfer a liability in an orderly transaction between market participants at the measurement date. ASC 820 also provides guidance for using fair value to measure financial assets and liabilities. The Codification requires disclosure of the level within the fair value hierarchy in which the fair value measurements fall, including measurements using quoted prices in active markets for identical assets or liabilities (Level 1), quoted prices for similar instruments in active markets or quoted prices for identical or similar instruments in markets that are not active (Level 2), and significant valuation assumptions that are not readily observable in the market (Level 3).
Cash and cash equivalents
The carrying amounts for cash and cash equivalents approximated fair value at December 31, 2010 and 2009.
Mortgage loan receivable
The Company owns the B participation piece (the “B piece”) of a first mortgage secured by an 844,000 square foot office building in Dallas, Texas known as 2100 Ross, and the carrying amount of the mortgage loan was approximately $8.8 million and $8.1 million at December 31, 2010 and 2009. In connection with the sale of One Park Ten, the Company seller-financed a $1.5 million note receivable, and carrying amount of the note was $1.5 million at December 31, 2010. The carrying amount for each mortgage loan approximated fair value at December 31, 2010.
Mortgage notes payable
The fair value of the mortgage notes payable are estimated using a discounted cash flow analysis, based on the Company's current incremental borrowing rates for similar types of borrowing arrangements. The aggregate fair value of the mortgage notes payable at December 31, 2010 was $734.6 million as compared to its carrying amount of $773.5 million. The aggregate fair value of the mortgage notes payable at December 31, 2009 was $795.9 million as compared to its carrying amount of $852.7 million.
Notes payable to banks
The fair value of the Company’s notes payable to banks is estimated by discounting expected cash flows at current market rates. The aggregate fair value of the notes payable to banks at December 31, 2010 was $109.6 million as compared to its carrying amount of $110.8 million. The aggregate fair value of the notes payable to banks at December 31, 2009 was $95.8 million as compared to its carrying amount of $100.0 million.
Interest rate swap agreements
The fair value of the interest rate swaps is determined by estimating the expected cash flows over the life of the swap using the mid-market rate and price environment as of the last trading day of the reporting period. This information is considered a Level 2 input as defined by ASC 820. The aggregate fair value liability of the interest rate swaps at December 31, 2010 and 2009 was $3.0 million and $4.9 million, respectively.
Note N – Segment Information
Parkway’s primary business is the ownership and operation of office properties. The Company accounts for each office property or groups of related office properties as an individual operating segment. Parkway has aggregated its individual operating segments into a single reporting segment due to the fact that the individual operating segments have similar operating and economic characteristics.
The Company believes that the individual operating segments exhibit similar economic characteristics such as being leased by the square foot, sharing the same primary operating expenses and ancillary revenue opportunities and being cyclical in the economic performance based on current supply and demand conditions. The individual operating segments are also similar in that revenues are derived from the leasing of office space to customers and each office property is managed and operated consistently in accordance with Parkway’s standard operating procedures. The range and type of customer uses of our properties is similar throughout our portfolio regardless of location or class of building and the needs and priorities of our customers do not vary from building to building. Therefore, Parkway’s management responsibilities do not vary from location to location based on the size of the building, geographic location or class.
The management of the Company evaluates the performance of the reportable office segment based on funds from operations attributable to common shareholders (“FFO”). Management believes that FFO is an appropriate measure of performance for equity REITs and computes this measure in accordance with the National Association of Real Estate Investment Trusts (“NAREIT”) definition of FFO. Funds from operations is defined by NAREIT as net income (computed in accordance with GAAP), excluding gains or losses from sales of property and extraordinary items under GAAP, plus depreciation and amortization, and after adjustments to derive the Company’s pro rata share of FFO of consolidated and unconsolidated joint ventures. Further, the Company does not adjust FFO to eliminate the effects of non-recurring charges. The Company believes that FFO is a meaningful supplemental measure of its operating performance because historical cost accounting for real estate assets in accordance with GAAP implicitly assumes that the value of real estate assets diminishes predictably over time, as reflected through depreciation and amortization expenses. However, since real estate values have historically risen or fallen with market and other conditions, many industry investors and analysts have considered presentation of operating results for real estate companies that use historical cost accounting to be insufficient. Thus, NAREIT created FFO as a supplemental measure of operating performance for real estate investment trusts that excludes historical cost depreciation and amortization, among other items, from net income, as defined by GAAP. The Company believes that the use of FFO, combined with the required GAAP presentations, has been beneficial in improving the understanding of operating results of real estate investment trusts among the investing public and making comparisons of operating results among such companies more meaningful. FFO as reported by Parkway may not be comparable to FFO reported by other REITs that do not define the term in accordance with the current NAREIT definition. Funds from operations do not represent cash generated from operating activities in accordance with accounting principles
generally accepted in the United States and is not an indication of cash available to fund cash needs. Funds from operations should not be considered an alternative to net income as an indicator of the Company's operating performance or as an alternative to cash flow as a measure of liquidity.
The following is a reconciliation of FFO and net income (loss) attributable to common stockholders for office properties and total consolidated entities for the years ending December 31, 2010, 2009 and 2008. Amounts presented as “Unallocated and Other” represent primarily income and expense associated with providing management services, corporate general and administration expense, interest expense on unsecured lines of credit and preferred dividends.
| | At or for the year ended December 31, 2010 |
| | Office | Unallocated | |
| | Properties | and Other | Consolidated |
| | (in thousands) |
| | | | |
| Income from office and parking properties (a) | $ | 254,611 | $ | - | $ | 254,611 |
| Management company income | - | 1,652 | 1,652 |
| Property operating expenses (b) | (117,935) | - | (117,935) |
| Depreciation and amortization | (92,190) | - | (92,190) |
| Management company expenses | - | (3,961) | (3,961) |
| General and administrative expenses | - | (7,382) | (7,382) |
| Other income | - | 1,487 | 1,487 |
| Equity in earnings of unconsolidated joint ventures | 326 | - | 326 |
| Gain on involuntary conversion | 40 | - | 40 |
| Interest expense (c) | (48,632) | (6,015) | (54,647) |
| Adjustment for noncontrolling interest - real estate partnerships | 10,789 | - | 10,789 |
| Income from discontinued operations | 194 | - | 194 |
| Gain on sale of real estate from discontinued operations | 8,518 | - | 8,518 |
| Impairment loss on real estate | (4,120) | - | (4,120) |
| Dividends on preferred stock | - | (6,325) | (6,325) |
| Net income (loss) attributable to common stockholders | 11,601 | (20,544) | (8,943) |
| | | | |
| Depreciation and amortization | 92,190 | - | 92,190 |
| Depreciation and amortization - discontinued operations | 121 | - | 121 |
| Depreciation and amortization - noncontrolling interest - real estate partnerships | (17,668) | - | (17,668) |
| Adjustment for depreciation and amortization - unconsolidated joint ventures | 342 | - | 342 |
| Gain on sale of real estate | (8,518) | - | (8,518) |
| Funds from operations attributable to common stockholders | $ | 78,068 | $ | (20,544) | $ | 57,524 |
| | | | |
| Total assets | $ | 1,590,546 | $ | 13,136 | $ | 1,603,682 |
| | | | |
| Office and parking properties | $ | 1,389,767 | $ | - | $ | 1,389,767 |
| | | | |
| Investment in unconsolidated joint ventures | $ | 2,892 | $ | - | $ | 2,892 |
| | | | |
| Capital expenditures (d) | $ | 49,760 | $ | - | $ | 49,760 |
| |
| (a) Included in income from office and parking properties are rental revenues, customer reimbursements, parking income and other income. |
| |
| (b) Included in property operating expenses are real estate taxes, insurance, contract services, repairs and maintenance and property operating expenses. |
| |
| (c) Interest expense for office properties represents interest expense on property secured mortgage debt. It does not include interest expense on the Company’s credit facility, which is included in “Unallocated and Other”. |
| |
| (d) Capital expenditures include building improvements, tenant improvements and deferred leasing costs. |
| | At or for the year ended December 31, 2009 |
| | Office | Unallocated | |
| | Properties | and Other | Consolidated |
| | (in thousands) |
| | | | |
| Income from office and parking properties (a) | $ | 262,951 | $ | - | $ | 262,951 |
| Management company income | - | 1,870 | 1,870 |
| Property operating expenses (b) | (126,343) | - | (126,343) |
| Depreciation and amortization | (92,126) | - | (92,126) |
| Management company expenses | - | (2,299) | (2,299) |
| General and administrative expenses | - | (6,108) | (6,108) |
| Other income | - | 1,609 | 1,609 |
| Equity in earnings of unconsolidated joint ventures | 445 | - | 445 |
| Gain on involuntary conversion | 823 | - | 823 |
| Gain on sale of real estate | 470 | - | 470 |
| Interest expense (c) | (48,474) | (6,570) | (55,044) |
| Adjustment for noncontrolling interest - real estate partnerships | 10,562 | - | 10,562 |
| Income from discontinued operations | 404 | - | 404 |
| Other-than-temporary impairment loss on investment in | | | |
| unconsolidated joint ventures | (8,817) | - | (8,817) |
| Dividends on preferred stock | - | (4,800) | (4,800) |
| Net loss attributable to common stockholders | (105) | (16,298) | (16,403) |
| | | | |
| Depreciation and amortization | 92,126 | - | 92,126 |
| Depreciation and amortization - discontinued operations | 600 | - | 600 |
| Depreciation and amortization - noncontrolling interest - real estate partnerships | (20,138) | - | (20,138) |
| Adjustment for depreciation and amortization - unconsolidated joint ventures | 848 | - | 848 |
| Gain on sale of real estate | (470) | - | (470) |
| Funds from operations attributable to common stockholders | $ | 72,861 | $ | (16,298) | $ | 56,563 |
| | | | |
| Total assets | $ | 1,597,316 | $ | 14,830 | $ | 1,612,146 |
| | | | |
| Office and parking properties | $ | 1,401,890 | $ | - | $ | 1,401,890 |
| | | | |
| Investment in unconsolidated joint ventures | $ | 2,512 | $ | - | $ | 2,512 |
| | | | |
| Capital expenditures (d) | $ | 44,768 | $ | - | $ | 44,768 |
| |
| (a) Included in income from office and parking properties are rental revenues, customer reimbursements, parking income and other income. |
| |
| (b) Included in property operating expenses are real estate taxes, insurance, contract services, repairs and maintenance and other property operating expenses. |
| |
| (c) Interest expense for office properties represents interest expense on property secured mortgage debt. It does not include interest expense on the Company’s credit facility, which is included in “Unallocated and Other”. |
| |
| (d) Capital expenditures include building improvements, tenant improvements and deferred leasing costs. |
| | At or for the year ended December 31, 2008 |
| | Office | Unallocated | |
| | Properties | and Other | Consolidated |
| | (in thousands) |
| | | | |
| Income from office and parking properties (a) | $ | 260,229 | $ | - | $ | 260,229 |
| Management company income | - | 1,936 | 1,936 |
| Property operating expenses (b) | (124,409) | - | (124,409) |
| Depreciation and amortization | (91,224) | - | (91,224) |
| Management company expenses | - | (1,947) | (1,947) |
| General and administrative expenses | - | (9,725) | (9,725) |
| Other income | - | 1,332 | 1,332 |
| Equity in earnings of unconsolidated joint ventures | 894 | - | 894 |
| Interest expense (c) | (47,874) | (10,892) | (58,766) |
| Adjustment for noncontrolling interest - real estate partnerships | 11,369 | - | 11,369 |
| Income from discontinued operations | (461) | - | (461) |
| Gain on sale of real estate from discontinued operations | 22,588 | - | 22,588 |
| Impairment loss on real estate | (2,542) | - | (2,542) |
| Dividends on preferred stock | - | (4,800) | (4,800) |
| Net income (loss) attributable to common stockholders | 28,570 | (24,096) | 4,474 |
| | | | |
| Depreciation and amortization | 91,224 | - | 91,224 |
| Depreciation and amortization - discontinued operations | 2,365 | - | 2,365 |
| Depreciation and amortization - noncontrolling interest - real estate partnerships | (20,644) | - | (20,644) |
| Adjustment for depreciation and amortization - unconsolidated joint ventures | 750 | - | 750 |
| Gain on sale of real estate | (22,588) | - | (22,588) |
| Funds from operations attributable to common stock holders | $ | 79,677 | $ | (24,096) | $ | 55,581 |
| | | | |
| Total assets | $ | 1,671,459 | $ | 16,396 | $ | 1,687,855 |
| | | | |
| Office and parking properties | $ | 1,455,239 | $ | - | $ | 1,455,239 |
| | | | |
| Investment in unconsolidated joint ventures | $ | 11,057 | $ | - | $ | 11,057 |
| | | | |
| Capital expenditures (d) | $ | 40,654 | $ | - | $ | 40,654 |
| |
| (a) Included in income from office and parking properties are rental revenues, customer reimbursements, parking income and other income. |
| |
| (b) Included in property operating expenses are real estate taxes, insurance, contract services, repairs and maintenance and other property operating expenses. |
| |
| (c) Interest expense for office properties represents interest expense on property secured mortgage debt. It does not include interest expense on the Company’s credit facility, which is included in “Unallocated and Other”. |
| |
| (d) Capital expenditures include building improvements, tenant improvements and deferred leasing costs. |
Note O - Selected Quarterly Financial Data (Unaudited):
Summarized quarterly financial data for the years ended December 31, 2010 and 2009 are as follows (in thousands, except per share data):
| | 2010 |
| | First | | Second | | Third | | Fourth |
| | | | | | | | |
| Revenues (other than gains) | $ | 69,321 | | $ | 62,472 | | $ | 62,152 | | $ | 62,318 |
| Expenses | (56,325) | | (53,557) | | (53,133) | | (62,573) |
| Operating income (loss) | 12,996 | | 8,915 | | 9,019 | | (255) |
| Interest and other income | 385 | | 365 | | 355 | | 382 |
| Interest expense | (13,695) | | (13,687) | | (13,669) | | (13,596) |
| Equity in earnings of unconsolidated joint ventures | 105 | | 87 | | 61 | | 73 |
| Gain on involuntary conversion | - | | - | | 40 | | - |
| Loss from continuing operations | (209) | | (4,320) | | (4,194) | | (13,396) |
| Income from discontinued operations | 165 | | 23 | | 6 | | - |
| Gain on sale of real estate from discontinued operations | - | | 8,518 | | - | | - |
| Net income (loss) | (44) | | 4,221 | | (4,188) | | (13,396) |
| Noncontrolling interest - real estate partnerships | 2,587 | | 2,638 | | 2,356 | | 3,208 |
| Net income (loss) attributable to Parkway Properties, Inc. | 2,543 | | 6,859 | | (1,832) | | (10,188) |
| Dividends on preferred stock | (1,200) | | (1,200) | | (1,737) | | (2,188) |
| Net income (loss) attributable to common stockholders | $ | 1,343 | | $ | 5,659 | | $ | (3,569) | | $ | (12,376) |
| | | | | | | | |
| Net income (loss) per common share: | | | | | | | |
| Basic: | | | | | | | |
| Income (loss) from continuing operations attributable to | | | | | | | |
| Parkway Properties, Inc. | $ | 0.05 | | $ | (0.14) | | $ | (0.17) | | $ | (0.58) |
| Discontinued operations | 0.01 | | 0.40 | | - | | - |
| Basic net income (loss) attributable to Parkway Properties, Inc. | $ | 0.06 | | $ | 0.26 | | $ | (0.17) | | $ | (0.58) |
| Diluted: | | | | | | | |
| Income (loss) from continuing operations attributable to | | | | | | | |
| Parkway Properties, Inc. | $ | 0.05 | | $ | (0.14) | | $ | (0.17) | | $ | (0.58) |
| Discontinued operations | 0.01 | | 0.40 | | - | | - |
| Diluted net income (loss) attributable to Parkway Properties, Inc. | $ | 0.06 | | $ | 0.26 | | $ | (0.17) | | $ | (0.58) |
| Dividends per common Share | $ | 0.075 | | $ | 0.075 | | $ | 0.075 | | $ | 0.075 |
| Weighted average shares outstanding: | | | | | | | |
| Basic | 21,390 | | 21,410 | | 21,438 | | 21,443 |
| Diluted | 21,509 | | 21,515 | | 21,438 | | 21,443 |
| | | | | | | | |
| | | | | | | | |
| | |
| | 2009 |
| | First | | Second | | Third | | Fourth |
| Revenues (other than gains) | $ | 67,340 | | $ | 66,399 | | $ | 65,957 | | $ | 65,125 |
| Expenses | (59,006) | | (54,679) | | (56,772) | | (56,419) |
| Operating income | 8,334 | | 11,720 | | 9,185 | | 8,706 |
| Interest and other income | 302 | | 309 | | 672 | | 326 |
| Interest expense | (13,890) | | (13,888) | | (13,672) | | (13,594) |
| Equity in earnings (loss) of unconsolidated joint ventures | 200 | | 227 | | 48 | | (30) |
| Gain (loss) on sale of real estate | (70) | | 540 | | - | | - |
| Gain on involuntary conversion | 463 | | 279 | | - | | 81 |
| Other-than-temporary impairment loss on investment in | | | | | | | |
| unconsolidated joint ventures | - | | - | | - | | (8,817) |
| Loss from continuing operations | (4,661) | | (813) | | (3,767) | | (13,328) |
| Income from discontinued operations | 108 | | 96 | | 105 | | 95 |
| Gain on sale of real estate from discontinued operations | - | | - | | - | | - |
| Net loss | (4,553) | | (717) | | (3,662) | | (13,233) |
| Noncontrolling interest - real estate partnerships | 3,764 | | 1,637 | | 2,107 | | 3,054 |
| Net income (loss) attributable Parkway Properties, Inc. | (789) | | 920 | | (1,555) | | (10,179) |
| Dividends on preferred stock | (1,200) | | (1,200) | | (1,200) | | (1,200) |
| Net loss attributable to common stockholders | $ | (1,989) | | $ | (280) | | $ | (2,755) | | $ | (11,379) |
| | | | | | | | |
| Net loss per common share: | | | | | | | |
| Basic: | | | | | | | |
| Loss from continuing operations attributable to | | | | | | | |
| Parkway Properties, Inc. | $ | (0.14) | | $ | (0.02) | | $ | (0.13) | | $ | (0.53) |
| Discontinued operations | 0.01 | | 0.01 | | - | | - |
| Basic net loss attributable to Parkway Properties, Inc. | $ | (0.13) | | $ | (0.01) | | $ | (0.13) | | $ | (0.53) |
| Diluted: | | | | | | | |
| Loss from continuing operations attributable to | | | | | | | |
| Parkway Properties, Inc. | $ | (0.14) | | $ | (0.02) | | $ | (0.13) | | $ | (0.53) |
| Discontinued operations | 0.01 | | 0.01 | | - | | - |
| Diluted net loss attributable to Parkway Properties, Inc. | $ | (0.13) | | $ | (0.01) | | $ | (0.13) | | $ | (0.53) |
| Dividends per common share | $ | 0.325 | | $ | 0.325 | | $ | 0.325 | | $ | 0.325 |
| Weighted average shares outstanding: | | | | | | | |
| Basic | 15,043 | | 19,457 | | 21,313 | | 21,315 |
| Diluted | 15,043 | | 19,457 | | 21,313 | | 21,315 |
SCHEDULE II – VALUATIONS AND QUALIFYING ACCOUNTS
(In thousands)
| | Balance | Additions | Deductions | Balance |
| | Beginning | Charged to | Written Off as | End |
| Description | of Year | Cost & Expenses | Uncollectible | of Year |
| | | | | |
| Allowance for Doubtful Accounts: | | | |
| Year Ended: | | | | |
| December 31, 2010 | $ | 2,951 | $ | 1,223 | $ | (1,364) | $ | 2,810 |
| December 31, 2009 | 1,122 | 2,957 | (1,128) | 2,951 |
| December 31, 2008 | 1,004 | 1,871 | (1,753) | 1,122 |
SCHEDULE III – REAL ESTATE AND ACCUMULATED DEPRECIATION DECEMBER 31, 2010 (In thousands) |
| | | | | |
| | | Initial Cost to the Company | Subsequent | |
| | | | Building and | Capitalized | Total |
| Description | Encumbrances | Land | Improvements | Costs | Real Estate |
| Office and Parking Properties: | | | | | |
| Arizona | | | | | |
| Desert Ridge Corporate Center | $ | 49,200 | $ | - | $ | 60,642 | $ | 5,078 | $ | 65,720 |
| Squaw Peak Corporate Center | - | 5,800 | 35,144 | 5,568 | 46,512 |
| Mesa Corporate Center | - | 3,353 | 15,243 | 1,212 | 19,808 |
| Florida | | | | | |
| Hillsboro Center V | 9,943 | 1,325 | 12,249 | 3,176 | 16,750 |
| Hillsboro Center I-IV | 6,779 | 1,129 | 7,734 | 1,873 | 10,736 |
| Bellsouth Building | 8,027 | 3,477 | 7,826 | 1,674 | 12,977 |
| Centurion Centre | 6,373 | 2,951 | 6,013 | 1,147 | 10,111 |
| Stein Mart Building | 11,935 | 1,653 | 16,636 | 4,401 | 22,690 |
| Riverplace South | - | 2,316 | 5,412 | 2,451 | 10,179 |
| Maitland 100 | 8,798 | 2,667 | 10,162 | 2,333 | 15,162 |
| 555 Winderley Place | 8,320 | 2,100 | 9,459 | 1,463 | 13,022 |
| Gateway Center | 33,000 | 14,281 | 35,035 | 3,666 | 52,982 |
| Citrus Center | 22,820 | 4,000 | 26,712 | 7,833 | 38,545 |
| Georgia | | | | | |
| 100 Ashford Center | 15,087 | 6,258 | 15,599 | 2,839 | 24,696 |
| Peachtree Ridge | 15,177 | 2,203 | 19,534 | 2,286 | 24,023 |
| Overlook II | 31,500 | 5,393 | 33,851 | 2,892 | 42,136 |
| Falls Pointe | - | 1,512 | 3,092 | 1,128 | 5,732 |
| Lakewood II | - | 1,195 | 642 | 197 | 2,034 |
| Waterstone | - | 859 | 7,207 | 2,045 | 10,111 |
| Meridian | - | 994 | 9,547 | 3,251 | 13,792 |
| Peachtree Dunwoody Pavilion | 28,473 | 9,373 | 24,579 | 5,847 | 39,799 |
| Capital City Plaza | 34,617 | 3,625 | 57,218 | 5,253 | 66,096 |
| Illinois | | | | | |
| Chatham Centre | 17,100 | 3,358 | 20,064 | 4,519 | 27,941 |
| US Cellular Plaza | 58,564 | 10,010 | 66,389 | 16,478 | 92,877 |
| 233 North Michigan | 86,711 | 18,181 | 133,552 | 25,484 | 177,217 |
| 111 East Wacker | 148,500 | 23,285 | 123,804 | 55,957 | 203,046 |
| Mississippi | | | | | |
| One Jackson Place | - | 1,799 | 19,730 | 5,567 | 27,096 |
| City Centre | - | 1,707 | 19,935 | 10,446 | 32,088 |
| 111 Capitol Building | - | 915 | 10,830 | 4,243 | 15,988 |
| The Pinnacle at Jackson Place | 29,501 | 1,275 | 36,994 | 7,558 | 45,827 |
| Parking at Jackson Place | - | - | 4,129 | 3,763 | 7,892 |
| North Carolina | | | | | |
| Carmel Crossing | - | 4,541 | 13,698 | 2,902 | 21,141 |
| South Carolina | | | | | |
| Tower at 1301 Gervais | - | 237 | 10,124 | 10,316 | 20,677 |
| Atrium at Stoneridge | - | 506 | 5,041 | 1,909 | 7,456 |
| Tennessee | | | | | |
| Renaissance Center | 16,000 | 4,255 | 29,727 | 2,424 | 36,406 |
| Forum II & III | - | 2,634 | 13,886 | 3,113 | 19,633 |
| Morgan Keegan Tower | 12,578 | - | 36,549 | 4,281 | 40,830 |
| Falls Building | - | - | 7,628 | 3,067 | 10,695 |
| Moore Building | - | 190 | 22,718 | 88 | 22,996 |
| Toyota Garage | - | 727 | 7,939 | 253 | 8,919 |
| Forum I | 10,194 | 4,737 | 12,485 | 2,382 | 19,604 |
| Bank of America Plaza | 16,939 | 1,464 | 28,712 | 10,592 | 40,768 |
| Texas | | | | | |
| 1401 Enclave | 28,000 | 5,160 | 36,015 | 3,079 | 44,254 |
| 400 North Belt | - | 419 | 10,022 | 3,787 | 14,228 |
| Woodbranch | - | 303 | 3,805 | 2,507 | 6,615 |
| Sugar Grove | - | 364 | 7,515 | 3,635 | 11,514 |
| Honeywell | - | 856 | 15,235 | 3,541 | 19,632 |
| Schlumberger | - | 1,013 | 11,102 | 4,128 | 16,243 |
| One Commerce Green | 18,982 | 489 | 37,307 | 5,218 | 43,014 |
| Comerica Bank Building | 13,558 | 1,921 | 21,222 | 2,668 | 25,811 |
SCHEDULE III – REAL ESTATE AND ACCUMULATED DEPRECIATION - (Continued) DECEMBER 31, 2010 (In thousands) |
| | | | | |
| | | Initial Cost to the Company | Subsequent | |
| | | | Building and | Capitalized | Total |
| Description | Encumbrances | Land | Improvements | Costs | Real Estate |
| Office and Parking Properties: | | | | | |
| Texas (con’t) | | | | | |
| 550 Greens Parkway | - | 1,006 | 8,061 | 416 | 9,483 |
| 5300 Memorial Building | 11,635 | 682 | 11,744 | 2,667 | 15,093 |
| Town and Country | 6,608 | 436 | 8,205 | 3,143 | 11,784 |
| Wells Fargo | 8,616 | 2,600 | 8,264 | 2,974 | 13,838 |
| Virginia | | | | | |
| Greenbrier Towers I & II | - | 1,157 | 14,857 | 5,677 | 21,691 |
| Glen Forest | - | 483 | 5,189 | 2,346 | 8,018 |
| Moorefield II | - | 469 | 4,752 | 1,286 | 6,507 |
| Moorefield III | - | 490 | 5,135 | 1,629 | 7,254 |
| Boulders Center | - | 1,265 | 11,825 | 4,346 | 17,436 |
| Winchester Building | - | 956 | 10,852 | 3,016 | 14,824 |
| Moorefield I | - | 260 | 3,698 | 1,403 | 5,361 |
| | 773,535 | 176,614 | 1,278,275 | 300,421 | 1,755,310 |
| Real Estate Development: | | | | | |
| Mississippi | | | | | |
| Land Held for Development | - | 609 | - | - | 609 |
| Total Real Estate Owned | $ | 773,535 | $ | 177,223 | $ | 1,278,275 | $ | 300,421 | $ | 1,755,919 |
SCHEDULE III – REAL ESTATE AND ACCUMULATED DEPRECIATION – (Continued) DECEMBER 31, 2010 (In thousands) |
| | | | | | | |
| | Gross Amount at Which | | | | | |
| | Carried at Close of Period | | | | | |
| | | Bldg. and | | Accum. | Net Book Value | Year | Year | Depreciable |
| Description | Land | Imprv. | Total | Depr. | of Real Estate | Acquired | Constructed | Lives (Yrs.) |
| Office and Parking Properties: | | | | | | | | |
| Arizona | | | | | | | | |
| Desert Ridge Corporate Center | $ | - | $ | 65,720 | $ | 65,720 | $ | 6,910 | $ | 58,810 | 2008 | 2006/2007 | (3) |
| Squaw Peak Corporate Center | 5,800 | 40,712 | 46,512 | 8,553 | 37,959 | 2004 | 1999/2000 | (3) |
| Mesa Corporate Center | 3,353 | 16,455 | 19,808 | 2,554 | 17,254 | 2005 | 2000 | (3) |
| Florida | | | | | | | | |
| Hillsboro Center V | 1,325 | 15,425 | 16,750 | 5,643 | 11,107 | 1998 | 1985 | (3) |
| Hillsboro Center I-IV | 1,129 | 9,607 | 10,736 | 3,320 | 7,416 | 1998 | 1985 | (3) |
| Bellsouth Building | 3,477 | 9,500 | 12,977 | 2,377 | 10,600 | 2006 | 1996 | (3) |
| Centurion Centre | 2,951 | 7,160 | 10,111 | 1,629 | 8,482 | 2006 | 1993 | (3) |
| Stein Mart Building | 1,653 | 21,037 | 22,690 | 4,806 | 17,884 | 2005 | 1985 | (3) |
| Riverplace South | 2,316 | 7,863 | 10,179 | 2,245 | 7,934 | 2005 | 1981 | (3) |
| Maitland 100 | 2,667 | 12,495 | 15,162 | 2,768 | 12,394 | 2005 | 1981 | (3) |
| 555 Winderley Place | 2,100 | 10,922 | 13,022 | 1,920 | 11,102 | 2005 | 1985 | (3) |
| Gateway Center | 14,281 | 38,701 | 52,982 | 3,813 | 49,169 | 2008 | 1989 | (3) |
| Citrus Center | 4,000 | 34,545 | 38,545 | 8,303 | 30,242 | 2003 | 1971 | (3) |
| Georgia | | | | | | | | |
| 100 Ashford Center | 6,258 | 18,438 | 24,696 | 2,679 | 22,017 | 2006 | 1987 | (3) |
| Peachtree Ridge | 2,203 | 21,820 | 24,023 | 3,013 | 21,010 | 2006 | 1986 | (3) |
| Overlook II | 5,393 | 36,743 | 42,136 | 4,945 | 37,191 | 2006 | 1985 | (3) |
| Falls Pointe | 1,512 | 4,220 | 5,732 | 46 | 5,686 | 2010 | 1990 | (3) |
| Lakewood II | 1,195 | 839 | 2,034 | 11 | 2,023 | 2010 | 1986 | (3) |
| Waterstone | 859 | 9,252 | 10,111 | 4,063 | 6,048 | 1995 | 1987 | (3) |
| Meridian | 994 | 12,798 | 13,792 | 4,875 | 8,917 | 1997 | 1985 | (3) |
| Peachtree Dunwoody Pavilion | 9,373 | 30,426 | 39,799 | 8,427 | 31,372 | 2003 | 1976/1980 | (3) |
| Capital City Plaza | 3,625 | 62,471 | 66,096 | 11,331 | 54,765 | 2004 | 1989 | (3) |
| Illinois | | | | | | | | |
| Chatham Centre | 3,358 | 24,583 | 27,941 | 4,826 | 23,115 | 2006 | 1989 | (3) |
| US Cellular Plaza | 10,010 | 82,867 | 92,877 | 12,391 | 80,486 | 2008 | (2)1980/1982/2006 | (3) |
| 233 North Michigan | 18,181 | 159,036 | 177,217 | 37,362 | 139,855 | 2005 | 1972 | (3) |
| 111 East Wacker | 23,285 | 179,761 | 203,046 | 38,760 | 164,286 | 2006 | 1970 | (3) |
| Mississippi | | | | | | | | |
| One Jackson Place | 1,799 | 25,297 | 27,096 | 12,630 | 14,466 | 1986 | 1986 | (3) |
| City Centre | 1,707 | 30,381 | 32,088 | 13,212 | 18,876 | 1995 | (2)1987/2005 | (3) |
| 111 Capitol Building | 915 | 15,073 | 15,988 | 5,042 | 10,946 | 1998 | 1983 | (3) |
| The Pinnacle at Jackson Place | 1,275 | 44,552 | 45,827 | 3,456 | 42,371 | 2008 | 2008 | (3) |
| Parking at Jackson Place | - | 7,892 | 7,892 | 842 | 7,050 | 2007 | 1980 | (3) |
| North Carolina | | | | | | | | |
| Carmel Crossing | 4,541 | 16,600 | 21,141 | 112 | 21,029 | 2010 | 1990/1997/1998 | (3) |
| South Carolina | | | | | | | | |
| Tower at 1301 Gervais | 237 | 20,440 | 20,677 | 3,167 | 17,510 | 1997 | 1973 | (3) |
| Atrium at Stoneridge | 506 | 6,950 | 7,456 | 1,178 | 6,278 | 1998 | 1986 | (3) |
| Tennessee | | | | | | | | |
| Renaissance Center | 4,255 | 32,151 | 36,406 | 4,284 | 32,122 | 2006 | 2000 | (3) |
| Forum II & III | 2,634 | 16,999 | 19,633 | 6,576 | 13,057 | 1997 | 1985 | (3) |
| Morgan Keegan Tower | - | 40,830 | 40,830 | 14,172 | 26,658 | 1997 | 1985 | (3) |
| Falls Building | - | 10,695 | 10,695 | 3,620 | 7,075 | 1998 | (2)1982/1984/1990 | (3) |
| Moore Building | 190 | 22,806 | 22,996 | 6,223 | 16,773 | 2000 | 2000 | (3) |
| Toyota Garage | 727 | 8,192 | 8,919 | 2,277 | 6,642 | 2000 | 2000 | (3) |
| Forum I | 4,737 | 14,867 | 19,604 | 3,102 | 16,502 | 2005 | 1982 | (3) |
| Bank of America Plaza | 1,464 | 39,304 | 40,768 | 11,036 | 29,732 | 2001 | 1977 | (3) |
| Texas | | | | | | | | |
| 1401 Enclave | 5,160 | 39,094 | 44,254 | 4,671 | 39,583 | 2007 | 1999 | (3) |
| 400 North Belt | 419 | 13,809 | 14,228 | 3,988 | 10,240 | 1996 | 1982 | (3) |
| Woodbranch | 303 | 6,312 | 6,615 | 2,632 | 3,983 | 1996 | 1982 | (3) |
| Sugar Grove | 364 | 11,150 | 11,514 | 4,447 | 7,067 | 1997 | 1982 | (3) |
| Honeywell | 856 | 18,776 | 19,632 | 6,294 | 13,338 | 1997 | 1983 | (3) |
| Schlumberger | 1,013 | 15,230 | 16,243 | 6,636 | 9,607 | 1998 | 1983 | (3) |
| One Commerce Green | 489 | 42,525 | 43,014 | 14,965 | 28,049 | 1998 | 1983 | (3) |
| Comerica Bank Building | 1,921 | 23,890 | 25,811 | 8,363 | 17,448 | 1998 | 1983 | (3) |
SCHEDULE III – REAL ESTATE AND ACCUMULATED DEPRECIATION – (Continued) DECEMBER 31, 2010 (In thousands) |
| | Gross Amount at Which | | | | | | |
| | Carried at Close of Period | | | | | | |
| | | Bldg. and | | Accum. | Net Book Value | Year | Year | Depreciable | |
| Description | Land | Imprv. | Total | Depr. | Of Real Estate | Acquired | Constructed | Lives (Yrs.) | |
| Office and Parking Properties: | | | | | | | | | |
| Texas (con’t) | | | | | | | | | |
| 550 Greens Parkway | 1,006 | 8,477 | 9,483 | 2,159 | 7,324 | 2001 | 1999 | (3) | |
| 5300 Memorial Building | 682 | 14,411 | 15,093 | 3,946 | 11,147 | 2002 | 1982 | (3) | |
| Town and Country | 436 | 11,348 | 11,784 | 2,825 | 8,959 | 2002 | 1982 | (3) | |
| Wells Fargo | 2,600 | 11,238 | 13,838 | 2,478 | 11,360 | 2003 | 1978 | (3) | |
| Virginia | | | | | | | | | |
| Greenbrier Towers I & II | 1,157 | 20,534 | 21,691 | 7,538 | 14,153 | 1997 | 1985/1987 | (3) | |
| Glen Forest | 483 | 7,535 | 8,018 | 841 | 7,177 | 1998 | 1985 | (3) | |
| Moorefield II | 469 | 6,038 | 6,507 | 1,960 | 4,547 | 1998 | 1985 | (3) | |
| Moorefield III | 490 | 6,764 | 7,254 | 2,309 | 4,945 | 1998 | 1985 | (3) | |
| Boulders Center | 1,265 | 16,171 | 17,436 | 5,108 | 12,328 | 1998 | 1986 | (3) | |
| Winchester Building | 956 | 13,868 | 14,824 | 4,879 | 9,945 | 1998 | 1987 | (3) | |
| Moorefield I | 260 | 5,101 | 5,361 | 1,614 | 3,747 | 1999 | 1984 | (3) | |
| | 176,614 | 1,578,696 | 1,755,310 | 366,152 | 1,389,158 | | | | |
| Real Estate Development: | | | | | | | | | |
| Mississippi | | | | | | | | | |
| Land Held for Development | 609 | - | 609 | - | 609 | | | | |
| Total Real Estate Owned | $ | 177,223 | $ | 1,578,696 | $ | 1,755,919 | $ | 366,152 | $ | 1,389,767 | | | | |
| (1) The aggregate cost for federal income tax purposes was approximately $1.9 billion. |
(2) The dates of major renovations. |
(3) Depreciation of buildings and improvements is calculated over lives ranging from the life of the lease to 40 years. |
NOTE TO SCHEDULE III
At December 31, 2010, 2009 and 2008
(In thousands)
A summary of activity for real estate and accumulated depreciation is as follows:
| | December 31 |
| | 2010 | | 2009 | | 2008 |
| Real Estate: | | | | | |
| Office and Parking Properties: | | | | | |
| Balance at beginning of year | $ | 1,738,649 | | $ | 1,738,158 | | $ | 1,566,393 |
| Additions: | | | | | |
| Acquisitions and improvements | 64,968 | | 27,370 | | 241,851 |
| Office property development | - | | 1,498 | | 29,686 |
| Cost of real estate sold or disposed | (47,698) | | (28,377) | | (99,772) |
| Balance at close of year | $ | 1,755,919 | | $ | 1,738,649 | | $ | 1,738,158 |
| | | | | | |
| Accumulated Depreciation: | | | | | |
| Balance at beginning of year | $ | 336,759 | | $ | 282,919 | | $ | 251,791 |
| Depreciation expense | 67,553 | | 67,077 | | 65,213 |
| Depreciation expense - discontinued operations | 94 | | 475 | | 2,058 |
| Real estate sold or disposed | (38,254) | | (13,712) | | (36,143) |
| Balance at close of year | $ | 366,152 | | $ | 336,759 | | $ | 282,919 |
| SCHEDULE IV - MORTGAGE LOANS ON REAL ESTATE |
| DECEMBER 31, 2010 |
| (In thousands) |
| | | | | | | | Principal |
| | | | | | | | Amount of |
| | | Final | Periodic | | Face | Carrying | Loan Subject to |
| | Interest | Maturity | Payment | Prior | Amount of | Amount of | Delinquent Principal |
| Description | Rate | Date | Term | Liens | Mortgage | Mortgage (4) | and Interest |
| 2100 Ross Avenue (1) | 6.065% | May 2012 | Interest only (2) | None | $ | 10,000 | $8,836 | $ | - |
| One Park Ten | 7.250% | June 2012 | Interest only (3) | None | | 1,500 | 1,500 | | - |
| | | | | | | | |
| (1) This is a B participation piece of first mortgage secured by an 844,000 square foot office building in Dallas, Texas. |
| (2) The note requires interest only payments until maturity, at which time a principal payment of $10.0 million will be due. |
| (3) The note requires interest only payments until maturity, at which time a principal payment of $1.5 million will be due. |
| (4) The cost for federal tax purposes is $8.4 million. |
NOTE TO SCHEDULE IV At December 31, 2010, 2009 and 2008 (In thousands) |
| |
| | December 31 |
| | 2010 | | 2009 | | 2008 |
| Balance at beginning of year | $ | 8,126 | | $ | 7,519 | | $ | 7,001 |
| Additions: | | | | | |
| New Mortgage Loan | 1,500 | | - | | - |
| Amortization of discount | 710 | | 607 | | 518 |
| Balance at end of year | $ | 10,336 | | $ | 8,126 | | $ | 7,519 |
Item 9. Changes in and Disagreements with Accountants on Accounting and Financial Disclosure.
None.
Item 9A. Controls and Procedures.
The Company’s management, with the participation of the Company’s Chief Executive Officer and Chief Financial Officer, has evaluated the effectiveness of Parkway’s disclosure controls and procedures at December 31, 2010. Based on that evaluation, the Company’s Chief Executive Officer and Chief Financial Officer concluded that Parkway’s disclosure controls and procedures were effective at December 31, 2010. There were no changes in the Company’s internal control over financial reporting during the fourth quarter of 2010 that has materially affected, or is reasonably likely to affect, the Company’s internal control over financial reporting.
The Company’s internal control system was designed to provide reasonable assurance to the Company’s management and Board of Directors regarding the preparation and fair presentation of published financial statements. All internal control systems, no matter how well designed, have inherent limitations. Therefore, even those systems determined to be effective can provide only reasonable assurance with respect to the financial statement preparation and presentation.
Management’s Report on Internal Control Over Financial Reporting
The Company’s management, with the participation of the Company’s Chief Executive Officer and Chief Financial Officer, is responsible for establishing and maintaining adequate internal control over financial reporting. The Company’s management has assessed the effectiveness of the Company’s internal control over financial reporting at December 31, 2010. In making this assessment, we used the criteria set forth by the Committee of Sponsoring Organizations of the Treadway Commission (COSO) in Internal Control – Integrated Framework. Based on our assessment we have concluded that, at December 31, 2010, the Company’s internal control over financial reporting is effective based on those criteria. Our independent registered public accounting firm, KPMG LLP, has provided an audit report on the Company’s internal control over financial reporting at December 31, 2010.
REPORT OF INDEPENDENT REGISTERED PUBLIC ACCOUNTING FIRM
THE BOARD OF DIRECTORS AND SHAREHOLDERS
PARKWAY PROPERTIES, INC.:
We have audited Parkway Properties, Inc.’s internal control over financial reporting as of December 31, 2010, based on the criteria established in Internal Control – Integrated Framework issued by the Committee of Sponsoring Organizations of the Treadway Commission (COSO). Parkway Properties, Inc.’s management is responsible for maintaining effective internal control over financial reporting and for its assessment of the effectiveness of internal control over financial reporting, included in the accompanying Management’s Report on Internal Control over Financial Reporting. Our responsibility is to express an opinion on the Company’s internal control over financial reporting based on our audit.
We conducted our audit in accordance with the standards of the Public Company Accounting Oversight Board (United States). Those standards require that we plan and perform the audit to obtain reasonable assurance about whether effective internal control over financial reporting was maintained in all material respects. Our audit included obtaining an understanding of internal control over financial reporting, assessing the risk that a material weakness exists, and testing and evaluating the design and operating effectiveness of internal control based on the assessed risk. Our audit also included performing such other procedures as we considered necessary in the circumstances. We believe that our audit provides a reasonable basis for our opinion.
A company’s internal control over financial reporting is a process designed to provide reasonable assurance regarding the reliability of financial reporting and the preparation of financial statements for external purposes in accordance with generally accepted accounting principles. A company’s internal control over financial reporting includes those policies and procedures that (1) pertain to the maintenance of records that, in reasonable detail, accurately and fairly reflect the transactions and dispositions of the assets of the company; (2) provide reasonable assurance that transactions are recorded as necessary to permit preparation of financial statements in accordance with generally accepted accounting principles, and that receipts and expenditures of the company are being made only in accordance with authorizations of management and directors of the company; and (3) provide reasonable assurance regarding prevention or timely detection of unauthorized acquisition, use, or disposition of the company’s assets that could have a material effect on the financial statements.
Because of its inherent limitations, internal control over financial reporting may not prevent or detect misstatements. Also, projections of any evaluation of effectiveness to future periods are subject to the risk that controls may become inadequate because of changes in conditions, or that the degree of compliance with the policies or procedures may deteriorate.
In our opinion, Parkway Properties, Inc. maintained, in all material respects, effective internal control over financial reporting as of December 31, 2010, based on the criteria established in Internal Control – Integrated Framework issued by the Committee of Sponsoring Organizations of the Treadway Commission.
We also have audited, in accordance with the standards of the Public Company Accounting Oversight Board (United States), the consolidated balance sheets of Parkway Properties, Inc. and subsidiaries as of December 31, 2010 and 2009, and the related consolidated statements of operations, changes in equity, and cash flows for each of the years in the three-year period ended December 31, 2010, and our report dated March 4, 2011, expressed an unqualified opinion on those consolidated financial statements.
/s/ KPMG LLP
Jackson, Mississippi
March 4, 2011
Item 9B. Other Information.
None.
PART III
Item 10. Directors, Executive Officers and Corporate Governance.
The information regarding directors is incorporated herein by reference from the section entitled "Proposal One: Election of Director − Nominees" in the Company's definitive Proxy Statement (“2011 Proxy Statement”) to be filed pursuant to Regulation 14A of the Securities Exchange Act of 1934, as amended, for the Company's Annual Meeting of Stockholders to be held on May 12, 2011. The 2011 Proxy Statement will be filed within 120 days after the end of the Company's fiscal year ended December 31, 2010.
The information regarding executive officers is incorporated herein by reference from the section entitled "Proposal 1: Election of Directors − Executive Officers" in the Company's 2011 Proxy Statement.
The information regarding compliance with Section 16(a) of the Securities Exchange Act of 1934 is incorporated herein by reference from the section entitled "Proposal 1: Election of Directors − Section 16(a) Beneficial Ownership Reporting Compliance" in the Company's 2011 Proxy Statement.
Information regarding the Company's code of business conduct and ethics found in the subsection captioned "Available Information" in Item 1 of Part I hereof is also incorporated herein by reference into this Item 10.
The information regarding the Company's audit committee, its members and the audit committee financial experts is incorporated by reference herein from the second paragraph in the section entitled "Proposal 1: Election of Directors − Board Committees and Meetings; Director Education" in the Company's 2011 Proxy Statement.
Item 11. Executive Compensation.
The information included under the following captions in the Company's 2011 Proxy Statement is incorporated herein by reference: "Proposal 1: Election of Directors − Compensation Discussion and Analysis, − Summary Compensation Table, − 2010 Grants of Plan-Based Awards, − Outstanding Equity Awards at 2010 Fiscal Year-End, − 2010 Option Exercises and Stock Vested, − Potential Payments upon Change in Control, − Compensation of Directors and − Compensation Committee Interlocks." The information included under the heading "Proposal 1: Election of Directors − Compensation Committee Report" in the Company's 2011 Proxy Statement is incorporated herein by reference; however, this information shall not be deemed to be "soliciting material" or to be "filed" with the SEC or subject to Regulation 14A or 14C, or to the liabilities of Section 18 of the Securities Exchange Act of 1934, as amended.
Item 12. Security Ownership of Certain Beneficial Owners and Management and Related Stockholder Matters.
Information regarding security ownership of certain beneficial owners and management is incorporated herein by reference from the sections entitled "Security Ownership of Certain Beneficial Owners," "Proposal 1: Election of Directors − Security Ownership of Management and Directors" in the Company's 2011 Proxy Statement.
Equity Compensation Plans
The following table sets forth the securities authorized for issuance under Parkway's equity compensation plans at December 31, 2010:
| | | | (c) |
| | | | Number of securities |
| | | | remaining available for |
| | (a) | (b) | future issuance under |
| | Number of securities to | Weighted-average | equity compensation |
| | be issued upon exercise | exercise price of | plans (excluding |
| | of outstanding options, | outstanding options, | securities reflected in |
| Plan category | warrants and rights | warrants and rights | column (a)) |
| Equity compensation plans | | | |
| approved by security | | | |
| holders | 55,101 | $25.64 | 235,861 |
| | | | |
| Equity compensation plans | | | |
| not approved by security | | | |
| holders | - | - | - |
| | | | |
| Total | 55,101 | $25.64 | 235,861 |
Item 13. Certain Relationships and Related Transactions, and Director Independence.
The information regarding transactions with related persons and director independence is incorporated herein by reference from the sections entitled “Independence” and “Certain Transactions and Relationships” in the Company's 2011 Proxy Statement.
Item 14. Principal Accountant Fees and Services.
The information regarding principal auditor fees and services is incorporated herein by reference from the section entitled “Proposal 2: Ratification of Independent Accountants” in the Company's 2011 Proxy Statement.
PART IV
Item 15. Exhibits and Financial Statement Schedules.
(a) 1 Consolidated Financial Statements
Report of Independent Registered Public Accounting Firm
Consolidated Balance Sheets at December 31, 2010 and 2009
Consolidated Statements of Operations for the years ended December 31, 2010, 2009 and 2008
Consolidated Statements of Changes in Equity for the years ended December 31, 2010, 2009 and 2008
Consolidated Statements of Cash Flows for the years ended December 31, 2010, 2009 and 2008
Notes to Consolidated Financial Statements
| 2 | Consolidated Financial Statement Schedules |
Schedule II – Valuations and Qualifying AccountsSchedule III – Real Estate and Accumulated Depreciation
Note to Schedule III
Schedule IV – Mortgage Loans on Real Estate
Note to Schedule IV
| | All other schedules for which provision is made in the applicable accounting regulation of the Securities and Exchange Commission are not required under the related instructions or are inapplicable and therefore have been omitted. |
| 3 | Form 10-K Exhibits required by Item 601 of Regulation S-K: |
| Exhibit | |
| No. | Description |
| 3.1 | Articles of Incorporation, as amended, of the Company (incorporated by reference to Exhibit B to the Company's proxy material for its July 18, 1996 Annual Meeting). |
| 3.2 | Bylaws of the Company, as amended through August 5, 2010 (incorporated by reference to Exhibit 3.1 to the Company’s Form 8-K filed on August 6, 2010). |
| 3.3 | Articles Supplementary creating the Company’s 8.00% Series D Cumulative Redeemable Preferred Stock (incorporated by reference to Exhibit 4 to the Company’s Form 8-A filed May 29, 2003). |
| 3.4 | Articles Supplementary reclassifying and designating an additional 1,974,896 shares of common stock as 8.00% Series D Cumulative Redeemable Preferred Stock (incorporated by reference to Exhibit 3 to the Company’s Form 8-K filed August 12, 2010). |
| 10 | Material Contracts (*Denotes management contract or compensatory plan or arrangement): |
| 10.1 | Amended and Restated Agreement of Limited Partnership of Parkway Properties LP (incorporated by reference to Exhibit 99(a) to the Company's Form 8-K filed July 15, 1998). |
| 10.2 | Amendment to Exhibit A dated August 9, 2010 of the Amended and Restated Agreement of Limited Partnership of Parkway Properties LP (incorporated by reference to Exhibit 10 to the Company’s Form 8-K filed August 12, 2010). |
| 10.3 | Limited Partnership Agreement of Parkway Properties Office Fund, L.P. by and among PKY Fund, LLC, Parkway Properties L.P. and PERS Holding Company Limited, L.L.C. (incorporated by reference to Exhibit 10 to the Company's Form 8-K filed July 7, 2005). |
| 10.4 | First Amendment to Limited Partnership Agreement of Parkway Properties Office Fund, L. P. by and among, PKY Fund, LLC, Parkway Properties LP and PERS Holding Company Limited, L.L.C. (incorporated by reference to Exhibit 10.14 to the Company’s Form 10-K for the year ended December 31, 2007). |
| 10.5 | Second Amendment to Limited Partnership Agreement of Parkway Properties Office Fund, L. P. by and among, PKY Fund, LLC, Parkway Properties LP and PERS Holding Company Limited, L.L.C. (incorporated by reference to Exhibit 10.15 to the Company’s Form 10-K for the year ended December 31, 2007). |
| 10.6 | Limited Partnership Agreement of Parkway Properties Office Fund II, L.P. by and among PPOF II, LLC, Parkway Properties, LP and Teacher Retirement System of Texas (incorporated by reference to Exhibit 10 to the Company’s Form 8-K filed May 19, 2008). |
| 10.7 | Promissory Note between Parkway Properties LP and Teachers Insurance and Annuity Association of America (incorporated by reference to Exhibit 10.1 to the Company's Form 8-K filed December 22, 2005). |
| 10.8 | Form of Deed of Trust, Assignment of Leases and Rents, Security Agreement and Fixture Filing by and between Parkway Properties LP as borrower and Jack Edelbrock as trustee for the benefit of Teachers Insurance and Annuity Association of America as lender (incorporated by reference to Exhibit 10.2 to the Company's Form 8-K filed December 22, 2005). |
| 10.9 | Indenture of Mortgage, Security Agreement Financing Statement Fixture Filing and Assignment of Leases, Rents and Security Deposits dated June 22, 2001 made by Parkway 233 North Michigan, LLC to German American Capital Corporation (incorporated by reference to Exhibit 4(a) to the Company's Form 8-K filed July 3, 2001). |
| 10.10 | Promissory Note made as of June 22, 2001 by Parkway 233 North Michigan, LLC in favor of German American Capital Corporation (incorporated by reference to Exhibit 4(a) to the Company's Form 8-K filed July 3, 2001). |
| 10.11 | Mortgage, Security Agreement, Assignment of Rents and Fixture Filing by 111 East Wacker LLC to Wachovia Bank, National Association (incorporated by reference to Exhibit 10.4 to the Company’s Form 8-K filed July 14, 2006). |
| 10.12 | Promissory Note by 111 East Wacker LLC to Wachovia Bank, National Association (incorporated by reference to Exhibit 10.5 to the Company’s Form 8-K filed July 14, 2006). |
| 10.13 | Credit Agreement by and among Parkway Properties LP, a Delaware limited partnership; Parkway Properties, Inc., a Maryland corporation; Wells Fargo Securities, LLC and J.P. Morgan Securities LLC, as Joint Lead Arrangers and Joint Bookrunners; Wells Fargo Bank, N.A., as Administration Agent; JPMorgan Chase Bank, N.A., as Syndication Agent; PNC Bank, N.A., Bank of America, N.A., and U.S. Bank, N.A., as Documentation Agents; and the Lenders dated January 31, 2011 (incorporated by reference to Exhibit 10 to the Company’s Form 8-K filed January 31, 2011). |
| 10.14* | Parkway Properties, Inc. 1994 Stock Option and Long-Term Incentive Plan (incorporated by reference to Appendix A to the Company’s proxy material for its June 3, 1999 Annual Meeting). |
| 10.15* | Parkway Properties, Inc. 2001 Non-employee Directors Equity Compensation Plan, as amended (incorporated by reference to Exhibit 10.5 to the Company’s Form 10-K for the year ended December 31, 2006). |
| 10.16* | Parkway Properties, Inc. 2003 Equity Incentive Plan, as amended (incorporated by reference to Exhibit 10.6 to the Company’s Form 10-K for the year ended December 31, 2006). |
| 10.17* | Parkway Properties, Inc. Amended and Restated 2010 Omnibus Equity Incentive Plan (incorporated by reference to Exhibit 10.1 to the Company’s Form 8-K filed May 18, 2010) |
| 10.18* | Parkway Properties, Inc. 2006 Employee Stock Purchase Plan, as amended (incorporated by reference to Exhibit 10.1 to the Company’s Form 8-K filed August 24, 2006). |
| 10.19* | Adoption Agreement for the Executive Nonqualifed Excess Plan (incorporated by reference to Exhibit 10.25 to the Company’s Form 10-K for the year ended December 31, 2006). |
| 10.20* | Appendix to Adoption Agreement for Parkway Properties, Inc Deferred Compensation Plan, as amended (incorporated by reference to Exhibit 10.26 to the Company’s Form 10-K for the year ended December 31, 2006). |
| 10.21* | Form of Incentive Restricted Share Agreement for Time-Based Awards (incorporated by reference to Exhibit 10.2 to the Company’s Form 8-K filed June 29, 2006). |
| 10.22* | Form of Incentive Restricted Share Agreement for 2009 Long-Term Equity Compensation Program (incorporated by reference to Exhibit 10 to the Company’s Form 8-K filed February 4, 2009). |
| 10.23* | Form of Restricted Share Agreement for FOCUS Plan Time-Based Awards (incorporated by reference to Exhibit 10.1 to the Company’s Form 8-K filed on July 15, 2010). |
| 10.24* | Form of Restricted Share Agreement for FOCUS Plan Performance-Based Awards (Absolute Return Goal) (incorporated by reference to Exhibit 10.2 to the Company’s Form 8-K filed on July 15, 2010). |
| 10.25* | Form of Restricted Share Agreement for FOCUS Plan Performance-Based Awards (Relative Return Goal) (incorporated by reference to Exhibit 10.3 to the Company’s Form 8-K filed on July 15, 2010). |
| 10.26* | Parkway Properties, Inc. FOCUS Plan Long-Term Cash Incentive (incorporated by reference to Exhibit 10.4 to the Company’s Form 8-K filed on July 15, 2010). |
| 10.27* | Parkway Properties, Inc. FOCUS Plan Long-Term Cash Incentive Participation Agreement (incorporated by reference to Exhibit 10.5 to the Company’s Form 8-K filed on July 15, 2010) |
| 10.28* | Performance measures for the Company's 2011 non-equity incentive awards for executive officers of the Company (a written description thereof is set forth in Item 5.02 of the Company’s Form 8-K filed February 16, 2011). |
| 10.29* | Form of Change in Control Agreement with each of the Company’s Executive Officers (the Change in Control Agreements are identical in substance for each of the Named Executive Officers, and provide for a multiple of “2.99” in calculating the severance payment under each officer's Agreement) (incorporated by reference to Exhibit 10.1 to the Company’s Form 8-K filed May 14, 2008). |
| 10.30 | Equity Distribution Agreement, dated as of December 23, 2009, among the Company, Parkway Properties LP and Wells Fargo Securities, LLC (incorporated by reference to Exhibit 1.1 to the Company’s Form 8-K filed December 28, 2009). |
| 10.31 | Equity Distribution Agreement, dated as of December 23, 2009, among the Company, Parkway Properties LP and Merrill Lynch, Pierce, Fenner & Smith Incorporated (incorporated by reference to Exhibit 1.2 to the Company’s Form 8-K filed December 28, 2009). |
| 10.32 | Equity Distribution Agreement, dated as of December 23, 2009, among the Company, Parkway Properties LP and J.P. Morgan Securities Inc (incorporated by reference to Exhibit 1.3 to the Company’s Form 8-K filed December 28, 2009). |
| 10.33 | Equity Distribution Agreement, dated as of December 23, 2009, among the Company, Parkway Properties LP and Morgan Keegan & Company, Inc (incorporated by reference to Exhibit 1.4 to the Company’s Form 8-K filed December 28, 2009). |
| 21 | Subsidiaries of the Company (filed herewith). |
| 23.1 | Consent of KPMG LLP (filed herewith). |
| 31.1 | Certification of Chief Executive Officer pursuant to Section 302 of the Sarbanes-Oxley Act of 2002. |
| 31.2 | Certification of Chief Financial Officer pursuant to Section 302 of the Sarbanes-Oxley Act of 2002. |
| 32.1 | Certification of Chief Executive Officer pursuant to Section 906 of the Sarbanes-Oxley Act of 2002. |
| 32.2 | Certification of Chief Financial Officer pursuant to Section 906 of the Sarbanes-Oxley Act of 2002. |
SIGNATURES
Pursuant to the requirements of Section 13 or 15(d) of the Securities Exchange Act of 1934, the Registrant has duly caused this report to be signed on its behalf by the undersigned, thereunto duly authorized.
| | |
| | PARKWAY PROPERTIES, INC. |
| | Registrant |
| | |
| | |
| | /s/ Steven G. Rogers |
| | Steven G. Rogers |
| | President, Chief Executive |
| | Officer and Director |
| | March 4, 2011 |
| | |
| | |
| | /s/ Richard G. Hickson IV |
| | Richard G. Hickson IV |
| | Executive Vice President and Chief Financial Officer |
| | March 4, 2011 |
| | |
| | |
| | /s/ Mandy M. Pope |
| | Mandy M. Pope |
| | Executive Vice President and Chief Accounting Officer |
| | March 4, 2011 |
Pursuant to the requirements of the Securities Exchange Act of 1934, this report has been signed below by the following persons on behalf of the Registrant and in the capacities and on the dates indicated.
| | | |
| /s/ Charles T. Cannada | | /s/ Steven G. Rogers |
| Charles T. Cannada, Director | | Steven G. Rogers |
| March 4, 2011 | | President, Chief Executive Officer and Director |
| | | March 4, 2011 |
| | | |
| /s/ Laurie L. Dotter | | /s/ Leland R. Speed |
| Laurie L. Dotter, Director | | Leland R. Speed |
| March 4, 2011 | | Chairman of the Board and Director |
| | | March 4, 2011 |
| | | |
| /s/ Daniel P. Friedman | | /s/ Troy A. Stovall |
| Daniel P. Friedman, Director | | Troy A. Stovall, Director |
| March 4, 2011 | | March 4, 2011 |
| | | |
| | | |
| /s/ Michael J. Lipsey | | /s/ Lenore M. Sullivan |
| Michael J. Lipsey, Director | | Lenore M. Sullivan, Director |
| March 4, 2011 | | March 4, 2011 |
| | | |
| | | |
| /s/ Brenda J. Mixson | | |
| Brenda J. Mixson, Director | | |
| March 4, 2011 | | |