Exhibit 99.2
Exhibit 99.2
Investor Presentation
May 3, 2012
Forward-Looking Statements
Certain statements in this release that are not in the present or past tense or discuss the Company’s expectations (including the use of the words anticipate, believe, forecast, intends, expects, project, or similar expressions) are forward-looking statements within the meaning of the federal securities laws and as such are based upon the Company’s current belief as to the outcome and timing of future events. Examples of forward-looking statements include projected net operating income, cap rates, internal rates of return, future dividend payment rates, forecasts of FFO accretion, projected capital improvements, expected sources of financing, expectations as to the timing of closing of acquisitions, or dispositions, or other transactions, including the proposed purchase of the Hearst Tower and the TPG equity investment, and descriptions relating to these expectations. There can be no assurance that future developments affecting the Company will be those anticipated by the Company. These forward-looking statements involve risks and uncertainties (some of which are beyond the control of the Company) and are subject to change based upon various factors, including but not limited to the following risks and uncertainties: changes in the real estate industry and in performance of the financial markets; the demand for and market acceptance of the Company’s properties for rental purposes; the amount and growth of the Company’s expenses; tenant financial difficulties and general economic conditions, including interest rates, as well as economic conditions in those areas where the Company owns properties; risks associated with joint venture partners; the risks associated with the ownership and development of real property; the failure of the TPG transaction to close; the failure to acquire or sell properties (including Hearst Tower) as and when anticipated; termination of property management contracts; the bankruptcy or insolvency of companies for which Parkway provides property management services or the sale of these properties; the outcome of claims and litigation involving or affecting the Company; the ability to satisfy conditions necessary to close pending transactions; and other risks and uncertainties detailed from time to time in the Company’s SEC filings. Should one or more of these risks or uncertainties occur, or should underlying assumptions prove incorrect, the Company’ s business, financial condition, liquidity, cash flows and results could differ materially from those expressed in the forward-looking statements. Any forward looking statements speaks only as of the date on which it is made. New risks and uncertainties arise over time, and it is not possible for us to predict the occurrence of those matters or the manner in which they may affect us. The Company does not undertake to update forward-looking statements except as may be required by law. Neither the common stock nor the Series E Convertible Preferred Stock to be issued in the investment transaction described herein, nor the common units into which the Series E Convertible Preferred Stock may become convertible, have been registered under the Securities Act of 1933, as amended, and they may not be offered or sold in the United States absent a registration statement or exemption from registration.
Key Highlights
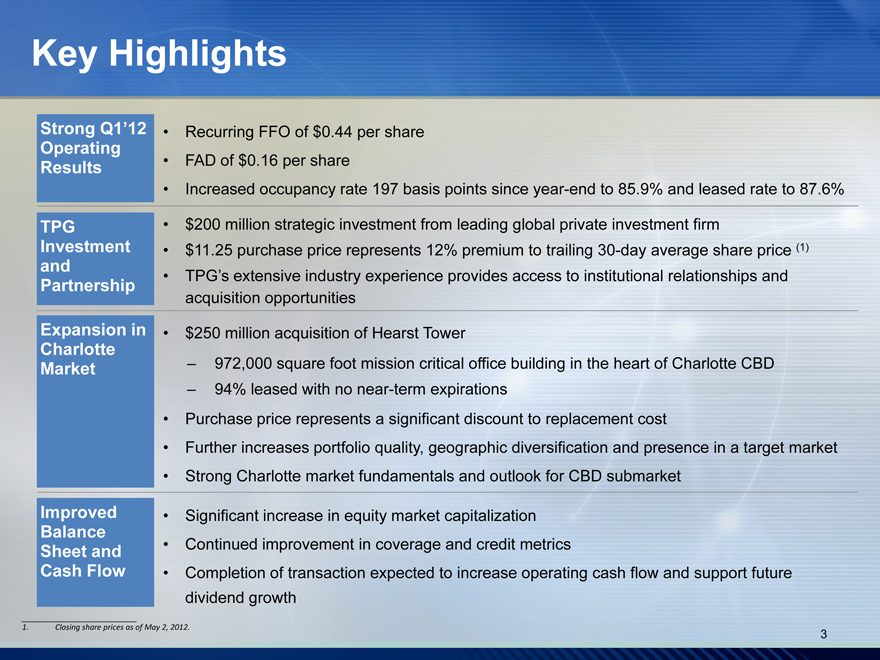
Strong Q1’12 Operating Results
TPG Investment and Partnership
Expansion in Charlotte Market
Improved Balance Sheet and Cash Flow
Recurring FFO of $0.44 per share FAD of $0.16 per share
Increased occupancy rate 197 basis points since year-end to 85.9% and leased rate to 87.6%
$200 million strategic investment from leading global private investment firm $11.25 purchase price represents 12% premium to trailing 30-day average share price (1) TPG’s extensive industry experience provides access to institutional relationships and acquisition opportunities
$250 million acquisition of Hearst Tower
– 972,000 square foot mission critical office building in the heart of Charlotte CBD
– 94% leased with no near-term expirations
Purchase price represents a significant discount to replacement cost
Further increases portfolio quality, geographic diversification and presence in a target market Strong Charlotte market fundamentals and outlook for CBD submarket
Significant increase in equity market capitalization Continued improvement in coverage and credit metrics
Completion of transaction expected to increase operating cash flow and support future dividend growth
Closing share prices as of May 2, 2012.
Transaction Benefits and Rationale
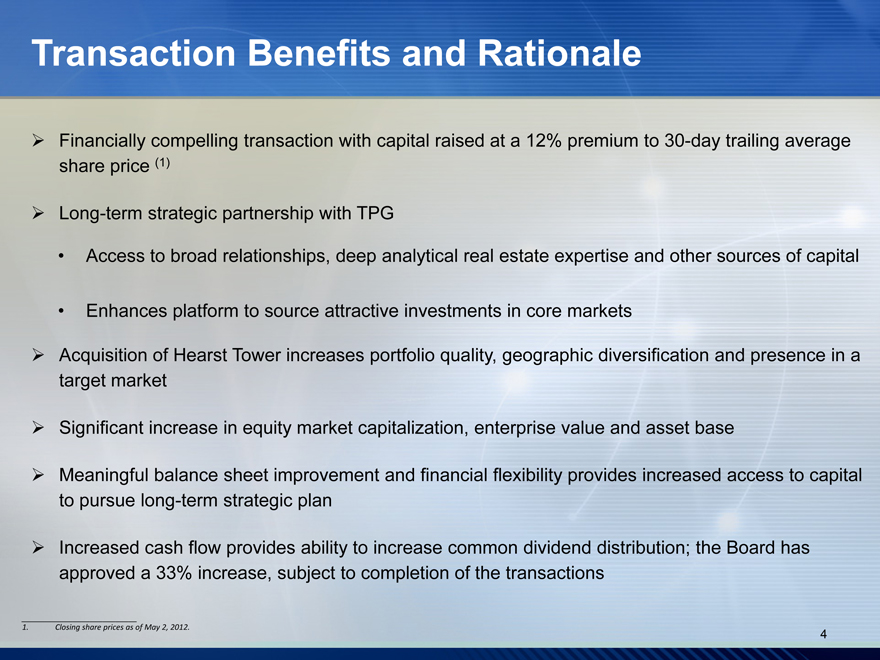
Financially compelling transaction with capital raised at a 12% premium to 30-day trailing average share price (1)
Long-term strategic partnership with TPG
Access to broad relationships, deep analytical real estate expertise and other sources of capital
Enhances platform to source attractive investments in core markets
Acquisition of Hearst Tower increases portfolio quality, geographic diversification and presence in a target market
Significant increase in equity market capitalization, enterprise value and asset base
Meaningful balance sheet improvement and financial flexibility provides increased access to capital to pursue long-term strategic plan
Increased cash flow provides ability to increase common dividend distribution; the Board has approved a 33% increase, subject to completion of the transactions
1. Closing share prices as of May 2, 2012.
Overview of TPG
A leading private investment firm founded in 1992, based in Fort Worth, Texas with 17 global offices and $49 billion of assets under management Long history of both value investing and backing highly accomplished management teams of world-class franchises, such as Neiman Marcus, J.Crew, Continental Airlines, Burger King, Univision, Hotwire, Beringer Wines and Petco
Successful track record of taking minority stakes in public companies; recent investments include Armstrong World Industries and Copano Energy Extensive experience in real estate investing dating back to the early 1990s Recent investments in the sector include:
$2.7 billion acquisition of a portfolio of construction loans and real estate owned assets previously owned by Corus Bank and now called ST Residential $505 million acquisition of Catellus, a former subsidiary of ProLogis, which includes high-quality retail centers and key development properties in the Western U.S. $955 million acquisition of Taylor Morrison, the ninth largest homebuilder in North America, which owns and controls approximately 30,000 lots

TPG Investment Terms
Investment $200 million investment at $11.25 per share
Summary Structured at closing as common stock and preferred stock
– 4.3 million shares of common stock ($48.4 million)
– ~13.5 million shares of Series E Convertible Preferred Stock ($151.6 million), convertible upon stockholder approval
TPG ownership of approximately 43% on an as-converted basis
Series Series E E Convertible into common stock on a one-for-one basis immediately upon shareholder approval Convertible Convertible Dividend Rate: – Equivalent to common dividend for months 1 to 6 Preferred Preferred – 8% for months 7 to 12; 12% for year 2; Stock Stock 15% thereafter (in the event shareholder approval is not obtained)
Call / Put Rights: – TPG can redeem anytime after year 5 at greater of (i) liquidation preference or
(ii) stock price appreciation mechanism
– PKY can call anytime between years 1 and 2 at liquidation preference plus a make whole amount
– TPG can redeem upon a change of control transaction at liquidation preference plus a make whole amount
GovernanceGovernance 4 independent directors appointed by TPG to a 9 member board; 2 TPG directors appointed to each board committee
TPG board and committee representation reduces if ownership decreases below certain thresholds
Timing Closing subject to customary closing conditions; expected to close in Q2 2012
Shareholder vote on conversion of preferred stock within 180 days of closing
6
Hearst Tower Acquisition
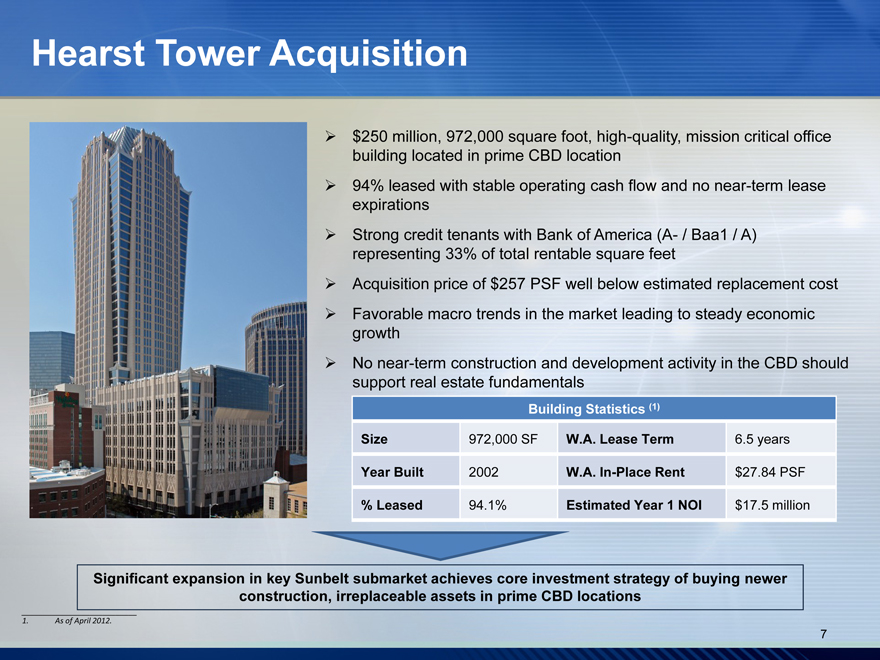
$250 million, 972,000 square foot, high-quality, mission critical office building located in prime CBD location
94% leased with stable operating cash flow and no near-term lease expirations Strong credit tenants with Bank of America (A- / Baa1 / A) representing 33% of total rentable square feet
Acquisition price of $257 PSF well below estimated replacement cost
Favorable macro trends in the market leading to steady economic growth No near-term construction and development activity in the CBD should support real estate fundamentals
Building Statistics (1)
Size 972,000 SF W.A. Lease Term 6.5 years
Year Built 2002 W.A. In-Place Rent $27.84 PSF
% Leased 94.1% Estimated Year 1 NOI $17.5 million
Significant expansion in key Sunbelt submarket achieves core investment strategy of buying newer construction, irreplaceable assets in prime CBD locations
1. As of April 2012.
Charlotte Macroeconomic Fundamentals
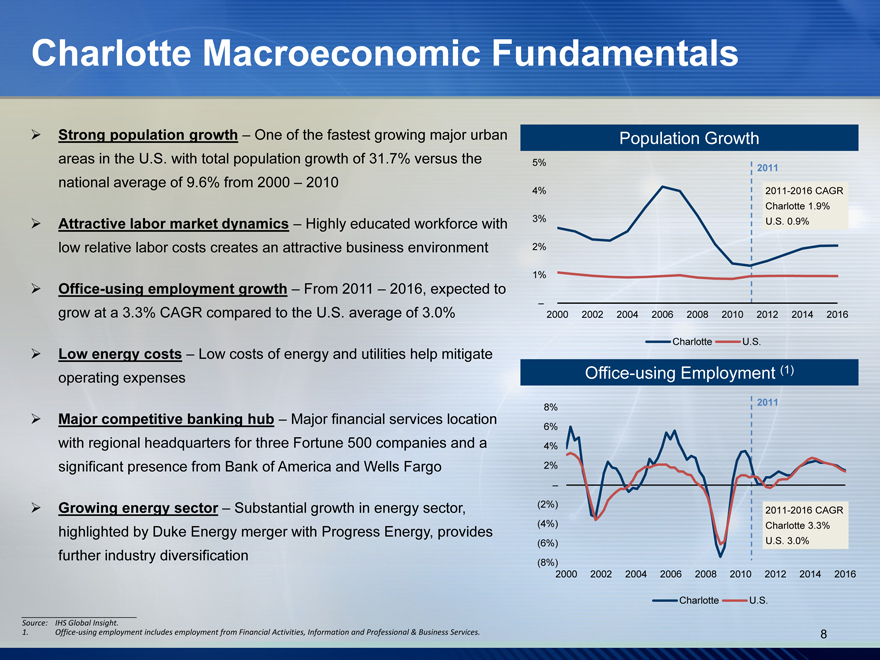
Strong population growth – One of the fastest growing major urban areas in the U.S. with total population growth of 31.7% versus the national average of 9.6% from 2000 – 2010
Attractive labor market dynamics – Highly educated workforce with low relative labor costs creates an attractive business environment
Office-using employment growth – From 2011 – 2016, expected to grow at a 3.3% CAGR compared to the U.S. average of 3.0%
Low energy costs – Low costs of energy and utilities help mitigate operating expenses
Major competitive banking hub – Major financial services location with regional headquarters for three Fortune 500 companies and a significant presence from Bank of America and Wells Fargo
Growing energy sector – Substantial growth in energy sector, highlighted by Duke Energy merger with Progress Energy, provides further industry diversification
Source: IHS Global Insight.
1. Office-using employment includes employment from Financial Activities, Information and Professional & Business Services.
Population Growth
5% 2011
4% 2011-2016 CAGR
Charlotte 1.9%
3% U.S. 0.9%
2%
1%
–
2000 2002 2004 2006 2008 2010 2012 2014 2016
Charlotte U.S.
Office-using Employment (1)
8% 2011
6%
4%
2%
–
(2%) 2011-2016 CAGR
(4%) Charlotte 3.3%
(6%) U.S. 3.0%
(8%)
2000 2002 2004 2006 2008 2010 2012 2014 2016
Charlotte U.S.
Charlotte CBD Office Market Fundamentals
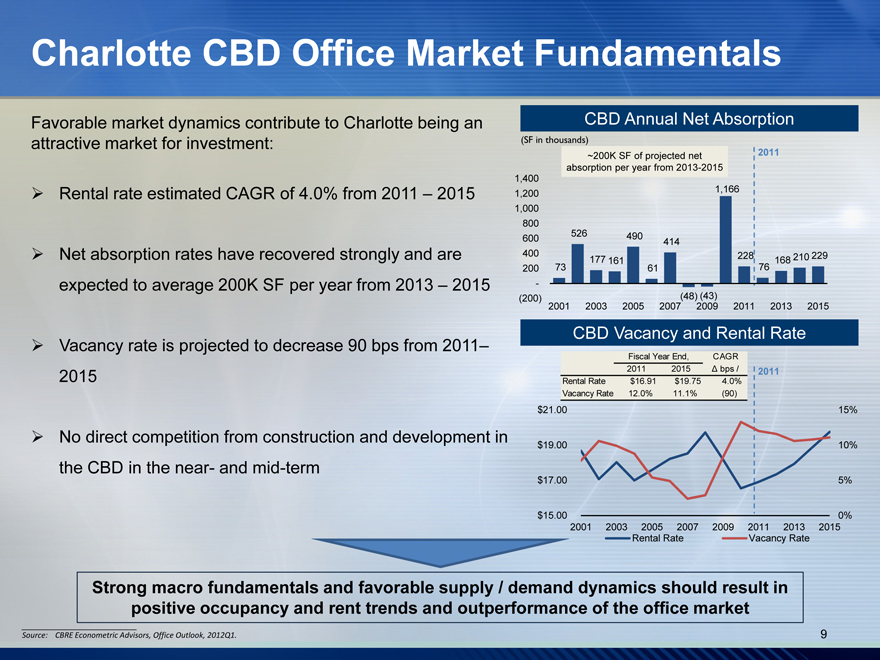
Favorable market dynamics contribute to Charlotte being an attractive market for investment:
Rental rate estimated CAGR of 4.0% from 2011 – 2015
Net absorption rates have recovered strongly and are expected to average 200K SF per year from 2013 – 2015
Vacancy rate is projected to decrease 90 bps from 2011–2015
No direct competition from construction and development in the CBD in the near- and mid-term
CBD Annual Net Absorption
(SF in thousands)
~200K SF of projected net 2011
absorption per year from 2013-2015
1,400
1,200 1,166
1,000
800
600 526 490 414
400 177 161 228 168 210 229
200 73 61 76
-
(200)(48) (43)
2001 2003 2005 2007 2009 2011 2013 2015
CBD Vacancy and Rental Rate
Fiscal Year End, CAGR
2011 2015 ?bps / 2011
Rental Rate $16.91 $19.75 4.0%
Vacancy Rate 12.0% 11.1%(90)
$17.00 5%
$15.00 0%
2001 2003 2005 2007 2009 2011 2013 2015
Rental Rate Vacancy Rate
Strong macro fundamentals and favorable supply / demand dynamics should result in positive occupancy and rent trends and outperformance of the office market
Source: CBRE Econometric Advisors, Office Outlook, 2012Q1.
9
Geographically Diversified Portfolio
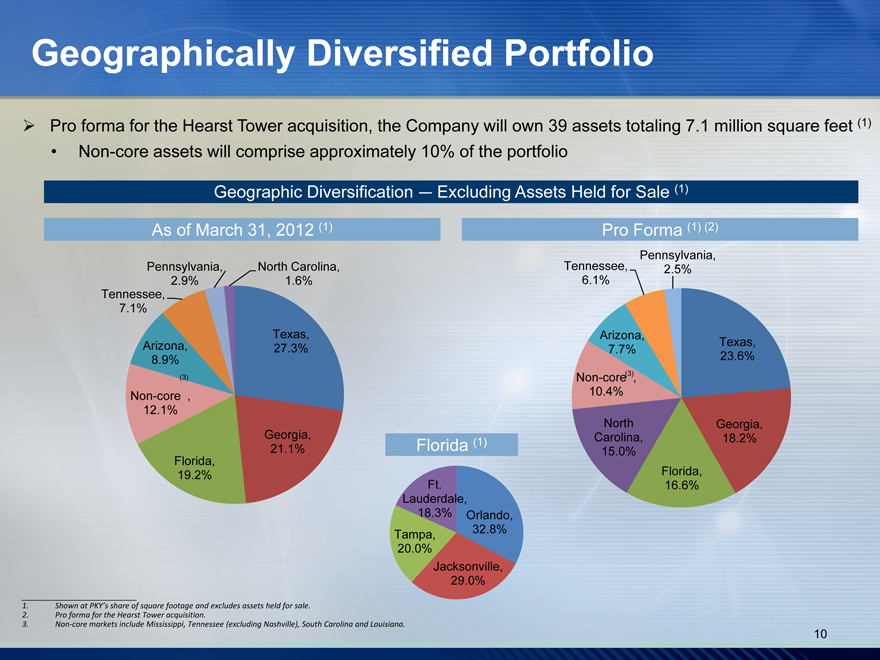
Pro forma for the Hearst Tower acquisition, the Company will own 39 assets totaling 7.1 million square feet (1)
Non-core assets will comprise approximately 10% of the portfolio
Geographic Diversification — Excluding Assets Held for Sale (1)
As of March 31, 2012 (1) Pro Forma (1) (2)
Pennsylvania, North Carolina, Tennessee, Pennsylvania, 2.9% 1.6% 6.1% 2.5% Tennessee, 7.1%
Texas, Arizona,
Arizona, Texas, 27.3% 7.7% 8.9% 23.6%
(3)
(3) Non-core , Non-core , 10.4% 12.1%
Georgia, North Georgia, 21.1% Florida (1) Carolina, 18.2% 15.0% Florida, 19.2% Florida, Ft. 16.6% Lauderdale, 18.3% Orlando, Tampa, 32.8% 20.0% Jacksonville, 29.0%
1. Shown at PKY’s share of square footage and excludes assets held for sale.
2. Pro forma for the Hearst Tower acquisition.
3. Non-core markets include Mississippi, Tennessee (excluding Nashville), South Carolina and Louisiana. 10
Strong Customer Profile
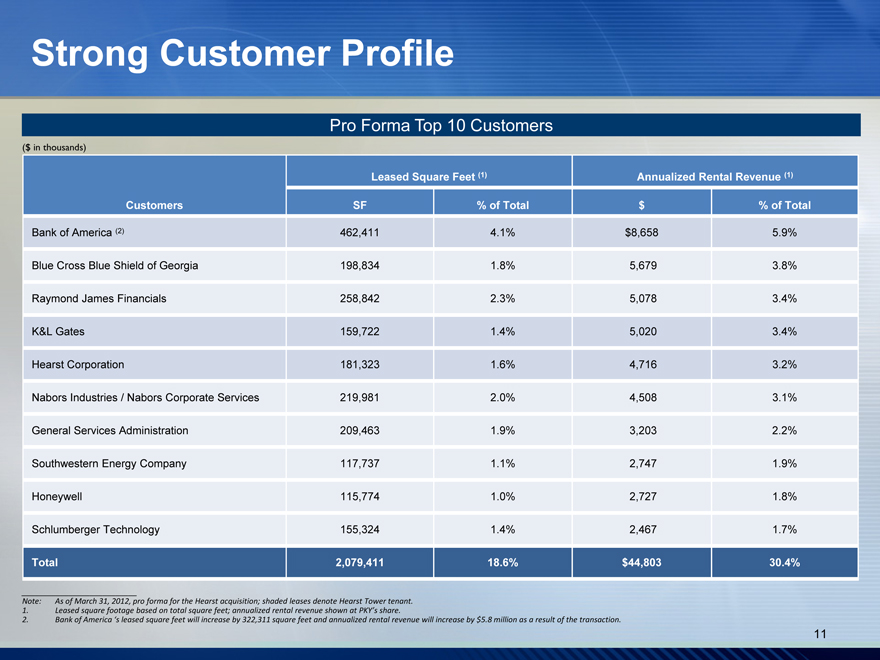
Pro Forma Top 10 Customers
($ in thousands)
Leased Square Feet (1) Annualized Rental Revenue (1)
Customers SF % of Total $ % of Total
Bank of America (2) 462,411 4.1% $8,658 5.9%
Blue Cross Blue Shield of Georgia 198,834 1.8% 5,679 3.8%
Raymond James Financials 258,842 2.3% 5,078 3.4%
K&L Gates 159,722 1.4% 5,020 3.4%
Hearst Corporation 181,323 1.6% 4,716 3.2%
Nabors Industries / Nabors Corporate Services 219,981 2.0% 4,508 3.1%
General Services Administration 209,463 1.9% 3,203 2.2%
Southwestern Energy Company 117,737 1.1% 2,747 1.9%
Honeywell 115,774 1.0% 2,727 1.8%
Schlumberger Technology 155,324 1.4% 2,467 1.7%
Total 2,079,411 18.6% $44,803 30.4%
Note: As of March 31, 2012, pro forma for the Hearst acquisition; shaded leases denote Hearst Tower tenant.
1. Leased square footage based on total square feet; annualized rental revenue shown at PKY’s share.
2. Bank of America‘s leased square feet will increase by 322,311 square feet and annualized rental revenue will increase by $5.8 million as a result of the transaction.
11
Limited Near-Term Lease Expirations
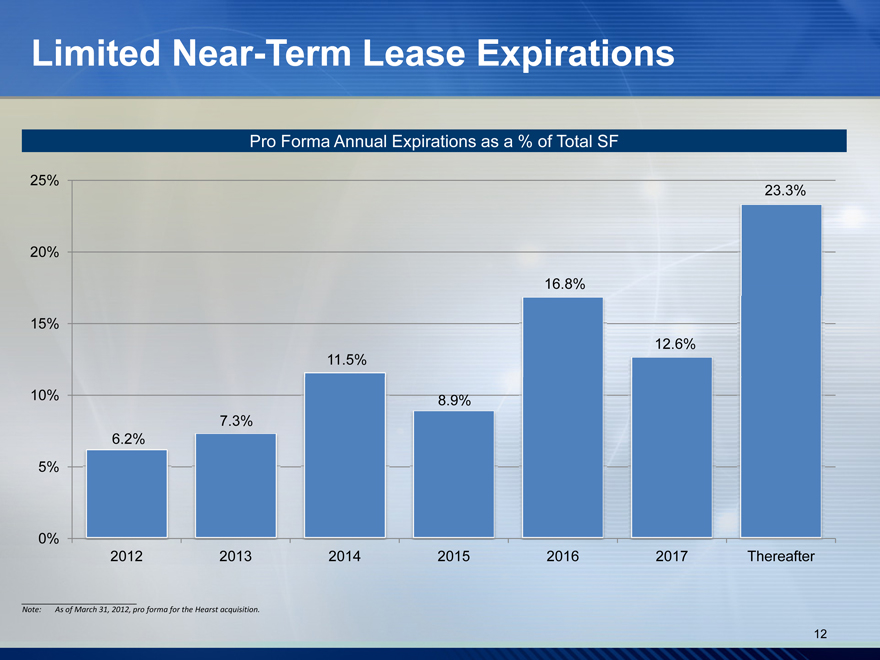
Pro Forma Annual Expirations as a % of Total SF
25%
23.3%
20%
16.8%
15%
12.6%
11.5%
10% 8.9%
7.3%
6.2%
5%
0%
2012 2013 2014 2015 2016 2017 Thereafter
Note: As of March 31, 2012, pro forma for the Hearst acquisition.
12
Pro Forma Capital Structure
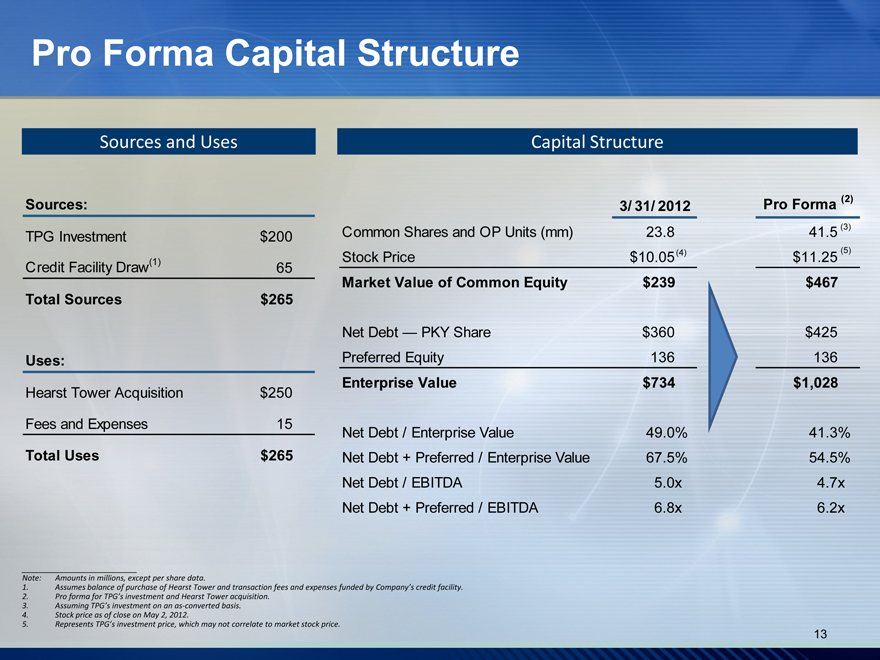
Sources and Uses Capital Structure
Sources: 3/ 31/ 2012 Pro Forma (2)
TPG Investment $200 Common Shares and OP Units (mm) 23.8 41.5 (3)
(1) | | Stock Price $10.05 (4) $11.25 (5) |
Credit Facility Draw 65
Market Value of Common Equity $239 $467
Total Sources $265
Net Debt — PKY Share $360 $425
Uses: Preferred Equity 136 136
Enterprise Value $734 $1,028
Hearst Tower Acquisition $250
Fees and Expenses 15 Net Debt / Enterprise Value 49.0% 41.3%
Total Uses $265 Net Debt + Preferred / Enterprise Value 67.5% 54.5%
Net Debt / EBITDA 5.0x 4.7x
Net Debt + Preferred / EBITDA 6.8x 6.2x
Note: Amounts in millions, except per share data.
1. Assumes balance of purchase of Hearst Tower and transaction fees and expenses funded by Company’s credit facility.
2. Pro forma for TPG’s investment and Hearst Tower acquisition.
3. Assuming TPG’s investment on an as-converted basis.
4. Stock price as of close on May 2, 2012.
5. Represents TPG’s investment price, which may not correlate to market stock price.
13
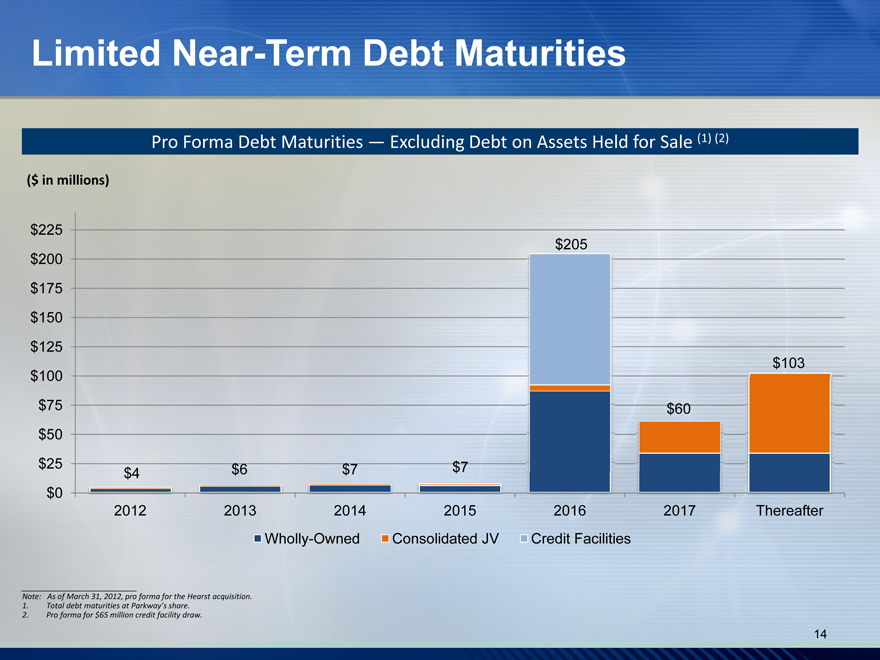
Limited Near-Term Debt Maturities
Pro Forma Debt Maturities — Excluding Debt on Assets Held for Sale (1) (2)
($ in millions)
$225
$205
$200
$175175
$150
$125
$103
$100
$75 $60
$50
$25 $4 $6 $7 $7
$0
2012 2013 2014 2015 2016 2017 Thereafter
Wholly-Owned Consolidated JV Credit Facilities
Note: As of March 31, 2012, pro forma for the Hearst acquisition.
1. Total debt maturities at Parkway’s share.
2. Pro forma for $65 million credit facility draw.
14
Investment Highlights
Financially compelling transaction
Alignment with strategic partner with proven track record of value creation
Enhanced platform to execute on robust acquisition pipeline
Acquisition of high-quality, mission critical property in a high growth market
Significant increase in equity market capitalization and asset base Meaningful balance sheet improvement and increased access to capital Increased cash flow supports future dividend growth
15
Additional Information About the Proposed Transaction
This communication relates to the proposed equity investment transaction pursuant to the terms of the Securities Purchase Agreement, dated as of May 3, 2012, among Parkway Properties, Inc. (“Parkway”), and TPG VI Pantera Holdings, L.P. (“TPG”).
In connection with the proposed transaction, Parkway will file with the Securities and Exchange Commission a proxy statement and will mail or otherwise disseminate the proxy statement and a form of proxy to its stockholders when it becomes available. STOCKHOLDERS AND INVESTORS ARE ENCOURAGED TO READ THE PROXY STATEMENT (AND OTHER RELEVANT MATERIALS) REGARDING THE PROPOSED TRANSACTION CAREFULLY AND IN ITS ENTIRETY WHEN IT BECOMES AVAILABLE, AND BEFORE MAKING ANY VOTING DECISION, AS IT WILL CONTAIN IMPORTANT INFORMATION ABOUT THE TRANSACTION. Stockholders and investors will be able to obtain a free copy of the proxy statement (when available), as well as other filings made by Parkway regarding Parkway Properties, Inc. and the proposed transaction, without charge, at the Securities and Exchange Commission’s website (http://www.sec.gov). These materials also can be obtained, when available, without charge, by directing a request to Parkway Properties, Inc., 390 North Orange Avenue, Suite 2400, Orlando, Florida 32801, Attention: Investor Relations.
Certain Information Regarding Participants
Parkway and its directors and executive officers may be deemed, under SEC rules, to be participants in the solicitation of proxies from Parkway’s stockholders regarding the conversion of any shares of preferred stock of Parkway issued to TPG in connection with TPG’s proposed equity investment in Parkway into shares of Parkway’s common stock. Security holders may obtain information regarding the names, affiliations and interests of such individuals in Parkway’s Annual Report on Form 10-K for the year ended December 31, 2011, which was filed with the SEC on March 12, 2012, and its definitive proxy statement for the 2012 annual meeting of stockholders, which was filed with the SEC on April 5, 2012. Additional information regarding the interests of such individuals in the proposed acquisition of Parkway will be included in the proxy statement relating to such acquisition when it is filed with the SEC. These documents may be obtained free of charge from the SEC’s website at www.sec.gov and the Company’s website at www.pky.com.
16
Parkway Properties, Inc. 390 North Orange Avenue Suite 2400 Orlando, FL 32801 (407) 650-0593 www.pky.com