UNITED STATES
SECURITIES AND EXCHANGE COMMISSION
Washington, D.C. 20549
FORM N-CSR
Certified Shareholder Report of
Registered Management Investment Companies
Investment Company Act File Number: 811-03857
American Funds Insurance Series
(Exact Name of Registrant as Specified in Charter)
333 South Hope Street
Los Angeles, California 90071
(Address of Principal Executive Offices)
Registrant's telephone number, including area code: (213) 486-9200
Date of fiscal year end: December 31
Date of reporting period: December 31, 2014
Steven I. Koszalka
American Funds Insurance Series
333 South Hope Street
Los Angeles, California 90071
(Name and Address of Agent for Service)
Copies to:
Michael Glazer
Morgan, Lewis & Bockius LLP
355 South Grand Avenue, Suite 4400
Los Angeles, California 90071
(Counsel for the Registrant)
ITEM 1 – Reports to Stockholders
![]()
American Funds
Insurance Series
at 30: Options for
every investor
Special feature page 44
American Funds
Annual report |
American Funds Insurance Series, from Capital Group, is the underlying investment vehicle for many variable annuities and insurance products. For more than 80 years, Capital has invested with a long-term focus based on thorough research and attention to risk.
Investing for short periods makes losses more likely. Investments are not FDIC-insured, nor are they deposits of or guaranteed by a bank or any other entity, so they may lose value. For current information and month-end results, visit americanfunds.com/afis. For information about your insurance contract and month-end results, go to the website of the company that issued your contract.
Investing outside the United States may be subject to risks, such as currency fluctuations, periods of illiquidity and price volatility. These risks may be heightened in connection with investments in developing countries. Investing in small-capitalization stocks can involve greater risk than is customarily associated with investing in stocks of larger, more established companies. The return of principal for bond funds and for funds with significant underlying bond holdings is not guaranteed. Fund shares are subject to the same interest rate, inflation and credit risks associated with the underlying bond holdings. High-yield bonds are subject to greater fluctuations in value and risk of loss of income and principal than investment-grade bonds. Bond ratings, which typically range from AAA/Aaa (highest) to D (lowest), are assigned by credit rating agencies such as Standard & Poor’s, Moody’s and/or Fitch as an indication of an issuer’s creditworthiness. Futures contracts may not provide an effective hedge of the underlying securities because changes in the prices of futures contracts may not track those of the securities they are intended to hedge. In addition, the managed risk strategy may not effectively protect the funds from market declines and will limit the funds’ participation in market gains. The use of the managed risk strategy could cause the funds’ returns to lag those of the applicable underlying funds in certain rising market conditions. Refer to the funds’ prospectuses and the Risk Factors section of this report for more information on these and other risks associated with investing in the funds.

Boosted by a steadily improving economy, strong corporate earnings, an accommodative monetary policy and declining unemployment, U.S. stocks achieved record highs in 2014. In other markets, Japanese stocks delivered solid gains after falling early in the year, reflecting the level of enthusiasm for Prime Minister Shinzo Abe’s economic stimulus measures, though the weak yen meant a negative return for U.S.-based investors. Chinese stocks rose sharply in the second half despite concerns about slowing economic growth.
The picture was not as bright in Europe, as several major markets, including Germany, France and the United Kingdom, lost ground over the 12 months ended December 31. Emerging markets also suffered amid concerns about the end of U.S. quantitative easing, rising geopolitical risk in Russia and sluggish demand for commodities.
There were more losers than winners in the MSCI ACWI (All Country World Index) in 2014. Israel (+22.77%) was the strongest developed market and the only one apart from the U.S. (+12.69%) to achieve a double-digit gain. Among developing markets, the highest individual country returns came from Egypt (+29.33%), Indonesia (+26.59%) and the Philippines (+25.59%). Conversely, the weakest markets were Russia (–46.27%) and Greece (–39.96%), which finally emerged from recession only to be hit by new fears about its ability to pay bond debts and a potential exit from the euro zone. Portugal, another debt-ravaged country that precipitated the euro-zone crisis, declined 38.24%. Country returns are based on MSCI indexes, which reflect reinvestment of distributions and dividends net of withholding taxes, except for the MSCI USA Index, which reflects dividends gross of withholding taxes. All market indexes referenced in this report are unmanaged and, therefore, have no expenses. Investors cannot invest directly in an index.
Investment-grade bond markets rallied from declines in 2013 as investors turned to U.S. Treasuries for their relative value and safety amid mixed global growth and geopolitical tensions. Barclays U.S. Aggregate Index gained 5.97%, while Barclays Global Aggregate Index rose 0.59%. The yield on the 10-year U.S. Treasury was 2.17% at December 31, down from 3.04% a year earlier. Higher yielding bonds did well in the first half of the year but struggled in the second half: The J.P. Morgan Emerging Markets Bond Index Global was up 5.53% at the close of 2014, while the Barclays U.S. Corporate High Yield 2% Issuer Capped Index advanced 2.46%.
| American Funds Insurance Series | 1 |
In currency markets, the U.S. dollar registered significant gains, rising against all major currencies and most minor ones. Among major currencies, the Japanese yen was the biggest loser (–12.3%), followed closely by the euro (–12.2%). The Swiss franc (–10.5%), Canadian dollar (–8.3%) and British pound (–5.9%) also lost ground vs. the dollar. Emerging markets currencies were weakest; the Ukrainian hryvnia plunged 47.9% and the Russian ruble fell 45.2%. The Chinese renminbi held up better, dipping just 2.4%. Currency returns are calculated by MSCI.
Not surprisingly, the U.S.-focused equity funds in American Funds Insurance Series had the best returns for the series in 2014. Larger companies tended to outpace smaller ones, a trend that was reflected in the results. All of the series’ bond funds ended the year ahead, while Cash Management Fund, which recorded a slight loss, continued to be hindered by low short-term interest rates.
Looking ahead
The U.S. economy continues to strengthen, and unemployment numbers are steadily improving; over the past year the jobless rate fell from 6.7% to 5.6%, the lowest level since mid-2008. Central banks around the world have pledged to maintain low interest rates, which have been a key contributing factor in the rise of stock prices.
Europe may see some short-term turmoil over growth concerns and the situation in Greece, but the European Central Bank’s plans to initiate bond purchases as part of its quantitative easing program may help the euro zone as a whole. Emerging markets countries will likely feel the impact of falling oil and commodity prices, which hurts exporters and helps importers. In aggregate, consumers around the world will benefit from the lower energy prices.
Of course, it is always difficult to predict what markets will do, particularly in the near term, so we invest with a long-term horizon, which we believe gives us a competitive advantage and also aligns perfectly with the long-term nature of retirement assets. We have a comprehensive network of investment analysts who scour the globe for attractive investment opportunities. In 2014, we opened a research office in Brazil, the world’s fifth-largest country by population and size. Some might wonder why we would open an office in a country whose stock market has declined 43.57% since 2010. We believe now is a wonderful time to look for opportunities to invest in well-managed companies in that region at attractive prices, and a local presence may provide an advantage.
The outlook for the U.S. market remains bright, but after nearly six years of gains, it’s reasonable to expect that U.S. returns will moderate at some point. We are confident that our time-tested investment approach will continue to help investors reach their financial goals no matter which way the market turns in the short term.
Thank you for entrusting your retirement assets to us. We look forward to reporting to you again in six months.
Sincerely,

Donald D. O’Neal
Vice Chairman of the Board
Alan N. Berro
President
February 6, 2015
| 2 | American Funds Insurance Series |
Summary investment portfolios
Summary investment portfolios are designed to streamline this report and help investors better focus on the funds’ principal holdings. Cash Management Fund, Managed Risk Growth Fund, Managed Risk International Fund, Managed Risk Blue Chip Income and Growth Fund, Managed Risk Growth-Income Fund and Managed Risk Asset Allocation Fund show a complete listing of portfolio holdings. See the inside back cover for details on how to obtain a complete schedule of portfolio holdings for each fund in the series.
Unless otherwise indicated, American Funds Insurance Series investment results are for Class 2 shares (Class P2 shares for managed risk funds). Class 2 shares began operations on April 30, 1997. Class 3 shares began operations on January 16, 2004. Class 4 shares began operations on December 14, 2012. Results encompassing periods prior to those dates assume a hypothetical investment in Class 1 shares and include the deduction of additional annual expenses (0.25% for Class 2 shares, 0.18% for Class 3 shares and 0.50% for Class 4 shares).
The mountain charts on pages 5 to 43 illustrate the growth of a $10,000 investment in each of the investment portfolios in American Funds Insurance Series (with the exception of Cash Management Fund) over the past 10 years (or the lifetime of the fund if less than 10 years).
The variable annuities and life insurance contracts that use the series’ funds contain certain fees and expenses not reflected in this report. Investment results assume all distributions are reinvested and reflect applicable fees and expenses. The series’ investment adviser waived a portion of its management fees for all existing funds from September 1, 2004, through December 31, 2008, for U.S. Government/AAA-Rated Securities Fund from July 1, 2010, through December 31, 2010, and for Blue Chip Income and Growth Fund from February 1, 2014, through December 31, 2014. For the managed risk funds, the investment adviser is currently waiving a portion of its management fee equal to 0.05% of the funds’ net assets and is currently reimbursing a portion of other expenses so that they will not exceed 0.28%. The waivers and reimbursements will be in effect through at least May 1, 2015, unless modified or terminated by the series board. After that time, the investment adviser may elect to extend, modify or terminate the reimbursements. The waivers may only be modified or terminated with the approval of the series board. Applicable fund results shown reflect the waivers and reimbursements, without which results would have been lower. See the Financial Highlights table in this report for details.
Although Capital Income Builder has a plan of distribution for Class 2 shares and Global Balanced Fund has a plan of distribution and an insurance administrative plan for Class 4 shares, fees for distribution and/or insurance administrative services are not paid on amounts invested in the funds by the investment adviser and/or its affiliates. If fees for these services were charged on these assets, fund results would have been lower and expenses would have been higher. See the “Plans of distribution” and the “Fund expenses” sections of the prospectus for information on the fees for distribution and/or insurance administrative services, respectively, permitted to be charged by the funds.
Individual funds are listed in this report according to their risk potential, with managed risk funds listed last.
| American Funds Insurance Series | 3 |
Fund results shown are for past periods and are not predictive of results for future periods. Current and future results may be lower or higher than those shown. Unit prices and returns will vary, so investors may lose money. For current information and month-end results, visit americanfunds.com/afis. For information about your insurance contract and month-end results, go to the website of the company that issued your contract.
Global Growth Fund gained 2.31% for the 12 months ended December 31, 2014, compared with a 4.16% increase for the MSCI ACWI (All Country World Index).*
The growing U.S. economy lifted domestic stocks in 2014, while international stocks faltered as persistent economic woes in Europe heightened fears of another recession and falling oil prices hurt oil-producing countries.
Stocks in the health care sector, the fund’s largest at year-end, accounted for most of the fund’s gain, with two U.S. biotechnology companies the primary contributors: Vertex Pharmaceuticals, which develops drugs to treat cystic fibrosis and other serious diseases, and Regeneron Pharmaceuticals, a leader in human antibody technologies. Danish company Novo Nordisk, which focuses on the treatment of diabetes, was also one of the top five contributors. All three were among the fund’s 10 largest holdings at year-end.
While holdings in the information technology sector were additive, results trailed those of the index. The fund benefited on a relative basis from low exposure to the struggling energy and materials sectors.
Results in the consumer discretionary sector, the third-largest at year-end, had the most negative impact, in large part due to poor showings from online retailers Amazon and U.K.-based ASOS. Financials and telecommunication services were also weak.
Despite five years of significant gains for global stock markets and considerable economic and political uncertainty in various countries, the fund’s portfolio managers continue to find attractive investment opportunities outside the U.S. They remain positive on the outlook for the Japanese economy, given the determination of Prime Minister Abe to drive economic growth, and continue to find selective value in European shares.
| Country diversification | Percent of net assets | |||
| The Americas | ||||
| United States | 44.9 | % | ||
| Canada | 2.0 | |||
| Brazil | .1 | |||
| 47.0 | ||||
| Europe | ||||
| United Kingdom | 8.1 | |||
| Switzerland | 4.9 | |||
| France | 4.1 | |||
| Germany | 3.4 | |||
| Denmark | 3.3 | |||
| Spain | 2.7 | |||
| Netherlands | 2.5 | |||
| Other | 2.2 | |||
| 31.2 | ||||
| Asia/Pacific Basin | ||||
| Japan | 7.2 | |||
| Taiwan | 2.0 | |||
| India | 1.9 | |||
| Hong Kong | 1.8 | |||
| China | 1.4 | |||
| South Korea | 1.0 | |||
| Other | 1.2 | |||
| 16.5 | ||||
| Other regions | ||||
| South Africa | .5 | |||
| Short-term securities & other assets less liabilities | 4.8 | |||
| Total | 100.0 | % | ||
| Largest individual equity securities | Percent of net assets | |||
| Vertex Pharmaceuticals | 3.61 | % | ||
| Novo Nordisk | 3.34 | |||
| Moody’s | 2.84 | |||
| Amazon | 2.84 | |||
| ASML | 2.46 | |||
| Regeneron Pharmaceuticals | 2.32 | |||
| Home Depot | 2.19 | |||
| Priceline Group | 2.13 | |||
| Taiwan Semiconductor Manufacturing | 2.05 | |||
| 2.04 | ||||
| 4 | American Funds Insurance Series |
Global Growth Fund
How a $10,000 investment has grown

Average annual total returns based on a $1,000 investment
| For periods ended December 31, 2014 | ||||||||||||||||||||
| 1 year | 5 years | 10 years | Lifetime (since April 30, 1997) | Expense ratio | ||||||||||||||||
| Class 1 | 2.52 | % | 10.80 | % | 8.87 | % | 9.71 | % | .55 | % | ||||||||||
| Class 2 | 2.31 | 10.52 | 8.60 | 9.44 | .80 | |||||||||||||||
| Class 4 | 2.01 | 10.34 | 8.37 | 9.19 | 1.05 | |||||||||||||||
Investment results assume all distributions are reinvested and reflect applicable fees and expenses. The fund’s investment adviser waived a portion of its management fees from September 1, 2004, through December 31, 2008. Applicable fund results shown reflect the waiver, without which they would have been lower. Expense ratios are as of the fund’s prospectus dated May 1, 2015 (unaudited). See the Financial Highlights table in this report for details.
Any market index shown is unmanaged and, therefore, has no expenses. Investors cannot invest directly in an index.
*The MSCI index result reflects dividends net of withholding taxes and reinvestment of distributions.
| Where the fund’s assets were invested as of December 31, 2014 | Percent of net assets |

| American Funds Insurance Series | 5 |
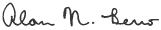
Global Small Capitalization Fund
Fund results shown are for past periods and are not predictive of results for future periods. Current and future results may be lower or higher than those shown. Unit prices and returns will vary, so investors may lose money. For current information and month-end results, visit americanfunds.com/afis. For information about your insurance contract and month-end results, go to the website of the company that issued your contract.
Global Small Capitalization Fund gained 2.12% for the 12 months ended December 31, 2014, beating its benchmark, the MSCI All Country World Small Cap Index, which rose 1.78%.*
The U.S. economy continues to improve as much of Europe is verging on recession and China struggles with economic and banking issues. There were some significant geopolitical events, including Russia invading Ukraine, resulting in economic sanctions. Late in the year, the price of oil substantially dipped.
The fund’s portfolio managers did a skilled job of identifying industries and stocks in the U.S. that could benefit the fund, but because the portfolio was underweight in the U.S. market, the position held back more gains. Health care stocks bolstered fund results, highlighted by bluebird bio, Synageva BioPharma and Illumina. Biotechnology stocks had a significant impact as increasing numbers of people benefit from innovation. Information technology holdings were additive to the fund, led by TriQuint Semiconductor and network security firm Palo Alto Networks.
Financials were the biggest drag on relative returns — primarily Ocwen Financial. Along with U.S.-based firms, companies based in India and Japan helped results, while companies headquartered in the U.K., Hong Kong and China detracted.
U.S. stocks have become more expensive, but stocks in sectors with real growth potential are still worth owning. The drop in oil prices has upended that industry around the world, likely creating much greater uncertainty in the economics of that business. There likely will be, however, some extraordinary investment opportunities — with volatility comes dislocation, and with dislocation comes opportunity.
| Country diversification | Percent of net assets | |||
| The Americas | ||||
| United States | 49.3 | % | ||
| Canada | 1.6 | |||
| Other | 1.1 | |||
| 52.0 | ||||
| Asia/Pacific Basin | ||||
| China | 5.8 | |||
| Hong Kong | 4.5 | |||
| Philippines | 3.5 | |||
| Japan | 3.3 | |||
| India | 2.8 | |||
| South Korea | 1.3 | |||
| Thailand | 1.1 | |||
| Other | 3.0 | |||
| 25.3 | ||||
| Europe | ||||
| United Kingdom | 10.2 | |||
| Germany | 1.6 | |||
| Ireland | 1.3 | |||
| Other | 3.0 | |||
| 16.1 | ||||
| Other regions | ||||
| South Africa | .1 | |||
| Short-term securities & other assets less liabilities | 6.5 | |||
| Total | 100.0 | % | ||
| Largest individual equity securities | Percent of net assets |
| Synageva BioPharma | 2.96 | % | ||
| TriQuint Semiconductor | 2.70 | |||
| bluebird bio | 2.52 | |||
| Netflix | 2.50 | |||
| Lions Gate Entertainment | 2.19 | |||
| International Container Terminal Services | 2.13 | |||
| Palo Alto Networks | 1.54 | |||
| AAC Technologies Holdings | 1.49 | |||
| athenahealth | 1.39 | |||
| InterOil | 1.39 |
| 6 | American Funds Insurance Series |
Global Small Capitalization Fund
How a $10,000 investment has grown
Average annual total returns based on a $1,000 investment
| For periods ended December 31, 2014 | ||||||||||||||||||||
| 1 year | 5 years | 10 years | Lifetime (since April 30, 1998) | Expense ratio | ||||||||||||||||
| Class 1 | 2.36 | % | 9.19 | % | 8.32 | ">% | 9.92 | % | .74 | % | ||||||||||
| Class 2 | 2.12 | 8.91 | 8.05 | 9.65 | .99 | |||||||||||||||
| Class 4 | 1.88 | 8.67 | 7.79 | 9.38 | 1.24 | |||||||||||||||
Investment results assume all distributions are reinvested and reflect applicable fees and expenses. The fund’s investment adviser waived a portion of its management fees from September 1, 2004, through December 31, 2008. Applicable fund results shown reflect the waiver, without which they would have been lower. Expense ratios are as of the fund’s prospectus dated May 1, 2015 (unaudited). See the Financial Highlights table in this report for details.
Any market index shown is unmanaged and, therefore, has no expenses. Investors cannot invest directly in an index.
*The MSCI index result reflects dividends net of withholding taxes and reinvestment of distributions.
| Where the fund’s assets were invested as of December 31, 2014 | Percent of net assets |

| American Funds Insurance Series | 7 |
Growth Fund
Fund results shown are for past periods and are not predictive of results for future periods. Current and future results may be lower or higher than those shown. Unit prices and returns will vary, so investors may lose money. For current information and month-end results, visit americanfunds.com/afis. For information about your insurance contract and month-end results, go to the website of the company that issued your contract.
Growth Fund gained 8.51% for the 12 months ended December 31, 2014. The S&P 500 rose 13.66%.
U.S. stocks recorded a succession of record highs in 2014, with the fourth quarter marking the eighth consecutive quarterly gain for the S&P 500. All industry sectors rose during the year, with the exception of energy, where stocks were hurt by the dramatic slump in oil prices.
Stocks in the health care, information technology (IT) and financials sectors were the main contributors to the fund’s gain on an absolute basis. Health care was particularly strong, with four U.S. companies in the sector among the top five contributors to relative returns. In IT, the standout was U.S./Singaporean semiconductor firm Avago Technologies.
The fund trailed the index in several sectors, including energy, consumer discretionary and consumer staples, which together accounted for most of the return difference. Two energy companies were among the top five detractors to relative returns, though the biggest drag was online retailer Amazon, the fund’s largest holding at year-end.
Overall, holdings outside the U.S. hindered fund returns. Canada, France, the U.K. and Japan were weakest on a relative basis. The fund’s cash holdings also detracted.
With oil prices at lows not seen in years, the fund’s portfolio managers will look for industries and companies that stand to benefit from lower energy costs in addition to those most likely to profit from consumers’ increased spending power. Attractive valuations among energy stocks could present promising investment opportunities.
| Largest individual equity securities | Percent of net assets | |||
| Amazon | 3.61 | % | ||
| Home Depot | 2.91 | |||
| Wells Fargo | 2.59 | |||
| ASML | 2.48 | |||
| Comcast | 2.43 | |||
| Microsoft | 2.37 | |||
| 2.17 | ||||
| Express Scripts | 1.74 | |||
| Incyte | 1.72 | |||
| Berkshire Hathaway | 1.62 | |||
| 8 | American Funds Insurance Series |
Growth Fund
How a $10,000 investment has grown
![]()
Average annual total returns based on a $1,000 investment
| For periods ended December 31, 2014 | ||||||||||||||||||||
| 1 year | 5 years | 10 years | Lifetime (since February 8, 1984) | Expense ratio | ||||||||||||||||
| Class 1 | 8.78 | % | 13.87 | % | 8.10 | % | 12.64 | % | .35 | % | ||||||||||
| Class 2 | 8.51 | 13.58 | 7.83 | 12.34 | .60 | |||||||||||||||
| Class 3 | 8.58 | 13.67 | 7.91 | 12.44 | .53 | |||||||||||||||
| Class 4 | 8.25 | 13.34 | 7.58 | 12.09 | .85 | |||||||||||||||
Investment results assume all distributions are reinvested and reflect applicable fees and expenses. The fund’s investment adviser waived a portion of its management fees from September 1, 2004, through December 31, 2008. Applicable fund results shown reflect the waiver, without which they would have been lower. Expense ratios are as of the fund’s prospectus dated May 1, 2015 (unaudited). See the Financial Highlights table in this report for details.
Any market index shown is unmanaged and, therefore, has no expenses. Investors cannot invest directly in an index.
| Where the fund’s assets were invested as of December 31, 2014 | Percent of net assets |
![]()
| American Funds Insurance Series | 9 |
International Fund
Fund results shown are for past periods and are not predictive of results for future periods. Current and future results may be lower or higher than those shown. Unit prices and returns will vary, so investors may lose money. For current information and month-end results, visit americanfunds.com/afis. For information about your insurance contract and month-end results, go to the website of the company that issued your contract.
International Fund lost 2.65% for the 12 months ended December 31, 2014. The fund’s benchmark, the MSCI ACWI (All Country World Index) ex USA, lost 3.87%.*
The U.S. is an important driver of the global economy and indications are that its economy is prospering. Europe has negative growth, its financial system is strained and financial stocks are in a tailspin. The European Central Bank ultimately may have to provide more support. The main event to watch in Japan is whether Prime Minister Abe comes through with promised reforms. China is slowing down, but the government is indicating it will do what it can to prevent a major slowdown.
The fund benefited from careful stock and sector selection in most regions, which helped mitigate the impact of the news. The largest sector by concentration was financials, and results were mixed — positive for India-based Axis Bank and negative for Russia-based Sberbank. SoftBank hurt fund results, as did other Japan-based holdings. Novartis led the way for health care holdings, while Pharmstandard and Grifols lagged. Consumer discretionary stocks were a drag, primarily Sands China. Investments in countries that benefit from low oil prices, such as India, were additive.
The U.S., after the end of quantitative easing, needs consumers to increase their spending and power the economy. The oil price decline should help consumers’ discretionary spending. The question is whether that’s enough to keep the world economy afloat.
| Country diversification | Percent of net assets | |||
| Europe | ||||
| Germany | 10.5 | % | ||
| United Kingdom | 10.2 | |||
| France | 8.9 | |||
| Switzerland | 8.4 | |||
| Netherlands | 2.9 | |||
| Spain | 1.7 | |||
| Ireland | 1.7 | |||
| Sweden | 1.4 | |||
| Italy | 1.3 | |||
| Other | 3.9 | |||
| 50.9 | ||||
| Asia/Pacific Basin | ||||
| Hong Kong | 10.0 | |||
| India | 8.6 | |||
| Japan | 7.8 | |||
| China | 5.9 | |||
| South Korea | 3.2 | |||
| Indonesia | 1.0 | |||
| Other | 2.2 | |||
| 38.7 | ||||
| The Americas | ||||
| United States | 1.1 | |||
| Other | 1.2 | |||
| 2.3 | ||||
| Other regions | ||||
| Other | 1.4 | |||
| Short-term securities & other assets less liabilities | 6.7 | |||
| Total | 100.0 | % | ||
| Largest individual equity securities | Percent of net assets | |||
| Novartis | 4.34 | % | ||
| Bayer | 3.22 | |||
| AIA Group | 2.48 | |||
| Baidu | 2.33 | |||
| Axis Bank | 2.33 | |||
| Samsung Electronics | 2.15 | |||
| Power Grid Corp. of India | 1.93 | |||
| Barclays | 1.82 | |||
| Nestlé | 1.75 | |||
| SoftBank | 1.68 | |||
| 10 | American Funds Insurance Series |
International Fund
How a $10,000 investment has grown
![]()
Average annual total returns based on a $1,000 investment
| For periods ended December 31, 2014 | ||||||||||||||||||||
| 1 year | 5 years | 10 years | Lifetime (since May 1, 1990) | Expense ratio | ||||||||||||||||
| Class 1 | –2.41 | % | 5.45 | % | 6.61 | % | 8.43 | % | .54 | % | ||||||||||
| Class 2 | –2.65 | 5.19 | 6.35 | 8.15 | .79 | |||||||||||||||
| Class 3 | –2.56 | 5.26 | 6.42 | 8.23 | .72 | |||||||||||||||
| Class 4 | –2.88 | 4.97 | 6.10 | 7.89 | 1.04 | |||||||||||||||
Investment results assume all distributions are reinvested and reflect applicable fees and expenses. The fund’s investment adviser waived a portion of its management fees from September 1, 2004, through December 31, 2008. Applicable fund results shown reflect the waiver, without which they would have been lower. Expense ratios are as of the fund’s prospectus dated May 1, 2015 (unaudited). See the Financial Highlights table in this report for details.
Any market index shown is unmanaged and, therefore, has no expenses. Investors cannot invest directly in an index.
*The MSCI index result reflects dividends net of withholding taxes and reinvestment of distributions.
| Where the fund’s assets were invested as of December 31, 2014 | Percent of net assets |
![]()
| American Funds Insurance Series | 11 |
New World Fund
Fund results shown are for past periods and are not predictive of results for future periods. Current and future results may be lower or higher than those shown. Unit prices and returns will vary, so investors may lose money. For current information and month-end results, visit americanfunds.com/afis. For information about your insurance contract and month-end results, go to the website of the company that issued your contract.
New World Fund lost 7.87% for the 12 months ended December 31, 2014. Its benchmark indexes, the MSCI ACWI (All Country World Index) and the MSCI Emerging Markets Index, gained 4.16% and lost 2.19%,* respectively.
At the beginning of 2014, the investor consensus was for stronger global economic growth; however, the results were extremely disappointing. European economic growth has been weak — the region is potentially heading for deflation — and Greece may leave the euro zone. Japan has had much more muted growth than was expected, and China’s economy stumbled.
There was a selloff in commodities, and the oil price decline hurt some emerging markets — including Brazil and Russia — while large importers of oil such as the U.S. and India did better. The fund did not have huge exposure to oil, but had significant exposure to Russia, which hurt results. Information technology holdings were mixed — Baidu benefited the fund the most, while Mail.ru Group was the biggest detractor.
While stimulus measures in Europe are a positive for some risk assets, they may not achieve the desired result of pulling those economies out of recession. If the Federal Reserve raises rates, it could be a challenge for some emerging markets. The portfolio managers don’t expect strong economic growth — that’s part of the reason commodities are selling off — and are more cautious than in recent years. They are therefore looking for companies that can do well notwithstanding the current economic environment.
| Country diversification | Percent of net assets | |||
| Asia/Pacific Basin | ||||
| India | 12.7 | % | ||
| Japan | 5.1 | |||
| China | 5.1 | |||
| Philippines | 2.2 | |||
| Hong Kong | 2.1 | |||
| Taiwan | 1.4 | |||
| Australia | 1.2 | |||
| Other | 1.7 | |||
| 31.5 | ||||
| The Americas | ||||
| United States | 16.9 | |||
| Mexico | 3.8 | |||
| Brazil | 1.9 | |||
| Canada | 1.3 | |||
| Other | 1.9 | |||
| 25.8 | ||||
| Europe | ||||
| France | 4.8 | |||
| United Kingdom | 3.9 | |||
| Switzerland | 3.5 | |||
| Russian Federation | 2.0 | |||
| Denmark | 1.7 | |||
| Sweden | 1.1 | |||
| Greece | 1.1 | |||
| Other | 4.4 | |||
| 22.5 | ||||
| Other regions | ||||
| South Africa | 2.4 | |||
| Other | 1.0 | |||
| 3.4 | ||||
| Short-term securities & other assets less liabilities | 16.8 | |||
| Total | 100.0 | % | ||
| Largest individual equity securities | Percent of net assets | |||
| Alcatel-Lucent | 2.26 | % | ||
| Novo Nordisk | 1.70 | |||
| Reliance Industries | 1.66 | |||
| ICICI Bank | 1.65 | |||
| Baidu | 1.63 | |||
| Naspers | 1.54 | |||
| 1.53 | ||||
| Domino’s Pizza | 1.52 | |||
| Novartis | 1.48 | |||
| Taiwan Semiconductor Manufacturing | 1.38 | |||
| 12 | American Funds Insurance Series |
New World Fund
How a $10,000 investment has grown
![]()
Average annual total returns based on a $1,000 investment
For periods ended December 31, 2014
| Lifetime | Expense | |||||||||||||||||||
| 1 year | 5 years | 10 years | (since June 17, 1999) | ratio | ||||||||||||||||
| Class 1 | –7.63 | % | 4.43 | % | 8.67 | % | 8.58 | % | .78 | % | ||||||||||
| Class 2 | –7.87 | 4.16 | 8.39 | 8.31 | 1.03 | |||||||||||||||
| Class 4 | –8.13 | 3.93 | 8.13 | 8.04 | 1.28 | |||||||||||||||
Investment results assume all distributions are reinvested and reflect applicable fees and expenses. The fund’s investment adviser waived a portion of its management fees from September 1, 2004, through December 31, 2008. Applicable fund results shown reflect the waiver, without which they would have been lower. Expense ratios are as of the fund’s prospectus dated May 1, 2015 (unaudited). See the Financial Highlights table in this report for details.
Any market index shown is unmanaged and, therefore, has no expenses. Investors cannot invest directly in an index.
*Results for MSCI indexes reflect dividends net of withholding taxes and reinvestment of distributions.
| Where the fund’s assets were invested as of December 31, 2014 | Percent of net assets |
![]()
| American Funds Insurance Series | 13 |
Blue Chip Income and Growth Fund
Fund results shown are for past periods and are not predictive of results for future periods. Current and future results may be lower or higher than those shown. Unit prices and returns will vary, so investors may lose money. For current information and month-end results, visit americanfunds.com/afis. For information about your insurance contract and month-end results, go to the website of the company that issued your contract.
Blue Chip Income and Growth Fund rose 15.36% for the 12 months ended December 31, 2014, outpacing its benchmark index, the S&P 500, which gained 13.66%.
The U.S. economy improved and the Federal Reserve ended its quantitative easing program. But other economies, including Europe, China and many emerging markets, deteriorated and the price of oil collapsed late in the year.
The fund held an “aggressively defensive” posture, with large positions relative to the index in health care and utilities contributing positively. In health care, the fund’s substantial position in Amgen proved particularly helpful. Gilead Sciences also impressed, boosted by robust sales of its hepatitis C drugs. Among utilities, Exelon advanced as regulatory developments and the polar vortex caused the market to reassess the value of its nuclear power plants. In industrials, General Dynamics was a standout contributor as its Gulfstream business jet division continued to grow rapidly. Ongoing regulatory pressure led the fund to take a more cautious view toward financials, and this detracted from results.
The U.S. economy has been improving, and this will continue to support profits for U.S.-oriented companies. Economic and earnings trends have been weak outside the U.S. The Fed has made it clear it will raise rates if U.S. economic strength continues, which may lead to further relative strength in the dollar. If so, this may continue to favor domestically oriented U.S. companies.
| Largest individual equity securities | Percent of net assets | |||
| Amgen | 5.90 | % | ||
| Verizon Communications | 4.82 | |||
| Gilead Sciences | 4.14 | |||
| Altria Group | 3.15 | |||
| Exelon | 3.02 | |||
| Philip Morris International | 2.80 | |||
| CenturyLink | 2.67 | |||
| Apple | 2.49 | |||
| Johnson Controls | 2.36 | |||
| Precision Castparts | 2.34 | |||
| 14 | American Funds Insurance Series |
Blue Chip Income and Growth Fund
How a $10,000 investment has grown
![]()
Average annual total returns based on a $1,000 investment
For periods ended December 31, 2014
| Lifetime | Expense | |||||||||||||||||||
| 1 year | 5 years | 10 years | (since July 5, 2001) | ratio | ||||||||||||||||
| Class 1 | 15.69 | % | 14.52 | % | 7.61 | % | 6.00 | % | .42 | % | ||||||||||
| Class 2 | 15.36 | 14.23 | 7.34 | 5.73 | .67 | |||||||||||||||
| Class 4 | 15.13 | 14.08 | 7.13 | 5.51 | .92 | |||||||||||||||
Investment results assume all distributions are reinvested and reflect applicable fees and expenses. The fund’s investment adviser waived a portion of its management fees from September 1, 2004, through December 31, 2008, and from February 1, 2014, through December 31, 2014. Applicable fund results shown reflect the waiver, without which they would have been lower. Expense ratios are as of the fund’s prospectus dated May 1, 2015 (unaudited). See the Financial Highlights table in this report for details.
Any market index shown is unmanaged and, therefore, has no expenses. Investors cannot invest directly in an index.
| Where the fund’s assets were invested as of December 31, 2014 | Percent of net assets |
![]()
| American Funds Insurance Series | 15 |
Global Growth and Income Fund
Fund results shown are for past periods and are not predictive of results for future periods. Current and future results may be lower or higher than those shown. Unit prices and returns will vary, so investors may lose money. For current information and month-end results, visit americanfunds.com/afis. For information about your insurance contract and month-end results, go to the website of the company that issued your contract.
Global Growth and Income Fund climbed 5.64% for the 12 months ended December 31, 2014, outpacing the MSCI ACWI (All Country World Index), which rose 4.16%.*
A strengthening U.S. economy lifted domestic stocks in 2014, while international stocks faltered as persistent economic woes in Europe heightened fears of another recession and falling oil prices hurt oil-producing countries.
The fund bested the index in seven of the 10 industry sectors, with holdings in industrials, health care and information technology adding the most value on an absolute basis. Three of the fund’s 10 largest holdings at year-end were among the primary contributors to relative returns, including Merck and United Continental. The fund was also helped on a relative basis by its limited exposure to the weak energy sector.
While recording modest gains on an absolute basis from financial and consumer discretionary companies, these sectors detracted most from relative returns. The fund’s weakest sector on an absolute basis was materials, but limited exposure helped mitigate the relative impact.
On a country basis, U.S. equities contributed most to the fund’s absolute result, followed by Taiwan and India. Holdings in Japan, France and Germany weighed on fund returns.
With global economic growth expected to accelerate in 2015, the fund’s portfolio managers remain optimistic about the availability of promising long-term investment opportunities.
| Country diversification | Percent of net assets | |||
| The Americas | ||||
| United States | 46.6 | % | ||
| Canada | 3.6 | |||
| Other | .6 | |||
| 50.8 | ||||
| Europe | ||||
| United Kingdom | 7.8 | |||
| France | 6.6 | |||
| Switzerland | 3.4 | |||
| Spain | 2.9 | |||
| Germany | 1.9 | |||
| Portugal | 1.1 | |||
| Other | 2.2 | |||
| 25.9 | ||||
| Asia/Pacific Basin | ||||
| Japan | 5.2 | |||
| Taiwan | 3.2 | |||
| India | 2.5 | |||
| Hong Kong | 2.3 | |||
| Philippines | 1.2 | |||
| China | 1.2 | |||
| Australia | 1.2 | |||
| Other | 1.0 | |||
| 17.8 | ||||
| Other regions | ||||
| South Africa | 1.3 | |||
| Short-term securities & other assets less liabilities | 4.2 | |||
| Total | 100.0 | % | ||
| Largest individual equity securities | Percent of net assets | |||
| Merck | 3.71 | % | ||
| Taiwan Semiconductor Manufacturing | 2.92 | |||
| Microsoft | 2.27 | |||
| AXA | 2.25 | |||
| Orange | 1.78 | |||
| United Continental | 1.77 | |||
| CME Group | 1.72 | |||
| Novartis | 1.70 | |||
| Potash Corp. of Saskatchewan | 1.57 | |||
| Lockheed Martin | 1.53 | |||
| 16 | American Funds Insurance Series |
Global Growth and Income Fund
How a $10,000 investment has grown
![]()
Average annual total returns based on a $1,000 investment
For periods ended December 31, 2014
| Lifetime | Expense | |||||||||||||||
| 1 year | 5 years | (since May 1, 2006) | ratio | |||||||||||||
| Class 1 | 6.00 | % | 10.39 | % | 6.24 | % | .63 | % | ||||||||
| Class 2 | 5.64 | 10.11 | 5.97 | .88 | ||||||||||||
| Class 4 | 5.41 | 9.89 | 5.74 | 1.13 | ||||||||||||
Investment results assume all distributions are reinvested and reflect applicable fees and expenses. The fund’s investment adviser waived a portion of its management fees from May 1, 2006, through December 31, 2008. Applicable fund results shown reflect the waiver, without which they would have been lower. Expense ratios are as of the fund’s prospectus dated May 1, 2015 (unaudited). See the Financial Highlights table in this report for details.
Any market index shown is unmanaged and, therefore, has no expenses. Investors cannot invest directly in an index.
*The MSCI index result reflects dividends net of withholding taxes and reinvestment of distributions.
| Where the fund’s assets were invested as of December 31, 2014 | Percent of net assets |
![]()
| American Funds Insurance Series | 17 |
Growth-Income Fund
Fund results shown are for past periods and are not predictive of results for future periods. Current and future results may be lower or higher than those shown. Unit prices and returns will vary, so investors may lose money. For current information and month-end results, visit americanfunds.com/afis. For information about your insurance contract and month-end results, go to the website of the company that issued your contract.
Growth-Income Fund gained 10.63% for the 12 months ended December 31, 2014, while the S&P 500 rose 13.66%.
U.S. stocks recorded a succession of record highs in 2014, with the fourth quarter marking the eighth consecutive quarterly gain for the S&P 500. All industry sectors rose during the year, with energy the exception as stocks were battered by the dramatic slump in oil prices.
Select health care, information technology and industrials holdings were important drivers of positive returns. Four health care companies were among the fund’s top five contributors to relative returns, including the fund’s two largest holdings at year-end, U.S. biotechnology firms Amgen and Gilead Sciences. Holdings in the industrials sector also made a significant contribution to relative returns. All sectors except energy and materials gained on an absolute basis.
Aside from holdings in cash, the biggest drag on relative results came from select investments in the consumer discretionary sector. The weakest stocks on a relative basis were fifth-largest holding Amazon, which had a run of strong returns in the previous few years, and General Motors.
Looking ahead, the portfolio managers are optimistic about prospects for U.S. companies as the economy continues to grow. Central banks around the world are committed to maintaining low interest rates, which should help the environment for growth.
| Largest individual equity securities | Percent of net assets | |||
| Amgen | 3.36 | % | ||
| Gilead Sciences | 2.88 | |||
| Texas Instruments | 2.57 | |||
| 2.47 | ||||
| Amazon | 2.32 | |||
| Oracle | 1.83 | |||
| Philip Morris International | 1.49 | |||
| Microsoft | 1.48 | |||
| Celanese | 1.40 | |||
| Home Depot | 1.32 | |||
| 18 | American Funds Insurance Series |
Growth-Income Fund
How a $10,000 investment has grown
![]()
Average annual total returns based on a $1,000 investment
| For periods ended December 31, 2014 | ||||||||||||||||||||
| 1 year | 5 years | 10 years | Lifetime (since February 8, 1984) | Expense ratio | ||||||||||||||||
| Class 1 | 10.91 | % | 13.96 | % | 7.35 | % | 11.42 | % | .29 | % | ||||||||||
| Class 2 | 10.63 | 13.67 | 7.09 | 11.12 | .54 | |||||||||||||||
| Class 3 | 10.71 | 13.75 | 7.16 | 11.22 | .47 | |||||||||||||||
| Class 4 | 10.34 | 13.42 | 6.83 | 10.87 | .79 | |||||||||||||||
Investment results assume all distributions are reinvested and reflect applicable fees and expenses. The fund’s investment adviser waived a portion of its management fees from September 1, 2004, through December 31, 2008. Applicable fund results shown reflect the waiver, without which they would have been lower. Expense ratios are as of the fund’s prospectus dated May 1, 2015 (unaudited). See the Financial Highlights table in this report for details.
Any market index shown is unmanaged and, therefore, has no expenses. Investors cannot invest directly in an index.
| Where the fund’s assets were invested as of December 31, 2014 | Percent of net assets |

| American Funds Insurance Series | 19 |
International Growth and Income Fund
Fund results shown are for past periods and are not predictive of results for future periods. Current and future results may be lower or higher than those shown. Unit prices and returns will vary, so investors may lose money. For current information and month-end results, visit americanfunds.com/afis. For information about your insurance contract and month-end results, go to the website of the company that issued your contract.
International Growth and Income Fund declined 3.15% for the 12 months ended December 31, 2014, but finished slightly ahead of the MSCI ACWI (All Country World Index) ex USA, which lost 3.87%.*
International stocks faltered toward the end of the year as persistent economic woes in Europe heightened fears of another recession, while the dramatic drop in oil prices and lower demand for raw materials hurt companies in the energy and materials sectors.
The fund’s best results on both an absolute and relative basis came from holdings in the health care and utilities sectors. Portuguese electricity provider EDP added the most relative value, while India’s Glenmark Pharmaceuticals and Switzerland’s Novartis, the largest holding at year-end, were also among the primary contributors to results. A low exposure to the troubled energy sector also helped the fund on a relative basis.
Holdings in consumer discretionary, information technology and telecommunication services detracted most from relative results. Lower-than-index weightings in the struggling materials and financials sectors helped reduce the relative impact of the fund’s decline in each area.
On a country basis, holdings in Hong Kong, India and the United Kingdom were strongest on a relative basis, while China, Australia and Russia were weakest.
The fund’s portfolio managers are optimistic for international markets in 2015, despite deflation worries and geopolitical uncertainties. The continuing recovery of the U.S. economy, the strong U.S. dollar and lower energy prices should boost consumers and exporters in Europe, Japan and many emerging markets. The European market looks particularly attractive given its very low relative valuations and weak currency.
| Country diversification | Percent of net assets | |||
| Europe | ||||
| United Kingdom | 25.9 | % | ||
| Switzerland | 6.0 | |||
| Germany | 4.8 | |||
| Sweden | 4.1 | |||
| Spain | 3.7 | |||
| Finland | 3.6 | |||
| France | 3.4 | |||
| Portugal | 3.3 | |||
| Ireland | 2.1 | |||
| Other | 3.3 | |||
| 60.2 | ||||
| Asia/Pacific Basin | ||||
| Hong Kong | 6.9 | |||
| Japan | 3.8 | |||
| India | 3.2 | |||
| Australia | 2.5 | |||
| Thailand | 2.3 | |||
| China | 1.7 | |||
| Indonesia | 1.4 | |||
| Other | 2.0 | |||
| 23.8 | ||||
| The Americas | ||||
| United States | 3.7 | |||
| Canada | 2.3 | |||
| Other | 1.2 | |||
| 7.2 | ||||
| Short-term securities & other assets less liabilities | 8.8 | |||
| Total | 100.0 | % | ||
| Largest individual equity securities | Percent of net assets | |||
| Novartis | 3.59 | % | ||
| EDP - Energias de Portugal | 3.12 | |||
| Philip Morris International | 2.81 | |||
| SSE | 2.63 | |||
| Prudential | 2.39 | |||
| H&M | 1.89 | |||
| Fortum | 1.86 | |||
| British American Tobacco | 1.58 | |||
| Aviva | 1.55 | |||
| easyJet | 1.49 | |||
| 20 | American Funds Insurance Series |
International Growth and Income Fund
How a $10,000 investment has grown

Average annual total returns based on a $1,000 investment
| For periods ended December 31, 2014 | ||||||||||||||||
| 1 year | 5 years | Lifetime (since November 18, 2008) | Expense ratio | |||||||||||||
| Class 1 | –2.93 | % | 5.85 | % | 12.34 | % | .68 | % | ||||||||
| Class 2 | –3.15 | 5.57 | 12.06 | .93 | ||||||||||||
| Class 4 | –3.39 | 5.39 | 11.85 | 1.18 | ||||||||||||
Investment results assume all distributions are reinvested and reflect applicable fees and expenses. The fund’s investment adviser waived a portion of its management fees from November 18, 2008, through December 31, 2008. Applicable fund results shown reflect the waiver, without which they would have been lower. Expense ratios are as of the fund’s prospectus dated May 1, 2015 (unaudited). See the Financial Highlights table in this report for details.
Any market index shown is unmanaged and, therefore, has no expenses. Investors cannot invest directly in an index.
*The MSCI index result reflects dividends net of withholding taxes and reinvestment of distributions.
| Where the fund’s assets were invested as of December 31, 2014 | Percent of net assets |

| American Funds Insurance Series | 21 |
Capital Income Builder
Fund results shown are for past periods and are not predictive of results for future periods. Current and future results may be lower or higher than those shown. Unit prices and returns will vary, so investors may lose money. For current information and month-end results, visit americanfunds.com/afis. For information about your insurance contract and month-end results, go to the website of the company that issued your contract.
Capital Income Builder, the newest fund in the American Funds Insurance Series lineup, was introduced on May 1. The fund has two primary investment objectives. It seeks (1) to provide a level of current income that exceeds the average yield on U.S. stocks generally, and (2) to provide a growing stream of income over the years. The fund’s secondary objective is to provide growth of capital.
From its inception through December 31, Capital Income Builder rose 0.12%, which included reinvested dividends totaling 19.0 cents a share and a capital gain of 1.3 cents a share. The S&P 500 advanced 10.85% over the same period, the MSCI ACWI (All Country World Index) ex USA declined 5.86%,* and the Lipper Global Equity Income Funds Average, a measure of similar funds, lost 1.13%.
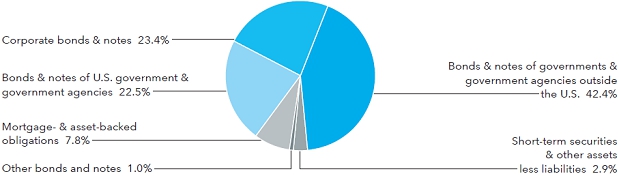
At year-end, the fund’s four portfolio managers had invested 81.3% of fund assets in stocks and 18.7% in investment-grade U.S. bonds (rated BBB/Baa and above) and cash. Within equities, 43.5% were invested in the U.S. and 56.5% outside the U.S. The fund’s equity holdings in aggregate lagged as returns outside the U.S. were considerably lower than returns in the U.S., which were helped by the strong dollar.
The relatively stable consumer staples and health care sectors represented 15.9% and 12.9% of the equity portfolio, respectively. The more volatile energy and financials sectors were held at lower weights than the index, at 8.2% and 14.0%, respectively, reflecting concerns around weak oil prices and their potential effects on lenders.
The portfolio managers continue to invest in companies dedicated to paying out dividends and growing those dividends over time to meet the fund’s current income and growth-of-income objectives.
| Country diversification | Percent of net assets | |||
| The Americas | ||||
| United States | 51.2 | % | ||
| Canada | 1.6 | |||
| 52.8 | ||||
| Europe | ||||
| United Kingdom | 14.7 | |||
| Switzerland | 4.9 | |||
| Sweden | 3.3 | |||
| Germany | 2.9 | |||
| Finland | 2.5 | |||
| France | 1.4 | |||
| Italy | 1.1 | |||
| Other | 2.1 | |||
| 32.9 | ||||
| Asia/Pacific Basin | ||||
| Hong Kong | 4.9 | |||
| Australia | 1.6 | |||
| Japan | 1.5 | |||
| Singapore | 1.1 | |||
| Other | 1.8 | |||
| 10.9 | ||||
| Other regions | ||||
| South Africa | .2 | |||
| Short-term securities & other assets less liabilities | 3.2 | |||
| Total | 100.0 | % | ||
| 22 | American Funds Insurance Series |
Capital Income Builder
How a $10,000 investment has grown

Cumulative returns based on a $1,000 investment
For period ended December 31, 2014
| Lifetime | Expense | |||||||
| (since May 1, 2014) | ratio† | |||||||
| Class 1 | 0.12 | % | .53 | % | ||||
| Class 2 | 0.12 | .78 | ||||||
| Class 4 | –0.21 | 1.03 | ||||||
Investment results assume all distributions are reinvested and reflect applicable fees and expenses. Expense ratios are as of the fund’s prospectus dated May 1, 2015 (unaudited). See the Financial Highlights table in this report for details.
Although the fund has a plan of distribution for Class 2 shares, fees for distribution services are not paid on amounts invested in the fund by the investment adviser and/or its affiliates. If fees for these services were charged on these assets, fund results would have been lower and expenses would have been higher. See the “Plans of distribution” section of the prospectus for information on the fees for distribution services, permitted to be charged by the fund.
Any market index shown is unmanaged and, therefore, has no expenses. Investors cannot invest directly in an index.
| * | The MSCI index result reflects dividends net of withholding taxes and reinvestment of distributions. |
| † | Based on estimated amounts for the current fiscal year. |
| Where the fund’s assets were invested as of December 31, 2014 | Percent of net assets |

| American Funds Insurance Series | 23 |
Asset Allocation Fund
Fund results shown are for past periods and are not predictive of results for future periods. Current and future results may be lower or higher than those shown. Unit prices and returns will vary, so investors may lose money. For current information and month-end results, visit americanfunds.com/afis. For information about your insurance contract and month-end results, go to the website of the company that issued your contract.
Asset Allocation Fund, which is a mix of stocks and bonds, rose 5.40% for the 12 months ended December 31, 2014. The S&P 500, the benchmark for the fund’s equity holdings, gained 13.66% over the same period, while the Barclays U.S. Aggregate Index, which measures investment-grade U.S. bonds (rated BBB/Baa and above), rose 5.97%. A blend of the two indexes, the 60/40 S&P/Barclays Index, advanced 10.60%.*
U.S. stocks recorded a succession of record highs in 2014. All industry sectors rose with the exception of energy, where stocks were hurt by the dramatic slump in oil prices. Bonds advanced as investors moved to U.S. Treasuries amid mixed global growth and geopolitical tensions.
The fund had gains close to or in double digits in several sectors, including utilities, information technology and health care, but trailed the index in each on a relative basis because of a low weighting or disappointing results from select holdings. Not surprisingly, the fund’s weakest sector was energy, which included two of the top five detractors to relative returns. The fund’s slightly larger cash position, which reflects the portfolio managers’ cautious approach after several years of rising markets, also hampered results.
The fund’s fixed-income holdings slightly lagged the index. High-yield corporate bonds detracted from fund results as investors sought the safety of Treasuries and investment-grade corporate securities.
The fund’s portfolio managers trimmed stock holdings slightly, ending the year with 67.5% of assets in equities, down from 69.4% a year ago.
| Largest individual equity securities | Percent of net assets | |||
| Microsoft | 3.76 | % | ||
| Comcast | 2.35 | |||
| Lockheed Martin | 2.32 | |||
| Merck | 2.05 | |||
| Amazon | 1.88 | |||
| ACE | 1.72 | |||
| JPMorgan Chase | 1.69 | |||
| Home Depot | 1.44 | |||
| ASML Holding | 1.33 | |||
| Boeing | 1.27 | |||
| 24 | American Funds Insurance Series |
Asset Allocation Fund
How a $10,000 investment has grown

Average annual total returns based on a $1,000 investment
| For periods ended December 31, 2014 | ||||||||||||||||||||
| Lifetime | Expense | |||||||||||||||||||
| 1 year | 5 years | 10 years | (since August 1, 1989) | ratio | ||||||||||||||||
| Class 1 | 5.66 | % | 11.81 | % | 7.51 | % | 8.64 | % | .30 | % | ||||||||||
| Class 2 | 5.40 | 11.54 | 7.24 | 8.36 | .55 | |||||||||||||||
| Class 3 | 5.47 | 11.62 | 7.32 | 8.45 | .48 | |||||||||||||||
| Class 4 | 5.16 | 11.35 | 7.02 | 8.12 | .80 | |||||||||||||||
Investment results assume all distributions are reinvested and reflect applicable fees and expenses. The fund’s investment adviser waived a portion of its management fees from September 1, 2004, through December 31, 2008. Applicable fund results shown reflect the waiver, without which they would have been lower. Expense ratios are as of the fund’s prospectus dated May 1, 2015 (unaudited). See the Financial Highlights table in this report for details.
Any market index shown is unmanaged and, therefore, has no expenses. Investors cannot invest directly in an index.
| * | The 60/40 S&P/Barclays Index blends the S&P 500 with the Barclays U.S. Aggregate Index by weighting their cumulative total returns at 60% and 40%, respectively. Its result assumes the blend is rebalanced monthly. |
| Where the fund’s assets were invested as of December 31, 2014 | Percent of net assets |

| American Funds Insurance Series | 25 |
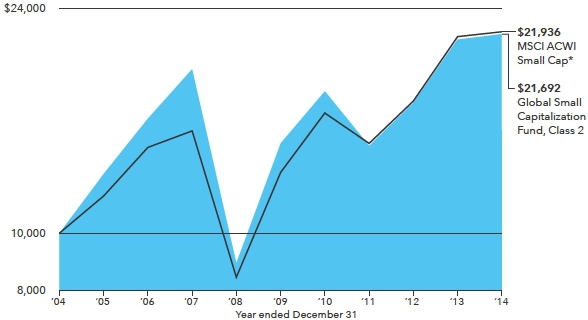
Global Balanced Fund
Fund results shown are for past periods and are not predictive of results for future periods. Current and future results may be lower or higher than those shown. Unit prices and returns will vary, so investors may lose money. For current information and month-end results, visit americanfunds.com/afis. For information about your insurance contract and month-end results, go to the website of the company that issued your contract.
Global Balanced Fund rose 1.63% for the 12 months ended December 31, 2014. The MSCI ACWI (All Country World Index), which measures global stocks, gained 4.16%,* while the Barclays Global Aggregate Index, a measure of investment-grade bonds, was up 0.59%. The 60/40 MSCI/Barclays Index increased 2.78%.*
The U.S. is recovering, employment is rising, the U.S. dollar is strong and inflation is low. It was a challenging year for the global investor, however, with worries about Europe’s negative growth and risk of deflation. Other regions are hurting, making the landscape a challenge for U.S. multinationals and their foreign earnings.
The fund’s lower concentration and careful stock selection among energy holdings helped results. Strong returns in information technology, led by Microsoft and ASML, benefited the fund. Weakness in the financials sector created a drag, punctuated by ORIX and Deutsche Bank, although Hong Kong–based Link Real Estate Investment Trust offset some losses. Global fixed-income returns in U.S. dollars were poor. Even though the fund had solid nominal returns, once currency was factored in, overall results suffered.
There are questions about the sustainability of U.S. growth given struggles around the world. An increase in rates by the Federal Reserve could be a problem for many countries in emerging markets. The European Central Bank has taken decisive action with its stimulus plan, which may help to resolve the economic uncertainty in Europe and brighten prospects for many of the fund’s European-based holdings.
| Five largest sectors in common stock holdings | Percent of net assets | |||
| Industrials | 10.4 | % | ||
| Financials | 9.8 | |||
| Consumer staples | 8.5 | |||
| Information technology | 8.1 | |||
| Health care | 6.4 | |||
| Currency diversification | Percent of net assets |
| Short-term | ||||||||||||||||||||
| Forward | securities & | |||||||||||||||||||
| Equity | Bonds & | currency | other assets | |||||||||||||||||
| securities | notes | contracts | less liabilities | Total | ||||||||||||||||
| U.S. dollars | 28.8 | % | 17.3 | % | 1.2 | % | 8.4 | % | 55.7 | % | ||||||||||
| Euros | 14.5 | 5.6 | .6 | — | 20.7 | |||||||||||||||
| British pounds | 6.0 | 2.0 | (.8 | ) | — | 7.2 | ||||||||||||||
| Japanese yen | 2.7 | .9 | 1.0 | — | 4.6 | |||||||||||||||
| Swiss francs | 3.0 | — | — | — | 3.0 | |||||||||||||||
| Hong Kong dollars | 2.6 | — | — | — | 2.6 | |||||||||||||||
| Mexican pesos | — | 1.5 | (.2 | ) | — | 1.3 | ||||||||||||||
| Australian dollars | .7 | .2 | — | — | .9 | |||||||||||||||
| Swedish kroner | .9 | .4 | (.4 | ) | — | .9 | ||||||||||||||
| New Taiwan dollar | .6 | — | — | — | .6 | |||||||||||||||
| Other currencies | 1.4 | 2.5 | (1.4 | ) | — | 2.5 | ||||||||||||||
| 100.0 | % | |||||||||||||||||||
| Largest individual equity securities | Percent of net assets | |||
| ASML | 2.38 | % | ||
| Microsoft | 2.22 | |||
| Merck | 2.08 | |||
| Nestlé | 1.37 | |||
| Comcast | 1.34 | |||
| Largest fixed-income holdings (by issuer) | Percent of net assets | |||
| U.S. Treasury | 6.96 | % | ||
| Fannie Mae | 2.93 | |||
| United Kingdom Government | 1.98 | |||
| United Mexican States Government | 1.50 | |||
| German Government | 1.19 | |||
| 26 | American Funds Insurance Series |
Global Balanced Fund
How a $10,000 investment has grown
Average annual total returns based on a $1,000 investment
| For periods ended December 31, 2014 | ||||||||||||
| Lifetime | Expense | |||||||||||
| 1 year | (since May 2, 2011) | ratio | ||||||||||
| Class 1 | 1.87 | % | 5.45 | % | .71 | % | ||||||
| Class 2 | 1.63 | 5.19 | .96 | |||||||||
| Class 4 | 1.88 | 5.18 | 1.21 | † | ||||||||
Investment results assume all distributions are reinvested and reflect applicable fees and expenses. Expense ratios are as of the fund’s prospectus dated May 1, 2015 (unaudited). See the Financial Highlights table in this report for details.
Although the fund has plans of distribution and insurance administrative plans for Class 4 shares, fees for distribution and/or insurance administrative services are not paid on amounts invested in the fund by the investment adviser and/or its affiliates. If fees for these services were charged on these assets, fund results would have been lower and expenses would have been higher. See the “Plans of distribution” and the “Fund expenses” sections of the prospectus for information on the fees for distribution and/or insurance administrative services, respectively, permitted to be charged by the fund.
Any market index shown is unmanaged and, therefore, has no expenses. Investors cannot invest directly in an index.
| * | The MSCI index result reflects dividends net of withholding taxes and reinvestment of distributions. The 60/40 MSCI/Barclays Index blends the MSCI ACWI (All Country World Index) with the Barclays Global Aggregate Index by weighting their cumulative total returns at 60% and 40%, respectively. Its result assumes the blend is rebalanced monthly. |
| † | Based on estimated amounts for the current fiscal year. |
| Where the fund’s assets were invested as of December 31, 2014 | Percent of net assets |

| American Funds Insurance Series | 27 |
Bond Fund
Fund results shown are for past periods and are not predictive of results for future periods. Current and future results may be lower or higher than those shown. Unit prices and returns will vary, so investors may lose money. For current information and month-end results, visit americanfunds.com/afis. For information about your insurance contract and month-end results, go to the website of the company that issued your contract.
Bond Fund increased 5.28% for the 12 months ended December 31, 2014. Its benchmark, the Barclays U.S. Aggregate Index, gained 5.97%.
The U.S. economy is further along in its expansion. Debt servicing costs continue to be low so companies can refinance their debt more cheaply, and mergers-and-acquisitions activity was robust. Continuing low interest rates were not a surprise to the fund’s portfolio managers.
The fund’s exposure to corporate bonds stayed low because valuations are expensive given investors’ search for yield. The allocation to high-yield bonds is also near a historic low, and this area suffered a rough fourth quarter — most of it related to energy. Credit did well, so the best position was to own high-quality corporate bonds and long-duration assets. The fund was not positioned overly short on duration; however, holding bonds of longer duration and more corporate bonds would have benefited the fund. The fund decreased its exposure to mortgage-backed securities as the Federal Reserve’s removal from that market weakened them.
The view of the portfolio managers is that the Fed is likely to raise rates in June, but the global economy might not be ready for rates to rise that soon. Financial conditions may tighten, resulting in an emerging markets scare as liquidity is removed from the system. If rates do rise, however, the fund’s portfolio managers anticipate attractive buying opportunities.
| Largest holdings (by issuer) | Percent of net assets | |||
| U.S. Treasury | 37.80 | % | ||
| Fannie Mae | 15.57 | |||
| Government National Mortgage Assn. | 1.67 | |||
| Freddie Mac | 1.58 | |||
| Spanish Government | .96 | |||
| Verizon Communications | .68 | |||
| Morgan Stanley | .64 | |||
| State of California General Obligation Bonds | .54 | |||
| Slovenian Government | .52 | |||
| Medtronic | .51 | |||
| 28 | American Funds Insurance Series |
Bond Fund
How a $10,000 investment has grown
![]()
Average annual total returns based on a $1,000 investment
| For periods ended December 31, 2014 | ||||||||||||||||||||
| Lifetime | Expense | |||||||||||||||||||
| 1 year | 5 years | 10 years | (since January 2, 1996) | ratio | ||||||||||||||||
| Class 1 | 5.59 | % | 4.43 | % | 3.72 | % | 5.10 | % | .39 | % | ||||||||||
| Class 2 | 5.28 | 4.16 | 3.46 | 4.83 | .64 | |||||||||||||||
| Class 4 | 5.15 | 3.95 | 3.22 | 4.58 | .89 | |||||||||||||||
Investment results assume all distributions are reinvested and reflect applicable fees and expenses. The fund’s investment adviser waived a portion of its management fees from September 1, 2004, through December 31, 2008. Applicable fund results shown reflect the waiver, without which they would have been lower. Expense ratios are as of the fund’s prospectus dated May 1, 2015 (unaudited). See the Financial Highlights table in this report for details.
Any market index shown is unmanaged and, therefore, has no expenses. Investors cannot invest directly in an index.
| Where the fund’s assets were invested as of December 31, 2014 | Percent of net assets |

| American Funds Insurance Series | 29 |
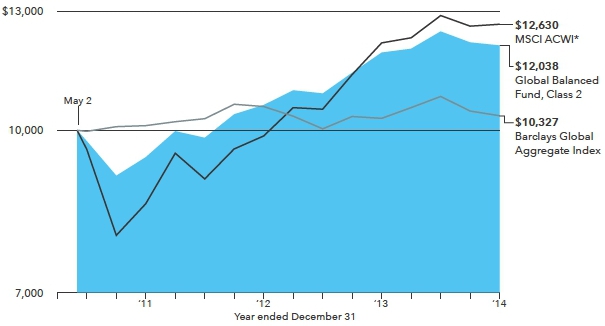
Global Bond Fund
Fund results shown are for past periods and are not predictive of results for future periods. Current and future results may be lower or higher than those shown. Unit prices and returns will vary, so investors may lose money. For current information and month-end results, visit americanfunds.com/afis. For information about your insurance contract and month-end results, go to the website of the company that issued your contract.
Global Bond Fund gained 1.39% for the 12 months ended December 31, 2014, while the Barclays Global Aggregate Index rose 0.59%.
Government bond yields in Europe rallied in 2014, with 10-year German bund yields starting the year at around 1.95% and finishing close to 0.50%.The 10-year U.S. Treasury yield declined from 3.04% to 2.17%, while in Japan the yield on the 10-year government bond dropped from around 0.70% to 0.30%.
This was a strong performance for bonds given the low starting point for yields. The falling yields in Europe helped lower government financing costs, a welcome relief for the more indebted countries.
The U.S. dollar strengthened in reaction to the prospect of Federal Reserve tightening. The U.S. economy improved as well, with employment slowly accelerating and investment spending recovering over the year. The Fed concluded its bond-buying program in the fall, and addressed the prospect of raising the federal funds rate during the summer of 2015. The Japanese and European economies remained weak. The Bank of Japan increased its quantitative easing in the fourth quarter, triggering a rapid decline of the yen.
The fund’s results benefited from the falling euro and yen throughout the year. While weakness in some emerging markets economies hurt results, the fund maintained a relatively low exposure. The fund was helped by its holdings in European sovereign credits, which tightened relative to German bunds.
With the U.S. dollar growing stronger and yields rising in many emerging markets, the fund’s portfolio managers may take advantage of increased opportunities to buy bonds around the world with attractive return profiles.
| Percent of net assets | ||||
| Currency weighting (after hedging) by country | ||||
| United States1 | 58.2 | % | ||
| EMU2 | 20.0 | |||
| Japan | 10.2 | |||
| United Kingdom | 3.9 | |||
| India | 1.8 | |||
| Poland | 1.8 | |||
| Mexico | 1.7 | |||
| Israel | .5 | |||
| Colombia | .4 | |||
| Canada | .3 | |||
| Norway | .3 | |||
| Indonesia | .2 | |||
| Hungary | .2 | |||
| Malaysia | .1 | |||
| Turkey | .1 | |||
| Sweden | .1 | |||
| Brazil | .1 | |||
| Australia | .1 | |||
| Total | 100.0 | % | ||
| Non-U.S. government bonds by country | ||||||||
| EMU2: | ||||||||
| Spain | 5.5 | % | ||||||
| Ireland | 4.3 | |||||||
| Portugal | 2.5 | |||||||
| Belgium | 1.1 | |||||||
| Germany | 1.1 | |||||||
| Other | 3.7 | 18.2 | % | |||||
| United Kingdom | 5.1 | |||||||
| Mexico | 3.3 | |||||||
| Hungary | 3.1 | |||||||
| Japan | 2.5 | |||||||
| India | 1.8 | |||||||
| Poland | 1.8 | |||||||
| Norway | 1.4 | |||||||
| Colombia | 1.1 | |||||||
| Other | 4.1 | |||||||
| Total | 42.4 | % | ||||||
| Largest holdings (by issuer) | Percent of net assets | |||
| U.S. Treasury | 22.47 | % | ||
| Spanish Government | 5.47 | |||
| Fannie Mae | 5.31 | |||
| United Kingdom Government | 5.09 | |||
| Irish Government | 4.30 | |||
| United Mexican States Government | 3.34 | |||
| Hungarian Government | 3.10 | |||
| Japanese Government | 2.53 | |||
| Portuguese Government | 2.49 | |||
| Indian Government | 1.83 | |||
| 30 | American Funds Insurance Series |
Global Bond Fund
How a $10,000 investment has grown
Average annual total returns based on a $1,000 investment
| For periods ended December 31, 2014 | ||||||||||||||||
| Lifetime | Expense | |||||||||||||||
| 1 year | 5 years | (since October 4, 2006) | ratio | |||||||||||||
| Class 1 | 1.71 | % | 3.16 | % | 5.00 | % | .57 | % | ||||||||
| Class 2 | 1.39 | 2.90 | 4.74 | 3 | .82 | |||||||||||
| Class 4 | 1.16 | 2.73 | 4.53 | 1.07 | ||||||||||||
Investment results assume all distributions are reinvested and reflect applicable fees and expenses. The fund’s investment adviser waived a portion of its management fees from October 4, 2006, through December 31, 2008. Applicable fund results shown reflect the waiver, without which they would have been lower. Expense ratios are as of the fund’s prospectus dated May 1, 2015 (unaudited). See the Financial Highlights table in this report for details.
Any market index shown is unmanaged and, therefore, has no expenses. Investors cannot invest directly in an index.
| 1 | Includes U.S. dollar-denominated debt of other countries, totaling 8.4%. |
| 2 | European Monetary Union consists of Austria, Belgium, Cyprus, Estonia, Finland, France, Germany, Greece, Ireland, Italy, Latvia, Luxembourg, Malta, the Netherlands, Portugal, Slovakia, Slovenia and Spain. Euro-denominated debt includes corporate and European government debt. |
| 3 | Global Bond Fund Class 2 shares were first sold on November 6, 2006. Results prior to that date are hypothetical based on Class 1 share results adjusted for estimated additional annual expenses of 0.25%. |
| Where the fund’s assets were invested as of December 31, 2014 | Percent of net assets |
| American Funds Insurance Series | 31 |
High-Income Bond Fund
Fund results shown are for past periods and are not predictive of results for future periods. Current and future results may be lower or higher than those shown. Unit prices and returns will vary, so investors may lose money. For current information and month-end results, visit americanfunds.com/afis. For information about your insurance contract and month-end results, go to the website of the company that issued your contract.
High-Income Bond Fund gained 0.63% for the 12 months ended December 31, 2014. The fund’s benchmark, the Barclays U.S. Corporate High Yield 2% Issuer Capped Index, increased 2.46%.
The fundamental backdrop was favorable. Low interest rates and inexpensive financing continued to bolster buyer demand for higher yielding investments. While there was a lot of new supply, the bulk of issuance was refinancing. The first half of the year was very strong and the second half very weak, resulting in low aggregate high-yield returns.
Weak oil prices hindered a number of energy companies, particularly in the fourth quarter. Oil, gas & consumable fuels and energy equipment & services were a benefit however, because of the fund’s underweight position, while an underweight position in independent power & renewables hurt. Issuer selection in non-U.S. high-yield and investment-grade bonds (rated BBB/Baa and above) detracted on a relative basis. Investments in emerging markets and commodity exporters also weighed on fund results.
Modest growth combined with ample liquidity to facilitate refinancing of balance sheets and financing of capital plans will likely continue. While a slow-growth, low-rate environment is best for high yield, growth may strengthen and interest rates may tick up. The fund’s portfolio managers think overall valuations are attractive, but expect to see continued stress in the energy sector from companies dependent on the oil price. Despite weakness in energy, however, the landscape for refinancing should be strong.
| Largest holdings (by issuer) | Percent of net assets | |||
| T-Mobile US | 2.90 | % | ||
| Sprint Nextel | 2.42 | |||
| inVentiv Health | 2.32 | |||
| Kinetic Concepts | 2.13 | |||
| First Data | 2.00 | |||
| Reynolds Group | 1.89 | |||
| First Quantum Minerals | 1.63 | |||
| FMG Resources | 1.54 | |||
| Freescale Semiconductor | 1.51 | |||
| Numericable Group | 1.43 | |||
| 32 | American Funds Insurance Series |
High-Income Bond Fund
How a $10,000 investment has grown

Average annual total returns based on a $1,000 investment
| For periods ended December 31, 2014 | ||||||||||||||||||||
| Lifetime | Expense | |||||||||||||||||||
| 1 year | 5 years | 10 years | (since February 8, 1984) | ratio | ||||||||||||||||
| Class 1 | 0.80 | % | 7.67 | % | 5.91 | % | 9.21 | % | .48 | % | ||||||||||
| Class 2 | 0.63 | 7.42 | 5.66 | 8.87 | .73 | |||||||||||||||
| Class 3 | 0.59 | 7.47 | 5.72 | 9.01 | .66 | |||||||||||||||
| Class 4 | 0.35 | 7.24 | 5.44 | 8.68 | .98 | |||||||||||||||
Investment results assume all distributions are reinvested and reflect applicable fees and expenses. The fund’s investment adviser waived a portion of its management fees from September 1, 2004, through December 31, 2008. Applicable fund results shown reflect the waiver, without which they would have been lower. Expense ratios are as of the fund’s prospectus dated May 1, 2015 (unaudited). See the Financial Highlights table in this report for details.
Any market index shown is unmanaged and, therefore, has no expenses. Investors cannot invest directly in an index.
| Where the fund’s assets were invested as of December 31, 2014 | Percent of net assets |

| American Funds Insurance Series | 33 |
Mortgage Fund
Fund results shown are for past periods and are not predictive of results for future periods. Current and future results may be lower or higher than those shown. Unit prices and returns will vary, so investors may lose money. For current information and month-end results, visit americanfunds.com/afis. For information about your insurance contract and month-end results, go to the website of the company that issued your contract.
Mortgage Fund gained 5.23% for the 12 months ended December 31, 2014, while the Barclays U.S. Mortgage-Backed Securities Index rose 6.08%.
Agency mortgage-backed securities delivered a total return of 6.15%, about 0.40% better than a duration-equivalent Treasury portfolio.
Yields on agency mortgage-backed securities and 10-year U.S. Treasuries declined notably over the year as the yield curve flattened significantly. Five-year Treasury yields decreased 10 basis points while 30-year yields decreased 81 basis points.
The fund lagged the index largely due to a core weighting in Treasury Inflation-Protected Securities (TIPS) and an overweight to the five-year portion of the yield curve.
Looking ahead, the portfolio managers are mindful that a further decline in long-term interest rates could trigger a refinancing wave among homeowners. This may provide an opportunity to add to the fund’s mortgage pass-through investments and agency mortgage-backed securities at more attractive valuations.
While higher short-term interest rates are anticipated in the latter part of 2015, the magnitude of the change is likely to be quite modest due to a fragile global macroeconomic backdrop and very limited inflationary pressures. Investors are protected against any inflationary surprise by the fund’s significant investment in TIPS.
| Breakdown of mortgage-backed obligations | Percent of net assets | ||||||
| 30-year pass-throughs: | |||||||
| Fannie Mae | 19.1 | % | |||||
| Ginnie Mae | 18.8 | ||||||
| Freddie Mac | 2.9 | 40.8 | % | ||||
| Other | 13.2 | ||||||
| Total | 54.0 | % | |||||
| 34 | American Funds Insurance Series |
Mortgage Fund
How a $10,000 investment has grown
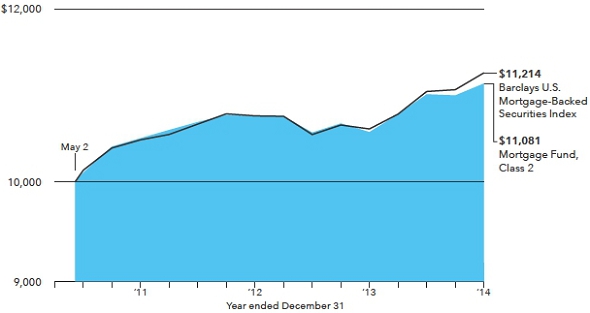
Average annual total returns based on a $1,000 investment
| For periods ended December 31, 2014 | ||||||||||||
| 1 year | Lifetime (since May 2, 2011) | Expense ratio | ||||||||||
| Class 1 | 5.54 | % | 3.10 | % | .45 | % | ||||||
| Class 2 | 5.23 | 2.84 | .70 | |||||||||
| Class 4 | 4.98 | 2.72 | .95 | |||||||||
Investment results assume all distributions are reinvested and reflect applicable fees and expenses. Expense ratios are as of the fund’s prospectus dated May 1, 2015 (unaudited). See the Financial Highlights table in this report for details.
Any market index shown is unmanaged and, therefore, has no expenses. Investors cannot invest directly in an index.
| Where the fund’s assets were invested as of December 31, 2014 | Percent of net assets |

| American Funds Insurance Series | 35 |
U.S. Government/AAA-Rated Securities Fund
Fund results shown are for past periods and are not predictive of results for future periods. Current and future results may be lower or higher than those shown. Unit prices and returns will vary, so investors may lose money. For current information and month-end results, visit americanfunds.com/afis. For information about your insurance contract and month-end results, go to the website of the company that issued your contract.
U.S. Government/AAA-Rated Securities Fund gained 5.01% for the 12 months ended December 31, 2014, slightly behind the Barclays U.S. Government/Mortgage-Backed Securities Index, which rose 5.41%.
The Federal Reserve ended its purchase program of U.S. Treasuries and agency mortgage-backed securities (MBS) in 2014. Interestingly, Treasury yields have fallen since the end of the purchase program. The Fed has indicated that it expects to begin raising short-term interest rates sometime in 2015.
During the year, the 10-year U.S. Treasury yield fell by just over 87 basis points and the yield curve flattened significantly (yields at the long end of the curve fell more than those at the short end). Treasury Inflation-Protected Securities (TIPS) also saw significant moves in 2014. During the last five months of the year, 10-year breakeven inflation (the market’s expectation for average inflation over the next decade) fell by 60 basis points.
Portfolio managers increased the fund’s nominal U.S. Treasury exposure by approximately 8% while reducing agency debenture and agency MBS exposure by approximately 4% and 3%, respectively. The fund maintained a meaningful weighting in TIPS, ranging from a low of 7% at the beginning of the year to almost 12% by December 31.
A relentlessly flattening yield curve and the more recent rapid drop in inflation expectations led to disappointing results for the fund relative to the index.
The portfolio managers have positioned the fund with the expectation that the Federal Reserve will be slower to raise rates than is currently priced into the market. They believe that less tightening in the U.S., coupled with aggressive expansionary monetary policy in Europe and Japan, will lead to a steepening of the yield curve and higher inflation expectations.
| Breakdown of mortgage-backed obligations | Percent of net assets | ||||||
| 30-year pass-throughs: | |||||||
| Fannie Mae | 11.1 | % | |||||
| Ginnie Mae | 5.5 | ||||||
| Freddie Mac | 3.8 | 20.4 | % | ||||
| 15-year pass-throughs | .7 | ||||||
| Other | 2.4 | ||||||
| Total | 23.5 | % | |||||
| 36 | American Funds Insurance Series |
U.S. Government/AAA-Rated Securities Fund
How a $10,000 investment has grown
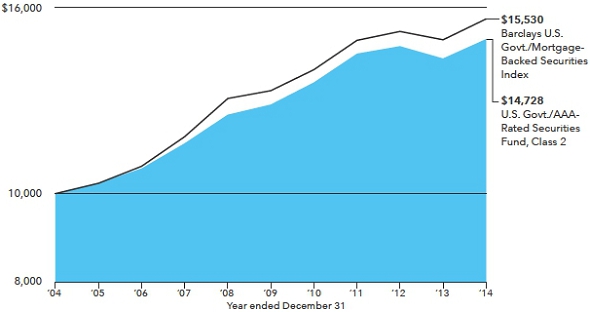
Average annual total returns based on a $1,000 investment
| For periods ended December 31, 2014 | ||||||||||||||||||||
| 1 year | 5 years | 10 years | Lifetime (since December 2, 1985) | Expense ratio | ||||||||||||||||
| Class 1 | 5.24 | % | 3.61 | % | 4.20 | % | 6.30 | % | .35 | % | ||||||||||
| Class 2 | 5.01 | 3.36 | 3.95 | 6.00 | .60 | |||||||||||||||
| Class 3 | 5.11 | 3.43 | 4.02 | 6.11 | .53 | |||||||||||||||
| Class 4 | 4.76 | 3.19 | 3.73 | 5.79 | .85 | |||||||||||||||
Investment results assume all distributions are reinvested and reflect applicable fees and expenses. The fund’s investment adviser waived a portion of its management fees from September 1, 2004, through December 31, 2008, and July 1, 2010, through December 31, 2010. Applicable fund results shown reflect the waiver, without which they would have been lower. Expense ratios are as of the fund’s prospectus dated May 1, 2015 (unaudited). See the Financial Highlights table in this report for details.
Any market index shown is unmanaged and, therefore, has no expenses. Investors cannot invest directly in an index.
| Where the fund’s assets were invested as of December 31, 2014 | Percent of net assets |

| American Funds Insurance Series | 37 |
Cash Management Fund
Fund results shown are for past periods and are not predictive of results for future periods. Current and future results may be lower or higher than those shown. Unit prices and returns will vary, so investors may lose money. An investment in Cash Management Fund is not insured or guaranteed by the FDIC or any other government agency. It is important to remember that the fund is not managed to maintain a stable net asset value at $1.00 per share. For current information and month-end results, visit americanfunds.com/afis. For information about your insurance contract and month-end results, go to the website of the company that issued your contract.
Cash Management Fund declined 0.54% for the 12 months ended December 31, 2014.
Short-term interest rates remained at historically low levels during the year. As a result, the fund’s expenses again exceeded its income.
Investors should expect this situation to continue until short-term rates begin to rise.
Average annual total returns based on a $1,000 investment
| For periods ended December 31, 2014 | ||||||||||||||||||||
| Lifetime | Expense | |||||||||||||||||||
| 1 year | 5 years | 10 years | (since February 8, 1984) | ratio | ||||||||||||||||
| Class 1 | –0.27 | % | –0.21 | % | 1.35 | % | 3.82 | % | .34 | % | ||||||||||
| Class 2 | –0.54 | –0.46 | 1.10 | 3.53 | .59 | |||||||||||||||
| Class 3 | –0.45 | –0.39 | 1.17 | 3.63 | .52 | |||||||||||||||
| Class 4 | –0.44 | –0.56 | 0.92 | 3.33 | .84 | |||||||||||||||
Investment results assume all distributions are reinvested and reflect applicable fees and expenses. The fund’s investment adviser waived a portion of its management fees from September 1, 2004, through December 31, 2008. Applicable fund results shown reflect the waiver, without which they would have been lower. Expense ratios are as of the fund’s prospectus dated May 1, 2015 (unaudited). See the Financial Highlights table in this report for details.
As of December 31, 2014, Cash Management Fund’s annualized seven-day SEC yield was –0.27% for Class 1 shares; –0.52% for Class 2 shares; –0.45% for Class 3 shares; and –0.77% for Class 4 shares. The fund’s yield more accurately reflects the fund’s current earnings than do the fund’s returns.
| Where the fund’s assets were invested as of December 31, 2014 | Percent of net assets | |||
| Federal agency discount notes | 48.7 | % | ||
| U.S. Treasury bills | 33.3 | |||
| Commercial paper | 16.8 | |||
| U.S. Treasury bonds & notes | 1.3 | |||
| Other assets less liabilities | (.1 | ) | ||
| Total | 100.0 | % | ||
| 38 | American Funds Insurance Series |
Managed Risk Growth Fund
Fund results shown are for past periods and are not predictive of results for future periods. Current and future results may be lower or higher than those shown. Unit prices and returns will vary, so investors may lose money. For current information and month-end results, visit americanfunds.com/afis. For information about your insurance contract and month-end results, go to the website of the company that issued your contract.
Managed Risk Growth Fund gained 1.77% for the 12 months ended December 31, 2014, while the S&P 500 rose 13.66%.
Managed Risk Growth Fund pursues its objective by investing in shares of American Funds Insurance Series Growth Fund while seeking to manage portfolio volatility and provide downside protection, primarily through the use of exchange-traded futures contracts that reduce the fund’s effective exposure to stocks.
The benefit of the fund’s managed risk strategy should be most apparent during periods of high volatility and in down markets over a prolonged period. In steady or rising markets, the fund’s results can be expected to lag those of the underlying fund.
How a $10,000 investment has grown
![]()
Average annual total returns based on a $1,000 investment
| For periods ended December 31, 2014 | ||||||||||||||||
| Lifetime | Gross expense | Net expense | ||||||||||||||
| 1 year | (since May 1, 2013) | ratio | ratio | |||||||||||||
| Class P1 | 2.18 | % | 10.18 | % | .97 | % | .81 | % | ||||||||
| Class P2 | 1.77 | 9.86 | 1.22 | 1.06 | ||||||||||||
Investment results assume all distributions are reinvested and reflect applicable fees and expenses. Expense ratios are estimated for the fund’s current fiscal year ending December 31, 2015. The investment adviser is currently waiving a portion of its management fee equal to 0.05% of the fund’s net assets. In addition, the investment adviser is currently reimbursing a portion of other expenses so that they will not exceed 0.28%.Investment results and net expense ratios shown reflect the waiver and reimbursements, without which the results would have been lower and the expenses would have been higher. This waiver and reimbursement will be in effect through at least May 1, 2015, unless modified or terminated by the fund’s board. The adviser may elect at its discretion to extend, modify or terminate the reimbursement at that time. The waiver may only be modified or terminated with the approval of the fund’s board. See the Financial Highlights table in this report for details.
Any market index shown is unmanaged and, therefore, has no expenses. Investors cannot invest directly in an index.
Milliman Financial Risk Management LLC serves as the subadviser with respect to the management of the fund’s managed risk strategy.
| American Funds Insurance Series | 39 |
Managed Risk International Fund
Fund results shown are for past periods and are not predictive of results for future periods. Current and future results may be lower or higher than those shown. Unit prices and returns will vary, so investors may lose money. For current information and month-end results, visit americanfunds.com/afis. For information about your insurance contract and month-end results, go to the website of the company that issued your contract.
Managed Risk International Fund declined 5.68% for the 12 months ended December 31, 2014. The MSCI ACWI (All Country World Index) ex USA lost 3.87%.*
Managed Risk International Fund pursues its objective by investing in shares of American Funds Insurance Series International Fund while seeking to manage portfolio volatility and provide downside protection, primarily through the use of exchange-traded futures contracts that reduce the fund’s effective exposure to stocks.
The benefit of the fund’s managed risk strategy should be most apparent during periods of high volatility and in down markets over a prolonged period. In steady or rising markets, the fund’s results can be expected to lag those of the underlying fund. Most of the fund’s losses came in a period during September and October characterized by markets that moved sharply in one direction followed by a sharp move in the opposite direction.
How a $10,000 investment has grown

Average annual total returns based on a $1,000 investment
| For periods ended December 31, 2014 | ||||||||||||||||
| Lifetime | Gross expense | Net expense | ||||||||||||||
| 1 year | (since May 1, 2013) | ratio | ratio | |||||||||||||
| Class P1 | –5.31 | % | 1.96 | % | 1.14 | % | .98 | % | ||||||||
| Class P2 | –5.68 | 1.67 | 1.39 | 1.23 | ||||||||||||
Investment results assume all distributions are reinvested and reflect applicable fees and expenses. Expense ratios are estimated for the fund’s current fiscal year ending December 31, 2015. The investment adviser is currently waiving a portion of its management fee equal to 0.05% of the fund’s net assets. In addition, the investment adviser is currently reimbursing a portion of other expenses so that they will not exceed 0.28%.Investment results and net expense ratios shown reflect the waiver and reimbursements, without which the results would have been lower and the expenses would have been higher. This waiver and reimbursement will be in effect through at least May 1, 2015, unless modified or terminated by the fund’s board. The adviser may elect at its discretion to extend, modify or terminate the reimbursement at that time. The waiver may only be modified or terminated with the approval of the fund’s board. See the Financial Highlights table in this report for details.
Any market index shown is unmanaged and, therefore, has no expenses. Investors cannot invest directly in an index.
*The MSCI index result reflects reinvestment of distributions and dividends net of withholding taxes.
Milliman Financial Risk Management LLC serves as the subadviser with respect to the management of the fund’s managed risk strategy.
| 40 | American Funds Insurance Series |
Managed Risk Blue Chip Income and Growth Fund
Fund results shown are for past periods and are not predictive of results for future periods. Current and future results may be lower or higher than those shown. Unit prices and returns will vary, so investors may lose money. For current information and month-end results, visit americanfunds.com/afis. For information about your insurance contract and month-end results, go to the website of the company that issued your contract.
Managed Risk Blue Chip Income and Growth Fund gained 8.10% for the 12 months ended December 31, 2014. The S&P 500 advanced 13.66%.
Managed Risk Blue Chip Income and Growth Fund pursues its objective by investing in shares of American Funds Insurance Series Blue Chip Income and Growth Fund while seeking to manage portfolio volatility and provide downside protection, primarily through the use of exchange-traded futures contracts that reduce the fund’s effective exposure to stocks.
The benefit of the fund’s managed risk strategy should be most apparent during periods of high volatility and in down markets over a prolonged period. In steady or rising markets, the fund’s results can be expected to lag those of the underlying fund.
How a $10,000 investment has grown
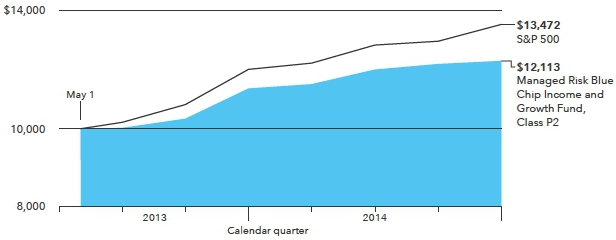
Average annual total returns based on a $1,000 investment
| For periods ended December 31, 2014 | ||||||||||||||||
| Lifetime | Gross expense | Net expense | ||||||||||||||
| 1 year | (since May 1, 2013) | ratio | ratio | |||||||||||||
| Class P1 | 8.58 | % | 12.54 | % | 1.03 | % | .87 | % | ||||||||
| Class P2 | 8.10 | 12.18 | 1.28 | 1.12 | ||||||||||||
Investment results assume all distributions are reinvested and reflect applicable fees and expenses. Expense ratios are estimated for the fund’s current fiscal year ending December 31, 2015. The investment adviser is currently waiving a portion of its management fee equal to 0.05% of the fund’s net assets. In addition, the investment adviser is currently reimbursing a portion of other expenses so that they will not exceed 0.28%.Investment results and net expense ratios shown reflect the waiver and reimbursements, without which the results would have been lower and the expenses would have been higher. This waiver and reimbursement will be in effect through at least May 1, 2015, unless modified or terminated by the fund’s board. The adviser may elect at its discretion to extend, modify or terminate the reimbursement at that time. The waiver may only be modified or terminated with the approval of the fund’s board. See the Financial Highlights table in this report for details.
Any market index shown is unmanaged and, therefore, has no expenses. Investors cannot invest directly in an index.
Milliman Financial Risk Management LLC serves as the subadviser with respect to the management of the fund’s managed risk strategy.
| American Funds Insurance Series | 41 |
Managed Risk Growth-Income Fund
Fund results shown are for past periods and are not predictive of results for future periods. Current and future results may be lower or higher than those shown. Unit prices and returns will vary, so investors may lose money. For current information and month-end results, visit americanfunds.com/afis. For information about your insurance contract and month-end results, go to the website of the company that issued your contract.
Managed Risk Growth-Income Fund gained 4.42% for the 12 months ended December 31, 2014. The S&P 500 rose 13.66%.
Managed Risk Growth-Income Fund pursues its objective by investing in shares of American Funds Insurance Series Growth-Income Fund while seeking to manage portfolio volatility and provide downside protection, primarily through the use of exchange-traded futures contracts that reduce the fund’s effective exposure to stocks.
The benefit of the fund’s managed risk strategy should be most apparent during periods of high volatility and in down markets over a prolonged period. In steady or rising markets, the fund’s results can be expected to lag those of the underlying fund.
How a $10,000 investment has grown

Average annual total returns based on a $1,000 investment
| For periods ended December 31, 2014 | ||||||||||||||||
| Lifetime | Gross expense | Net expense | ||||||||||||||
| 1 year | (since May 1, 2013) | ratio | ratio | |||||||||||||
| Class P1 | 4.85 | % | 12.54 | % | .91 | % | .75 | % | ||||||||
| Class P2 | 4.42 | 12.19 | 1.16 | 1.00 | ||||||||||||
Investment results assume all distributions are reinvested and reflect applicable fees and expenses. Expense ratios are estimated for the fund’s current fiscal year ending December 31, 2015. The investment adviser is currently waiving a portion of its management fee equal to 0.05% of the fund’s net assets. In addition, the investment adviser is currently reimbursing a portion of other expenses so that they will not exceed 0.28%.Investment results and net expense ratios shown reflect the waiver and reimbursements, without which the results would have been lower and the expenses would have been higher. This waiver and reimbursement will be in effect through at least May 1, 2015, unless modified or terminated by the fund’s board. The adviser may elect at its discretion to extend, modify or terminate the reimbursement at that time. The waiver may only be modified or terminated with the approval of the fund’s board. See the Financial Highlights table in this report for details.
Any market index shown is unmanaged and, therefore, has no expenses. Investors cannot invest directly in an index.
Milliman Financial Risk Management LLC serves as the subadviser with respect to the management of the fund’s managed risk strategy.
| 42 | American Funds Insurance Series |
Managed Risk Asset Allocation Fund
Fund results shown are for past periods and are not predictive of results for future periods. Current and future results may be lower or higher than those shown. Unit prices and returns will vary, so investors may lose money. For current information and month-end results, visit americanfunds.com/afis. For information about your insurance contract and month-end results, go to the website of the company that issued your contract.
Managed Risk Asset Allocation Fund gained 2.91% for the 12 months ended December 31, 2014. Over the same period, the S&P 500, which measures U.S. stocks, rose 13.66%, while the Barclays U.S. Aggregate Index, a measure of U.S. investment-grade bonds (rated BBB/Baa and above), gained 5.97%. A blend of the two indexes, the 60/40 S&P/Barclays Index, was up 10.60%.*
Managed Risk Asset Allocation Fund pursues its objective by investing in shares of American Funds Insurance Series Asset Allocation Fund while seeking to manage portfolio volatility and provide downside protection, primarily through the use of exchange-traded futures contracts that reduce the fund’s effective exposure to stocks.
The benefit of the fund’s managed risk strategy should be most apparent during periods of high volatility and in down markets over a prolonged period. In steady or rising markets, the fund’s results can be expected to lag those of the underlying fund.
How a $10,000 investment has grown

Average annual total returns based on a $1,000 investment
| For periods ended December 31, 2014 | ||||||||||||||||
| Lifetime | Gross expense | Expense | ||||||||||||||
| 1 year | (since September 28, 2012) | ratio | ratio | |||||||||||||
| Class P1 | 3.24 | % | 10.89 | % | .82 | % | .76 | % | ||||||||
| Class P2 | 2.91 | 10.62 | 1.07 | 1.01 | ||||||||||||
Investment results assume all distributions are reinvested and reflect applicable fees and expenses. Expense ratios are estimated for the fund’s current fiscal year ending December 31, 2015. The investment adviser is currently waiving a portion of its management fee equal to 0.05% of the fund’s net assets. In addition, the investment adviser is currently reimbursing a portion of other expenses so that they will not exceed 0.28%. Investment results and net expense ratios shown reflect the waiver and reimbursements, without which the results would have been lower and the expenses would have been higher. This waiver and reimbursement will be in effect through at least May 1, 2015, unless modified or terminated by the fund’s board. The adviser may elect at its discretion to extend, modify or terminate the reimbursement at that time. The waiver may only be modified or terminated with the approval of the fund’s board. See the Financial Highlights table in this report for details.
Any market index shown is unmanaged and, therefore, has no expenses. Investors cannot invest directly in an index.
| * | The 60/40 S&P/Barclays Index blends the S&P 500 with the Barclays U.S. Aggregate Index by weighting their total returns at 60% and 40%, respectively. Its result assumes the blend is rebalanced monthly. |
Milliman Financial Risk Management LLC serves as the subadviser with respect to the management of the fund’s managed risk strategy.
| American Funds Insurance Series | 43 |

| 44 | American Funds Insurance Series |
 | |
| Don O’Neal |
Options for every investor
According to the British newspaper The Guardian, “everything good happened in 1984.” That assertion was based on the release of many movies now regarded as classics, including “Ghostbusters,” “The Terminator” and “Beverly Hills Cop.” Others might remember 1984 for the famous TV commercial that introduced Apple to the world.
But investors also have cause to celebrate 1984, because on February 8 of that year American Funds Insurance Series (AFIS) was launched. At its introduction, the series — which marked its 30th anniversary last year — offered just four funds. Assets at the end of 1984 totaled $38 million.
Today, AFIS is one of the nation’s largest variable insurance investment series with a full range of fund options, including managed risk funds, many of which are offered by some of the nation’s leading insurance companies. At December 31, 2014, the series’ assets stood at more than $116 billion.
A search for growth and income
For retirement investors, who need their savings to grow over time to help offset withdrawals and inflation, stock funds offer the potential for the highest returns. A drawback is that they can be volatile, so investors close to or in retirement often have a sizable allocation to bonds, which have tended to hold up better when stocks are down.
AFIS Vice Chairman Don O’Neal, a portfolio manager in the series since 1991 and currently one of five portfolio managers on Growth-Income Fund, explains how AFIS portfolio managers look at the different types of stocks, which can be helpful to investors as they consider their options.
“The way we define a growth stock is different from most other investment managers,” says Don. “Stocks are generally considered by others to be in the growth category if they have a high price-to-earnings ratio. At American Funds, we think of growth stocks as those stocks with the potential for capital appreciation over the long run. They could be fast-growing companies, like Google, for example, but they could also be companies whose stocks we believe are extremely undervalued that also offer the same potential for appreciation. It is a more flexible definition that we believe offers better returns for our shareholders interested in growth.”
At the other end of the spectrum are income-oriented stocks. Says Don, “These are the stocks with relatively high dividend yields, and a dividend yield can be really important to an investor’s total return over time. People often forget about dividends after a long bull market, but they are a very important part of total return — dividends have accounted for more than 40% of U.S. stocks’ average annual return since 1926. Ignoring them would be overlooking a significant part of your total return over the long run. Dividend-paying companies are also considered more conservative investments because they have tended to do significantly better in down markets.”
A growth-and-income fund is a portfolio of stocks that balances two objectives: growth of capital and dividend income. “The total return on any stock is the sum of its capital appreciation and dividend income, so a growth-and-income fund tries to blend the two,” explains Don. “It’s the best of both worlds, and a core way for investors to get exposure to stocks.”
The benefits of bonds
Bond funds help retirement investors by adding diversification and balance to a portfolio. When stock prices go up, bond values often fall and vice versa. This is particularly true of U.S. Treasuries, which can become very popular with larger investors when stock prices decline. Investors with a shorter time horizon may also benefit from the stability that bond funds can add to a broader portfolio. The bonds in AFIS funds generally fall into five categories:
| • | Corporate bonds are issued by companies or corporations that are typically looking to finance investments. Companies often prefer the corporate bond market as a source of financing because it can be cheaper than bank financing and provides greater liquidity. |
| American Funds Insurance Series | 45 |
 |  |
| Thomas Høgh | Alan Berro |
| • | Government bonds, such as U.S. Treasuries, are issued by national governments to fund their operations. Bonds are usually denominated in the currency of the issuing country, but developing countries sometimes issue bonds in a more stable currency to increase their attractiveness to investors. Government bonds are typically highly liquid and unlikely to default because governments can usually raise taxes or cut spending to service their bond debt. |
| • | Mortgage-backed bonds are issued to finance mortgages on private homes. U.S. government agencies such as Fannie Mae have programs that allow many individual mortgages to be pooled and used as collateral for securities issued in the bond market. |
| • | Asset-backed securities are similar to mortgage-backed bonds, but the underlying loans can be credit card debt, auto loans or other loans. |
| • | Global bonds are issued in any country or currency around the world. Bonds issued in currencies other than the U.S. dollar are affected by fluctuations in the issuing currency, so investment managers often strategically use global bonds for the potential of attractive returns from the combination of bond yields and currency gains. |
For AFIS bond fund managers, the key to assessing a bond’s investment potential is the tradeoff between risk and return. “If the yield is high enough to justify the potential risk of a security, then it may be an attractive investment,” explains portfolio manager Thomas Høgh, who manages assets in AFIS Global Bond Fund and U.S. Government/AAA-Rated Securities Fund.
“We look at each security and its specific risk characteristics to judge if the yield and potential return are worth the risk. The factors vary widely depending on the type of security.
“For corporate bonds, it is all about balance sheet strength and how vulnerable a company may be to certain risks. For example, if a company takes over a weaker company, the acquisition costs may pose a substantial risk to its balance sheet.”
With mortgage-backed securities, the main risk is prepayment, which occurs when the mortgage borrowers refinance to take advantage of lower rates. “We analyze likely prepayment speeds under different scenarios to understand the risk associated with each security,” Thomas continues. “If a security is priced above par, or its face value, a prepayment would be very negative for returns because we would only get back the par value.” Factors influencing asset-backed securities vary depending on the type of underlying assets.
Managing volatility
In 2012, AFIS introduced to the series a new type of fund, Managed Risk Asset Allocation Fund, which was followed in 2013 by four similar managed risk funds.
Each of the five managed risk funds invests primarily in shares of its corresponding non-managed risk AFIS fund. A portion of fund assets is used to help manage volatility and provide capital preservation in down markets through the use of exchange-traded futures.
The funds were created for variable annuity investors who are particularly risk-averse and worried about how a significant market downturn might affect their retirement savings. “The typical managed risk investor is older and closer to retirement,” explains Alan Berro, an AFIS portfolio manager for 19 years and one of two AFIS portfolio managers who oversee the managed risk lineup.
“These investors can’t afford to take a large loss if there’s a significant stock market downturn because their period to recover is shorter. Investors who have 15 or 20 years to retirement can be pretty confident that at some point they’ll make their money back. But those who suffer substantial losses shortly before they plan to retire might have to make some significant lifestyle changes in retirement.”
Managed risk funds are a relatively new type of variable annuity investment option, adds Alan. “These funds have come of age in the last few years when we’ve been in a particularly strong market. The returns of our funds and others are in line with what we would expect given the nature of the bull market — i. e., lower than a straight equity fund — so we expect them to be very popular when we have a difficult market environment for a sustained period.
“These funds are ideal for investors who want exposure to equity investments but who are willing to exchange some potential upside for less volatile returns.”
| 46 | American Funds Insurance Series |

“People have the freedom
and independence to
pursue what they think are
the best investments, and
our robust discussions
about the attractiveness of
stocks with diverse points
of view help stress-test our
ideas.” – Don O’Neal
The American Funds Advantage
Underpinning all American Funds Insurance Series funds is the American Funds investment management process, in which each fund is divided among several portfolio managers who invest a portion of fund assets independently.
“One of the things about our approach that some people don’t realize is that it’s not a committee where we debate and vote on potential investments,” explains Don. “We debate to test the merits of our ideas, but we’re not looking for approval. People have the freedom and independence to pursue what they think are the best investments, and our robust discussions about the attractiveness of stocks with diverse points of view help stress-test our ideas.
“Our culture is such that we can agree to disagree and still respect each other. We understand that people have strengths and weaknesses at different parts of the market cycle. There is no single person in charge of all investments, and our collaborative culture allows folks with different ideas to have equal influence on the investment decisions. We really feel that our process is a different kind of investing that gives us a competitive advantage in the long run.”
Adds Alan, “We’re trying to produce outcomes for investors that they couldn’t achieve themselves. Our approach has been particularly effective in down markets. But over the long term, if you lose less when the market is down and can stay close when it’s up, you do very well. I think we’ve proven over time that we strive to limit volatility, which is something our investors really appreciate.”
Evolving to meet investor needs
When it was launched in 1984, AFIS consisted of four variable funds focused almost exclusively on domestic stock and bond markets. Today, there are 23 funds spanning the global investment universe. The latest to join the series, Capital Income Builder,® was added last May after insurance companies asked for a variable annuity option with similar objectives to those of American Funds’ Capital Income Builder,® which seeks to provide current income and a growing stream of income over the years.
AFIS funds are generally launched in May and October, the two times in the year when insurance companies typically introduce a new product to the market. We look to add funds to AFIS when we identify a need for such a fund and believe that we can successfully manage the fund for the benefit of investors. Initial ideas for funds may be generated internally or at the suggestion of insurance companies that offer the AFIS funds as underlying investments for their variable annuity contracts. ■
| American Funds Insurance Series | 47 |
Summary investment portfolio December 31, 2014
| Common stocks 94.45% | Shares | Value (000) | ||||||
| Health care 19.43% | ||||||||
| Vertex Pharmaceuticals Inc.1 | 1,693,000 | $ | 201,128 | |||||
| Novo Nordisk A/S, Class B2 | 4,401,000 | 186,213 | ||||||
| Regeneron Pharmaceuticals, Inc.1 | 314,600 | 129,065 | ||||||
| UnitedHealth Group Inc. | 960,000 | 97,046 | ||||||
| Merck & Co., Inc. | 1,544,000 | 87,684 | ||||||
| Express Scripts Holding Co.1 | 770,000 | 65,196 | ||||||
| Bristol-Myers Squibb Co. | 929,600 | 54,874 | ||||||
| Novartis AG2 | 580,000 | 53,341 | ||||||
| Bayer AG2 | 349,300 | 47,753 | ||||||
| Hologic, Inc.1 | 1,613,000 | 43,132 | ||||||
| Other securities | 116,508 | |||||||
| 1,081,940 | ||||||||
| Information technology 18.67% | ||||||||
| ASML Holding NV (New York registered) | 647,176 | 69,785 | ||||||
| ASML Holding NV2 | 624,897 | 66,949 | ||||||
| Taiwan Semiconductor Manufacturing Co. Ltd.2 | 23,380,000 | 103,170 | ||||||
| Taiwan Semiconductor Manufacturing Co. Ltd. (ADR) | 480,000 | 10,742 | ||||||
| Google Inc., Class A1 | 107,700 | 57,152 | ||||||
| Google Inc., Class C1 | 107,700 | 56,693 | ||||||
| Alcatel-Lucent1,2 | 22,539,144 | 80,018 | ||||||
| Visa Inc., Class A | 263,300 | 69,037 | ||||||
| Microsoft Corp. | 1,202,000 | 55,833 | ||||||
| Nintendo Co., Ltd.2 | 535,000 | 55,758 | ||||||
| Alibaba Group Holding Ltd. (ADR)1 | 476,150 | 49,491 | ||||||
| ASM Pacific Technology Ltd.2 | 3,900,000 | 37,077 | ||||||
| Wirecard AG2 | 825,662 | 36,420 | ||||||
| Other securities | 291,852 | |||||||
| 1,039,977 | ||||||||
| Consumer discretionary 18.12% | ||||||||
| Amazon.com, Inc.1 | 508,900 | 157,937 | ||||||
| Home Depot, Inc. | 1,161,000 | 121,870 | ||||||
| Priceline Group Inc.1 | 104,000 | 118,582 | ||||||
| Walt Disney Co. | 683,705 | 64,398 | ||||||
| Toyota Motor Corp.2 | 950,000 | 59,243 | ||||||
| Liberty Global PLC, Class C1 | 816,465 | 39,443 | ||||||
| Liberty Global PLC, Class A1 | 327,449 | 16,440 | ||||||
| Industria de Diseño Textil, SA2 | 1,460,000 | 41,833 | ||||||
| HUGO BOSS AG2 | 335,500 | 41,191 | ||||||
| Swatch Group Ltd, non-registered shares2 | 64,530 | 28,654 | ||||||
| Swatch Group Ltd2 | 135,500 | 11,720 | ||||||
| CBS Corp., Class B | 702,500 | 38,876 | ||||||
| Other securities | 268,987 | |||||||
| 1,009,174 | ||||||||
| Financials 14.09% | ||||||||
| Moody’s Corp. | 1,651,000 | 158,182 | ||||||
| JPMorgan Chase & Co. | 1,145,000 | 71,654 | ||||||
| ORIX Corp.2 | 4,990,000 | 62,380 | ||||||
| AIA Group Ltd.2 | 11,202,500 | 61,686 | ||||||
| Bankia, SA1,2 | 29,520,000 | 43,764 | ||||||
| HSBC Holdings PLC (GBP denominated)2 | 4,320,228 | 40,828 | ||||||
| ICICI Bank Ltd.2 | 6,625,000 | 36,797 | ||||||
| Sumitomo Mitsui Financial Group, Inc.2 | 462,000 | 16,693 | ||||||
| Other securities | 292,391 | |||||||
| 784,375 | ||||||||
| 48 | American Funds Insurance Series |
Global Growth Fund
| Common stocks | Shares | Value (000) | ||||||
| Industrials 9.21% | ||||||||
| AA PLC1,2 | 12,217,000 | $ | 66,850 | |||||
| Geberit AG2 | 150,000 | 50,975 | ||||||
| KONE Oyj, Class B2 | 880,000 | 39,968 | ||||||
| Other securities | 355,130 | |||||||
| 512,923 | ||||||||
| Consumer staples 6.68% | ||||||||
| Associated British Foods PLC2 | 1,590,000 | 77,251 | ||||||
| Nestlé SA2 | 780,000 | 57,175 | ||||||
| Colgate-Palmolive Co. | 632,000 | 43,728 | ||||||
| Orion Corp.2 | 43,000 | 39,548 | ||||||
| Other securities | 154,142 | |||||||
| 371,844 | ||||||||
| Materials 2.93% | ||||||||
| First Quantum Minerals Ltd. | 2,669,400 | 37,934 | ||||||
| Other securities | 125,098 | |||||||
| 163,032 | ||||||||
| Energy 2.68% | ||||||||
| Oil Search Ltd.2 | 4,986,113 | 32,214 | ||||||
| Other securities | 117,086 | |||||||
| 149,300 | ||||||||
| Telecommunication services 1.31% | ||||||||
| SoftBank Corp.2 | 784,000 | 46,657 | ||||||
| Other securities | 26,431 | |||||||
| 73,088 | ||||||||
| Utilities 0.49% | ||||||||
| Other securities | 27,458 | |||||||
| Miscellaneous 0.84% | ||||||||
| Other common stocks in initial period of acquisition | 46,641 | |||||||
| Total common stocks (cost: $3,872,317,000) | 5,259,752 | |||||||
| Preferred securities 0.07% | ||||||||
| Miscellaneous 0.07% | ||||||||
| Other preferred securities in initial period of acquisition | 3,641 | |||||||
| Total preferred securities (cost: $10,355,000) | 3,641 | |||||||
| Bonds, notes & other debt instruments 0.64% | Principal amount (000) | |||||||
| U.S. Treasury bonds & notes 0.64% | ||||||||
| U.S. Treasury 0.64% | ||||||||
| Other securities | 35,825 | |||||||
| Total bonds, notes & other debt instruments (cost: $35,814,000) | 35,825 | |||||||
| American Funds Insurance Series | 49 |
Global Growth Fund
| Short-term securities 4.63% | Principal amount (000) | Value (000) | ||||||
| Federal Home Loan Bank 0.05%–0.12% due 1/16/2015–5/6/2015 | $ | 42,000 | $ | 41,998 | ||||
| Microsoft Corp. 0.10% due 2/10/20153 | 24,300 | 24,297 | ||||||
| Nordea Bank AB 0.18% due 1/8/20153 | 38,400 | 38,399 | ||||||
| Sumitomo Mitsui Banking Corp. 0.12%–0.22% due 1/13/2015–1/16/20153 | 61,100 | 61,096 | ||||||
| Other securities | 91,885 | |||||||
| Total short-term securities (cost: $257,667,000) | 257,675 | |||||||
| Total investment securities 99.79% (cost: $4,176,153,000) | 5,556,893 | |||||||
| Other assets less liabilities 0.21% | 11,952 | |||||||
| Net assets 100.00% | $ | 5,568,845 | ||||||
This summary investment portfolio is designed to streamline the report and help investors better focus on the fund’s principal holdings. See the inside back cover for details on how to obtain a complete schedule of portfolio holdings.
As permitted by U.S. Securities and Exchange Commission regulations, “Miscellaneous” securities include holdings in their first year of acquisition that have not previously been publicly disclosed.
“Other securities” includes all issues that are not disclosed separately in the summary investment portfolio.
Forward currency contracts
The fund has entered into forward currency contracts as shown in the following table. The average notional amount of open forward currency contracts was $148,388,000 over the prior 12-month period.
| Unrealized | |||||||||||||||
| Contract amount | appreciation | ||||||||||||||
| Receive | Deliver | at 12/31/2014 | |||||||||||||
| Settlement date | Counterparty | (000) | (000) | (000) | |||||||||||
| Sales: | |||||||||||||||
| Japanese yen | 1/14/2015 | JPMorgan Chase | $1,337 | ¥160,000 | $ | 1 | |||||||||
| Japanese yen | 1/15/2015 | UBS AG | $1,337 | ¥160,000 | 1 | ||||||||||
| Japanese yen | 1/16/2015 | Bank of America, N.A. | $4,176 | ¥500,000 | 1 | ||||||||||
| Japanese yen | 1/22/2015 | Bank of America, N.A. | $1,346 | ¥160,000 | 10 | ||||||||||
| Japanese yen | 1/26/2015 | Bank of America, N.A. | $13,438 | ¥1,575,000 | 286 | ||||||||||
| Japanese yen | 2/19/2015 | Bank of New York Mellon | $17,747 | ¥2,050,000 | 625 | ||||||||||
| Japanese yen | 3/4/2015 | Bank of America, N.A. | $82,305 | ¥9,800,000 | 444 | ||||||||||
| $ | 1,368 | ||||||||||||||
The following footnotes apply to either the individual securities noted or one or more of the securities aggregated and listed as a single line item.
| 1 | Security did not produce income during the last 12 months. |
| 2 | Valued under fair value procedures adopted by authority of the board of trustees. The total value of all such securities, including those in “Miscellaneous” and “Other securities,” was $2,548,710,000, which represented 45.77% of the net assets of the fund. This entire amount relates to certain securities trading outside the U.S. whose values were adjusted as a result of significant market movements following the close of local trading. |
| 3 | Acquired in a transaction exempt from registration under Section 4(2) of the Securities Act of 1933. May be resold in the U.S. in transactions exempt from registration, normally to qualified institutional buyers. The total value of all such securities, including those in “Other securities,” was $158,787,000, which represented 2.85% of the net assets of the fund. |
Key to abbreviations and symbol
ADR = American Depositary Receipts
GBP = British pounds
¥ = Japanese yen
See Notes to Financial Statements
| 50 | American Funds Insurance Series |
Global Small Capitalization Fund
Summary investment portfolio December 31, 2014
| Common stocks 93.16% | Shares | Value (000) | ||||||
| Consumer discretionary 20.05% | ||||||||
| Netflix, Inc.1 | 304,000 | $ | 103,849 | |||||
| Lions Gate Entertainment Corp. | 2,844,500 | 91,081 | ||||||
| Domino’s Pizza, Inc. | 512,000 | 48,215 | ||||||
| Paddy Power PLC2 | 523,300 | 43,560 | ||||||
| Penske Automotive Group, Inc. | 812,000 | 39,845 | ||||||
| Melco Crown Entertainment Ltd. (ADR) | 1,432,000 | 36,373 | ||||||
| Cedar Fair, LP | 687,000 | 32,859 | ||||||
| zooplus AG, non-registered shares1,2,3 | 357,716 | 28,557 | ||||||
| John Wiley & Sons, Inc., Class A | 347,500 | 20,586 | ||||||
| Other securities | 389,265 | |||||||
| 834,190 | ||||||||
| Health care 18.79% | ||||||||
| Synageva BioPharma Corp.1 | 1,326,100 | 123,049 | ||||||
| bluebird bio, Inc.1 | 1,144,159 | 104,942 | ||||||
| athenahealth, Inc.1 | 396,600 | 57,785 | ||||||
| Endo International PLC1 | 798,824 | 57,611 | ||||||
| Illumina, Inc.1 | 289,100 | 53,362 | ||||||
| BioMarin Pharmaceutical Inc.1 | 516,800 | 46,719 | ||||||
| Hikma Pharmaceuticals PLC2 | 1,424,000 | 43,669 | ||||||
| Myriad Genetics, Inc.1 | 1,274,898 | 43,423 | ||||||
| Ultragenyx Pharmaceutical Inc.1 | 836,206 | 36,693 | ||||||
| Kite Pharma, Inc.1,4 | 343,739 | 19,823 | ||||||
| Kite Pharma, Inc.1 | 168,000 | 9,689 | ||||||
| Novadaq Technologies Inc.1 | 1,505,700 | 25,025 | ||||||
| GW Pharmaceuticals PLC (ADR)1 | 358,950 | 24,294 | ||||||
| Other securities | 135,577 | |||||||
| 781,661 | ||||||||
| Information technology 14.64% | ||||||||
| TriQuint Semiconductor, Inc.1 | 4,084,978 | 112,541 | ||||||
| Palo Alto Networks, Inc.1 | 523,200 | 64,129 | ||||||
| AAC Technologies Holdings Inc.2 | 11,687,100 | 62,108 | ||||||
| Semiconductor Manufacturing International Corp.1,2 | 358,447,500 | 32,738 | ||||||
| Topcon Corp.2 | 1,306,310 | 27,850 | ||||||
| Hamamatsu Photonics KK2 | 480,300 | 22,951 | ||||||
| Kakaku.com, Inc.2 | 1,510,500 | 21,716 | ||||||
| Other securities | 264,919 | |||||||
| 608,952 | ||||||||
| Industrials 13.81% | ||||||||
| International Container Terminal Services, Inc.2 | 34,610,000 | 88,650 | ||||||
| AA PLC1,2 | 6,770,800 | 37,049 | ||||||
| Intertek Group PLC2 | 955,000 | 34,618 | ||||||
| ITT Corp. | 801,000 | 32,408 | ||||||
| Moog Inc., Class A1 | 432,100 | 31,988 | ||||||
| Polypore International, Inc.1 | 672,000 | 31,618 | ||||||
| JVM Co., Ltd.1,2,3 | 411,500 | 22,472 | ||||||
| Other securities | 295,637 | |||||||
| 574,440 | ||||||||
| Financials 6.45% | ||||||||
| SVB Financial Group1 | 257,600 | 29,900 | ||||||
| Kemper Corp. | 595,000 | 21,485 | ||||||
| Old Republic International Corp. | 1,450,000 | 21,214 | ||||||
| K. Wah International Holdings Ltd.2 | 39,420,410 | 20,870 | ||||||
| Other securities | 174,900 | |||||||
| 268,369 | ||||||||
| American Funds Insurance Series | 51 |
Global Small Capitalization Fund
| Common stocks (continued) | Shares | Value (000) | ||||||
| Materials 4.41% | ||||||||
| PolyOne Corp. | 720,168 | $ | 27,302 | |||||
| AptarGroup, Inc. | 345,500 | 23,093 | ||||||
| OM Group, Inc. | 735,000 | 21,903 | ||||||
| Other securities | 111,303 | |||||||
| 183,601 | ||||||||
| Energy 4.14% | ||||||||
| InterOil Corp.1 | 1,184,235 | 57,779 | ||||||
| Other securities | 114,528 | |||||||
| 172,307 | ||||||||
| Consumer staples 3.28% | ||||||||
| Puregold Price Club, Inc.1,2 | 37,418,000 | 32,071 | ||||||
| Other securities | 104,405 | |||||||
| 136,476 | ||||||||
| Utilities 2.03% | ||||||||
| ENN Energy Holdings Ltd.2 | 9,515,700 | 53,812 | ||||||
| Other securities | 30,492 | |||||||
| 84,304 | ||||||||
| Telecommunication services 0.63% | ||||||||
| Other securities | 26,382 | |||||||
| Miscellaneous 4.93% | ||||||||
| Other common stocks in initial period of acquisition | 205,254 | |||||||
| Total common stocks (cost: $2,953,292,000) | 3,875,936 | |||||||
| Rights & warrants 0.00% | ||||||||
| Energy 0.00% | ||||||||
| Other securities | 83 | |||||||
| Miscellaneous 0.00% | ||||||||
| Other rights & warrants in initial period of acquisition | 53 | |||||||
| Total rights & warrants (cost: $506,000) | 136 | |||||||
| Convertible stocks 0.12% | ||||||||
| Health care 0.12% | ||||||||
| Other securities | 4,961 | |||||||
| Total convertible stocks (cost: $3,307,000) | 4,961 | |||||||
| Bonds, notes & other debt instruments 0.25% | Principal amount (000) | |||||||
| U.S. Treasury bonds & notes 0.25% | ||||||||
| U.S. Treasury 0.25% | ||||||||
| Other securities | 10,130 | |||||||
| Total bonds, notes & other debt instruments (cost: $10,126,000) | 10,130 | |||||||
| 52 | American Funds Insurance Series |
Global Small Capitalization Fund
| Short-term securities 6.53% | Principal amount (000) | Value (000) | ||||||
| Abbott Laboratories 0.10% due 2/2/20155 | $ | 20,000 | $ | 19,999 | ||||
| American Honda Finance Corp. 0.11% due 1/9/2015 | 27,000 | 26,999 | ||||||
| Sumitomo Mitsui Banking Corp. 0.12%–0.22% due 1/13/2015–1/16/20155 | 39,000 | 38,997 | ||||||
| Toronto-Dominion Holdings USA Inc. 0.16% due 1/22/20155 | 30,000 | 29,998 | ||||||
| Victory Receivables Corp. 0.16%–0.19% due 1/12/2015–1/28/20155 | 49,700 | 49,696 | ||||||
| Other securities | 105,989 | |||||||
| Total short-term securities (cost: $271,673,000) | 271,678 | |||||||
| Total investment securities 100.06% (cost: $3,238,904,000) | 4,162,841 | |||||||
| Other assets less liabilities (0.06)% | (2,297 | ) | ||||||
| Net assets 100.00% | $ | 4,160,544 | ||||||
This summary investment portfolio is designed to streamline the report and help investors better focus on the fund’s principal holdings. See the inside back cover for details on how to obtain a complete schedule of portfolio holdings.
As permitted by U.S. Securities and Exchange Commission regulations, “Miscellaneous” securities include holdings in their first year of acquisition that have not previously been publicly disclosed.
“Other securities” includes all issues that are not disclosed separately in the summary investment portfolio.
Forward currency contracts
The fund has entered into forward currency contracts as shown in the following table. The average notional amount of open forward currency contracts was $12,323,000 over the prior 12-month period.
| Unrealized | |||||||||||||||
| appreciation | |||||||||||||||
| Contract amount | (depreciation) | ||||||||||||||
| Receive | Deliver | at 12/31/2014 | |||||||||||||
| Settlement date | Counterparty | (000) | (000) | (000) | |||||||||||
| Sales: | |||||||||||||||
| Australian dollars | 1/22/2015 | UBS AG | $871 | A$1,000 | $ | 56 | |||||||||
| Australian dollars | 1/22/2015 | Barclays Bank PLC | $814 | A$1,000 | (1) | ||||||||||
| Euros | 1/8/2015 | HSBC Bank | $2,652 | €2,114 | 94 | ||||||||||
| Japanese yen | 1/8/2015 | UBS AG | $5,973 | ¥697,000 | 154 | ||||||||||
| Japanese yen | 1/27/2015 | UBS AG | $5,115 | ¥600,000 | 104 | ||||||||||
| $ | 407 | ||||||||||||||
| American Funds Insurance Series | 53 |
Global Small Capitalization Fund
Investments in affiliates
A company is an affiliate of the fund under the Investment Company Act of 1940 if the fund’s holdings in that company represent 5% or more of the outstanding voting shares. The value of the fund’s affiliated-company holdings is either shown in the summary investment portfolio or included in the value of “Other securities” under the respective industry sectors. Further details on such holdings and related transactions during the year ended December 31, 2014, appear below.
| Value of | ||||||||||||||||||||||||
| Dividend | affiliates at | |||||||||||||||||||||||
| Beginning | Ending | income | 12/31/2014 | |||||||||||||||||||||
| shares | Additions | Reductions | shares | (000) | (000) | |||||||||||||||||||
| zooplus AG, non-registered shares1,2 | 357,716 | — | — | 357,716 | $ | — | $ | 28,557 | ||||||||||||||||
| JVM Co., Ltd.1,2 | 411,500 | — | — | 411,500 | — | 22,472 | ||||||||||||||||||
| Time Technoplast Ltd.2 | 11,888,000 | — | — | 11,888,000 | 88 | 9,979 | ||||||||||||||||||
| Victoria Oil & Gas PLC1,2 | 278,662,420 | — | 271,695,860 | 6,966,560 | — | 7,018 | ||||||||||||||||||
| Mauna Kea Technologies SA1,2 | 881,400 | — | — | 881,400 | — | 6,123 | ||||||||||||||||||
| Airesis SA1,2 | 3,294,151 | — | 62,759 | 3,231,392 | — | 4,233 | ||||||||||||||||||
| Canadian Overseas Petroleum Ltd.1 | 16,670,000 | 2,555,000 | — | 19,225,000 | — | 1,655 | ||||||||||||||||||
| Canadian Overseas Petroleum Ltd. (GBP denominated)1,2 | — | 6,050,000 | — | 6,050,000 | — | 448 | ||||||||||||||||||
| Canadian Overseas Petroleum Ltd., warrants, expire 20171,2 | — | 2,555,000 | — | 2,555,000 | — | 44 | ||||||||||||||||||
| Sylvania Platinum Ltd. (CDI)1,2 | 15,000,000 | — | — | 15,000,000 | — | 1,955 | ||||||||||||||||||
| Indochine Mining Ltd.1,2 | 58,574,166 | 34,325,300 | 19,700,000 | 73,199,466 | — | 717 | ||||||||||||||||||
| Wildhorse Energy Ltd.1,2 | 16,227,016 | — | 15,686,116 | 540,900 | — | 23 | ||||||||||||||||||
| Wildhorse Energy Ltd. (CDI)1,2 | 7,225,777 | — | 6,984,918 | 240,859 | — | 11 | ||||||||||||||||||
| Wildhorse Energy Ltd., rights, expire 20151,2 | — | 2,704,500 | — | 2,704,500 | — | 11 | ||||||||||||||||||
| Wildhorse Energy Ltd., rights, expire 2015 (GBP denominated)1,2 | — | 1,204,295 | — | 1,204,295 | — | 7 | ||||||||||||||||||
| Hummingbird Resources PLC1,2,6 | 3,475,000 | — | — | 3,475,000 | — | — | ||||||||||||||||||
| Ultragenyx Pharmaceutical Inc.1,6 | — | 866,206 | 30,000 | 836,206 | — | — | ||||||||||||||||||
| Ultragenyx Pharmaceutical Inc., Series B, convertible preferred6 | 1,904,544 | — | 1,904,544 | — | 134 | — | ||||||||||||||||||
| $ | 222 | $ | 83,253 | |||||||||||||||||||||
| 54 | American Funds Insurance Series |
Global Small Capitalization Fund
The following footnotes apply to either the individual securities noted or one or more of the securities aggregated and listed as a single line item.
| 1 | Security did not produce income during the last 12 months. |
| 2 | Valued under fair value procedures adopted by authority of the board of trustees. The total value of all such securities, including those in “Miscellaneous” and “Other securities,” was $1,668,893,000, which represented 40.11% of the net assets of the fund. This amount includes $1,650,402,000 related to certain securities trading outside the U.S. whose values were adjusted as a result of significant market movements following the close of local trading. |
| 3 | Represents an affiliated company as defined under the Investment Company Act of 1940. |
| 4 | Acquired through a private placement transaction exempt from registration under the Securities Act of 1933. May be subject to legal or contractual restrictions on resale. Further details on these holdings appear below. |
| 5 | Acquired in a transaction exempt from registration under Section 4(2) of the Securities Act of 1933. May be resold in the U.S. in transactions exempt from registration, normally to qualified institutional buyers. The total value of all such securities, including those in “Other securities,” was $203,818,000, which represented 4.90% of the net assets of the fund. |
| 6 | Unaffiliated issuer at 12/31/2014. |
| Percent | ||||||||||||||||
| Acquisition | Cost | Value | of net | |||||||||||||
| Private placement securities | date(s) | (000) | (000) | assets | ||||||||||||
| Kite Pharma, Inc. | 4/24/2014–6/24/2014 | $ | 5,259 | $ | 19,823 | .48 | % | |||||||||
| Other private placement securities | 6/10/2014 | 3,307 | 4,961 | .12 | ||||||||||||
| Total private placement securities | $ | 8,566 | $ | 24,784 | .60 | % | ||||||||||
Key to abbreviations and symbols
ADR = American Depositary Receipts
CDI = CREST Depository Interest
A$ = Australian dollars
€ = Euros
GBP = British pounds
¥ = Japanese yen
See Notes to Financial Statements
| American Funds Insurance Series | 55 |
Summary investment portfolio December 31, 2014
| Common stocks 95.50% | Shares | Value (000) | ||||||
| Consumer discretionary 18.78% | ||||||||
| Amazon.com, Inc.1 | 2,648,216 | $ | 821,874 | |||||
| Home Depot, Inc. | 6,320,000 | 663,410 | ||||||
| Comcast Corp., Class A | 9,555,000 | 554,286 | ||||||
| Twenty-First Century Fox, Inc., Class A | 9,540,000 | 366,384 | ||||||
| Tiffany & Co. | 2,389,000 | 255,289 | ||||||
| Johnson Controls, Inc. | 3,099,100 | 149,810 | ||||||
| NIKE, Inc., Class B | 1,530,000 | 147,109 | ||||||
| Other securities | 1,318,041 | |||||||
| 4,276,203 | ||||||||
| Information technology 18.78% | ||||||||
| ASML Holding NV (New York registered) | 3,444,016 | 371,368 | ||||||
| ASML Holding NV2 | 1,808,186 | 193,723 | ||||||
| Microsoft Corp. | 11,590,000 | 538,355 | ||||||
| Google Inc., Class C1 | 511,000 | 268,991 | ||||||
| Google Inc., Class A1 | 423,000 | 224,469 | ||||||
| Visa Inc., Class A | 1,083,000 | 283,963 | ||||||
| LinkedIn Corp., Class A1 | 1,235,000 | 283,692 | ||||||
| Apple Inc. | 2,500,000 | 275,950 | ||||||
| Facebook, Inc., Class A1 | 3,282,685 | 256,115 | ||||||
| Avago Technologies Ltd. | 1,816,000 | 182,671 | ||||||
| salesforce.com, inc.1 | 2,880,000 | 170,813 | ||||||
| Other securities | 1,224,291 | |||||||
| �� | 4,274,401 | |||||||
| Health care 17.05% | ||||||||
| Express Scripts Holding Co.1 | 4,668,208 | 395,257 | ||||||
| Incyte Corp.1 | 5,340,000 | 390,407 | ||||||
| UnitedHealth Group Inc. | 3,510,000 | 354,826 | ||||||
| Regeneron Pharmaceuticals, Inc.1 | 847,600 | 347,728 | ||||||
| Vertex Pharmaceuticals Inc.1 | 2,680,000 | 318,384 | ||||||
| Centene Corp.1 | 2,288,500 | 237,661 | ||||||
| Hologic, Inc.1 | 7,913,000 | 211,594 | ||||||
| Edwards Lifesciences Corp.1 | 1,285,400 | 163,734 | ||||||
| Biogen Idec Inc.1 | 445,500 | 151,225 | ||||||
| Agios Pharmaceuticals, Inc.1 | 1,255,126 | 140,624 | ||||||
| Other securities | 1,170,557 | |||||||
| 3,881,997 | ||||||||
| Financials 12.97% | ||||||||
| Wells Fargo & Co. | 10,751,096 | 589,375 | ||||||
| Berkshire Hathaway Inc., Class A1 | 1,630 | 368,380 | ||||||
| American Express Co. | 3,000,000 | 279,120 | ||||||
| Capital One Financial Corp. | 2,580,000 | 212,979 | ||||||
| Legal & General Group PLC2 | 45,158,246 | 173,445 | ||||||
| Onex Corp. | 2,523,500 | 146,527 | ||||||
| Other securities | 1,181,773 | |||||||
| 2,951,599 | ||||||||
| Industrials 9.20% | ||||||||
| American Airlines Group Inc. | 5,525,000 | 296,306 | ||||||
| Boeing Co. | 2,250,000 | 292,455 | ||||||
| Oshkosh Corp.3 | 4,947,000 | 240,672 | ||||||
| United Continental Holdings, Inc.1 | 3,200,700 | 214,095 | ||||||
| Union Pacific Corp. | 1,500,000 | 178,695 | ||||||
| Rockwell Collins, Inc. | 1,775,000 | 149,952 | ||||||
| Other securities | 721,139 | |||||||
| 2,093,314 | ||||||||
| 56 | American Funds Insurance Series |
Growth Fund
| Common stocks | Shares | Value (000) | ||||||
| Energy 8.05% | ||||||||
| Noble Energy, Inc. | 4,510,000 | $ | 213,909 | |||||
| Concho Resources Inc.1 | 2,065,000 | 205,984 | ||||||
| Suncor Energy Inc. | 5,502,090 | 174,752 | ||||||
| FMC Technologies, Inc.1 | 3,400,000 | 159,256 | ||||||
| Pioneer Natural Resources Co. | 935,000 | 139,175 | ||||||
| Other securities | 938,931 | |||||||
| 1,832,007 | ||||||||
| Consumer staples 7.32% | ||||||||
| Costco Wholesale Corp. | 2,580,000 | 365,715 | ||||||
| Coca-Cola Co. | 4,670,000 | 197,168 | ||||||
| Philip Morris International Inc. | 2,280,000 | 185,706 | ||||||
| PepsiCo, Inc. | 1,715,000 | 162,171 | ||||||
| Other securities | 754,905 | |||||||
| 1,665,665 | ||||||||
| Materials 2.17% | ||||||||
| Potash Corp. of Saskatchewan Inc. | 4,000,000 | 141,280 | ||||||
| Other securities | 352,741 | |||||||
| 494,021 | ||||||||
| Other 0.36% | ||||||||
| Other securities | 83,427 | |||||||
| Miscellaneous 0.82% | ||||||||
| Other common stocks in initial period of acquisition | 186,562 | |||||||
| Total common stocks (cost: $14,434,935,000) | 21,739,196 | |||||||
| Preferred securities 0.00% | ||||||||
| Miscellaneous 0.00% | ||||||||
| Other preferred securities in initial period of acquisition | 827 | |||||||
| Total preferred securities (cost: $2,353,000) | 827 | |||||||
| Rights & warrants 0.08% | ||||||||
| Energy 0.08% | ||||||||
| Other securities | 17,417 | |||||||
| Total rights & warrants (cost: $17,736,000) | 17,417 | |||||||
| Short-term securities 4.47% | Principal amount (000) | |||||||
| Apple Inc. 0.11% due 1/9/20154 | $ | 18,500 | 18,500 | |||||
| Coca-Cola Co. 0.25% due 7/13/20154 | 55,000 | 54,935 | ||||||
| Federal Farm Credit Banks 0.08%–0.12% due 5/20/2015–7/28/2015 | 138,600 | 138,530 | ||||||
| Federal Home Loan Bank 0.05%–0.17% due 1/16/2015–8/18/2015 | 430,381 | 430,249 | ||||||
| Google Inc. 0.09%–0.15% due 2/25/2015–3/24/20154 | 38,400 | 38,392 | ||||||
| Other securities | 335,829 | |||||||
| Total short-term securities (cost: $1,016,410,000) | 1,016,435 | |||||||
| Total investment securities 100.05% (cost: $15,471,434,000) | 22,773,875 | |||||||
| Other assets less liabilities (0.05)% | (10,910 | ) | ||||||
| Net assets 100.00% | $ | 22,762,965 | ||||||
| American Funds Insurance Series | 57 |
Growth Fund
This summary investment portfolio is designed to streamline the report and help investors better focus on the fund’s principal holdings. See the inside back cover for details on how to obtain a complete schedule of portfolio holdings.
As permitted by U.S. Securities and Exchange Commission regulations, “Miscellaneous” securities include holdings in their first year of acquisition that have not previously been publicly disclosed.
“Other securities” includes all issues that are not disclosed separately in the summary investment portfolio.
Investments in affiliates
A company is an affiliate of the fund under the Investment Company Act of 1940 if the fund’s holdings in that company represent 5% or more of the outstanding voting shares. The value of the fund’s affiliated-company holdings is either shown in the summary investment portfolio or included in the value of “Other securities” under the respective industry sectors. Further details on such holdings and related transactions during the year ended December 31, 2014, appear below.
| Value of | ||||||||||||||||||||||||
| Dividend | affiliates at | |||||||||||||||||||||||
| Beginning | Ending | income | 12/31/2014 | |||||||||||||||||||||
| shares | Additions | Reductions | shares | (000) | (000) | |||||||||||||||||||
| Oshkosh Corp. | 4,947,000 | — | — | 4,947,000 | $ | 3,067 | $ | 240,672 | ||||||||||||||||
| KGen Power Corp.1,2,5 | 3,166,128 | — | — | 3,166,128 | — | 886 | ||||||||||||||||||
| $ | 3,067 | $ | 241,558 |
The following footnotes apply to either the individual securities noted or one or more of the securities aggregated and listed as a single line item.
| 1 | Security did not produce income during the last 12 months. |
| 2 | Valued under fair value procedures adopted by authority of the board of trustees. The total value of all such securities, including those in “Miscellaneous” and “Other securities,” was $1,832,419,000, which represented 8.05% of the net assets of the fund. This amount includes $1,809,130,000 related to certain securities trading outside the U.S. whose values were adjusted as a result of significant market movements following the close of local trading. |
| 3 | Represents an affiliated company as defined under the Investment Company Act of 1940. |
| 4 | Acquired in a transaction exempt from registration under Rule 144A or Section 4(2) of the Securities Act of 1933. May be resold in the U.S. in transactions exempt from registration, normally to qualified institutional buyers. The total value of all such securities, including those in “Other securities,” was $207,006,000, which represented .91% of the net assets of the fund. |
| 5 | Acquired through a private placement transaction exempt from registration under the Securities Act of 1933. May be subject to legal or contractual restrictions on resale. Further details on this holding appear below. |
| Percent | ||||||||||||||||
| Acquisition | Cost | Value | of net | |||||||||||||
| Private placement securities | date(s) | (000) | (000) | assets | ||||||||||||
| KGen Power Corp. | 12/19/2006 | $ | — | $ | 886 | .00 | % | |||||||||
| Other private placement securities | 6/21/2011–11/24/2014 | 62,124 | 13,352 | .06 | ||||||||||||
| Total private placement securities | $ | 62,124 | $ | 14,238 | .06 | % | ||||||||||
See Notes to Financial Statements
| 58 | American Funds Insurance Series |
Summary investment portfolio December 31, 2014
| Common stocks 92.68% | Shares | Value (000) | ||||||
| Financials 19.59% | ||||||||
| AIA Group Ltd.1 | 34,668,700 | $ | 190,902 | |||||
| Axis Bank Ltd.1 | 22,781,004 | 179,974 | ||||||
| Barclays PLC1 | 37,251,875 | 140,048 | ||||||
| Prudential PLC1 | 4,688,265 | 107,887 | ||||||
| HDFC Bank Ltd.1 | 5,164,608 | 77,452 | ||||||
| Credit Suisse Group AG1 | 2,879,624 | 72,189 | ||||||
| Sun Hung Kai Properties Ltd.1 | 4,412,783 | 66,728 | ||||||
| UniCredit SpA1 | 10,059,241 | 64,113 | ||||||
| Housing Development Finance Corp. Ltd.1 | 3,333,000 | 59,628 | ||||||
| Henderson Land Development Co. Ltd.1 | 8,419,450 | 58,443 | ||||||
| BNP Paribas SA1 | 966,046 | 56,769 | ||||||
| Commerzbank AG, non-registered shares1,2 | 4,267,872 | 56,697 | ||||||
| Other securities | 380,293 | |||||||
| 1,511,123 | ||||||||
| Consumer discretionary 15.11% | ||||||||
| Volkswagen AG, nonvoting preferred1 | 492,162 | 109,935 | ||||||
| Numericable Group SA, non-registered shares1,2 | 2,011,856 | 99,205 | ||||||
| Sands China Ltd.1 | 16,642,000 | 80,943 | ||||||
| Altice SA1,2 | 1,014,127 | 80,027 | ||||||
| Toyota Motor Corp.1 | 876,200 | 54,640 | ||||||
| Melco Crown Entertainment Ltd. (ADR) | 1,985,000 | 50,419 | ||||||
| Other securities | 689,929 | |||||||
| 1,165,098 | ||||||||
| Health care 14.05% | ||||||||
| Novartis AG1 | 3,642,900 | 335,028 | ||||||
| Bayer AG1 | 1,819,055 | 248,682 | ||||||
| Novo Nordisk A/S, Class B1 | 2,309,340 | 97,712 | ||||||
| Grifols, SA, Class B, non-registered shares1 | 1,735,509 | 58,951 | ||||||
| Grifols, SA, Class A, non-registered shares1 | 440,500 | 17,535 | ||||||
| Grifols, SA, Class B (ADR) | 396,845 | 13,489 | ||||||
| Fresenius SE & Co. KGaA1 | 1,381,806 | 72,158 | ||||||
| UCB SA1 | 900,000 | 68,301 | ||||||
| Merck KGaA1 | 620,000 | 58,817 | ||||||
| Other securities | 112,739 | |||||||
| 1,083,412 | ||||||||
| Information technology 11.49% | ||||||||
| Baidu, Inc., Class A (ADR)2 | 790,000 | 180,096 | ||||||
| Samsung Electronics Co. Ltd.1 | 137,640 | 165,450 | ||||||
| Murata Manufacturing Co., Ltd.1 | 757,100 | 82,701 | ||||||
| ASML Holding NV1 | 617,834 | 66,192 | ||||||
| Tencent Holdings Ltd.1 | 4,262,500 | 61,160 | ||||||
| Gemalto NV1 | 709,453 | 57,952 | ||||||
| Other securities | 272,339 | |||||||
| 885,890 | ||||||||
| Industrials 11.01% | ||||||||
| Ryanair Holdings PLC (ADR)2 | 1,654,800 | 117,937 | ||||||
| SMC Corp.1 | 440,100 | 114,605 | ||||||
| Jardine Matheson Holdings Ltd.1 | 1,217,600 | 74,092 | ||||||
| Legrand SA1 | 1,180,000 | 61,772 | ||||||
| Airbus Group NV1 | 1,140,514 | 56,646 | ||||||
| KONE Oyj, Class B1 | 1,211,900 | 55,042 | ||||||
| Other securities | 368,739 | |||||||
| 848,833 | ||||||||
| American Funds Insurance Series | 59 |
International Fund
| Common stocks (continued) | Shares | Value (000) | ||||||
| Consumer staples 5.79% | ||||||||
| Nestlé SA1 | 1,836,700 | $ | 134,633 | |||||
| Pernod Ricard SA1 | 840,200 | 93,159 | ||||||
| Associated British Foods PLC1 | 1,443,588 | 70,138 | ||||||
| Other securities | 148,840 | |||||||
| 446,770 | ||||||||
| Materials 3.98% | ||||||||
| Syngenta AG1 | 189,900 | 60,977 | ||||||
| Other securities | 245,630 | |||||||
| 306,607 | ||||||||
| Utilities 3.46% | ||||||||
| Power Grid Corp. of India Ltd.1 | 68,214,040 | 148,711 | ||||||
| ENN Energy Holdings Ltd.1 | 9,758,000 | 55,182 | ||||||
| Other securities | 62,641 | |||||||
| 266,534 | ||||||||
| Telecommunication services 2.96% | ||||||||
| SoftBank Corp.1 | 2,175,700 | 129,481 | ||||||
| MTN Group Ltd.1 | 2,712,400 | 51,473 | ||||||
| Other securities | 47,616 | |||||||
| 228,570 | ||||||||
| Energy 2.79% | ||||||||
| Royal Dutch Shell PLC, Class B1 | 1,730,000 | 59,432 | ||||||
| Royal Dutch Shell PLC, Class A (GBP denominated)1 | 461,000 | 15,281 | ||||||
| Other securities | 140,792 | |||||||
| 215,505 | ||||||||
| Miscellaneous 2.45% | ||||||||
| Other common stocks in initial period of acquisition | 188,732 | |||||||
| Total common stocks (cost: $5,674,301,000) | 7,147,074 | |||||||
| Bonds, notes & other debt instruments 0.62% | Principal amount (000) | |||||||
| U.S. Treasury bonds & notes 0.55% | ||||||||
| U.S. Treasury 0.55% | ||||||||
| Other securities | 42,336 | |||||||
| Bonds & notes of governments outside the U.S. 0.07% | ||||||||
| Other securities | 5,954 | |||||||
| Total bonds, notes & other debt instruments (cost: $48,208,000) | 48,290 | |||||||
| Short-term securities 6.38% | ||||||||
| American Honda Finance Corp. 0.11% due 2/9/2015 | $ | 51,600 | 51,592 | |||||
| Bank of Nova Scotia 0.17%–0.18% due 1/13/2015–1/26/20153 | 91,600 | 91,595 | ||||||
| Federal Home Loan Bank 0.09%–0.10% due 2/18/2015–4/17/2015 | 65,600 | 65,596 | ||||||
| Mizuho Funding LLC 0.19%–0.21% due 1/5/2015–2/17/20153 | 73,500 | 73,487 | ||||||
| Other securities | 209,647 | |||||||
| Total short-term securities (cost: $491,905,000) | 491,917 | |||||||
| Total investment securities 99.68% (cost: $6,214,414,000) | 7,687,281 | |||||||
| Other assets less liabilities 0.32% | 24,573 | |||||||
| Net assets 100.00% | $ | 7,711,854 | ||||||
| 60 | American Funds Insurance Series |
International Fund
This summary investment portfolio is designed to streamline the report and help investors better focus on the fund’s principal holdings. See the inside back cover for details on how to obtain a complete schedule of portfolio holdings.
As permitted by U.S. Securities and Exchange Commission regulations, “Miscellaneous” securities include holdings in their first year of acquisition that have not previously been publicly disclosed.
“Other securities” includes all issues that are not disclosed separately in the summary investment portfolio. Some of these securities (with an aggregate value of $0, an aggregate cost of $138,000, and which represented less than .01% of the net assets of the fund) were acquired from 2/11/1998 to 8/31/1998 through private placement transactions exempt from registration under the Securities Act of 1933, which may subject them to legal or contractual restrictions on resale.
Forward currency contracts
The fund has entered into forward currency contracts as shown in the following table. The average notional amount of open forward currency contracts was $196,648,000 over the prior 12-month period.
| Unrealized | ||||||||||||
| Contract amount | appreciation | |||||||||||
| Receive | Deliver | at 12/31/2014 | ||||||||||
| Settlement date | Counterparty | (000) | (000) | (000) | ||||||||
| Sales: | ||||||||||||
| Australian dollars | 1/22/2015 | UBS AG | $6,095 | A$7,000 | $ 390 | |||||||
| Euros | 1/7/2015 | Bank of America, N.A. | $22,483 | €18,000 | 700 | |||||||
| Euros | 1/23/2015 | Bank of America, N.A. | $2,108 | €1,694 | 58 | |||||||
| Japanese yen | 1/8/2015 | UBS AG | $13,069 | ¥1,525,000 | 336 | |||||||
| Japanese yen | 1/9/2015 | Barclays Bank PLC | $117,678 | ¥13,846,000 | 2,073 | |||||||
| Japanese yen | 1/16/2015 | Barclays Bank PLC | $19,022 | ¥2,250,000 | 235 | |||||||
| Swiss francs | 1/14/2015 | Citibank | $11,274 | CHF10,900 | 309 | |||||||
| $4,101 | ||||||||||||
The following footnotes apply to either the individual securities noted or one or more of the securities aggregated and listed as a single line item.
| 1 | Valued under fair value procedures adopted by authority of the board of trustees. The total value of all such securities, including those in “Miscellaneous” and “Other securities,” was $6,549,203,000, which represented 84.92% of the net assets of the fund. This amount includes $6,542,173,000 related to certain securities trading outside the U.S. whose values were adjusted as a result of significant market movements following the close of local trading. |
| 2 | Security did not produce income during the last 12 months. |
| 3 | Acquired in a transaction exempt from registration under Section 4(2) of the Securities Act of 1933. May be resold in the U.S. in transactions exempt from registration, normally to qualified institutional buyers. The total value of all such securities, including those in “Other securities,” was $303,632,000, which represented 3.94% of the net assets of the fund. |
Key to abbreviations and symbols
ADR = American Depositary Receipts
A$ = Australian dollars
CHF = Swiss francs
€ = Euros
GBP = British pounds
¥ = Japanese yen
See Notes to Financial Statements
| American Funds Insurance Series | 61 |
Summary investment portfolio December 31, 2014
| Common stocks 75.75% | Shares | Value (000) | ||||||
| Information technology 13.41% | ||||||||
| Alcatel-Lucent1,2 | 16,426,961 | $ | 58,319 | |||||
| Baidu, Inc., Class A (ADR)1 | 184,700 | 42,106 | ||||||
| Google Inc., Class A1 | 37,400 | 19,847 | ||||||
| Google Inc., Class C1 | 37,400 | 19,687 | ||||||
| Taiwan Semiconductor Manufacturing Co. Ltd.2 | 5,322,000 | 23,485 | ||||||
| Taiwan Semiconductor Manufacturing Co. Ltd. (ADR) | 540,000 | 12,085 | ||||||
| Murata Manufacturing Co., Ltd.2 | 301,000 | 32,879 | ||||||
| Infosys Ltd.2 | 798,222 | 24,826 | ||||||
| Cognizant Technology Solutions Corp., Class A1 | 435,000 | 22,907 | ||||||
| Other securities | 89,970 | |||||||
| 346,111 | ||||||||
| Financials 12.85% | ||||||||
| ICICI Bank Ltd.2 | 5,603,830 | 31,125 | ||||||
| ICICI Bank Ltd. (ADR) | 1,000,000 | 11,550 | ||||||
| AEON Financial Service Co., Ltd.2 | 1,740,000 | 34,016 | ||||||
| Citigroup Inc. | 560,000 | 30,302 | ||||||
| Fibra Uno Administración, SA de CV | 9,301,578 | 27,412 | ||||||
| Housing Development Finance Corp. Ltd.2 | 1,353,000 | 24,205 | ||||||
| Grupo Financiero Santander México, SAB de CV, Class B (ADR) | 2,230,000 | 23,103 | ||||||
| American Tower Corp. | 225,000 | 22,241 | ||||||
| Other securities | 127,901 | |||||||
| 331,855 | ||||||||
| Consumer discretionary 12.33% | ||||||||
| Naspers Ltd., Class N2 | 309,919 | 39,901 | ||||||
| Domino’s Pizza, Inc. | 418,000 | 39,363 | ||||||
| Ctrip.com International, Ltd. (ADR)1 | 718,500 | 32,692 | ||||||
| Maruti Suzuki India Ltd.2 | 519,500 | 27,311 | ||||||
| Toyota Motor Corp.2 | 398,900 | 24,876 | ||||||
| Arcos Dorados Holdings Inc., Class A | 4,289,656 | 23,207 | ||||||
| Zee Entertainment Enterprises Ltd.2 | 3,832,000 | 23,011 | ||||||
| Melco International Development Ltd.2 | 8,155,000 | 17,854 | ||||||
| Other securities | 90,068 | |||||||
| 318,283 | ||||||||
| Consumer staples 8.80% | ||||||||
| LT Group, Inc.2 | 104,395,900 | 28,302 | ||||||
| Pernod Ricard SA2 | 208,900 | 23,162 | ||||||
| Lenta Ltd. (GDR)1,2 | 3,267,900 | 22,088 | ||||||
| ITC Ltd.2 | 3,715,000 | 21,630 | ||||||
| Nestlé SA2 | 293,696 | 21,528 | ||||||
| Magnit OJSC (GDR)2 | 388,100 | 17,501 | ||||||
| Other securities | 92,972 | |||||||
| 227,183 | ||||||||
| Health care 6.84% | ||||||||
| Novo Nordisk A/S, Class B2 | 1,035,600 | 43,818 | ||||||
| Novartis AG2 | 280,500 | 25,797 | ||||||
| Novartis AG (ADR) | 134,000 | 12,416 | ||||||
| Other securities | 94,440 | |||||||
| 176,471 | ||||||||
| Energy 6.70% | ||||||||
| Reliance Industries Ltd.2 | 3,042,302 | 42,796 | ||||||
| Royal Dutch Shell PLC, Class B2 | 600,000 | 20,612 | ||||||
| Royal Dutch Shell PLC, Class B (ADR) | 95,000 | 6,608 | ||||||
| InterOil Corp.1 | 518,000 | 25,273 | ||||||
| Oil Search Ltd.2 | 2,716,613 | 17,551 | ||||||
| Other securities | 60,172 | |||||||
| 173,012 | ||||||||
| 62 | American Funds Insurance Series |
New World Fund
| Common stocks | Shares | Value (000) | ||||||
| Industrials 4.12% | ||||||||
| Cummins Inc. | 198,000 | $ | 28,546 | |||||
| Airbus Group NV2 | 431,929 | 21,453 | ||||||
| ASSA ABLOY AB, Class B2 | 330,886 | 17,486 | ||||||
| Other securities | 38,958 | |||||||
| 106,443 | ||||||||
| Telecommunication services 2.76% | ||||||||
| Reliance Communications Ltd.1,2 | 23,578,631 | 29,696 | ||||||
| Other securities | 41,605 | |||||||
| 71,301 | ||||||||
| Materials 1.92% | ||||||||
| First Quantum Minerals Ltd. | 1,297,000 | 18,431 | ||||||
| Other securities | 31,129 | |||||||
| 49,560 | ||||||||
| Utilities 1.57% | ||||||||
| Other securities | 40,484 | |||||||
| Miscellaneous 4.45% | ||||||||
| Other common stocks in initial period of acquisition | 114,856 | |||||||
| Total common stocks (cost: $1,833,406,000) | 1,955,559 | |||||||
| Preferred securities 0.04% | ||||||||
| Consumer discretionary 0.04% | ||||||||
| Other securities | 1,083 | |||||||
| Total preferred securities (cost: $570,000) | 1,083 | |||||||
| Bonds, notes & other debt instruments 7.38% | Principal amount (000) | |||||||
| Bonds & notes of governments & government agencies outside the U.S. 5.79% | ||||||||
| Other securities | 149,444 | |||||||
| Corporate bonds & notes 0.92% | ||||||||
| Other 0.92% | ||||||||
| Other securities | 23,676 | |||||||
| U.S. Treasury bonds & notes 0.67% | ||||||||
| U.S. Treasury 0.67% | ||||||||
| U.S. Treasury 4.00% 2015 | $ | 17,200 | 17,281 | |||||
| Total bonds, notes & other debt instruments (cost: $193,381,000) | 190,401 | |||||||
| Short-term securities 16.83% | ||||||||
| CAFCO, LLC 0.12% due 1/16/2015 | 25,000 | 24,999 | ||||||
| Chevron Corp. 0.11%–0.14% due 2/9/2015–4/14/20153 | 40,000 | 39,984 | ||||||
| Fannie Mae 0.05%–0.09% due 1/20/2015–5/4/2015 | 45,782 | 45,778 | ||||||
| Federal Home Loan Bank 0.05%–0.11% due 1/16/2015–2/6/2015 | 109,600 | 109,598 | ||||||
| Intel Corp. 0.14% due 1/14/2015 | 20,000 | 19,999 | ||||||
| Mitsubishi UFJ Trust and Banking Corp. 0.17% due 1/9/20153 | 10,000 | 10,000 | ||||||
| Province of Ontario 0.10% due 2/13/2015 | 40,000 | 39,996 | ||||||
| American Funds Insurance Series | 63 |
New World Fund
| Short-term securities (continued) | Principal amount (000) | Value (000) | ||||||
| Svenska Handelsbanken Inc. 0.20% due 2/20/20153 | $ | 20,000 | $ | 19,996 | ||||
| Victory Receivables Corp. 0.17%–0.19% due 1/16/2015–1/28/20153 | 60,000 | 59,995 | ||||||
| Other securities | 64,196 | |||||||
| Total short-term securities (cost: $434,535,000) | 434,541 | |||||||
| Total investment securities 100.00% (cost: $2,461,892,000) | 2,581,584 | |||||||
| Other assets less liabilities (0.00)% | (106 | ) | ||||||
| Net assets 100.00% | $ | 2,581,478 | ||||||
This summary investment portfolio is designed to streamline the report and help investors better focus on the fund’s principal holdings. See the inside back cover for details on how to obtain a complete schedule of portfolio holdings.
As permitted by U.S. Securities and Exchange Commission regulations, “Miscellaneous” securities include holdings in their first year of acquisition that have not previously been publicly disclosed.
“Other securities” includes all issues that are not disclosed separately in the summary investment portfolio.
Forward currency contracts
The fund has entered into forward currency contracts as shown in the following table. The average notional amount of open forward currency contracts was $33,229,000 over the prior 12-month period.
| Unrealized | ||||||||||||
| appreciation | ||||||||||||
| Contract amount | (depreciation) | |||||||||||
| Receive | Deliver | at 12/31/2014 | ||||||||||
| Settlement date | Counterparty | (000) | (000) | (000) | ||||||||
| Sales: | ||||||||||||
| Brazilian reais | 1/12/2015 | Citibank | $3,304 | BRL8,700 | $ 42 | |||||||
| Brazilian reais | 1/16/2015 | UBS AG | $1,192 | BRL3,214 | (12 | ) | ||||||
| Colombian pesos | 1/16/2015 | Citibank | $757 | COP1,742,013 | 24 | |||||||
| Colombian pesos | 1/23/2015 | UBS AG | $3,501 | COP8,524,500 | (83 | ) | ||||||
| Colombian pesos | 1/27/2015 | Barclays Bank PLC | $1,127 | COP2,715,850 | (15 | ) | ||||||
| Euros | 1/12/2015 | HSBC Bank | $62 | €50 | 2 | |||||||
| Euros | 1/14/2015 | JPMorgan Chase | $999 | €800 | 31 | |||||||
| Euros | 1/14/2015 | Bank of America, N.A. | $739 | €600 | 12 | |||||||
| Euros | 1/15/2015 | Bank of America, N.A. | $545 | €440 | 12 | |||||||
| Hungarian forints | 1/15/2015 | HSBC Bank | $1,176 | HUF291,600 | 61 | |||||||
| Indonesian rupiah | 1/8/2015 | JPMorgan Chase | $575 | IDR7,094,950 | 3 | |||||||
| Indonesian rupiah | 1/12/2015 | Citibank | $383 | IDR4,714,400 | 3 | |||||||
| Indonesian rupiah | 1/12/2015 | JPMorgan Chase | $220 | IDR2,737,400 | (1 | ) | ||||||
| Japanese yen | 1/7/2015 | UBS AG | $1,032 | ¥121,900 | 14 | |||||||
| Japanese yen | 1/15/2015 | UBS AG | $526 | ¥63,000 | — | 4 | ||||||
| Japanese yen | 1/22/2015 | Bank of America, N.A. | $1,287 | ¥153,000 | 9 | |||||||
| Mexican pesos | 1/13/2015 | UBS AG | $2,668 | MXN36,300 | 210 | |||||||
| Mexican pesos | 1/22/2015 | HSBC Bank | $554 | MXN8,210 | (2 | ) | ||||||
| Philippine pesos | 1/12/2015 | Barclays Bank PLC | $2,064 | PHP92,650 | (6 | ) | ||||||
| Russian rubles | 1/13/2015 | Citibank | $598 | RUB28,600 | 131 | |||||||
| Russian rubles | 1/16/2015 | JPMorgan Chase | $1,047 | RUB56,975 | 118 | |||||||
| Turkish lira | 1/12/2015 | Citibank | $371 | TRY850 | 8 | |||||||
| Turkish lira | 1/15/2015 | UBS AG | $218 | TRY500 | 5 | |||||||
| $566 | ||||||||||||
| 64 | American Funds Insurance Series |
New World Fund
The following footnotes apply to either the individual securities noted or one or more of the securities aggregated and listed as a single line item.
| 1 | Security did not produce income during the last 12 months. |
| 2 | Valued under fair value procedures adopted by authority of the board of trustees. The total value of all such securities, including those in “Miscellaneous” and “Other securities,” was $1,265,473,000, which represented 49.02% of the net assets of the fund. This amount includes $1,259,886,000 related to certain securities trading outside the U.S. whose values were adjusted as a result of significant market movements following the close of local trading. |
| 3 | Acquired in a transaction exempt from registration under Rule 144A or Section 4(2) of the Securities Act of 1933. May be resold in the U.S. in transactions exempt from registration, normally to qualified institutional buyers. The total value of all such securities, including those in “Other securities,” was $223,945,000, which represented 8.68% of the net assets of the fund. |
| 4 | Amount less than one thousand. |
Key to abbreviations and symbols
ADR = American Depositary Receipts
GDR = Global Depositary Receipts
BRL = Brazilian reais
COP = Colombian pesos
€ = Euros
HUF = Hungarian forints
IDR = Indonesian rupiah
¥ = Japanese yen
MXN = Mexican pesos
PHP = Philippine pesos
RUB = Russian rubles
TRY = Turkish lira
See Notes to Financial Statements
| American Funds Insurance Series | 65 |
Blue Chip Income and Growth Fund
Summary investment portfolio December 31, 2014
| Common stocks 96.20% | Shares | Value (000) | ||||||
| Health care 16.59% | ||||||||
| Amgen Inc. | 2,694,600 | $ | 429,223 | |||||
| Gilead Sciences, Inc.1 | 3,197,735 | 301,418 | ||||||
| AbbVie Inc. | 1,664,800 | 108,944 | ||||||
| Medtronic, Inc. | 1,375,000 | 99,275 | ||||||
| Teva Pharmaceutical Industries Ltd. (ADR) | 1,202,000 | 69,127 | ||||||
| Bristol-Myers Squibb Co. | 1,125,000 | 66,409 | ||||||
| Novartis AG (ADR) | 708,500 | 65,650 | ||||||
| Other securities | 66,662 | |||||||
| 1,206,708 | ||||||||
| Industrials 15.00% | ||||||||
| Precision Castparts Corp. | 706,000 | 170,061 | ||||||
| General Dynamics Corp. | 1,060,900 | 146,001 | ||||||
| CSX Corp. | 3,372,000 | 122,168 | ||||||
| United Parcel Service, Inc., Class B | 850,000 | 94,494 | ||||||
| Union Pacific Corp. | 750,000 | 89,347 | ||||||
| Cummins Inc. | 473,100 | 68,207 | ||||||
| Norfolk Southern Corp. | 592,800 | 64,977 | ||||||
| Illinois Tool Works Inc. | 650,000 | 61,555 | ||||||
| General Electric Co. | 2,400,000 | 60,648 | ||||||
| United Technologies Corp. | 500,000 | 57,500 | ||||||
| Other securities | 155,613 | |||||||
| 1,090,571 | ||||||||
| Information technology 13.49% | ||||||||
| Apple Inc. | 1,642,377 | 181,285 | ||||||
| Western Union Co. | 8,225,000 | 147,310 | ||||||
| Texas Instruments Inc. | 2,630,000 | 140,613 | ||||||
| Cisco Systems, Inc. | 5,015,000 | 139,492 | ||||||
| Oracle Corp. | 2,395,000 | 107,703 | ||||||
| Microsoft Corp. | 1,400,000 | 65,030 | ||||||
| International Business Machines Corp. | 330,000 | 52,945 | ||||||
| Other securities | 146,319 | |||||||
| 980,697 | ||||||||
| Consumer staples 10.84% | ||||||||
| Altria Group, Inc. | 4,654,000 | 229,303 | ||||||
| Philip Morris International Inc. | 2,497,400 | 203,413 | ||||||
| Kraft Foods Group, Inc. | 1,076,666 | 67,464 | ||||||
| Kimberly-Clark Corp. | 500,000 | 57,770 | ||||||
| Mondelez International, Inc. | 1,580,000 | 57,394 | ||||||
| Coca-Cola Co. | 1,250,000 | 52,775 | ||||||
| Other securities | 120,100 | |||||||
| 788,219 | ||||||||
| Telecommunication services 8.90% | ||||||||
| Verizon Communications Inc. | 7,491,339 | 350,445 | ||||||
| CenturyLink, Inc. | 4,908,135 | 194,264 | ||||||
| AT&T Inc. | 3,060,000 | 102,785 | ||||||
| 647,494 | ||||||||
| Consumer discretionary 7.99% | ||||||||
| Johnson Controls, Inc. | 3,546,000 | 171,414 | ||||||
| General Motors Co. | 3,625,000 | 126,549 | ||||||
| Darden Restaurants, Inc. | 2,045,000 | 119,898 | ||||||
| Las Vegas Sands Corp. | 1,234,000 | 71,769 | ||||||
| Other securities | 91,779 | |||||||
| 581,409 | ||||||||
| 66 | American Funds Insurance Series |
Blue Chip Income and Growth Fund
| Common stocks | Shares | Value (000) | ||||||
| Utilities 7.55% | ||||||||
| Exelon Corp. | 5,913,000 | $ | 219,254 | |||||
| FirstEnergy Corp. | 3,544,200 | 138,188 | ||||||
| PG&E Corp. | 2,413,000 | 128,468 | ||||||
| Other securities | 63,405 | |||||||
| 549,315 | ||||||||
| Energy 5.16% | ||||||||
| Canadian Natural Resources, Ltd. | 4,221,000 | 130,345 | ||||||
| Cabot Oil & Gas Corp. | 3,129,000 | 92,650 | ||||||
| Royal Dutch Shell PLC, Class B (ADR) | 750,000 | 52,170 | ||||||
| Exxon Mobil Corp. | 546,300 | 50,505 | ||||||
| Other securities | 49,813 | |||||||
| 375,483 | ||||||||
| Materials 2.98% | ||||||||
| Praxair, Inc. | 688,000 | 89,137 | ||||||
| Vale SA, Class A, preferred nominative (ADR) | 7,002,000 | 50,835 | ||||||
| Other securities | 76,783 | |||||||
| 216,755 | ||||||||
| Financials 2.78% | ||||||||
| JPMorgan Chase & Co. | 1,870,000 | 117,025 | ||||||
| American International Group, Inc. | 998,000 | 55,898 | ||||||
| Other securities | 29,223 | |||||||
| 202,146 | ||||||||
| Miscellaneous 4.92% | ||||||||
| Other common stocks in initial period of acquisition | 357,685 | |||||||
| Total common stocks (cost: $5,089,072,000) | 6,996,482 | |||||||
| Short-term securities 3.51% | Principal amount (000) | |||||||
| ExxonMobil Corp. 0.08% due 1/27/2015 | $ | 24,100 | 24,098 | |||||
| Freddie Mac 0.06%–0.10% due 2/5/2015–5/6/2015 | 54,100 | 54,093 | ||||||
| Jupiter Securitization Co., LLC 0.27% due 4/27/20152 | 10,000 | 9,993 | ||||||
| Kimberly-Clark Corp. 0.12% due 1/14/20152 | 15,000 | 14,999 | ||||||
| Other securities | 151,881 | |||||||
| Total short-term securities (cost: $255,056,000) | 255,064 | |||||||
| Total investment securities 99.71% (cost: $5,344,128,000) | 7,251,546 | |||||||
| Other assets less liabilities 0.29% | 21,338 | |||||||
| Net assets 100.00% | $ | 7,272,884 | ||||||
| American Funds Insurance Series | 67 |
Blue Chip Income and Growth Fund
This summary investment portfolio is designed to streamline the report and help investors better focus on the fund’s principal holdings. See the inside back cover for details on how to obtain a complete schedule of portfolio holdings.
As permitted by U.S. Securities and Exchange Commission regulations, “Miscellaneous” securities include holdings in their first year of acquisition that have not previously been publicly disclosed.
“Other securities” includes all issues that are not disclosed separately in the summary investment portfolio.
The following footnotes apply to either the individual securities noted or one or more of the securities aggregated and listed as a single line item.
| 1 | Security did not produce income during the last 12 months. |
| 2 | Acquired in a transaction exempt from registration under Section 4(2) of the Securities Act of 1933. May be resold in the U.S. in transactions exempt from registration, normally to qualified institutional buyers. The total value of all such securities, including those in “Other securities,” was $106,984,000, which represented 1.47% of the net assets of the fund. |
Key to abbreviation
ADR = American Depositary Receipts
See Notes to Financial Statements
| 68 | American Funds Insurance Series |
Summary investment portfolio December 31, 2014
| Common stocks 95.00% | Shares | Value (000) | ||||||
| Financials 21.91% | ||||||||
| AXA SA1 | 1,834,360 | $ | 42,367 | |||||
| CME Group Inc., Class A | 365,500 | 32,402 | ||||||
| Wells Fargo & Co. | 445,000 | 24,395 | ||||||
| Banco Santander, SA1,2 | 2,746,403 | 22,965 | ||||||
| ICICI Bank Ltd. (ADR) | 1,575,000 | 18,191 | ||||||
| Suncorp Group Ltd.1 | 1,495,191 | 17,038 | ||||||
| Sun Hung Kai Properties Ltd.1 | 1,094,201 | 16,546 | ||||||
| JPMorgan Chase & Co. | 255,000 | 15,958 | ||||||
| Oaktree Capital Group, LLC | 285,000 | 14,772 | ||||||
| Shinsei Bank, Ltd.1 | 8,060,000 | 14,071 | ||||||
| McGraw Hill Financial, Inc. | 145,500 | 12,947 | ||||||
| Other securities | 181,616 | |||||||
| 413,268 | ||||||||
| Consumer discretionary 12.38% | ||||||||
| D.R. Horton, Inc. | 1,000,000 | 25,290 | ||||||
| Carnival Corp., units | 475,000 | 21,532 | ||||||
| Home Depot, Inc. | 178,000 | 18,685 | ||||||
| HUGO BOSS AG1 | 150,000 | 18,416 | ||||||
| Amazon.com, Inc.2 | 49,400 | 15,331 | ||||||
| Comcast Corp., Class A | 255,000 | 14,792 | ||||||
| Toll Brothers, Inc.2 | 400,000 | 13,708 | ||||||
| Twenty-First Century Fox, Inc., Class A | 335,000 | 12,866 | ||||||
| Other securities | 92,895 | |||||||
| 233,515 | ||||||||
| Information technology 11.99% | ||||||||
| Taiwan Semiconductor Manufacturing Co. Ltd.1 | 12,460,800 | 54,986 | ||||||
| Microsoft Corp. | 922,000 | 42,827 | ||||||
| Cisco Systems, Inc. | 920,000 | 25,590 | ||||||
| Google Inc., Class C2 | 23,850 | 12,555 | ||||||
| Google Inc., Class A2 | 18,400 | 9,764 | ||||||
| ASM Pacific Technology Ltd.1 | 1,477,000 | 14,042 | ||||||
| Avago Technologies Ltd. | 125,000 | 12,573 | ||||||
| Other securities | 53,820 | |||||||
| 226,157 | ||||||||
| Industrials 11.95% | ||||||||
| United Continental Holdings, Inc.2 | 500,000 | 33,445 | ||||||
| Lockheed Martin Corp. | 150,000 | 28,886 | ||||||
| Geberit AG1 | 60,000 | 20,390 | ||||||
| Meggitt PLC1 | 2,519,290 | 20,138 | ||||||
| Abertis Infraestructuras, SA, Class A1 | 969,750 | 19,158 | ||||||
| Masco Corp. | 700,000 | 17,640 | ||||||
| Airbus Group NV1 | 284,000 | 14,105 | ||||||
| Other securities | 71,602 | |||||||
| 225,364 | ||||||||
| Health care 10.86% | ||||||||
| Merck & Co., Inc. | 1,233,900 | 70,073 | ||||||
| Novartis AG1 | 349,000 | 32,097 | ||||||
| Vertex Pharmaceuticals Inc.2 | 238,877 | 28,379 | ||||||
| Pfizer Inc. | 451,000 | 14,049 | ||||||
| Other securities | 60,252 | |||||||
| 204,850 | ||||||||
| American Funds Insurance Series | 69 |
Global Growth and Income Fund
| Common stocks (continued) | Shares | Value (000) | ||||||
| Telecommunication services 7.01% | ||||||||
| Orange1 | 1,970,000 | $ | 33,502 | |||||
| MTN Group Ltd.1 | 1,100,000 | 20,874 | ||||||
| AT&T Inc. | 525,000 | 17,635 | ||||||
| TalkTalk Telecom Group PLC1 | 3,704,000 | 17,405 | ||||||
| Globe Telecom, Inc.1 | 399,695 | 15,349 | ||||||
| Other securities | 27,584 | |||||||
| 132,349 | ||||||||
| Consumer staples 6.15% | ||||||||
| British American Tobacco PLC1 | 338,500 | 18,392 | ||||||
| Philip Morris International Inc. | 175,000 | 14,254 | ||||||
| Other securities | 83,310 | |||||||
| 115,956 | ||||||||
| Materials 5.13% | ||||||||
| Potash Corp. of Saskatchewan Inc. | 841,000 | 29,704 | ||||||
| Newmont Mining Corp. | 1,000,000 | 18,900 | ||||||
| Dow Chemical Co. | 335,000 | 15,279 | ||||||
| Other securities | 32,950 | |||||||
| 96,833 | ||||||||
| Utilities 4.24% | ||||||||
| Exelon Corp. | 500,000 | 18,540 | ||||||
| EDP - Energias de Portugal, SA1 | 4,220,000 | 16,320 | ||||||
| NRG Yield, Inc., Class A | 337,800 | 15,924 | ||||||
| Other securities | 29,278 | |||||||
| 80,062 | ||||||||
| Energy 3.38% | ||||||||
| Other securities | 63,741 | |||||||
| Total common stocks (cost: $1,482,814,000) | 1,792,095 | |||||||
| Preferred securities 0.02% | ||||||||
| Consumer discretionary 0.02% | ||||||||
| Other securities | 458 | |||||||
| Total preferred securities (cost: $256,000) | 458 | |||||||
| Rights & warrants 0.01% | ||||||||
| Financials 0.01% | ||||||||
| Other securities | 129 | |||||||
| Total rights & warrants (cost: $0) | 129 | |||||||
| 70 | American Funds Insurance Series |
Global Growth and Income Fund
| Convertible bonds 0.06% | Principal amount (000) | Value (000) | ||||||
| Consumer discretionary 0.06% | ||||||||
| Other securities | $ | 1,111 | ||||||
| Total convertible bonds (cost: $927,000) | 1,111 | |||||||
| Bonds, notes & other debt instruments 0.75% | ||||||||
| U.S. Treasury bonds & notes 0.38% | ||||||||
| U.S. Treasury 0.38% | ||||||||
| Other securities | 7,210 | |||||||
| Corporate bonds & notes 0.37% | ||||||||
| Other 0.37% | ||||||||
| Other securities | 6,854 | |||||||
| Total bonds, notes & other debt instruments (cost: $16,339,000) | 14,064 | |||||||
| Short-term securities 3.52% | ||||||||
| Mitsubishi UFJ Trust and Banking Corp. 0.16% due 1/15/20153 | $ | 29,100 | 29,098 | |||||
| Mizuho Funding LLC 0.19% due 1/5/20153 | 15,500 | 15,500 | ||||||
| Other securities | 21,892 | |||||||
| Total short-term securities (cost: $66,489,000) | 66,490 | |||||||
| Total investment securities 99.36% (cost: $1,566,825,000) | 1,874,347 | |||||||
| Other assets less liabilities 0.64% | 12,004 | |||||||
| Net assets 100.00% | $ | 1,886,351 | ||||||
This summary investment portfolio is designed to streamline the report and help investors better focus on the fund’s principal holdings. See the inside back cover for details on how to obtain a complete schedule of portfolio holdings.
“Other securities” includes all issues that are not disclosed separately in the summary investment portfolio.
Forward currency contracts
The fund has entered into forward currency contracts as shown in the following table. The average notional amount of open forward currency contracts was $21,353,000 over the prior 12-month period.
| Contract amount | Unrealized appreciation | |||||||||||
| Settlement date | Counterparty | Receive (000) | Deliver (000) | at 12/31/2014 (000) | ||||||||
| Sales: | ||||||||||||
| Australian dollars | 1/12/2015 | Citibank | $3,176 | A$3,840 | $ 44 | |||||||
| Euros | 1/12/2015 | Citibank | $7,835 | €6,300 | 210 | |||||||
| Japanese yen | 1/13/2015 | JPMorgan Chase | $10,610 | ¥1,150,000 | 1,009 | |||||||
| Japanese yen | 1/14/2015 | JPMorgan Chase | $54 | ¥6,500 | — | 4 | ||||||
| Japanese yen | 1/15/2015 | UBS AG | $54 | ¥6,500 | — | 4 | ||||||
| Japanese yen | 1/16/2015 | Bank of America, N.A. | $1,754 | ¥210,000 | 1 | |||||||
| Japanese yen | 1/22/2015 | Bank of America, N.A. | $55 | ¥6,500 | — | 4 | ||||||
| $1,264 | ||||||||||||
| American Funds Insurance Series | 71 |
Global Growth and Income Fund
Investments in affiliates
A company is an affiliate of the fund under the Investment Company Act of 1940 if the fund’s holdings in that company represent 5% or more of the outstanding voting shares. The value of the fund’s affiliated-company holdings is included in “Other securities” under the respective industry sectors in the summary investment portfolio. Further details on such holdings and related transactions during the year ended December 31, 2014, appear below.
| Beginning shares | Additions | Reductions | Ending shares | Dividend income (000) | Value of affiliates at 12/31/2014 (000) | |||||||||||||||||||
| Rickmers Maritime1 | 54,840,000 | — | — | 54,840,000 | $ | 1,316 | $ | 11,584 | ||||||||||||||||
The following footnotes apply to either the individual securities noted or one or more of the securities aggregated and listed as a single line item.
| 1 | Valued under fair value procedures adopted by authority of the board of trustees. The total value of all such securities, including those in “Other securities,” was $817,501,000, which represented 43.34% of the net assets of the fund. This entire amount relates to certain securities trading outside the U.S. whose values were adjusted as a result of significant market movements following the close of local trading. |
| 2 | Security did not produce income during the last 12 months. |
| 3 | Acquired in a transaction exempt from registration under Rule 144A or Section 4(2) of the Securities Act of 1933. May be resold in the U.S. in transactions exempt from registration, normally to qualified institutional buyers. The total value of all such securities, including those in “Other securities,” was $45,178,000, which represented 2.39% of the net assets of the fund. |
| 4 | Amount less than one thousand. |
Key to abbreviation and symbols
ADR = American Depositary Receipts
A$ = Australian dollars
€ = Euros
¥ = Japanese yen
See Notes to Financial Statements
| 72 | American Funds Insurance Series |
Summary investment portfolio December 31, 2014
| Common stocks 91.60% | Shares | Value (000) | ||||||
| Health care 17.32% | ||||||||
| Amgen Inc. | 5,356,100 | $ | 853,173 | |||||
| Gilead Sciences, Inc.1 | 7,759,200 | 731,382 | ||||||
| Alexion Pharmaceuticals, Inc.1 | 1,590,000 | 294,198 | ||||||
| Express Scripts Holding Co.1 | 2,600,309 | 220,168 | ||||||
| Stryker Corp. | 2,185,011 | 206,112 | ||||||
| Merck & Co., Inc. | 3,626,080 | 205,925 | ||||||
| UnitedHealth Group Inc. | 1,766,396 | 178,565 | ||||||
| Illumina, Inc.1 | 948,000 | 174,982 | ||||||
| Humana Inc. | 1,193,600 | 171,437 | ||||||
| Edwards Lifesciences Corp.1 | 1,193,900 | 152,079 | ||||||
| Other securities | 1,206,229 | |||||||
| 4,394,250 | ||||||||
| Information technology 16.43% | ||||||||
| Texas Instruments Inc. | 12,199,259 | 652,233 | ||||||
| Google Inc., Class A1 | 606,000 | 321,580 | ||||||
| Google Inc., Class C1 | 577,600 | 304,049 | ||||||
| Oracle Corp. | 10,356,500 | 465,732 | ||||||
| Microsoft Corp. | 8,090,000 | 375,781 | ||||||
| Yahoo! Inc.1 | 5,038,000 | 254,469 | ||||||
| Apple Inc. | 2,246,300 | 247,947 | ||||||
| Accenture PLC, Class A | 2,068,500 | 184,738 | ||||||
| Intuit Inc. | 1,989,400 | 183,403 | ||||||
| Other securities | 1,178,124 | |||||||
| 4,168,056 | ||||||||
| Consumer discretionary 13.03% | ||||||||
| Amazon.com, Inc.1 | 1,898,800 | 589,293 | ||||||
| Home Depot, Inc. | 3,200,000 | 335,904 | ||||||
| Time Warner Inc. | 3,525,000 | 301,105 | ||||||
| Comcast Corp., Class A | 3,962,500 | 229,865 | ||||||
| Comcast Corp., Class A, special nonvoting shares | 1,000,000 | 57,565 | ||||||
| General Motors Co. | 6,952,256 | 242,703 | ||||||
| Royal Caribbean Cruises Ltd. | 1,983,000 | 163,459 | ||||||
| Other securities | 1,385,260 | |||||||
| 3,305,154 | ||||||||
| Industrials 9.51% | ||||||||
| CSX Corp. | 8,124,200 | 294,340 | ||||||
| General Dynamics Corp. | 1,909,300 | 262,758 | ||||||
| Precision Castparts Corp. | 969,800 | 233,605 | ||||||
| Nielsen NV | 4,401,039 | 196,859 | ||||||
| Waste Management, Inc. | 3,138,000 | 161,042 | ||||||
| Other securities | 1,263,476 | |||||||
| 2,412,080 | ||||||||
| Financials 7.87% | ||||||||
| Crown Castle International Corp. | 2,808,200 | 221,005 | ||||||
| State Street Corp. | 2,534,500 | 198,958 | ||||||
| Marsh & McLennan Companies, Inc. | 3,426,100 | 196,110 | ||||||
| JPMorgan Chase & Co. | 2,455,300 | 153,653 | ||||||
| Other securities | 1,227,099 | |||||||
| 1,996,825 | ||||||||
| Materials 6.80% | ||||||||
| Celanese Corp., Series A | 5,930,400 | 355,587 | ||||||
| Dow Chemical Co. | 6,573,500 | 299,817 | ||||||
| Monsanto Co. | 1,980,243 | 236,580 | ||||||
| Other securities | 831,540 | |||||||
| 1,723,524 | ||||||||
| American Funds Insurance Series | 73 |
Growth-Income Fund
| Common stocks (continued) | Shares | Value (000) | ||||||
| Energy 6.65% | ||||||||
| ConocoPhillips | 3,334,460 | $ | 230,278 | |||||
| EOG Resources, Inc. | 2,341,300 | 215,563 | ||||||
| Royal Dutch Shell PLC, Class A (ADR) | 3,016,000 | 201,921 | ||||||
| Schlumberger Ltd. | 2,055,000 | 175,518 | ||||||
| Other securities | 863,211 | |||||||
| 1,686,491 | ||||||||
| Consumer staples 6.42% | ||||||||
| Philip Morris International Inc. | 4,627,444 | 376,905 | ||||||
| Altria Group, Inc. | 4,050,700 | 199,578 | ||||||
| Coca-Cola Co. | 4,708,400 | 198,789 | ||||||
| CVS/Caremark Corp. | 1,670,000 | 160,838 | ||||||
| Other securities | 691,493 | |||||||
| 1,627,603 | ||||||||
| Telecommunication services 1.61% | ||||||||
| Verizon Communications Inc. | 6,731,501 | 314,900 | ||||||
| Other securities | 93,754 | |||||||
| 408,654 | ||||||||
| Utilities 0.97% | ||||||||
| Sempra Energy | 1,455,000 | 162,029 | ||||||
| Other securities | 83,936 | |||||||
| 245,965 | ||||||||
| Miscellaneous 4.99% | ||||||||
| Other common stocks in initial period of acquisition | 1,265,338 | |||||||
| Total common stocks (cost: $15,610,703,000) | 23,233,940 | |||||||
| Rights & warrants 0.02% | ||||||||
| Consumer discretionary 0.02% | ||||||||
| Other securities | 3,633 | |||||||
| Total rights & warrants (cost: $3,908,000) | 3,633 | |||||||
| Convertible stocks 0.04% | ||||||||
| Financials 0.04% | ||||||||
| Other securities | 9,007 | |||||||
| Total convertible stocks (cost: $6,000,000) | 9,007 | |||||||
| Convertible bonds 0.12% | Principal amount (000) | |||||||
| Information technology 0.12% | ||||||||
| Other securities | 30,961 | |||||||
| Total convertible bonds (cost: $27,669,000) | 30,961 | |||||||
| Bonds, notes & other debt instruments 0.17% | ||||||||
| Corporate bonds & notes 0.11% | ||||||||
| Other 0.11% | ||||||||
| Other securities | 27,682 | |||||||
| U.S. Treasury bonds & notes 0.06% | ||||||||
| U.S. Treasury 0.06% | ||||||||
| Other securities | 14,935 | |||||||
| Total bonds, notes & other debt instruments (cost: $40,155,000) | 42,617 | |||||||
| 74 | American Funds Insurance Series |
Growth-Income Fund
| Short-term securities 8.10% | Principal amount (000) | Value (000) | ||||||
| Apple Inc. 0.13% due 1/8/20152 | $ | 17,200 | $ | 17,200 | ||||
| Coca-Cola Co. 0.10%–0.19% due 1/15/2015–5/8/20152 | 117,800 | 117,760 | ||||||
| Fannie Mae 0.07%–0.15% due 3/2/2015–10/5/2015 | 183,900 | 183,795 | ||||||
| Federal Home Loan Bank 0.05%–0.17% due 1/14/2015–10/5/2015 | 585,200 | 585,112 | ||||||
| Freddie Mac 0.09%–0.17% due 1/6/2015–11/3/2015 | 321,800 | 321,632 | ||||||
| Other securities | 830,643 | |||||||
| Total short-term securities (cost: $2,056,061,000) | 2,056,142 | |||||||
| Total investment securities 100.05% (cost: $17,744,496,000) | 25,376,300 | |||||||
| Other assets less liabilities (0.05)% | (12,752 | ) | ||||||
| Net assets 100.00% | $ | 25,363,548 | ||||||
This summary investment portfolio is designed to streamline the report and help investors better focus on the fund’s principal holdings. See the inside back cover for details on how to obtain a complete schedule of portfolio holdings.
As permitted by U.S. Securities and Exchange Commission regulations, “Miscellaneous” securities include holdings in their first year of acquisition that have not previously been publicly disclosed.
“Other securities” includes all issues that are not disclosed separately in the summary investment portfolio. “Miscellaneous” and “Other securities” include securities which were valued under fair value procedures adopted by authority of the board of trustees. The total value of securities which were valued under fair value procedures was $1,838,773,000, which represented 7.25% of the net assets of the fund. This amount includes $1,759,866,000 related to certain securities trading outside the U.S. whose values were adjusted as a result of significant market movements following the close of local trading. One of the securities in “Other securities” (with a value of $9,007,000, a cost of $6,000,000, and which represented .04% of the net assets of the fund) was acquired on 6/28/2012 through private placement transactions exempt from registration under the Securities Act of 1933, which may subject it to legal or contractual restrictions on resale.
The following footnotes apply to either the individual securities noted or one or more of the securities aggregated and listed as a single line item.
| 1 | Security did not produce income during the last 12 months. |
| 2 | Acquired in a transaction exempt from registration under Section 4(2) of the Securities Act of 1933. May be resold in the U.S. in transactions exempt from registration, normally to qualified institutional buyers. The total value of all such securities, including those in “Other securities,” was $698,638,000, which represented 2.75% of the net assets of the fund. |
Key to abbreviation
ADR = American Depositary Receipts
See Notes to Financial Statements
| American Funds Insurance Series | 75 |
International Growth and Income Fund
Summary investment portfolio December 31, 2014
| Common stocks 90.06% | Shares | Value (000) | ||||||
| Financials 23.43% | ||||||||
| Prudential PLC1 | 1,049,574 | $ | 24,153 | |||||
| Aviva PLC1 | 2,081,000 | 15,593 | ||||||
| Wharf (Holdings) Ltd.1 | 2,071,000 | 14,872 | ||||||
| Siam Commercial Bank PCL1 | 2,665,000 | 14,724 | ||||||
| Barclays PLC1 | 3,872,500 | 14,559 | ||||||
| BNP Paribas SA1 | 233,700 | 13,733 | ||||||
| St. James’s Place PLC1 | 1,048,000 | 13,170 | ||||||
| Cheung Kong (Holdings) Ltd.1 | 610,000 | 10,179 | ||||||
| Banco Bilbao Vizcaya Argentaria, SA1 | 635,533 | 5,981 | ||||||
| Banco Bilbao Vizcaya Argentaria, SA (ADR) | 320,944 | 3,014 | ||||||
| Axis Bank Ltd.1 | 906,000 | 7,158 | ||||||
| Mitsubishi UFJ Financial Group, Inc.1 | 1,205,000 | 6,605 | ||||||
| Toronto-Dominion Bank | 113,000 | 5,399 | ||||||
| Other securities | 87,074 | |||||||
| 236,214 | ||||||||
| Utilities 12.75% | ||||||||
| EDP - Energias de Portugal, SA1 | 8,130,084 | 31,443 | ||||||
| SSE PLC1 | 1,056,225 | 26,516 | ||||||
| Fortum Oyj1 | 865,793 | 18,709 | ||||||
| National Grid PLC1 | 1,044,870 | 14,895 | ||||||
| ENDESA, SA1 | 650,236 | 12,915 | ||||||
| Power Assets Holdings Ltd.1 | 1,013,000 | 9,786 | ||||||
| PT Perusahaan Gas Negara (Persero) Tbk1 | 15,009,239 | 7,230 | ||||||
| Other securities | 7,034 | |||||||
| 128,528 | ||||||||
| Consumer discretionary 12.30% | ||||||||
| H & M Hennes & Mauritz AB, Class B1 | 460,700 | 19,111 | ||||||
| HUGO BOSS AG1 | 84,900 | 10,423 | ||||||
| Numericable Group SA, non-registered shares1,2 | 210,435 | 10,377 | ||||||
| L’Occitane International SA1 | 2,840,000 | 7,147 | ||||||
| Other securities | 76,912 | |||||||
| 123,970 | ||||||||
| Consumer staples 10.81% | ||||||||
| Philip Morris International Inc. | 348,000 | 28,345 | ||||||
| British American Tobacco PLC1 | 292,400 | 15,887 | ||||||
| Imperial Tobacco Group PLC1 | 317,000 | 13,882 | ||||||
| Japan Tobacco Inc.1 | 396,600 | 10,890 | ||||||
| CALBEE, Inc.1 | 284,400 | 9,818 | ||||||
| Nestlé SA1 | 124,000 | 9,089 | ||||||
| Other securities | 21,093 | |||||||
| 109,004 | ||||||||
| Health care 10.60% | ||||||||
| Novartis AG1 | 393,870 | 36,223 | ||||||
| Glenmark Pharmaceuticals Ltd.1 | 1,180,000 | 14,351 | ||||||
| Orion Oyj, Class B1 | 429,600 | 13,337 | ||||||
| Sonic Healthcare Ltd.1 | 618,000 | 9,281 | ||||||
| Other securities | 33,667 | |||||||
| 106,859 | ||||||||
| Industrials 7.83% | ||||||||
| easyJet PLC1 | 580,489 | 14,983 | ||||||
| ASSA ABLOY AB, Class B1 | 206,800 | 10,929 | ||||||
| Ryanair Holdings PLC (ADR)2 | 106,000 | 7,555 | ||||||
| BAE Systems PLC1 | 1,000,000 | 7,300 | ||||||
| 76 | American Funds Insurance Series |
International Growth and Income Fund
| Common stocks | Shares | Value (000) | ||||||
| Rolls-Royce Holdings PLC1,2 | 525,000 | $ | 7,072 | |||||
| Jardine Matheson Holdings Ltd.1 | 115,000 | 6,998 | ||||||
| Other securities | 24,117 | |||||||
| 78,954 | ||||||||
| Energy 4.48% | ||||||||
| Royal Dutch Shell PLC, Class A (GBP denominated)1 | 389,000 | 12,894 | ||||||
| Veresen Inc. | 692,000 | 10,936 | ||||||
| BP PLC1 | 1,336,800 | 8,488 | ||||||
| Other securities | 12,813 | |||||||
| 45,131 | ||||||||
| Materials 3.18% | ||||||||
| Syngenta AG1 | 29,080 | 9,338 | ||||||
| Fortescue Metals Group Ltd.1 | 3,175,000 | 6,997 | ||||||
| Other securities | 15,779 | |||||||
| 32,114 | ||||||||
| Telecommunication services 3.15% | ||||||||
| China Mobile Ltd.1 | 700,000 | 8,223 | ||||||
| Other securities | 23,551 | |||||||
| 31,774 | ||||||||
| Information technology 1.53% | ||||||||
| Delta Electronics, Inc.1 | 1,380,760 | 8,204 | ||||||
| Other securities | 7,249 | |||||||
| 15,453 | ||||||||
| Total common stocks (cost: $865,333,000) | 908,001 | |||||||
| Rights & warrants 0.01% | ||||||||
| Financials 0.01% | ||||||||
| Other securities | 61 | |||||||
| Total rights & warrants (cost: $62,000) | 61 | |||||||
| Convertible bonds 0.25% | Principal amount (000) | |||||||
| Financials 0.25% | ||||||||
| Other securities | 2,556 | |||||||
| Total convertible bonds (cost: $2,560,000) | 2,556 | |||||||
| Bonds, notes & other debt instruments 0.92% | ||||||||
| Corporate bonds & notes 0.54% | ||||||||
| Telecommunication services 0.36% | ||||||||
| Numericable Group SA, First Lien, 6.00% 20223 | $ | 950 | 956 | |||||
| Other securities | 2,723 | |||||||
| 3,679 | ||||||||
| Other 0.18% | ||||||||
| Other securities | 1,782 | |||||||
| Total corporate bonds & notes | 5,461 | |||||||
| Bonds & notes of governments & government agencies outside the U.S. 0.38% | ||||||||
| Other securities | 3,795 | |||||||
| Total bonds, notes & other debt instruments (cost: $10,167,000) | 9,256 |
| American Funds Insurance Series | 77 |
International Growth and Income Fund
| Short-term securities 8.39% | Principal amount (000) | Value (000) | ||||||
| ExxonMobil Corp. 0.14% due 3/2/2015 | $ | 13,100 | $ | 13,097 | ||||
| Federal Home Loan Bank 0.04% due 1/6/2015 | 10,000 | 10,000 | ||||||
| Freddie Mac 0.08% due 2/25/2015 | 10,000 | 10,000 | ||||||
| General Electric Co. 0.10% due 1/2/2015 | 7,700 | 7,700 | ||||||
| Mitsubishi UFJ Trust and Banking Corp. 0.14% due 1/13/20153 | 5,000 | 4,999 | ||||||
| Siemens Capital Co. LLC 0.11% due 1/5/20153 | 15,000 | 15,000 | ||||||
| Toronto-Dominion Holdings USA Inc. 0.14% due 1/16/20153 | 23,800 | 23,799 | ||||||
| Total short-term securities (cost: $84,594,000) | 84,595 | |||||||
| Total investment securities 99.63% (cost: $962,716,000) | 1,004,469 | |||||||
| Other assets less liabilities 0.37% | 3,741 | |||||||
| Net assets 100.00% | $ | 1,008,210 | ||||||
This summary investment portfolio is designed to streamline the report and help investors better focus on the fund’s principal holdings. See the inside back cover for details on how to obtain a complete schedule of portfolio holdings.
“Other securities” includes all issues that are not disclosed separately in the summary investment portfolio.
The following footnotes apply to either the individual securities noted or one or more of the securities aggregated and listed as a single line item.
| 1 | Valued under fair value procedures adopted by authority of the board of trustees. The total value of all such securities, including those in “Other securities,” was $824,121,000, which represented 81.74% of the net assets of the fund. This entire amount relates to certain securities trading outside the U.S. whose values were adjusted as a result of significant market movements following the close of local trading. |
| 2 | Security did not produce income during the last 12 months. |
| 3 | Acquired in a transaction exempt from registration under Rule 144A or Section 4(2) of the Securities Act of 1933. May be resold in the U.S. in transactions exempt from registration, normally to qualified institutional buyers. The total value of all such securities, including those in “Other securities,” was $46,348,000, which represented 4.60% of the net assets of the fund. |
Key to abbreviations
ADR = American Depositary Receipts
GBP = British pounds
See Notes to Financial Statements
| 78 | American Funds Insurance Series |
Summary investment portfolio December 31, 2014
| Common stocks 81.31% | Shares | Value (000) | ||||||
| Consumer staples 12.90% | ||||||||
| Altria Group, Inc. | 48,910 | $ | 2,410 | |||||
| Philip Morris International Inc. | 25,375 | 2,067 | ||||||
| Coca-Cola Co. | 31,745 | 1,340 | ||||||
| Unilever PLC1 | 25,710 | 1,044 | ||||||
| Japan Tobacco Inc.1 | 28,100 | 772 | ||||||
| Other securities | 2,060 | |||||||
| 9,693 | ||||||||
| Financials 11.39% | ||||||||
| Sampo Oyj, Class A1 | 32,009 | 1,501 | ||||||
| Swedbank AB, Class A1 | 39,771 | 990 | ||||||
| BB&T Corp. | 22,080 | 859 | ||||||
| Mercury General Corp. | 12,410 | 703 | ||||||
| CME Group Inc., Class A | 7,595 | 673 | ||||||
| HSBC Holdings PLC (GBP denominated)1 | 69,820 | 660 | ||||||
| Wells Fargo & Co. | 11,700 | 641 | ||||||
| Other securities | 2,533 | |||||||
| 8,560 | ||||||||
| Health care 10.49% | ||||||||
| Novartis AG1 | 19,363 | 1,781 | ||||||
| AstraZeneca PLC1 | 13,950 | 981 | ||||||
| AstraZeneca PLC (ADR) | 8,490 | 598 | ||||||
| Pfizer Inc. | 45,480 | 1,417 | ||||||
| GlaxoSmithKline PLC1 | 43,700 | 935 | ||||||
| Bristol-Myers Squibb Co. | 14,285 | 843 | ||||||
| Other securities | 1,327 | |||||||
| 7,882 | ||||||||
| Utilities 9.46% | ||||||||
| National Grid PLC1 | 109,300 | 1,558 | ||||||
| SSE PLC1 | 55,070 | 1,383 | ||||||
| Red Eléctrica Corporación, SA1 | 8,075 | 709 | ||||||
| Duke Energy Corp. | 8,450 | 706 | ||||||
| Other securities | 2,753 | |||||||
| 7,109 | ||||||||
| Telecommunication services 9.41% | ||||||||
| Verizon Communications Inc. | 30,770 | 1,440 | ||||||
| HKT Trust and HKT Ltd., units1 | 1,004,340 | 1,307 | ||||||
| Singapore Telecommunications Ltd.1 | 290,000 | 851 | ||||||
| CenturyLink, Inc. | 18,365 | 727 | ||||||
| Swisscom AG1 | 1,281 | 673 | ||||||
| AT&T Inc. | 18,380 | 617 | ||||||
| Other securities | 1,459 | |||||||
| 7,074 | ||||||||
| Consumer discretionary 6.76% | ||||||||
| Daimler AG1 | 12,371 | 1,032 | ||||||
| Leggett & Platt, Inc. | 17,690 | 754 | ||||||
| Greene King PLC1 | 64,220 | 745 | ||||||
| AB Electrolux, Series B1 | 20,760 | 609 | ||||||
| SES SA, Class A (FDR)1 | 15,367 | 551 | ||||||
| Other securities | 1,393 | |||||||
| 5,084 | ||||||||
| American Funds Insurance Series | 79 |
Capital Income Builder
| Common stocks (continued) | Shares | Value (000) | ||||||
| Energy 6.70% | ||||||||
| Royal Dutch Shell PLC, Class B1 | 33,360 | $ | 1,146 | |||||
| ConocoPhillips | 11,915 | 823 | ||||||
| Enbridge Inc. | 12,370 | 636 | ||||||
| Crescent Point Energy Corp. | 25,530 | 591 | ||||||
| Exxon Mobil Corp. | 4,600 | 425 | ||||||
| Other securities | 1,418 | |||||||
| 5,039 | ||||||||
| Information technology 6.33% | ||||||||
| Microsoft Corp. | 36,160 | 1,680 | ||||||
| VTech Holdings Ltd.1 | 58,600 | 838 | ||||||
| Texas Instruments Inc. | 11,030 | 590 | ||||||
| Xilinx, Inc. | 12,940 | 560 | ||||||
| Paychex, Inc. | 12,010 | 554 | ||||||
| Other securities | 538 | |||||||
| 4,760 | ||||||||
| Industrials 4.10% | ||||||||
| Siemens AG1 | 6,464 | 733 | ||||||
| Lockheed Martin Corp. | 3,655 | 704 | ||||||
| Other securities | 1,643 | |||||||
| 3,080 | ||||||||
| Materials 3.13% | ||||||||
| Dow Chemical Co. | 16,715 | 762 | ||||||
| Amcor Ltd.1 | 58,498 | 644 | ||||||
| Other securities | 949 | |||||||
| 2,355 | ||||||||
| Miscellaneous 0.64% | ||||||||
| Other common stocks in initial period of acquisition | 477 | |||||||
| Total common stocks (cost: $62,169,000) | 61,113 | |||||||
| Bonds, notes & other debt instruments 15.53% | Principal amount (000) | |||||||
| Mortgage-backed obligations 5.90% | ||||||||
| Commercial mortgage-backed securities 3.03% | ||||||||
| Other securities | 2,275 | |||||||
| Federal agency mortgage-backed obligations 2.87% | ||||||||
| Government National Mortgage Assn. 4.36%–6.86% 2059–20632 | $ | 1,994 | 2,158 | |||||
| Total mortgage-backed obligations | 4,433 | |||||||
| U.S. Treasury bonds & notes 4.74% | ||||||||
| U.S. Treasury 2.78% | ||||||||
| U.S. Treasury 3.50% 2020 | 1,450 | 1,582 | ||||||
| U.S. Treasury 2.75%–3.63% 2019–2023 | 480 | 511 | ||||||
| 2,093 | ||||||||
| U.S. Treasury inflation-protected securities 1.96% | ||||||||
| U.S. Treasury Inflation-Protected Security 0.125% 20243 | 1,400 | 1,355 | ||||||
| U.S. Treasury Inflation-Protected Security 1.375% 20443 | 102 | 116 | ||||||
| 1,471 | ||||||||
| Total U.S. Treasury bonds & notes | 3,564 | |||||||
| 80 | American Funds Insurance Series |
Capital Income Builder
| Bonds, notes & other debt instruments | Principal amount (000) | Value (000) | ||||||
| Corporate bonds & notes 3.35% | ||||||||
| Financials 1.09% | ||||||||
| Wells Fargo & Co. 5.625% 2017 | $ | 100 | $ | 111 | ||||
| Other securities | 708 | |||||||
| 819 | ||||||||
| Telecommunication services 0.15% | ||||||||
| Verizon Communications Inc. 5.50% 2018 | 100 | 111 | ||||||
| Other 2.11% | ||||||||
| Other securities | 1,586 | |||||||
| Total corporate bonds & notes | 2,516 | |||||||
| Asset-backed obligations 1.54% | ||||||||
| Santander Drive Auto Receivables Trust, Series 2012-2, Class C, 3.20% 20152 | 850 | 859 | ||||||
| Other securities | 301 | |||||||
| Total asset-backed obligations | 1,160 | |||||||
| Total bonds, notes & other debt instruments (cost: $11,676,000) | 11,673 | |||||||
| Short-term securities 2.79% | ||||||||
| ExxonMobil Corp. 0.08% due 1/27/2015 | 1,000 | 1,000 | ||||||
| General Electric Co. 0.10% due 1/2/2015 | 1,100 | 1,100 | ||||||
| Total short-term securities (cost: $2,100,000) | 2,100 | |||||||
| Total investment securities 99.63% (cost: $75,945,000) | 74,886 | |||||||
| Other assets less liabilities 0.37% | 280 | |||||||
| Net assets 100.00% | $ | 75,166 | ||||||
This summary investment portfolio is designed to streamline the report and help investors better focus on the fund’s principal holdings. See the inside back cover for details on how to obtain a complete schedule of portfolio holdings.
As permitted by U.S. Securities and Exchange Commission regulations, “Miscellaneous” securities include holdings in their first year of acquisition that have not previously been publicly disclosed.
“Other securities” includes all issues that are not disclosed separately in the summary investment portfolio.
The following footnotes apply to either the individual securities noted or one or more of the securities aggregated and listed as a single line item.
| 1 | Valued under fair value procedures adopted by authority of the board of trustees. The total value of all such securities, including those in “Miscellaneous” and “Other securities,” was $32,245,000, which represented 42.90% of the net assets of the fund. This entire amount relates to certain securities trading outside the U.S. whose values were adjusted as a result of significant market movements following the close of local trading. |
| 2 | Principal payments may be made periodically. Therefore, the effective maturity date may be earlier than the stated maturity date. |
| 3 | Index-linked bond whose principal amount moves with a government price index. |
Key to abbreviations
ADR = American Depositary Receipts
FDR = Fiduciary Depositary Receipts
GBP = British pounds
See Notes to Financial Statements
| American Funds Insurance Series | 81 |
Summary investment portfolio December 31, 2014
| Common stocks 67.47% | Shares | Value (000) | ||||||
| Information technology 11.11% | ||||||||
| Microsoft Corp. | 14,225,000 | $ | 660,751 | |||||
| ASML Holding NV (New York registered) | 2,162,000 | 233,128 | ||||||
| KLA-Tencor Corp. | 2,500,000 | 175,800 | ||||||
| Texas Instruments Inc. | 3,000,000 | 160,395 | ||||||
| VeriSign, Inc.1 | 2,675,000 | 152,475 | ||||||
| Autodesk, Inc.1 | 2,000,000 | 120,120 | ||||||
| Taiwan Semiconductor Manufacturing Co. Ltd. (ADR) | 5,000,000 | 111,900 | ||||||
| Cisco Systems, Inc. | 4,000,000 | 111,260 | ||||||
| Other securities | 225,518 | |||||||
| 1,951,347 | ||||||||
| Consumer discretionary 10.81% | ||||||||
| Comcast Corp., Class A | 7,100,000 | 411,871 | ||||||
| Amazon.com, Inc.1 | 1,065,000 | 330,523 | ||||||
| Home Depot, Inc. | 2,405,000 | 252,453 | ||||||
| Twenty-First Century Fox, Inc., Class A | 4,750,000 | 182,424 | ||||||
| VF Corp. | 1,800,000 | 134,820 | ||||||
| Gentex Corp. | 3,500,000 | 126,455 | ||||||
| General Motors Co. | 3,500,000 | 122,185 | ||||||
| Walt Disney Co. | 1,150,000 | 108,318 | ||||||
| Other securities | 230,037 | |||||||
| 1,899,086 | ||||||||
| Financials 10.01% | ||||||||
| ACE Ltd. | 2,620,000 | 300,986 | ||||||
| JPMorgan Chase & Co. | 4,750,000 | 297,255 | ||||||
| American Express Co. | 2,400,000 | 223,296 | ||||||
| Citigroup Inc. | 2,750,000 | 148,802 | ||||||
| Other securities | 787,221 | |||||||
| 1,757,560 | ||||||||
| Industrials 8.00% | ||||||||
| Lockheed Martin Corp. | 2,115,000 | 407,286 | ||||||
| Boeing Co. | 1,720,000 | 223,566 | ||||||
| Cummins Inc. | 1,230,000 | 177,329 | ||||||
| Other securities | 597,090 | |||||||
| 1,405,271 | ||||||||
| Health care 7.29% | ||||||||
| Merck & Co., Inc. | 6,350,000 | 360,616 | ||||||
| Johnson & Johnson | 2,075,000 | 216,983 | ||||||
| UnitedHealth Group Inc. | 1,500,000 | 151,635 | ||||||
| Incyte Corp.1 | 2,000,000 | 146,220 | ||||||
| Pfizer Inc. | 4,210,000 | 131,141 | ||||||
| Other securities | 274,200 | |||||||
| 1,280,795 | ||||||||
| Energy 7.19% | ||||||||
| Chevron Corp. | 1,625,000 | 182,292 | ||||||
| Noble Energy, Inc. | 3,600,000 | 170,748 | ||||||
| Chesapeake Energy Corp. | 7,700,000 | 150,689 | ||||||
| Concho Resources Inc.1 | 1,238,816 | 123,572 | ||||||
| Other securities | 635,568 | |||||||
| 1,262,869 | ||||||||
| 82 | American Funds Insurance Series |
Asset Allocation Fund
| Common stocks | Shares | Value (000) | ||||||
| Materials 4.84% | ||||||||
| FMC Corp. | 3,250,000 | $ | 185,347 | |||||
| Dow Chemical Co. | 2,500,000 | 114,025 | ||||||
| Potash Corp. of Saskatchewan Inc. | 3,100,000 | 109,492 | ||||||
| Monsanto Co. | 900,000 | 107,523 | ||||||
| Other securities | 333,446 | |||||||
| 849,833 | ||||||||
| Consumer staples 4.62% | ||||||||
| Coca-Cola Co. | 3,440,000 | 145,237 | ||||||
| Philip Morris International Inc. | 1,750,000 | 142,537 | ||||||
| Unilever NV (New York registered) | 3,445,000 | 134,493 | ||||||
| Other securities | 389,451 | |||||||
| 811,718 | ||||||||
| Other 0.98% | ||||||||
| Other securities | 169,946 | |||||||
| Miscellaneous 2.62% | ||||||||
| Other common stocks in initial period of acquisition | 460,600 | |||||||
| Total common stocks (cost: $8,330,362,000) | 11,849,025 | |||||||
| Convertible stocks 0.06% | ||||||||
| Industrials 0.06% | ||||||||
| Other securities | 10,915 | |||||||
| Total convertible stocks (cost: $15,028,000) | 10,915 | |||||||
| Bonds, notes & other debt instruments 25.00% | Principal amount (000) | |||||||
| U.S. Treasury bonds & notes 10.96% | ||||||||
| U.S. Treasury 7.99% | ||||||||
| U.S. Treasury 0.25% 2015 | $ | 236,000 | 236,156 | |||||
| U.S. Treasury 0.625% 2018 | 143,000 | 140,129 | ||||||
| U.S. Treasury 1.50% 2019 | 400,000 | 400,220 | ||||||
| U.S. Treasury 2.75% 2024 | 130,000 | 136,764 | ||||||
| U.S. Treasury 0.88%–7.25% 2015–20442 | 471,000 | 488,834 | ||||||
| 1,402,103 | ||||||||
| U.S. Treasury inflation-protected securities 2.97% | ||||||||
| U.S. Treasury Inflation-Protected Security 0.625% 20243 | 179,108 | 180,727 | ||||||
| U.S. Treasury Inflation-Protected Security 1.375% 20443 | 194,373 | 222,160 | ||||||
| U.S. Treasury Inflation-Protected Security 0.13%–0.75% 2019–20433 | 121,033 | 119,233 | ||||||
| 522,120 | ||||||||
| Total U.S. Treasury bonds & notes | 1,924,223 | |||||||
| Corporate bonds & notes 7.77% | ||||||||
| Financials 1.41% | ||||||||
| JPMorgan Chase & Co. 1.35%–3.88% 2017–2024 | 13,515 | 13,555 | ||||||
| Other securities | 234,398 | |||||||
| 247,953 | ||||||||
| Consumer discretionary 0.68% | ||||||||
| 21st Century Fox America, Inc. 3.70% 20244 | 6,000 | 6,184 | ||||||
| Amazon.com, Inc. 4.80% 2034 | 6,000 | 6,294 | ||||||
| Comcast Corp. 4.75%–5.65% 2035–2044 | 7,250 | 8,330 | ||||||
| Home Depot, Inc. 2.00% 2019 | 5,500 | 5,519 | ||||||
| Other securities | 92,983 | |||||||
| 119,310 | ||||||||
| American Funds Insurance Series | 83 |
Asset Allocation Fund
| Bonds, notes & other debt instruments (continued) | Principal amount (000) | Value (000) | ||||||
| Corporate bonds & notes (continued) | ||||||||
| Other 5.68% | ||||||||
| Other securities | $ | 998,144 | ||||||
| Total corporate bonds & notes | 1,365,407 | |||||||
| Mortgage-backed obligations 4.13% | ||||||||
| Federal agency mortgage-backed obligations 3.48% | ||||||||
| Fannie Mae 4.00% 20455,6 | $ | 108,000 | 114,939 | |||||
| Fannie Mae 0%–7.50% 2021–20475,6,7 | 385,476 | 415,587 | ||||||
| Freddie Mac 4.00%–6.50% 2023–20435,7 | 45,257 | 49,208 | ||||||
| Other securities | 31,480 | |||||||
| 611,214 | ||||||||
| Other 0.65% | ||||||||
| Other securities | 113,757 | |||||||
| Total mortgage-backed obligations | 724,971 | |||||||
| Federal agency bonds & notes 1.57% | ||||||||
| Fannie Mae 0.50%–3.51% 2015–20245,7 | 133,772 | 136,018 | ||||||
| Freddie Mac 0.75%–3.24% 2016–20245,7 | 136,579 | 138,100 | ||||||
| Other securities | 1,589 | |||||||
| Total federal agency bonds & notes | 275,707 | |||||||
| Other bonds & notes 0.57% | ||||||||
| Other securities | 99,674 | |||||||
| Total bonds, notes & other debt instruments (cost: $4,354,101,000) | 4,389,982 | |||||||
| Short-term securities 9.63% | ||||||||
| Chariot Funding, LLC 0.22% due 4/23/20154 | 15,000 | 14,991 | ||||||
| Chevron Corp. 0.10%–0.14% due 1/21/2015–4/10/20154 | 96,400 | 96,387 | ||||||
| Coca-Cola Co. 0.17% due 4/23/20154 | 40,000 | 39,981 | ||||||
| Fannie Mae 0.07%–0.11% due 1/5/2015–5/18/2015 | 311,100 | 311,051 | ||||||
| Federal Home Loan Bank 0.06%–0.16% due 1/22/2015–7/31/2015 | 524,700 | 524,591 | ||||||
| Freddie Mac 0.07%–0.18% due 2/4/2015–11/3/2015 | 293,600 | 293,514 | ||||||
| Other securities | 410,968 | |||||||
| Total short-term securities (cost: $1,691,354,000) | 1,691,483 | |||||||
| Total investment securities 102.16% (cost: $14,390,845,000) | 17,941,405 | |||||||
| Other assets less liabilities (2.16)% | (378,537 | ) | ||||||
| Net assets 100.00% | $ | 17,562,868 | ||||||
This summary investment portfolio is designed to streamline the report and help investors better focus on the fund’s principal holdings. See the inside back cover for details on how to obtain a complete schedule of portfolio holdings.
As permitted by U.S. Securities and Exchange Commission regulations, “Miscellaneous” securities include holdings in their first year of acquisition that have not previously been publicly disclosed.
“Other securities” includes all issues that are not disclosed separately in the summary investment portfolio. “Miscellaneous” and “Other securities” include securities which were valued under fair value procedures adopted by authority of the board of trustees. The total value of securities which were valued under fair value procedures was $394,040,000, which represented 2.24% of the net assets of the fund. This amount includes $364,386,000 related to certain securities trading outside the U.S. whose values were adjusted as a result of significant market movements following the close of local trading. Some securities in “Other securities” (with an aggregate value of $5,692,000, an aggregate cost of $27,620,000, and which represented .03% of the net assets of the fund) were acquired from 3/10/2010 to 3/15/2013 through private placement transactions exempt from registration under the Securities Act of 1933, which may subject them to legal or contractual restrictions on resale. “Other securities” also includes loan participations and assignments, which may be subject to legal or contractual restrictions on resale. The total value of all such loans was $59,567,000, which represented ..34% of the net assets of the fund.
| 84 | American Funds Insurance Series |
Asset Allocation Fund
Interest rate swaps
The fund has entered into interest rate swaps as shown in the following table. The average notional amount of interest rate swaps was $411,714,000 over the prior seven-month period.
| Pay/receive fixed rate | Clearinghouse | Floating rate index | Fixed rate | Expiration date | Notional amount (000) | Unrealized (depreciation) appreciation at 12/31/2014 (000) | |||||||||||||
| Pay | LCH.Clearnet | 3-month USD-LIBOR | 0.7885 | % | 9/29/2016 | $ | 118,000 | $ | (35 | ) | |||||||||
| Pay | LCH.Clearnet | 3-month USD-LIBOR | 1.485 | 7/17/2018 | 200,000 | (220 | ) | ||||||||||||
| Receive | LCH.Clearnet | 3-month USD-LIBOR | 1.929 | 9/29/2019 | 80,000 | 778 | |||||||||||||
| Receive | LCH.Clearnet | 3-month USD-LIBOR | 1.6365 | 10/16/2019 | 124,000 | (513 | ) | ||||||||||||
| Pay | LCH.Clearnet | 3-month USD-LIBOR | 2.652 | 9/29/2024 | 26,000 | (902 | ) | ||||||||||||
| Pay | LCH.Clearnet | 3-month USD-LIBOR | 3.402 | 6/23/2044 | 45,000 | (6,755 | ) | ||||||||||||
| Pay | LCH.Clearnet | 3-month USD-LIBOR | 2.945 | 10/16/2044 | 28,000 | (1,480 | ) | ||||||||||||
| $ | (9,127 | ) | |||||||||||||||||
The following footnotes apply to either the individual securities noted or one or more of the securities aggregated and listed as a single line item.
| 1 | Security did not produce income during the last 12 months. |
| 2 | A portion of this security was pledged as collateral. The total value of pledged collateral was $10,940,000, which represented .06% of the net assets of the fund. |
| 3 | Index-linked bond whose principal amount moves with a government price index. |
| 4 | Acquired in a transaction exempt from registration under Rule 144A or Section 4(2) of the Securities Act of 1933. May be resold in the U.S. in transactions exempt from registration, normally to qualified institutional buyers. The total value of all such securities, including those in “Other securities,” was $839,403,000, which represented 4.78% of the net assets of the fund. |
| 5 | Principal payments may be made periodically. Therefore, the effective maturity date may be earlier than the stated maturity date. |
| 6 | A portion or all of the security purchased on a TBA basis. |
| 7 | Coupon rate may change periodically. |
Key to abbreviations
ADR = American Depositary Receipts
TBA = To be announced
See Notes to Financial Statements
| American Funds Insurance Series | 85 |
Summary investment portfolio December 31, 2014
| Common stocks 60.73% | Shares | Value (000) | ||||||
| Industrials 10.43% | ||||||||
| Cummins Inc. | 19,200 | $ | 2,768 | |||||
| General Electric Co. | 93,700 | 2,368 | ||||||
| KONE Oyj, Class B1 | 49,600 | 2,253 | ||||||
| Boeing Co. | 17,000 | 2,210 | ||||||
| BAE Systems PLC1 | 284,400 | 2,076 | ||||||
| Robert Half International Inc. | 30,000 | 1,751 | ||||||
| Schneider Electric SE1 | 20,000 | 1,453 | ||||||
| Rolls-Royce Holdings PLC1,2 | 105,045 | 1,415 | ||||||
| Other securities | 6,222 | |||||||
| 22,516 | ||||||||
| Financials 9.76% | ||||||||
| Link Real Estate Investment Trust1 | 429,509 | 2,681 | ||||||
| Banco Santander, SA1,2 | 306,406 | 2,562 | ||||||
| ORIX Corp.1 | 182,000 | 2,275 | ||||||
| AIA Group Ltd.1 | 380,000 | 2,092 | ||||||
| JPMorgan Chase & Co. | 32,700 | 2,046 | ||||||
| Bankia, SA1,2 | 1,179,000 | 1,748 | ||||||
| Deutsche Bank AG1 | 51,750 | 1,564 | ||||||
| Wells Fargo & Co. | 24,000 | 1,316 | ||||||
| Sumitomo Mitsui Financial Group, Inc.1 | 13,500 | 488 | ||||||
| Other securities | 4,280 | |||||||
| 21,052 | ||||||||
| Consumer staples 8.45% | ||||||||
| Nestlé SA1 | 40,240 | 2,950 | ||||||
| Pernod Ricard SA1 | 22,220 | 2,464 | ||||||
| Lorillard, Inc. | 33,900 | 2,134 | ||||||
| British American Tobacco PLC1 | 35,950 | 1,953 | ||||||
| Altria Group, Inc. | 31,000 | 1,527 | ||||||
| SABMiller PLC1 | 28,500 | 1,475 | ||||||
| Costco Wholesale Corp. | 10,170 | 1,441 | ||||||
| Other securities | 4,281 | |||||||
| 18,225 | ||||||||
| Information technology 8.14% | ||||||||
| ASML Holding NV1 | 47,969 | 5,139 | ||||||
| Microsoft Corp. | 103,000 | 4,784 | ||||||
| Murata Manufacturing Co., Ltd.1 | 12,600 | 1,376 | ||||||
| Taiwan Semiconductor Manufacturing Co. Ltd.1 | 300,000 | 1,324 | ||||||
| Other securities | 4,950 | |||||||
| 17,573 | ||||||||
| Health care 6.43% | ||||||||
| Merck & Co., Inc. | 79,120 | 4,493 | ||||||
| Novartis AG1 | 27,860 | 2,562 | ||||||
| Humana Inc. | 12,780 | 1,836 | ||||||
| Other securities | 4,976 | |||||||
| 13,867 | ||||||||
| Consumer discretionary 6.38% | ||||||||
| Comcast Corp., Class A | 49,930 | 2,897 | ||||||
| Home Depot, Inc. | 21,030 | 2,208 | ||||||
| SES SA, Class A (FDR)1 | 53,700 | 1,926 | ||||||
| HUGO BOSS AG1 | 12,600 | 1,547 | ||||||
| Tiffany & Co. | 12,600 | 1,346 | ||||||
| Other securities | 3,839 | |||||||
| 13,763 | ||||||||
| 86 | American Funds Insurance Series |
Global Balanced Fund
| Common stocks | Shares | Value (000) | ||||||
| Energy 3.39% | ||||||||
| Royal Dutch Shell PLC, Class B1 | 71,220 | $ | 2,447 | |||||
| Chevron Corp. | 13,030 | 1,462 | ||||||
| ConocoPhillips | 18,906 | 1,305 | ||||||
| Other securities | 2,092 | |||||||
| 7,306 | ||||||||
| Materials 3.19% | ||||||||
| MeadWestvaco Corp. | 34,000 | 1,509 | ||||||
| Dow Chemical Co. | 33,000 | 1,505 | ||||||
| Other securities | 3,876 | |||||||
| 6,890 | ||||||||
| Telecommunication services 1.41% | ||||||||
| Other securities | 3,051 | |||||||
| Utilities 1.12% | ||||||||
| EDP - Energias de Portugal, SA1 | 625,000 | 2,417 | ||||||
| Miscellaneous 2.03% | ||||||||
| Other common stocks in initial period of acquisition | 4,379 | |||||||
| Total common stocks (cost: $110,011,000) | 131,039 | |||||||
| Preferred securities 0.08% | ||||||||
| Financials 0.08% | ||||||||
| Other securities | 166 | |||||||
| Total preferred securities (cost: $150,000) | 166 | |||||||
| Convertible bonds 0.41% | Principal amount (000) | |||||||
| Consumer staples 0.41% | ||||||||
| Other securities | 873 | |||||||
| Total convertible bonds (cost: $1,198,000) | 873 | |||||||
| Bonds, notes & other debt instruments 30.38% | ||||||||
| Bonds & notes of governments & government agencies outside the U.S. 13.58% | ||||||||
| German Government 2.00%–4.25% 2016–2044 | € | 1,815 | 2,543 | |||||
| Spanish Government 4.00% 20183 | $ | 500 | 527 | |||||
| Spanish Government 2.75%–5.40% 2023–2024 | € | 1,160 | 1,715 | |||||
| United Kingdom 1.25%–5.00% 2015–2046 | £ | 2,480 | 4,308 | |||||
| United Mexican States Government Global 3.60% 2025 | $ | 200 | 200 | |||||
| United Mexican States Government 2.00%–10.00% 2015–20404 | MXN | 39,899 | 3,063 | |||||
| Other securities | 16,943 | |||||||
| 29,299 | ||||||||
| U.S. Treasury bonds & notes 6.96% | ||||||||
| U.S. Treasury 5.20% | ||||||||
| U.S. Treasury 1.625% 2019 | $ | 1,925 | 1,930 | |||||
| U.S. Treasury 0.63%–4.38% 2015–2044 | 9,128 | 9,279 | ||||||
| 11,209 | ||||||||
| American Funds Insurance Series | 87 |
Global Balanced Fund
| Bonds, notes & other debt instruments (continued) | Principal amount (000) | Value (000) | ||||||
| U.S. Treasury bonds & notes (continued) | ||||||||
| U.S. Treasury inflation-protected securities 1.76% | ||||||||
| U.S. Treasury Inflation-Protected Security 0.13%–2.38% 2017–20444 | $ | 3,728 | $ | 3,800 | ||||
| Total U.S. Treasury bonds & notes | 15,009 | |||||||
| Corporate bonds & notes 6.79% | ||||||||
| Financials 1.96% | ||||||||
| JPMorgan Chase & Co. 3.25% 2022 | 28 | 28 | ||||||
| JPMorgan Chase & Co., Series S, junior subordinated, perpetual, 6.75% (undated)5 | 135 | 143 | ||||||
| Other securities | 4,047 | |||||||
| 4,218 | ||||||||
| Health care 0.83% | ||||||||
| Novartis Capital Corp. 2.90%–3.40% 2015–2024 | 150 | 154 | ||||||
| Novartis Securities Investment Ltd. 5.125% 2019 | 25 | 28 | ||||||
| Other securities | 1,615 | |||||||
| 1,797 | ||||||||
| Consumer staples 0.60% | ||||||||
| Pernod Ricard SA 4.45% 20223 | 150 | 161 | ||||||
| Other securities | 1,125 | |||||||
| 1,286 | ||||||||
| Industrials 0.45% | ||||||||
| Boeing Company 0.95% 2018 | 45 | 44 | ||||||
| General Electric Capital Corp. 2.30%–3.15% 2017–2023 | 315 | 321 | ||||||
| General Electric Capital Corp., Series A, junior subordinated 7.125% (undated)5 | 100 | 117 | ||||||
| Other securities | 490 | |||||||
| 972 | ||||||||
| Consumer discretionary 0.40% | ||||||||
| Comcast Corp. 4.65% 2042 | 75 | 82 | ||||||
| Other securities | 786 | |||||||
| 868 | ||||||||
| Other 2.55% | ||||||||
| Other securities | 5,506 | |||||||
| Total corporate bonds & notes | 14,647 | |||||||
| Mortgage-backed obligations 3.05% | ||||||||
| Federal agency mortgage-backed obligations 2.93% | ||||||||
| Fannie Mae 3.50% 20456,7 | 1,625 | 1,689 | ||||||
| Fannie Mae 4.00% 20456,7 | 1,825 | 1,942 | ||||||
| Fannie Mae 2.50%–5.00% 2028–20456,7 | 2,515 | 2,688 | ||||||
| 6,319 | ||||||||
| 88 | American Funds Insurance Series |
Global Balanced Fund
| Bonds, notes & other debt instruments | Principal amount (000) | Value (000) | ||||||
| Commercial mortgage-backed securities 0.12% | ||||||||
| Other securities | $ | 262 | ||||||
| Total mortgage-backed obligations | 6,581 | |||||||
| Total bonds, notes & other debt instruments (cost: $66,396,000) | 65,536 | |||||||
| Short-term securities 10.52% | ||||||||
| Federal Home Loan Bank 0.10% due 2/20/2015 | $ | 6,500 | 6,500 | |||||
| Freddie Mac 0.05% due 1/9/2015 | 5,900 | 5,900 | ||||||
| General Electric Co. 0.10% due 1/2/2015 | 3,300 | 3,300 | ||||||
| Sumitomo Mitsui Banking Corp. 0.12% due 1/13/20153 | 3,000 | 3,000 | ||||||
| Victory Receivables Corp. 0.16% due 1/5/20153 | 4,000 | 4,000 | ||||||
| Total short-term securities (cost: $22,699,000) | 22,700 | |||||||
| Total investment securities 102.12% (cost: $200,454,000) | 220,314 | |||||||
| Other assets less liabilities (2.12)% | (4,565 | ) | ||||||
| Net assets 100.00% | $ | 215,749 | ||||||
This summary investment portfolio is designed to streamline the report and help investors better focus on the fund’s principal holdings. See the inside back cover for details on how to obtain a complete schedule of portfolio holdings.
As permitted by U.S. Securities and Exchange Commission regulations, “Miscellaneous” securities include holdings in their first year of acquisition that have not previously been publicly disclosed.
“Other securities” includes all issues that are not disclosed separately in the summary investment portfolio.
Forward currency contracts
The fund has entered into forward currency contracts as shown in the following table. The average notional amount of open forward currency contracts was $8,176,000 over the prior 12-month period.
| Contract amount | Unrealized (depreciation) appreciation | ||||||||||||
| Settlement date | Counterparty | Receive (000) | Deliver (000) | at 12/31/2014 (000) | |||||||||
| Purchases: | |||||||||||||
| Euros | 2/12/2015 | HSBC Bank | €349 | $434 | $ | (12 | ) | ||||||
| Japanese yen | 1/13/2015 | HSBC Bank | ¥86,626 | $727 | (3 | ) | |||||||
| Japanese yen | 1/15/2015 | HSBC Bank | ¥147,249 | �� | $1,233 | (3 | ) | ||||||
| Japanese yen | 1/22/2015 | UBS AG | ¥58,364 | $496 | (9 | ) | |||||||
| Japanese yen | 1/27/2015 | UBS AG | ¥34,916 | $300 | (9 | ) | |||||||
| Japanese yen | 1/28/2015 | UBS AG | ¥21,209 | $180 | (3 | ) | |||||||
| $ | (39 | ) | |||||||||||
| Sales: | |||||||||||||
| British pounds | 1/9/2015 | Bank of America, N.A. | $273 | £175 | — | 8 | |||||||
| British pounds | 1/12/2015 | Bank of America, N.A. | $313 | £200 | 2 | ||||||||
| British pounds | 1/15/2015 | HSBC Bank | $817 | £520 | 6 | ||||||||
| British pounds | 1/23/2015 | Barclays Bank PLC | €255 | £200 | (3 | ) | |||||||
| Colombian pesos | 1/13/2015 | Citibank | $52 | COP122,625 | — | 8 | |||||||
| Colombian pesos | 1/23/2015 | JPMorgan Chase | $189 | COP464,100 | (6 | ) | |||||||
| Euros | 1/27/2015 | UBS AG | ¥43,702 | €300 | 2 | ||||||||
| Euros | 1/29/2015 | Bank of America, N.A. | ¥58,619 | €400 | 5 | ||||||||
| Indonesian rupiah | 1/8/2015 | JPMorgan Chase | $122 | IDR1,506,300 | 1 | ||||||||
| Japanese yen | 1/8/2015 | JPMorgan Chase | $1,579 | ¥189,000 | 1 | ||||||||
| Mexican pesos | 1/28/2015 | Citibank | $225 | MXN3,275 | 3 | ||||||||
| American Funds Insurance Series | 89 |
Global Balanced Fund
| Contract amount | Unrealized (depreciation) appreciation | ||||||||||||
| Settlement date | Counterparty | Receive (000) | Deliver (000) | at 12/31/2014 (000) | |||||||||
| Mexican pesos | 1/29/2015 | Bank of America, N.A. | $143 | MXN2,100 | $ | — | 8 | ||||||
| Norwegian kroner | 1/9/2015 | HSBC Bank | $139 | NKr1,000 | 5 | ||||||||
| Norwegian kroner | 1/14/2015 | HSBC Bank | €87 | NKr750 | 4 | ||||||||
| Norwegian kroner | 1/14/2015 | Bank of America, N.A. | €124 | NKr1,100 | 3 | ||||||||
| Norwegian kroner | 1/15/2015 | HSBC Bank | $247 | NKr1,800 | 5 | ||||||||
| Norwegian kroner | 1/22/2015 | HSBC Bank | €194 | NKr1,800 | (7 | ) | |||||||
| Norwegian kroner | 1/23/2015 | UBS AG | €199 | NKr1,800 | — | 8 | |||||||
| Polish zloty | 1/22/2015 | JPMorgan Chase | $459 | PLN1,550 | 22 | ||||||||
| Polish zloty | 1/27/2015 | JPMorgan Chase | €556 | PLN2,350 | 11 | ||||||||
| Russian rubles | 1/14/2015 | Citibank | $13 | RUB750 | 1 | ||||||||
| Russian rubles | 1/16/2015 | JPMorgan Chase | $232 | RUB12,625 | 26 | ||||||||
| South African rand | 1/23/2015 | UBS AG | $42 | ZAR500 | (1 | ) | |||||||
| South African rand | 1/28/2015 | HSBC Bank | $184 | ZAR2,150 | (1 | ) | |||||||
| Swedish kronor | 1/12/2015 | Bank of America, N.A. | $79 | SKr600 | 2 | ||||||||
| Swedish kronor | 1/14/2015 | Citibank | $795 | SKr5,900 | 38 | ||||||||
| $ | 119 | ||||||||||||
| Forward currency contracts — net | $ | 80 | |||||||||||
The following footnotes apply to either the individual securities noted or one or more of the securities aggregated and listed as a single line item.
| 1 | Valued under fair value procedures adopted by authority of the board of trustees. The total value of all such securities, including those in “Miscellaneous” and “Other securities,” was $69,790,000, which represented 32.35% of the net assets of the fund. This amount includes $69,262,000 related to certain securities trading outside the U.S. whose values were adjusted as a result of significant market movements following the close of local trading. |
| 2 | Security did not produce income during the last 12 months. |
| 3 | Acquired in a transaction exempt from registration under Rule 144A or Section 4(2) of the Securities Act of 1933. May be resold in the U.S. in transactions exempt from registration, normally to qualified institutional buyers. The total value of all such securities, including those in “Other securities,” was $10,322,000, which represented 4.78% of the net assets of the fund. |
| 4 | Index-linked bond whose principal amount moves with a government price index. |
| 5 | Coupon rate may change periodically. |
| 6 | Principal payments may be made periodically. Therefore, the effective maturity date may be earlier than the stated maturity date. |
| 7 | A portion or all of the security purchased on a TBA basis. |
| 8 | Amount less than one thousand. |
Key to abbreviations and symbols
FDR = Fiduciary Depositary Receipts
TBA = To be announced
COP = Colombian pesos
€ = Euros
£ = British pounds
IDR = Indonesian rupiah
¥ = Japanese yen
MXN = Mexican pesos
NKr = Norwegian kroner
PLN = Polish zloty
RUB = Russian rubles
SKr = Swedish kronor
ZAR = South African rand
See Notes to Financial Statements
| 90 | American Funds Insurance Series |
Summary investment portfolio December 31, 2014
| Bonds, notes & other debt instruments 95.74% | Principal amount (000) | Value (000) | ||||||
| U.S. Treasury bonds & notes 37.80% | ||||||||
| U.S. Treasury 30.56% | ||||||||
| U.S. Treasury 7.50% 2016 | $ | 35,000 | $ | 39,468 | ||||
| U.S. Treasury 0.75% 20171 | 109,229 | 108,819 | ||||||
| U.S. Treasury 8.75% 2017 | 50,000 | 59,313 | ||||||
| U.S. Treasury 1.25% 2018 | 218,100 | 216,702 | ||||||
| U.S. Treasury 1.375% 2018 | 108,000 | 108,110 | ||||||
| U.S. Treasury 1.50% 2018 | 86,875 | 87,289 | ||||||
| U.S. Treasury 1.50% 2019 | 185,000 | 183,822 | ||||||
| U.S. Treasury 1.50% 2019 | 178,755 | 177,602 | ||||||
| U.S. Treasury 1.50% 2019 | 43,000 | 43,024 | ||||||
| U.S. Treasury 1.625% 2019 | 310,000 | 310,825 | ||||||
| U.S. Treasury 1.625% 2019 | 152,750 | 152,910 | ||||||
| U.S. Treasury 1.625% 2019 | 152,625 | 152,875 | ||||||
| U.S. Treasury 1.75% 2019 | 155,320 | 156,205 | ||||||
| U.S. Treasury 1.125% 2020 | 67,300 | 65,381 | ||||||
| U.S. Treasury 1.25% 2020 | 44,425 | 43,488 | ||||||
| U.S. Treasury 1.375% 2020 | 68,250 | 66,979 | ||||||
| U.S. Treasury 8.75% 2020 | 40,000 | 55,000 | ||||||
| U.S. Treasury 2.125% 2021 | 55,000 | 55,560 | ||||||
| U.S. Treasury 2.00% 2023 | 44,809 | 44,613 | ||||||
| U.S. Treasury 2.25% 2024 | 96,985 | 97,682 | ||||||
| U.S. Treasury 2.375% 2024 | 180,000 | 183,290 | ||||||
| U.S. Treasury 2.75% 2024 | 40,050 | 42,134 | ||||||
| U.S. Treasury 6.125% 2027 | 25,000 | 35,598 | ||||||
| U.S. Treasury 3.625% 2043 | 75,400 | 88,713 | ||||||
| U.S. Treasury 3.00% 2044 | 88,679 | 93,189 | ||||||
| U.S. Treasury 0.63%–7.63% 2016–20441 | 244,420 | 256,374 | ||||||
| 2,924,965 | ||||||||
| U.S. Treasury inflation-protected securities 7.24% | ||||||||
| U.S. Treasury Inflation-Protected Security 0.50% 20152 | 41,286 | 40,750 | ||||||
| U.S. Treasury Inflation-Protected Security 0.125% 20192 | 150,739 | 149,387 | ||||||
| U.S. Treasury Inflation-Protected Security 0.125% 20242 | 74,152 | 71,752 | ||||||
| U.S. Treasury Inflation-Protected Security 0.625% 20242 | 189,641 | 191,355 | ||||||
| U.S. Treasury Inflation-Protected Security 1.375% 20442 | 172,855 | 197,385 | ||||||
| U.S. Treasury Inflation-Protected Security 0.13%–2.39% 2015–20262 | 41,454 | 42,011 | ||||||
| 692,640 | ||||||||
| Total U.S. Treasury bonds & notes | 3,617,605 | |||||||
| Corporate bonds & notes 29.87% | ||||||||
| Financials 7.40% | ||||||||
| Other securities | 707,917 | |||||||
| Consumer staples 2.90% | ||||||||
| Coca-Cola Co. 1.50%–3.15% 2015–2020 | 14,395 | 14,771 | ||||||
| Other securities | 262,865 | |||||||
| 277,636 | ||||||||
| Industrials 1.88% | ||||||||
| Volvo Treasury AB 5.95% 20153 | 34,000 | 34,398 | ||||||
| Other securities | 145,325 | |||||||
| 179,723 | ||||||||
| Other 17.69% | ||||||||
| Other securities | 1,693,862 | |||||||
| Total corporate bonds & notes | 2,859,138 | |||||||
| American Funds Insurance Series | 91 |
Bond Fund
| Bonds, notes & other debt instruments (continued) | Principal amount (000) | Value (000) | ||||||
| Mortgage-backed obligations 21.46% | ||||||||
| Federal agency mortgage-backed obligations 17.61% | ||||||||
| Fannie Mae 3.50% 20454,5 | $ | 135,000 | $ | 140,670 | ||||
| Fannie Mae 3.50% 20454,5 | 75,000 | 77,945 | ||||||
| Fannie Mae 4.00% 20454,5 | 215,000 | 228,814 | ||||||
| Fannie Mae 4.50% 20454,5 | 446,334 | 483,618 | ||||||
| Fannie Mae 4.50% 20454,5 | 377,845 | 410,116 | ||||||
| Fannie Mae 1.77%–9.44% 2023–20444,6 | 113,216 | 123,516 | ||||||
| Freddie Mac 0%–5.50% 2033–20444,6 | 55,840 | 61,273 | ||||||
| Government National Mortgage Assn. 4.00% 20444 | 131,804 | 141,621 | ||||||
| Government National Mortgage Assn. 4.00%–4.50% 2040–20444 | 16,726 | 18,038 | ||||||
| 1,685,611 | ||||||||
| Other 3.85% | ||||||||
| Other securities | 367,736 | |||||||
| Total mortgage-backed obligations | 2,053,347 | |||||||
| Bonds & notes of governments & government agencies outside the U.S. 3.51% | ||||||||
| Spanish Government 5.15% 2044 | € | 26,750 | 46,332 | |||||
| Other securities | 289,915 | |||||||
| 336,247 | ||||||||
| Federal agency bonds & notes 1.89% | ||||||||
| Fannie Mae 1.25%–5.38% 2016–2024 | $ | 24,990 | 25,428 | |||||
| Freddie Mac 1.25% 2019 | 44,500 | 43,623 | ||||||
| Freddie Mac 0.50%–3.53% 2015–20234,6 | 45,025 | 45,972 | ||||||
| Other securities | 65,826 | |||||||
| 180,849 | ||||||||
| Municipals 0.90% | ||||||||
| State of California, Various Purpose G.O. Bonds, 7.60% 2040 | 22,040 | 35,015 | ||||||
| Other securities | 51,002 | |||||||
| 86,017 | ||||||||
| Asset-backed obligations 0.31% | ||||||||
| Other securities | 29,616 | |||||||
| Total bonds, notes & other debt instruments (cost: $9,020,873,000) | 9,162,819 | |||||||
| Convertible bonds 0.01% | ||||||||
| Financials 0.01% | ||||||||
| Other securities | 1,311 | |||||||
| Total convertible bonds (cost: $1,333,000) | 1,311 | |||||||
| Preferred securities 0.03% | Shares | |||||||
| Financials 0.02% | ||||||||
| Other securities | 1,658 | |||||||
| Miscellaneous 0.01% | ||||||||
| Other preferred securities in initial period of acquisition | 628 | |||||||
| Total preferred securities (cost: $2,180,000) | 2,286 | |||||||
| 92 | American Funds Insurance Series |
Bond Fund
| Common stocks 0.00% | Shares | Value (000) | ||||||
| Consumer discretionary 0.00% | ||||||||
| Other securities | $ | 6 | ||||||
| Total common stocks (cost: $2,376,000) | 6 | |||||||
| Short-term securities 17.20% | Principal amount (000) | |||||||
| Abbott Laboratories 0.09%–0.12% due 1/7/2015–3/4/20153 | $ | 101,700 | 101,687 | |||||
| Chevron Corp. 0.10%–0.12% due 1/12/2015–2/24/20153 | 39,900 | 39,895 | ||||||
| Coca-Cola Co. 0.13%–0.20% due 2/6/2015–5/8/20153 | 135,000 | 134,943 | ||||||
| Emerson Electric Co. 0.09%–0.10% due 1/7/2015–3/2/20153 | 52,200 | 52,193 | ||||||
| Fannie Mae 0.07%–0.12% due 1/14/2015–6/1/2015 | 143,800 | 143,776 | ||||||
| Federal Farm Credit Banks 0.11%–0.13% due 6/11/2015–7/17/2015 | 42,300 | 42,271 | ||||||
| Federal Home Loan Bank 0.08%–0.17% due 1/14/2015–11/4/2015 | 351,900 | 351,764 | ||||||
| Freddie Mac 0.06%–0.15% due 1/20/2015–7/23/2015 | 518,000 | 517,872 | ||||||
| Microsoft Corp. 0.10% due 2/2/20153 | 62,900 | 62,896 | ||||||
| Private Export Funding Corp. 0.15% due 1/7/20153 | 44,800 | 44,799 | ||||||
| U.S. Treasury Bills 0.13% due 6/25/2015 | 20,500 | 20,493 | ||||||
| Other securities | 133,672 | |||||||
| Total short-term securities (cost: $1,646,155,000) | 1,646,261 | |||||||
| Total investment securities 112.98% (cost: $10,672,917,000) | 10,812,683 | |||||||
| Other assets less liabilities (12.98)% | (1,242,063 | ) | ||||||
| Net assets 100.00% | $ | 9,570,620 | ||||||
This summary investment portfolio is designed to streamline the report and help investors better focus on the fund’s principal holdings. See the inside back cover for details on how to obtain a complete schedule of portfolio holdings.
“Other securities” includes all issues that are not disclosed separately in the summary investment portfolio, including securities which were valued under fair value procedures adopted by authority of the board of trustees. The total value of securities which were valued under fair value procedures was $430,000, which represented less than .01% of the net assets of the fund. One of these securities (with a value of $0, a cost of $2,194,000, and which represented less than .01% of the net assets of the fund) was acquired from 12/7/2011 to 12/31/2011 through private placement transactions exempt from registration under the Securities Act of 1933, which may subject it to legal or contractual restrictions on resale. “Other securities” also includes loan participations and assignments, which may be subject to legal or contractual restrictions on resale. The total value of such loans was $44,343,000, which represented .46% of the net assets of the fund.
| American Funds Insurance Series | 93 |
Bond Fund
Forward currency contracts
The fund has entered into forward currency contracts as shown in the following table. The average notional amount of open forward currency contracts was $174,267,000 over the prior 12-month period.
| Contract amount | Unrealized appreciation | ||||||||||||
| Settlement date | Counterparty | Receive (000) | Deliver (000) | at 12/31/2014 (000) | |||||||||
| Purchases: | |||||||||||||
| Euros | 1/26/2015 | HSBC Bank | $11,036 | €9,000 | $ | 142 | |||||||
| Euros | 1/28/2015 | HSBC Bank | $34,827 | €28,060 | 863 | ||||||||
| $ | 1,005 | ||||||||||||
| Sales: | |||||||||||||
| British pounds | 1/8/2015 | UBS AG | $9,782 | £6,240 | 57 | ||||||||
| Euros | 1/8/2015 | JPMorgan Chase | $84,403 | €68,450 | 1,568 | ||||||||
| Euros | 1/12/2015 | Citibank | $9,327 | €7,500 | 250 | ||||||||
| Euros | 1/22/2015 | Barclays Bank PLC | $6,145 | €5,000 | 93 | ||||||||
| Euros | 1/29/2015 | UBS AG | $8,653 | €7,100 | 59 | ||||||||
| Euros | 1/29/2015 | UBS AG | $8,644 | €7,100 | 50 | ||||||||
| Euros | 2/6/2015 | JPMorgan Chase | $6,160 | €4,906 | 221 | ||||||||
| Mexican pesos | 2/23/2015 | HSBC Bank | $21,122 | MXN289,600 | 1,559 | ||||||||
| $ | 3,857 | ||||||||||||
| Forward currency contracts — net | $ | 4,862 | |||||||||||
Interest rate swaps
The fund has entered into interest rate swaps as shown in the following table. The average notional amount of interest rate swaps was $1,019,242,000 over the prior 12-month period.
| Pay/receive fixed rate | Clearinghouse | Floating rate index | Fixed rate | Expiration date | Notional amount (000) | Unrealized appreciation (depreciation) at 12/31/2014 (000) | |||||||||
| Pay | LCH.Clearnet | 3-month USD-LIBOR | 0.799 | % | 12/17/2016 | $ | 7,500 | $ | 11 | ||||||
| Pay | LCH.Clearnet | 3-month USD-LIBOR | 0.8 | 12/19/2016 | 10,000 | 14 | |||||||||
| Pay | LCH.Clearnet | 3-month USD-LIBOR | 1.132 | 8/26/2017 | 479 | — | 7 | ||||||||
| Pay | LCH.Clearnet | 3-month USD-LIBOR | 1.138 | 8/27/2017 | 1,000 | 1 | |||||||||
| Pay | LCH.Clearnet | 3-month USD-LIBOR | 1.1625 | 9/2/2017 | 155,000 | 35 | |||||||||
| Pay | LCH.Clearnet | 3-month USD-LIBOR | 1.0545 | 10/16/2017 | 1,000 | 4 | |||||||||
| Pay | LCH.Clearnet | 3-month USD-LIBOR | 1.1375 | 11/6/2017 | 440,000 | 1,210 | |||||||||
| Receive | LCH.Clearnet | 3-month USD-LIBOR | 1.0635 | 12/3/2017 | 15,000 | (86 | ) | ||||||||
| Pay | LCH.Clearnet | 3-month USD-LIBOR | 1.2125 | 12/16/2017 | 250,000 | 458 | |||||||||
| Pay | LCH.Clearnet | 3-month USD-LIBOR | 1.607 | 8/1/2018 | 50,000 | (249 | ) | ||||||||
| Receive | LCH.Clearnet | 3-month USD-LIBOR | 2.39925 | 12/30/2018 | 180,000 | 457 | |||||||||
| Receive | LCH.Clearnet | 3-month USD-LIBOR | 2.33 | 12/31/2018 | 169,400 | 205 | |||||||||
| Receive | LCH.Clearnet | 3-month USD-LIBOR | 1.8065 | 7/29/2019 | 240,000 | 1,305 | |||||||||
| Receive | LCH.Clearnet | 3-month USD-LIBOR | 1.959 | 9/26/2019 | 500 | 6 | |||||||||
| Receive | LCH.Clearnet | 3-month USD-LIBOR | 1.7285 | 10/10/2019 | 5,200 | 2 | |||||||||
| Pay | LCH.Clearnet | 3-month USD-LIBOR | 1.584 | 10/22/2019 | 2,100 | 14 | |||||||||
| Receive | LCH.Clearnet | 3-month USD-LIBOR | 1.619 | 10/24/2019 | 80,000 | (411 | ) | ||||||||
| Receive | LCH.Clearnet | 3-month USD-LIBOR | 1.669 | 10/28/2019 | 185,000 | (534 | ) | ||||||||
| Pay | LCH.Clearnet | 3-month USD-LIBOR | 1.66 | 10/29/2019 | 700 | 2 | |||||||||
| Pay | LCH.Clearnet | 3-month USD-LIBOR | 1.7135 | 10/31/2019 | 425 | — | 7 | ||||||||
| Receive | LCH.Clearnet | 3-month USD-LIBOR | 1.7725 | 11/14/2019 | 253,460 | 393 | |||||||||
| Receive | LCH.Clearnet | 3-month USD-LIBOR | 1.77 | 11/14/2019 | 236,540 | 338 | |||||||||
| Pay | LCH.Clearnet | 3-month USD-LIBOR | 1.789 | 11/14/2019 | 660 | (1 | ) | ||||||||
| Receive | LCH.Clearnet | 3-month USD-LIBOR | 1.8095 | 12/9/2019 | 73,000 | 204 | |||||||||
| Receive | LCH.Clearnet | 3-month USD-LIBOR | 1.7375 | 12/19/2019 | 4,000 | (4 | ) | ||||||||
| 94 | American Funds Insurance Series |
Bond Fund
| Pay/receive fixed rate | Clearinghouse | Floating rate index | Fixed rate | Expiration date | Notional amount (000) | Unrealized appreciation (depreciation) at 12/31/2014 (000) | ||||||||||
| Pay | LCH.Clearnet | 3-month USD-LIBOR | 1.9455 | % | 10/20/2021 | $ | 800 | $ | 4 | |||||||
| Pay | LCH.Clearnet | 3-month USD-LIBOR | 2.0505 | 10/28/2021 | 700 | (1 | ) | |||||||||
| Pay | LCH.Clearnet | 6-month EURIBOR | 0.544 | 12/31/2021 | 40,000 | (62 | ) | |||||||||
| Pay | LCH.Clearnet | 3-month USD-LIBOR | 2.0525 | 1/5/2022 | 2,550 | — | ||||||||||
| Pay | LCH.Clearnet | 3-month USD-LIBOR | 2.805 | 3/21/2024 | 11,000 | (540 | ) | |||||||||
| Pay | LCH.Clearnet | 3-month USD-LIBOR | 2.609 | 5/29/2024 | 275 | (9 | ) | |||||||||
| Pay | LCH.Clearnet | 3-month USD-LIBOR | 2.701 | 6/9/2024 | 95,000 | (3,782 | ) | |||||||||
| Pay | LCH.Clearnet | 3-month USD-LIBOR | 2.6145 | 7/22/2024 | 800 | (26 | ) | |||||||||
| Pay | LCH.Clearnet | 3-month USD-LIBOR | 2.608 | 7/24/2024 | 150,000 | (4,707 | ) | |||||||||
| Pay | LCH.Clearnet | 3-month USD-LIBOR | 2.66 | 9/15/2024 | 2,750 | (98 | ) | |||||||||
| Pay | LCH.Clearnet | 3-month USD-LIBOR | 2.6815 | 9/24/2024 | 1,600 | (60 | ) | |||||||||
| Pay | LCH.Clearnet | 3-month USD-LIBOR | 2.6915 | 9/26/2024 | 1,100 | (42 | ) | |||||||||
| Pay | LCH.Clearnet | 3-month USD-LIBOR | 2.54 | 10/3/2024 | 400 | (10 | ) | |||||||||
| Pay | LCH.Clearnet | 3-month USD-LIBOR | 2.58 | 10/6/2024 | 600 | (17 | ) | |||||||||
| Pay | LCH.Clearnet | 6-month EURIBOR | 0.9852 | 10/17/2024 | 25,000 | (569 | ) | |||||||||
| Pay | LCH.Clearnet | 3-month USD-LIBOR | 2.342 | 10/21/2024 | 290 | (2 | ) | |||||||||
| Pay | LCH.Clearnet | 3-month USD-LIBOR | 2.326 | 10/22/2024 | 800 | (4 | ) | |||||||||
| Pay | LCH.Clearnet | 3-month USD-LIBOR | 2.372 | 10/24/2024 | 1,150 | (11 | ) | |||||||||
| Pay | LCH.Clearnet | 3-month USD-LIBOR | 2.526 | 11/10/2024 | 50,050 | (1,151 | ) | |||||||||
| Pay | LCH.Clearnet | 3-month USD-LIBOR | 2.438 | 11/19/2024 | 3,250 | (49 | ) | |||||||||
| Pay | LCH.Clearnet | 3-month USD-LIBOR | 2.4585 | 11/24/2024 | 23,000 | (385 | ) | |||||||||
| Pay | LCH.Clearnet | 3-month USD-LIBOR | 2.4295 | 11/25/2024 | 800 | (11 | ) | |||||||||
| Pay | LCH.Clearnet | 3-month USD-LIBOR | 2.426 | 12/5/2024 | 5,500 | (75 | ) | |||||||||
| Pay | LCH.Clearnet | 3-month USD-LIBOR | 2.353 | 12/8/2024 | 700 | (5 | ) | |||||||||
| Pay | LCH.Clearnet | 3-month USD-LIBOR | 2.3555 | 12/8/2024 | 1,500 | (11 | ) | |||||||||
| Pay | LCH.Clearnet | 3-month USD-LIBOR | 2.429 | 12/9/2024 | 3,750 | (52 | ) | |||||||||
| Pay | LCH.Clearnet | 3-month USD-LIBOR | 2.2845 | 12/12/2024 | 330 | — | 7 | |||||||||
| Pay | LCH.Clearnet | 3-month USD-LIBOR | 3.008 | 12/30/2024 | 80,000 | (505 | ) | |||||||||
| Pay | LCH.Clearnet | 3-month USD-LIBOR | 2.9125 | 12/31/2024 | 76,000 | (172 | ) | |||||||||
| Pay | LCH.Clearnet | 3-month USD-LIBOR | 2.2945 | 1/5/2025 | 6,100 | — | ||||||||||
| Pay | LCH.Clearnet | 3-month USD-LIBOR | 2.86625 | 1/6/2025 | 94,000 | — | ||||||||||
| Pay | LCH.Clearnet | 6-month EURIBOR | 1.4385 | 11/6/2029 | 17,200 | (910 | ) | |||||||||
| Receive | LCH.Clearnet | 3-month USD-LIBOR | 3.0865 | 8/18/2034 | 5,500 | 416 | ||||||||||
| Receive | LCH.Clearnet | 3-month USD-LIBOR | 2.951 | 9/2/2034 | 450 | 24 | ||||||||||
| Receive | LCH.Clearnet | 3-month USD-LIBOR | 2.913 | 11/24/2034 | 14,000 | 668 | ||||||||||
| Pay | LCH.Clearnet | 3-month USD-LIBOR | 3.273 | 7/28/2044 | 450 | (55 | ) | |||||||||
| Pay | LCH.Clearnet | 3-month USD-LIBOR | 3.304 | 8/4/2044 | 340 | (44 | ) | |||||||||
| Pay | LCH.Clearnet | 3-month USD-LIBOR | 3.245 | 8/8/2044 | 600 | (70 | ) | |||||||||
| Pay | LCH.Clearnet | 3-month USD-LIBOR | 3.2165 | 8/13/2044 | 600 | (66 | ) | |||||||||
| Pay | LCH.Clearnet | 3-month USD-LIBOR | 3.2515 | 9/12/2044 | 700 | (83 | ) | |||||||||
| Pay | LCH.Clearnet | 3-month USD-LIBOR | 3.355 | 9/18/2044 | 500 | (70 | ) | |||||||||
| Pay | LCH.Clearnet | 3-month USD-LIBOR | 3.132 | 10/8/2044 | 200 | (19 | ) | |||||||||
| Pay | LCH.Clearnet | 3-month USD-LIBOR | 3.046 | 10/10/2044 | 1,300 | (97 | ) | |||||||||
| Pay | LCH.Clearnet | 3-month USD-LIBOR | 2.975 | 10/24/2044 | 5,000 | (297 | ) | |||||||||
| Pay | LCH.Clearnet | 6-month EURIBOR | 1.6397 | 10/31/2044 | 21,800 | (1,239 | ) | |||||||||
| Pay | LCH.Clearnet | 3-month USD-LIBOR | 3.0745 | 11/10/2044 | 250 | (20 | ) | |||||||||
| Pay | LCH.Clearnet | 3-month USD-LIBOR | 3.086 | 11/10/2044 | 525 | (44 | ) | |||||||||
| Pay | LCH.Clearnet | 3-month USD-LIBOR | 3.061 | 11/12/2044 | 200 | (15 | ) | |||||||||
| Pay | LCH.Clearnet | 3-month USD-LIBOR | 3.0515 | 11/14/2044 | 1,000 | (76 | ) | |||||||||
| Pay | LCH.Clearnet | 3-month USD-LIBOR | 3.0205 | 11/24/2044 | 3,500 | (242 | ) | |||||||||
| Receive | LCH.Clearnet | 3-month USD-LIBOR | 2.9255 | 11/28/2044 | 50,000 | 2,444 | ||||||||||
| Pay | LCH.Clearnet | 3-month USD-LIBOR | 2.899 | 12/2/2044 | 2,400 | (103 | ) | |||||||||
| Pay | LCH.Clearnet | 3-month USD-LIBOR | 2.925 | 12/3/2044 | 1,980 | (96 | ) | |||||||||
| Receive | LCH.Clearnet | 3-month USD-LIBOR | 2.933 | 12/8/2044 | 30,000 | 1,510 | ||||||||||
| Pay | LCH.Clearnet | 3-month USD-LIBOR | 2.6695 | 12/19/2044 | 200 | 1 | ||||||||||
| $ | (7,461 | ) | ||||||||||||||
| American Funds Insurance Series | 95 |
Bond Fund
The following footnotes apply to either the individual securities noted or one or more of the securities aggregated and listed as a single line item.
| 1 | A portion of this security was pledged as collateral. The total value of pledged collateral was $133,853,000, which represented 1.40% of the net assets of the fund. |
| 2 | Index-linked bond whose principal amount moves with a government price index. |
| 3 | Acquired in a transaction exempt from registration under Rule 144A or Section 4(2) of the Securities Act of 1933. May be resold in the U.S. in transactions exempt from registration, normally to qualified institutional buyers. The total value of all such securities, including those in “Other securities,” was $1,331,157,000, which represented 13.91% of the net assets of the fund. |
| 4 | Principal payments may be made periodically. Therefore, the effective maturity date may be earlier than the stated maturity date. |
| 5 | A portion or all of the security purchased on a TBA basis. |
| 6 | Coupon rate may change periodically. |
| 7 | Amount less than one thousand. |
Key to abbreviations and symbols
G.O. = General Obligation
TBA = To be announced
€ = Euros
£ = British pounds
MXN = Mexican pesos
See Notes to Financial Statements
| 96 | American Funds Insurance Series |
Summary investment portfolio December 31, 2014
| Bonds, notes & other debt instruments 97.08% | Principal amount (000) | Value (000) | ||||||
| Euros 22.61% | ||||||||
| Belgium (Kingdom of) 1.25%–3.75% 2018–2045 | € | 20,625 | $ | 28,768 | ||||
| German Government 3.00% 2020 | 9,300 | 13,079 | ||||||
| German Government 1.50%–6.25% 2024–2044 | 9,230 | 15,143 | ||||||
| Hungarian Government 5.75% 2018 | 9,385 | 12,953 | ||||||
| Hungarian Government 3.88%–6.00% 2019–2020 | 7,550 | 10,597 | ||||||
| Irish Government 4.50% 2020 | 15,595 | 22,748 | ||||||
| Irish Government 3.90% 2023 | 32,790 | 48,437 | ||||||
| Irish Government 3.40% 2024 | 24,155 | 34,653 | ||||||
| Irish Government 2.40%–5.00% 2020–2030 | 3,800 | 5,393 | ||||||
| Italian Government 2.15% 2021 | 13,960 | 17,723 | ||||||
| Portuguese Government 3.85% 2021 | 8,640 | 11,618 | ||||||
| Portuguese Government 5.65% 2024 | 35,165 | 52,797 | ||||||
| Slovenia (Republic of) 4.13%–4.62% 2019–2024 | 14,120 | 20,048 | ||||||
| Spanish Government 1.40% 2020 | 16,420 | 20,383 | ||||||
| Spanish Government 5.85% 2022 | 21,085 | 33,643 | ||||||
| Spanish Government 5.40% 2023 | 11,025 | 17,460 | ||||||
| Spanish Government 2.75% 2024 | 19,320 | 25,796 | ||||||
| Spanish Government 5.15% 2028 | 8,700 | 14,118 | ||||||
| Spanish Government 5.15% 2044 | 17,165 | 29,731 | ||||||
| Other securities | 149,220 | |||||||
| 584,308 | ||||||||
| British pounds 5.26% | ||||||||
| United Kingdom 2.00% 2020 | £ | 18,816 | 30,366 | |||||
| United Kingdom 3.75% 2020 | 8,583 | 15,174 | ||||||
| United Kingdom 2.25% 2023 | 15,620 | 25,517 | ||||||
| United Kingdom 3.25% 2044 | 8,895 | 16,002 | ||||||
| United Kingdom 1.00%–4.75% 2015–2040 | 25,005 | 44,391 | ||||||
| Other securities | 4,372 | |||||||
| 135,822 | ||||||||
| Mexican pesos 3.16% | ||||||||
| United Mexican States Government, Series M20, 10.00% 2024 | MXN | 247,500 | 22,014 | |||||
| United Mexican States Government 2.00%–10.00% 2015–20421 | 785,677 | 59,505 | ||||||
| 81,519 | ||||||||
| Japanese yen 2.53% | ||||||||
| Japanese Government, Series 116, 2.20% 2030 | ¥ | 1,970,000 | 20,011 | |||||
| Japanese Government, Series 145, 1.70% 2033 | 1,580,000 | 14,856 | ||||||
| Japanese Government 0.10%–2.00% 2016–2042 | 3,416,250 | 30,579 | ||||||
| 65,446 | ||||||||
| Indian rupees 1.83% | ||||||||
| India (Republic of) 7.28% 2019 | INR | 1,727,000 | 26,839 | |||||
| India (Republic of) 8.83% 2023 | 1,230,000 | 20,524 | ||||||
| 47,363 | ||||||||
| Polish zloty 1.78% | ||||||||
| Polish Government 4.00%–5.75% 2017–2023 | PLN | 139,392 | 45,973 | |||||
| Hungarian forints 1.57% | ||||||||
| Hungarian Government, Series 20A, 7.50% 2020 | HUF | 6,694,000 | 31,329 | |||||
| Hungarian Government 5.50%–7.00% 2019–2025 | 2,037,020 | 9,302 | ||||||
| 40,631 | ||||||||
| Norwegian kroner 1.41% | ||||||||
| Norwegian Government 3.75% 2021 | NKr | 145,225 | 22,503 | |||||
| Norwegian Government 3.00%–4.50% 2017–2024 | 92,110 | 13,995 | ||||||
| 36,498 | ||||||||
| American Funds Insurance Series | 97 |
Global Bond Fund
| Bonds, notes & other debt instruments (continued) | Principal amount (000) | Value (000) | ||||||
| Colombian pesos 1.14% | ||||||||
| Colombia (Republic of), Series B, 10.00% 2024 | COP | 27,232,100 | $ | 13,689 | ||||
| Colombia (Republic of) 5.00%–6.00% 2018–2028 | 40,699,700 | 15,697 | ||||||
| Colombia (Republic of) Global 9.85% 2027 | 130,000 | 69 | ||||||
| 29,455 | ||||||||
| U.S. dollars 52.88% | ||||||||
| Fannie Mae 3.50% 20452,3 | $ | 32,675 | 34,047 | |||||
| Fannie Mae 4.00% 20452,3 | 16,050 | 17,081 | ||||||
| Fannie Mae 4.50% 20452,3 | 27,348 | 29,632 | ||||||
| Fannie Mae 4.50% 20452,3 | 16,312 | 17,705 | ||||||
| Fannie Mae 2.18%–6.50% 2022–20452,3,4 | 36,822 | 38,323 | ||||||
| Hungarian Government 4.00%–7.62% 2018–2041 | 14,298 | 16,144 | ||||||
| Slovenia (Republic of) 4.13%–5.85% 2018–20245 | 13,700 | 15,255 | ||||||
| U.S. Treasury 1.25% 2018 | 36,150 | 35,918 | ||||||
| U.S. Treasury 1.375% 2018 | 15,000 | 15,015 | ||||||
| U.S. Treasury 1.50% 2018 | 67,050 | 67,370 | ||||||
| U.S. Treasury 3.50% 2018 | 15,275 | 16,366 | ||||||
| U.S. Treasury 1.00% 2019 | 27,500 | 26,835 | ||||||
| U.S. Treasury 1.50% 2019 | 13,950 | 13,958 | ||||||
| U.S. Treasury 1.625% 2019 | 46,905 | 46,954 | ||||||
| U.S. Treasury 1.625% 20196 | 44,800 | 44,919 | ||||||
| U.S. Treasury 1.625% 2019 | 18,550 | 18,630 | ||||||
| U.S. Treasury 1.125% 2020 | 30,350 | 29,484 | ||||||
| U.S. Treasury 1.375% 2020 | 39,600 | 38,862 | ||||||
| U.S. Treasury 2.50% 2024 | 19,530 | 20,111 | ||||||
| U.S. Treasury 0.38%–5.12% 2015–2043 | 79,775 | 79,613 | ||||||
| U.S. Treasury Inflation-Protected Security 0.125% 20191 | 45,678 | 45,268 | ||||||
| U.S. Treasury Inflation-Protected Security 0.625% 20241 | 46,202 | 46,619 | ||||||
| U.S. Treasury Inflation-Protected Security 1.375% 20441 | 14,517 | 16,592 | ||||||
| U.S. Treasury Inflation-Protected Security 0.13%–2.38% 2018–20431 | 18,552 | 18,395 | ||||||
| United Mexican States Government Global 3.60%–3.63% 2022–2025 | 4,525 | 4,570 | ||||||
| Other securities | 613,000 | |||||||
| 1,366,666 | ||||||||
| Other 2.91% | ||||||||
| Other securities | 75,018 | |||||||
| Total bonds, notes & other debt instruments (cost: $2,546,783,000) | 2,508,699 | |||||||
| Convertible stocks 0.01% | Shares | |||||||
| U.S. dollars 0.01% | ||||||||
| Other securities | 357 | |||||||
| Total convertible stocks (cost: $386,000) | 357 | |||||||
| Common stocks 0.01% | ||||||||
| U.S. dollars 0.01% | ||||||||
| Other securities | 334 | |||||||
| Total common stocks (cost: $998,000) | 334 | |||||||
| Short-term securities 5.89% | Principal amount (000) | |||||||
| Abbott Laboratories 0.09% due 2/2/20155 | $ | 20,000 | 19,999 | |||||
| Coca-Cola Co. 0.14% due 1/12/20155 | 25,000 | 24,999 | ||||||
| ExxonMobil Corp. 0.14% due 3/2/2015 | 17,000 | 16,996 | ||||||
| Federal Home Loan Bank 0.09% due 2/13/2015 | 30,000 | 29,999 | ||||||
| 98 | American Funds Insurance Series |
Global Bond Fund
| Short-term securities | Principal amount (000) | Value (000) | ||||||
| John Deere Financial Ltd. 0.09% due 1/13/20155 | $ | 35,000 | $ | 34,998 | ||||
| Toronto-Dominion Holdings USA Inc. 0.16% due 1/22/20155 | 20,000 | 19,999 | ||||||
| Other securities | 5,100 | |||||||
| Total short-term securities (cost: $152,087,000) | 152,090 | |||||||
| Total investment securities 102.99% (cost: $2,700,254,000) | 2,661,480 | |||||||
| Other assets less liabilities (2.99)% | (77,177 | ) | ||||||
| Net assets 100.00% | $ | 2,584,303 | ||||||
This summary investment portfolio is designed to streamline the report and help investors better focus on the fund’s principal holdings. See the inside back cover for details on how to obtain a complete schedule of portfolio holdings.
“Other securities” includes all issues that are not disclosed separately in the summary investment portfolio, including securities which were valued under fair value procedures adopted by authority of the board of trustees. The total value of securities which were valued under fair value procedures was $698,000, which represented ..03% of the net assets of the fund. One of these securities (with a value of $28,000, a cost of $52,000, and which represented less than .01% of the net assets of the fund) was acquired on 3/10/2010 through private placement transactions exempt from registration under the Securities Act of 1933, which may subject it to legal or contractual restrictions on resale. “Other securities” also includes loan participations and assignments, which may be subject to legal or contractual restrictions on resale. The total value of all such loans was $10,039,000, which represented .39% of the net assets of the fund.
| American Funds Insurance Series | 99 |
Global Bond Fund
Forward currency contracts
The fund has entered into forward currency contracts as shown in the following table. The average notional amount of open forward currency contracts was $443,327,000 over the prior 12-month period.
| Contract amount | Unrealized (depreciation) appreciation | ||||||||||||
| Settlement date | Counterparty | Receive (000) | Deliver (000) | at 12/31/2014 (000) | |||||||||
| Purchases: | |||||||||||||
| Euros | 1/15/2015 | UBS AG | €10,410 | $12,885 | $ | (287 | ) | ||||||
| Euros | 2/12/2015 | HSBC Bank | €6,879 | $8,555 | (228 | ) | |||||||
| Japanese yen | 1/7/2015 | JPMorgan Chase | ¥970,280 | $8,215 | (114 | ) | |||||||
| Japanese yen | 1/7/2015 | Bank of New York Mellon | ¥2,712,496 | $22,964 | (317 | ) | |||||||
| Japanese yen | 1/9/2015 | JPMorgan Chase | ¥1,078,281 | $9,906 | (904 | ) | |||||||
| Japanese yen | 1/9/2015 | HSBC Bank | ¥999,315 | $9,250 | (906 | ) | |||||||
| Japanese yen | 1/9/2015 | Bank of New York Mellon | ¥1,094,935 | $10,171 | (1,029 | ) | |||||||
| Japanese yen | 1/9/2015 | Bank of New York Mellon | ¥1,498,997 | $13,750 | (1,234 | ) | |||||||
| Japanese yen | 1/13/2015 | HSBC Bank | ¥1,905,431 | $15,984 | (74 | ) | |||||||
| Japanese yen | 1/14/2015 | Citibank | ¥3,622,655 | $30,650 | (402 | ) | |||||||
| Japanese yen | 1/15/2015 | HSBC Bank | ¥4,804,701 | $40,226 | (108 | ) | |||||||
| Japanese yen | 1/16/2015 | UBS AG | ¥1,070,490 | $9,039 | (101 | ) | |||||||
| Japanese yen | 1/16/2015 | Citibank | ¥1,854,036 | $15,649 | (169 | ) | |||||||
| Japanese yen | 1/23/2015 | HSBC Bank | ¥960,273 | $8,191 | (172 | ) | |||||||
| Japanese yen | 1/28/2015 | Barclays Bank PLC | ¥1,163,558 | $9,905 | (188 | ) | |||||||
| $ | (6,233 | ) | |||||||||||
| Sales: | |||||||||||||
| Australian dollars | 3/3/2015 | Citibank | $5,534 | A$6,540 | 218 | ||||||||
| Brazilian reais | 1/12/2015 | Citibank | $4,938 | BRL13,000 | 62 | ||||||||
| British pounds | 1/12/2015 | Bank of America, N.A. | $8,614 | £5,500 | 43 | ||||||||
| British pounds | 1/23/2015 | Barclays Bank PLC | €7,019 | £5,500 | (75 | ) | |||||||
| British pounds | 2/11/2015 | Bank of America, N.A. | $4,075 | £2,600 | 24 | ||||||||
| British pounds | 2/12/2015 | HSBC Bank | $8,994 | £5,690 | 128 | ||||||||
| British pounds | 3/4/2015 | UBS AG | €6,128 | £4,860 | (151 | ) | |||||||
| Canadian dollars | 2/23/2015 | UBS AG | $4,521 | C$5,120 | 119 | ||||||||
| Colombian pesos | 1/8/2015 | JPMorgan Chase | $2,873 | COP6,629,670 | 84 | ||||||||
| Colombian pesos | 1/13/2015 | Citibank | $1,560 | COP3,672,875 | 15 | ||||||||
| Colombian pesos | 1/16/2015 | Barclays Bank PLC | $7,422 | COP17,936,000 | (123 | ) | |||||||
| Colombian pesos | 1/23/2015 | JPMorgan Chase | $7,521 | COP18,487,000 | (254 | ) | |||||||
| Euros | 1/7/2015 | Barclays Bank PLC | $10,943 | €8,620 | 512 | ||||||||
| Euros | 1/7/2015 | UBS AG | $5,903 | €4,850 | 34 | ||||||||
| Euros | 1/8/2015 | JPMorgan Chase | $22,781 | €18,475 | 423 | ||||||||
| Euros | 1/9/2015 | Citibank | $8,193 | €6,472 | 361 | ||||||||
| Euros | 1/9/2015 | Bank of America, N.A. | $8,123 | €6,440 | 330 | ||||||||
| Euros | 1/9/2015 | HSBC Bank | $3,644 | €2,878 | 161 | ||||||||
| Euros | 1/9/2015 | HSBC Bank | $8,857 | €7,200 | 144 | ||||||||
| Euros | 1/12/2015 | UBS AG | $5,263 | €4,150 | 240 | ||||||||
| Euros | 1/15/2015 | HSBC Bank | $5,955 | €4,810 | 133 | ||||||||
| Euros | 1/22/2015 | Citibank | $5,299 | €4,260 | 143 | ||||||||
| Euros | 1/22/2015 | JPMorgan Chase | $3,022 | €2,430 | 81 | ||||||||
| Euros | 1/29/2015 | UBS AG | $13,314 | €10,925 | 90 | ||||||||
| Euros | 1/29/2015 | UBS AG | $11,535 | €9,475 | 66 | ||||||||
| Euros | 3/3/2015 | JPMorgan Chase | $11,648 | €9,320 | 364 | ||||||||
| Euros | 3/4/2015 | HSBC Bank | $5,837 | €4,710 | 135 | ||||||||
| Euros | 3/23/2015 | Citibank | £2,317 | €2,950 | 36 | ||||||||
| Euros | 3/23/2015 | Bank of America, N.A. | $3,122 | €2,550 | 34 | ||||||||
| Euros | 3/27/2015 | UBS AG | $22,209 | €18,200 | 169 | ||||||||
| Hungarian forints | 1/12/2015 | Bank of America, N.A. | $2,619 | HUF648,000 | 142 | ||||||||
| Hungarian forints | 1/15/2015 | UBS AG | €6,647 | HUF2,043,400 | 237 | ||||||||
| Hungarian forints | 1/29/2015 | Citibank | €19,908 | HUF6,170,000 | 533 | ||||||||
| Hungarian forints | 2/19/2015 | HSBC Bank | €2,421 | HUF742,740 | 96 | ||||||||
| Indonesian rupiah | 1/8/2015 | JPMorgan Chase | $3,886 | IDR47,992,000 | 17 | ||||||||
| 100 | American Funds Insurance Series |
Global Bond Fund
| Contract amount | Unrealized (depreciation) appreciation | ||||||||||||
| Settlement date | Counterparty | Receive (000) | Deliver (000) | at 12/31/2014 (000) | |||||||||
| Mexican pesos | 1/28/2015 | Citibank | $6,965 | MXN101,575 | $ | 93 | |||||||
| Mexican pesos | 1/29/2015 | Bank of America, N.A. | $6,365 | MXN93,800 | 19 | ||||||||
| Mexican pesos | 2/23/2015 | HSBC Bank | $17,891 | MXN245,300 | 1,321 | ||||||||
| Mexican pesos | 3/10/2015 | Bank of America, N.A. | $2,701 | MXN39,260 | 52 | ||||||||
| Mexican pesos | 3/11/2015 | Citibank | $5,583 | MXN80,730 | 135 | ||||||||
| Norwegian kroner | 1/9/2015 | HSBC Bank | $6,784 | NKr48,700 | 252 | ||||||||
| Norwegian kroner | 1/15/2015 | HSBC Bank | $7,821 | NKr57,100 | 163 | ||||||||
| Norwegian kroner | 1/22/2015 | HSBC Bank | €6,211 | NKr57,700 | (220) | ||||||||
| Norwegian kroner | 1/23/2015 | UBS AG | €6,479 | NKr58,600 | (15) | ||||||||
| Russian rubles | 1/14/2015 | Citibank | $342 | RUB19,300 | 26 | ||||||||
| Russian rubles | 1/16/2015 | JPMorgan Chase | $5,403 | RUB294,100 | 608 | ||||||||
| South African rand | 1/23/2015 | UBS AG | $4,186 | ZAR49,500 | (77) | ||||||||
| Swedish kronor | 1/7/2015 | UBS AG | €969 | SKr8,917 | 28 | ||||||||
| Swedish kronor | 1/27/2015 | JPMorgan Chase | €909 | SKr8,430 | 19 | ||||||||
| Swedish kronor | 3/17/2015 | Citibank | $5,013 | SKr38,340 | 93 | ||||||||
| $ | 7,068 | ||||||||||||
| Forward currency contracts — net | $ | 835 | |||||||||||
Interest rate swaps
The fund has entered into interest rate swaps as shown in the following table. The average notional amount of interest rate swaps was $80,433,000 over the prior six-month period.
| Pay/receive fixed rate | Clearinghouse | Floating rate index | Fixed rate | Expiration date | Notional amount (000) | Unrealized appreciation (depreciation) at 12/31/2014 (000) | ||||||||||
| Receive | LCH.Clearnet | 3-month USD-LIBOR | 1.8065 | % | 7/29/2019 | $ | 50,000 | $ | 272 | |||||||
| Pay | LCH.Clearnet | 6-month EURIBOR | 1.4385 | 11/6/2029 | 2,800 | (149) | ||||||||||
| Pay | LCH.Clearnet | 6-month EURIBOR | 1.4217 | 11/24/2029 | 6,000 | (298) | ||||||||||
| $ | (175) | |||||||||||||||
The following footnotes apply to either the individual securities noted or one or more of the securities aggregated and listed as a single line item.
| 1 | Index-linked bond whose principal amount moves with a government price index. |
| 2 | Principal payments may be made periodically. Therefore, the effective maturity date may be earlier than the stated maturity date. |
| 3 | A portion or all of the security purchased on a TBA basis. |
| 4 | Coupon rate may change periodically. |
| 5 | Acquired in a transaction exempt from registration under Rule 144A or Section 4(2) of the Securities Act of 1933. May be resold in the U.S. in transactions exempt from registration, normally to qualified institutional buyers. The total value of all such securities, including those in “Other securities,” was $284,687,000, which represented 11.02% of the net assets of the fund. |
| 6 | A portion of this security was pledged as collateral. The total value of pledged collateral was $4,587,000, which represented .18% of the net assets of the fund. |
Key to abbreviation
TBA = To be announced
See Notes to Financial Statements
| American Funds Insurance Series | 101 |
Summary investment portfolio December 31, 2014
| Bonds, notes & other debt instruments 89.08% | Principal amount (000) | Value (000) | ||||||
| Corporate bonds & notes 86.38% | ||||||||
| Telecommunication services 15.03% | ||||||||
| Clearwire Communications and Clearwire Finance, Inc. 14.75% 20161 | $ | 1,250 | $ | 1,506 | ||||
| Digicel Group Ltd. 8.25% 20201 | 17,300 | 16,867 | ||||||
| Digicel Group Ltd. 6.00%–7.13% 2021–20221 | 8,900 | 8,328 | ||||||
| Frontier Communications Corp. 6.25%–9.25% 2018–2025 | 24,725 | 27,131 | ||||||
| Intelsat Jackson Holding Co. 7.25% 2020 | 1,100 | 1,165 | ||||||
| Intelsat Jackson Holding Co. 6.625% 2022 | 22,350 | 23,076 | ||||||
| Intelsat Luxembourg Holding Co. 6.75% 2018 | 1,470 | 1,507 | ||||||
| MetroPCS Wireless, Inc. 6.25% 2021 | 16,950 | 17,412 | ||||||
| MetroPCS Wireless, Inc. 6.625% 2023 | 19,150 | 19,705 | ||||||
| NII Capital Corp. 7.63%–11.38% 2016–20211,2 | 62,635 | 25,837 | ||||||
| Numericable Group SA, First Lien, 4.875% 20191 | 18,800 | 18,706 | ||||||
| Numericable Group SA 6.00%–6.25% 2022–20241 | 9,350 | 9,414 | ||||||
| Sprint Nextel Corp. 7.00% 2020 | 28,050 | 28,190 | ||||||
| Sprint Nextel Corp. 7.25% 2021 | 9,900 | 9,863 | ||||||
| Sprint Nextel Corp. 7.88%–11.50% 2021–2023 | 7,000 | 8,011 | ||||||
| T-Mobile US, Inc. 6.375% 2025 | 9,400 | 9,574 | ||||||
| T-Mobile US, Inc. 6.54%–6.73% 2020–2022 | 9,879 | 10,228 | ||||||
| Trilogy International Partners, LLC 10.25% 20161 | 12,675 | 12,723 | ||||||
| Wind Acquisition SA 4.75% 20201 | 7,575 | 7,102 | ||||||
| Wind Acquisition SA 7.375% 20211 | 18,000 | 17,033 | ||||||
| Other securities | 21,491 | |||||||
| 294,869 | ||||||||
| Health care 14.64% | ||||||||
| DJO Finance LLC 7.75% 2018 | 12,070 | 11,768 | ||||||
| DJO Finance LLC 8.75%–9.88% 2017–2018 | 12,295 | 12,474 | ||||||
| HCA Inc. 3.75% 2019 | 16,135 | 16,196 | ||||||
| HCA Inc. 5.00%–6.50% 2020–2024 | 7,730 | 8,318 | ||||||
| inVentiv Health Inc, Term Loan B4, 7.75% 20183,4,5 | 7,585 | 7,561 | ||||||
| inVentiv Health Inc. 9.00% 20181 | 10,775 | 11,044 | ||||||
| inVentiv Health Inc. 11.00% 20181 | 12,092 | 10,568 | ||||||
| inVentiv Health Inc. 12.00% 20181,3,6 | 17,376 | 16,420 | ||||||
| Kinetic Concepts, Inc. 10.50% 2018 | 22,795 | 24,847 | ||||||
| Kinetic Concepts, Inc. 12.50% 2019 | 15,330 | 17,016 | ||||||
| Multiplan Inc., Term Loan B, 3.75% 20213,4,5 | 13,777 | 13,424 | ||||||
| Ortho-Clinical Diagnostics Inc., Term Loan B, 4.75% 20213,4,5 | 10,599 | 10,447 | ||||||
| VPI Escrow Corp. 6.75% 20181 | 14,755 | 15,733 | ||||||
| VPI Escrow Corp. 6.38%–7.50% 2020–20211 | 9,370 | 9,844 | ||||||
| VWR Funding, Inc. 7.25% 2017 | 10,770 | 11,295 | ||||||
| Other securities | 90,428 | |||||||
| 287,383 | ||||||||
| Industrials 12.76% | ||||||||
| Altegrity, Inc. 9.50% 20191 | 12,225 | 11,644 | ||||||
| Associated Materials, LLC and AMH New Finance, Inc. 9.125% 2017 | 25,580 | 21,231 | ||||||
| Builders Firstsource 7.625% 20211 | 10,600 | 10,891 | ||||||
| CEVA Group PLC 4.00%–9.00% 2018–20211 | 9,900 | 8,928 | ||||||
| CEVA Group PLC, LOC, 6.50% 20213,4,5 | 2,140 | 2,011 | ||||||
| CEVA Group PLC, Term Loan 6.50% 20213,4,5 | 5,716 | 5,372 | ||||||
| Euramax International, Inc. 9.50% 2016 | 10,390 | 9,715 | ||||||
| Ply Gem Industries, Inc. 6.50% 2022 | 16,450 | 15,525 | ||||||
| Ply Gem Industries, Inc. 6.50% 20221 | 4,800 | 4,488 | ||||||
| Other securities | 160,596 | |||||||
| 250,401 | ||||||||
| 102 | American Funds Insurance Series |
High-Income Bond Fund
| Bonds, notes & other debt instruments | Principal amount (000) | Value (000) | ||||||
| Consumer discretionary 12.52% | ||||||||
| Boyd Gaming Corp. 9.125% 2018 | $ | 9,190 | $ | 9,466 | ||||
| Boyd Gaming Corp. 9.00% 2020 | 11,000 | 11,316 | ||||||
| Cequel Communications Holdings I, LLC and Cequel Capital Corp. 6.375% 20201 | 13,400 | 13,936 | ||||||
| Charter Communications Operating, LLC and Charter Communications Operating Capital Corp. 5.50% 2022 | 12,625 | 12,846 | ||||||
| DISH DBS Corp. 4.25% 2018 | 18,675 | 19,119 | ||||||
| DISH DBS Corp. 5.13%–7.88% 2019–2020 | 6,950 | 7,108 | ||||||
| Warner Music Group 5.625% 20221 | 12,500 | 12,156 | ||||||
| Warner Music Group 6.75%–13.75% 2019–20221 | 8,725 | 8,277 | ||||||
| Other securities | 151,521 | |||||||
| 245,745 | ||||||||
| Energy 9.50% | ||||||||
| NGPL PipeCo LLC 7.119% 20171 | 6,715 | 6,631 | ||||||
| NGPL PipeCo LLC 9.625% 20191 | 16,825 | 16,951 | ||||||
| NGPL PipeCo LLC, Term Loan B, 6.75% 20173,4,5 | 1,786 | 1,728 | ||||||
| Peabody Energy Corp. 6.00% 2018 | 21,470 | 19,591 | ||||||
| Peabody Energy Corp. 6.25%–7.38% 2016–2021 | 6,670 | 5,806 | ||||||
| Other securities | 135,732 | |||||||
| 186,439 | ||||||||
| Materials 8.37% | ||||||||
| ArcelorMittal 7.25% 20413 | 9,960 | 10,109 | ||||||
| First Quantum Minerals Ltd. 6.75% 20201 | 16,543 | 15,054 | ||||||
| First Quantum Minerals Ltd. 7.00% 20211 | 17,343 | 15,695 | ||||||
| First Quantum Minerals Ltd. 7.25% 20221 | 1,275 | 1,151 | ||||||
| FMG Resources 6.00% 20171 | 25,865 | 24,814 | ||||||
| FMG Resources 6.88%–8.25% 2018–20191,4 | 5,966 | 5,431 | ||||||
| JMC Steel Group Inc. 8.25% 20181 | 17,250 | 16,452 | ||||||
| Reynolds Group Inc. 5.75% 2020 | 29,965 | 30,864 | ||||||
| Reynolds Group Inc. 7.13%–9.88% 2019 | 5,915 | 6,275 | ||||||
| Other securities | 38,338 | |||||||
| 164,183 | ||||||||
| Information technology 7.57% | ||||||||
| Alcatel-Lucent USA Inc. 4.625% 20171 | 9,650 | 9,795 | ||||||
| Alcatel-Lucent USA Inc. 6.75% 20201 | 5,880 | 6,236 | ||||||
| Alcatel-Lucent USA Inc. 8.875% 20201 | 10,090 | 11,023 | ||||||
| First Data Corp. 11.75% 2021 | 17,195 | 19,817 | ||||||
| First Data Corp. 12.625% 2021 | 10,804 | 12,857 | ||||||
| First Data Corp. 8.25%–8.75% 2021–20221,3,6 | 6,058 | 6,517 | ||||||
| Freescale Semiconductor, Inc. 5.00% 20211 | 9,000 | 9,045 | ||||||
| Freescale Semiconductor, Inc. 6.00% 20221 | 14,575 | 15,267 | ||||||
| Freescale Semiconductor, Inc., Term Loan B4, 4.25% 20203,4,5 | 5,433 | 5,311 | ||||||
| NXP BV and NXP Funding LLC 3.75% 20181 | 9,900 | 9,950 | ||||||
| SRA International, Inc. 11.00% 2019 | 7,835 | 8,364 | ||||||
| SRA International, Inc., Term Loan B, 6.50% 20183,4,5 | 16,913 | 16,934 | ||||||
| Other securities | 17,484 | |||||||
| 148,600 | ||||||||
| Financials 4.72% | ||||||||
| CIT Group Inc. 3.875% 2019 | 13,340 | 13,340 | ||||||
| CIT Group Inc. 4.25%–5.50% 2017–20191 | 11,875 | 12,383 | ||||||
| iStar Financial Inc. 4.00%–9.00% 2017–2019 | 22,180 | 21,950 | ||||||
| Realogy Corp. 4.50% 20191 | 9,950 | 9,900 | ||||||
| Other securities | 35,062 | |||||||
| 92,635 | ||||||||
| Other 1.27% | ||||||||
| Other securities | 24,848 | |||||||
| Total corporate bonds & notes | 1,695,103 | |||||||
| American Funds Insurance Series | 103 |
High-Income Bond Fund
| Bonds, notes & other debt instruments (continued) | Principal amount (000) | Value (000) | ||||||
| Other bonds & notes 2.70% | ||||||||
| Other securities | $ | 53,008 | ||||||
| Total bonds, notes & other debt instruments (cost: $1,826,064,000) | 1,748,111 | |||||||
| Convertible bonds 0.30% | ||||||||
| Other 0.30% | ||||||||
| Other securities | 5,888 | |||||||
| Total convertible bonds (cost: $7,127,000) | 5,888 | |||||||
| Convertible stocks 1.02% | Shares | |||||||
| Industrials 0.33% | ||||||||
| CEVA Group PLC, Series A-1, 3.253% convertible preferred7 | 4,788 | 4,788 | ||||||
| CEVA Group PLC, Series A-2, 2.253% convertible preferred7,8 | 2,211 | 1,714 | ||||||
| 6,502 | ||||||||
| Other 0.69% | ||||||||
| Other securities | 13,440 | |||||||
| Total convertible stocks (cost: $19,628,000) | 19,942 | |||||||
| Preferred securities 0.04% | ||||||||
| Financials 0.04% | ||||||||
| Other securities | 798 | |||||||
| Total preferred securities (cost: $751,000) | 798 | |||||||
| Common stocks 0.80% | ||||||||
| Industrials 0.22% | ||||||||
| CEVA Group PLC1,7,9 | 5,622 | 4,357 | ||||||
| Other securities | 13 | |||||||
| 4,370 | ||||||||
| Other 0.58% | ||||||||
| Other securities | 11,437 | |||||||
| Total common stocks (cost: $25,260,000) | 15,807 | |||||||
| Short-term securities 5.26% | Principal amount (000) | |||||||
| Abbott Laboratories 0.11% due 2/26/20151 | $ | 35,000 | 34,994 | |||||
| Chevron Corp. 0.12% due 3/11/20151 | 34,700 | 34,689 | ||||||
| General Electric Co. 0.10% due 1/2/2015 | 26,000 | 26,000 | ||||||
| Other securities | 7,499 | |||||||
| Total short-term securities (cost: $103,183,000) | 103,182 | |||||||
| Total investment securities 96.50% (cost: $1,982,013,000) | 1,893,728 | |||||||
| Other assets less liabilities 3.50% | 68,748 | |||||||
| Net assets 100.00% | $ | 1,962,476 | ||||||
This summary investment portfolio is designed to streamline the report and help investors better focus on the fund’s principal holdings. See the inside back cover for details on how to obtain a complete schedule of portfolio holdings.
“Other securities” includes all issues that are not disclosed separately in the summary investment portfolio.
| 104 | American Funds Insurance Series |
High-Income Bond Fund
Forward currency contracts
The fund has entered into forward currency contracts as shown in the following table. The average notional amount of open forward currency contracts was $8,536,000 over the prior 12-month period.
| Unrealized | |||||||||||||
| Contract amount | appreciation | ||||||||||||
| Receive | Deliver | at 12/31/2014 | |||||||||||
| Settlement date | Counterparty | (000) | (000) | (000) | |||||||||
| Sales: | |||||||||||||
| Euros | 1/12/2015 | Bank of New York Mellon | $6,840 | €5,500 | $ | 184 | |||||||
| Euros | 1/23/2015 | UBS AG | $1,088 | €875 | 29 | ||||||||
| South African rand | 1/16/2015 | HSBC Bank | $720 | ZAR8,100 | 21 | ||||||||
| $ | 234 | ||||||||||||
The following footnotes apply to either the individual securities noted or one or more of the securities aggregated and listed as a single line item.
| 1 | Acquired in a transaction exempt from registration under Rule 144A or Section 4(2) of the Securities Act of 1933. May be resold in the U.S. in transactions exempt from registration, normally to qualified institutional buyers. The total value of all such securities, including those in “Other securities,” was $797,716,000, which represented 40.65% of the net assets of the fund. |
| 2 | Scheduled interest and/or principal payment was not received. |
| 3 | Coupon rate may change periodically. |
| 4 | Principal payments may be made periodically. Therefore, the effective maturity date may be earlier than the stated maturity date. |
| 5 | Loan participations and assignments; may be subject to legal or contractual restrictions on resale. The total value of all such loans, including those in “Other securities,” was $137,417,000, which represented .07% of the net assets of the fund. |
| 6 | Payment in kind; the issuer has the option of paying additional securities in lieu of cash. |
| 7 | Valued under fair value procedures adopted by authority of the board of trustees. The total value of all such securities, including those in “Other securities,” was $24,973,000, which represented 1.27% of the net assets of the fund. |
| 8 | Acquired through a private placement transaction exempt from registration under the Securities Act of 1933. May be subject to legal or contractual restrictions on resale. Further details on these holdings appear below. |
| 9 | Security did not produce income during the last 12 months. |
| Percent | ||||||||||||||
| Acquisition | Cost | Value | of net | |||||||||||
| Private placement securities | dates | (000) | (000) | assets | ||||||||||
| CEVA Group PLC, Series A-2, 2.253% convertible preferred | 3/10/2010–1/23/2012 | $ | 2,214 | $ | 1,714 | .09 | % | |||||||
| Other private placement securities | 9/17/2009–7/24/2014 | 10,066 | 1,477 | .08 | ||||||||||
| Total private placement securities | $ | 12,280 | $ | 3,191 | .17 | % | ||||||||
Key to abbreviations and symbol
LOC = Letter of credit
€ = Euros
ZAR = South African rand
See Notes to Financial Statements
| American Funds Insurance Series | 105 |
Summary investment portfolio December 31, 2014
| Bonds, notes & other debt instruments 98.55% | Principal amount (000) | Value (000) | ||||||
| Mortgage-backed obligations 54.01% | ||||||||
| Federal agency mortgage-backed obligations 44.25% | ||||||||
| Fannie Mae 5.00% 20361 | $ | 540 | $ | 586 | ||||
| Fannie Mae 3.50% 20451,2 | 49,979 | 52,078 | ||||||
| Fannie Mae 3.50% 20451,2 | 5,000 | 5,196 | ||||||
| Fannie Mae 4.50% 20451,2 | 7,500 | 8,141 | ||||||
| Freddie Mac 5.00% 20341 | 3,267 | 3,608 | ||||||
| Freddie Mac 3.50% 20451,2 | 6,000 | 6,236 | ||||||
| Government National Mortgage Assn. 5.50% 20401 | 5,246 | 5,920 | ||||||
| Government National Mortgage Assn. 5.00% 20411 | 2,628 | 2,882 | ||||||
| Government National Mortgage Assn. 6.50% 20411 | 1,958 | 2,149 | ||||||
| Government National Mortgage Assn. 3.50% 20431 | 2,971 | 3,122 | ||||||
| Government National Mortgage Assn. 3.50% 20431 | 2,830 | 2,978 | ||||||
| Government National Mortgage Assn. 3.50% 20431 | 2,649 | 2,786 | ||||||
| Government National Mortgage Assn. 3.50% 20431 | 2,313 | 2,434 | ||||||
| Government National Mortgage Assn. 3.50% 20431 | 2,053 | 2,157 | ||||||
| Government National Mortgage Assn. 4.00% 20441 | 14,615 | 15,703 | ||||||
| Government National Mortgage Assn. 4.00% 20441 | 10,000 | 10,740 | ||||||
| Government National Mortgage Assn. 4.00% 20441 | 2,562 | 2,749 | ||||||
| Government National Mortgage Assn. 4.25% 20441 | 2,366 | 2,569 | ||||||
| Government National Mortgage Assn. 3.50%–6.00% 2034–20441 | 12,069 | 12,705 | ||||||
| Vendee Mortgage Trust, Series 2011-2, Class V, 3.75% 20281 | 5,596 | 5,822 | ||||||
| Vendee Mortgage Trust, Series 2010-1, Class DA, 4.25% 20351 | 1,548 | 1,654 | ||||||
| Other securities | 354 | |||||||
| 152,569 | ||||||||
| Commercial mortgage-backed securities 9.76% | ||||||||
| CS First Boston Mortgage Securities Corp., Series 2006-C4, Class A1A, 5.46% 20391 | 4,766 | 5,027 | ||||||
| J.P. Morgan Chase Commercial Mortgage Securities Corp., Series 2007-LDPX, Class A-1-A, 5.439% 20491 | 4,699 | 5,029 | ||||||
| LB Commercial Mortgage Trust, Series 2007-C3, Class A-1-A, multifamily 5.858% 20441,3 | 2,757 | 3,007 | ||||||
| Merrill Lynch Mortgage Trust, Series 2006-C2, Class A1A, 5.739% 20431,3 | 1,898 | 2,009 | ||||||
| Other securities | 18,577 | |||||||
| 33,649 | ||||||||
| Total mortgage-backed obligations | 186,218 | |||||||
| U.S. Treasury bonds & notes 21.56% | ||||||||
| U.S. Treasury inflation-protected securities 11.40% | ||||||||
| U.S. Treasury Inflation-Protected Security 1.875% 20154 | 1,312 | 1,316 | ||||||
| U.S. Treasury Inflation-Protected Security 0.125% 20164 | 2,689 | 2,682 | ||||||
| U.S. Treasury Inflation-Protected Security 2.00% 20164 | 2,991 | 3,036 | ||||||
| U.S. Treasury Inflation-Protected Security 0.125% 20194 | 9,120 | 9,039 | ||||||
| U.S. Treasury Inflation-Protected Security 0.125% 20244 | 10,350 | 10,015 | ||||||
| U.S. Treasury Inflation-Protected Security 1.375% 20444 | 11,576 | 13,231 | ||||||
| 39,319 | ||||||||
| U.S. Treasury 10.16% | ||||||||
| U.S. Treasury 1.50% 2019 | 5,000 | 4,968 | ||||||
| U.S. Treasury 1.50% 2019 | 1,500 | 1,491 | ||||||
| U.S. Treasury 1.625% 20195 | 24,000 | 24,064 | ||||||
| U.S. Treasury 1.625% 2019 | 2,000 | 2,002 | ||||||
| U.S. Treasury 1.75% 2019 | 2,500 | 2,514 | ||||||
| 35,039 | ||||||||
| Total U.S. Treasury bonds & notes | 74,358 | |||||||
| Federal agency bonds & notes 17.17% | ||||||||
| Fannie Mae 1.75% 2019 | 21,900 | 21,957 | ||||||
| Federal Home Loan Bank 0.50% 2016 | 13,285 | 13,257 | ||||||
| Federal Home Loan Bank 2.00% 2016 | 2,215 | 2,265 | ||||||
| Freddie Mac 0.875% 2017 | 8,200 | 8,223 | ||||||
| 106 | American Funds Insurance Series |
Mortgage Fund
| Bonds, notes & other debt instruments | Principal amount (000) | Value (000) | ||||||
| Freddie Mac, Series K031, Class A2, multifamily 3.30% 20231,3 | $ | 4,722 | $ | 4,969 | ||||
| Freddie Mac, Series K032, Class A2, multifamily 3.31% 20231,3 | 1,250 | 1,316 | ||||||
| United States Agency for International Development, Jordan (Kingdom of) 2.503% 2020 | 7,000 | 7,210 | ||||||
| 59,197 | ||||||||
| Asset-backed obligations 5.81% | ||||||||
| AmeriCredit Automobile Receivables Trust, Series 2013-4, Class B, 1.66% 20181 | 2,000 | 2,011 | ||||||
| Flagstar Home Equity Loan Trust, Series 2006-2A, Class A, FSA insured, 0.315% 20191,3,6 | 2,882 | 2,803 | ||||||
| Santander Drive Auto Receivables Trust, Series 2012-2, Class C, 3.20% 20151 | 2,000 | 2,022 | ||||||
| Santander Drive Auto Receivables Trust, Series 2012-4, Class C, 2.94% 20161 | 3,250 | 3,295 | ||||||
| Santander Drive Auto Receivables Trust, Series 2013-5, Class B, 1.55% 20181 | 2,285 | 2,293 | ||||||
| Santander Drive Auto Receivables Trust, Series 2013-1, Class B, 1.16% 20191 | 4,124 | 4,137 | ||||||
| Other securities | 3,484 | |||||||
| 20,045 | ||||||||
| Total bonds, notes & other debt instruments (cost: $335,972,000) | 339,818 | |||||||
| Short-term securities 21.69% | ||||||||
| ExxonMobil Corp. 0.08% due 1/22/2015 | 7,200 | 7,199 | ||||||
| Fannie Mae 0.08%–0.10% due 3/2/2015–5/18/2015 | 15,100 | 15,096 | ||||||
| Federal Farm Credit Banks 0.14% due 7/15/2015 | 5,000 | 4,996 | ||||||
| Federal Home Loan Bank 0.07%–0.12% due 2/11/2015–3/13/2015 | 28,000 | 27,999 | ||||||
| General Electric Co. 0.10% due 1/2/2015 | 8,400 | 8,400 | ||||||
| John Deere Financial Ltd. 0.10% due 1/12/20156 | 3,100 | 3,100 | ||||||
| National Rural Utilities Cooperative Finance Corp. 0.11% due 1/16/2015 | 8,000 | 8,000 | ||||||
| Total short-term securities (cost: $74,786,000) | 74,790 | |||||||
| Total investment securities 120.24% (cost: $410,758,000) | 414,608 | |||||||
| Other assets less liabilities (20.24)% | (69,800 | ) | ||||||
| Net assets 100.00% | $ | 344,808 | ||||||
This summary investment portfolio is designed to streamline the report and help investors better focus on the fund’s principal holdings. See the inside back cover for details on how to obtain a complete schedule of portfolio holdings.
“Other securities” includes all issues that are not disclosed separately in the summary investment portfolio.
| American Funds Insurance Series | 107 |
Mortgage Fund
Interest rate swaps
The fund has entered into interest rate swaps as shown in the following table. The average notional amount of interest rate swaps was $99,650,000 over the prior 12-month period.
| Unrealized | ||||||||||||||||
| appreciation | ||||||||||||||||
| Notional | (depreciation) | |||||||||||||||
| Pay/receive | Floating rate | Fixed | Expiration | amount | at 12/31/2014 | |||||||||||
| fixed rate | Clearinghouse | index | rate | date | (000) | (000) | ||||||||||
| Pay | LCH.Clearnet | 3-month USD-LIBOR | 0.6425 | % | 10/30/2016 | $ | 60,000 | $ | 182 | |||||||
| Pay | LCH.Clearnet | 3-month USD-LIBOR | 1.139 | 11/6/2017 | 27,600 | 75 | ||||||||||
| Pay | LCH.Clearnet | 3-month USD-LIBOR | 1.039 | 11/26/2017 | 800 | 5 | ||||||||||
| Receive | LCH.Clearnet | 3-month USD-LIBOR | 1.789 | 6/20/2019 | 6,150 | 33 | ||||||||||
| Receive | LCH.Clearnet | 3-month USD-LIBOR | 1.7945 | 6/20/2019 | 3,800 | 22 | ||||||||||
| Receive | LCH.Clearnet | 3-month USD-LIBOR | 1.7905 | 6/20/2019 | 1,550 | 9 | ||||||||||
| Receive | LCH.Clearnet | 3-month USD-LIBOR | 1.732 | 6/27/2019 | 8,500 | 24 | ||||||||||
| Receive | LCH.Clearnet | 3-month USD-LIBOR | 1.821 | 7/31/2019 | 8,000 | 49 | ||||||||||
| Receive | LCH.Clearnet | 3-month USD-LIBOR | 1.799 | 8/8/2019 | 8,000 | 39 | ||||||||||
| Receive | LCH.Clearnet | 3-month USD-LIBOR | 1.7255 | 8/19/2019 | 15,000 | 20 | ||||||||||
| Receive | LCH.Clearnet | 3-month USD-LIBOR | 1.9225 | 9/25/2019 | 15,000 | 142 | ||||||||||
| Receive | LCH.Clearnet | 3-month USD-LIBOR | 1.675 | 10/30/2019 | 67,500 | (173 | ) | |||||||||
| Receive | LCH.Clearnet | 3-month USD-LIBOR | 1.6625 | 12/18/2019 | 3,500 | (16 | ) | |||||||||
| Receive | LCH.Clearnet | 3-month USD-LIBOR | 2.898 | 9/23/2023 | 5,000 | 286 | ||||||||||
| Pay | LCH.Clearnet | 3-month USD-LIBOR | 2.421 | 10/30/2024 | 3,000 | (42 | ) | |||||||||
| Pay | LCH.Clearnet | 3-month USD-LIBOR | 2.199 | 12/18/2024 | 3,500 | 25 | ||||||||||
| Pay | LCH.Clearnet | 3-month USD-LIBOR | 3.34 | 6/27/2044 | 3,500 | (479 | ) | |||||||||
| Pay | LCH.Clearnet | 3-month USD-LIBOR | 3.206 | 7/31/2044 | 2,000 | (218 | ) | |||||||||
| Pay | LCH.Clearnet | 3-month USD-LIBOR | 3.238 | 8/8/2044 | 2,000 | (231 | ) | |||||||||
| Pay | LCH.Clearnet | 3-month USD-LIBOR | 3.2265 | 9/25/2044 | 3,000 | (339 | ) | |||||||||
| Pay | LCH.Clearnet | 3-month USD-LIBOR | 3.035 | 10/30/2044 | 3,000 | (218 | ) | |||||||||
| $ | (805 | ) | ||||||||||||||
The following footnotes apply to either the individual securities noted or one or more of the securities aggregated and listed as a single line item.
| 1 | Principal payments may be made periodically. Therefore, the effective maturity date may be earlier than the stated maturity date. |
| 2 | A portion or all of the security purchased on a TBA basis. |
| 3 | Coupon rate may change periodically. |
| 4 | Index-linked bond whose principal amount moves with a government price index. |
| 5 | A portion of this security was pledged as collateral. The total value of pledged collateral was $2,638,000, which represented .77% of the net assets of the fund. |
| 6 | Acquired in a transaction exempt from registration under Rule 144A or Section 4(2) of the Securities Act of 1933. May be resold in the U.S. in transactions exempt from registration, normally to qualified institutional buyers. The total value of all such securities, including those in “Other securities,” was $9,559,000, which represented 2.77% of the net assets of the fund. |
Key to abbreviation
TBA = To be announced
See Notes to Financial Statements
| 108 | American Funds Insurance Series |
U.S. Government/AAA-Rated Securities Fund
Summary investment portfolio December 31, 2014
| Bonds, notes & other debt instruments 91.37% | Principal amount (000) | Value (000) | ||||||
| U.S. Treasury bonds & notes 50.26% | ||||||||
| U.S. Treasury 38.55% | ||||||||
| U.S. Treasury 1.50% 20161 | $ | 42,150 | $ | 42,792 | ||||
| U.S. Treasury 0.625% 2017 | 26,000 | 25,749 | ||||||
| U.S. Treasury 0.75% 2017 | 25,750 | 25,653 | ||||||
| U.S. Treasury 0.875% 2017 | 44,400 | 44,459 | ||||||
| U.S. Treasury 2.75% 2017 | 24,000 | 25,094 | ||||||
| U.S. Treasury 1.25% 2018 | 32,425 | 32,217 | ||||||
| U.S. Treasury 1.25% 2018 | 25,975 | 25,786 | ||||||
| U.S. Treasury 1.375% 2018 | 64,000 | 64,065 | ||||||
| U.S. Treasury 1.50% 2018 | 25,700 | 25,823 | ||||||
| U.S. Treasury 1.50% 2019 | 43,775 | 43,496 | ||||||
| U.S. Treasury 1.50% 2019 | 25,775 | 25,789 | ||||||
| U.S. Treasury 1.50% 2019 | 25,330 | 25,273 | ||||||
| U.S. Treasury 1.625% 2019 | 144,450 | 144,834 | ||||||
| U.S. Treasury 1.625% 2019 | 140,000 | 140,230 | ||||||
| U.S. Treasury 1.625% 2019 | 25,825 | 25,852 | ||||||
| U.S. Treasury 3.625% 2019 | 56,500 | 61,638 | ||||||
| U.S. Treasury 2.25% 2021 | 103,575 | 105,748 | ||||||
| U.S. Treasury 1.625% 2022 | 46,698 | 45,288 | ||||||
| U.S. Treasury 1.625% 2022 | 41,728 | 40,568 | ||||||
| U.S. Treasury 1.75% 2022 | 63,000 | 61,935 | ||||||
| U.S. Treasury 2.75% 2023 | 52,000 | 54,722 | ||||||
| U.S. Treasury 1.00%–6.25% 2016–2044 | 246,209 | 252,146 | ||||||
| 1,339,157 | ||||||||
| U.S. Treasury inflation-protected securities 11.71% | ||||||||
| U.S. Treasury Inflation-Protected Security 0.125% 20192 | 44,538 | 44,138 | ||||||
| U.S. Treasury Inflation-Protected Security 0.125% 20242 | 75,002 | 72,574 | ||||||
| U.S. Treasury Inflation-Protected Security 0.625% 20242 | 72,228 | 72,881 | ||||||
| U.S. Treasury Inflation-Protected Security 1.375% 20442 | 120,064 | 137,228 | ||||||
| U.S. Treasury Inflation-Protected Security 0.13%–2.00% 2015–20432 | 80,699 | 79,996 | ||||||
| 406,817 | ||||||||
| Total U.S. Treasury bonds & notes | 1,745,974 | |||||||
| Mortgage-backed obligations 23.51% | ||||||||
| Federal agency mortgage-backed obligations 23.51% | ||||||||
| Fannie Mae 3.50% 20453,4 | 114,850 | 119,674 | ||||||
| Fannie Mae 4.50% 20453,4 | 118,880 | 128,810 | ||||||
| Fannie Mae 4.50% 20453,4 | 73,420 | 79,691 | ||||||
| Fannie Mae 0%–10.01% 2017–20453,4,5 | 76,121 | 81,943 | ||||||
| Freddie Mac 4.00% 20443 | 36,092 | 38,749 | ||||||
| Freddie Mac 4.50% 20453,4 | 30,000 | 32,514 | ||||||
| Freddie Mac 0%–6.00% 2016–20453,4,5 | 71,794 | 77,075 | ||||||
| Government National Mortgage Assn. 4.00% 20443 | 60,673 | 65,109 | ||||||
| Government National Mortgage Assn. 4.00% 20443 | 40,419 | 43,412 | ||||||
| Government National Mortgage Assn. 4.50% 20453,4 | 24,500 | 26,769 | ||||||
| Government National Mortgage Assn. 3.00%–6.50% 2026–20583,5 | 73,127 | 79,611 | ||||||
| Vendee Mortgage Trust 3.75%–4.25% 2033–20353 | 38,158 | 40,344 | ||||||
| Other securities | 2,857 | |||||||
| 816,558 | ||||||||
| Federal agency bonds & notes 17.60% | ||||||||
| Fannie Mae 0.48%–7.13% 2015–20303,5 | 46,220 | 49,395 | ||||||
| Federal Farm Credit Banks 0.60% 2017 | 41,774 | 41,491 | ||||||
| Federal Farm Credit Banks 0.21%–0.22% 20175 | 13,621 | 13,624 | ||||||
| Federal Home Loan Bank 0.375% 2015 | 34,750 | 34,776 | ||||||
| Federal Home Loan Bank, Series 2816, 1.00% 2017 | 56,095 | 56,164 | ||||||
| Federal Home Loan Bank 1.75% 2018 | 38,000 | 38,326 | ||||||
| Federal Home Loan Bank 0.38%–5.50% 2015–2036 | 60,390 | 62,104 | ||||||
| Freddie Mac 0.54%–3.75% 2015–20243,5 | 94,713 | 96,230 | ||||||
| American Funds Insurance Series | 109 |
U.S. Government/AAA-Rated Securities Fund
| Bonds, notes & other debt instruments (continued) | Principal amount (000) | Value (000) | ||||||
| Federal agency bonds & notes (continued) | ||||||||
| Tennessee Valley Authority, Series A, 3.875% 2021 | $ | 32,975 | $ | 36,244 | ||||
| Tennessee Valley Authority 1.88%–5.88% 2022–2060 | 27,450 | 30,016 | ||||||
| TVA Southaven 3.846% 20333 | 1,692 | 1,799 | ||||||
| United States Agency for International Development, Jordan (Kingdom of) 1.945% 2019 | 22,750 | 23,054 | ||||||
| United States Agency for International Development, Jordan (Kingdom of) 2.503% 2020 | 88,000 | 90,640 | ||||||
| United States Agency for International Development, Ukraine, 1.844% 2019 | 1,445 | 1,458 | ||||||
| Other securities | 36,187 | |||||||
| 611,508 | ||||||||
| Total bonds, notes & other debt instruments (cost: $3,125,272,000) | 3,174,040 | |||||||
| Short-term securities 20.46% | ||||||||
| Abbott Laboratories 0.11% due 1/22/2015–3/2/20156 | 50,000 | 49,994 | ||||||
| Chevron Corp. 0.12%–0.14% due 3/11/2015–4/14/20156 | 75,000 | 74,968 | ||||||
| Coca-Cola Co. 0.11%–0.18% due 2/20/2015–5/8/20156 | 95,000 | 94,963 | ||||||
| Emerson Electric Co. 0.10%–0.11% due 1/28/2015–3/4/20156 | 55,400 | 55,391 | ||||||
| ExxonMobil Corp. 0.08%–0.10% due 1/22/2015–2/10/2015 | 51,000 | 50,994 | ||||||
| Federal Farm Credit Banks 0.10%–0.14% due 1/28/2015–7/15/2015 | 47,750 | 47,732 | ||||||
| General Electric Co. 0.10% due 1/2/2015 | 27,400 | 27,400 | ||||||
| Harvard University 0.11% due 1/16/2015 | 30,198 | 30,197 | ||||||
| John Deere Capital Corp. 0.10% due 1/14/20156 | 50,000 | 49,997 | ||||||
| John Deere Financial Ltd. 0.09%–0.10% due 1/7/2015–1/14/20156 | 36,400 | 36,399 | ||||||
| Procter & Gamble Co. 0.08%–0.15% due 1/7/2015–2/9/20156 | 69,800 | 69,796 | ||||||
| Regents of the University of California 0.12% due 2/13/2015 | 40,000 | 39,995 | ||||||
| Other securities | 82,893 | |||||||
| Total short-term securities (cost: $710,730,000) | 710,719 | |||||||
| Total investment securities 111.83% (cost: $3,836,002,000) | 3,884,759 | |||||||
| Other assets less liabilities (11.83)% | (410,946 | ) | ||||||
| Net assets 100.00% | $ | 3,473,813 | ||||||
This summary investment portfolio is designed to streamline the report and help investors better focus on the fund’s principal holdings. See the inside back cover for details on how to obtain a complete schedule of portfolio holdings.
“Other securities” includes all issues that are not disclosed separately in the summary investment portfolio.
Interest rate swaps
The fund has entered into interest rate swaps as shown in the following table. The average notional amount of interest rate swaps was $782,986,000 over the prior 12-month period.
| Unrealized | |||||||||||||||
| appreciation | |||||||||||||||
| Notional | (depreciation) | ||||||||||||||
| Pay/receive | Floating rate | Fixed | Expiration | amount | at 12/31/2014 | ||||||||||
| fixed rate | Clearinghouse | index | rate | date | (000) | (000) | |||||||||
| Receive | LCH.Clearnet | 3-month USD-LIBOR | 0.4975 | % | 1/8/2016 | $ | 25,000 | $ | 14 | ||||||
| Pay | LCH.Clearnet | 3-month USD-LIBOR | 0.796 | 9/24/2016 | 40,000 | (20 | ) | ||||||||
| Pay | LCH.Clearnet | 3-month USD-LIBOR | 0.7875 | 9/29/2016 | 56,400 | (14 | ) | ||||||||
| Pay | LCH.Clearnet | 3-month USD-LIBOR | 0.644 | 10/27/2016 | 16,000 | 47 | |||||||||
| Pay | LCH.Clearnet | 3-month USD-LIBOR | 0.6365 | 10/29/2016 | 21,250 | 67 | |||||||||
| Pay | LCH.Clearnet | 3-month USD-LIBOR | 1.32125 | 1/8/2018 | 15,000 | (11 | ) | ||||||||
| Pay | LCH.Clearnet | 3-month USD-LIBOR | 1.314 | 5/20/2018 | 20,000 | 64 | |||||||||
| Pay | LCH.Clearnet | 3-month USD-LIBOR | 1.49 | 11/29/2018 | 25,000 | 53 | |||||||||
| Receive | LCH.Clearnet | 3-month USD-LIBOR | 1.789 | 6/20/2019 | 138,700 | 754 | |||||||||
| 110 | American Funds Insurance Series |
U.S. Government/AAA-Rated Securities Fund
| Unrealized | ||||||||||||||||
| appreciation | ||||||||||||||||
| Notional | (depreciation) | |||||||||||||||
| Pay/receive | Floating rate | Fixed | Expiration | amount | at 12/31/2014 | |||||||||||
| fixed rate | Clearinghouse | index | rate | date | (000) | (000) | ||||||||||
| Receive | LCH.Clearnet | 3-month USD-LIBOR | 1.7945 | % | 6/20/2019 | $ | 86,600 | $ | 492 | |||||||
| Receive | LCH.Clearnet | 3-month USD-LIBOR | 1.7905 | 6/20/2019 | 34,700 | 191 | ||||||||||
| Receive | LCH.Clearnet | 3-month USD-LIBOR | 1.8065 | 7/29/2019 | 70,000 | 381 | ||||||||||
| Receive | LCH.Clearnet | 3-month USD-LIBOR | 1.821 | 7/31/2019 | 64,000 | 392 | ||||||||||
| Receive | LCH.Clearnet | 3-month USD-LIBOR | 1.799 | 8/8/2019 | 64,000 | 312 | ||||||||||
| Receive | LCH.Clearnet | 3-month USD-LIBOR | 1.7725 | 8/11/2019 | 133,000 | 476 | ||||||||||
| Receive | LCH.Clearnet | 3-month USD-LIBOR | 1.773 | 8/11/2019 | 127,000 | 457 | ||||||||||
| Receive | LCH.Clearnet | 3-month USD-LIBOR | 1.956 | 9/24/2019 | 15,000 | 166 | ||||||||||
| Receive | LCH.Clearnet | 3-month USD-LIBOR | 1.9225 | 9/25/2019 | 52,000 | 494 | ||||||||||
| Receive | LCH.Clearnet | 3-month USD-LIBOR | 1.925 | 9/29/2019 | 40,000 | 373 | ||||||||||
| Receive | LCH.Clearnet | 3-month USD-LIBOR | 1.664 | 10/27/2019 | 20,000 | (63 | ) | |||||||||
| Receive | LCH.Clearnet | 3-month USD-LIBOR | 1.649 | 10/29/2019 | 25,000 | (95 | ) | |||||||||
| Receive | LCH.Clearnet | 3-month USD-LIBOR | 1.7725 | 11/14/2019 | 75,004 | 116 | ||||||||||
| Receive | LCH.Clearnet | 3-month USD-LIBOR | 1.77 | 11/14/2019 | 69,996 | 100 | ||||||||||
| Receive | LCH.Clearnet | 3-month USD-LIBOR | 1.785 | 1/2/2020 | 48,000 | 47 | ||||||||||
| Pay | LCH.Clearnet | 3-month USD-LIBOR | 2.33565 | 4/11/2021 | 35,000 | (801 | ) | |||||||||
| Pay | LCH.Clearnet | 3-month USD-LIBOR | 2.74125 | 11/22/2023 | 15,000 | (664 | ) | |||||||||
| Pay | LCH.Clearnet | 3-month USD-LIBOR | 2.5315 | 9/8/2024 | 6,400 | (154 | ) | |||||||||
| Pay | LCH.Clearnet | 3-month USD-LIBOR | 2.645 | 9/29/2024 | 10,250 | (348 | ) | |||||||||
| Pay | LCH.Clearnet | 3-month USD-LIBOR | 2.415 | 10/27/2024 | 8,000 | (105 | ) | |||||||||
| Pay | LCH.Clearnet | 3-month USD-LIBOR | 2.526 | 11/10/2024 | 14,850 | (341 | ) | |||||||||
| Pay | LCH.Clearnet | 3-month USD-LIBOR | 3.34 | 6/27/2044 | 45,000 | (6,161 | ) | |||||||||
| Pay | LCH.Clearnet | 3-month USD-LIBOR | 3.206 | 7/31/2044 | 16,000 | (1,743 | ) | |||||||||
| Pay | LCH.Clearnet | 3-month USD-LIBOR | 3.238 | 8/8/2044 | 16,000 | (1,846 | ) | |||||||||
| Pay | LCH.Clearnet | 3-month USD-LIBOR | 3.014 | 10/29/2044 | 3,750 | (255 | ) | |||||||||
| Pay | LCH.Clearnet | 3-month USD-LIBOR | 2.7045 | 1/2/2045 | 12,000 | (12 | ) | |||||||||
| $ | (7,637 | ) | ||||||||||||||
The following footnotes apply to either the individual securities noted or one or more of the securities aggregated and listed as a single line item.
| 1 | A portion of this security was pledged as collateral. The total value of pledged collateral was $20,696,000, which represented .60% of the net assets of the fund. |
| 2 | Index-linked bond whose principal amount moves with a government price index. |
| 3 | Principal payments may be made periodically. Therefore, the effective maturity date may be earlier than the stated maturity date. |
| 4 | A portion or all of the security purchased on a TBA basis. |
| 5 | Coupon rate may change periodically. |
| 6 | Acquired in a transaction exempt from registration under Rule 144A or Section 4(2) of the Securities Act of 1933. May be resold in the U.S. in transactions exempt from registration, normally to qualified institutional buyers. The total value of all such securities, including those in “Other securities,” was $463,583,000, which represented 13.35% of the net assets of the fund. |
Key to abbreviation
TBA = To be announced
See Notes to Financial Statements
| American Funds Insurance Series | 111 |
Investment portfolio December 31, 2014
| Short-term securities 98.79% | Principal amount (000) | Value (000) | ||||||
| Federal agency discount notes 48.70% | ||||||||
| Fannie Mae 0.03%–0.09% due 1/2/2015–5/18/2015 | $ | 58,660 | $ | 58,653 | ||||
| Federal Home Loan Bank 0.05%–0.11% due 1/14/2015–3/25/2015 | 68,650 | 68,649 | ||||||
| Freddie Mac 0.05%–0.10% due 1/20/2015–5/8/2015 | 52,315 | 52,308 | ||||||
| International Bank for Reconstruction and Development 0.07% due 1/26/2015 | 5,000 | 5,000 | ||||||
| Tennessee Valley Authority 0.06% due 1/6/2015 | 7,800 | 7,800 | ||||||
| 192,410 | ||||||||
| U.S. Treasury bonds & notes 33.28% | ||||||||
| U.S. Treasury Bills 0.02%–0.06% due 1/2/2015–5/14/2015 | 131,500 | 131,497 | ||||||
| Commercial paper 16.81% | ||||||||
| CAFCO, LLC 0.12% due 1/16/2015 | 10,000 | 9,999 | ||||||
| Emerson Electric Co. 0.16% due 3/2/20151 | 5,000 | 4,999 | ||||||
| Gotham Funding Corp. 0.15% due 1/16/20151 | 10,000 | 9,999 | ||||||
| John Deere Capital Corp. 0.12% due 2/12/20151 | 10,600 | 10,598 | ||||||
| KfW 0.11% due 1/16/20151 | 7,000 | 7,000 | ||||||
| Regents of the University of California 0.12% due 2/23/2015 | 10,000 | 9,998 | ||||||
| Sumitomo Mitsui Banking Corp. 0.16% due 1/6/20151 | 13,800 | 13,800 | ||||||
| 66,393 | ||||||||
| Total short-term securities (cost: $390,286,000) | 390,300 | |||||||
| Bonds, notes & other debt instruments 1.27% | ||||||||
| U.S. Treasury bonds & notes 1.27% | ||||||||
| U.S. Treasury 0.093% 20162 | 5,000 | 4,997 | ||||||
| Total bonds, notes & other debt instruments (cost: $4,995,000) | 4,997 | |||||||
| Total investment securities 100.06% (cost: $395,281,000) | 395,297 | |||||||
| Other assets less liabilities (0.06)% | (232 | ) | ||||||
| Net assets 100.00% | $ | 395,065 | ||||||
| 1 | Acquired in a transaction exempt from registration under Section 4(2) of the Securities Act of 1933. May be resold in the U.S. in transactions exempt from registration, normally to qualified institutional buyers. The total value of all such securities was $46,396,000, which represented 11.74% of the net assets of the fund. |
| 2 | Coupon rate may change periodically. |
See Notes to Financial Statements
| 112 | American Funds Insurance Series |
Investment portfolio December 31, 2014
| Growth funds 93.58% | Shares | Value (000) | ||||||
| American Funds Insurance Series – Growth Fund, Class 1 | 925,445 | $ | 74,175 | |||||
| Total growth funds (cost: $72,153,000) | 74,175 | |||||||
| Short-term securities 4.56% | ||||||||
| Government Cash Management Fund | 3,614,218 | 3,614 | ||||||
| Total short-term securities (cost: $3,615,000) | 3,614 | |||||||
| Total investment securities 98.14% (cost: $75,768,000) | 77,789 | |||||||
| Other assets less liabilities 1.86% | 1,475 | |||||||
| Net assets 100.00% | $ | 79,264 | ||||||
Futures contracts
The fund has entered into futures contracts as shown in the following table. The average month-end notional amount of open futures contracts while held was $8,706,000 over the prior 12-month period.
| Unrealized | ||||||||||||||
| (depreciation) | ||||||||||||||
| Notional | appreciation | |||||||||||||
| Number of | amount | at 12/31/2014 | ||||||||||||
| Clearinghouse | contracts | Expiration | (000) | (000) | ||||||||||
| S&P 500 E-mini Index Contracts | CME Exchange | 95 | March 2015 | $ | 9,472 | $ | (277 | ) | ||||||
| Russell 2000 Mini Index Contracts | ICE Exchange | 20 | March 2015 | 2,295 | (106 | ) | ||||||||
| Euro Stoxx 50 Index Contracts | Eurex Exchange | 21 | March 2015 | 770 | (21 | ) | ||||||||
| S&P Mid 400 E-mini Index Contracts | CME Exchange | 5 | March 2015 | 695 | (29 | ) | ||||||||
| Euro Currency Contracts | CME Exchange | 4 | March 2015 | 622 | 16 | |||||||||
| FTSE 100 Index Contracts | LIFFE Exchange | 5 | March 2015 | 485 | (20 | ) | ||||||||
| British Pound Currency Contracts | CME Exchange | 4 | March 2015 | 392 | 3 | |||||||||
| Japanese Yen Currency Contracts | CME Exchange | 3 | March 2015 | 317 | 3 | |||||||||
| Nikkei 225 (OSE) Index Contracts | OSE Exchange | 2 | March 2015 | 289 | 1 | |||||||||
| Mini MSCI Emerging Markets Index Contracts | ICE Exchange | 4 | March 2015 | 183 | (8 | ) | ||||||||
| $ | (438 | ) | ||||||||||||
Investment in affiliates
This holding is an affiliate of the fund under the Investment Company Act of 1940 since it is controlled by the same board of trustees as the series. Further details on this holding and related transactions during the year ended December 31, 2014, appear below.
| Value of | ||||||||||||||||||||||||
| Dividend | affiliate at | |||||||||||||||||||||||
| Beginning | Ending | income | 12/31/2014 | |||||||||||||||||||||
| shares | Additions | Reductions | shares | (000) | (000) | |||||||||||||||||||
| American Funds Insurance Series – Growth Fund, Class 1 | 335,489 | 728,347 | 138,391 | 925,445 | $ | 901 | $ | 74,175 | ||||||||||||||||
See Notes to Financial Statements
| American Funds Insurance Series | 113 |
Managed Risk International Fund
Investment portfolio December 31, 2014
| Growth funds 94.05% | Shares | Value (000) | ||||||
| American Funds Insurance Series – International Fund, Class 1 | 2,130,911 | $ | 43,365 | |||||
| Total growth funds (cost: $44,843,000) | 43,365 | |||||||
| Short-term securities 4.63% | ||||||||
| Government Cash Management Fund | 2,134,483 | 2,134 | ||||||
| Total short-term securities (cost: $2,134,000) | 2,134 | |||||||
| Total investment securities 98.68% (cost: $46,977,000) | 45,499 | |||||||
| Other assets less liabilities 1.32% | 608 | |||||||
| Net assets 100.00% | $ | 46,107 | ||||||
Futures contracts
The fund has entered into futures contracts as shown in the following table. The average month-end notional amount of open futures contracts while held was $6,286,000 over the prior 12-month period.
| Unrealized | ||||||||||||||
| (depreciation) | ||||||||||||||
| Notional | appreciation | |||||||||||||
| Number of | amount | at 12/31/2014 | ||||||||||||
| Clearinghouse | contracts | Expiration | (000) | (000) | ||||||||||
| Euro Stoxx 50 Index Contracts | Eurex Exchange | 78 | March 2015 | $ | 2,844 | $ | (94 | ) | ||||||
| Euro Currency Contracts | CME Exchange | 13 | March 2015 | 2,017 | 49 | |||||||||
| Mini MSCI Emerging Markets Index Contracts | ICE Exchange | 28 | March 2015 | 1,282 | (58 | ) | ||||||||
| FTSE 100 Index Contracts | LIFFE Exchange | 8 | March 2015 | 779 | (30 | ) | ||||||||
| Nikkei 225 (OSE) Index Contracts | OSE Exchange | 5 | March 2015 | 711 | (9 | ) | ||||||||
| British Pound Currency Contracts | CME Exchange | 5 | March 2015 | 488 | 2 | |||||||||
| Japanese Yen Currency Contracts | CME Exchange | 4 | March 2015 | 427 | 9 | |||||||||
| Russell 2000 Mini Index Contracts | ICE Exchange | 3 | March 2015 | 342 | (18 | ) | ||||||||
| $ | (149 | ) | ||||||||||||
Investment in affiliates
This holding is an affiliate of the fund under the Investment Company Act of 1940 since it is controlled by the same board of trustees as the series. Further details on this holding and related transactions during the year ended December 31, 2014, appear below.
| Value of | ||||||||||||||||||||||||
| Dividend | affiliate at | |||||||||||||||||||||||
| Beginning | Ending | income | 12/31/2014 | |||||||||||||||||||||
| shares | Additions | Reductions | shares | (000) | (000) | |||||||||||||||||||
| American Funds Insurance Series – International Fund, Class 1 | 741,709 | 1,700,837 | 311,635 | 2,130,911 | $ | 700 | $ | 43,365 | ||||||||||||||||
See Notes to Financial Statements
| 114 | American Funds Insurance Series |
Managed Risk Blue Chip Income and Growth Fund
Investment portfolio December 31, 2014
| Growth-and-income funds 93.20% | Shares | Value (000) | ||||||
| American Funds Insurance Series – Blue Chip Income and Growth Fund, Class 1 | 6,224,439 | $ | 91,437 | |||||
| Total growth-and-income funds (cost: $87,162,000) | 91,437 | |||||||
| Short-term securities 5.54% | ||||||||
| Government Cash Management Fund | 5,435,970 | 5,436 | ||||||
| Total short-term securities (cost: $5,436,000) | 5,436 | |||||||
| Total investment securities 98.74% (cost: $92,598,000) | 96,873 | |||||||
| Other assets less liabilities 1.26% | 1,234 | |||||||
| Net assets 100.00% | $ | 98,107 | ||||||
Futures contracts
The fund has entered into futures contracts as shown in the following table. The average month-end notional amount of open futures contracts while held was $6,217,000 over the prior 12-month period.
| Unrealized | ||||||||||||||
| (depreciation) | ||||||||||||||
| Notional | appreciation | |||||||||||||
| Number of | amount | at 12/31/2014 | ||||||||||||
| Clearinghouse | contracts | Expiration | (000) | (000) | ||||||||||
| S&P 500 E-mini Index Contracts | CME Exchange | 76 | March 2015 | $ | 7,683 | $ | (115 | ) | ||||||
| FTSE 100 Index Contracts | LIFFE Exchange | 2 | March 2015 | 198 | (4 | ) | ||||||||
| Euro Currency Contracts | CME Exchange | 1 | March 2015 | 154 | 3 | |||||||||
| Euro Stoxx 50 Index Contracts | Eurex Exchange | 4 | March 2015 | 149 | (2 | ) | ||||||||
| Nikkei 225 (OSE) Index Contracts | OSE Exchange | 1 | March 2015 | 146 | 2 | |||||||||
| Russell 2000 Mini Index Contracts | ICE Exchange | 1 | March 2015 | 114 | (6 | ) | ||||||||
| Japanese Yen Currency Contracts | CME Exchange | 1 | March 2015 | 107 | 2 | |||||||||
| British Pound Currency Contracts | CME Exchange | 1 | March 2015 | 98 | — | * | ||||||||
| Mini MSCI Emerging Markets Index Contracts | ICE Exchange | 1 | March 2015 | 47 | (1 | ) | ||||||||
| $ | (121 | ) | ||||||||||||
Investment in affiliates
This holding is an affiliate of the fund under the Investment Company Act of 1940 since it is controlled by the same board of trustees as the series. Further details on this holding and related transactions during the year ended December 31, 2014, appear below.
| Value of | ||||||||||||||||||||||||
| Dividend | affiliate at | |||||||||||||||||||||||
| Beginning | Ending | income | 12/31/2014 | |||||||||||||||||||||
| shares | Additions | Reductions | shares | (000) | (000) | |||||||||||||||||||
| American Funds Insurance Series – Blue Chip Income and Growth Fund, Class 1 | 1,896,886 | 5,108,864 | 781,311 | 6,224,439 | $ | 2,611 | $ | 91,437 | ||||||||||||||||
*Amount less than one thousand.
See Notes to Financial Statements
| American Funds Insurance Series | 115 |
Managed Risk Growth-Income Fund
Investment portfolio December 31, 2014
| Growth-and-income funds 92.94% | Shares | Value (000) | ||||||
| American Funds Insurance Series – Growth-Income Fund, Class 1 | 1,334,756 | $ | 70,421 | |||||
| Total growth-and-income funds (cost: $68,649,000) | 70,421 | |||||||
| Short-term securities 6.29% | ||||||||
| Government Cash Management Fund | 4,764,642 | 4,765 | ||||||
| Total short-term securities (cost: $4,764,000) | 4,765 | |||||||
| Total investment securities 99.23% (cost: $73,413,000) | 75,186 | |||||||
| Other assets less liabilities 0.77% | 580 | |||||||
| Net assets 100.00% | $ | 75,766 | ||||||
Futures contracts
The fund has entered into futures contracts as shown in the following table. The average month-end notional amount of open futures contracts while held was $6,065,000 over the prior 12-month period.
| Unrealized | ||||||||||||||
| (depreciation) | ||||||||||||||
| Notional | appreciation | |||||||||||||
| Number of | amount | at 12/31/2014 | ||||||||||||
| Clearinghouse | contracts | Expiration | (000) | (000) | ||||||||||
| S&P 500 E-mini Index Contracts | CME Exchange | 42 | March 2015 | $ | 4,175 | $ | (135 | ) | ||||||
| Russell 2000 Mini Index Contracts | ICE Exchange | 4 | March 2015 | 456 | (24 | ) | ||||||||
| Euro Stoxx 50 Index Contracts | Eurex Exchange | 10 | March 2015 | 365 | (12 | ) | ||||||||
| Euro Currency Contracts | CME Exchange | 2 | March 2015 | 312 | 9 | |||||||||
| FTSE 100 Index Contracts | LIFFE Exchange | 3 | March 2015 | 290 | (13 | ) | ||||||||
| S&P Mid 400 E-mini Index Contracts | CME Exchange | 2 | March 2015 | 279 | (11 | ) | ||||||||
| British Pound Currency Contracts | CME Exchange | 2 | March 2015 | 196 | 1 | |||||||||
| Nikkei 225 (OSE) Index Contracts | OSE Exchange | 1 | March 2015 | 140 | (4 | ) | ||||||||
| Japanese Yen Currency Contracts | CME Exchange | 1 | March 2015 | 106 | 2 | |||||||||
| Mini MSCI Emerging Markets Index Contracts | ICE Exchange | 2 | March 2015 | 91 | (5 | ) | ||||||||
| $ | (192 | ) | ||||||||||||
Investment in affiliates
This holding is an affiliate of the fund under the Investment Company Act of 1940 since it is controlled by the same board of trustees as the series. Further details on this holding and related transactions during the year ended December 31, 2014, appear below.
| Value of | ||||||||||||||||||||||||
| Dividend | affiliate at | |||||||||||||||||||||||
| Beginning | Ending | income | 12/31/2014 | |||||||||||||||||||||
| shares | Additions | Reductions | shares | (000) | (000) | |||||||||||||||||||
| American Funds Insurance Series – Growth-Income Fund, Class 1 | 449,118 | 1,117,879 | 232,241 | 1,334,756 | $ | 957 | $ | 70,421 | ||||||||||||||||
See Notes to Financial Statements
| 116 | American Funds Insurance Series |
Managed Risk Asset Allocation Fund
Investment portfolio December 31, 2014
| Asset allocation funds 93.19% | Shares | Value (000) | ||||||
| American Funds Insurance Series – Asset Allocation Fund, Class 1 | 86,231,073 | $ | 1,916,917 | |||||
| Total asset allocation funds (cost: $1,885,280,000) | 1,916,917 | |||||||
| Short-term securities 6.57% | ||||||||
| Government Cash Management Fund | 135,125,280 | 135,125 | ||||||
| Total short-term securities (cost: $135,125,000) | 135,125 | |||||||
| Total investment securities 99.76% (cost: $2,020,405,000) | 2,052,042 | |||||||
| Other assets less liabilities 0.24% | 4,927 | |||||||
| Net assets 100.00% | $ | 2,056,969 | ||||||
Futures contracts
The fund did not hold any futures contracts as of December 31, 2014. The average month-end notional amount of open futures contracts while held was $61,765,000 over the prior 12-month period.
Investment in affiliates
This holding is an affiliate of the fund under the Investment Company Act of 1940 since it is controlled by the same board of trustees as the series. Further details on this holding and related transactions during the year ended December 31, 2014, appear below.
| Value of | ||||||||||||||||||||||||
| Dividend | affiliate at | |||||||||||||||||||||||
| Beginning | Ending | income | 12/31/2014 | |||||||||||||||||||||
| shares | Additions | Reductions | shares | (000) | (000) | |||||||||||||||||||
| American Funds Insurance Series – Asset Allocation Fund, Class 1 | 37,702,567 | 50,634,043 | 2,105,537 | 86,231,073 | $ | 30,954 | $ | 1,916,917 | ||||||||||||||||
See Notes to Financial Statements
| American Funds Insurance Series | 117 |
Statements of assets and liabilities
at December 31, 2014
| Global Growth Fund | Global Small Capitalization Fund | Growth Fund | International Fund | New World Fund | ||||||||||||||||
| Assets: | ||||||||||||||||||||
| Investment securities, at value: | ||||||||||||||||||||
| Unaffiliated issuers | $ | 5,556,893 | $ | 4,079,588 | $ | 22,532,317 | $ | 7,687,281 | $ | 2,581,584 | ||||||||||
| Affiliated issuers | — | 83,253 | 241,558 | — | — | |||||||||||||||
| Cash denominated in currencies other than U.S. dollars | 19 | 24 | — | — | — | |||||||||||||||
| Cash | 91 | 29 | 123 | 124 | 109 | |||||||||||||||
| Unrealized appreciation on open forward currency contracts | 1,368 | 408 | — | 4,101 | 685 | |||||||||||||||
| Receivables for: | ||||||||||||||||||||
| Sales of investments | 6,727 | 1,327 | 35,349 | 6,608 | 3,470 | |||||||||||||||
| Sales of fund’s shares | 6,306 | 1,295 | 1,895 | 15,299 | 2,346 | |||||||||||||||
| Dividends and interest | 7,817 | 2,412 | 17,561 | 13,595 | 5,590 | |||||||||||||||
| Closed forward currency contracts | — | — | — | — | 27 | |||||||||||||||
| Deposits at brokers for futures contracts | — | — | — | — | — | |||||||||||||||
| Variation margin | — | — | — | — | — | |||||||||||||||
| Other | — | — | — | — | — | |||||||||||||||
| 5,579,221 | 4,168,336 | 22,828,803 | 7,727,008 | 2,593,811 | ||||||||||||||||
| Liabilities: | ||||||||||||||||||||
| Unrealized depreciation on open forward currency contracts | — | 1 | — | — | 119 | |||||||||||||||
| Payables for: | ||||||||||||||||||||
| Purchases of investments | 29 | 1,709 | 22,694 | 2,208 | 4,510 | |||||||||||||||
| Repurchases of fund’s shares | 6,405 | 2,833 | 32,491 | 5,083 | 785 | |||||||||||||||
| Investment advisory services | 2,497 | 2,442 | 6,332 | 3,308 | 1,607 | |||||||||||||||
| Services provided by related parties | 910 | 615 | 3,510 | 1,017 | 269 | |||||||||||||||
| Trustees’ deferred compensation | 53 | 33 | 500 | 222 | 19 | |||||||||||||||
| Closed forward currency contracts | — | — | — | — | — | |||||||||||||||
| Variation margin | — | — | — | — | — | |||||||||||||||
| Other | 482 | 159 | 311 | 3,316 | 5,024 | |||||||||||||||
| 10,376 | 7,792 | 65,838 | 15,154 | 12,333 | ||||||||||||||||
| Net assets at December 31, 2014 | $ | 5,568,845 | $ | 4,160,544 | $ | 22,762,965 | $ | 7,711,854 | $ | 2,581,478 | ||||||||||
| Net assets consist of: | ||||||||||||||||||||
| Capital paid in on shares of beneficial interest | $ | 3,642,850 | $ | 2,926,683 | $ | 10,975,371 | $ | 5,824,671 | $ | 2,329,810 | ||||||||||
| Undistributed (distributions in excess of) net investment income | 4,840 | (20,757 | ) | 25,981 | (24,827 | ) | (12,575 | ) | ||||||||||||
| Undistributed (accumulated) net realized gain (loss) | 539,464 | 330,350 | 4,459,410 | 437,846 | 148,966 | |||||||||||||||
| Net unrealized appreciation (depreciation) | 1,381,691 | 924,268 | 7,302,203 | 1,474,164 | 115,277 | |||||||||||||||
| Net assets at December 31, 2014 | $ | 5,568,845 | $ | 4,160,544 | $ | 22,762,965 | $ | 7,711,854 | $ | 2,581,478 | ||||||||||
| Investment securities, at cost: | ||||||||||||||||||||
| Unaffiliated issuers | $ | 4,176,153 | $ | 3,121,166 | $ | 15,264,257 | $ | 6,214,414 | $ | 2,461,892 | ||||||||||
| Affiliated issuers | — | 117,738 | 207,177 | — | — | |||||||||||||||
| Cash denominated in currencies other than U.S. dollars, at cost | 19 | 24 | — | — | — | |||||||||||||||
See end of statements of assets and liabilities for footnote.
See Notes to Financial Statements
| 118 | American Funds Insurance Series |
(dollars and shares in thousands, except per-share amounts)
| Blue Chip Income and Growth Fund | Global Growth and Income Fund | Growth- Income Fund | International Growth and Income Fund | Capital Income Builder | Asset Allocation Fund | Global Balanced Fund | Bond Fund | Global Bond Fund | ||||||||||||||||||||||||||
| $ | 7,251,546 | $ | 1,862,763 | $ | 25,376,300 | $ | 1,004,469 | $ | 74,886 | $ | 17,941,405 | $ | 220,314 | $ | 10,812,683 | $ | 2,661,480 | |||||||||||||||||
| — | 11,584 | — | — | — | — | — | — | — | ||||||||||||||||||||||||||
| — | — | 234 | — | — | — | — | 722 | 2 | ||||||||||||||||||||||||||
| 76 | 179 | 118 | 102 | 93 | 296 | 67 | 2,876 | 283 | ||||||||||||||||||||||||||
| — | 1,264 | — | — | — | — | 137 | 4,862 | 7,983 | ||||||||||||||||||||||||||
| 26,033 | 17,869 | 15,260 | 1,746 | 318 | 251,291 | 5,469 | 1,606,820 | 79,754 | ||||||||||||||||||||||||||
| 2,688 | 395 | 10,534 | 508 | 845 | 9,458 | 176 | 4,789 | 621 | ||||||||||||||||||||||||||
| 12,923 | 4,034 | 28,225 | 2,404 | 266 | 46,765 | 789 | 59,480 | 29,914 | ||||||||||||||||||||||||||
| — | — | — | — | — | — | 5 | 157 | 874 | ||||||||||||||||||||||||||
| — | — | — | — | — | — | — | — | — | ||||||||||||||||||||||||||
| — | — | — | — | — | — | — | 784 | 44 | ||||||||||||||||||||||||||
| 15 | — | 26 | — | — | 15 | — | — | — | ||||||||||||||||||||||||||
| 7,293,281 | 1,898,088 | 25,430,697 | 1,009,229 | 76,408 | 18,249,230 | 226,957 | 12,493,173 | 2,780,955 | ||||||||||||||||||||||||||
| — | — | — | — | — | — | 57 | — | 7,148 | ||||||||||||||||||||||||||
| 12,129 | 9,482 | 29,527 | — | 1,170 | 669,674 | 10,945 | 2,916,021 | 184,417 | ||||||||||||||||||||||||||
| 4,758 | 781 | 24,179 | 59 | — | * | 8,695 | 2 | 1,943 | 752 | |||||||||||||||||||||||||
| 2,457 | 968 | 5,771 | 552 | 30 | 4,118 | 122 | 2,977 | 1,160 | ||||||||||||||||||||||||||
| 864 | 377 | 3,319 | 66 | 12 | 1,331 | 40 | 1,058 | 319 | ||||||||||||||||||||||||||
| 43 | 15 | 567 | 3 | — | * | 178 | 1 | 76 | 15 | |||||||||||||||||||||||||
| — | — | — | — | — | — | 3 | 278 | 1,393 | ||||||||||||||||||||||||||
| — | — | — | — | — | 68 | — | — | — | ||||||||||||||||||||||||||
| 146 | 114 | 3,786 | 339 | 30 | 2,298 | 38 | 200 | 1,448 | ||||||||||||||||||||||||||
| 20,397 | 11,737 | 67,149 | 1,019 | 1,242 | 686,362 | 11,208 | 2,922,553 | 196,652 | ||||||||||||||||||||||||||
| $ | 7,272,884 | $ | 1,886,351 | $ | 25,363,548 | $ | 1,008,210 | $ | 75,166 | $ | 17,562,868 | $ | 215,749 | $ | 9,570,620 | $ | 2,584,303 | |||||||||||||||||
| $ | 4,630,223 | $ | 1,661,463 | $ | 14,067,434 | $ | 946,878 | $ | 76,662 | $ | 12,690,641 | $ | 195,556 | $ | 9,216,219 | $ | 2,555,764 | |||||||||||||||||
| 24,901 | 77 | 67,971 | (1,634 | ) | (109 | ) | 67,803 | (358 | ) | 29,269 | (357 | ) | ||||||||||||||||||||||
| 710,357 | (83,891 | ) | 3,599,882 | 21,494 | (327 | ) | 1,263,084 | 645 | 188,330 | 68,360 | ||||||||||||||||||||||||
| 1,907,403 | 308,702 | 7,628,261 | 41,472 | (1,060 | ) | 3,541,340 | 19,906 | 136,802 | (39,464 | ) | ||||||||||||||||||||||||
| $ | 7,272,884 | $ | 1,886,351 | $ | 25,363,548 | $ | 1,008,210 | $ | 75,166 | $ | 17,562,868 | $ | 215,749 | $ | 9,570,620 | $ | 2,584,303 | |||||||||||||||||
| $ | 5,344,128 | $ | 1,545,692 | $ | 17,744,496 | $ | 962,716 | $ | 75,945 | $ | 14,390,845 | $ | 200,454 | $ | 10,672,917 | $ | 2,700,254 | |||||||||||||||||
| — | 21,133 | — | — | — | — | — | — | — | ||||||||||||||||||||||||||
| — | — | 234 | — | — | — | — | 730 | 2 | ||||||||||||||||||||||||||
| American Funds Insurance Series | 119 |
Statements of assets and liabilities
at December 31, 2014
| High- Income Bond Fund | Mortgage Fund | U.S. Government/ AAA-Rated Securities Fund | Cash Management Fund | Managed Risk Growth Fund | ||||||||||||||||
| Assets: | ||||||||||||||||||||
| Investment securities, at value: | ||||||||||||||||||||
| Unaffiliated issuers | $ | 1,893,728 | $ | 414,608 | $ | 3,884,759 | $ | 395,297 | $ | 3,614 | ||||||||||
| Affiliated issuers | — | — | — | — | 74,175 | |||||||||||||||
| Cash denominated in currencies other than U.S. dollars | — | — | — | — | — | |||||||||||||||
| Cash | 3,406 | 106 | 344 | 105 | 496 | |||||||||||||||
| Unrealized appreciation on open forward currency contracts | 234 | — | — | — | — | |||||||||||||||
| Receivables for: | ||||||||||||||||||||
| Sales of investments | 33,636 | 109,864 | 317,156 | — | — | |||||||||||||||
| Sales of fund’s shares | 476 | 399 | 4,834 | 2,058 | 149 | |||||||||||||||
| Dividends and interest | 35,323 | 875 | 11,401 | 1 | — | * | ||||||||||||||
| Closed forward currency contracts | — | — | — | — | — | |||||||||||||||
| Deposits at brokers for futures contracts | — | — | — | — | 887 | |||||||||||||||
| Variation margin | — | 138 | 708 | — | 151 | |||||||||||||||
| Other | — | — | — | — | — | |||||||||||||||
| 1,966,803 | 525,990 | 4,219,202 | 397,461 | 79,472 | ||||||||||||||||
| Liabilities: | ||||||||||||||||||||
| Unrealized depreciation on open forward currency contracts | — | — | — | — | — | |||||||||||||||
| Payables for: | ||||||||||||||||||||
| Purchases of investments | 2,193 | 180,971 | 743,612 | — | 131 | |||||||||||||||
| Repurchases of fund’s shares | 1,104 | 80 | 340 | 2,185 | 4 | |||||||||||||||
| Investment advisory services | 766 | 119 | 981 | 108 | 13 | |||||||||||||||
| Services provided by related parties | 209 | 11 | 398 | 77 | 60 | |||||||||||||||
| Trustees’ deferred compensation | 55 | 1 | 58 | 22 | — | * | ||||||||||||||
| Closed forward currency contracts | — | — | — | — | — | |||||||||||||||
| Variation margin | — | — | — | — | — | |||||||||||||||
| Other | — | — | — | 4 | — | * | ||||||||||||||
| 4,327 | 181,182 | 745,389 | 2,396 | 208 | ||||||||||||||||
| Net assets at December 31, 2014 | $ | 1,962,476 | $ | 344,808 | $ | 3,473,813 | $ | 395,065 | $ | 79,264 | ||||||||||
| Net assets consist of: | ||||||||||||||||||||
| Capital paid in on shares of beneficial interest | $ | 2,111,532 | $ | 336,794 | $ | 3,401,135 | $ | 395,071 | $ | 78,039 | ||||||||||
| Undistributed (distributions in excess of) net investment income | 16,634 | 732 | 5,404 | (22 | ) | 60 | ||||||||||||||
| Undistributed (accumulated) net realized gain (loss) | (77,593 | ) | 4,237 | 26,154 | — | (418 | ) | |||||||||||||
| Net unrealized appreciation (depreciation) | (88,097 | ) | 3,045 | 41,120 | 16 | 1,583 | ||||||||||||||
| Net assets at December 31, 2014 | $ | 1,962,476 | $ | 344,808 | $ | 3,473,813 | $ | 395,065 | $ | 79,264 | ||||||||||
| Investment securities, at cost: | ||||||||||||||||||||
| Unaffiliated issuers | $ | 1,982,013 | $ | 410,758 | $ | 3,836,002 | $ | 395,281 | $ | 3,615 | ||||||||||
| Affiliated issuers | — | — | — | — | 72,153 | |||||||||||||||
| Cash denominated in currencies other than U.S. dollars, at cost | — | — | — | — | — | |||||||||||||||
See end of statements of assets and liabilities for footnote.
See Notes to Financial Statements
| 120 | American Funds Insurance Series |
(dollars and shares in thousands, except per-share amounts)
| Managed Risk International Fund | Managed Risk Blue Chip Income and Growth Fund | Managed Risk Growth- Income Fund | Managed Risk Asset Allocation Fund | |||||||||||
| $ | 2,134 | $ | 5,436 | $ | 4,765 | $ | 135,125 | |||||||
| 43,365 | 91,437 | 70,421 | 1,916,917 | |||||||||||
| — | — | — | — | |||||||||||
| 123 | 808 | 102 | 3,725 | |||||||||||
| — | — | — | — | |||||||||||
| — | — | — | — | |||||||||||
| 152 | 216 | 82 | 6,403 | |||||||||||
| — | * | — | * | — | * | 1 | ||||||||
| — | — | — | — | |||||||||||
| 486 | 318 | 475 | — | |||||||||||
| 42 | 77 | 61 | — | |||||||||||
| — | — | — | — | |||||||||||
| 46,302 | 98,292 | 75,906 | 2,062,171 | |||||||||||
| — | — | — | — | |||||||||||
| 141 | 100 | 67 | 225 | |||||||||||
| 10 | — | * | 5 | 2,875 | ||||||||||
| 8 | 16 | 12 | 344 | |||||||||||
| 36 | 69 | 56 | 1,605 | |||||||||||
| — | * | — | * | — | * | 3 | ||||||||
| — | — | — | — | |||||||||||
| — | — | — | — | |||||||||||
| — | * | — | * | — | * | 150 | ||||||||
| 195 | 185 | 140 | 5,202 | |||||||||||
| $ | 46,107 | $ | 98,107 | $ | 75,766 | $ | 2,056,969 | |||||||
| $ | 47,900 | $ | 95,076 | $ | 74,564 | $ | 1,952,693 | |||||||
| 14 | 69 | 12 | 24,307 | |||||||||||
| (180 | ) | (1,192 | ) | (391 | ) | 48,332 | ||||||||
| (1,627 | ) | 4,154 | 1,581 | 31,637 | ||||||||||
| $ | 46,107 | $ | 98,107 | $ | 75,766 | $ | 2,056,969 | |||||||
| $ | 2,134 | $ | 5,436 | $ | 4,764 | $ | 135,125 | |||||||
| 44,843 | 87,162 | 68,649 | 1,885,280 | |||||||||||
| — | — | — | — | |||||||||||
| American Funds Insurance Series | 121 |
Statements of assets and liabilities
at December 31, 2014
| Global Growth Fund | Global Small Capitalization Fund | Growth Fund | International Fund | New World Fund | ||||||||||||||||
| Shares of beneficial interest issued and outstanding (no stated par value) — unlimited shares authorized | ||||||||||||||||||||
| Class 1: | ||||||||||||||||||||
| Net assets | $ | 1,557,548 | $ | 1,411,143 | $ | 7,118,538 | $ | 3,281,804 | $ | 1,433,225 | ||||||||||
| Shares outstanding | 56,669 | 54,083 | 88,818 | 161,255 | 69,186 | |||||||||||||||
| Net asset value per share | $ | 27.48 | $ | 26.09 | $ | 80.15 | $ | 20.35 | $ | 20.72 | ||||||||||
| Class 2: | ||||||||||||||||||||
| Net assets | $ | 3,991,976 | $ | 2,737,594 | $ | 15,413,097 | $ | 4,373,530 | $ | 1,083,831 | ||||||||||
| Shares outstanding | 146,252 | 106,750 | 193,040 | 215,569 | 52,766 | |||||||||||||||
| Net asset value per share | $ | 27.30 | $ | 25.64 | $ | 79.84 | $ | 20.29 | $ | 20.54 | ||||||||||
| Class 3: | ||||||||||||||||||||
| Net assets | $ | 207,705 | $ | 38,257 | ||||||||||||||||
| Shares outstanding | 2,581 | 1,877 | ||||||||||||||||||
| Net asset value per share | $ | 80.47 | $ | 20.38 | ||||||||||||||||
| Class 4: | ||||||||||||||||||||
| Net assets | $ | 19,321 | $ | 11,807 | $ | 23,625 | $ | 18,263 | $ | 64,422 | ||||||||||
| Shares outstanding | 707 | 455 | 296 | 903 | 3,133 | |||||||||||||||
| Net asset value per share | $ | 27.34 | $ | 25.92 | $ | 79.74 | $ | 20.23 | $ | 20.56 | ||||||||||
| High- Income Bond Fund | Mortgage Fund | U.S. Government/ AAA-Rated Securities Fund | Cash Management Fund | Managed Risk Growth Fund | ||||||||||||||||
| Shares of beneficial interest issued and outstanding (no stated par value) — unlimited shares authorized | ||||||||||||||||||||
| Class 1: | ||||||||||||||||||||
| Net assets | $ | 1,016,725 | $ | 291,907 | $ | 1,722,678 | $ | 48,812 | ||||||||||||
| Shares outstanding | 96,429 | 27,291 | 138,875 | 4,326 | ||||||||||||||||
| Net asset value per share | $ | 10.54 | $ | 10.70 | $ | 12.40 | $ | 11.28 | ||||||||||||
| Class 2: | ||||||||||||||||||||
| Net assets | $ | 929,443 | $ | 52,433 | $ | 1,716,883 | $ | 331,450 | ||||||||||||
| Shares outstanding | 89,319 | 4,910 | 139,736 | 29,967 | ||||||||||||||||
| Net asset value per share | $ | 10.41 | $ | 10.68 | $ | 12.29 | $ | 11.06 | ||||||||||||
| Class 3: | ||||||||||||||||||||
| Net assets | $ | 16,012 | $ | 12,933 | $ | 7,581 | ||||||||||||||
| Shares outstanding | 1,514 | 1,041 | 680 | |||||||||||||||||
| Net asset value per share | $ | 10.57 | $ | 12.43 | $ | 11.16 | ||||||||||||||
| Class 4: | ||||||||||||||||||||
| Net assets | $ | 296 | $ | 468 | $ | 21,319 | $ | 7,222 | ||||||||||||
| Shares outstanding | 27 | 44 | 1,728 | 642 | ||||||||||||||||
| Net asset value per share | $ | 11.05 | $ | 10.65 | $ | 12.34 | $ | 11.25 | ||||||||||||
| Class P1: | ||||||||||||||||||||
| Net assets | $ | 187 | ||||||||||||||||||
| Shares outstanding | 16 | |||||||||||||||||||
| Net asset value per share | $ | 11.37 | ||||||||||||||||||
| Class P2: | ||||||||||||||||||||
| Net assets | $ | 79,077 | ||||||||||||||||||
| Shares outstanding | 6,965 | |||||||||||||||||||
| Net asset value per share | $ | 11.35 | ||||||||||||||||||
* Amount less than one thousand.
See Notes to Financial Statements
| 122 | American Funds Insurance Series |
(dollars and shares in thousands, except per-share amounts)
| Blue Chip Income and Growth Fund | Global Growth and Income Fund | Growth- Income Fund | International Growth and Income Fund | Capital Income Builder | Asset Allocation Fund | Global Balanced Fund | Bond Fund | Global Bond Fund | ||||||||||||||||||||||||||
| $ | 3,541,931 | $ | 199,890 | $ | 10,812,079 | $ | 740,232 | $ | 20,131 | $ | 11,997,270 | $ | 36,767 | $ | 4,976,680 | $ | 1,193,822 | |||||||||||||||||
| 241,153 | 15,645 | 204,921 | 45,506 | 2,053 | 539,607 | 3,310 | 449,180 | 101,411 | ||||||||||||||||||||||||||
| $ | 14.69 | $ | 12.78 | $ | 52.76 | $ | 16.27 | $ | 9.81 | $ | 22.23 | $ | 11.11 | $ | 11.08 | $ | 11.77 | |||||||||||||||||
| $ | 3,721,695 | $ | 1,684,976 | $ | 14,336,947 | $ | 247,928 | $ | 1 | $ | 5,494,146 | $ | 178,981 | $ | 4,564,572 | $ | 1,386,425 | |||||||||||||||||
| 255,471 | 132,136 | 273,559 | 15,288 | — | * | 249,023 | 16,142 | 416,740 | 118,290 | |||||||||||||||||||||||||
| $ | 14.57 | $ | 12.75 | $ | 52.41 | $ | 16.22 | $ | 9.81 | $ | 22.06 | $ | 11.09 | $ | 10.95 | $ | 11.72 | |||||||||||||||||
| $ | 184,284 | $ | 39,615 | |||||||||||||||||||||||||||||||
| 3,489 | 1,780 | |||||||||||||||||||||||||||||||||
| $ | 52.82 | $ | 22.25 | |||||||||||||||||||||||||||||||
| $ | 9,258 | $ | 1,485 | $ | 30,238 | $ | 20,050 | $ | 55,034 | $ | 31,837 | $ | 1 | $ | 29,368 | $ | 4,056 | |||||||||||||||||
| 633 | 117 | 577 | 1,238 | 5,618 | 1,440 | — | * | 2,668 | 346 | |||||||||||||||||||||||||
| $ | 14.63 | $ | 12.71 | $ | 52.39 | $ | 16.19 | $ | 9.80 | $ | 22.11 | $ | 11.09 | $ | 11.01 | $ | 11.70 | |||||||||||||||||
| Managed Risk International Fund | Managed Risk Blue Chip Income and Growth Fund | Managed Risk Growth- Income Fund | Managed Risk Asset Allocation Fund | |||||||||||
| $ | 117 | $ | 223 | $ | 149 | $ | 276,872 | |||||||
| 11 | 18 | 13 | 22,529 | |||||||||||
| $ | 10.10 | $ | 11.70 | $ | 11.67 | $ | 12.29 | |||||||
| $ | 45,990 | $ | 97,884 | $ | 75,617 | $ | 1,780,097 | |||||||
| 4,558 | 8,387 | 6,492 | 145,048 | |||||||||||
| $ | 10.09 | $ | 11.67 | $ | 11.65 | $ | 12.27 | |||||||
| American Funds Insurance Series | 123 |
Statements of operations
for the year ended December 31, 2014
| Global Growth Fund | Global Small Capitalization Fund | Growth Fund | International Fund | New World Fund | ||||||||||||||||
| Investment income: | ||||||||||||||||||||
| Income (net of non-U.S. taxes)2: | ||||||||||||||||||||
| Dividends | $ | 93,235 | $ | 45,034 | $ | 336,253 | $ | 161,353 | $ | 43,211 | ||||||||||
| Interest | 375 | 556 | 1,051 | 823 | 11,562 | |||||||||||||||
| 93,610 | 45,590 | 337,304 | 162,176 | 54,773 | ||||||||||||||||
| Fees and expenses2: | ||||||||||||||||||||
| Investment advisory services | 29,661 | 29,376 | 74,940 | 40,834 | 19,582 | |||||||||||||||
| Distribution services | 10,394 | 7,191 | 39,698 | 12,132 | 3,144 | |||||||||||||||
| Insurance administrative services | 22 | 20 | 25 | 20 | 77 | |||||||||||||||
| Transfer agent services | — | — | 3 | 2 | 1 | — | 3 | |||||||||||||
| Administrative services | 568 | 422 | 2,293 | 820 | 272 | |||||||||||||||
| Accounting and administrative services | — | — | — | — | — | |||||||||||||||
| Reports to shareholders | 342 | 226 | 1,446 | 511 | 155 | |||||||||||||||
| Registration statement and prospectus | 82 | 92 | 375 | 99 | 25 | |||||||||||||||
| Trustees’ compensation | 55 | 40 | 247 | 96 | 25 | |||||||||||||||
| Auditing and legal | 55 | 48 | 160 | 82 | 48 | |||||||||||||||
| Custodian | 537 | 794 | 428 | 1,833 | 1,003 | |||||||||||||||
| Other | 27 | 18 | 37 | 34 | 50 | |||||||||||||||
| Total fees and expenses before reimbursement/waiver | 41,743 | 38,227 | 119,651 | 56,462 | 24,381 | |||||||||||||||
| Less reimbursement/waiver of fees and expenses: | ||||||||||||||||||||
| Investment advisory services | — | — | — | — | — | |||||||||||||||
| Other | — | — | — | — | — | |||||||||||||||
| Total reimbursement/waiver of fees and expenses | — | — | — | — | — | |||||||||||||||
| Total fees and expenses after reimbursement/waiver | 41,743 | 38,227 | 119,651 | 56,462 | 24,381 | |||||||||||||||
| Net investment income (loss) | 51,867 | 7,363 | 217,653 | 105,714 | 30,392 | |||||||||||||||
| Net realized gain (loss) and unrealized (depreciation) appreciation on investments, forward currency contracts, interest rate swaps, futures contracts and currency: | ||||||||||||||||||||
| Net realized gain (loss) on2: | ||||||||||||||||||||
| Investments | 539,436 | 333,894 | 4,628,900 | 844,337 | 147,035 | |||||||||||||||
| Forward currency contracts | 20,528 | 1,123 | — | 21,865 | 4,004 | |||||||||||||||
| Interest rate swaps | — | — | — | — | — | |||||||||||||||
| Futures contracts | — | — | — | — | — | |||||||||||||||
| Currency transactions | (1,737 | ) | (285 | ) | (485 | ) | (1,059 | ) | (999 | ) | ||||||||||
| Capital gain distributions received | — | — | — | — | — | |||||||||||||||
| 558,227 | 334,732 | 4,628,415 | 865,143 | 150,040 | ||||||||||||||||
| Net unrealized (depreciation) appreciation on: | ||||||||||||||||||||
| Investments | (475,427 | ) | (249,152 | ) | (2,957,960 | ) | (1,179,677 | ) | (396,214 | ) | ||||||||||
| Forward currency contracts | (3,902 | ) | (53 | ) | — | (839 | ) | (274 | ) | |||||||||||
| Interest rate swaps | — | — | — | — | — | |||||||||||||||
| Futures contracts | — | — | — | — | — | |||||||||||||||
| Currency translations | (400 | ) | (62 | ) | (333 | ) | (1,176 | ) | (36 | ) | ||||||||||
| (479,729 | ) | (249,267 | ) | (2,958,293 | ) | (1,181,692 | ) | (396,524 | ) | |||||||||||
| Net realized gain (loss) and unrealized (depreciation) appreciation on investments, forward currency contracts, interest rate swaps, futures contracts and currency | 78,498 | 85,465 | 1,670,122 | (316,549 | ) | (246,484 | ) | |||||||||||||
| Net increase (decrease) in net assets resulting from operations | $ | 130,365 | $ | 92,828 | $ | 1,887,775 | $ | (210,835 | ) | $ | (216,092 | ) | ||||||||
See end of statements of operations for footnotes.
See Notes to Financial Statements
| 124 | American Funds Insurance Series |
(dollars in thousands)
| Blue Chip Income and Growth Fund | Global Growth and Income Fund | Growth- Income Fund | International Growth and Income Fund | Capital Income Builder1 | Asset Allocation Fund | Global Balanced Fund | Bond Fund | Global Bond Fund | ||||||||||||||||||||||||||
| $ | 256,576 | $ | 78,405 | $ | 455,690 | $ | 39,412 | $ | 859 | $ | 265,080 | $ | 4,121 | $ | 378 | $ | 49 | |||||||||||||||||
| 324 | 1,391 | 6,489 | 759 | 100 | 111,167 | 1,770 | 230,717 | 77,652 | ||||||||||||||||||||||||||
| 256,900 | 79,796 | 462,179 | 40,171 | 959 | 376,247 | 5,891 | 231,095 | 77,701 | ||||||||||||||||||||||||||
| 27,138 | 11,666 | 66,888 | 6,376 | 146 | 46,705 | 1,370 | 34,918 | 13,996 | ||||||||||||||||||||||||||
| 9,290 | 4,395 | 36,890 | 672 | 39 | 14,134 | 427 | 11,723 | 3,695 | ||||||||||||||||||||||||||
| 6 | 3 | 30 | 24 | 39 | 26 | — | 32 | 3 | ||||||||||||||||||||||||||
| 1 | — | 3 | 2 | — | — | 3 | 2 | — | 3 | 1 | — | 3 | ||||||||||||||||||||||
| 681 | 195 | 2,501 | 100 | 3 | 1,677 | 21 | 954 | 266 | ||||||||||||||||||||||||||
| — | — | — | — | — | — | — | — | — | ||||||||||||||||||||||||||
| 281 | 78 | 1,560 | 13 | — | 3 | 955 | 2 | 508 | 111 | |||||||||||||||||||||||||
| 74 | 17 | 334 | 62 | 2 | 282 | 6 | 131 | 35 | ||||||||||||||||||||||||||
| 61 | 18 | 269 | 9 | — | 3 | 158 | 2 | 88 | 24 | |||||||||||||||||||||||||
| 45 | 27 | 175 | 13 | 1 | 114 | 6 | 64 | 18 | ||||||||||||||||||||||||||
| 238 | 279 | 596 | 255 | 13 | 318 | 38 | 72 | 496 | ||||||||||||||||||||||||||
| 9 | 13 | 43 | 2 | — | 26 | 21 | 145 | 215 | ||||||||||||||||||||||||||
| 37,824 | 16,691 | 109,288 | 7,526 | 243 | 64,397 | 1,893 | 48,636 | 18,859 | ||||||||||||||||||||||||||
| 29 | — | — | — | — | — | — | — | — | ||||||||||||||||||||||||||
| — | — | — | — | — | — | — | — | — | ||||||||||||||||||||||||||
| 29 | — | — | — | — | — | — | — | — | ||||||||||||||||||||||||||
| 37,795 | 16,691 | 109,288 | 7,526 | 243 | 64,397 | 1,893 | 48,636 | 18,859 | ||||||||||||||||||||||||||
| 219,105 | 63,105 | 352,891 | 32,645 | 716 | 311,850 | 3,998 | 182,459 | 58,842 | ||||||||||||||||||||||||||
| 737,780 | 191,174 | 3,613,704 | 25,019 | (214 | ) | 1,263,716 | 3,547 | 205,030 | 49,433 | |||||||||||||||||||||||||
| — | 828 | (9 | ) | — | — | — | (43 | ) | 10,839 | (3,161 | ) | |||||||||||||||||||||||
| — | — | — | — | — | (1,666 | ) | — | (9,463 | ) | (2,498 | ) | |||||||||||||||||||||||
| — | — | — | — | — | — | — | — | — | ||||||||||||||||||||||||||
| (2 | ) | (199 | ) | (1,390 | ) | (137 | ) | (10 | ) | (1,085 | ) | (64 | ) | 156 | (1,813 | ) | ||||||||||||||||||
| — | — | — | — | — | — | — | — | — | ||||||||||||||||||||||||||
| 737,778 | 191,803 | 3,612,305 | 24,882 | (224 | ) | 1,260,965 | 3,440 | 206,562 | 41,961 | |||||||||||||||||||||||||
| 25,023 | (147,265 | ) | (1,414,381 | ) | (92,324 | ) | (1,059 | ) | (645,038 | ) | (4,302 | ) | 116,937 | (63,286 | ) | |||||||||||||||||||
| — | 1,206 | (612 | ) | — | — | — | 104 | 6,511 | 4,230 | |||||||||||||||||||||||||
| — | — | — | — | — | (9,127 | ) | — | (7,795 | ) | (175 | ) | |||||||||||||||||||||||
| — | — | — | — | — | — | — | — | — | ||||||||||||||||||||||||||
| (19 | ) | (135 | ) | (99 | ) | (143 | ) | (1 | ) | (16 | ) | (37 | ) | (412 | ) | (1,646 | ) | |||||||||||||||||
| 25,004 | (146,194 | ) | (1,415,092 | ) | (92,467 | ) | (1,060 | ) | (654,181 | ) | (4,235 | ) | 115,241 | (60,877 | ) | |||||||||||||||||||
| 762,782 | 45,609 | 2,197,213 | (67,585 | ) | (1,284 | ) | 606,784 | (795 | ) | 321,803 | (18,916 | ) | ||||||||||||||||||||||
| $ | 981,887 | $ | 108,714 | $ | 2,550,104 | $ | (34,940 | ) | $ | (568 | ) | $ | 918,634 | $ | 3,203 | $ | 504,262 | $ | 39,926 | |||||||||||||||
| American Funds Insurance Series | 125 |
Statements of operations
for the year ended December 31, 2014
| High- Income Bond Fund | Mortgage Fund | U.S. Government/ AAA-Rated Securities Fund | Cash Management Fund | Managed Risk Growth Fund | ||||||||||||||||
| Investment income: | ||||||||||||||||||||
| Income (net of non-U.S. taxes)2: | ||||||||||||||||||||
| Dividends | $ | 838 | $ | — | $ | — | $ | — | $ | 901 | ||||||||||
| Interest | 125,255 | 4,475 | 55,405 | 313 | — | 3 | ||||||||||||||
| 126,093 | 4,475 | 55,405 | 313 | 901 | ||||||||||||||||
| Fees and expenses2: | ||||||||||||||||||||
| Investment advisory services | 9,118 | 1,194 | 11,539 | 1,363 | 132 | |||||||||||||||
| Distribution services | 2,584 | 127 | 4,509 | 926 | 122 | |||||||||||||||
| Insurance administrative services | 6 | — | 3 | 22 | 6 | 122 | ||||||||||||||
| Transfer agent services | — | 3 | — | 3 | — | 3 | — | — | 3 | |||||||||||
| Administrative services | 197 | 29 | 348 | 42 | — | |||||||||||||||
| Accounting and administrative services | — | — | — | — | 52 | |||||||||||||||
| Reports to shareholders | 52 | 3 | 90 | 11 | — | 3 | ||||||||||||||
| Registration statement and prospectus | 22 | 18 | 39 | 6 | 4 | |||||||||||||||
| Trustees’ compensation | 22 | 2 | 35 | 6 | — | 3 | ||||||||||||||
| Auditing and legal | 13 | 2 | 23 | 3 | — | 3 | ||||||||||||||
| Custodian | 9 | 1 | 9 | 1 | 12 | |||||||||||||||
| Other | 68 | 17 | 37 | 1 | 14 | |||||||||||||||
| Total fees and expenses before reimbursement/waiver | 12,091 | 1,393 | 16,651 | 2,365 | 458 | |||||||||||||||
| Less reimbursement/waiver of fees and expenses: | ||||||||||||||||||||
| Investment advisory services | — | — | — | — | 26 | |||||||||||||||
| Other | — | — | — | — | 67 | |||||||||||||||
| Total reimbursement/waiver of fees and expenses | — | — | — | — | 93 | |||||||||||||||
| Total fees and expenses after reimbursement/waiver | 12,091 | 1,393 | 16,651 | 2,365 | 365 | |||||||||||||||
| Net investment income (loss) | 114,002 | 3,082 | 38,754 | (2,052 | ) | 536 | ||||||||||||||
| Net realized gain (loss) and unrealized (depreciation) appreciation on investments, forward currency contracts, interest rate swaps, futures contracts and currency: | ||||||||||||||||||||
| Net realized gain (loss) on2: | ||||||||||||||||||||
| Investments | 50,613 | 6,945 | 52,366 | 1 | 1,399 | |||||||||||||||
| Forward currency contracts | 872 | — | — | — | — | |||||||||||||||
| Interest rate swaps | — | 222 | (4,040 | ) | — | — | ||||||||||||||
| Futures contracts | — | — | — | — | (2,612 | ) | ||||||||||||||
| Currency transactions | 20 | — | — | — | (9 | ) | ||||||||||||||
| Capital gain distributions received | — | — | — | — | 2,314 | |||||||||||||||
| 51,505 | 7,167 | 48,326 | 1 | 1,092 | ||||||||||||||||
| Net unrealized (depreciation) appreciation on: | ||||||||||||||||||||
| Investments | (152,554 | ) | 5,159 | 98,178 | 3 | 4 | ||||||||||||||
| Forward currency contracts | 258 | — | — | — | — | |||||||||||||||
| Interest rate swaps | — | (956 | ) | (11,848 | ) | — | — | |||||||||||||
| Futures contracts | — | — | — | — | (438 | ) | ||||||||||||||
| Currency translations | (62 | ) | — | — | — | — | ||||||||||||||
| (152,358 | ) | 4,203 | 86,330 | 3 | (434 | ) | ||||||||||||||
| Net realized gain (loss) and unrealized (depreciation) appreciation on investments, forward currency contracts, interest rate swaps, futures contracts and currency | (100,853 | ) | 11,370 | 134,656 | 4 | 658 | ||||||||||||||
| Net increase (decrease) in net assets resulting from operations | $ | 13,149 | $ | 14,452 | $ | 173,410 | $ | (2,048 | ) | $ | 1,194 | |||||||||
| 1 | For the period May 1, 2014, commencement of operations, through December 31, 2014. |
| 2 | Additional information related to non-U.S. taxes, affiliated transactions and class-specific fees and expenses is included in the Notes to Financial Statements. |
| 3 | Amount less than one thousand. |
See Notes to Financial Statements
| 126 | American Funds Insurance Series |
(dollars in thousands)
| Managed Risk International Fund | Managed Risk Blue Chip Income and Growth Fund | Managed Risk Growth- Income Fund | Managed Risk Asset Allocation Fund | |||||||||||
| $ | 700 | $ | 2,611 | $ | 957 | $ | 30,954 | |||||||
| — | 3 | — | 3 | — | 3 | 9 | ||||||||
| 700 | 2,611 | 957 | 30,963 | |||||||||||
| 81 | 132 | 116 | 3,883 | |||||||||||
| 71 | 121 | 105 | 3,407 | |||||||||||
| 71 | 121 | 105 | 3,883 | |||||||||||
| — | 3 | — | 3 | — | 3 | — | 3 | |||||||
| — | — | — | — | |||||||||||
| 51 | 52 | 51 | 87 | |||||||||||
| — | 3 | 1 | — | 3 | 79 | |||||||||
| 3 | 4 | 4 | 116 | |||||||||||
| — | 3 | — | 3 | — | 3 | 11 | ||||||||
| — | 3 | — | 3 | — | 3 | 14 | ||||||||
| 12 | 12 | 12 | 12 | |||||||||||
| 2 | 17 | 10 | 221 | |||||||||||
| 291 | 460 | 403 | 11,713 | |||||||||||
| 16 | 26 | 23 | 777 | |||||||||||
| 60 | 70 | 64 | 74 | |||||||||||
| 76 | 96 | 87 | 851 | |||||||||||
| 215 | 364 | 316 | 10,862 | |||||||||||
| 485 | 2,247 | 641 | 20,101 | |||||||||||
| 743 | 2,062 | 1,859 | 7,887 | |||||||||||
| — | — | — | — | |||||||||||
| — | — | — | — | |||||||||||
| (639 | ) | (2,998 | ) | (2,253 | ) | (23,286 | ) | |||||||
| (8 | ) | (2 | ) | (3 | ) | (20 | ) | |||||||
| — | — | 1,784 | 69,557 | |||||||||||
| 96 | (938 | ) | 1,387 | 54,138 | ||||||||||
| (2,621 | ) | 2,404 | (224 | ) | (23,318 | ) | ||||||||
| — | — | — | — | |||||||||||
| — | — | — | — | |||||||||||
| (149 | ) | (121 | ) | (192 | ) | — | ||||||||
| — | — | — | — | |||||||||||
| (2,770 | ) | 2,283 | (416 | ) | (23,318 | ) | ||||||||
| (2,674 | ) | 1,345 | 971 | 30,820 | ||||||||||
| $ | (2,189 | ) | $ | 3,592 | $ | 1,612 | $ | 50,921 | ||||||
| American Funds Insurance Series | 127 |
Statements of changes in net assets
| Global Growth Fund | Global Small Capitalization Fund | Growth Fund | ||||||||||||||||||||||
| Year ended December 31 | Year ended December 31 | Year ended December 31 | ||||||||||||||||||||||
| 2014 | 2013 | 2014 | 2013 | 2014 | 2013 | |||||||||||||||||||
| Operations: | ||||||||||||||||||||||||
| Net investment income (loss) | $ | 51,867 | $ | 55,608 | $ | 7,363 | $ | 361 | $ | 217,653 | $ | 171,593 | ||||||||||||
| Net realized gain (loss) on investments | 558,227 | 929,844 | 334,732 | 472,703 | 4,628,415 | 2,727,323 | ||||||||||||||||||
| Net unrealized appreciation (depreciation) on investments | (479,729 | ) | 524,891 | (249,267 | ) | 494,315 | (2,958,293 | ) | 3,086,943 | |||||||||||||||
| Net increase (decrease) in net assets resulting from operations | 130,365 | 1,510,343 | 92,828 | 967,379 | 1,887,775 | 5,985,859 | ||||||||||||||||||
| Dividends and distributions paid to shareholders: | ||||||||||||||||||||||||
| Dividends from net investment income | (68,881 | ) | (71,780 | ) | (8,225 | ) | (33,337 | ) | (224,482 | ) | (221,528 | ) | ||||||||||||
| Distributions from net realized gain on investments | (559,317 | ) | — | (18,741 | ) | — | (1,119,414 | ) | — | |||||||||||||||
| Total dividends and distributions paid to shareholders | (628,198 | ) | (71,780 | ) | (26,966 | ) | (33,337 | ) | (1,343,896 | ) | (221,528 | ) | ||||||||||||
| Net capital share transactions | 178,506 | (739,453 | ) | (105,588 | ) | (355,428 | ) | (1,339,113 | ) | (4,421,762 | ) | |||||||||||||
| Total increase (decrease) in net assets | (319,327 | ) | 699,110 | (39,726 | ) | 578,614 | (795,234 | ) | 1,342,569 | |||||||||||||||
| Net assets: | ||||||||||||||||||||||||
| Beginning of year | 5,888,172 | 5,189,062 | 4,200,270 | 3,621,656 | 23,558,199 | 22,215,630 | ||||||||||||||||||
| End of year | $ | 5,568,845 | $ | 5,888,172 | $ | 4,160,544 | $ | 4,200,270 | $ | 22,762,965 | $ | 23,558,199 | ||||||||||||
| Undistributed (distributions in excess of) net investment income | $ | 4,840 | $ | 3,114 | $ | (20,757 | ) | $ | (23,219 | ) | $ | 25,981 | $ | 33,372 | ||||||||||
| International Growth and Income Fund | Capital Income Builder | Asset Allocation Fund | ||||||||||||||||||
| Year ended December 31 | Year ended December 31 | Year ended December 31 | ||||||||||||||||||
| 2014 | 2013 | 20141 | 2014 | 2013 | ||||||||||||||||
| Operations: | ||||||||||||||||||||
| Net investment income (loss) | $ | 32,645 | $ | 21,709 | $ | 716 | $ | 311,850 | $ | 230,855 | ||||||||||
| Net realized gain (loss) on investments | 24,882 | 34,613 | (224 | ) | 1,260,965 | 825,117 | ||||||||||||||
| Net unrealized appreciation (depreciation) on investments | (92,467 | ) | 92,291 | (1,060 | ) | (654,181 | ) | 1,982,263 | ||||||||||||
| Net increase (decrease) in net assets resulting from operations | (34,940 | ) | 148,613 | (568 | ) | 918,634 | 3,038,235 | |||||||||||||
| Dividends and distributions paid to shareholders: | ||||||||||||||||||||
| Dividends from net investment income | (31,369 | ) | (23,927 | ) | (835 | ) | (282,950 | ) | (240,318 | ) | ||||||||||
| Distributions from net realized gain on investments | (9,656 | ) | (14,821 | ) | (94 | ) | (808,834 | ) | — | |||||||||||
| Total dividends and distributions paid to shareholders | (41,025 | ) | (38,748 | ) | (929 | ) | (1,091,784 | ) | (240,318 | ) | ||||||||||
| Net capital share transactions | 129,868 | 416,512 | 76,663 | 1,418,325 | 1,058,137 | |||||||||||||||
| Total increase (decrease) in net assets | 53,903 | 526,377 | 75,166 | 1,245,175 | 3,856,054 | |||||||||||||||
| Net assets: | ||||||||||||||||||||
| Beginning of year | 954,307 | 427,930 | — | 16,317,693 | 12,461,639 | |||||||||||||||
| End of year | $ | 1,008,210 | $ | 954,307 | $ | 75,166 | $ | 17,562,868 | $ | 16,317,693 | ||||||||||
| Undistributed (distributions in excess of) net investment income | $ | (1,634 | ) | $ | (3,866 | ) | $ | (109 | ) | $ | 67,803 | $ | 44,514 | |||||||
See end of statements of changes for footnotes.
See Notes to Financial Statements
| 128 | American Funds Insurance Series |
(dollars in thousands)
| International Fund | New World Fund | Blue Chip Income and Growth Fund | Global Growth and Income Fund | Growth-Income Fund | ||||||||||||||||||||||||||||||||||
| Year ended December 31 | Year ended December 31 | Year ended December 31 | Year ended December 31 | Year ended December 31 | ||||||||||||||||||||||||||||||||||
| 2014 | 2013 | 2014 | 2013 | 2014 | 2013 | 2014 | 2013 | 2014 | 2013 | |||||||||||||||||||||||||||||
| $ | 105,714 | $ | 112,294 | $ | 30,392 | $ | 34,369 | $ | 219,105 | $ | 125,779 | $ | 63,105 | $ | 62,835 | $ | 352,891 | $ | 315,972 | |||||||||||||||||||
| 865,143 | 905,270 | 150,040 | 265,071 | 737,778 | 481,198 | 191,803 | 267,269 | 3,612,305 | 2,959,891 | |||||||||||||||||||||||||||||
| (1,181,692 | ) | 757,137 | (396,524 | ) | (14,019 | ) | 25,004 | 1,061,023 | (146,194 | ) | 80,764 | (1,415,092 | ) | 3,592,077 | ||||||||||||||||||||||||
| (210,835 | ) | 1,774,701 | (216,092 | ) | 285,421 | 981,887 | 1,668,000 | 108,714 | 410,868 | 2,550,104 | 6,867,940 | |||||||||||||||||||||||||||
| (119,689 | ) | (126,296 | ) | (31,681 | ) | (38,680 | ) | (221,413 | ) | (121,475 | ) | (66,932 | ) | (63,217 | ) | (345,996 | ) | (330,882 | ) | |||||||||||||||||||
| — | — | (264,280 | ) | (11,688 | ) | — | — | — | — | (1,199,049 | ) | — | ||||||||||||||||||||||||||
| (119,689 | ) | (126,296 | ) | (295,961 | ) | (50,368 | ) | (221,413 | ) | (121,475 | ) | (66,932 | ) | (63,217 | ) | (1,545,045 | ) | (330,882 | ) | |||||||||||||||||||
| (1,245,391 | ) | (1,488,019 | ) | 390,346 | (49,848 | ) | (56,686 | ) | 283,296 | (184,153 | ) | (335,904 | ) | (674,865 | ) | (4,856,235 | ) | |||||||||||||||||||||
| (1,575,915 | ) | 160,386 | (121,707 | ) | 185,205 | 703,788 | 1,829,821 | (142,371 | ) | 11,747 | 330,194 | 1,680,823 | ||||||||||||||||||||||||||
| 9,287,769 | 9,127,383 | 2,703,185 | 2,517,980 | 6,569,096 | 4,739,275 | 2,028,722 | 2,016,975 | 25,033,354 | 23,352,531 | |||||||||||||||||||||||||||||
| $ | 7,711,854 | $ | 9,287,769 | $ | 2,581,478 | $ | 2,703,185 | $ | 7,272,884 | $ | 6,569,096 | $ | 1,886,351 | $ | 2,028,722 | $ | 25,363,548 | $ | 25,033,354 | |||||||||||||||||||
| $ | (24,827 | ) | $ | (35,174 | ) | $ | (12,575 | ) | $ | (12,241 | ) | $ | 24,901 | $ | 27,211 | $ | 77 | $ | (1,984 | ) | $ | 67,971 | $ | 57,175 | ||||||||||||||
| Global Balanced Fund | Bond Fund | Global Bond Fund | High-Income Bond Fund | Mortgage Fund | ||||||||||||||||||||||||||||||||||
| Year ended December 31 | Year ended December 31 | Year ended December 31 | Year ended December 31 | Year ended December 31 | ||||||||||||||||||||||||||||||||||
| 2014 | 2013 | 2014 | 2013 | 2014 | 2013 | 2014 | 2013 | 2014 | 2013 | |||||||||||||||||||||||||||||
| $ | 3,998 | $ | 3,143 | $ | 182,459 | $ | 165,688 | $ | 58,842 | $ | 58,823 | $ | 114,002 | $ | 122,416 | $ | 3,082 | $ | 529 | |||||||||||||||||||
| 3,440 | 3,839 | 206,562 | 8,330 | 41,961 | (31,021 | ) | 51,505 | 15,106 | 7,167 | (1,198 | ) | |||||||||||||||||||||||||||
| (4,235 | ) | 13,109 | 115,241 | (351,831 | ) | (60,877 | ) | (98,103 | ) | (152,358 | ) | (8,925 | ) | 4,203 | (2,393 | ) | ||||||||||||||||||||||
| 3,203 | 20,091 | 504,262 | (177,813 | ) | 39,926 | (70,301 | ) | 13,149 | 128,597 | 14,452 | (3,062 | ) | ||||||||||||||||||||||||||
| (2,876 | ) | (2,640 | ) | (196,026 | ) | (176,180 | ) | (38,880 | ) | — | (116,796 | ) | (127,001 | ) | (2,963 | ) | (1,659 | ) | ||||||||||||||||||||
| (5,479 | ) | (1,389 | ) | (3,424 | ) | (97,344 | ) | (22,998 | ) | (32,698 | ) | — | — | — | (345 | ) | ||||||||||||||||||||||
| (8,355 | ) | (4,029 | ) | (199,450 | ) | (273,524 | ) | (61,878 | ) | (32,698 | ) | (116,796 | ) | (127,001 | ) | (2,963 | ) | (2,004 | ) | |||||||||||||||||||
| 28,764 | 24,936 | (6,277 | ) | 762,587 | 17,465 | 69,173 | 130,489 | (115,679 | ) | 86,031 | 116,261 | |||||||||||||||||||||||||||
| 23,612 | 40,998 | 298,535 | 311,250 | (4,487 | ) | (33,826 | ) | 26,842 | (114,083 | ) | 97,520 | 111,195 | ||||||||||||||||||||||||||
| 192,137 | 151,139 | 9,272,085 | 8,960,835 | 2,588,790 | 2,622,616 | 1,935,634 | 2,049,717 | 247,288 | 136,093 | |||||||||||||||||||||||||||||
| $ | 215,749 | $ | 192,137 | $ | 9,570,620 | $ | 9,272,085 | $ | 2,584,303 | $ | 2,588,790 | $ | 1,962,476 | $ | 1,935,634 | $ | 344,808 | $ | 247,288 | |||||||||||||||||||
| $ | (358 | ) | $ | (344 | ) | $ | 29,269 | $ | 33,731 | $ | (357 | ) | $ | 6,522 | $ | 16,634 | $ | 16,443 | $ | 732 | $ | 11 | ||||||||||||||||
| American Funds Insurance Series | 129 |
Statements of changes in net assets
| U.S. Government/ AAA-Rated Securities Fund | Cash Management Fund | Managed Risk Growth Fund | ||||||||||||||||||||||
| Year ended December 31 | Year ended December 31 | Year ended December 31 | ||||||||||||||||||||||
| 2014 | 2013 | 2014 | 2013 | 2014 | 20132 | |||||||||||||||||||
| Operations: | ||||||||||||||||||||||||
| Net investment income (loss) | $ | 38,754 | $ | 19,673 | $ | (2,052 | ) | $ | (2,280 | ) | $ | 536 | $ | 142 | ||||||||||
| Net realized gain (loss) on investments | 48,326 | (10,887 | ) | 1 | — | 3 | 1,092 | (126 | ) | |||||||||||||||
| Net unrealized appreciation (depreciation) on investments | 86,330 | (118,491 | ) | 3 | (11 | ) | (434 | ) | 2,017 | |||||||||||||||
| Net increase (decrease) in net assets resulting from operations | 173,410 | (109,705 | ) | (2,048 | ) | (2,291 | ) | 1,194 | 2,033 | |||||||||||||||
| Dividends and distributions paid to shareholders: | ||||||||||||||||||||||||
| Dividends from net investment income | (41,683 | ) | (27,711 | ) | — | — | (534 | ) | (140 | ) | ||||||||||||||
| Distributions from net realized gain on investments | — | (98,424 | ) | — | — | (1,328 | ) | — | ||||||||||||||||
| Total dividends and distributions paid to shareholders | (41,683 | ) | (126,135 | ) | — | — | (1,862 | ) | (140 | ) | ||||||||||||||
| Net capital share transactions | (57,173 | ) | (189,164 | ) | (62,920 | ) | (73,782 | ) | 51,939 | 26,100 | ||||||||||||||
| Total increase (decrease) in net assets | 74,554 | (425,004 | ) | (64,968 | ) | (76,073 | ) | 51,271 | 27,993 | |||||||||||||||
| Net assets: | ||||||||||||||||||||||||
| Beginning of year | 3,399,259 | 3,824,263 | 460,033 | 536,106 | 27,993 | — | ||||||||||||||||||
| End of year | $ | 3,473,813 | $ | 3,399,259 | $ | 395,065 | $ | 460,033 | $ | 79,264 | $ | 27,993 | ||||||||||||
| Undistributed (distributions in excess of) net investment income | $ | 5,404 | $ | 6,797 | $ | (22 | ) | $ | (20 | ) | $ | 60 | $ | 2 | ||||||||||
| 1 | For the period May 1, 2014, commencement of operations, through December 31, 2014. |
| 2 | For the period May 1, 2013, commencement of operations, through December 31, 2013. |
| 3 | Amount less than one thousand. |
See Notes to Financial Statements
| 130 | American Funds Insurance Series |
(dollars in thousands)
| Managed Risk International Fund | Managed Risk Blue Chip Income and Growth Fund | Managed Risk Growth-Income Fund | Managed Risk Asset Allocation Fund | |||||||||||||||||||||||||||
| Year ended December 31 | Year ended December 31 | Year ended December 31 | Year ended December 31 | |||||||||||||||||||||||||||
| 2014 | 20132 | 2014 | 20132 | 2014 | 20132 | 2014 | 2013 | |||||||||||||||||||||||
| $ | 485 | $ | 157 | $ | 2,247 | $ | 346 | $ | 641 | $ | 205 | $ | 20,101 | $ | 8,194 | |||||||||||||||
| 96 | (280 | ) | (938 | ) | (257 | ) | 1,387 | (177 | ) | 54,138 | (47 | ) | ||||||||||||||||||
| (2,770 | ) | 1,143 | 2,283 | 1,871 | (416 | ) | 1,997 | (23,318 | ) | 54,945 | ||||||||||||||||||||
| (2,189 | ) | 1,020 | 3,592 | 1,960 | 1,612 | 2,025 | 50,921 | 63,092 | ||||||||||||||||||||||
| (510 | ) | (114 | ) | (2,179 | ) | (342 | ) | (643 | ) | (202 | ) | (1,557 | ) | (8,151 | ) | |||||||||||||||
| — | — | — | — | (1,590 | ) | — | — | — | ||||||||||||||||||||||
| (510 | ) | (114 | ) | (2,179 | ) | (342 | ) | (2,233 | ) | (202 | ) | (1,557 | ) | (8,151 | ) | |||||||||||||||
| 31,920 | 15,980 | 70,335 | 24,741 | 52,232 | 22,332 | 1,100,535 | 817,857 | |||||||||||||||||||||||
| 29,221 | 16,886 | 71,748 | 26,359 | 51,611 | 24,155 | 1,149,899 | 872,798 | |||||||||||||||||||||||
| 16,886 | — | 26,359 | — | 24,155 | — | 907,070 | 34,272 | |||||||||||||||||||||||
| $ | 46,107 | $ | 16,886 | $ | 98,107 | $ | 26,359 | $ | 75,766 | $ | 24,155 | $ | 2,056,969 | $ | 907,070 | |||||||||||||||
| $ | 14 | $ | 6 | $ | 69 | $ | 4 | $ | 12 | $ | 3 | $ | 24,307 | $ | 89 | |||||||||||||||
| American Funds Insurance Series | 131 |
Notes to financial statements
1. Organization
American Funds Insurance Series (the “series”) is registered under the Investment Company Act of 1940 as an open-end, diversified investment company with 23 different funds (the “funds”). The assets of each fund are segregated, with each fund accounted for separately. Capital Research and Management Company (“CRMC”) is the series’ investment adviser. Milliman Financial Risk Management LLC (“Milliman”) is the subadviser for the risk management strategy for five of the funds (the “managed risk funds”).
The managed risk funds are Managed Risk Growth Fund, Managed Risk International Fund, Managed Risk Blue Chip Income and Growth Fund, Managed Risk Growth-Income Fund and Managed Risk Asset Allocation Fund. The managed risk funds invest in other funds within the series (the “underlying funds”) and employ Milliman to implement the risk management strategy, which consists of using hedging instruments – primarily short positions on exchange-traded futures contracts – to attempt to stabilize the volatility of the funds around target volatility levels and reduce the downside exposure of the funds during periods of significant market declines.
Shareholders approved a proposal to reorganize the series from a Massachusetts business trust to a Delaware statutory trust. The reorganization may be completed in the next 12 months; however, the series reserves the right to delay the implementation.
Each fund’s investment objective and the principal strategies used to achieve the objective are as follows:
Global Growth Fund — Seeks long-term growth of capital through investments in common stocks of companies located around the world.
Global Small Capitalization Fund — Seeks long-term growth of capital through investments in smaller companies in the U.S. and around the world.
Growth Fund — Seeks to invest in a wide range of companies that appear to offer superior opportunities for growth of capital.
International Fund — Seeks long-term growth of capital through investments in common stocks of companies located around the world.
New World Fund — Seeks long-term capital appreciation by investing in common stocks and bonds with significant exposure to countries that have developing economies and/or markets.
Blue Chip Income and Growth Fund — Seeks to produce income exceeding the average yield on U.S. stocks generally and to provide an opportunity for growth of principal consistent with sound common stock investing through investments in quality common stocks.
Global Growth and Income Fund — Seeks long-term growth of capital while providing current income. It invests on a global basis in a diversified portfolio consisting primarily of common stocks and other equity securities.
Growth-Income Fund — Seeks long-term growth of capital and income by investing in common stocks or other securities of companies located in the U.S. and around the world.
International Growth and Income Fund — Seeks to provide long-term growth of capital and current income by investing primarily in the stocks of larger, well-established companies outside the U.S., including countries that have developing economies and/or markets.
Capital Income Builder — Seeks to provide a level of current income exceeding the average yield on U.S. stocks generally and to provide a growing stream of income over the years.
Asset Allocation Fund — Seeks high total return (including income and capital gains) consistent with the preservation of capital over the long term by investing primarily in common stocks and fixed-income securities.
Global Balanced Fund — Seeks long-term growth of capital, conservation of principal and current income by investing in equity and debt securities in the U.S. and around the world.
Bond Fund — Seeks a high level of current income as is consistent with preservation of capital by investing primarily in bonds.
Global Bond Fund — Seeks a high level of total return consistent with prudent investment management by investing primarily in a global portfolio of investment-grade bonds.
| 132 | American Funds Insurance Series |
High-Income Bond Fund — Seeks a high level of current income and, secondarily, capital appreciation through a diversified portfolio consisting primarily of lower rated, higher risk corporate bonds.
Mortgage Fund — Seeks to provide current income and preservation of capital by investing primarily in mortgage-related securities.
U.S. Government/AAA-Rated Securities Fund — Seeks to provide a high level of current income consistent with preservation of capital by investing primarily in securities guaranteed or sponsored by the U.S. government and the highest quality corporate bonds.
Cash Management Fund — Seeks to provide income on cash reserves while preserving capital and maintaining liquidity.
Managed Risk Growth Fund — Seeks to provide growth of capital while seeking to manage volatility and provide downside protection.
Managed Risk International Fund — Seeks to provide long-term growth of capital while seeking to manage volatility and provide downside protection.
Managed Risk Blue Chip Income and Growth Fund — Seeks to produce income exceeding the average yield on U.S. stocks generally and to provide an opportunity for growth of principal consistent with sound common stock investing, in each case while seeking to manage volatility and provide downside protection.
Managed Risk Growth-Income Fund — Seeks to provide long-term growth of capital and income while seeking to manage volatility and provide downside protection.
Managed Risk Asset Allocation Fund — Seeks to provide high total return consistent with preservation of capital over the long term while seeking to manage volatility and provide downside protection.
Each fund in the series, except the managed risk funds, offers either three or four share classes (Classes 1, 2, 3 or 4); the managed risk funds offer two share classes (Classes P1 and P2). Holders of all share classes of each fund have equal pro rata rights to assets, dividends and liquidation proceeds of each fund held. Each share class of each fund has identical voting rights, except for the exclusive right to vote on matters affecting only its class. Share classes have different fees and expenses (“class-specific fees and expenses”), primarily due to different arrangements for certain distribution expenses. Differences in class-specific fees and expenses will result in differences in net investment income and, therefore, the payment of different per-share dividends by each class of each fund.
2. Significant accounting policies
Each fund is an investment company that applies the accounting and reporting guidance issued in Topic 946 by the U.S. Financial Accounting Standards Board. Each fund’s financial statements have been prepared to comply with U.S. generally accepted accounting principles (“U.S. GAAP”). These principles require the series’ investment adviser to make estimates and assumptions that affect reported amounts and disclosures. Actual results could differ from those estimates. The funds follow the significant accounting policies described in this section, as well as the valuation policies described in the next section on valuation.
Security transactions and related investment income — Security transactions are recorded by the funds as of the date the trades are executed with brokers. Realized gains and losses from security transactions are determined based on the specific identified cost of the securities. In the event a security is purchased with a delayed payment date, the funds will segregate liquid assets sufficient to meet their payment obligations. Dividend income is recognized on the ex-dividend date and interest income is recognized on an accrual basis. Market discounts, premiums and original issue discounts on fixed-income securities are amortized daily over the expected life of the security.
Fees and expenses — The fees and expenses of the underlying funds held by the managed risk funds are not included in the fees and expenses reported for each of the managed risk funds; however, they are indirectly reflected in the valuation of each of the underlying funds. These fees are included in the net effective expense ratios that are provided as supplementary information in the Financial Highlights tables.
Class allocations — Income, fees and expenses (other than class-specific fees and expenses) and realized and unrealized gains and losses are allocated daily among the various share classes of each fund based on their relative net assets. Class-specific fees and expenses, such as distribution expenses, are accrued daily and charged directly to the respective share class of each fund.
| American Funds Insurance Series | 133 |
Dividends and distributions to shareholders — Dividends and distributions to shareholders are recorded on each fund’s ex-dividend date.
Currency translation — Assets and liabilities, including investment securities, denominated in currencies other than U.S. dollars are translated into U.S. dollars at the exchange rates supplied by one or more pricing vendors on the valuation date. Purchases and sales of investment securities and income and expenses are translated into U.S. dollars at the exchange rates on the dates of such transactions. The effects of changes in exchange rates on investment securities are included with the net realized gain or loss and net unrealized appreciation or depreciation on investments in the funds’ statements of operations. The realized gain or loss and unrealized appreciation or depreciation resulting from all other transactions denominated in currencies other than U.S. dollars are disclosed separately.
3. Valuation
CRMC, the series’ investment adviser, values the funds’ investments at fair value as defined by U.S. GAAP. The net asset value of each share class of each fund is generally determined as of approximately 4:00 p.m. New York time each day the New York Stock Exchange is open.
Methods and inputs — The series’ investment adviser uses the following methods and inputs to establish the fair value of each fund’s assets and liabilities. Use of particular methods and inputs may vary over time based on availability and relevance as market and economic conditions evolve.
Equity securities are generally valued at the official closing price of, or the last reported sale price on, the exchange or market on which such securities are traded, as of the close of business on the day the securities are being valued or, lacking any sales, at the last available bid price. Prices for each security are taken from the principal exchange or market on which the security trades. The value of an underlying fund is based on its reported net asset value.
Fixed-income securities, including short-term securities, are generally valued at prices obtained from one or more pricing vendors. Vendors value such securities based on one or more of the inputs described in the following table. The table provides examples of inputs that are commonly relevant for valuing particular classes of fixed-income securities in which the funds are authorized to invest. However, these classifications are not exclusive and any of the inputs may be used to value any other class of fixed-income security.
| Fixed-income class | Examples of standard inputs | |
| All | Benchmark yields, transactions, bids, offers, quotations from dealers and trading systems, new issues, spreads and other relationships observed in the markets among comparable securities; and proprietary pricing models such as yield measures calculated using factors such as cash flows, financial or collateral performance and other reference data (collectively referred to as “standard inputs”) | |
| Corporate bonds & notes; convertible securities | Standard inputs and underlying equity of the issuer | |
| Bonds & notes of governments & government agencies | Standard inputs and interest rate volatilities | |
| Mortgage-backed; asset-backed obligations | Standard inputs and cash flows, prepayment information, default rates, delinquency and loss assumptions, collateral characteristics, credit enhancements and specific deal information | |
| Municipal securities | Standard inputs and, for certain distressed securities, cash flows or liquidation values using a net present value calculation based on inputs that include, but are not limited to, financial statements and debt contracts |
When the series’ investment adviser deems it appropriate to do so (such as when vendor prices are unavailable or not deemed to be representative), fixed-income securities will be valued in good faith at the mean quoted bid and ask prices that are reasonably and timely available (or bid prices, if ask prices are not available) or at prices for securities of comparable maturity, quality and type.
Securities with both fixed-income and equity characteristics, or equity securities traded principally among fixed-income dealers, are generally valued in the manner described for either equity or fixed-income securities, depending on which method is deemed most appropriate by the series’ investment adviser. The Government Cash Management Fund held by the managed risk funds is managed to
| 134 | American Funds Insurance Series |
maintain a $1.00 net asset value per share. The net asset value of each share class of each managed risk fund is calculated based on the reported net asset values of the underlying funds in which each fund invests.
Forward currency contracts are valued at the mean of representative quoted bid and ask prices, generally based on prices supplied by one or more pricing vendors. Interest rate swaps are generally valued by pricing vendors based on market inputs that include the index and term of index, reset frequency, payer/receiver, currency, and pay frequency. Exchange-traded futures are generally valued at the official settlement price of, or the last reported sale price on, the exchange or market on which such instruments are traded, as of the close of business on the day the futures are being valued or, lacking any sales, at the last available bid price. Prices for each future are taken from the exchange or market on which the security trades.
Securities and other assets for which representative market quotations are not readily available or are considered unreliable by the series’ investment adviser are fair valued as determined in good faith under fair value guidelines adopted by authority of the series’ board of trustees as further described. The investment adviser follows fair valuation guidelines, consistent with U.S. Securities and Exchange Commission rules and guidance, to consider relevant principles and factors when making fair value determinations. The investment adviser considers relevant indications of value that are reasonably and timely available to it in determining the fair value to be assigned to a particular security, such as the type and cost of the security; contractual or legal restrictions on resale of the security; relevant financial or business developments of the issuer; actively traded similar or related securities; conversion or exchange rights on the security; related corporate actions; significant events occurring after the close of trading in the security; and changes in overall market conditions. In addition, the closing prices of equity securities and futures that trade in markets outside U.S. time zones may be adjusted to reflect significant events that occur after the close of local trading but before the net asset value of each share class of each fund is determined. Fair valuations and valuations of investments and futures that are not actively trading involve judgment and may differ materially from valuations that would have been used had greater market activity occurred.
Processes and structure — The series’ board of trustees has delegated authority to the series’ investment adviser to make fair value determinations, subject to board oversight. The investment adviser has established a Joint Fair Valuation Committee (the “Fair Valuation Committee”) to administer, implement and oversee the fair valuation process, and to make fair value decisions. The Fair Valuation Committee regularly reviews its own fair value decisions, as well as decisions made under its standing instructions to the investment adviser’s valuation teams. The Fair Valuation Committee reviews changes in fair value measurements from period to period and may, as deemed appropriate, update the fair valuation guidelines to better reflect the results of back testing and address new or evolving issues. The Fair Valuation Committee reports any changes to the fair valuation guidelines to the board of trustees with supplemental information to support the changes. The series’ board and audit committee also regularly review reports that describe fair value determinations and methods.
The series’ investment adviser has also established a Fixed-Income Pricing Review Group to administer and oversee the fixed-income valuation process, including the use of fixed-income pricing vendors. This group regularly reviews pricing vendor information and market data. Pricing decisions, processes and controls over security valuation are also subject to additional internal reviews, including an annual control self-evaluation program facilitated by the investment adviser’s compliance group.
Classifications — The series’ investment adviser classifies the funds’ assets and liabilities into three levels based on the inputs used to value the assets or liabilities. Level 1 values are based on quoted prices in active markets for identical securities. Level 2 values are based on significant observable market inputs, such as quoted prices for similar securities and quoted prices in inactive markets. Certain securities trading outside the U.S. may transfer between Level 1 and Level 2 due to valuation adjustments resulting from significant market movements following the close of local trading. Level 3 values are based on significant unobservable inputs that reflect the investment adviser’s determination of assumptions that market participants might reasonably use in valuing the securities. The valuation levels are not necessarily an indication of the risk or liquidity associated with the underlying investment. For example, U.S. government securities are reflected as Level 2 because the inputs used to determine fair value may not always be quoted prices in an active market. The following tables present the funds’ valuation levels as of December 31, 2014 (dollars in thousands):
| American Funds Insurance Series | 135 |
Global Growth Fund
| Investment securities | ||||||||||||||||
| Level 1 | Level 2* | Level 3 | Total | |||||||||||||
| Assets: | ||||||||||||||||
| Common stocks: | ||||||||||||||||
| Health care | $ | 739,428 | $ | 342,512 | $ | — | $ | 1,081,940 | ||||||||
| Information technology | 531,129 | 508,848 | — | 1,039,977 | ||||||||||||
| Consumer discretionary | 626,762 | 382,412 | — | 1,009,174 | ||||||||||||
| Financials | 307,413 | 476,962 | — | 784,375 | ||||||||||||
| Industrials | 216,803 | 296,120 | — | 512,923 | ||||||||||||
| Consumer staples | 93,106 | 278,738 | — | 371,844 | ||||||||||||
| Materials | 88,808 | 74,224 | — | 163,032 | ||||||||||||
| Energy | 86,063 | 63,237 | — | 149,300 | ||||||||||||
| Telecommunication services | — | 73,088 | — | 73,088 | ||||||||||||
| Utilities | — | 27,458 | — | 27,458 | ||||||||||||
| Miscellaneous | 21,531 | 25,110 | — | 46,641 | ||||||||||||
| Preferred securities | 3,641 | — | — | 3,641 | ||||||||||||
| Bonds, notes & other debt instruments | — | 35,825 | — | 35,825 | ||||||||||||
| Short-term securities | — | 257,675 | — | 257,675 | ||||||||||||
| Total | $ | 2,714,684 | $ | 2,842,209 | $ | — | $ | 5,556,893 | ||||||||
| Other investments† | ||||||||||||||||
| Level 1 | Level 2 | Level 3 | Total | |||||||||||||
| Assets: | ||||||||||||||||
| Unrealized appreciation on open forward currency contracts | $ | — | $ | 1,368 | $ | — | $ | 1,368 | ||||||||
| * | Securities with a value of $2,107,483,000, which represented 37.84% of the net assets of the fund, transferred from Level 1 to Level 2 since the prior fiscal year-end, primarily due to significant market movements following the close of local trading. |
| † | Forward currency contracts are not included in the investment portfolio. |
Global Small Capitalization Fund
| Investment securities | ||||||||||||||||
| Level 1 | Level 2* | Level 3 | Total | |||||||||||||
| Assets: | ||||||||||||||||
| Common stocks: | ||||||||||||||||
| Consumer discretionary | $ | 512,915 | $ | 321,228 | $ | 47 | $ | 834,190 | ||||||||
| Health care | 685,038 | 96,623 | — | 781,661 | ||||||||||||
| Information technology | 348,028 | 260,853 | 71 | 608,952 | ||||||||||||
| Industrials | 149,123 | 425,317 | — | 574,440 | ||||||||||||
| Financials | 142,152 | 126,217 | — | 268,369 | ||||||||||||
| Materials | 105,862 | 77,739 | — | 183,601 | ||||||||||||
| Energy | 94,667 | 75,950 | 1,690 | 172,307 | ||||||||||||
| Consumer staples | 18,575 | 117,901 | — | 136,476 | ||||||||||||
| Utilities | — | 84,304 | — | 84,304 | ||||||||||||
| Telecommunication services | 20,350 | 6,032 | — | 26,382 | ||||||||||||
| Miscellaneous | 135,430 | 69,824 | — | 205,254 | ||||||||||||
| Rights & warrants | — | 71 | 65 | 136 | ||||||||||||
| Convertible stocks | — | — | 4,961 | 4,961 | ||||||||||||
| Bonds, notes & other debt instruments | — | 10,130 | — | 10,130 | ||||||||||||
| Short-term securities | — | 271,678 | — | 271,678 | ||||||||||||
| Total | $ | 2,212,140 | $ | 1,943,867 | $ | 6,834 | $ | 4,162,841 | ||||||||
| 136 | American Funds Insurance Series |
| Other investments† | ||||||||||||||||
| Level 1 | Level 2 | Level 3 | Total | |||||||||||||
| Assets: | ||||||||||||||||
| Unrealized appreciation on open forward currency contracts | $ | — | $ | 408 | $ | — | $ | 408 | ||||||||
| Liabilities: | ||||||||||||||||
| Unrealized depreciation on open forward currency contracts | — | (1 | ) | — | (1 | ) | ||||||||||
| Total | $ | — | $ | 407 | $ | — | $ | 407 | ||||||||
| * | Securities with a value of $1,375,550,000, which represented 33.06% of the net assets of the fund, transferred from Level 1 to Level 2 since the prior fiscal year-end, primarily due to significant market movements following the close of local trading. |
| † | Forward currency contracts are not included in the investment portfolio. |
Growth Fund
| Investment securities | ||||||||||||||||
| Level 1 | Level 2* | Level 3 | Total | |||||||||||||
| Assets: | ||||||||||||||||
| Common stocks: | ||||||||||||||||
| Consumer discretionary | $ | 4,073,351 | $ | 202,852 | $ | — | $ | 4,276,203 | ||||||||
| Information technology | 3,642,301 | 632,100 | — | 4,274,401 | ||||||||||||
| Health care | 3,778,014 | 103,983 | — | 3,881,997 | ||||||||||||
| Financials | 2,778,154 | 173,445 | — | 2,951,599 | ||||||||||||
| Industrials | 1,783,878 | 309,436 | — | 2,093,314 | ||||||||||||
| Energy | 1,816,801 | 2,043 | 13,163 | 1,832,007 | ||||||||||||
| Consumer staples | 1,427,320 | 238,345 | — | 1,665,665 | ||||||||||||
| Materials | 374,714 | 119,307 | — | 494,021 | ||||||||||||
| Other | 55,518 | 27,023 | 886 | 83,427 | ||||||||||||
| Miscellaneous | 176,726 | 9,836 | — | 186,562 | ||||||||||||
| Preferred securities | 827 | — | — | 827 | ||||||||||||
| Rights & warrants | 17,417 | — | — | 17,417 | ||||||||||||
| Short-term securities | — | 1,016,435 | — | 1,016,435 | ||||||||||||
| Total | $ | 19,925,021 | $ | 2,834,805 | $ | 14,049 | $ | 22,773,875 | ||||||||
| * | Securities with a value of $1,558,297,000, which represented 6.85% of the net assets of the fund, transferred from Level 1 to Level 2 since the prior fiscal year-end, primarily due to significant market movements following the close of local trading. |
International Fund
| Investment securities | ||||||||||||||||
| Level 1 | Level 2* | Level 3 | Total | |||||||||||||
| Assets: | ||||||||||||||||
| Common stocks: | ||||||||||||||||
| Financials | $ | — | $ | 1,511,123 | $ | — | $ | 1,511,123 | ||||||||
| Consumer discretionary | 67,776 | 1,097,322 | — | 1,165,098 | ||||||||||||
| Health care | 50,008 | 1,033,404 | — | 1,083,412 | ||||||||||||
| Information technology | 266,859 | 619,031 | — | 885,890 | ||||||||||||
| Industrials | 129,505 | 719,328 | — | 848,833 | ||||||||||||
| Consumer staples | 15,749 | 431,021 | — | 446,770 | ||||||||||||
| Materials | 8,953 | 297,654 | — | 306,607 | ||||||||||||
| Utilities | — | 266,534 | — | 266,534 | ||||||||||||
| Telecommunication services | 10,388 | 218,182 | — | 228,570 | ||||||||||||
| Energy | 38,147 | 177,358 | — | 215,505 | ||||||||||||
| Miscellaneous | 10,485 | 178,247 | — | 188,732 | ||||||||||||
| Bonds, notes & other debt instruments | — | 48,290 | — | 48,290 | ||||||||||||
| Short-term securities | — | 491,917 | — | 491,917 | ||||||||||||
| Total | $ | 597,870 | $ | 7,089,411 | $ | — | $ | 7,687,281 | ||||||||
| American Funds Insurance Series | 137 |
| Other investments† | ||||||||||||||||
| Level 1 | Level 2 | Level 3 | Total | |||||||||||||
| Assets: | ||||||||||||||||
| Unrealized appreciation on open forward currency contracts | $ | — | $ | 4,101 | $ | — | $ | 4,101 | ||||||||
| * | Securities with a value of $5,787,479,000, which represented 75.05% of the net assets of the fund, transferred from Level 1 to Level 2 since the prior fiscal year-end, primarily due to significant market movements following the close of local trading. |
| † | Forward currency contracts are not included in the investment portfolio. |
New World Fund
| Investment securities | ||||||||||||||||
| Level 1 | Level 2* | Level 3 | Total | |||||||||||||
| Assets: | ||||||||||||||||
| Common stocks: | ||||||||||||||||
| Information technology | $ | 134,081 | $ | 212,030 | $ | — | $ | 346,111 | ||||||||
| Financials | 135,131 | 196,690 | 34 | 331,855 | ||||||||||||
| Consumer discretionary | 129,744 | 188,539 | — | 318,283 | ||||||||||||
| Consumer staples | 45,733 | 181,450 | — | 227,183 | ||||||||||||
| Health care | 54,634 | 121,837 | — | 176,471 | ||||||||||||
| Energy | 66,286 | 106,726 | — | 173,012 | ||||||||||||
| Industrials | 50,753 | 55,690 | — | 106,443 | ||||||||||||
| Telecommunication services | — | 71,301 | — | 71,301 | ||||||||||||
| Materials | 18,431 | 31,129 | — | 49,560 | ||||||||||||
| Utilities | 5,701 | 34,783 | — | 40,484 | ||||||||||||
| Miscellaneous | 49,592 | 65,264 | — | 114,856 | ||||||||||||
| Preferred securities | 1,083 | — | — | 1,083 | ||||||||||||
| Bonds, notes & other debt instruments: | ||||||||||||||||
| Bonds & notes of governments & government agencies outside the U.S. | — | 149,444 | — | 149,444 | ||||||||||||
| Corporate bonds & notes | — | 23,676 | — | 23,676 | ||||||||||||
| U.S. Treasury bonds & notes | — | 17,281 | — | 17,281 | ||||||||||||
| Short-term securities | — | 434,541 | — | 434,541 | ||||||||||||
| Total | $ | 691,169 | $ | 1,890,381 | $ | 34 | $ | 2,581,584 | ||||||||
| Other investments† | ||||||||||||||||
| Level 1 | Level 2 | Level 3 | Total | |||||||||||||
| Assets: | ||||||||||||||||
| Unrealized appreciation on open forward currency contracts | $ | — | $ | 685 | $ | — | $ | 685 | ||||||||
| Liabilities: | ||||||||||||||||
| Unrealized depreciation on open forward currency contracts | — | (119 | ) | — | (119 | ) | ||||||||||
| Total | $ | — | $ | 566 | $ | — | $ | 566 | ||||||||
| * | Securities with a value of $1,000,333,000, which represented 38.75% of the net assets of the fund, transferred from Level 1 to Level 2 since the prior fiscal year-end, primarily due to significant market movements following the close of local trading. |
| † | Forward currency contracts are not included in the investment portfolio. |
| 138 | American Funds Insurance Series |
Blue Chip Income and Growth Fund
| Investment securities | ||||||||||||||||
| Level 1 | Level 2 | Level 3 | Total | |||||||||||||
| Assets: | ||||||||||||||||
| Common stocks: | ||||||||||||||||
| Health care | $ | 1,206,708 | $ | — | $ | — | $ | 1,206,708 | ||||||||
| Industrials | 1,090,571 | — | — | 1,090,571 | ||||||||||||
| Information technology | 980,697 | — | — | 980,697 | ||||||||||||
| Consumer staples | 788,219 | — | — | 788,219 | ||||||||||||
| Telecommunication services | 647,494 | — | — | 647,494 | ||||||||||||
| Consumer discretionary | 581,409 | — | — | 581,409 | ||||||||||||
| Utilities | 549,315 | — | — | 549,315 | ||||||||||||
| Energy | 375,483 | — | — | 375,483 | ||||||||||||
| Materials | 216,755 | — | — | 216,755 | ||||||||||||
| Financials | 202,146 | — | — | 202,146 | ||||||||||||
| Miscellaneous | 357,685 | — | — | 357,685 | ||||||||||||
| Short-term securities | — | 255,064 | — | 255,064 | ||||||||||||
| Total | $ | 6,996,482 | $ | 255,064 | $ | — | $ | 7,251,546 | ||||||||
Global Growth and Income Fund
| Investment securities | ||||||||||||||||
| Level 1 | Level 2* | Level 3 | Total | |||||||||||||
| Assets: | ||||||||||||||||
| Common stocks: | ||||||||||||||||
| Financials | $ | 214,725 | $ | 198,543 | $ | — | $ | 413,268 | ||||||||
| Consumer discretionary | 140,482 | 93,033 | — | 233,515 | ||||||||||||
| Information technology | 116,145 | 110,012 | — | 226,157 | ||||||||||||
| Industrials | 123,783 | 101,581 | — | 225,364 | ||||||||||||
| Health care | 143,642 | 61,208 | — | 204,850 | ||||||||||||
| Telecommunication services | 17,635 | 114,714 | — | 132,349 | ||||||||||||
| Consumer staples | 52,948 | 63,008 | — | 115,956 | ||||||||||||
| Materials | 79,864 | 16,969 | — | 96,833 | ||||||||||||
| Utilities | 42,458 | 37,604 | — | 80,062 | ||||||||||||
| Energy | 42,913 | 20,828 | — | 63,741 | ||||||||||||
| Preferred securities | 458 | — | — | 458 | ||||||||||||
| Rights & warrants | 129 | — | — | 129 | ||||||||||||
| Convertible bonds | — | 1,111 | — | 1,111 | ||||||||||||
| Bonds, notes & other debt instruments | — | 14,064 | — | 14,064 | ||||||||||||
| Short-term securities | — | 66,490 | — | 66,490 | ||||||||||||
| Total | $ | 975,182 | $ | 899,165 | $ | — | $ | 1,874,347 | ||||||||
| Other investments† | ||||||||||||||||
| Level 1 | Level 2 | Level 3 | Total | |||||||||||||
| Assets: | ||||||||||||||||
| Unrealized appreciation on open forward currency contracts | $ | — | $ | 1,264 | $ | — | $ | 1,264 | ||||||||
| * | Securities with a value of $662,693,000, which represented 35.13% of the net assets of the fund, transferred from Level 1 to Level 2 since the prior fiscal year-end, primarily due to significant market movements following the close of local trading. |
| † | Forward currency contracts are not included in the investment portfolio. |
| American Funds Insurance Series | 139 |
Growth-Income Fund
| Investment securities | ||||||||||||||||
| Level 1 | Level 2* | Level 3 | Total | |||||||||||||
| Assets: | ||||||||||||||||
| Common stocks: | ||||||||||||||||
| Health care | $ | 4,257,763 | $ | 136,487 | $ | — | $ | 4,394,250 | ||||||||
| Information technology | 4,022,522 | 145,534 | — | 4,168,056 | ||||||||||||
| Consumer discretionary | 2,801,117 | 504,037 | — | 3,305,154 | ||||||||||||
| Industrials | 2,195,585 | 216,495 | — | 2,412,080 | ||||||||||||
| Financials | 1,827,601 | 169,224 | — | 1,996,825 | ||||||||||||
| Materials | 1,599,620 | 123,904 | — | 1,723,524 | ||||||||||||
| Energy | 1,468,850 | 217,641 | — | 1,686,491 | ||||||||||||
| Consumer staples | 1,391,547 | 236,056 | — | 1,627,603 | ||||||||||||
| Telecommunication services | 408,654 | — | — | 408,654 | ||||||||||||
| Utilities | 245,965 | — | — | 245,965 | ||||||||||||
| Miscellaneous | 1,175,943 | 89,395 | — | 1,265,338 | ||||||||||||
| Rights & warrants | 3,633 | — | — | 3,633 | ||||||||||||
| Convertible stocks | — | 9,007 | — | 9,007 | ||||||||||||
| Convertible bonds | — | 30,961 | — | 30,961 | ||||||||||||
| Bonds, notes & other debt instruments | — | 42,617 | — | 42,617 | ||||||||||||
| Short-term securities | — | 2,056,142 | — | 2,056,142 | ||||||||||||
| Total | $ | 21,398,800 | $ | 3,977,500 | $ | — | $ | 25,376,300 | ||||||||
| * | Securities with a value of $1,209,046,000, which represented 4.77% of the net assets of the fund, transferred from Level 1 to Level 2 since the prior fiscal year-end, primarily due to significant market movements following the close of local trading. |
International Growth and Income Fund
| Investment securities | ||||||||||||||||
| Level 1 | Level 2* | Level 3 | Total | |||||||||||||
| Assets: | ||||||||||||||||
| Common stocks: | ||||||||||||||||
| Financials | $ | 14,644 | $ | 221,570 | $ | — | $ | 236,214 | ||||||||
| Utilities | — | 128,528 | — | 128,528 | ||||||||||||
| Consumer discretionary | 3,716 | 120,254 | — | 123,970 | ||||||||||||
| Consumer staples | 28,345 | 80,659 | — | 109,004 | ||||||||||||
| Health care | — | 106,859 | — | 106,859 | ||||||||||||
| Industrials | 7,555 | 71,399 | — | 78,954 | ||||||||||||
| Energy | 17,440 | 27,691 | — | 45,131 | ||||||||||||
| Materials | 3,116 | 28,998 | — | 32,114 | ||||||||||||
| Telecommunication services | 2,603 | 29,171 | — | 31,774 | ||||||||||||
| Information technology | 6,522 | 8,931 | — | 15,453 | ||||||||||||
| Rights & warrants | — | 61 | — | 61 | ||||||||||||
| Convertible bonds | — | 2,556 | — | 2,556 | ||||||||||||
| Bonds, notes & other debt instruments | — | 9,256 | — | 9,256 | ||||||||||||
| Short-term securities | — | 84,595 | — | 84,595 | ||||||||||||
| Total | $ | 83,941 | $ | 920,528 | $ | — | $ | 1,004,469 | ||||||||
| * | Securities with a value of $617,618,000, which represented 61.26% of the net assets of the fund, transferred from Level 1 to Level 2 since the prior fiscal year-end, primarily due to significant market movements following the close of local trading. |
| 140 | American Funds Insurance Series |
Capital Income Builder
| Investment securities | ||||||||||||||||
| Level 1 | Level 2 | Level 3 | Total | |||||||||||||
| Assets: | ||||||||||||||||
| Common stocks: | ||||||||||||||||
| Consumer staples | $ | 7,023 | $ | 2,670 | $ | — | $ | 9,693 | ||||||||
| Financials | 3,307 | 5,253 | — | 8,560 | ||||||||||||
| Health care | 3,668 | 4,214 | — | 7,882 | ||||||||||||
| Utilities | 706 | 6,403 | — | 7,109 | ||||||||||||
| Telecommunication services | 2,784 | 4,290 | — | 7,074 | ||||||||||||
| Consumer discretionary | 1,136 | 3,948 | — | 5,084 | ||||||||||||
| Energy | 3,459 | 1,580 | — | 5,039 | ||||||||||||
| Information technology | 3,922 | 838 | — | 4,760 | ||||||||||||
| Industrials | 1,662 | 1,418 | — | 3,080 | ||||||||||||
| Materials | 1,201 | 1,154 | — | 2,355 | ||||||||||||
| Miscellaneous | — | 477 | — | 477 | ||||||||||||
| Bonds, notes & other debt instruments | — | 11,673 | — | 11,673 | ||||||||||||
| Short-term securities | — | 2,100 | — | 2,100 | ||||||||||||
| Total | $ | 28,868 | $ | 46,018 | $ | — | $ | 74,886 | ||||||||
Asset Allocation Fund
| Investment securities | ||||||||||||||||
| Level 1 | Level 2 | Level 3 | Total | |||||||||||||
| Assets: | ||||||||||||||||
| Common stocks: | ||||||||||||||||
| Information technology | $ | 1,850,376 | $ | 100,971 | $ | — | $ | 1,951,347 | ||||||||
| Consumer discretionary | 1,881,061 | 18,025 | — | 1,899,086 | ||||||||||||
| Financials | 1,757,560 | — | — | 1,757,560 | ||||||||||||
| Industrials | 1,385,692 | 19,578 | 1 | 1,405,271 | ||||||||||||
| Health care | 1,182,825 | 94,864 | 3,106 | 1,280,795 | ||||||||||||
| Energy | 1,262,869 | — | — | 1,262,869 | ||||||||||||
| Materials | 848,790 | 1,043 | — | 849,833 | ||||||||||||
| Consumer staples | 715,693 | 96,025 | — | 811,718 | ||||||||||||
| Other | 169,946 | — | — | 169,946 | ||||||||||||
| Miscellaneous | 420,917 | 39,683 | — | 460,600 | ||||||||||||
| Convertible stocks | — | 10,915 | — | 10,915 | ||||||||||||
| Bonds, notes & other debt instruments: | ||||||||||||||||
| U.S. Treasury bonds & notes | — | 1,924,223 | — | 1,924,223 | ||||||||||||
| Corporate bonds & notes | — | 1,354,535 | 10,872 | 1,365,407 | ||||||||||||
| Mortgage-backed obligations | — | 724,971 | — | 724,971 | ||||||||||||
| Federal agency bonds & notes | — | 275,707 | — | 275,707 | ||||||||||||
| Other | — | 99,674 | — | 99,674 | ||||||||||||
| Short-term securities | — | 1,691,483 | — | 1,691,483 | ||||||||||||
| Total | $ | 11,475,729 | $ | 6,451,697 | $ | 13,979 | $ | 17,941,405 | ||||||||
| Other investments* | ||||||||||||||||
| Level 1 | Level 2 | Level 3 | Total | |||||||||||||
| Assets: | ||||||||||||||||
| Unrealized appreciation on interest rate swaps | $ | — | $ | 778 | $ | — | $ | 778 | ||||||||
| Liabilities: | ||||||||||||||||
| Unrealized depreciation on interest rate swaps | — | (9,905 | ) | — | (9,905 | ) | ||||||||||
| Total | $ | — | $ | (9,127 | ) | $ | — | $ | (9,127 | ) | ||||||
| * | Interest rate swaps are not included in the investment portfolio. |
| American Funds Insurance Series | 141 |
Global Balanced Fund
| Investment securities | ||||||||||||||||
| Level 1 | Level 2* | Level 3 | Total | |||||||||||||
| Assets: | ||||||||||||||||
| Common stocks: | ||||||||||||||||
| Industrials | $ | 9,981 | $ | 12,535 | $ | — | $ | 22,516 | ||||||||
| Financials | 3,944 | 17,108 | — | 21,052 | ||||||||||||
| Consumer staples | 8,087 | 10,138 | — | 18,225 | ||||||||||||
| Information technology | 8,066 | 9,507 | — | 17,573 | ||||||||||||
| Health care | 8,027 | 5,840 | — | 13,867 | ||||||||||||
| Consumer discretionary | 9,370 | 4,393 | — | 13,763 | ||||||||||||
| Energy | 4,859 | 2,447 | — | 7,306 | ||||||||||||
| Materials | 5,855 | 1,035 | — | 6,890 | ||||||||||||
| Telecommunication services | 648 | 2,403 | — | 3,051 | ||||||||||||
| Utilities | — | 2,417 | — | 2,417 | ||||||||||||
| Miscellaneous | 2,412 | 1,967 | — | 4,379 | ||||||||||||
| Preferred securities | 166 | — | — | 166 | ||||||||||||
| Convertible bonds | — | 873 | — | 873 | ||||||||||||
| Bonds, notes & other debt instruments | — | 65,536 | — | 65,536 | ||||||||||||
| Short-term securities | — | 22,700 | — | 22,700 | ||||||||||||
| Total | $ | 61,415 | $ | 158,899 | $ | — | $ | 220,314 | ||||||||
Other investments† | ||||||||||||||||
| Level 1 | Level 2 | Level 3 | Total | |||||||||||||
| Assets: | ||||||||||||||||
| Unrealized appreciation on open forward currency contracts | $ | — | $ | 137 | $ | — | $ | 137 | ||||||||
| Liabilities: | ||||||||||||||||
| Unrealized depreciation on open forward currency contracts | — | (57 | ) | — | (57 | ) | ||||||||||
| Total | $ | — | $ | 80 | $ | — | $ | 80 | ||||||||
| * | Securities with a value of $56,422,000, which represented 26.15% of the net assets of the fund, transferred from Level 1 to Level 2 since the prior fiscal year-end, primarily due to significant market movements following the close of local trading. |
| † | Forward currency contracts are not included in the investment portfolio. |
Bond Fund
| Investment securities | ||||||||||||||||
| Level 1 | Level 2 | Level 3 | Total | |||||||||||||
| Assets: | ||||||||||||||||
| Bonds, notes & other debt instruments: | ||||||||||||||||
| U.S. Treasury bonds & notes | $ | — | $ | 3,617,605 | $ | — | $ | 3,617,605 | ||||||||
| Corporate bonds & notes | — | 2,859,035 | 103 | 2,859,138 | ||||||||||||
| Mortgage-backed obligations | — | 2,053,347 | — | 2,053,347 | ||||||||||||
| Other | — | 632,729 | — | 632,729 | ||||||||||||
| Convertible bonds | — | 1,311 | — | 1,311 | ||||||||||||
| Preferred securities | 2,286 | — | — | 2,286 | ||||||||||||
| Common stocks | 6 | — | — | 6 | ||||||||||||
| Short-term securities | — | 1,646,261 | — | 1,646,261 | ||||||||||||
| Total | $ | 2,292 | $ | 10,810,288 | $ | 103 | $ | 10,812,683 | ||||||||
| Other investments* | ||||||||||||||||
| Level 1 | Level 2 | Level 3 | Total | |||||||||||||
| Assets: | ||||||||||||||||
| Unrealized appreciation on forward currency contracts | $ | — | $ | 4,862 | $ | — | $ | 4,862 | ||||||||
| Unrealized appreciation on interest rate swaps | — | 9,726 | — | 9,726 | ||||||||||||
| Liabilities: | ||||||||||||||||
| Unrealized depreciation on interest rate swaps | — | (17,187 | ) | — | (17,187 | ) | ||||||||||
| Total | $ | — | $ | (2,599 | ) | $ | — | $ | (2,599 | ) | ||||||
| * | Forward currency contracts and interest rate swaps are not included in the investment portfolio. |
| 142 | American Funds Insurance Series |
Global Bond Fund
| Investment securities | ||||||||||||||||
| Level 1 | Level 2 | Level 3 | Total | |||||||||||||
| Assets: | ||||||||||||||||
| Bonds, notes & other debt instruments: | ||||||||||||||||
| Euros | $ | — | $ | 584,308 | $ | — | $ | 584,308 | ||||||||
| British pounds | — | 135,822 | — | 135,822 | ||||||||||||
| Mexican pesos | — | 81,519 | — | 81,519 | ||||||||||||
| Japanese yen | — | 65,446 | — | 65,446 | ||||||||||||
| Indian rupees | — | 47,363 | — | 47,363 | ||||||||||||
| Polish zloty | — | 45,973 | — | 45,973 | ||||||||||||
| Hungarian forints | — | 40,631 | — | 40,631 | ||||||||||||
| Norwegian kroner | — | 36,498 | — | 36,498 | ||||||||||||
| Colombian pesos | — | 29,455 | — | 29,455 | ||||||||||||
| U.S. dollars | — | 1,366,659 | 7 | 1,366,666 | ||||||||||||
| Other | — | 75,018 | — | 75,018 | ||||||||||||
| Convertible stocks | — | 357 | — | 357 | ||||||||||||
| Common stocks | — | 334 | — | 334 | ||||||||||||
| Short-term securities | — | 152,090 | — | 152,090 | ||||||||||||
| Total | $ | — | $ | 2,661,473 | $ | 7 | $ | 2,661,480 | ||||||||
| Other investments* | ||||||||||||||||
| Level 1 | Level 2 | Level 3 | Total | |||||||||||||
| Assets: | ||||||||||||||||
| Unrealized appreciation on forward currency contracts | $ | — | $ | 7,983 | $ | — | $ | 7,983 | ||||||||
| Unrealized appreciation on interest rate swaps | — | 272 | — | 272 | ||||||||||||
| Liabilities: | ||||||||||||||||
| Unrealized depreciation on forward currency contracts | — | (7,148 | ) | — | (7,148 | ) | ||||||||||
| Unrealized depreciation on interest rate swaps | — | (447 | ) | — | (447 | ) | ||||||||||
| Total | $ | — | $ | 660 | $ | — | $ | 660 | ||||||||
| * | Forward currency contracts and interest rate swaps are not included in the investment portfolio. |
High-Income Bond Fund
| Investment securities | ||||||||||||||||
| Level 1 | Level 2 | Level 3 | Total | |||||||||||||
| Assets: | ||||||||||||||||
| Bonds, notes & other debt instruments: | ||||||||||||||||
| Corporate bonds & notes | $ | — | $ | 1,684,551 | $ | 10,552 | $ | 1,695,103 | ||||||||
| Other | — | 53,008 | — | 53,008 | ||||||||||||
| Convertible bonds | — | 5,888 | — | 5,888 | ||||||||||||
| Convertible stocks | 13,440 | 6,502 | — | 19,942 | ||||||||||||
| Preferred securities | 798 | — | — | 798 | ||||||||||||
| Common stocks | 6,410 | 5,834 | 3,563 | 15,807 | ||||||||||||
| Short-term securities | — | 103,182 | — | 103,182 | ||||||||||||
| Total | $ | 20,648 | $ | 1,858,965 | $ | 14,115 | $ | 1,893,728 | ||||||||
| Other investments* | ||||||||||||||||
| Level 1 | Level 2 | Level 3 | Total | |||||||||||||
| Assets: | ||||||||||||||||
| Unrealized appreciation on open forward currency contracts | $ | — | $ | 234 | $ | — | $ | 234 | ||||||||
| * | Forward currency contracts are not included in the investment portfolio. |
Mortgage Fund
At December 31, 2014, all of the fund’s investments were classified as Level 2.
U.S. Government/AAA-Rated Securities Fund
At December 31, 2014, all of the fund’s investments were classified as Level 2.
| American Funds Insurance Series | 143 |
Cash Management Fund
At December 31, 2014, all of the fund’s investment securities were classified as Level 2.
Managed Risk Growth Fund
At December 31, 2014, all of the fund’s investments were classified as Level 1.
Managed Risk International Fund
At December 31, 2014, all of the fund’s investments were classified as Level 1.
Managed Risk Blue Chip Income and Growth Fund
At December 31, 2014, all of the fund’s investments were classified as Level 1.
Managed Risk Growth-Income Fund
At December 31, 2014, all of the fund’s investments were classified as Level 1.
Managed Risk Asset Allocation Fund
At December 31, 2014, all of the fund’s investments were classified as Level 1.
4. Risk factors
Investing in the funds may involve certain risks including, but not limited to, those described below.
Market conditions — The prices of, and the income generated by, the common stocks, bonds and other securities held by a fund may decline – sometimes rapidly or unpredictably – due to various factors, including events or conditions affecting the general economy or particular industries; overall market changes; local, regional or global political, social or economic instability; governmental or governmental agency responses to economic conditions; and currency exchange, interest rate and commodity price fluctuations.
Issuer risks — The prices of, and the income generated by, securities held by a fund may decline in response to various factors directly related to the issuers of such securities, including reduced demand for an issuer’s goods or services, poor management performance and strategic initiatives such as mergers, acquisitions or dispositions and the market response to any such initiatives.
Investing in growth-oriented stocks — Growth-oriented common stocks and other equity-type securities (such as preferred stocks, convertible preferred stocks and convertible bonds) may involve larger price swings and greater potential for loss than other types of investments. These risks may be even greater in the case of smaller capitalization stocks.
Investing in income-oriented stocks — Income provided by a fund may be reduced by changes in the dividend policies of, and the capital resources available at, the companies in which the fund invests.
Investing in small companies — Investing in smaller companies may pose additional risks. For example, it is often more difficult to value or dispose of small company stocks and more difficult to obtain information about smaller companies than about larger companies. Furthermore, smaller companies often have limited product lines, operating histories, markets and/or financial resources, may be dependent on one or a few key persons for management, and can be more susceptible to losses. Moreover, the prices of their stocks maybe more volatile than stocks of larger, more established companies.
Investing outside the U.S. — Securities of issuers domiciled outside the U.S., or with significant operations or revenues outside the U.S., may lose value because of adverse political, social, economic or market developments (including social instability, regional conflicts, terrorism and war) in the countries or regions in which the issuers operate or generate revenue. These securities may also lose value due to changes in foreign currency exchange rates against the U.S. dollar and/or currencies of other countries. Issuers of these securities may be more susceptible to actions of foreign governments, such as the imposition of price controls or punitive taxes, that could adversely impact revenues. Securities markets in certain countries may be more volatile and/or less liquid than those in the U.S. Investments outside the U.S. may also be subject to different accounting practices and different regulatory, legal and reporting standards and practices, and may be more difficult to value, than those in the U.S. In addition, the value of investments outside the U.S. may be reduced by foreign taxes, including foreign withholding taxes on interest and dividends. Further, there may be increased risks
| 144 | American Funds Insurance Series |
of delayed settlement of securities purchased or sold by the fund. The risks of investing outside the U.S. may be heightened in connection with investments in emerging markets.
Investing in emerging markets — Investing in emerging markets may involve risks in addition to and greater than those generally associated with investing in the securities markets of developed countries. For instance, developing countries may have less developed legal and accounting systems than those in developed countries. The governments of these countries may be less stable and more likely to impose capital controls, nationalize a company or industry, place restrictions on foreign ownership and on withdrawing sale proceeds of securities from the country, and/or impose punitive taxes that could adversely affect the prices of securities. In addition, the economies of these countries may be dependent on relatively few industries that are more susceptible to local and global changes. Securities markets in these countries can also be relatively small and have substantially lower trading volumes. As a result, securities issued in these countries may be more volatile and less liquid, and may be more difficult to value, than securities issued in countries with more developed economies and/or markets. Less certainty with respect to security valuations may lead to additional challenges and risks in calculating a fund’s net asset value. Additionally, there may be increased settlement risks for transactions in local securities.
Investing in debt instruments — The prices of, and the income generated by, bonds and other debt securities held by a fund may be affected by changing interest rates and by changes in the effective maturities and credit ratings of these securities. Rising interest rates will generally cause the prices of bonds and other debt securities to fall. Falling interest rates may cause an issuer to redeem, call or refinance a debt security before its stated maturity, which may result in a fund having to reinvest the proceeds in lower yielding securities. Longer maturity debt securities generally have greater sensitivity to changes in interest rates and may be subject to greater price fluctuations than shorter maturity debt securities.
Bonds and other debt securities are subject to credit risk, which is the possibility that the credit strength of an issuer will weaken and/or an issuer of a debt security will fail to make timely payments of principal or interest and the security will go into default. Lower quality debt securities generally have higher rates of interest and may be subject to greater price fluctuations than higher quality debt securities. Credit risk is gauged, in part, by the credit ratings of the debt securities in which a fund invests. However, ratings are only the opinions of the rating agencies issuing them and are not guarantees as to credit quality or an evaluation of market risk. The funds’ investment adviser relies on its own credit analysts to research issuers and issues in seeking to mitigate various credit and default risks.
Investing in lower rated debt instruments — Lower rated bonds and other lower rated debt securities generally have higher rates of interest and involve greater risk of default or price declines due to changes in the issuer’s creditworthiness than those of higher quality debt securities. The market prices of these securities may fluctuate more than the prices of higher quality debt securities and may decline significantly in periods of general economic difficulty. These risks may be increased with respect to investments in junk bonds, or bonds rated Ba1 or BB+ or below by Nationally Recognized Statistical Rating Organizations.
Thinly traded securities — There may be little trading in the secondary market for particular bonds or other debt securities, which may make them more difficult to value, acquire or sell.
Currency — The prices of, and the income generated by, most debt securities held by a fund may also be affected by changes in relative currency values. If the U.S. dollar appreciates against foreign currencies, the value in U.S. dollars of a fund’s securities denominated in such currencies would generally fall and vice versa. U.S. dollar-denominated securities of foreign issuers may also be affected by changes in relative currency values.
Investing in mortgage-related securities and other asset-backed securities — Mortgage-related securities, such as mortgage-backed securities, and other asset-backed securities, include debt obligations that represent interests in pools of mortgages or other income-bearing assets, such as consumer loans or receivables. Such securities often involve risks that are different from or more acute than the risks associated with investing in other types of debt securities. Mortgage-backed and other asset-backed securities are subject to changes in the payment patterns of borrowers of the underlying debt. When interest rates fall, borrowers are more likely to refinance or prepay their debt before its stated maturity. This may result in a fund having to reinvest the proceeds in lower yielding securities, effectively reducing a fund’s income. Conversely, if interest rates rise and borrowers repay their debt more slowly than expected, the time in which the mortgage-backed and other asset-backed securities are paid off could be extended, reducing a fund’s cash available for reinvestment in higher yielding securities.
Investing in future delivery contracts — Contracts for future delivery of mortgage-related securities, such as to be announced contracts and mortgage dollar rolls, involve a fund selling mortgage-related securities and simultaneously contracting to repurchase similar securities for delivery at a future date at a predetermined price. This can increase a fund’s market exposure, and the market price of the securities the fund contracts to repurchase could drop below their purchase price. While a fund can preserve capital and generate
| American Funds Insurance Series | 145 |
gains through the use of such contracts by, for example, realizing the difference between the sale price and the future purchase price, the income generated by the fund may be reduced by engaging in such transactions. In addition, these transactions may increase the turnover rate of a fund.
Investing in interest rate swaps — The use of interest rate swaps involves the risk that the investment adviser will not accurately predict anticipated changes in interest rates, which may result in losses to a fund. Interest rate swaps also involve the possible failure of a counterparty to perform in accordance with the terms of the swap agreement. If a counterparty defaults on its obligations under a swap agreement, a fund may lose any amount it expected to receive from the counterparty, potentially including amounts in excess of a fund’s initial investment.
Investing in inflation linked bonds — The values of inflation linked bonds generally fluctuate in response to changes in real interest rates – i.e., rates of interest after factoring in inflation. A rise in real interest rates may cause the prices of inflation linked securities to fall, while a decline in real interest rates may cause the prices to increase. Inflation linked bonds may experience greater losses than other debt securities with similar durations when real interest rates rise faster than nominal interest rates. There can be no assurance that the value of an inflation linked security will be directly correlated to changes in interest rates; for example, if interest rates rise for reasons other than inflation, the increase may not be reflected in the security’s inflation measure.
Investing in inflation linked bonds may also reduce a fund’s distributable income during periods of extreme deflation. If prices for goods and services decline throughout the economy, the principal and income on inflation linked securities may decline and result in losses to a fund.
Investing in securities backed by the U.S. government — Securities backed by the U.S. Treasury or the full faith and credit of the U.S. government are guaranteed only as to the timely payment of interest and principal when held to maturity. Accordingly, the current market values for these securities will fluctuate with changes in interest rates. Securities issued by government-sponsored entities and federal agencies and instrumentalities that are not backed by the full faith and credit of the U.S. government are neither issued nor guaranteed by the U.S. government.
Investing in money market securities — The values and liquidity of the securities held by a fund may be affected by changing interest rates, changes in the credit quality of the issuers, changes in credit ratings of the securities and general market conditions. For example, the values of these securities may decline when interest rates rise and increase when interest rates fall.
Low interest rate environment — During periods of extremely low short-term interest rates, a fund may not be able to maintain a positive yield.
Credit and liquidity support — Changes in the credit quality of banks and financial institutions providing credit and liquidity support features with respect to securities held by a fund could cause the values of these securities to decline.
Asset allocation — A fund’s percentage allocation to equity securities, debt securities and money market instruments could cause the fund to underperform relative to relevant benchmarks and other funds with similar investment objectives.
Nondiversification — As nondiversified funds, certain funds have the ability to invest a larger percentage of their assets in the securities of a smaller number of issuers than diversified funds. Although the funds do not intend to limit their investments to the securities of a small number of issuers, if they were to do so, poor performance by a single large holding would adversely impact the funds’ investment results more than if the funds were invested in a larger number of issuers.
Management — The investment adviser to the funds actively manages the funds’ investments. Consequently, the funds are subject to the risk that the methods and analyses employed by the investment adviser in this process may not produce the desired results. This could cause the funds to lose value or their investment results to lag relevant benchmarks or other funds with similar objectives.
Investing in the managed risk funds may involve additional risks including, but not limited to, those described below.
Fund structure — The managed risk funds invest in underlying funds and incur expenses related to those underlying funds. In addition, investors in the managed risk funds will incur fees to pay for certain expenses related to the operations of the managed risk funds. An investor holding the underlying fund directly would incur lower overall expenses but would not receive the benefit of the risk management strategy of the managed risk fund.
| 146 | American Funds Insurance Series |
Management — The managed risk funds are subject to the risk that the methods employed by the subadviser in implementing the managed risk strategy may not produce the desired results. This could cause the managed risk funds to lose value or their investment results to lag relevant benchmarks or other funds with similar objectives.
Underlying fund risks — Because the managed risk funds’ investments consist of individual underlying funds, the managed risk funds’ risks are directly related to the risks of the respective underlying fund in which each managed fund invests. For this reason, it is important to understand the risks associated with investing both in the managed risk fund and the respective underlying fund.
Futures — A futures contract is considered a derivative because it derives its value from the price of the underlying security or financial index. The prices of futures contracts can be volatile, and futures contracts may be illiquid.
Hedging — Futures contracts may not provide an effective hedge of the underlying securities because changes in the prices of futures contracts may not track those of the securities they are intended to hedge. In addition, the risk management strategy may not effectively protect the managed risk funds from market declines and will limit the managed risk funds’ participation in market gains. The use of the risk management strategy could cause a managed risk fund to underperform as compared to the underlying fund in certain rising market conditions.
Short positions — Losses from short positions in futures contracts occur when the underlying index increases in value. As the underlying index increases in value, the holder of the short position in the corresponding futures contract is required to pay the difference in value of the futures contract resulting from the increase in the index on a daily basis. Losses from a short position in an index futures contract could potentially be very large if the value of the underlying index rises dramatically in a short period of time.
5. Certain investment techniques
Index-linked bonds — Some of the funds have invested in index-linked bonds, which are fixed-income securities whose principal value is periodically adjusted to a government price index. Over the life of an index-linked bond, interest is paid on the adjusted principal value. Increases or decreases in the principal value of index-linked bonds are recorded as interest income in the fund’s statement of operations.
Mortgage dollar rolls — Some of the funds have entered into mortgage dollar roll transactions in which the fund sells a mortgage-backed security to a counterparty and simultaneously enters into an agreement with the same counterparty to buy back a similar security on a specific future date at a predetermined price. Mortgage dollar rolls are accounted for as purchase and sale transactions, which may increase the funds’ portfolio turnover rates.
Loan transactions — Some of the funds have entered into loan transactions in which the fund acquires a loan either through an agent, by assignment from another holder, or as a participation interest in another holder’s portion of a loan. The loan is often administered by a financial institution that acts as agent for the holders of the loan, and the fund may be required to receive approval from the agent and/or borrower prior to the sale of the investment. The loan’s interest rate and maturity date may change based on the terms of the loan, including potential early payments of principal.
Short-term securities — The managed risk funds hold shares of the Government Cash Management Fund, a cash management vehicle offered by Bank of New York Mellon (“BNY Mellon”), the funds’ custodian bank. The Government Cash Management Fund is managed by the Dreyfus Corporation.
Forward currency contracts — Some of the funds have entered into forward currency contracts, which represent agreements to exchange currencies on specific future dates at predetermined rates. The series’ investment adviser uses forward currency contracts to manage the fund’s exposure to changes in exchange rates. Upon entering into these contracts, risks may arise from the potential inability of counterparties to meet the terms of their contracts and from possible movements in exchange rates.
On a daily basis, the series’ investment adviser values forward currency contracts based on the applicable exchange rates and records unrealized appreciation or depreciation for open forward currency contracts in each fund’s statement of assets and liabilities. Realized gains or losses are recorded at the time the forward contract is closed or offset by another contract with the same broker for the same settlement date and currency. Closed forward currency contracts that have not reached their settlement date are included in the respective receivables or payables for closed forward currency contracts in each fund’s statement of assets and liabilities. Net realized gains or losses from closed forward currency contracts and net unrealized appreciation or depreciation from open forward currency
| American Funds Insurance Series | 147 |
contracts are recorded in each fund’s statement of operations. As of December 31, 2014, Global Growth Fund, Global Small Capitalization Fund, International Fund, New World Fund, Global Growth and Income Fund, Global Balanced Fund, Bond Fund, Global Bond Fund and High-Income Bond Fund had open forward currency contracts.
Interest rate swaps — Some of the funds have entered into interest rate swaps, which are agreements to exchange one stream of future interest payments for another based on a specified notional amount. Typically, interest rate swaps exchange a fixed interest rate for a payment that floats relative to a benchmark or vice versa. The series’ investment adviser uses interest rate swaps to manage the interest rate sensitivity of the fund by increasing or decreasing the duration of the fund or a portion of the fund’s portfolio. Risks may arise as a result of the series’ investment adviser incorrectly anticipating changes in interest rates, increased volatility, reduced liquidity and the potential inability of counterparties to meet the terms of their agreements.
Upon entering into an interest rate swap contract, the fund is required to deposit cash, U.S. government securities or other liquid securities, which is known as “initial margin.” Generally, the initial margin required for a particular interest rate swap is set and held as collateral by the clearinghouse on which the contract is cleared. The amount of initial margin required may be significantly modified from time to time by the clearinghouse during the term of the contract.
On a daily basis, the series’ investment adviser records daily interest accruals related to the exchange of future payments as a receivable and payable in each fund’s statement of assets and liabilities. Each fund also pays or receives a “variation margin” based on the increase or decrease in the value of the interest rate swaps, including accrued interest, and records variation margin on interest rate swaps in the statement of assets and liabilities. Each fund records realized gains and losses on both the net accrued interest and any gain or loss recognized at the time the interest rate swap is closed or expires. Net realized gains or losses, as well as any net unrealized appreciation or depreciation, from interest rate swaps are recorded in each fund’s statement of operations. As of December 31, 2014, Asset Allocation Fund, Bond Fund, Global Bond Fund, Mortgage Fund and U.S. Government/AAA-Rated Securities Fund had open interest rate swaps.
Futures contracts — The managed risk funds have entered into futures contracts, which provide for the future sale by one party and purchase by another party of a specified amount of a specific financial instrument for a specified price, date, time and place designated at the time the contract is made. Futures contracts are used to strategically manage portfolio volatility and downside equity risk.
Upon entering into futures contracts, and to maintain the fund’s open positions in futures contracts, the fund is required to deposit with a futures broker, or futures commission merchant (“FCM”), in a segregated account in the name of the FCM an amount of cash, U.S. government securities, suitable money market instruments, or other liquid securities, known as “initial margin.” The margin required for a particular futures contract is set by the exchange on which the contract is traded to serve as collateral, and may be significantly modified from time to time by the exchange during the term of the contract. When initial margin is deposited with brokers, a receivable is recorded in the fund’s statement of assets and liabilities.
On a daily basis, each fund pays or receives “variation margin” based on the increase or decrease in the value of the futures contracts and records variation margin on futures contracts in the statement of assets and liabilities. In addition, each fund segregates liquid assets equivalent to the fund’s outstanding obligations under the contract in excess of the initial margin and variation margin, if any. Futures contracts may involve a risk of loss in excess of the variation margin shown on each fund’s statement of assets and liabilities. Each fund records realized gains or losses at the time the futures contract is closed or expires. Net realized gains or losses and net unrealized appreciation or depreciation from futures contracts are recorded in each fund’s statement of operations. As of December 31, 2014, Managed Risk Asset Allocation Fund did not hold any futures contracts.
| 148 | American Funds Insurance Series |
The following tables present the financial statement impacts resulting from the funds’ use of forward currency contracts, interest rate swaps and/or futures contracts as of December 31, 2014 (dollars in thousands):
| Global Growth Fund | Global Small Capitalization Fund | International Fund | New World Fund | Global Growth and Income Fund | |||||||||||||||||||
| Assets | Location on statements of assets and liabilties | ||||||||||||||||||||||
| Forward currency | Unrealized appreciation on open forward currency contracts | $ | 1,368 | $ | 408 | $ | 4,101 | $ | 685 | $ | 1,264 | ||||||||||||
| Forward currency | Receivables for closed forward currency contracts | — | — | — | 27 | — | |||||||||||||||||
| Futures contracts | Deposits at brokers for futures contracts | — | — | — | — | — | |||||||||||||||||
| Interest rate swaps | Variation margin for interest rate swaps | — | — | — | — | — | |||||||||||||||||
| Futures contracts | Variation margin on futures contracts | — | — | — | — | — | |||||||||||||||||
| $ | 1,368 | $ | 408 | $ | 4,101 | $ | 712 | $ | 1,264 | ||||||||||||||
| Liabilities | Location on statements of assets and liabilities | ||||||||||||||||||||||
| Forward currency | Unrealized depreciation on open forward currency contracts | $ | — | $ | 1 | $ | — | $ | 119 | $ | — | ||||||||||||
| Forward currency | Payables for closed forward currency contracts | — | — | — | — | — | |||||||||||||||||
| Interest rate swaps | Variation margin on interest rate swaps | — | — | — | — | — | |||||||||||||||||
| Futures contracts | Variation margin on futures contracts | — | — | — | — | — | |||||||||||||||||
| $ | — | $ | 1 | $ | — | $ | 119 | $ | — | ||||||||||||||
| Net realized gain | Location on statements of operations | ||||||||||||||||||||||
| Forward currency | Net realized gain on forward currency contracts | $ | 20,528 | $ | 1,123 | $ | 21,865 | $ | 4,004 | $ | 828 | ||||||||||||
| Interest rate swaps | Net realized gain on interest rate swaps | — | — | — | — | — | |||||||||||||||||
| Futures contracts | Net realized gain on futures contracts | — | — | — | — | — | |||||||||||||||||
| $ | 20,528 | $ | 1,123 | $ | 21,865 | $ | 4,004 | $ | 828 | ||||||||||||||
| Net unrealized (depreciation) appreciation | Location on statements of operations | ||||||||||||||||||||||
| Forward currency | Net unrealized depreciation on forward currency contracts | $ | (3,902 | ) | $ | (53 | ) | $ | (839 | ) | $ | (274 | ) | $ | 1,206 | ||||||||
| Interest rate swaps | Net unrealized appreciation on interest rate swaps | — | — | — | — | — | |||||||||||||||||
| Futures contracts | Net unrealized appreciation on futures contracts | — | — | — | — | — | |||||||||||||||||
| $ | (3,902 | ) | $ | (53 | ) | $ | (839 | ) | $ | (274 | ) | $ | 1,206 | ||||||||||
| American Funds Insurance Series | 149 |
| Growth- Income Fund | Asset Allocation Fund | Global Balanced Fund | Bond Fund | Global Bond Fund | |||||||||||||||||||
| Assets | Location on statements of assets and liabilties | ||||||||||||||||||||||
| Forward currency | Unrealized appreciation on open forward currency contracts | $ | — | $ | — | $ | 137 | $ | 4,862 | $ | 7,983 | ||||||||||||
| Forward currency | Receivables for closed forward currency contracts | — | — | 5 | 157 | 874 | |||||||||||||||||
| Futures contracts | Deposits at brokers for futures contracts | — | — | — | — | — | |||||||||||||||||
| Interest rate swaps | Variation margin for interest rate swaps | — | — | — | 784 | 44 | |||||||||||||||||
| Futures contracts | Variation margin on futures contracts | — | — | — | — | — | |||||||||||||||||
| $ | — | $ | — | $ | 142 | $ | 5,803 | $ | 8,901 | ||||||||||||||
| Liabilities | Location on statements of assets and liabilities | ||||||||||||||||||||||
| Forward currency | Unrealized depreciation on open forward currency contracts | $ | — | $ | — | $ | 57 | $ | — | $ | 7,148 | ||||||||||||
| Forward currency | Payables for closed forward currency contracts | — | — | 3 | 278 | 1,393 | |||||||||||||||||
| Interest rate swaps | Variation margin on interest rate swaps | — | 68 | — | — | — | |||||||||||||||||
| Futures contracts | Variation margin on futures contracts | — | — | — | — | — | |||||||||||||||||
| $ | — | $ | 68 | $ | 60 | $ | 278 | $ | 8,541 | ||||||||||||||
| Net realized (loss) gain | Location on statements of operations | ||||||||||||||||||||||
| Forward currency | Net realized (loss) gain on forward currency contracts | $ | (9 | ) | $ | — | $ | (43 | ) | $ | 10,839 | $ | (3,161 | ) | |||||||||
| Interest rate swaps | Net realized loss on interest rate swaps | — | (1,666 | ) | — | (9,463 | ) | (2,498 | ) | ||||||||||||||
| Futures contracts | Net realized gain on futures contracts | — | — | — | — | — | |||||||||||||||||
| $ | (9 | ) | $ | (1,666 | ) | $ | (43 | ) | $ | 1,376 | $ | (5,659 | ) | ||||||||||
| Net unrealized (depreciation) appreciation | Location on statements of operations | ||||||||||||||||||||||
| Forward currency | Net unrealized (depreciation) appreciation on forward currency contracts | $ | (612 | ) | $ | — | $ | 104 | $ | 6,511 | $ | 4,230 | |||||||||||
| Interest rate swaps | Net unrealized depreciation on interest rate swaps | — | (9,127 | ) | — | (7,795 | ) | (175 | ) | ||||||||||||||
| Futures contracts | Net unrealized appreciation on futures contracts | — | — | — | — | — | |||||||||||||||||
| $ | (612 | ) | $ | (9,127 | ) | $ | 104 | $ | (1,284 | ) | $ | 4,055 | |||||||||||
| 150 | American Funds Insurance Series |
| High- Income Bond Fund | Mortgage Fund | U.S. Government/ AAA-Rated Securities Fund | Managed Risk Growth Fund | Managed Risk International Fund | |||||||||||||||||||
| Assets | Location on statements of assets and liabilties | ||||||||||||||||||||||
| Forward currency | Unrealized appreciation on open forward currency contracts | $ | 234 | $ | — | $ | — | $ | — | $ | — | ||||||||||||
| Forward currency | Receivables for closed forward currency contracts | — | — | — | — | — | |||||||||||||||||
| Futures contracts | Deposits at brokers for futures contracts | — | — | — | 887 | 486 | |||||||||||||||||
| Interest rate swaps | Variation margin for interest rate swaps | — | 138 | 708 | — | — | |||||||||||||||||
| Futures contracts | Variation margin on futures contracts | — | — | — | 151 | 42 | |||||||||||||||||
| $ | 234 | $ | 138 | $ | 708 | $ | 1,038 | $ | 528 | ||||||||||||||
| Liabilities | Location on statements of assets and liabilities | ||||||||||||||||||||||
| Forward currency | Unrealized depreciation on open forward currency contracts | $ | — | $ | — | $ | — | $ | — | $ | — | ||||||||||||
| Forward currency | Payables for closed forward currency contracts | — | — | — | — | — | |||||||||||||||||
| Interest rate swaps | Variation margin on interest rate swaps | — | — | — | — | — | |||||||||||||||||
| Futures contracts | Variation margin on futures contracts | — | — | — | — | — | |||||||||||||||||
| $ | — | $ | — | $ | — | $ | — | $ | — | ||||||||||||||
| Net realized gain (loss) | Location on statements of operations | ||||||||||||||||||||||
| Forward currency | Net realized gain on forward currency contracts | $ | 872 | $ | — | $ | — | $ | — | $ | — | ||||||||||||
| Interest rate swaps | Net realized gain (loss) on interest rate swaps | — | 222 | (4,040 | ) | — | — | ||||||||||||||||
| Futures contracts | Net realized loss on futures contracts | — | — | — | (2,612 | ) | (639 | ) | |||||||||||||||
| $ | 872 | $ | 222 | $ | (4,040 | ) | $ | (2,612 | ) | $ | (639 | ) | |||||||||||
| Net unrealized appreciation (depreciation) | Location on statements of operations | ||||||||||||||||||||||
| Forward currency | Net unrealized appreciation on forward currency contracts | $ | 258 | $ | — | $ | — | $ | — | $ | — | ||||||||||||
| Interest rate swaps | Net unrealized depreciation on interest rate swaps | — | (956 | ) | (11,848 | ) | — | — | |||||||||||||||
| Futures contracts | Net unrealized depreciation on futures contracts | — | — | — | (438 | ) | (149 | ) | |||||||||||||||
| $ | 258 | $ | (956 | ) | $ | (11,848 | ) | $ | (438 | ) | $ | (149 | ) | ||||||||||
| American Funds Insurance Series | 151 |
| Managed Risk Blue Chip Income and Growth Fund | Managed Risk Growth- Income Fund | Managed Risk Asset Allocation Fund | |||||||||||||||||||||
| Assets | Location on statements of assets and liabilties | ||||||||||||||||||||||
| Forward currency | Unrealized appreciation on open forward currency contracts | $ | — | $ | — | $ | — | ||||||||||||||||
| Forward currency | Receivables for closed forward currency contracts | — | — | — | |||||||||||||||||||
| Futures contracts | Deposits at brokers for futures contracts | 318 | 475 | — | |||||||||||||||||||
| Interest rate swaps | Variation margin for interest rate swaps | — | — | — | |||||||||||||||||||
| Futures contracts | Variation margin on futures contracts | 77 | 61 | — | |||||||||||||||||||
| $ | 395 | $ | 536 | $ | — | ||||||||||||||||||
| Liabilities | Location on statements of assets and liabilities | ||||||||||||||||||||||
| Forward currency | Unrealized depreciation on open forward currency contracts | $ | — | $ | — | $ | — | ||||||||||||||||
| Forward currency | Payables for closed forward currency contracts | — | — | — | |||||||||||||||||||
| Interest rate swaps | Variation margin on interest rate swaps | — | — | — | |||||||||||||||||||
| Futures contracts | Variation margin on futures contracts | — | — | — | |||||||||||||||||||
| $ | — | $ | — | $ | — | ||||||||||||||||||
| Net realized loss | Location on statements of operations | ||||||||||||||||||||||
| Forward currency | Net realized gain on forward currency contracts | $ | — | $ | — | $ | — | ||||||||||||||||
| Interest rate swaps | Net realized gain on interest rate swaps | — | — | — | |||||||||||||||||||
| Futures contracts | Net realized loss on futures contracts | (2,998 | ) | (2,253 | ) | (23,286 | ) | ||||||||||||||||
| $ | (2,998 | ) | $ | (2,253 | ) | $ | (23,286 | ) | |||||||||||||||
| Net unrealized appreciation (depreciation) | Location on statements of operations | ||||||||||||||||||||||
| Forward currency | Net unrealized appreciation on forward currency contracts | $ | — | $ | — | $ | — | ||||||||||||||||
| Interest rate swaps | Net unrealized appreciation on interest rate swaps | — | — | — | |||||||||||||||||||
| Futures contracts | Net unrealized depreciation on futures contracts | (121 | ) | (192 | ) | — | |||||||||||||||||
| $ | (121 | ) | $ | (192 | ) | $ | — | ||||||||||||||||
Collateral — Funds that invest in forward currency contracts, interest rate swaps and/or futures contracts participate in a collateral program. For forward currency contracts, the program calls for the fund to either receive or pledge collateral based on the net gain or loss on unsettled forward currency contracts by counterparty. For interest rate swaps and futures contracts, the program calls for the fund to pledge collateral for initial and variation margin by contract. The purpose of the collateral is to cover potential losses that could occur in the event that either party to the contract cannot meet its contractual obligations.
Rights of offset — Funds that hold forward currency contracts have enforceable master netting agreements with certain counterparties, where amounts payable by each party to the other in the same currency, with the same settlement date and with the same counterparty, are settled net of each party’s payment obligation. For financial reporting purposes, the funds do not offset financial assets and financial liabilities that are subject to netting arrangements in the funds’ statements of assets and liabilities. The following tables present each
| 152 | American Funds Insurance Series |
fund’s forward currency contracts by counterparty as of December 31, 2014, including those that are subject to potential offset on the statements of assets and liabilities (dollars in thousands):
Global Growth Fund
| Gross amounts recognized in the | Gross amounts not offset in the statement of assets and liabilities and subject to a master netting agreement | |||||||||||||||||||
| Counterparty | statement of assets and liabilities | Available to offset | Non-cash collateral* | Cash collateral | Net amount | |||||||||||||||
| Assets: | ||||||||||||||||||||
| Bank of America, N.A. | $ | 741 | $ | — | $ | — | $ | — | $ | 741 | ||||||||||
| Bank of New York Mellon | 625 | — | — | — | 625 | |||||||||||||||
| JPMorgan Chase | 1 | — | — | — | 1 | |||||||||||||||
| UBS AG | 1 | — | — | — | 1 | |||||||||||||||
| $ | 1,368 | $ | — | $ | — | $ | — | $ | 1,368 | |||||||||||
Global Small Capitalization Fund
| Gross amounts recognized in the | Gross amounts not offset in the statement of assets and liabilities and subject to a master netting agreement | |||||||||||||||||||
| Counterparty | statement of assets and liabilities | Available to offset | Non-cash collateral* | Cash collateral | Net amount | |||||||||||||||
| Assets: | ||||||||||||||||||||
| HSBC Bank | $ | 94 | $ | — | $ | — | $ | — | $ | 94 | ||||||||||
| UBS AG | 314 | — | — | — | 314 | |||||||||||||||
| $ | 408 | $ | — | $ | — | $ | — | $ | 408 | |||||||||||
| Liabilities: | ||||||||||||||||||||
| Barclays Bank PLC | $ | 1 | $ | — | $ | — | $ | — | $ | 1 | ||||||||||
| International Fund | ||||||||||||||||||||
| Gross amounts recognized in the | Gross amounts not offset in the statement of assets and liabilities and subject to a master netting agreement | |||||||||||||||||||
| Counterparty | statement of assets and liabilities | Available to offset | Non-cash collateral* | Cash collateral | Net amount | |||||||||||||||
| Assets: | ||||||||||||||||||||
| Bank of America, N.A. | $ | 758 | $ | — | $ | — | $ | — | $ | 758 | ||||||||||
| Barclays Bank PLC | 2,308 | — | — | 2,308 | ||||||||||||||||
| Citibank | 309 | — | — | — | 309 | |||||||||||||||
| UBS AG | 726 | — | — | — | 726 | |||||||||||||||
| $ | 4,101 | $ | — | $ | — | $ | — | $ | 4,101 | |||||||||||
See end of tables for footnote.
| American Funds Insurance Series | 153 |
New World Fund
| Gross amounts recognized in the | Gross amounts not offset in the statement of assets and liabilities and subject to a master netting agreement | |||||||||||||||||||
| Counterparty | statement of assets and liabilities | Available to offset | Non-cash collateral* | Cash collateral | Net amount | |||||||||||||||
| Assets: | ||||||||||||||||||||
| Bank of America, N.A. | $ | 33 | $ | — | $ | — | $ | — | $ | 33 | ||||||||||
| Citibank | 234 | — | — | — | 234 | |||||||||||||||
| HSBC Bank | 63 | (2 | ) | — | — | 61 | ||||||||||||||
| JPMorgan Chase | 153 | (1 | ) | — | — | 152 | ||||||||||||||
| UBS AG | 229 | (95 | ) | — | — | 134 | ||||||||||||||
| $ | 712 | $ | (98 | ) | $ | — | $ | — | $ | 614 | ||||||||||
| Liabilities: | ||||||||||||||||||||
| Barclays Bank PLC | $ | 21 | $ | — | $ | — | $ | — | $ | 21 | ||||||||||
| HSBC Bank | 2 | (2 | ) | — | — | — | ||||||||||||||
| JPMorgan Chase | 1 | (1 | ) | — | — | — | ||||||||||||||
| UBS AG | 95 | (95 | ) | — | — | — | ||||||||||||||
| $ | 119 | $ | (98 | ) | $ | — | $ | — | $ | 21 | ||||||||||
Global Growth and Income Fund
| Gross amounts recognized in the | Gross amounts not offset in the statement of assets and liabilities and subject to a master netting agreement | |||||||||||||||||||
| Counterparty | statement of assets and liabilities | Available to offset | Non-cash collateral* | Cash collateral | Net amount | |||||||||||||||
| Assets: | ||||||||||||||||||||
| Bank of America, N.A. | $ | 1 | $ | — | $ | — | $ | — | $ | 1 | ||||||||||
| Citibank | 254 | — | — | — | 254 | |||||||||||||||
| JPMorgan Chase | 1,009 | — | — | — | 1,009 | |||||||||||||||
| $ | 1,264 | $ | — | $ | — | $ | — | $ | 1,264 | |||||||||||
Global Balanced Fund
| Gross amounts recognized in the | Gross amounts not offset in the statement of assets and liabilities and subject to a master netting agreement | |||||||||||||||||||
| Counterparty | statement of assets and liabilities | Available to offset | Non-cash collateral* | Cash collateral | Net amount | |||||||||||||||
| Assets: | ||||||||||||||||||||
| Bank of America, N.A. | $ | 12 | $ | — | $ | — | $ | — | $ | 12 | ||||||||||
| Citibank | 47 | — | — | — | 47 | |||||||||||||||
| HSBC Bank | 21 | (21 | ) | — | — | — | ||||||||||||||
| JPMorgan Chase | 60 | (9 | ) | — | — | 51 | ||||||||||||||
| UBS AG | 2 | (2 | ) | — | — | — | ||||||||||||||
| $ | 142 | $ | (32 | ) | $ | — | $ | — | $ | 110 | ||||||||||
| Liabilities: | ||||||||||||||||||||
| Barclays Bank PLC | $ | 3 | $ | — | $ | — | $ | — | $ | 3 | ||||||||||
| HSBC Bank | 26 | (21 | ) | — | — | 5 | ||||||||||||||
| JPMorgan Chase | 9 | (9 | ) | — | — | — | ||||||||||||||
| UBS AG | 22 | (2 | ) | — | — | 20 | ||||||||||||||
| $ | 60 | $ | (32 | ) | $ | — | $ | — | $ | 28 | ||||||||||
| 154 | American Funds Insurance Series |
Bond Fund
| Gross amounts recognized in the | Gross amounts not offset in the statement of assets and liabilities and subject to a master netting agreement | |||||||||||||||||||
| Counterparty | statement of assets and liabilities | Available to offset | Non-cash collateral* | Cash collateral | Net amount | |||||||||||||||
| Assets: | ||||||||||||||||||||
| Barclays Bank PLC | $ | 93 | $ | — | $ | — | $ | — | $ | 93 | ||||||||||
| Citibank | 250 | — | — | — | 250 | |||||||||||||||
| HSBC Bank | 2,565 | — | — | — | 2,565 | |||||||||||||||
| JPMorgan Chase | 1,945 | — | — | — | 1,945 | |||||||||||||||
| UBS AG | 166 | — | — | — | 166 | |||||||||||||||
| $ | 5,019 | $ | — | $ | — | $ | — | $ | 5,019 | |||||||||||
| Liabilities: | ||||||||||||||||||||
| JPMorgan Chase | $ | 198 | $ | — | $ | — | $ | — | $ | 198 | ||||||||||
| UBS AG | 80 | — | — | — | 80 | |||||||||||||||
| $ | 278 | $ | — | $ | — | $ | — | $ | 278 | |||||||||||
Global Bond Fund
| Gross amounts recognized in the | Gross amounts not offset in the statement of assets and liabilities and subject to a master netting agreement | |||||||||||||||||||
| Counterparty | statement of assets and liabilities | Available to offset | Non-cash collateral* | Cash collateral | Net amount | |||||||||||||||
| Assets: | ||||||||||||||||||||
| Bank of America, N.A. | $ | 643 | $ | — | $ | — | $ | — | $ | 643 | ||||||||||
| Barclays Bank PLC | 512 | (386 | ) | — | — | 126 | ||||||||||||||
| Citibank | 1,957 | (571 | ) | — | — | 1,386 | ||||||||||||||
| HSBC Bank | 2,534 | (1,708 | ) | — | — | 826 | ||||||||||||||
| JPMorgan Chase | 1,603 | (1,595 | ) | — | — | 8 | ||||||||||||||
| UBS AG | 1,608 | (632 | ) | — | — | 976 | ||||||||||||||
| $ | 8,857 | $ | (4,892 | ) | $ | — | $ | — | $ | 3,965 | ||||||||||
| Liabilities: | ||||||||||||||||||||
| Bank of America, N.A. | $ | 294 | $ | — | $ | — | $ | — | $ | 294 | ||||||||||
| Bank of New York Mellon | 2,580 | — | — | — | 2,580 | |||||||||||||||
| Barclays Bank PLC | 386 | (386 | ) | — | — | — | ||||||||||||||
| Citibank | 625 | (571 | ) | — | — | 54 | ||||||||||||||
| HSBC Bank | 2,000 | (1,708 | ) | — | — | 292 | ||||||||||||||
| JPMorgan Chase | 2,024 | (1,595 | ) | — | — | 429 | ||||||||||||||
| UBS AG | 632 | (632 | ) | — | — | — | ||||||||||||||
| $ | 8,541 | $ | (4,892 | ) | $ | — | $ | — | $ | 3,649 | ||||||||||
High-Income Bond Fund
| Gross amounts recognized in the | Gross amounts not offset in the statement of assets and liabilities and subject to a master netting agreement | |||||||||||||||||||
| Counterparty | statement of assets and liabilities | Available to offset | Non-cash collateral* | Cash collateral | Net amount | |||||||||||||||
| Assets: | ||||||||||||||||||||
| Bank of New York Mellon | $ | 184 | $ | — | $ | — | $ | — | $ | 184 | ||||||||||
| HSBC Bank | 21 | — | — | — | 21 | |||||||||||||||
| UBS AG | 29 | — | — | — | 29 | |||||||||||||||
| $ | 234 | $ | — | $ | — | $ | — | $ | 234 | |||||||||||
* Non-cash collateral is shown on a settlement basis.
| American Funds Insurance Series | 155 |
6. Taxation and distributions
Federal income taxation — Each fund complies with the requirements under Subchapter M of the Internal Revenue Code applicable to mutual funds and intends to distribute substantially all of its net taxable income and net capital gains each year. The funds are not subject to income taxes to the extent such distributions are made. Therefore, no federal income tax provision is required.
As of and during the period ended December 31, 2014, none of the funds had a liability for any unrecognized tax benefits. Each fund recognizes interest and penalties, if any, related to unrecognized tax benefits as income tax expense in the statements of operations. During the period, none of the funds incurred any significant interest or penalties.
The funds are not subject to examination by U.S. federal tax authorities for tax years before 2011. Global Balanced Fund and Mortgage Fund are not subject to examination by U.S. federal tax authorities for tax years before 2011, the year the funds commenced operations. Managed Risk Asset Allocation Fund is not subject to examination by U.S. federal tax authorities for tax years before 2012, the year the fund commenced operations. Managed Risk Growth Fund, Managed Risk International Fund, Managed Risk Blue Chip Income and Growth Fund and Managed Risk Growth-Income Fund are not subject to examination by U.S. federal tax authorities for tax years before 2013, the year the funds commenced operations. Capital Income Builder is not subject to examination by U.S. federal tax authorities for tax years before 2014, the year the fund commenced operations.
The funds are not subject to examination by state tax authorities for tax years before 2010. Global Balanced Fund and Mortgage Fund are not subject to examination by state tax authorities for tax years before 2011, the year the funds commenced operations. Managed Risk Asset Allocation Fund is not subject to examination by state tax authorities for tax years before 2012, the year the fund commenced operations. Managed Risk Growth Fund, Managed Risk International Fund, Managed Risk Blue Chip Income and Growth Fund and Managed Risk Growth-Income Fund are not subject to examination by state tax authorities for tax years before 2013, the year the funds commenced operations. Capital Income Builder is not subject to examination by state tax authorities for tax years before 2014, the year the fund commenced operations.
The following funds are not subject to examination by tax authorities outside the U.S. for the years indicated: Global Growth Fund, Global Small Capitalization Fund, Growth Fund, International Fund, New World Fund and Global Growth and Income Fund for tax years before 2007; Growth-Income Fund for tax years before 2010; and International Growth and Income Fund and Global Balanced Fund for tax years before 2011. All other funds are not subject to examination by tax authorities outside the U.S.
Non-U.S. taxation — Dividend and interest income are recorded net of non-U.S. taxes paid. Gains realized by the funds on the sale of securities in certain countries are subject to non-U.S. taxes. The funds record a liability based on unrealized gains to provide for potential non-U.S. taxes payable upon the sale of these securities.
Distributions — Distributions paid to shareholders are based on net investment income and net realized gains determined on a tax basis, which may differ from net investment income and net realized gains for financial reporting purposes. These differences are due primarily to different treatment for items such as currency gains and losses; short-term capital gains and losses; capital losses related to sales of certain securities within 30 days of purchase; unrealized appreciation of certain investments in securities outside the U.S.; cost of investments sold; non-U.S. taxes on capital gains; paydowns on fixed-income securities; net capital losses; net operating losses; amortization of premiums and discounts; and income on certain investments. The fiscal year in which amounts are distributed may differ from the year in which the net investment income and net realized gains are recorded by the funds for financial reporting purposes.
As indicated in the tables in this section, some of the funds had capital loss carryforwards available at December 31, 2014. These will be used to offset any capital gains realized by the funds in future years through the expiration dates. Funds with capital loss carryforwards will not make distributions from capital gains while a capital loss carryforward remains.
Under the Regulated Investment Company Modernization Act of 2010 (the “Act”), net capital losses recognized after December 31, 2010, may be carried forward indefinitely, and their character is retained as short-term and/or long-term losses. Previously, net capital losses were carried forward for eight years and treated as short-term losses. As a transition rule, the Act requires that post-enactment net capital losses be used before pre-enactment net capital losses.
| 156 | American Funds Insurance Series |
Additional tax basis disclosures are as follows (dollars in thousands):
| Global Growth Fund | Global Small Capitalization Fund | Growth Fund | International Fund | New World Fund | Blue Chip Income and Growth Fund | |||||||||||||||||||
| Undistributed ordinary income | $ | 59,303 | $ | 39,763 | $ | 26,481 | $ | 27,519 | $ | 46,283 | $ | 70,798 | ||||||||||||
| Late year ordinary loss deferral* | — | (1,480 | ) | — | — | — | — | |||||||||||||||||
| Undistributed long-term capital gain | 490,905 | 291,621 | 4,626,374 | 445,795 | 111,831 | 665,817 | ||||||||||||||||||
| Capital loss carryforward utilized | — | — | — | 386,250 | — | 24,747 | ||||||||||||||||||
| Gross unrealized appreciation on investment securities | 1,619,588 | 1,375,775 | 7,722,797 | 1,852,730 | 422,654 | 1,962,299 | ||||||||||||||||||
| Gross unrealized depreciation on investment securities | (243,332 | ) | (471,711 | ) | (587,321 | ) | (435,835 | ) | (324,025 | ) | (56,195 | ) | ||||||||||||
| Net unrealized appreciation (depreciation) on investment securities | 1,376,256 | 904,064 | 7,135,476 | 1,416,895 | 98,629 | 1,906,104 | ||||||||||||||||||
| Cost of investment securities | 4,180,637 | 3,258,777 | 15,638,399 | 6,270,386 | 2,482,955 | 5,345,442 | ||||||||||||||||||
| Reclassification to (from) undistributed/distributions in excess of net investment income from (to) undistributed net realized gain/accumulated net realized loss | 18,740 | 3,324 | (562 | ) | 24,322 | 955 | (2 | ) | ||||||||||||||||
| Global Growth and Income Fund | Growth- Income Fund | International Growth and Income Fund | Capital Income Builder | Asset Allocation Fund | Global Balanced Fund | |||||||||||||||||||
| Undistributed ordinary income | $ | 7,207 | $ | 163,215 | $ | 1,651 | $ | — | $ | 208,311 | $ | 272 | ||||||||||||
| Late year ordinary loss deferral* | — | — | — | (10 | ) | — | — | |||||||||||||||||
| Undistributed long-term capital gain | — | 3,511,162 | 21,495 | — | 1,126,260 | 779 | ||||||||||||||||||
| Post-October capital loss deferral* | — | — | — | (316 | ) | — | — | |||||||||||||||||
| Capital loss carryforward: | ||||||||||||||||||||||||
| Expiring 2017 | (82,483 | ) | — | — | — | — | — | |||||||||||||||||
| Expiring 2018 | (297 | ) | — | — | — | — | — | |||||||||||||||||
| (82,780 | ) | — | — | — | — | — | ||||||||||||||||||
| Capital loss carryforward utilized | 190,917 | — | — | — | — | — | ||||||||||||||||||
| Gross unrealized appreciation on investment securities | 421,233 | 8,301,888 | 96,553 | 1,985 | 3,930,660 | 26,969 | ||||||||||||||||||
| Gross unrealized depreciation on investment securities | (120,674 | ) | (671,034 | ) | (58,082 | ) | (3,166 | ) | (382,960 | ) | (7,789 | ) | ||||||||||||
| Net unrealized appreciation (depreciation) on investment securities | 300,559 | 7,630,854 | 38,471 | (1,181 | ) | 3,547,700 | 19,180 | |||||||||||||||||
| Cost of investment securities | 1,573,788 | 17,745,446 | 965,998 | 76,067 | 14,393,705 | 201,134 | ||||||||||||||||||
| Reclassification to (from) undistributed/distributions in excess of net investment income from (to) undistributed net realized gain/accumulated net realized loss | 5,888 | 3,901 | 956 | 9 | (5,611 | ) | (1,136 | ) | ||||||||||||||||
| Reclassification to (from) undistributed/distributions in excess of net investment income from (to) capital paid in on shares of beneficial interest | — | — | — | 1 | — | — | ||||||||||||||||||
| American Funds Insurance Series | 157 |
| Bond Fund | Global Bond Fund | High-Income Bond Fund | Mortgage Fund | U.S. Government/ AAA-Rated Securities Fund | Cash Management Fund | |||||||||||||||||||
| Undistributed ordinary income | $ | 189,634 | $ | 45,303 | $ | 19,480 | $ | 5,010 | $ | 29,066 | $ | — | ||||||||||||
| Undistributed long-term capital gain | 36,263 | 25,248 | — | — | 3,636 | — | ||||||||||||||||||
| Capital loss carryforward: | ||||||||||||||||||||||||
| Expiring 2017 | — | — | (45,026 | ) | — | — | — | |||||||||||||||||
| Capital loss carryforward utilized | — | — | 32,657 | 2,303 | 18,371 | — | ||||||||||||||||||
| Gross unrealized appreciation on investment securities | 196,278 | 34,777 | 6,398 | 4,574 | 55,715 | 17 | ||||||||||||||||||
| Gross unrealized depreciation on investment securities | (59,704 | ) | (75,180 | ) | (128,762 | ) | (765 | ) | (8,044 | ) | (1 | ) | ||||||||||||
| Net unrealized appreciation (depreciation) on investment securities | 136,574 | (40,403 | ) | (122,364 | ) | 3,809 | 47,671 | 16 | ||||||||||||||||
| Cost of investment securities | 10,676,109 | 2,701,883 | 2,016,092 | 410,799 | 3,837,088 | 395,281 | ||||||||||||||||||
| Reclassification to (from) undistributed/distributions in excess of net investment income from (to) undistributed net realized gain/accumulated net realized loss | 9,105 | (26,841 | ) | 2,985 | 602 | 1,536 | 1 | |||||||||||||||||
| Reclassification to (from) undistributed/distributions in excess of net investment income from (to) capital paid in on shares of beneficial interest | — | — | — | — | — | 2,049 | ||||||||||||||||||
| Managed Risk Growth Fund | Managed Risk International Fund | Managed Risk Blue Chip Income and Growth Fund | Managed Risk Growth- Income Fund | Managed Risk Asset Allocation Fund | ||||||||||||||||
| Undistributed ordinary income | $ | — | $ | 14 | $ | 70 | $ | — | $ | 24,307 | ||||||||||
| Late year ordinary loss deferral* | (6 | ) | — | — | (3 | ) | — | |||||||||||||
| Undistributed long-term capital gain | — | — | — | — | 48,332 | |||||||||||||||
| Post-October capital loss deferral* | (792 | ) | — | — | (564 | ) | — | |||||||||||||
| Capital loss carryforward: | ||||||||||||||||||||
| No expiration | — | (319 | ) | (1,316 | ) | — | — | |||||||||||||
| Capital loss carryforward utilized | 126 | — | — | 178 | 87 | |||||||||||||||
| Gross unrealized appreciation on investment securities | 2,021 | — | 4,276 | 1,772 | 31,637 | |||||||||||||||
| Gross unrealized depreciation on investment securities | — | (1,478 | ) | — | — | — | ||||||||||||||
| Net unrealized appreciation (depreciation) on investment securities | 2,021 | (1,478 | ) | 4,276 | 1,772 | 31,637 | ||||||||||||||
| Cost of investment securities | 75,768 | 46,977 | 92,597 | 73,414 | 2,020,405 | |||||||||||||||
| Reclassification to (from) undistributed/distributions in excess of net investment income from (to) undistributed net realized gain/accumulated net realized loss | 56 | 33 | (3 | ) | 11 | 5,674 | ||||||||||||||
* These deferrals are considered incurred in the subsequent year.
| 158 | American Funds Insurance Series |
The tax character of distributions paid to shareholders of each fund was as follows (dollars in thousands):
Global Growth Fund
| Year ended December 31, 2014 | Year ended December 31, 2013 | |||||||||||||||||||||||
| Total | Total | |||||||||||||||||||||||
| Ordinary | Long-term | distributions | Ordinary | Long-term | distributions | |||||||||||||||||||
| Share class | income | capital gains | paid | income | capital gains | paid | ||||||||||||||||||
| Class 1 | $ | 21,714 | $ | 149,231 | $ | 170,945 | $ | 21,540 | $ | — | $ | 21,540 | ||||||||||||
| Class 2 | 46,982 | 409,357 | 456,339 | 50,234 | — | 50,234 | ||||||||||||||||||
| Class 4 | 185 | 729 | 914 | 6 | — | 6 | ||||||||||||||||||
| Total | $ | 68,881 | $ | 559,317 | $ | 628,198 | $ | 71,780 | $ | — | $ | 71,780 | ||||||||||||
Global Small Capitalization Fund
| Year ended December 31, 2014 | Year ended December 31, 2013 | |||||||||||||||||||||||
| Total | Total | |||||||||||||||||||||||
| Ordinary | Long-term | distributions | Ordinary | Long-term | distributions | |||||||||||||||||||
| Share class | income | capital gains | paid | income | capital gains | paid | ||||||||||||||||||
| Class 1 | $ | 4,791 | $ | 5,850 | $ | 10,641 | $ | 9,160 | $ | — | $ | 9,160 | ||||||||||||
| Class 2 | 3,426 | 12,856 | 16,282 | 24,174 | — | 24,174 | ||||||||||||||||||
| Class 4 | 8 | 35 | 43 | 3 | — | 3 | ||||||||||||||||||
| Total | $ | 8,225 | $ | 18,741 | $ | 26,966 | $ | 33,337 | $ | — | $ | 33,337 | ||||||||||||
Growth Fund
| Year ended December 31, 2014 | Year ended December 31, 2013 | |||||||||||||||||||||||
| Total | Total | |||||||||||||||||||||||
| Ordinary | Long-term | distributions | Ordinary | Long-term | distributions | |||||||||||||||||||
| Share class | income | capital gains | paid | income | capital gains | paid | ||||||||||||||||||
| Class 1 | $ | 101,536 | $ | 338,191 | $ | 439,727 | $ | 77,038 | $ | — | $ | 77,038 | ||||||||||||
| Class 2 | 120,723 | 770,692 | 891,415 | 142,471 | — | 142,471 | ||||||||||||||||||
| Class 3 | 2,019 | 10,176 | 12,195 | 1,987 | — | 1,987 | ||||||||||||||||||
| Class 4 | 204 | 355 | 559 | 32 | — | 32 | ||||||||||||||||||
| Total | $ | 224,482 | $ | 1,119,414 | $ | 1,343,896 | $ | 221,528 | $ | — | $ | 221,528 | ||||||||||||
International Fund
| Year ended December 31, 2014 | Year ended December 31, 2013 | |||||||||||||||||||||||
| Total | Total | |||||||||||||||||||||||
| Ordinary | Long-term | distributions | Ordinary | Long-term | distributions | |||||||||||||||||||
| Share class | income | capital gains | paid | income | capital gains | paid | ||||||||||||||||||
| Class 1 | $ | 56,042 | $ | — | $ | 56,042 | $ | 50,434 | $ | — | $ | 50,434 | ||||||||||||
| Class 2 | 62,808 | — | 62,808 | 75,225 | — | 75,225 | ||||||||||||||||||
| Class 3 | 586 | — | 586 | 614 | — | 614 | ||||||||||||||||||
| Class 4 | 253 | — | 253 | 23 | — | 23 | ||||||||||||||||||
| Total | $ | 119,689 | $ | — | $ | 119,689 | $ | 126,296 | $ | — | $ | 126,296 | ||||||||||||
New World Fund
| Year ended December 31, 2014 | Year ended December 31, 2013 | |||||||||||||||||||||||
| Total | Total | |||||||||||||||||||||||
| Ordinary | Long-term | distributions | Ordinary | Long-term | distributions | |||||||||||||||||||
| Share class | income | capital gains | paid | income | capital gains | paid | ||||||||||||||||||
| Class 1 | $ | 22,533 | $ | 136,762 | $ | 159,295 | $ | 21,178 | $ | 5,690 | $ | 26,868 | ||||||||||||
| Class 2 | 14,710 | 118,828 | 133,538 | 17,409 | 5,994 | 23,403 | ||||||||||||||||||
| Class 4 | 712 | 2,416 | 3,128 | 93 | 4 | 97 | ||||||||||||||||||
| Total | $ | 37,955 | $ | 258,006 | $ | 295,961 | $ | 38,680 | $ | 11,688 | $ | 50,368 | ||||||||||||
See end of tables for footnotes.
| American Funds Insurance Series | 159 |
Blue Chip Income and Growth Fund
| Year ended December 31, 2014 | Year ended December 31, 2013 | |||||||||||||||||||||||
| Total | Total | |||||||||||||||||||||||
| Ordinary | Long-term | distributions | Ordinary | Long-term | distributions | |||||||||||||||||||
| Share class | income | capital gains | paid | income | capital gains | paid | ||||||||||||||||||
| Class 1 | $ | 110,127 | $ | — | $ | 110,127 | $ | 54,555 | $ | — | $ | 54,555 | ||||||||||||
| Class 2 | 111,072 | — | 111,072 | 66,918 | — | 66,918 | ||||||||||||||||||
| Class 4 | 214 | — | 214 | 2 | — | 2 | ||||||||||||||||||
| Total | $ | 221,413 | $ | — | $ | 221,413 | $ | 121,475 | $ | — | $ | 121,475 | ||||||||||||
Global Growth and Income Fund
| Year ended December 31, 2014 | Year ended December 31, 2013 | |||||||||||||||||||||||
| Total | Total | |||||||||||||||||||||||
| Ordinary | Long-term | distributions | Ordinary | Long-term | distributions | |||||||||||||||||||
| Share class | income | capital gains | paid | income | capital gains | paid | ||||||||||||||||||
| Class 1 | $ | 7,433 | $ | — | $ | 7,433 | $ | 6,810 | $ | — | $ | 6,810 | ||||||||||||
| Class 2 | 59,444 | — | 59,444 | 56,388 | — | 56,388 | ||||||||||||||||||
| Class 4 | 55 | — | 55 | 19 | — | 19 | ||||||||||||||||||
| Total | $ | 66,932 | $ | — | $ | 66,932 | $ | 63,217 | $ | — | $ | 63,217 | ||||||||||||
Growth-Income Fund
| Year ended December 31, 2014 | Year ended December 31, 2013 | |||||||||||||||||||||||
| Total | Total | |||||||||||||||||||||||
| Ordinary | Long-term | distributions | Ordinary | Long-term | distributions | |||||||||||||||||||
| Share class | income | capital gains | paid | income | capital gains | paid | ||||||||||||||||||
| Class 1 | $ | 160,312 | $ | 481,640 | $ | 641,952 | $ | 142,502 | $ | — | $ | 142,502 | ||||||||||||
| Class 2 | 182,884 | 707,921 | 890,805 | 185,855 | — | 185,855 | ||||||||||||||||||
| Class 3 | 2,464 | 9,150 | 11,614 | 2,493 | — | 2,493 | ||||||||||||||||||
| Class 4 | 336 | 338 | 674 | 32 | — | 32 | ||||||||||||||||||
| Total | $ | 345,996 | $ | 1,199,049 | $ | 1,545,045 | $ | 330,882 | $ | — | $ | 330,882 | ||||||||||||
International Growth and Income Fund
| Year ended December 31, 2014 | Year ended December 31, 2013 | |||||||||||||||||||||||
| Total | Total | |||||||||||||||||||||||
| Ordinary | Long-term | distributions | Ordinary | Long-term | distributions | |||||||||||||||||||
| Share class | income | capital gains | paid | income | capital gains | paid | ||||||||||||||||||
| Class 1 | $ | 23,471 | $ | 7,090 | $ | 30,561 | $ | 19,657 | $ | 9,002 | $ | 28,659 | ||||||||||||
| Class 2 | 7,334 | 2,491 | 9,825 | 6,724 | 3,354 | 10,078 | ||||||||||||||||||
| Class 4 | 564 | 75 | 639 | 8 | 3 | 11 | ||||||||||||||||||
| Total | $ | 31,369 | $ | 9,656 | $ | 41,025 | $ | 26,389 | $ | 12,359 | $ | 38,748 | ||||||||||||
Capital Income Builder
| For the period ended December 31, 20141 | ||||||||||||
| Ordinary | Long-term | Total distributions | ||||||||||
| Share class | income | capital gains | paid | |||||||||
| Class 1 | $ | 409 | $ | — | $ | 409 | ||||||
| Class 2 | — | — | — | |||||||||
| Class 4 | 520 | — | 520 | |||||||||
| Total | $ | 929 | $ | — | $ | 929 | ||||||
| 160 | American Funds Insurance Series |
Asset Allocation Fund
| Year ended December 31, 2014 | Year ended December 31, 2013 | |||||||||||||||||||||||
| Total | Total | |||||||||||||||||||||||
| Ordinary | Long-term | distributions | Ordinary | Long-term | distributions | |||||||||||||||||||
| Share class | income | capital gains | paid | income | capital gains | paid | ||||||||||||||||||
| Class 1 | $ | 244,441 | $ | 487,101 | $ | 731,542 | $ | 160,436 | $ | — | $ | 160,436 | ||||||||||||
| Class 2 | 104,039 | 252,911 | 356,950 | 79,271 | — | 79,271 | ||||||||||||||||||
| Class 3 | 774 | 1,837 | 2,611 | 607 | — | 607 | ||||||||||||||||||
| Class 4 | 434 | 247 | 681 | 4 | — | 4 | ||||||||||||||||||
| Total | $ | 349,688 | $ | 742,096 | $ | 1,091,784 | $ | 240,318 | $ | — | $ | 240,318 | ||||||||||||
Global Balanced Fund
| Year ended December 31, 2014 | Year ended December 31, 2013 | |||||||||||||||||||||||
| Total | Total | |||||||||||||||||||||||
| Ordinary | Long-term | distributions | Ordinary | Long-term | distributions | |||||||||||||||||||
| Share class | income | capital gains | paid | income | capital gains | paid | ||||||||||||||||||
| Class 1 | $ | 559 | $ | 943 | $ | 1,502 | $ | 557 | $ | 260 | $ | 817 | ||||||||||||
| Class 2 | 2,317 | 4,536 | 6,853 | 2,083 | 1,129 | 3,212 | ||||||||||||||||||
| Class 4 | — | 2 | — | 2 | — | 2 | — | 2 | — | 2 | — | 2 | ||||||||||||
| Total | $ | 2,876 | $ | 5,479 | $ | 8,355 | $ | 2,640 | $ | 1,389 | $ | 4,029 | ||||||||||||
Bond Fund
| Year ended December 31, 2014 | Year ended December 31, 2013 | |||||||||||||||||||||||
| Total | Total | |||||||||||||||||||||||
| Ordinary | Long-term | distributions | Ordinary | Long-term | distributions | |||||||||||||||||||
| Share class | income | capital gains | paid | income | capital gains | paid | ||||||||||||||||||
| Class 1 | $ | 106,599 | $ | 1,717 | $ | 108,316 | $ | 89,562 | $ | 43,797 | $ | 133,359 | ||||||||||||
| Class 2 | 88,930 | 1,704 | 90,634 | 86,573 | 53,541 | 140,114 | ||||||||||||||||||
| Class 4 | 497 | 3 | 500 | 45 | 6 | 51 | ||||||||||||||||||
| Total | $ | 196,026 | $ | 3,424 | $ | 199,450 | $ | 176,180 | $ | 97,344 | $ | 273,524 | ||||||||||||
Global Bond Fund
| Year ended December 31, 2014 | Year ended December 31, 2013 | |||||||||||||||||||||||
| Total | Total | |||||||||||||||||||||||
| Ordinary | Long-term | distributions | Ordinary | Long-term | distributions | |||||||||||||||||||
| Share class | income | capital gains | paid | income | capital gains | paid | ||||||||||||||||||
| Class 1 | $ | 21,017 | $ | 10,164 | $ | 31,181 | $ | 6,185 | $ | 7,310 | $ | 13,495 | ||||||||||||
| Class 2 | 17,806 | 12,830 | 30,636 | 8,801 | 10,402 | 19,203 | ||||||||||||||||||
| Class 4 | 57 | 4 | 61 | — | 2 | — | 2 | — | 2 | |||||||||||||||
| Total | $ | 38,880 | $ | 22,998 | $ | 61,878 | $ | 14,986 | $ | 17,712 | $ | 32,698 | ||||||||||||
High-Income Bond Fund
| Year ended December 31, 2014 | Year ended December 31, 2013 | |||||||||||||||||||||||
| Total | Total | |||||||||||||||||||||||
| Ordinary | Long-term | distributions | Ordinary | Long-term | distributions | |||||||||||||||||||
| Share class | income | capital gains | paid | income | capital gains | paid | ||||||||||||||||||
| Class 1 | $ | 60,248 | $ | — | $ | 60,248 | $ | 55,659 | $ | — | $ | 55,659 | ||||||||||||
| Class 2 | 55,536 | — | 55,536 | 70,100 | — | 70,100 | ||||||||||||||||||
| Class 3 | 966 | — | 966 | 1,237 | — | 1,237 | ||||||||||||||||||
| Class 4 | 46 | — | 46 | 5 | — | 5 | ||||||||||||||||||
| Total | $ | 116,796 | $ | — | $ | 116,796 | $ | 127,001 | $ | — | $ | 127,001 | ||||||||||||
See end of tables for footnotes.
| American Funds Insurance Series | 161 |
Mortgage Fund
| Year ended December 31, 2014 | Year ended December 31, 2013 | |||||||||||||||||||||||
| Total | Total | |||||||||||||||||||||||
| Ordinary | Long-term | distributions | Ordinary | Long-term | distributions | |||||||||||||||||||
| Share class | income | capital gains | paid | income | capital gains | paid | ||||||||||||||||||
| Class 1 | $ | 2,595 | $ | — | $ | 2,595 | $ | 1,647 | $ | 46 | $ | 1,693 | ||||||||||||
| Class 2 | 364 | — | 364 | 296 | 15 | 311 | ||||||||||||||||||
| Class 4 | 4 | — | 4 | — | 2 | — | 2 | — | 2 | |||||||||||||||
| Total | $ | 2,963 | $ | — | $ | 2,963 | $ | 1,943 | $ | 61 | $ | 2,004 | ||||||||||||
U.S. Government/AAA-Rated Securities Fund
| Year ended December 31, 2014 | Year ended December 31, 2013 | |||||||||||||||||||||||
| Total | Total | |||||||||||||||||||||||
| Ordinary | Long-term | distributions | Ordinary | Long-term | distributions | |||||||||||||||||||
| Share class | income | capital gains | paid | income | capital gains | paid | ||||||||||||||||||
| Class 1 | $ | 22,540 | $ | — | $ | 22,540 | $ | 35,942 | $ | 25,494 | $ | 61,436 | ||||||||||||
| Class 2 | 18,675 | — | 18,675 | 35,681 | 28,443 | 64,124 | ||||||||||||||||||
| Class 3 | 143 | — | 143 | 318 | 255 | 573 | ||||||||||||||||||
| Class 4 | 325 | — | 325 | 2 | — | 2 | 2 | |||||||||||||||||
| Total | $ | 41,683 | $ | — | $ | 41,683 | $ | 71,943 | $ | 54,192 | $ | 126,135 | ||||||||||||
Managed Risk Growth Fund
| Year ended December 31, 2014 | Year ended December 31, 20133 | |||||||||||||||||||||||
| Total | Total | |||||||||||||||||||||||
| Ordinary | Long-term | distributions | Ordinary | Long-term | distributions | |||||||||||||||||||
| Share class | income | capital gains | paid | income | capital gains | paid | ||||||||||||||||||
| Class P1 | $ | 2 | $ | 3 | $ | 5 | $ | 1 | $ | — | $ | 1 | ||||||||||||
| Class P2 | 532 | 1,325 | 1,857 | 139 | — | 139 | ||||||||||||||||||
| Total | $ | 534 | $ | 1,328 | $ | 1,862 | $ | 140 | $ | — | $ | 140 | ||||||||||||
Managed Risk International Fund
| Year ended December 31, 2014 | Year ended December 31, 20133 | |||||||||||||||||||||||
| Total | Total | |||||||||||||||||||||||
| Ordinary | Long-term | distributions | Ordinary | Long-term | distributions | |||||||||||||||||||
| Share class | income | capital gains | paid | income | capital gains | paid | ||||||||||||||||||
| Class P1 | $ | 2 | $ | — | $ | 2 | $ | 1 | $ | — | $ | 1 | ||||||||||||
| Class P2 | 508 | — | 508 | 113 | — | 113 | ||||||||||||||||||
| Total | $ | 510 | $ | — | $ | 510 | $ | 114 | $ | — | $ | 114 | ||||||||||||
Managed Risk Blue Chip Income and Growth Fund
| Year ended December 31, 2014 | Year ended December 31, 20133 | |||||||||||||||||||||||
| Total | Total | |||||||||||||||||||||||
| Ordinary | Long-term | distributions | Ordinary | Long-term | distributions | |||||||||||||||||||
| Share class | income | capital gains | paid | income | capital gains | paid | ||||||||||||||||||
| Class P1 | $ | 6 | $ | — | $ | 6 | $ | 2 | $ | — | $ | 2 | ||||||||||||
| Class P2 | 2,173 | — | 2,173 | 340 | — | 340 | ||||||||||||||||||
| Total | $ | 2,179 | $ | — | $ | 2,179 | $ | 342 | $ | — | $ | 342 | ||||||||||||
| 162 | American Funds Insurance Series |
Managed Risk Growth-Income Fund
| Year ended December 31, 2014 | Year ended December 31, 20133 | |||||||||||||||||||||||
| Total | Total | |||||||||||||||||||||||
| Ordinary | Long-term | distributions | Ordinary | Long-term | distributions | |||||||||||||||||||
| Share class | income | capital gains | paid | income | capital gains | paid | ||||||||||||||||||
| Class P1 | $ | 2 | $ | 3 | $ | 5 | $ | 1 | $ | — | $ | 1 | ||||||||||||
| Class P2 | 641 | 1,587 | 2,228 | 201 | — | 201 | ||||||||||||||||||
| Total | $ | 643 | $ | 1,590 | $ | 2,233 | $ | 202 | $ | — | $ | 202 | ||||||||||||
Managed Risk Asset Allocation Fund
| Year ended December 31, 2014 | Year ended December 31, 2013 | |||||||||||||||||||||||
| Total | Total | |||||||||||||||||||||||
| Ordinary | Long-term | distributions | Ordinary | Long-term | distributions | |||||||||||||||||||
| Share class | income | capital gains | paid | income | capital gains | paid | ||||||||||||||||||
| Class P1 | $ | 581 | $ | — | $ | 581 | $ | 1,126 | $ | — | $ | 1,126 | ||||||||||||
| Class P2 | 976 | — | 976 | 7,025 | — | 7,025 | ||||||||||||||||||
| Total | $ | 1,557 | $ | — | $ | 1,557 | $ | 8,151 | $ | — | $ | 8,151 | ||||||||||||
| 1 | For the period May 1, 2014, commencement of operations, through December 31, 2014. |
| 2 | Amount less than one thousand. |
| 3 | For the period May 1, 2013, commencement of operations, through December 31, 2013. |
7. Fees and transactions
CRMC, the series’ investment adviser, is the parent company of American Funds Distributors,® Inc. (“AFD”), the distributor of the series’ shares, and American Funds Service Company® (“AFS”), the series’ transfer agent. CRMC, AFD and AFS are considered related parties to the series.
Investment advisory services — The series has an investment advisory and service agreement with CRMC that provides for monthly fees accrued daily. These fees are based on annual rates that generally decrease as average net asset levels increase. Subadvisory fees for the managed risk funds are paid by CRMC to Milliman. The managed risk funds are not responsible for paying any subadvisory fees.
Investment advisory services waiver — The series’ board of trustees approved an amended agreement for Blue Chip Income and Growth Fund effective February 1, 2015, decreasing the annual rates on daily net assets in excess of $6.5 billion to 0.360%. During the year ended December 31, 2014, CRMC voluntarily reduced investment advisory services fees to the new rate for Blue Chip Income and Growth Fund. CRMC is also waiving a portion of its investment advisory services fees for each of the managed risk funds. Investment advisory services fees are presented in each fund’s statement of operations gross of the waivers from CRMC. For the year ended December 31, 2014, total investment advisory services fees waived by CRMC were $897,000.
| American Funds Insurance Series | 163 |
The range of rates and asset levels and the current annualized rates of average net assets for each fund, before and after any investment advisory services waivers, are as follows:
| For the | For the | |||||||||||||||||||||||
| period ended | period ended | |||||||||||||||||||||||
| Rates | Net asset level (in billions) | December 31, | December 31, | |||||||||||||||||||||
| Beginning | Ending | In excess | 2014, | 2014, | ||||||||||||||||||||
| Fund | with | with | Up to | of | before waiver | after waiver | ||||||||||||||||||
| Global Growth Fund | .690 | % | .460 | % | $ | .6 | $ | 5.0 | .52 | % | .52 | % | ||||||||||||
| Global Small Capitalization Fund | .800 | .635 | .6 | 5.0 | .70 | .70 | ||||||||||||||||||
| Growth Fund | .500 | .280 | .6 | 34.0 | .33 | .33 | ||||||||||||||||||
| International Fund | .690 | .430 | .5 | 21.0 | .50 | .50 | ||||||||||||||||||
| New World Fund | .850 | .620 | .5 | 2.5 | .72 | .72 | ||||||||||||||||||
| Blue Chip Income and Growth Fund | .500 | .370 | .6 | 4.0 | .40 | .40 | ||||||||||||||||||
| Global Growth and Income Fund | .690 | .480 | .6 | 3.0 | .60 | .60 | ||||||||||||||||||
| Growth-Income Fund | .500 | .219 | .6 | 34.0 | .27 | .27 | ||||||||||||||||||
| International Growth and Income Fund | .690 | .530 | .5 | 1.0 | .64 | .64 | ||||||||||||||||||
| Capital Income Builder | .500 | all | .50 | .50 | ||||||||||||||||||||
| Asset Allocation Fund | .500 | .244 | .6 | 13.0 | .28 | .28 | ||||||||||||||||||
| Global Balanced Fund | .660 | .510 | .5 | 1.0 | .66 | .66 | ||||||||||||||||||
| Bond Fund | .480 | .330 | .6 | 8.0 | .37 | .37 | ||||||||||||||||||
| Global Bond Fund | .570 | .450 | 1.0 | 3.0 | .53 | .53 | ||||||||||||||||||
| High-Income Bond Fund | .500 | .420 | .6 | 2.0 | .46 | .46 | ||||||||||||||||||
| Mortgage Fund | .420 | .290 | .6 | 3.0 | .42 | .42 | ||||||||||||||||||
| U.S. Government/AAA-Rated Securities Fund | .420 | .290 | .6 | 3.0 | .33 | .33 | ||||||||||||||||||
| Cash Management Fund | .320 | .270 | 1.0 | 2.0 | .32 | .32 | ||||||||||||||||||
| Managed Risk Growth Fund | .250 | all | .25 | .20 | ||||||||||||||||||||
| Managed Risk International Fund | .250 | all | .25 | .20 | ||||||||||||||||||||
| Managed Risk Blue Chip Income and Growth Fund | .250 | all | .25 | .20 | ||||||||||||||||||||
| Managed Risk Growth-Income Fund | .250 | all | .25 | .20 | ||||||||||||||||||||
| Managed Risk Asset Allocation Fund | .250 | all | .25 | .20 | ||||||||||||||||||||
Distribution services — The series has plans of distribution for all share classes except Class 1. Under the plans, the board of trustees approves certain categories of expenses that are used to finance activities primarily intended to sell fund shares. The plans provide for payments to pay service fees to firms that have entered into agreements with the series. These payments, based on an annualized percentage of average daily net assets, range from 0.18% to 0.50% as noted in the table below. In some cases, the board of trustees has limited the amounts that may be paid to less than the maximum allowed by the plans.
| Share class | Currently approved limits | Plan limits | ||||||||
| Class 2 | 0.25 | % | 0.25 | % | ||||||
| Class 3 | 0.18 | 0.18 | ||||||||
| Class 4 | 0.25 | 0.25 | ||||||||
| Class P1 | 0.00 | 0.25 | ||||||||
| Class P2 | 0.25 | 0.50 | ||||||||
Insurance administrative services — The series has an insurance administrative services plan for Class 4, P1 and P2 shares. Under the plan, these share classes pay 0.25% of each insurance company’s respective average daily net assets in each share class to compensate the insurance companies for services provided to their separate accounts and contractholders for which the shares of the fund are beneficially owned as underlying investments of such contractholders’ annuities. These services include, but are not limited to, maintenance, shareholder communications and transactional services. The insurance companies are not related parties to the series.
Transfer agent services — The series has a shareholder services agreement with AFS under which the funds compensate AFS for providing transfer agent services to all of the funds’ share classes. These services include recordkeeping, shareholder communications and transaction processing. In addition, the managed risk funds reimburse AFS for amounts paid to third parties for performing transfer agent services on behalf of fund shareholders.
Administrative services — The series has an administrative services agreement that applies to all funds except the managed risk funds. Under the agreement, each share class pays an annual fee of 0.01% based on its respective average daily net assets to compensate CRMC for providing administrative services. These services include, but are not limited to, coordinating, monitoring, assisting and overseeing third parties that provide services to fund shareholders.
| 164 | American Funds Insurance Series |
Accounting and administrative services — The managed risk funds have a subadministration agreement with BNY Mellon under which the fund compensates BNY Mellon for providing accounting and administrative services to each of the managed risk funds’ share classes. These services include, but are not limited to, fund accounting (including calculation of net asset value), financial reporting and tax services. BNY Mellon is not a related party to the managed risk funds.
Reimbursement of fees and expenses — CRMC is currently reimbursing a portion of other expenses for each of the managed risk funds so that each fund’s expenses do not exceed 0.28% of its respective average daily net assets. Other expenses exclude investment advisory services and distribution services fees. For the year ended December 31, 2014, total expenses reimbursed by CRMC were $335,000.
Class-specific expenses and reimbursements under the agreements described above were as follows (dollars in thousands):
| Global Growth Fund | ||||||||||||
| Insurance | ||||||||||||
| Distribution | administrative | Administrative | ||||||||||
| Share class | services | services | services | |||||||||
| Class 1 | $— | $— | $152 | |||||||||
| Class 2 | 10,372 | — | 415 | |||||||||
| Class 4 | 22 | 22 | 1 | |||||||||
| Total class-specific expenses | $10,394 | $22 | $568 | |||||||||
| Global Small Capitalization Fund | ||||||||||||
| Insurance | ||||||||||||
| Distribution | administrative | Administrative | ||||||||||
| Share class | services | services | services | |||||||||
| Class 1 | $— | $— | $134 | |||||||||
| Class 2 | 7,171 | — | 287 | |||||||||
| Class 4 | 20 | 20 | 1 | |||||||||
| Total class-specific expenses | $7,191 | $20 | $422 | |||||||||
| Growth Fund | ||||||||||||
| Insurance | ||||||||||||
| Distribution | administrative | Administrative | ||||||||||
| Share class | services | services | services | |||||||||
| Class 1 | $— | $— | $699 | |||||||||
| Class 2 | 39,295 | — | 1,572 | |||||||||
| Class 3 | 378 | — | 21 | |||||||||
| Class 4 | 25 | 25 | 1 | |||||||||
| Total class-specific expenses | $39,698 | $25 | $2,293 | |||||||||
| International Fund | ||||||||||||
| Insurance | ||||||||||||
| Distribution | administrative | Administrative | ||||||||||
| Share class | services | services | services | |||||||||
| Class 1 | $— | $— | $334 | |||||||||
| Class 2 | 12,035 | — | 481 | |||||||||
| Class 3 | 77 | — | 4 | |||||||||
| Class 4 | 20 | 20 | 1 | |||||||||
| Total class-specific expenses | $12,132 | $20 | $820 | |||||||||
| New World Fund | ||||||||||||
| Insurance | ||||||||||||
| Distribution | administrative | Administrative | ||||||||||
| Share class | services | services | services | |||||||||
| Class 1 | $— | $— | $146 | |||||||||
| Class 2 | 3,067 | — | 123 | |||||||||
| Class 4 | 77 | 77 | 3 | |||||||||
| Total class-specific expenses | $3,144 | $77 | $272 | |||||||||
| Blue Chip Income and Growth Fund | ||||||||||||
| Insurance | ||||||||||||
| Distribution | administrative | Administrative | ||||||||||
| Share class | services | services | services | |||||||||
| Class 1 | $— | $— | $309 | |||||||||
| Class 2 | 9,284 | — | 372 | |||||||||
| Class 4 | 6 | 6 | — | * | ||||||||
| Total class-specific expenses | $9,290 | $6 | $681 | |||||||||
| Global Growth and Income Fund | ||||||||||||
| Insurance | ||||||||||||
| Distribution | administrative | Administrative | ||||||||||
| Share class | services | services | services | |||||||||
| Class 1 | $— | $— | $19 | |||||||||
| Class 2 | 4,393 | — | 176 | |||||||||
| Class 4 | 2 | 3 | — | * | ||||||||
| Total class-specific expenses | $4,395 | $3 | $195 | |||||||||
| Growth-Income Fund | ||||||||||||
| Insurance | ||||||||||||
| Distribution | administrative | Administrative | ||||||||||
| Share class | services | services | services | |||||||||
| Class 1 | $— | $— | $1,020 | |||||||||
| Class 2 | 36,520 | — | 1,461 | |||||||||
| Class 3 | 340 | — | 19 | |||||||||
| Class 4 | 30 | 30 | 1 | |||||||||
| Total class-specific expenses | $36,890 | $30 | $2,501 | |||||||||
See end of tables for footnote.
| American Funds Insurance Series | 165 |
| International Growth and Income Fund | ||||||||||||
| Insurance | ||||||||||||
| Distribution | administrative | Administrative | ||||||||||
| Share class | services | services | services | |||||||||
| Class 1 | $— | $— | $73 | |||||||||
| Class 2 | 648 | — | 26 | |||||||||
| Class 4 | 24 | 24 | 1 | |||||||||
| Total class-specific expenses | $672 | $24 | $100 | |||||||||
| Capital Income Builder | ||||||||||||
| Insurance | ||||||||||||
| Distribution | administrative | Administrative | ||||||||||
| Share class | services | services | services | |||||||||
| Class 1 | $— | $— | $1 | |||||||||
| Class 2 | — | — | — | |||||||||
| Class 4 | 39 | 39 | 2 | |||||||||
| Total class-specific expenses | $39 | $39 | $3 | |||||||||
| Asset Allocation Fund | ||||||||||||
| Insurance | ||||||||||||
| Distribution | administrative | Administrative | ||||||||||
| Share class | services | services | services | |||||||||
| Class 1 | $— | $— | $1,111 | |||||||||
| Class 2 | 14,034 | — | 561 | |||||||||
| Class 3 | 74 | — | 4 | |||||||||
| Class 4 | 26 | 26 | 1 | |||||||||
| Total class-specific expenses | $14,134 | $26 | $1,677 | |||||||||
| Global Balanced Fund | ||||||||||||
| Insurance | ||||||||||||
| Distribution | administrative | Administrative | ||||||||||
| Share class | services | services | services | |||||||||
| Class 1 | $— | $— | $4 | |||||||||
| Class 2 | 427 | — | 17 | |||||||||
| Class 4 | — | — | — | |||||||||
| Total class-specific expenses | $427 | $— | $21 | |||||||||
| Bond Fund | ||||||||||||
| Insurance | ||||||||||||
| Distribution | administrative | Administrative | ||||||||||
| Share class | services | services | services | |||||||||
| Class 1 | $— | $— | $485 | |||||||||
| Class 2 | 11,692 | — | 468 | |||||||||
| Class 4 | 31 | 32 | 1 | |||||||||
| Total class-specific expenses | $11,723 | $32 | $954 | |||||||||
| Global Bond Fund | ||||||||||||
| Insurance | ||||||||||||
| Distribution | administrative | Administrative | ||||||||||
| Share class | services | services | services | |||||||||
| Class 1 | $— | $— | $118 | |||||||||
| Class 2 | 3,692 | — | 148 | |||||||||
| Class 4 | 3 | 3 | — | * | ||||||||
| Total class-specific expenses | $3,695 | $3 | $266 | |||||||||
| High-Income Bond Fund | ||||||||||||
| Insurance | ||||||||||||
| Distribution | administrative | Administrative | ||||||||||
| Share class | services | services | services | |||||||||
| Class 1 | $— | $— | $93 | |||||||||
| Class 2 | 2,546 | — | 102 | |||||||||
| Class 3 | 33 | — | 2 | |||||||||
| Class 4 | 5 | 6 | — | * | ||||||||
| Total class-specific expenses | $2,584 | $6 | $197 | |||||||||
| Mortgage Fund | ||||||||||||
| Insurance | ||||||||||||
| Distribution | administrative | Administrative | ||||||||||
| Share class | services | services | services | |||||||||
| Class 1 | $— | $— | $24 | |||||||||
| Class 2 | 127 | — | 5 | |||||||||
| Class 4 | — | * | — | * | — | * | ||||||
| Total class-specific expenses | $127 | $— | * | $29 | ||||||||
| U.S. Government/AAA-Rated Securities Fund | ||||||||||||
| Insurance | ||||||||||||
| Distribution | administrative | Administrative | ||||||||||
| Share class | services | services | services | |||||||||
| Class 1 | $— | $— | $167 | |||||||||
| Class 2 | 4,463 | — | 179 | |||||||||
| Class 3 | 24 | — | 1 | |||||||||
| Class 4 | 22 | 22 | 1 | |||||||||
| Total class-specific expenses | $4,509 | $22 | $348 | |||||||||
| Cash Management Fund | ||||||||||||
| Insurance | ||||||||||||
| Distribution | administrative | Administrative | ||||||||||
| Share class | services | services | services | |||||||||
| Class 1 | $— | $— | $5 | |||||||||
| Class 2 | 906 | — | 36 | |||||||||
| Class 3 | 14 | — | 1 | |||||||||
| Class 4 | 6 | 6 | — | * | ||||||||
| Total class-specific expenses | $926 | $6 | $42 | |||||||||
| Managed Risk Growth Fund | ||||||||||||
| Insurance | ||||||||||||
| Distribution | administrative | |||||||||||
| services | services | |||||||||||
| Class P1 | $— | $— | ||||||||||
| Class P2 | 122 | 122 | ||||||||||
| Total class-specific expenses | $122 | $122 | ||||||||||
| Managed Risk International Fund | ||||||||||||
| Insurance | ||||||||||||
| Distribution | administrative | |||||||||||
| services | services | |||||||||||
| Class P1 | $— | $— | ||||||||||
| Class P2 | 71 | 71 | ||||||||||
| Total class-specific expenses | $71 | $71 | ||||||||||
| 166 | American Funds Insurance Series |
| Managed Risk Blue Chip Income and Growth Fund | ||||||||||||
| Insurance | ||||||||||||
| Distribution | administrative | |||||||||||
| services | services | |||||||||||
| Class P1 | $— | $— | ||||||||||
| Class P2 | 121 | 121 | ||||||||||
| Total class-specific expenses | $121 | $121 | ||||||||||
| Managed Risk Growth-Income Fund | ||||||||||||
| Insurance | ||||||||||||
| Distribution | administrative | |||||||||||
| services | services | |||||||||||
| Class P1 | $— | $— | ||||||||||
| Class P2 | 105 | 105 | ||||||||||
| Total class-specific expenses | $105 | $105 | ||||||||||
| Managed Risk Asset Allocation Fund | ||||||||||||
| Insurance | ||||||||||||
| Distribution | administrative | |||||||||||
| services | services | |||||||||||
| Class P1 | $— | $476 | ||||||||||
| Class P2 | 3,407 | 3,407 | ||||||||||
| Total class-specific expenses | $3,407 | $3,883 | ||||||||||
* Amount less than one thousand.
Trustees’ deferred compensation — Trustees who are unaffiliated with CRMC may elect to defer the cash payment of part or all of their compensation. These deferred amounts, which remain as liabilities of the funds, are treated as if invested in one or more of the American Funds. These amounts represent general, unsecured liabilities of the funds and vary according to the total returns of the selected funds. Trustees’ compensation, shown on the accompanying financial statements, includes current fees (either paid in cash or deferred) and a net increase in the value of the deferred amounts as follows (dollars in thousands):
| Increase in value of | Total trustees’ | |||||||||||
| Current fees | deferred amounts | compensation | ||||||||||
| Global Growth Fund | $ | 50 | $ | 5 | $ | 55 | ||||||
| Global Small Capitalization Fund | 37 | 3 | 40 | |||||||||
| Growth Fund | 200 | 47 | 247 | |||||||||
| International Fund | 75 | 21 | 96 | |||||||||
| New World Fund | 23 | 2 | 25 | |||||||||
| Blue Chip Income and Growth Fund | 57 | 4 | 61 | |||||||||
| Global Growth and Income Fund | 17 | 1 | 18 | |||||||||
| Growth-Income Fund | 216 | 53 | 269 | |||||||||
| International Growth and Income Fund | 9 | — | 9 | |||||||||
| Capital Income Builder | — | * | — | — | * | |||||||
| Asset Allocation Fund | 142 | 16 | 158 | |||||||||
| Global Balanced Fund | 2 | — | * | 2 | ||||||||
| Bond Fund | 81 | 7 | 88 | |||||||||
| Global Bond Fund | 23 | 1 | 24 | |||||||||
| High-Income Bond Fund | 17 | 5 | 22 | |||||||||
| Mortgage Fund | 2 | — | * | 2 | ||||||||
| U.S. Government/AAA-Rated Securities Fund | 30 | 5 | 35 | |||||||||
| Cash Management Fund | 4 | 2 | 6 | |||||||||
| Managed Risk Growth Fund | — | * | — | * | — | * | ||||||
| Managed Risk International Fund | — | * | — | * | — | * | ||||||
| Managed Risk Blue Chip Income and Growth Fund | — | * | — | * | — | * | ||||||
| Managed Risk Growth-Income Fund | — | * | — | * | — | * | ||||||
| Managed Risk Asset Allocation Fund | 11 | — | * | 11 | ||||||||
* Amount less than one thousand.
Affiliated officers and trustees — Officers and certain trustees of the series are or may be considered to be affiliated with CRMC, AFD and AFS. No affiliated officers or trustees received any compensation directly from the series.
| American Funds Insurance Series | 167 |
8. Capital share transactions
Capital share transactions in the funds were as follows (dollars and shares in thousands):
| Global Growth Fund | ||||||||||||||||||||||||||||||||
| Sales1, 2 | Reinvestments of dividends and distributions | Repurchases1 | Net increase (decrease) | |||||||||||||||||||||||||||||
| Share class | Amount | Shares | Amount | Shares | Amount | Shares | Amount | Shares | ||||||||||||||||||||||||
| Year ended December 31, 2014 | ||||||||||||||||||||||||||||||||
| Class 1 | $ | 184,637 | 6,455 | $ | 170,945 | 6,260 | $ | (174,151 | ) | (6,124 | ) | $ | 181,431 | 6,591 | ||||||||||||||||||
| Class 2 | 63,364 | 2,246 | 456,339 | 16,834 | (541,744 | ) | (19,183 | ) | (22,041 | ) | (103 | ) | ||||||||||||||||||||
| Class 4 | 19,507 | 693 | 914 | 33 | (1,305 | ) | (47 | ) | 19,116 | 679 | ||||||||||||||||||||||
| Total net increase (decrease) | $ | 267,508 | 9,394 | $ | 628,198 | 23,127 | $ | (717,200 | ) | (25,354 | ) | $ | 178,506 | 7,167 | ||||||||||||||||||
| Year ended December 31, 2013 | ||||||||||||||||||||||||||||||||
| Class 1 | $ | 258,243 | 10,345 | $ | 21,540 | 764 | $ | (652,054 | ) | (23,190 | ) | $ | (372,271 | ) | (12,081 | ) | ||||||||||||||||
| Class 2 | 273,799 | 12,031 | 50,234 | 1,788 | (692,022 | ) | (26,313 | ) | (367,989 | ) | (12,494 | ) | ||||||||||||||||||||
| Class 4 | 881 | 30 | 5 | — | 3 | (79 | ) | (2 | ) | 807 | 28 | |||||||||||||||||||||
| Total net increase (decrease) | $ | 532,923 | 22,406 | $ | 71,779 | 2,552 | $ | (1,344,155 | ) | (49,505 | ) | $ | (739,453 | ) | (24,547 | ) | ||||||||||||||||
| Global Small Capitalization Fund | ||||||||||||||||||||||||||||||||
| Sales1 | Reinvestments of dividends and distributions | Repurchases1 | Net increase (decrease) | |||||||||||||||||||||||||||||
| Share class | Amount | Shares | Amount | Shares | Amount | Shares | Amount | Shares | ||||||||||||||||||||||||
| Year ended December 31, 2014 | ||||||||||||||||||||||||||||||||
| Class 1 | $ | 271,446 | 10,305 | $ | 10,641 | 409 | $ | (129,888 | ) | (4,940 | ) | $ | 152,199 | 5,774 | ||||||||||||||||||
| Class 2 | 61,975 | 2,423 | 16,282 | 630 | (344,027 | ) | (13,338 | ) | (265,770 | ) | (10,285 | ) | ||||||||||||||||||||
| Class 4 | 11,043 | 422 | 43 | 1 | (3,103 | ) | (119 | ) | 7,983 | 304 | ||||||||||||||||||||||
| Total net increase (decrease) | $ | 344,464 | 13,150 | $ | 26,966 | 1,040 | $ | (477,018 | ) | (18,397 | ) | $ | (105,588 | ) | (4,207 | ) | ||||||||||||||||
| Year ended December 31, 2013 | ||||||||||||||||||||||||||||||||
| Class 1 | $ | 285,973 | 12,430 | $ | 9,160 | 410 | $ | (337,663 | ) | (15,049 | ) | $ | (42,530 | ) | (2,209 | ) | ||||||||||||||||
| Class 2 | 58,648 | 2,581 | 24,174 | 1,098 | (399,343 | ) | (17,694 | ) | (316,521 | ) | (14,015 | ) | ||||||||||||||||||||
| Class 4 | 4,861 | 201 | 3 | —3 | (1,241 | ) | (50 | ) | 3,623 | 151 | ||||||||||||||||||||||
| Total net increase (decrease) | $ | 349,482 | 15,212 | $ | 33,337 | 1,508 | $ | (738,247 | ) | (32,793 | ) | $ | (355,428 | ) | (16,073 | ) | ||||||||||||||||
| Growth Fund | ||||||||||||||||||||||||||||||||
| Sales1 | Reinvestments of dividends and distributions | Repurchases1 | Net (decrease) increase | |||||||||||||||||||||||||||||
| Share class | Amount | Shares | Amount | Shares | Amount | Shares | Amount | Shares | ||||||||||||||||||||||||
| Year ended December 31, 2014 | ||||||||||||||||||||||||||||||||
| Class 1 | $ | 427,546 | 5,435 | $ | 439,268 | 5,684 | $ | (902,919 | ) | (11,466 | ) | $ | (36,105 | ) | (347 | ) | ||||||||||||||||
| Class 2 | 161,775 | 2,066 | 891,416 | 11,588 | (2,361,274 | ) | (30,194 | ) | (1,308,083 | ) | (16,540 | ) | ||||||||||||||||||||
| Class 3 | 818 | 10 | 12,194 | 157 | (26,290 | ) | (333 | ) | (13,278 | ) | (166 | ) | ||||||||||||||||||||
| Class 4 | 19,956 | 255 | 559 | 7 | (2,162 | ) | (28 | ) | 18,353 | 234 | ||||||||||||||||||||||
| Total net increase (decrease) | $ | 610,095 | 7,766 | $ | 1,343,437 | 17,436 | $ | (3,292,645 | ) | (42,021 | ) | $ | (1,339,113 | ) | (16,819 | ) | ||||||||||||||||
| Year ended December 31, 2013 | ||||||||||||||||||||||||||||||||
| Class 1 | $ | 294,640 | 4,226 | $ | 77,034 | 1,051 | $ | (2,235,166 | ) | (32,949 | ) | $ | (1,863,492 | ) | (27,672 | ) | ||||||||||||||||
| Class 2 | 157,902 | 2,305 | 142,471 | 1,972 | (2,838,847 | ) | (41,366 | ) | (2,538,474 | ) | (37,089 | ) | ||||||||||||||||||||
| Class 3 | 1,530 | 21 | 1,987 | 27 | (27,728 | ) | (401 | ) | (24,211 | ) | (353 | ) | ||||||||||||||||||||
| Class 4 | 4,782 | 67 | 32 | 1 | (399 | ) | (6 | ) | 4,415 | 62 | ||||||||||||||||||||||
| Total net increase (decrease) | $ | 458,854 | 6,619 | $ | 221,524 | 3,051 | $ | (5,102,140 | ) | (74,722 | ) | $ | (4,421,762 | ) | (65,052 | ) | ||||||||||||||||
| 168 | American Funds Insurance Series |
| International Fund | ||||||||||||||||||||||||||||||||
| Sales1 | Reinvestments of dividends | Repurchases1 | Net increase (decrease) | |||||||||||||||||||||||||||||
| Share class | Amount | Shares | Amount | Shares | Amount | Shares | Amount | Shares | ||||||||||||||||||||||||
| Year ended December 31, 2014 | ||||||||||||||||||||||||||||||||
| Class 1 | $ | 380,142 | 17,940 | $ | 56,042 | 2,782 | $ | (341,755 | ) | (16,103 | ) | $ | 94,429 | 4,619 | ||||||||||||||||||
| Class 2 | 227,750 | 10,810 | 62,808 | 3,135 | (1,641,111 | ) | (78,073 | ) | (1,350,553 | ) | (64,128 | ) | ||||||||||||||||||||
| Class 3 | 229 | 10 | 585 | 29 | (7,077 | ) | (334 | ) | (6,263 | ) | (295 | ) | ||||||||||||||||||||
| Class 4 | 17,887 | 843 | 253 | 13 | (1,144 | ) | (54 | ) | 16,996 | 802 | ||||||||||||||||||||||
| Total net increase (decrease) | $ | 626,008 | 29,603 | $ | 119,688 | 5,959 | $ | (1,991,087 | ) | (94,564 | ) | $ | (1,245,391 | ) | (59,002 | ) | ||||||||||||||||
| Year ended December 31, 2013 | ||||||||||||||||||||||||||||||||
| Class 1 | $ | 248,721 | 12,978 | $ | 50,434 | 2,504 | $ | (1,206,929 | ) | (63,495 | ) | $ | (907,774 | ) | (48,013 | ) | ||||||||||||||||
| Class 2 | 213,458 | 11,190 | 75,225 | 3,750 | (865,300 | ) | (45,337 | ) | (576,617 | ) | (30,397 | ) | ||||||||||||||||||||
| Class 3 | 685 | 35 | 614 | 31 | (6,904 | ) | (362 | ) | (5,605 | ) | (296 | ) | ||||||||||||||||||||
| Class 4 | 2,148 | 110 | 23 | 1 | (194 | ) | (10 | ) | 1,977 | 101 | ||||||||||||||||||||||
| Total net increase (decrease) | $ | 465,012 | 24,313 | $ | 126,296 | 6,286 | $ | (2,079,327 | ) | (109,204 | ) | $ | (1,488,019 | ) | (78,605 | ) | ||||||||||||||||
| New World Fund | ||||||||||||||||||||||||||||||||
| Sales1 | Reinvestments of dividends and distributions | Repurchases1 | Net increase (decrease) | |||||||||||||||||||||||||||||
| Share class | Amount | Shares | Amount | Shares | Amount | Shares | Amount | Shares | ||||||||||||||||||||||||
| Year ended December 31, 2014 | ||||||||||||||||||||||||||||||||
| Class 1 | $ | 324,674 | 13,748 | $ | 159,199 | 6,820 | $ | (159,490 | ) | (6,712 | ) | $ | 324,383 | 13,856 | ||||||||||||||||||
| Class 2 | 67,274 | 3,007 | 133,538 | 5,749 | (199,405 | ) | (8,528 | ) | 1,407 | 228 | ||||||||||||||||||||||
| Class 4 | 66,188 | 2,863 | 3,128 | 137 | (4,760 | ) | (202 | ) | 64,556 | 2,798 | ||||||||||||||||||||||
| Total net increase (decrease) | $ | 458,136 | 19,618 | $ | 295,865 | 12,706 | $ | (363,655 | ) | (15,442 | ) | $ | 390,346 | 16,882 | ||||||||||||||||||
| Year ended December 31, 2013 | ||||||||||||||||||||||||||||||||
| Class 1 | $ | 291,376 | 12,346 | $ | 26,867 | 1,123 | $ | (189,247 | ) | (7,862 | ) | $ | 128,996 | 5,607 | ||||||||||||||||||
| Class 2 | 67,014 | 2,889 | 23,403 | 991 | (277,349 | ) | (11,889 | ) | (186,932 | ) | (8,009 | ) | ||||||||||||||||||||
| Class 4 | 8,180 | 339 | 96 | 4 | (188 | ) | (8 | ) | 8,088 | 335 | ||||||||||||||||||||||
| Total net increase (decrease) | $ | 366,570 | 15,574 | $ | 50,366 | 2,118 | $ | (466,784 | ) | (19,759 | ) | $ | (49,848 | ) | (2,067 | ) | ||||||||||||||||
| Blue Chip Income and Growth Fund | ||||||||||||||||||||||||||||||||
| Sales1 | Reinvestments of dividends | Repurchases1 | Net increase (decrease) | |||||||||||||||||||||||||||||
| Share class | Amount | Shares | Amount | Shares | Amount | Shares | Amount | Shares | ||||||||||||||||||||||||
| Year ended December 31, 2014 | ||||||||||||||||||||||||||||||||
| Class 1 | $ | 634,484 | 44,701 | $ | 109,528 | 7,600 | $ | (357,453 | ) | (25,605 | ) | $ | 386,559 | 26,696 | ||||||||||||||||||
| Class 2 | 30,187 | 2,104 | 111,072 | 7,771 | (593,568 | ) | (42,833 | ) | (452,309 | ) | (32,958 | ) | ||||||||||||||||||||
| Class 4 | 11,406 | 792 | 215 | 15 | (2,557 | ) | (182 | ) | 9,064 | 625 | ||||||||||||||||||||||
| Total net increase (decrease) | $ | 676,077 | 47,597 | $ | 220,815 | 15,386 | $ | (953,578 | ) | (68,620 | ) | $ | (56,686 | ) | (5,637 | ) | ||||||||||||||||
| Year ended December 31, 2013 | ||||||||||||||||||||||||||||||||
| Class 1 | $ | 986,042 | 89,659 | $ | 54,549 | 4,323 | $ | (174,356 | ) | (14,648 | ) | $ | 866,235 | 79,334 | ||||||||||||||||||
| Class 2 | 13,596 | 1,173 | 66,918 | 5,356 | (663,556 | ) | (57,363 | ) | (583,042 | ) | (50,834 | ) | ||||||||||||||||||||
| Class 4 | 101 | 8 | 2 | — | 3 | — | 3 | — | 3 | 103 | 8 | |||||||||||||||||||||
| Total net increase (decrease) | $ | 999,739 | 90,840 | $ | 121,469 | 9,679 | $ | (837,912 | ) | (72,011 | ) | $ | 283,296 | 28,508 | ||||||||||||||||||
See end of tables for footnotes.
| American Funds Insurance Series | 169 |
| Global Growth and Income Fund | ||||||||||||||||||||||||||||||||
| Sales1 | Reinvestments of dividends | Repurchases1 | Net (decrease) increase | |||||||||||||||||||||||||||||
| Share class | Amount | Shares | Amount | Shares | Amount | Shares | Amount | Shares | ||||||||||||||||||||||||
| Year ended December 31, 2014 | ||||||||||||||||||||||||||||||||
| Class 1 | $ | 34,831 | 2,706 | $ | 7,340 | 582 | $ | (51,693 | ) | (4,103 | ) | $ | (9,522 | ) | (815 | ) | ||||||||||||||||
| Class 2 | 29,379 | 2,291 | 59,444 | 4,718 | (264,395 | ) | (20,538 | ) | (175,572 | ) | (13,529 | ) | ||||||||||||||||||||
| Class 4 | 1,666 | 129 | 55 | 4 | (780 | ) | (61 | ) | 941 | 72 | ||||||||||||||||||||||
| Total net increase (decrease) | $ | 65,876 | 5,126 | $ | 66,839 | 5,304 | $ | (316,868 | ) | (24,702 | ) | $ | (184,153 | ) | (14,272 | ) | ||||||||||||||||
| Year ended December 31, 2013 | ||||||||||||||||||||||||||||||||
| Class 1 | $ | 38,885 | 3,340 | $ | 6,806 | 566 | $ | (52,061 | ) | (4,474 | ) | $ | (6,370 | ) | (568 | ) | ||||||||||||||||
| Class 2 | 35,387 | 3,082 | 56,388 | 4,700 | (421,844 | ) | (36,504 | ) | (330,069 | ) | (28,722 | ) | ||||||||||||||||||||
| Class 4 | 678 | 56 | 19 | 2 | (162 | ) | (13 | ) | 535 | 45 | ||||||||||||||||||||||
| Total net increase (decrease) | $ | 74,950 | 6,478 | $ | 63,213 | 5,268 | $ | (474,067 | ) | (40,991 | ) | $ | (335,904 | ) | (29,245 | ) | ||||||||||||||||
| Growth-Income Fund | ||||||||||||||||||||||||||||||||
| Sales1 | Reinvestments of dividends and distributions | Repurchases1 | Net increase (decrease) | |||||||||||||||||||||||||||||
| Share class | Amount | Shares | Amount | Shares | Amount | Shares | Amount | Shares | ||||||||||||||||||||||||
| Year ended December 31, 2014 | ||||||||||||||||||||||||||||||||
| Class 1 | $ | 1,350,590 | 26,045 | $ | 641,213 | 12,554 | $ | (1,449,140 | ) | (28,021 | ) | $ | 542,663 | 10,578 | ||||||||||||||||||
| Class 2 | 146,775 | 2,843 | 890,805 | 17,580 | (2,265,133 | ) | (44,088 | ) | (1,227,553 | ) | (23,665 | ) | ||||||||||||||||||||
| Class 3 | 1,337 | 25 | 11,614 | 227 | (29,526 | ) | (570 | ) | (16,575 | ) | (318 | ) | ||||||||||||||||||||
| Class 4 | 28,729 | 553 | 674 | 13 | (2,803 | ) | (54 | ) | 26,600 | 512 | ||||||||||||||||||||||
| Total net increase (decrease) | $ | 1,527,431 | 29,466 | $ | 1,544,306 | 30,374 | $ | (3,746,602 | ) | (72,733 | ) | $ | (674,865 | ) | (12,893 | ) | ||||||||||||||||
| Year ended December 31, 2013 | ||||||||||||||||||||||||||||||||
| Class 1 | $ | 970,097 | 21,875 | $ | 142,493 | 2,962 | $ | (3,617,332 | ) | (84,723 | ) | $ | (2,504,742 | ) | (59,886 | ) | ||||||||||||||||
| Class 2 | 101,521 | 2,274 | 185,855 | 3,897 | (2,617,064 | ) | (59,419 | ) | (2,329,688 | ) | (53,248 | ) | ||||||||||||||||||||
| Class 3 | 1,397 | 31 | 2,493 | 52 | (28,707 | ) | (644 | ) | (24,817 | ) | (561 | ) | ||||||||||||||||||||
| Class 4 | 3,337 | 72 | 32 | 1 | (357 | ) | (8 | ) | 3,012 | 65 | ||||||||||||||||||||||
| Total net increase (decrease) | $ | 1,076,352 | 24,252 | $ | 330,873 | 6,912 | $ | (6,263,460 | ) | (144,794 | ) | $ | (4,856,235 | ) | (113,630 | ) | ||||||||||||||||
| International Growth and Income Fund | ||||||||||||||||||||||||||||||||
| Sales1 | Reinvestments of dividends and distributions | Repurchases1 | Net increase (decrease) | |||||||||||||||||||||||||||||
| Share class | Amount | Shares | Amount | Shares | Amount | Shares | Amount | Shares | ||||||||||||||||||||||||
| Year ended December 31, 2014 | ||||||||||||||||||||||||||||||||
| Class 1 | $ | 135,449 | 7,581 | $ | 30,562 | 1,854 | $ | (65,051 | ) | (3,745 | ) | $ | 100,960 | 5,690 | ||||||||||||||||||
| Class 2 | 16,759 | 964 | 9,825 | 597 | (18,584 | ) | (1,055 | ) | 8,000 | 506 | ||||||||||||||||||||||
| Class 4 | 21,190 | 1,211 | 639 | 39 | (921 | ) | (52 | ) | 20,908 | 1,198 | ||||||||||||||||||||||
| Total net increase (decrease) | $ | 173,398 | 9,756 | $ | 41,026 | 2,490 | $ | (84,556 | ) | (4,852 | ) | $ | 129,868 | 7,394 | ||||||||||||||||||
| Year ended December 31, 2013 | ||||||||||||||||||||||||||||||||
| Class 1 | $ | 432,753 | 27,502 | $ | 28,659 | 1,689 | $ | (45,474 | ) | (2,646 | ) | $ | 415,938 | 26,545 | ||||||||||||||||||
| Class 2 | 21,144 | 1,309 | 10,078 | 596 | (31,345 | ) | (1,880 | ) | (123 | ) | 25 | |||||||||||||||||||||
| Class 4 | 791 | 45 | 11 | 1 | (105 | ) | (6 | ) | 697 | 40 | ||||||||||||||||||||||
| Total net increase (decrease) | $ | 454,688 | 28,856 | $ | 38,748 | 2,286 | $ | (76,924 | ) | (4,532 | ) | $ | 416,512 | 26,610 | ||||||||||||||||||
| 170 | American Funds Insurance Series |
| Capital Income Builder | ||||||||||||||||||||||||||||||||||||||||
| Proceeds from initial capitalization | Sales1 | Reinvestments of dividends and distributions | Repurchases1 | Net increase | ||||||||||||||||||||||||||||||||||||
| Share class | Amount | Shares | Amount | Shares | Amount | Shares | Amount | Shares | Amount | Shares | ||||||||||||||||||||||||||||||
| Year ended December 31, 20144 | ||||||||||||||||||||||||||||||||||||||||
| Class 1 | $ | 19,998 | 2,000 | $ | 154 | 16 | $ | 409 | 41 | $ | (36 | ) | (4 | ) | $ | 20,525 | 2,053 | |||||||||||||||||||||||
| Class 2 | 1 | — | 3 | — | 3 | — | 3 | — | 3 | — | 3 | — | — | 1 | — | 3 | ||||||||||||||||||||||||
| Class 4 | 1 | — | 3 | 56,746 | 5,678 | 520 | 53 | (1,130 | ) | (113 | ) | 56,137 | 5,618 | |||||||||||||||||||||||||||
| Total net increase (decrease) | $ | 20,000 | 2,000 | $ | 56,900 | 5,694 | $ | 929 | 94 | $ | (1,166 | ) | (117 | ) | $ | 76,663 | 7,671 | |||||||||||||||||||||||
| Asset Allocation Fund | ||||||||||||||||||||||||||||||||
| Sales1 | Reinvestments of dividends and distributions | Repurchases1 | Net increase (decrease) | |||||||||||||||||||||||||||||
| Share class | Amount | Shares | Amount | Shares | Amount | Shares | Amount | Shares | ||||||||||||||||||||||||
| Year ended December 31, 2014 | ||||||||||||||||||||||||||||||||
| Class 1 | $ | 1,900,080 | 84,968 | $ | 731,542 | 33,258 | $ | (1,038,802 | ) | (46,153 | ) | $ | 1,592,820 | 72,073 | ||||||||||||||||||
| Class 2 | 155,081 | 6,998 | 356,950 | 16,361 | (715,536 | ) | (32,277 | ) | (203,505 | ) | (8,918 | ) | ||||||||||||||||||||
| Class 3 | 1,259 | 57 | 2,611 | 118 | (6,288 | ) | (281 | ) | (2,418 | ) | (106 | ) | ||||||||||||||||||||
| Class 4 | 32,797 | 1,481 | 681 | 31 | (2,050 | ) | (94 | ) | 31,428 | 1,418 | ||||||||||||||||||||||
| Total net increase (decrease) | $ | 2,089,217 | 93,504 | $ | 1,091,784 | 49,768 | $ | (1,762,676 | ) | (78,805 | ) | $ | 1,418,325 | 64,467 | ||||||||||||||||||
| Year ended December 31, 2013 | ||||||||||||||||||||||||||||||||
| Class 1 | $ | 1,917,257 | 91,983 | $ | 160,436 | 7,366 | $ | (459,506 | ) | (22,330 | ) | $ | 1,618,187 | 77,019 | ||||||||||||||||||
| Class 2 | 214,460 | 10,499 | 79,271 | 3,677 | (851,000 | ) | (41,687 | ) | (557,269 | ) | (27,511 | ) | ||||||||||||||||||||
| Class 3 | 1,510 | 72 | 607 | 28 | (5,389 | ) | (259 | ) | (3,272 | ) | (159 | ) | ||||||||||||||||||||
| Class 4 | 487 | 22 | 4 | — | — | 3 | — | 3 | 491 | 22 | ||||||||||||||||||||||
| Total net increase (decrease) | $ | 2,133,714 | 102,576 | $ | 240,318 | 11,071 | $ | (1,315,895 | ) | (64,276 | ) | $ | 1,058,137 | 49,371 | ||||||||||||||||||
| Global Balanced Fund | ||||||||||||||||||||||||||||||||
| Sales1 | Reinvestments of dividends and distributions | Repurchases1 | Net increase | |||||||||||||||||||||||||||||
| Share class | Amount | Shares | Amount | Shares | Amount | Shares | Amount | Shares | ||||||||||||||||||||||||
| Year ended December 31, 2014 | ||||||||||||||||||||||||||||||||
| Class 1 | $ | 229 | 20 | $ | 1,503 | 134 | $ | (127 | ) | (11 | ) | $ | 1,605 | 143 | ||||||||||||||||||
| Class 2 | 29,687 | 2,589 | 6,852 | 616 | (9,380 | ) | (820 | ) | 27,159 | 2,385 | ||||||||||||||||||||||
| Class 4 | — | — | — | 3 | — | 3 | — | — | — | 3 | — | 3 | ||||||||||||||||||||
| Total net increase (decrease) | $ | 29,916 | 2,609 | $ | 8,355 | 750 | $ | (9,507 | ) | (831 | ) | $ | 28,764 | 2,528 | ||||||||||||||||||
| Year ended December 31, 2013 | ||||||||||||||||||||||||||||||||
| Class 1 | $ | 377 | 35 | $ | 817 | 73 | $ | (184 | ) | (17 | ) | $ | 1,010 | 91 | ||||||||||||||||||
| Class 2 | 33,820 | 3,112 | 3,212 | 288 | (13,106 | ) | (1,202 | ) | 23,926 | 2,198 | ||||||||||||||||||||||
| Class 4 | — | — | — | 3 | — | 3 | — | — | — | 3 | — | 3 | ||||||||||||||||||||
| Total net increase (decrease) | $ | 34,197 | 3,147 | $ | 4,029 | 361 | $ | (13,290 | ) | (1,219 | ) | $ | 24,936 | 2,289 | ||||||||||||||||||
See end of tables for footnotes.
| American Funds Insurance Series | 171 |
| Bond Fund | ||||||||||||||||||||||||||||||||
| Sales1 | Reinvestments of dividends and distributions | Repurchases1 | Net increase (decrease) | |||||||||||||||||||||||||||||
| Share class | Amount | Shares | Amount | Shares | Amount | Shares | Amount | Shares | ||||||||||||||||||||||||
| Year ended December 31, 2014 | ||||||||||||||||||||||||||||||||
| Class 1 | $ | 754,186 | 68,208 | $ | 107,710 | 9,742 | $ | (542,787 | ) | (48,790 | ) | $ | 319,109 | 29,160 | ||||||||||||||||||
| Class 2 | 177,278 | 16,106 | 90,634 | 8,290 | (619,817 | ) | (56,644 | ) | (351,905 | ) | (32,248 | ) | ||||||||||||||||||||
| Class 4 | 31,784 | 2,869 | 501 | 45 | (5,766 | ) | (522 | ) | 26,519 | 2,392 | ||||||||||||||||||||||
| Total net increase (decrease) | $ | 963,248 | 87,183 | $ | 198,845 | 18,077 | $ | (1,168,370 | ) | (105,956 | ) | $ | (6,277 | ) | (696 | ) | ||||||||||||||||
| Year ended December 31, 2013 | ||||||||||||||||||||||||||||||||
| Class 1 | $ | 1,279,497 | 115,702 | $ | 133,350 | 12,270 | $ | (615,210 | ) | (54,877 | ) | $ | 797,637 | 73,095 | ||||||||||||||||||
| Class 2 | 408,953 | 37,839 | 140,114 | 13,025 | (587,137 | ) | (53,583 | ) | (38,070 | ) | (2,719 | ) | ||||||||||||||||||||
| Class 4 | 3,160 | 289 | 51 | 5 | (191 | ) | (18 | ) | 3,020 | 276 | ||||||||||||||||||||||
| Total net increase (decrease) | $ | 1,691,610 | 153,830 | $ | 273,515 | 25,300 | $ | (1,202,538 | ) | (108,478 | ) | $ | 762,587 | 70,652 | ||||||||||||||||||
| Global Bond Fund | ||||||||||||||||||||||||||||||||
| Sales1 | Reinvestments of dividends and distributions | Repurchases1 | Net increase (decrease) | |||||||||||||||||||||||||||||
| Share class | Amount | Shares | Amount | Shares | Amount | Shares | Amount | Shares | ||||||||||||||||||||||||
| Year ended December 31, 2014 | ||||||||||||||||||||||||||||||||
| Class 1 | $ | 241,123 | 19,710 | $ | 31,181 | 2,593 | $ | (156,449 | ) | (12,855 | ) | $ | 115,855 | 9,448 | ||||||||||||||||||
| Class 2 | 24,571 | 2,029 | 30,636 | 2,560 | (157,807 | ) | (13,005 | ) | (102,600 | ) | (8,416 | ) | ||||||||||||||||||||
| Class 4 | 4,775 | 392 | 61 | 5 | (626 | ) | (52 | ) | 4,210 | 345 | ||||||||||||||||||||||
| Total net increase (decrease) | $ | 270,469 | 22,131 | $ | 61,878 | 5,158 | $ | (314,882 | ) | (25,912 | ) | $ | 17,465 | 1,377 | ||||||||||||||||||
| Year ended December 31, 2013 | ||||||||||||||||||||||||||||||||
| Class 1 | $ | 400,246 | 33,288 | $ | 13,495 | 1,134 | $ | (240,206 | ) | (20,328 | ) | $ | 173,535 | 14,094 | ||||||||||||||||||
| Class 2 | 74,483 | 6,243 | 19,203 | 1,622 | (198,058 | ) | (16,777 | ) | (104,372 | ) | (8,912 | ) | ||||||||||||||||||||
| Class 4 | 10 | 1 | — | 3 | — | 3 | — | 3 | — | 3 | 10 | 1 | ||||||||||||||||||||
| Total net increase (decrease) | $ | 474,739 | 39,532 | $ | 32,698 | 2,756 | $ | (438,264 | ) | (37,105 | ) | $ | 69,173 | 5,183 | ||||||||||||||||||
| High-Income Bond Fund | ||||||||||||||||||||||||||||||||
| Sales1 | Reinvestments of dividends | Repurchases1 | Net increase (decrease) | |||||||||||||||||||||||||||||
| Share class | Amount | Shares | Amount | Shares | Amount | Shares | Amount | Shares | ||||||||||||||||||||||||
| Year ended December 31, 2014 | ||||||||||||||||||||||||||||||||
| Class 1 | $ | 226,447 | 20,029 | $ | 60,198 | 5,726 | $ | (69,861 | ) | (6,187 | ) | $ | 216,784 | 19,568 | ||||||||||||||||||
| Class 2 | 27,460 | 2,460 | 55,536 | 5,341 | (167,244 | ) | (15,003 | ) | (84,248 | ) | (7,202 | ) | ||||||||||||||||||||
| Class 3 | 1,235 | 109 | 966 | 91 | (4,384 | ) | (388 | ) | (2,183 | ) | (188 | ) | ||||||||||||||||||||
| Class 4 | 5,476 | 487 | 46 | 4 | (5,386 | ) | (472 | ) | 136 | 19 | ||||||||||||||||||||||
| Total net increase (decrease) | $ | 260,618 | 23,085 | $ | 116,746 | 11,162 | $ | (246,875 | ) | (22,050 | ) | $ | 130,489 | 12,197 | ||||||||||||||||||
| Year ended December 31, 2013 | ||||||||||||||||||||||||||||||||
| Class 1 | $ | 176,901 | 15,477 | $ | 55,635 | 5,010 | $ | (271,595 | ) | (23,719 | ) | $ | (39,059 | ) | (3,232 | ) | ||||||||||||||||
| Class 2 | 55,098 | 4,920 | 70,100 | 6,387 | (199,655 | ) | (17,691 | ) | (74,457 | ) | (6,384 | ) | ||||||||||||||||||||
| Class 3 | 2,555 | 222 | 1,237 | 111 | (6,052 | ) | (528 | ) | (2,260 | ) | (195 | ) | ||||||||||||||||||||
| Class 4 | 92 | 8 | 5 | — | 3 | ’ | — | 3 | — | 3 | 97 | 8 | ||||||||||||||||||||
| Total net increase (decrease) | $ | 234,646 | 20,627 | $ | 126,977 | 11,508 | $ | (477,302 | ) | (41,938 | ) | $ | (115,679 | ) | (9,803 | ) | ||||||||||||||||
| 172 | American Funds Insurance Series |
| Mortgage Fund | ||||||||||||||||||||||||||||||||
| Sales1 | Reinvestments of dividends and distributions | Repurchases1 | Net increase | |||||||||||||||||||||||||||||
| Share class | Amount | Shares | Amount | Shares | Amount | Shares | Amount | Shares | ||||||||||||||||||||||||
| Year ended December 31, 2014 | ||||||||||||||||||||||||||||||||
| Class 1 | $ | 98,137 | 9,226 | $ | 2,596 | 243 | $ | (16,394 | ) | (1,558 | ) | $ | 84,339 | 7,911 | ||||||||||||||||||
| Class 2 | 7,547 | 713 | 364 | 34 | (6,687 | ) | (633 | ) | 1,224 | 114 | ||||||||||||||||||||||
| Class 4 | 978 | 92 | 3 | — | 3 | (513 | ) | (48 | ) | 468 | 44 | |||||||||||||||||||||
| Total net increase (decrease) | $ | 106,662 | 10,031 | $ | 2,963 | 277 | $ | (23,594 | ) | (2,239 | ) | $ | 86,031 | 8,069 | ||||||||||||||||||
| Year ended December 31, 2013 | ||||||||||||||||||||||||||||||||
| Class 1 | $ | 131,740 | 12,668 | $ | 1,693 | 165 | $ | (18,122 | ) | (1,746 | ) | $ | 115,311 | 11,087 | ||||||||||||||||||
| Class 2 | 11,184 | 1,078 | 311 | 30 | (10,545 | ) | (1,019 | ) | 950 | 89 | ||||||||||||||||||||||
| Class 4 | — | — | — | 3 | — | 3 | — | — | — | 3 | — | 3 | ||||||||||||||||||||
| Total net increase (decrease) | $ | 142,924 | 13,746 | $ | 2,004 | 195 | $ | (28,667 | ) | (2,765 | ) | $ | 116,261 | 11,176 | ||||||||||||||||||
| U.S. Government AAA-Rated Securities Fund | ||||||||||||||||||||||||||||||||
| Sales1 | Reinvestments of dividends and distributions | Repurchases1 | Net increase (decrease) | |||||||||||||||||||||||||||||
| Share class | Amount | Shares | Amount | Shares | Amount | Shares | Amount | Shares | ||||||||||||||||||||||||
| Year ended December 31, 2014 | ||||||||||||||||||||||||||||||||
| Class 1 | $ | 137,157 | 11,139 | $ | 22,540 | 1,819 | $ | (82,815 | ) | (6,714 | ) | $ | 76,882 | 6,244 | ||||||||||||||||||
| Class 2 | 28,567 | 2,357 | 18,675 | 1,521 | (200,417 | ) | (16,407 | ) | (153,175 | ) | (12,529 | ) | ||||||||||||||||||||
| Class 3 | 1,459 | 118 | 143 | 11 | (3,611 | ) | (293 | ) | (2,009 | ) | (164 | ) | ||||||||||||||||||||
| Class 4 | 41,142 | 3,315 | 325 | 26 | (20,338 | ) | (1,649 | ) | 21,129 | 1,692 | ||||||||||||||||||||||
| Total net increase (decrease) | $ | 208,325 | 16,929 | $ | 41,683 | 3,377 | $ | (307,181 | ) | (25,063 | ) | $ | (57,173 | ) | (4,757 | ) | ||||||||||||||||
| Year ended December 31, 2013 | ||||||||||||||||||||||||||||||||
| Class 1 | $ | 160,004 | 12,948 | $ | 61,436 | 5,042 | $ | (336,723 | ) | (27,279 | ) | $ | (115,283 | ) | (9,289 | ) | ||||||||||||||||
| Class 2 | 61,544 | 5,019 | 64,124 | 5,311 | (195,682 | ) | (16,029 | ) | (70,014 | ) | (5,699 | ) | ||||||||||||||||||||
| Class 3 | 1,142 | 93 | 573 | 47 | (6,009 | ) | (488 | ) | (4,294 | ) | (348 | ) | ||||||||||||||||||||
| Class 4 | 452 | 38 | 2 | — | 3 | (27 | ) | (2 | ) | 427 | 36 | |||||||||||||||||||||
| Total net increase (decrease) | $ | 223,142 | 18,098 | $ | 126,135 | 10,400 | $ | (538,441 | ) | (43,798 | ) | $ | (189,164 | ) | (15,300 | ) | ||||||||||||||||
| Cash Management Fund | ||||||||||||||||||||||||||||||||
| Sales1 | Reinvestments of dividends | Repurchases1 | Net increase (decrease) | |||||||||||||||||||||||||||||
| Share class | Amount | Shares | Amount | Shares | Amount | Shares | Amount | Shares | ||||||||||||||||||||||||
| Year ended December 31, 2014 | ||||||||||||||||||||||||||||||||
| Class 1 | $ | 30,209 | 2,674 | $ | — | — | $ | (38,206 | ) | (3,382 | ) | $ | (7,997 | ) | (708 | ) | ||||||||||||||||
| Class 2 | 155,395 | 14,015 | — | — | (217,194 | ) | (19,587 | ) | (61,799 | ) | (5,572 | ) | ||||||||||||||||||||
| Class 3 | 4,241 | 379 | — | — | (4,604 | ) | (411 | ) | (363 | ) | (32 | ) | ||||||||||||||||||||
| Class 4 | 14,839 | 1,316 | — | — | (7,600 | ) | (674 | ) | 7,239 | 642 | ||||||||||||||||||||||
| Total net increase (decrease) | $ | 204,684 | 18,384 | $ | — | — | $ | (267,604 | ) | (24,054 | ) | $ | (62,920 | ) | (5,670 | ) | ||||||||||||||||
| Year ended December 31, 2013 | ||||||||||||||||||||||||||||||||
| Class 1 | $ | 26,858 | 2,372 | $ | — | — | $ | (36,064 | ) | (3,184 | ) | $ | (9,206 | ) | (812 | ) | ||||||||||||||||
| Class 2 | 210,456 | 18,884 | — | — | (272,642 | ) | (24,465 | ) | (62,186 | ) | (5,581 | ) | ||||||||||||||||||||
| Class 3 | 6,711 | 597 | — | — | (9,101 | ) | (810 | ) | (2,390 | ) | (213 | ) | ||||||||||||||||||||
| Class 4 | — | — | — | — | — | — | — | — | ||||||||||||||||||||||||
| Total net increase (decrease) | $ | 244,025 | 21,853 | $ | — | — | $ | (317,807 | ) | (28,459 | ) | $ | (73,782 | ) | (6,606 | ) | ||||||||||||||||
See end of tables for footnotes.
| American Funds Insurance Series | 173 |
| Managed Risk Growth Fund | ||||||||||||||||||||||||||||||||||||||||
| Proceeds from initial capitalization | Sales1 | Reinvestments of dividends and distributions | Repurchases1 | Net increase | ||||||||||||||||||||||||||||||||||||
| Share class | Amount | Shares | Amount | Shares | Amount | Shares | Amount | Shares | Amount | Shares | ||||||||||||||||||||||||||||||
| Year ended December 31, 2014 | ||||||||||||||||||||||||||||||||||||||||
| Class P1 | $ | — | — | $ | 23 | 2 | $ | 5 | — | 3 | $ | (6 | ) | (1 | ) | $ | 22 | 1 | ||||||||||||||||||||||
| Class P2 | — | — | 58,735 | 5,108 | 1,857 | 164 | (8,675 | ) | (742 | ) | 51,917 | 4,530 | ||||||||||||||||||||||||||||
| Total net increase (decrease) | $ | — | — | $ | 58,758 | 5,110 | $ | 1,862 | 164 | $ | (8,681 | ) | (743 | ) | $ | 51,939 | 4,531 | |||||||||||||||||||||||
| Year ended December 31, 20135 | ||||||||||||||||||||||||||||||||||||||||
| Class P1 | $ | 100 | 10 | $ | 50 | 5 | $ | 1 | — | 3 | $ | (1 | ) | — | 3 | $ | 150 | 15 | ||||||||||||||||||||||
| Class P2 | 4,900 | 490 | 22,269 | 2,059 | 139 | 12 | (1,358 | ) | (126 | ) | 25,950 | 2,435 | ||||||||||||||||||||||||||||
| Total net increase (decrease) | $ | 5,000 | 500 | $ | 22,319 | 2,064 | $ | 140 | 12 | $ | (1,359 | ) | (126 | ) | $ | 26,100 | 2,450 | |||||||||||||||||||||||
| Managed Risk International Fund | ||||||||||||||||||||||||||||||||||||||||
| Proceeds from initial capitalization | Sales1 | Reinvestments of dividends | Repurchases1 | Net increase | ||||||||||||||||||||||||||||||||||||
| Share class | Amount | Shares | Amount | Shares | Amount | Shares | Amount | Shares | Amount | Shares | ||||||||||||||||||||||||||||||
| Year ended December 31, 2014 | ||||||||||||||||||||||||||||||||||||||||
| Class P1 | $ | — | — | $ | 14 | 1 | $ | 2 | — | 3 | $ | — | 3 | — | 3 | $ | 16 | 1 | ||||||||||||||||||||||
| Class P2 | — | — | 38,069 | 3,583 | 508 | 50 | (6,673 | ) | (626 | ) | 31,904 | 3,007 | ||||||||||||||||||||||||||||
| Total net increase (decrease) | $ | — | — | $ | 38,083 | 3,584 | $ | 510 | 50 | $ | (6,673 | ) | (626 | ) | $ | 31,920 | 3,008 | |||||||||||||||||||||||
| Year ended December 31, 20135 | ||||||||||||||||||||||||||||||||||||||||
| Class P1 | $ | 100 | 10 | $ | — | — | $ | 1 | — | 3 | $ | — | 3 | — | 3 | $ | 101 | 10 | ||||||||||||||||||||||
| Class P2 | 4,900 | 490 | 11,094 | 1,073 | 113 | 11 | (228 | ) | (23 | ) | 15,879 | 1,551 | ||||||||||||||||||||||||||||
| Total net increase (decrease) | $ | 5,000 | 500 | $ | 11,094 | 1,073 | $ | 114 | 11 | $ | (228 | ) | (23 | ) | $ | 15,980 | 1,561 | |||||||||||||||||||||||
| Managed Risk Blue Chip Income and Growth Fund | ||||||||||||||||||||||||||||||||||||||||
| Proceeds from initial capitalization | Sales1 | Reinvestments of dividends | Repurchases1 | Net increase | ||||||||||||||||||||||||||||||||||||
| Share class | Amount | Shares | Amount | Shares | Amount | Shares | Amount | Shares | Amount | Shares | ||||||||||||||||||||||||||||||
| Year ended December 31, 2014 | ||||||||||||||||||||||||||||||||||||||||
| Class P1 | $ | — | — | $ | 86 | 7 | $ | 6 | — | 3 | $ | (2 | ) | — | 3 | $ | 90 | 7 | ||||||||||||||||||||||
| Class P2 | — | — | 77,239 | 6,603 | 2,173 | 185 | (9,167 | ) | (776 | ) | 70,245 | 6,012 | ||||||||||||||||||||||||||||
| Total net increase (decrease) | $ | — | — | $ | 77,325 | 6,610 | $ | 2,179 | 185 | $ | (9,169 | ) | (776 | ) | $ | 70,335 | 6,019 | |||||||||||||||||||||||
| Year ended December 31, 20135 | ||||||||||||||||||||||||||||||||||||||||
| Class P1 | $ | 100 | 10 | $ | 11 | 1 | $ | 2 | — | 3 | $ | — | 3 | — | 3 | $ | 113 | 11 | ||||||||||||||||||||||
| Class P2 | 4,900 | 490 | 19,819 | 1,894 | 340 | 32 | (431 | ) | (41 | ) | 24,628 | 2,375 | ||||||||||||||||||||||||||||
| Total net increase (decrease) | $ | 5,000 | 500 | $ | 19,830 | 1,895 | $ | 342 | 32 | $ | (431 | ) | (41 | ) | $ | 24,741 | 2,386 | |||||||||||||||||||||||
| 174 | American Funds Insurance Series |
| Managed Risk Growth-Income Fund | ||||||||||||||||||||||||||||||||||||||||
| Proceeds from initial capitalization | Sales1 | Reinvestments of dividends and distributions | Repurchases1 | Net increase | ||||||||||||||||||||||||||||||||||||
| Share class | Amount | Shares | Amount | Shares | Amount | Shares | Amount | Shares | Amount | Shares | ||||||||||||||||||||||||||||||
| Year ended December 31, 2014 | ||||||||||||||||||||||||||||||||||||||||
| Class P1 | $ | — | — | $ | 21 | 2 | $ | 5 | — | 3 | $ | — | 3 | — | 3 | $ | 26 | 2 | ||||||||||||||||||||||
| Class P2 | — | — | 60,935 | 5,124 | 2,228 | 191 | (10,957 | ) | (913 | ) | 52,206 | 4,402 | ||||||||||||||||||||||||||||
| Total net increase (decrease) | $ | — | — | $ | 60,956 | 5,126 | $ | 2,233 | 191 | $ | (10,957 | ) | (913 | ) | $ | 52,232 | 4,404 | |||||||||||||||||||||||
| Year ended December 31, 20135 | ||||||||||||||||||||||||||||||||||||||||
| Class P1 | $ | 100 | 10 | $ | 6 | 1 | $ | 1 | — | 3 | $ | — | — | $ | 107 | 11 | ||||||||||||||||||||||||
| Class P2 | 4,900 | 490 | 17,350 | 1,603 | 201 | 18 | (226 | ) | (21 | ) | 22,225 | 2,090 | ||||||||||||||||||||||||||||
| Total net increase (decrease) | $ | 5,000 | 500 | $ | 17,356 | 1,604 | $ | 202 | 18 | $ | (226 | ) | (21 | ) | $ | 22,332 | 2,101 | |||||||||||||||||||||||
| Managed Risk Asset Allocation Fund | ||||||||||||||||||||||||||||||||
| Sales1 | Reinvestments of dividends | Repurchases1 | Net increase | |||||||||||||||||||||||||||||
| Share class | Amount | Shares | Amount | Shares | Amount | Shares | Amount | Shares | ||||||||||||||||||||||||
| Year ended December 31, 2014 | ||||||||||||||||||||||||||||||||
| Class P1 | $ | 158,370 | 13,095 | $ | 581 | 47 | $ | (9 | ) | (1 | ) | $ | 158,942 | 13,141 | ||||||||||||||||||
| Class P2 | 996,253 | 82,884 | 976 | 80 | (55,636 | ) | (4,564 | ) | 941,593 | 78,400 | ||||||||||||||||||||||
| Total net increase (decrease) | $ | 1,154,623 | 95,979 | $ | 1,557 | 127 | $ | (55,645 | ) | (4,565 | ) | $ | 1,100,535 | 91,541 | ||||||||||||||||||
| Year ended December 31, 2013 | ||||||||||||||||||||||||||||||||
| Class P1 | $ | 98,804 | 8,801 | $ | 1,126 | 96 | $ | (5,829 | ) | (521 | ) | $ | 94,101 | 8,376 | ||||||||||||||||||
| Class P2 | 728,422 | 64,675 | 7,025 | 598 | (11,691 | ) | (1,045 | ) | 723,756 | 64,228 | ||||||||||||||||||||||
| Total net increase (decrease) | $ | 827,226 | 73,476 | $ | 8,151 | 694 | $ | (17,520 | ) | (1,566 | ) | $ | 817,857 | 72,604 | ||||||||||||||||||
| 1 | Includes exchanges between share classes of the fund. |
| 2 | For the year ended December 31, 2013, includes amounts and shares issued to acquire the net assets of Global Discovery Fund. |
| 3 | Amount less than one thousand. |
| 4 | For the period May 1, 2014, commencement of operations, through December 31, 2014. |
| 5 | For the period May 1, 2013, commencement of operations, through December 31, 2013. |
9. Investment transactions and other disclosures
The following tables present additional information for the year ended December 31, 2014 (dollars in thousands):
| Global | Blue Chip | |||||||||||||||||||||||
| Global | Small | New | Income and | |||||||||||||||||||||
| Growth | Capitalization | Growth | International | World | Growth | |||||||||||||||||||
| Fund | Fund | Fund | Fund | Fund | Fund | |||||||||||||||||||
| Purchases of investment securities* | $ | 1,214,443 | $ | 1,091,298 | $ | 6,355,268 | $ | 1,381,380 | $ | 857,727 | $ | 2,394,238 | ||||||||||||
| Sales of investment securities* | 1,690,492 | 1,092,048 | 9,239,217 | 2,813,994 | 1,002,804 | 2,467,058 | ||||||||||||||||||
| Non-U.S. taxes paid on dividend income | 6,390 | 1,373 | 5,371 | 14,086 | 3,395 | 1,088 | ||||||||||||||||||
| Non-U.S. taxes paid on interest income | — | — | — | — | 78 | — | ||||||||||||||||||
| Non-U.S. taxes paid on realized gains | — | — | — | — | 1 | — | ||||||||||||||||||
| Non-U.S. taxes provided on unrealized gains | 135 | — | — | 1,982 | 4,958 | — | ||||||||||||||||||
| Dividends from affiliated issuers | — | 222 | 3,067 | — | — | — | ||||||||||||||||||
| Net realized gain from affiliated issuers | — | 1,449 | — | — | — | — | ||||||||||||||||||
See end of tables for footnote.
| American Funds Insurance Series | 175 |
| Global | International | |||||||||||||||||||||||
| Growth | Growth- | Growth | Capital | Asset | Global | |||||||||||||||||||
| and Income | Income | and Income | Income | Allocation | Balanced | |||||||||||||||||||
| Fund | Fund | Fund | Builder | Fund | Fund | |||||||||||||||||||
| Purchases of investment securities* | $ | 513,379 | $ | 5,771,695 | $ | 401,141 | $ | 81,414 | $ | 11,996,691 | $ | 138,697 | ||||||||||||
| Sales of investment securities* | 722,344 | 8,128,463 | 308,572 | 10,688 | 11,766,369 | 131,288 | ||||||||||||||||||
| Non-U.S. taxes paid on dividend income | 3,174 | 6,395 | 2,215 | 23 | 3,269 | 184 | ||||||||||||||||||
| Non-U.S. taxes paid on interest income | — | — | — | — | — | 9 | ||||||||||||||||||
| Non-U.S. taxes paid on realized gains | — | — | — | — | — | 2 | ||||||||||||||||||
| Non-U.S. taxes provided on unrealized gains | 5 | 3,569 | 193 | — | 108 | 3 | ||||||||||||||||||
| Dividends from affiliated issuers | 1,316 | — | — | — | — | — | ||||||||||||||||||
| Net realized gain from affiliated issuers | — | — | — | — | — | — | ||||||||||||||||||
| U.S. | ||||||||||||||||||||||||
| High- | Government/ | |||||||||||||||||||||||
| Global | Income | AAA-Rated | Cash | |||||||||||||||||||||
| Bond | Bond | Bond | Mortgage | Securities | Management | |||||||||||||||||||
| Fund | Fund | Fund | Fund | Fund | Fund | |||||||||||||||||||
| Purchases of investment securities* | $ | 25,849,455 | $ | 4,243,921 | $ | 1,152,794 | $ | 2,238,799 | $ | 9,996,605 | $ | — | ||||||||||||
| Sales of investment securities* | 25,947,835 | 4,324,239 | 995,578 | 2,189,452 | 10,220,255 | — | ||||||||||||||||||
| Non-U.S. taxes paid on dividend income | — | — | — | — | — | — | ||||||||||||||||||
| Non-U.S. taxes paid on interest income | 69 | 431 | 19 | — | — | — | ||||||||||||||||||
| Non-U.S. taxes refunded on realized gains | (9 | ) | — | — | — | — | — | |||||||||||||||||
| Non-U.S. taxes provided on unrealized gains | 76 | 91 | 10 | — | — | — | ||||||||||||||||||
| Dividends from affiliated issuers | — | — | — | — | — | — | ||||||||||||||||||
| Net realized gain from affiliated issuers | — | — | — | — | — | — | ||||||||||||||||||
| Managed | Managed | Managed | ||||||||||||||||||||||
| Managed | Managed | Risk Blue | Risk | Risk | ||||||||||||||||||||
| Risk | Risk | Chip Income | Growth- | Asset | ||||||||||||||||||||
| Growth | International | and Growth | Income | Allocation | ||||||||||||||||||||
| Fund | Fund | Fund | Fund | Fund | ||||||||||||||||||||
| Purchases of investment securities* | $ | 57,281 | $ | 36,102 | $ | 73,235 | $ | 58,078 | $ | 1,131,547 | ||||||||||||||
| Sales of investment securities* | 10,860 | 6,599 | 11,151 | 12,069 | 47,131 | |||||||||||||||||||
| Non-U.S. taxes paid on dividend income | — | — | — | — | — | |||||||||||||||||||
| Non-U.S. taxes paid on interest income | — | — | — | — | — | |||||||||||||||||||
| Non-U.S. taxes paid on realized gains | — | — | — | — | — | |||||||||||||||||||
| Non-U.S. taxes provided on unrealized gains | — | — | — | — | — | |||||||||||||||||||
| Dividends from affiliated issuers | 901 | 700 | 2,611 | 957 | 30,954 | |||||||||||||||||||
| Net realized gain from affiliated issuers | 1,399 | 743 | 2,062 | 1,859 | 7,887 | |||||||||||||||||||
* Excludes short-term securities and U.S. government obligations, if any.
10. Ownership concentration
At December 31, 2014, CRMC held aggregate ownership of 27% and 17% of the outstanding shares of Capital Income Builder and Global Balanced Fund, respectively. The ownership represents the seed money invested in the funds when each fund began operations.
| 176 | American Funds Insurance Series |
Financial highlights
| Income (loss) from investment operations1 | Dividends and distributions | |||||||||||||||||||||||||||||||||||||||||||||||
| Net asset value, beginning of period | Net investment income (loss) | Net gains (losses) on securities (both realized and unrealized) | Total from investment operations | Dividends (from net investment income) | Distributions (from capital gains) | Total dividends and distributions | Net asset value, end of period | Total return2 | Net assets, end of period (in millions) | Ratio of expenses to average net assets | Ratio of net income (loss) to average net assets | |||||||||||||||||||||||||||||||||||||
| Global Growth Fund | ||||||||||||||||||||||||||||||||||||||||||||||||
| Class 1: | ||||||||||||||||||||||||||||||||||||||||||||||||
| 12/31/14 | $ | 30.11 | $ | .31 | $ | .40 | $ | .71 | $ | (.40 | ) | $ | (2.94 | ) | $ | (3.34 | ) | $ | 27.48 | 2.52 | % | $ | 1,558 | .55 | % | 1.08 | % | |||||||||||||||||||||
| 12/31/13 | 23.58 | .31 | 6.62 | 6.93 | (.40 | ) | — | (.40 | ) | 30.11 | 29.51 | 1,508 | .55 | 1.17 | ||||||||||||||||||||||||||||||||||
| 12/31/12 | 19.40 | .30 | 4.14 | 4.44 | (.26 | ) | — | (.26 | ) | 23.58 | 22.89 | 1,466 | .56 | 1.38 | ||||||||||||||||||||||||||||||||||
| 12/31/11 | 21.61 | .29 | (2.16 | ) | (1.87 | ) | (.34 | ) | — | (.34 | ) | 19.40 | (8.66 | ) | 1,277 | .55 | 1.37 | |||||||||||||||||||||||||||||||
| 12/31/10 | 19.61 | .30 | 2.04 | 2.34 | (.34 | ) | — | (.34 | ) | 21.61 | 12.04 | 1,227 | .56 | 1.54 | ||||||||||||||||||||||||||||||||||
| Class 2: | ||||||||||||||||||||||||||||||||||||||||||||||||
| 12/31/14 | 29.92 | .24 | .41 | .65 | (.33 | ) | (2.94 | ) | (3.27 | ) | 27.30 | 2.31 | 3,992 | .80 | .85 | |||||||||||||||||||||||||||||||||
| 12/31/13 | 23.44 | .24 | 6.58 | 6.82 | (.34 | ) | — | (.34 | ) | 29.92 | 29.18 | 4,379 | .80 | .91 | ||||||||||||||||||||||||||||||||||
| 12/31/12 | 19.29 | .24 | 4.11 | 4.35 | (.20 | ) | — | (.20 | ) | 23.44 | 22.56 | 3,723 | .81 | 1.13 | ||||||||||||||||||||||||||||||||||
| 12/31/11 | 21.48 | .24 | (2.15 | ) | (1.91 | ) | (.28 | ) | — | (.28 | ) | 19.29 | (8.89 | ) | 3,535 | .80 | 1.13 | |||||||||||||||||||||||||||||||
| 12/31/10 | 19.50 | .25 | 2.03 | 2.28 | (.30 | ) | — | (.30 | ) | 21.48 | 11.75 | 4,308 | .81 | 1.30 | ||||||||||||||||||||||||||||||||||
| Class 4: | ||||||||||||||||||||||||||||||||||||||||||||||||
| 12/31/14 | 30.07 | .07 | .50 | .57 | (.36 | ) | (2.94 | ) | (3.30 | ) | 27.34 | 2.01 | 19 | 1.05 | .26 | |||||||||||||||||||||||||||||||||
| 12/31/13 | 23.58 | .13 | 6.77 | 6.90 | (.41 | ) | — | (.41 | ) | 30.07 | 29.36 | 1 | 1.06 | .43 | ||||||||||||||||||||||||||||||||||
| 12/31/123,4 | 23.53 | .01 | .29 | .30 | (.25 | ) | — | (.25 | ) | 23.58 | 1.27 | 5 | — | 6 | .02 | 2,5 | .04 | 2,5 | ||||||||||||||||||||||||||||||
| Global Small Capitalization Fund | ||||||||||||||||||||||||||||||||||||||||||||||||
| Class 1: | ||||||||||||||||||||||||||||||||||||||||||||||||
| 12/31/14 | $ | 25.69 | $ | .09 | $ | .52 | $ | .61 | $ | (.09 | ) | $ | (.12 | ) | $ | (.21 | ) | $ | 26.09 | 2.36 | % | $ | 1,411 | .74 | % | .34 | % | |||||||||||||||||||||
| 12/31/13 | 20.16 | .04 | 5.70 | 5.74 | (.21 | ) | — | (.21 | ) | 25.69 | 28.60 | 1,241 | .74 | .17 | ||||||||||||||||||||||||||||||||||
| 12/31/12 | 17.28 | .09 | 3.09 | 3.18 | (.30 | ) | — | (.30 | ) | 20.16 | 18.51 | 1,019 | .75 | .46 | ||||||||||||||||||||||||||||||||||
| 12/31/11 | 21.67 | .07 | (4.14 | ) | (4.07 | ) | (.32 | ) | — | (.32 | ) | 17.28 | (18.94 | ) | 795 | .74 | .36 | |||||||||||||||||||||||||||||||
| 12/31/10 | 18.00 | .13 | 3.91 | 4.04 | (.37 | ) | — | (.37 | ) | 21.67 | 22.76 | 818 | .75 | .69 | ||||||||||||||||||||||||||||||||||
| Class 2: | ||||||||||||||||||||||||||||||||||||||||||||||||
| 12/31/14 | 25.25 | .03 | .51 | .54 | (.03 | ) | (.12 | ) | (.15 | ) | 25.64 | 2.12 | 2,738 | .99 | .10 | |||||||||||||||||||||||||||||||||
| 12/31/13 | 19.86 | (.01 | ) | 5.60 | 5.59 | (.20 | ) | — | (.20 | ) | 25.25 | 28.28 | 2,955 | .99 | (.05 | ) | ||||||||||||||||||||||||||||||||
| 12/31/12 | 17.04 | .04 | 3.03 | 3.07 | (.25 | ) | — | (.25 | ) | 19.86 | 18.18 | 2,603 | 1.00 | .20 | ||||||||||||||||||||||||||||||||||
| 12/31/11 | 21.35 | .02 | (4.06 | ) | (4.04 | ) | (.27 | ) | — | (.27 | ) | 17.04 | (19.14 | ) | 2,450 | .99 | .10 | |||||||||||||||||||||||||||||||
| 12/31/10 | 17.74 | .08 | 3.86 | 3.94 | (.33 | ) | — | (.33 | ) | 21.35 | 22.41 | 3,189 | 1.00 | .45 | ||||||||||||||||||||||||||||||||||
| Class 4: | ||||||||||||||||||||||||||||||||||||||||||||||||
| 12/31/14 | 25.57 | (.05 | ) | .54 | .49 | (.02 | ) | (.12 | ) | (.14 | ) | 25.92 | 1.88 | 12 | 1.24 | (.17 | ) | |||||||||||||||||||||||||||||||
| 12/31/13 | 20.16 | (.12 | ) | 5.74 | 5.62 | (.21 | ) | — | (.21 | ) | 25.57 | 28.01 | 4 | 1.24 | (.50 | ) | ||||||||||||||||||||||||||||||||
| 12/31/123,4 | 19.68 | .01 | .54 | .55 | (.07 | ) | — | (.07 | ) | 20.16 | 2.80 | 5 | — | 6 | .04 | 2,5 | .04 | 2,5 | ||||||||||||||||||||||||||||||
See end of tables for footnotes.
| American Funds Insurance Series | 177 |
Financial highlights (continued)
| Income (loss) from investment operations1 | Dividends and distributions | |||||||||||||||||||||||||||||||||||||||||||||||
| Net asset value, beginning of period | Net investment income (loss) | Net gains (losses) on securities (both realized and unrealized) | Total from investment operations | Dividends (from net investment income) | Distributions (from capital gains) | Total dividends and distributions | Net asset value, end of period | Total return2 | Net assets, end of period (in millions) | Ratio of expenses to average net assets | Ratio of net income (loss) to average net assets | |||||||||||||||||||||||||||||||||||||
| Growth Fund | ||||||||||||||||||||||||||||||||||||||||||||||||
| Class 1: | ||||||||||||||||||||||||||||||||||||||||||||||||
| 12/31/14 | $ | 78.54 | $ | .88 | 7 | $ | 5.79 | $ | 6.67 | $ | (1.16 | ) | $ | (3.90 | ) | $ | (5.06 | ) | $ | 80.15 | 8.78 | % | $ | 7,118 | .35 | % | 1.12 | %7 | ||||||||||||||||||||
| 12/31/13 | 60.90 | .64 | 17.84 | 18.48 | (.84 | ) | — | (.84 | ) | 78.54 | 30.43 | 7,003 | .35 | .93 | ||||||||||||||||||||||||||||||||||
| 12/31/12 | 52.07 | .63 | 8.83 | 9.46 | (.63 | ) | — | (.63 | ) | 60.90 | 18.19 | 7,116 | .35 | 1.10 | ||||||||||||||||||||||||||||||||||
| 12/31/11 | 54.78 | .45 | (2.68 | ) | (2.23 | ) | (.48 | ) | — | (.48 | ) | 52.07 | (4.06 | ) | 7,426 | .34 | .81 | |||||||||||||||||||||||||||||||
| 12/31/10 | 46.45 | .49 | 8.32 | 8.81 | (.48 | ) | — | (.48 | ) | 54.78 | 19.01 | 8,011 | .34 | 1.02 | ||||||||||||||||||||||||||||||||||
| Class 2: | ||||||||||||||||||||||||||||||||||||||||||||||||
| 12/31/14 | 77.94 | .68 | 7 | 5.75 | 6.43 | (.63 | ) | (3.90 | ) | (4.53 | ) | 79.84 | 8.51 | 15,413 | .60 | .87 | 7 | |||||||||||||||||||||||||||||||
| 12/31/13 | 60.45 | .47 | 17.68 | 18.15 | (.66 | ) | — | (.66 | ) | 77.94 | 30.11 | 16,334 | .60 | .68 | ||||||||||||||||||||||||||||||||||
| 12/31/12 | 51.68 | .47 | 8.77 | 9.24 | (.47 | ) | — | (.47 | ) | 60.45 | 17.89 | 14,911 | .60 | .83 | ||||||||||||||||||||||||||||||||||
| 12/31/11 | 54.35 | .30 | (2.63 | ) | (2.33 | ) | (.34 | ) | — | (.34 | ) | 51.68 | (4.27 | ) | 16,701 | .59 | .55 | |||||||||||||||||||||||||||||||
| 12/31/10 | 46.10 | .36 | 8.24 | 8.60 | (.35 | ) | — | (.35 | ) | 54.35 | 18.68 | 19,896 | .59 | .76 | ||||||||||||||||||||||||||||||||||
| Class 3: | ||||||||||||||||||||||||||||||||||||||||||||||||
| 12/31/14 | 78.62 | .74 | 7 | 5.79 | 6.53 | (.78 | ) | (3.90 | ) | (4.68 | ) | 80.47 | 8.58 | 208 | .53 | .94 | 7 | |||||||||||||||||||||||||||||||
| 12/31/13 | 60.97 | .52 | 17.84 | 18.36 | (.71 | ) | — | (.71 | ) | 78.62 | 30.20 | 216 | .53 | .75 | ||||||||||||||||||||||||||||||||||
| 12/31/12 | 52.13 | .53 | 8.83 | 9.36 | (.52 | ) | — | (.52 | ) | 60.97 | 17.97 | 189 | .53 | .92 | ||||||||||||||||||||||||||||||||||
| 12/31/11 | 54.82 | .34 | (2.66 | ) | (2.32 | ) | (.37 | ) | — | (.37 | ) | 52.13 | (4.21 | ) | 189 | .52 | .62 | |||||||||||||||||||||||||||||||
| 12/31/10 | 46.49 | .40 | 8.31 | 8.71 | (.38 | ) | — | (.38 | ) | 54.82 | 18.76 | 232 | .52 | .82 | ||||||||||||||||||||||||||||||||||
| Class 4: | ||||||||||||||||||||||||||||||||||||||||||||||||
| 12/31/14 | 78.32 | .37 | 7 | 5.87 | 6.24 | (.92 | ) | (3.90 | ) | (4.82 | ) | 79.74 | 8.25 | 24 | .85 | .47 | 7 | |||||||||||||||||||||||||||||||
| 12/31/13 | 60.90 | .29 | 17.90 | 18.19 | (.77 | ) | — | (.77 | ) | 78.32 | 29.96 | 5 | .85 | .40 | ||||||||||||||||||||||||||||||||||
| 12/31/123,4 | 60.55 | .03 | .78 | .81 | (.46 | ) | — | (.46 | ) | 60.90 | 1.33 | 5 | — | 6 | .02 | 2,5 | .05 | 2,5 | ||||||||||||||||||||||||||||||
| International Fund | ||||||||||||||||||||||||||||||||||||||||||||||||
| Class 1: | ||||||||||||||||||||||||||||||||||||||||||||||||
| 12/31/14 | $ | 21.22 | $ | .30 | $ | (.81 | ) | $ | (.51 | ) | $ | (.36 | ) | $ | — | $ | (.36 | ) | $ | 20.35 | (2.41)% | $ | 3,282 | .54 | % | 1.43 | % | |||||||||||||||||||||
| 12/31/13 | 17.68 | .27 | 3.59 | 3.86 | (.32 | ) | — | (.32 | ) | 21.22 | 21.91 | 3,324 | .54 | 1.41 | ||||||||||||||||||||||||||||||||||
| 12/31/12 | 15.21 | .30 | 2.47 | 2.77 | (.30 | ) | — | (.30 | ) | 17.68 | 18.21 | 3,618 | .54 | 1.81 | ||||||||||||||||||||||||||||||||||
| 12/31/11 | 18.05 | .35 | (2.84 | ) | (2.49 | ) | (.35 | ) | — | (.35 | ) | 15.21 | (13.76 | ) | 3,314 | .53 | 2.03 | |||||||||||||||||||||||||||||||
| 12/31/10 | 17.17 | .28 | .99 | �� | 1.27 | (.39 | ) | — | (.39 | ) | 18.05 | 7.52 | 3,490 | .53 | 1.69 | |||||||||||||||||||||||||||||||||
| Class 2: | ||||||||||||||||||||||||||||||||||||||||||||||||
| 12/31/14 | 21.15 | .25 | (.81 | ) | (.56 | ) | (.30 | ) | — | (.30 | ) | 20.29 | (2.65 | ) | 4,374 | .79 | 1.19 | |||||||||||||||||||||||||||||||
| 12/31/13 | 17.62 | .22 | 3.58 | 3.80 | (.27 | ) | — | (.27 | ) | 21.15 | 21.64 | 5,916 | .79 | 1.15 | ||||||||||||||||||||||||||||||||||
| 12/31/12 | 15.16 | .26 | 2.45 | 2.71 | (.25 | ) | — | (.25 | ) | 17.62 | 17.91 | 5,465 | .79 | 1.57 | ||||||||||||||||||||||||||||||||||
| 12/31/11 | 17.98 | .31 | (2.82 | ) | (2.51 | ) | (.31 | ) | — | (.31 | ) | 15.16 | (13.96 | ) | 5,210 | .78 | 1.81 | |||||||||||||||||||||||||||||||
| 12/31/10 | 17.11 | .24 | .98 | 1.22 | (.35 | ) | — | (.35 | ) | 17.98 | 7.23 | 6,615 | .78 | 1.46 | ||||||||||||||||||||||||||||||||||
| Class 3: | ||||||||||||||||||||||||||||||||||||||||||||||||
| 12/31/14 | 21.24 | .27 | (.82 | ) | (.55 | ) | (.31 | ) | — | (.31 | ) | 20.38 | (2.56 | ) | 38 | .72 | 1.28 | |||||||||||||||||||||||||||||||
| 12/31/13 | 17.70 | .23 | 3.59 | 3.82 | (.28 | ) | — | (.28 | ) | 21.24 | 21.67 | 46 | .72 | 1.22 | ||||||||||||||||||||||||||||||||||
| 12/31/12 | 15.23 | .27 | 2.47 | 2.74 | (.27 | ) | — | (.27 | ) | 17.70 | 17.97 | 44 | .72 | 1.65 | ||||||||||||||||||||||||||||||||||
| 12/31/11 | 18.05 | .33 | (2.83 | ) | (2.50 | ) | (.32 | ) | — | (.32 | ) | 15.23 | (13.85 | ) | 43 | .71 | 1.90 | |||||||||||||||||||||||||||||||
| 12/31/10 | 17.18 | .26 | .97 | 1.23 | (.36 | ) | — | (.36 | ) | 18.05 | 7.26 | 61 | .71 | 1.54 | ||||||||||||||||||||||||||||||||||
| Class 4: | ||||||||||||||||||||||||||||||||||||||||||||||||
| 12/31/14 | 21.16 | .07 | (.68 | ) | (.61 | ) | (.32 | ) | — | (.32 | ) | 20.23 | (2.88 | ) | 18 | 1.04 | .31 | |||||||||||||||||||||||||||||||
| 12/31/13 | 17.68 | (.01 | ) | 3.79 | 3.78 | (.30 | ) | — | (.30 | ) | 21.16 | 21.48 | 2 | 1.04 | (.07 | ) | ||||||||||||||||||||||||||||||||
| 12/31/123,4 | 17.79 | .01 | .16 | .17 | (.28 | ) | — | (.28 | ) | 17.68 | .98 | 5 | — | 6 | .02 | 2,5 | .05 | 2,5 | ||||||||||||||||||||||||||||||
| 178 | American Funds Insurance Series |
| Income (loss) from investment operations1 | Dividends and distributions | |||||||||||||||||||||||||||||||||||||||||||||||
| Net asset value, beginning of period | Net investment income (loss) | Net gains (losses) on securities (both realized and unrealized) | Total from investment operations | Dividends (from net investment income) | Distributions (from capital gains) | Total dividends and distributions | Net asset value, end of period | Total return2 | Net assets, end of period (in millions) | Ratio of expenses to average net assets | Ratio of net income (loss) to average net assets | |||||||||||||||||||||||||||||||||||||
| New World Fund | ||||||||||||||||||||||||||||||||||||||||||||||||
| Class 1: | ||||||||||||||||||||||||||||||||||||||||||||||||
| 12/31/14 | $ | 25.08 | $ | .29 | 7 | $ | (1.92 | ) | $ | (1.63 | ) | $ | (.29 | ) | $ | (2.44 | ) | $ | (2.73 | ) | $ | 20.72 | (7.63 | )% | $ | 1,433 | .78 | % | 1.23 | %7 | ||||||||||||||||||
| 12/31/13 | 22.93 | .34 | 2.31 | 2.65 | (.39 | ) | (.11 | ) | (.50 | ) | 25.08 | 11.66 | 1,388 | .78 | 1.45 | |||||||||||||||||||||||||||||||||
| 12/31/12 | 19.65 | .33 | 3.23 | 3.56 | (.28 | ) | — | (.28 | ) | 22.93 | 18.13 | 1,140 | .79 | 1.54 | ||||||||||||||||||||||||||||||||||
| 12/31/11 | 23.28 | .36 | (3.55 | ) | (3.19 | ) | (.44 | ) | — | (.44 | ) | 19.65 | (13.75 | ) | 826 | .78 | 1.62 | |||||||||||||||||||||||||||||||
| 12/31/10 | 20.04 | .37 | 3.25 | 3.62 | (.38 | ) | — | (.38 | ) | 23.28 | 18.20 | 774 | .80 | 1.76 | ||||||||||||||||||||||||||||||||||
| Class 2: | ||||||||||||||||||||||||||||||||||||||||||||||||
| 12/31/14 | 24.88 | .24 | 7 | (1.91 | ) | (1.67 | ) | (.23 | ) | (2.44 | ) | (2.67 | ) | 20.54 | (7.87 | ) | 1,084 | 1.03 | 1.01 | 7 | ||||||||||||||||||||||||||||
| 12/31/13 | 22.75 | .28 | 2.29 | 2.57 | (.33 | ) | (.11 | ) | (.44 | ) | 24.88 | 11.38 | 1,307 | 1.03 | 1.22 | |||||||||||||||||||||||||||||||||
| 12/31/12 | 19.50 | .28 | 3.19 | 3.47 | (.22 | ) | — | (.22 | ) | 22.75 | 17.82 | 1,378 | 1.04 | 1.31 | ||||||||||||||||||||||||||||||||||
| 12/31/11 | 23.09 | .30 | (3.51 | ) | (3.21 | ) | (.38 | ) | — | (.38 | ) | 19.50 | (13.95 | ) | 1,350 | 1.03 | 1.37 | |||||||||||||||||||||||||||||||
| 12/31/10 | 19.89 | .31 | 3.22 | 3.53 | (.33 | ) | — | (.33 | ) | 23.09 | 17.87 | 1,739 | 1.05 | 1.52 | ||||||||||||||||||||||||||||||||||
| Class 4: | ||||||||||||||||||||||||||||||||||||||||||||||||
| 12/31/14 | 24.99 | .09 | 7 | (1.83 | ) | (1.74 | ) | (.25 | ) | (2.44 | ) | (2.69 | ) | 20.56 | (8.13 | ) | 64 | 1.28 | .40 | 7 | ||||||||||||||||||||||||||||
| 12/31/13 | 22.93 | .14 | 2.41 | 2.55 | (.38 | ) | (.11 | ) | (.49 | ) | 24.99 | 11.20 | 8 | 1.29 | .56 | |||||||||||||||||||||||||||||||||
| 12/31/123,4 | 22.83 | .01 | .35 | .36 | (.26 | ) | — | (.26 | ) | 22.93 | 1.58 | 5 | — | 6 | .04 | 2,5 | .04 | 2,5 | ||||||||||||||||||||||||||||||
| Blue Chip Income and Growth Fund | ||||||||||||||||||||||||||||||||||||||||||||||||
| Class 1: | ||||||||||||||||||||||||||||||||||||||||||||||||
| 12/31/14 | $ | 13.12 | $ | .46 | 7 | $ | 1.59 | $ | 2.05 | $ | (.48 | ) | $ | — | $ | (.48 | ) | $ | 14.69 | 15.69 | % | $ | 3,542 | .42 | % | 3.31 | %7 | |||||||||||||||||||||
| 12/31/13 | 10.05 | .27 | 3.06 | 3.33 | (.26 | ) | — | (.26 | ) | 13.12 | 33.26 | 2,814 | .42 | 2.27 | ||||||||||||||||||||||||||||||||||
| 12/31/12 | 9.00 | .24 | 1.04 | 1.28 | (.23 | ) | — | (.23 | ) | 10.05 | 14.18 | 1,357 | .43 | 2.41 | ||||||||||||||||||||||||||||||||||
| 12/31/11 | 9.25 | .19 | (.25 | ) | (.06 | ) | (.19 | ) | — | (.19 | ) | 9.00 | (.63 | ) | 992 | .42 | 2.08 | |||||||||||||||||||||||||||||||
| 12/31/10 | 8.37 | .18 | .87 | 1.05 | (.17 | ) | — | (.17 | ) | 9.25 | 12.61 | 674 | .44 | 2.10 | ||||||||||||||||||||||||||||||||||
| Class 2: | ||||||||||||||||||||||||||||||||||||||||||||||||
| 12/31/14 | 13.02 | .44 | 7 | 1.55 | 1.99 | (.44 | ) | — | (.44 | ) | 14.57 | 15.36 | 3,722 | .67 | 3.14 | 7 | ||||||||||||||||||||||||||||||||
| 12/31/13 | 9.97 | .23 | 3.05 | 3.28 | (.23 | ) | — | (.23 | ) | 13.02 | 33.00 | 3,755 | .67 | 2.03 | ||||||||||||||||||||||||||||||||||
| 12/31/12 | 8.93 | .21 | 1.03 | 1.24 | (.20 | ) | — | (.20 | ) | 9.97 | 13.88 | 3,382 | .68 | 2.17 | ||||||||||||||||||||||||||||||||||
| 12/31/11 | 9.18 | .17 | (.26 | ) | (.09 | ) | (.16 | ) | — | (.16 | ) | 8.93 | (.90 | ) | 3,340 | .67 | 1.83 | |||||||||||||||||||||||||||||||
| 12/31/10 | 8.31 | .16 | .86 | 1.02 | (.15 | ) | — | (.15 | ) | 9.18 | 12.33 | 3,677 | .69 | 1.87 | ||||||||||||||||||||||||||||||||||
| Class 4: | ||||||||||||||||||||||||||||||||||||||||||||||||
| 12/31/14 | 13.12 | .34 | 7 | 1.63 | 1.97 | (.46 | ) | — | (.46 | ) | 14.63 | 15.13 | 9 | .92 | 2.33 | 7 | ||||||||||||||||||||||||||||||||
| 12/31/13 | 10.05 | .18 | 3.15 | 3.33 | (.26 | ) | — | (.26 | ) | 13.12 | 33.27 | — | 6 | .86 | 1.39 | |||||||||||||||||||||||||||||||||
| 12/31/123,4 | 10.20 | .01 | .03 | .04 | (.19 | ) | — | (.19 | ) | 10.05 | .38 | 5 | — | 6 | .02 | 2,5 | .10 | 2,5 | ||||||||||||||||||||||||||||||
| Global Growth and Income Fund | ||||||||||||||||||||||||||||||||||||||||||||||||
| Class 1: | ||||||||||||||||||||||||||||||||||||||||||||||||
| 12/31/14 | $ | 12.53 | $ | .43 | 7 | $ | .31 | $ | .74 | $ | (.49 | ) | $ | — | $ | (.49 | ) | $ | 12.78 | 6.00 | % | $ | 200 | .63 | % | 3.34 | %7 | |||||||||||||||||||||
| 12/31/13 | 10.56 | .39 | 2.00 | 2.39 | (.42 | ) | — | (.42 | ) | 12.53 | 22.81 | 206 | .62 | 3.35 | ||||||||||||||||||||||||||||||||||
| 12/31/12 | 9.20 | .25 | 1.39 | 1.64 | (.28 | ) | — | (.28 | ) | 10.56 | 17.93 | 180 | .62 | 2.56 | ||||||||||||||||||||||||||||||||||
| 12/31/11 | 9.96 | .28 | (.75 | ) | (.47 | ) | (.29 | ) | — | (.29 | ) | 9.20 | (4.68 | ) | 161 | .61 | 2.86 | |||||||||||||||||||||||||||||||
| 12/31/10 | 9.14 | .23 | .85 | 1.08 | (.26 | ) | — | (.26 | ) | 9.96 | 12.02 | 171 | .61 | 2.54 | ||||||||||||||||||||||||||||||||||
| Class 2: | ||||||||||||||||||||||||||||||||||||||||||||||||
| 12/31/14 | 12.51 | .41 | 7 | .29 | .70 | (.46 | ) | — | (.46 | ) | 12.75 | 5.64 | 1,685 | .88 | 3.22 | 7 | ||||||||||||||||||||||||||||||||
| 12/31/13 | 10.54 | .36 | 2.00 | 2.36 | (.39 | ) | — | (.39 | ) | 12.51 | 22.54 | 1,822 | .87 | 3.09 | ||||||||||||||||||||||||||||||||||
| 12/31/12 | 9.19 | .23 | 1.38 | 1.61 | (.26 | ) | — | (.26 | ) | 10.54 | 17.56 | 1,837 | .87 | 2.31 | ||||||||||||||||||||||||||||||||||
| 12/31/11 | 9.94 | .25 | (.74 | ) | (.49 | ) | (.26 | ) | — | (.26 | ) | 9.19 | (4.85 | ) | 1,839 | .86 | 2.60 | |||||||||||||||||||||||||||||||
| 12/31/10 | 9.12 | .21 | .85 | 1.06 | (.24 | ) | — | (.24 | ) | 9.94 | 11.78 | 2,130 | .86 | 2.28 | ||||||||||||||||||||||||||||||||||
| Class 4: | ||||||||||||||||||||||||||||||||||||||||||||||||
| 12/31/14 | 12.50 | .30 | 7 | .37 | .67 | (.46 | ) | — | (.46 | ) | 12.71 | 5.41 | 1 | 1.13 | 2.30 | 7 | ||||||||||||||||||||||||||||||||
| 12/31/13 | 10.55 | .28 | 2.09 | 2.37 | (.42 | ) | — | (.42 | ) | 12.50 | 22.60 | 1 | 1.12 | 2.27 | ||||||||||||||||||||||||||||||||||
| 12/31/123,4 | 10.64 | .01 | .13 | .14 | (.23 | ) | — | (.23 | ) | 10.55 | 1.27 | 5 | — | 6 | .03 | 2,5 | .08 | 2,5 | ||||||||||||||||||||||||||||||
See end of tables for footnotes.
| American Funds Insurance Series | 179 |
Financial highlights (continued)
| Income (loss) from investment operations1 | Dividends and distributions | |||||||||||||||||||||||||||||||||||||||||||||||
| Net asset value, beginning of period | Net investment income (loss) | Net gains (losses) on securities (both realized and unrealized) | Total from investment operations | Dividends (from net investment income) | Distributions (from capital gains) | Total dividends and distributions | Net asset value, end of period | Total return2 | Net assets, end of period (in millions) | Ratio of expenses to average net assets | Ratio of net income (loss) to average net assets | |||||||||||||||||||||||||||||||||||||
| Growth-Income Fund | ||||||||||||||||||||||||||||||||||||||||||||||||
| Class 1: | ||||||||||||||||||||||||||||||||||||||||||||||||
| 12/31/14 | $ | 50.72 | $ | .81 | $ | 4.57 | $ | 5.38 | $ | (.80 | ) | $ | (2.54 | ) | $ | (3.34 | ) | $ | 52.76 | 10.91 | % | $ | 10,812 | .29 | % | 1.56 | % | |||||||||||||||||||||
| 12/31/13 | 38.48 | .66 | 12.31 | 12.97 | (.73 | ) | — | (.73 | ) | 50.72 | 33.82 | 9,857 | .29 | 1.49 | ||||||||||||||||||||||||||||||||||
| 12/31/12 | 33.27 | .66 | 5.25 | 5.91 | (.70 | ) | — | (.70 | ) | 38.48 | 17.79 | 9,782 | .29 | 1.79 | ||||||||||||||||||||||||||||||||||
| 12/31/11 | 34.47 | .61 | (1.18 | ) | (.57 | ) | (.63 | ) | — | (.63 | ) | 33.27 | (1.60 | ) | 9,496 | .28 | 1.77 | |||||||||||||||||||||||||||||||
| 12/31/10 | 31.37 | .56 | 3.10 | 3.66 | (.56 | ) | — | (.56 | ) | 34.47 | 11.72 | 9,370 | .29 | 1.76 | ||||||||||||||||||||||||||||||||||
| Class 2: | ||||||||||||||||||||||||||||||||||||||||||||||||
| 12/31/14 | 50.40 | .67 | 4.55 | 5.22 | (.67 | ) | (2.54 | ) | (3.21 | ) | 52.41 | 10.63 | 14,337 | .54 | 1.31 | |||||||||||||||||||||||||||||||||
| 12/31/13 | 38.24 | .55 | 12.23 | 12.78 | (.62 | ) | — | (.62 | ) | 50.40 | 33.50 | 14,980 | .54 | 1.25 | ||||||||||||||||||||||||||||||||||
| 12/31/12 | 33.07 | .56 | 5.22 | 5.78 | (.61 | ) | — | (.61 | ) | 38.24 | 17.48 | 13,403 | .54 | 1.53 | ||||||||||||||||||||||||||||||||||
| 12/31/11 | 34.25 | .52 | (1.16 | ) | (.64 | ) | (.54 | ) | — | (.54 | ) | 33.07 | (1.83 | ) | 13,235 | .53 | 1.52 | |||||||||||||||||||||||||||||||
| 12/31/10 | 31.18 | .48 | 3.07 | 3.55 | (.48 | ) | — | (.48 | ) | 34.25 | 11.43 | 16,668 | .54 | 1.52 | ||||||||||||||||||||||||||||||||||
| Class 3: | ||||||||||||||||||||||||||||||||||||||||||||||||
| 12/31/14 | 50.77 | .71 | 4.59 | 5.30 | (.71 | ) | (2.54 | ) | (3.25 | ) | 52.82 | 10.71 | 185 | .47 | 1.38 | |||||||||||||||||||||||||||||||||
| 12/31/13 | 38.52 | .58 | 12.32 | 12.90 | (.65 | ) | — | (.65 | ) | 50.77 | 33.58 | 193 | .47 | 1.32 | ||||||||||||||||||||||||||||||||||
| 12/31/12 | 33.30 | .59 | 5.26 | 5.85 | (.63 | ) | — | (.63 | ) | 38.52 | 17.59 | 168 | .47 | 1.60 | ||||||||||||||||||||||||||||||||||
| 12/31/11 | 34.49 | .55 | (1.18 | ) | (.63 | ) | (.56 | ) | — | (.56 | ) | 33.30 | (1.77 | ) | 172 | .46 | 1.59 | |||||||||||||||||||||||||||||||
| 12/31/10 | 31.39 | .50 | 3.09 | 3.59 | (.49 | ) | — | (.49 | ) | 34.49 | 11.50 | 209 | .47 | 1.59 | ||||||||||||||||||||||||||||||||||
| Class 4: | ||||||||||||||||||||||||||||||||||||||||||||||||
| 12/31/14 | 50.56 | .58 | 4.51 | 5.09 | (.72 | ) | (2.54 | ) | (3.26 | ) | 52.39 | 10.34 | 30 | .79 | 1.11 | |||||||||||||||||||||||||||||||||
| 12/31/13 | 38.47 | .45 | 12.33 | 12.78 | (.69 | ) | — | (.69 | ) | 50.56 | 33.32 | 3 | .79 | .96 | ||||||||||||||||||||||||||||||||||
| 12/31/123,4 | 38.65 | .01 | .39 | .40 | (.58 | ) | — | (.58 | ) | 38.47 | 1.02 | 5 | — | 6 | .01 | 2,5 | .03 | 2,5 | ||||||||||||||||||||||||||||||
| International Growth and Income Fund | ||||||||||||||||||||||||||||||||||||||||||||||||
| Class 1: | ||||||||||||||||||||||||||||||||||||||||||||||||
| 12/31/14 | $ | 17.48 | $ | .58 | $ | (1.09 | ) | $ | (.51 | ) | $ | (.53 | ) | $ | (.17 | ) | $ | (.70 | ) | $ | 16.27 | (2.93 | )% | $ | 740 | .68 | % | 3.32 | % | |||||||||||||||||||
| 12/31/13 | 15.29 | .44 | 2.50 | 2.94 | (.47 | ) | (.28 | ) | (.75 | ) | 17.48 | 19.39 | 696 | .69 | 2.63 | |||||||||||||||||||||||||||||||||
| 12/31/12 | 13.40 | .37 | 1.89 | 2.26 | (.37 | ) | — | (.37 | ) | 15.29 | 16.84 | 203 | .74 | 2.50 | ||||||||||||||||||||||||||||||||||
| 12/31/11 | 15.25 | .47 | (1.77 | ) | (1.30 | ) | (.44 | ) | (.11 | ) | (.55 | ) | 13.40 | (8.51 | ) | 35 | .73 | 3.17 | ||||||||||||||||||||||||||||||
| 12/31/10 | 14.92 | .38 | .68 | 1.06 | (.33 | ) | (.40 | ) | (.73 | ) | 15.25 | 7.24 | 32 | .74 | 2.61 | |||||||||||||||||||||||||||||||||
| Class 2: | ||||||||||||||||||||||||||||||||||||||||||||||||
| 12/31/14 | 17.43 | .56 | (1.10 | ) | (.54 | ) | (.50 | ) | (.17 | ) | (.67 | ) | 16.22 | (3.15 | ) | 248 | .93 | 3.21 | ||||||||||||||||||||||||||||||
| 12/31/13 | 15.25 | .38 | 2.51 | 2.89 | (.43 | ) | (.28 | ) | (.71 | ) | 17.43 | 19.09 | 257 | .94 | 2.28 | |||||||||||||||||||||||||||||||||
| 12/31/12 | 13.37 | .40 | 1.81 | 2.21 | (.33 | ) | — | (.33 | ) | 15.25 | 16.50 | 225 | .99 | 2.77 | ||||||||||||||||||||||||||||||||||
| 12/31/11 | 15.21 | .42 | (1.75 | ) | (1.33 | ) | (.40 | ) | (.11 | ) | (.51 | ) | 13.37 | (8.71 | ) | 199 | .98 | 2.89 | ||||||||||||||||||||||||||||||
| 12/31/10 | 14.90 | .35 | .67 | 1.02 | (.31 | ) | (.40 | ) | (.71 | ) | 15.21 | 6.92 | 180 | .99 | 2.37 | |||||||||||||||||||||||||||||||||
| Class 4: | ||||||||||||||||||||||||||||||||||||||||||||||||
| 12/31/14 | 17.45 | .26 | (.85 | ) | (.59 | ) | (.50 | ) | (.17 | ) | (.67 | ) | 16.19 | (3.39 | ) | 20 | 1.18 | 1.52 | ||||||||||||||||||||||||||||||
| 12/31/13 | 15.29 | .03 | 2.87 | 2.90 | (.46 | ) | (.28 | ) | (.74 | ) | 17.45 | 19.16 | 1 | 1.19 | .18 | |||||||||||||||||||||||||||||||||
| 12/31/123,4 | 15.56 | .01 | .09 | .10 | (.37 | ) | — | (.37 | ) | 15.29 | .62 | 5 | — | 6 | .04 | 2,5 | .07 | 2,5 | ||||||||||||||||||||||||||||||
| Capital Income Builder | ||||||||||||||||||||||||||||||||||||||||||||||||
| Class 1: | ||||||||||||||||||||||||||||||||||||||||||||||||
| 12/31/143,8 | $ | 10.00 | $ | .19 | $ | (.18 | ) | $ | .01 | $ | (.19 | ) | $ | (.01 | ) | $ | (.20 | ) | $ | 9.81 | .12 | % | $ | 20 | .56 | %9 | 2.87 | %9 | ||||||||||||||||||||
| Class 2: | ||||||||||||||||||||||||||||||||||||||||||||||||
| 12/31/143,8 | 10.00 | .20 | (.19 | ) | .01 | (.19 | ) | (.01 | ) | (.20 | ) | 9.81 | .12 | 5,10 | — | 6 | .47 | 5,9,10 | 2.94 | 5,9,10 | ||||||||||||||||||||||||||||
| Class 4: | ||||||||||||||||||||||||||||||||||||||||||||||||
| 12/31/143,8 | 10.00 | .14 | (.16 | ) | (.02 | ) | (.17 | ) | (.01 | ) | (.18 | ) | 9.80 | (.21 | ) | 55 | 1.06 | 9 | 2.08 | 9 | ||||||||||||||||||||||||||||
| 180 | American Funds Insurance Series |
| Income (loss) from investment operations1 | Dividends and distributions | |||||||||||||||||||||||||||||||||||||||||||||||
| Net asset value, beginning of period | Net investment income (loss) | Net gains (losses) on securities (both realized and unrealized) | Total from investment operations | Dividends (from net investment income) | Distributions (from capital gains) | Total dividends and distributions | Net asset value, end of period | Total return2 | Net assets, end of period (in millions) | Ratio of expenses to average net assets | Ratio of net income (loss) to average net assets | |||||||||||||||||||||||||||||||||||||
| Asset Allocation Fund | ||||||||||||||||||||||||||||||||||||||||||||||||
| Class 1: | ||||||||||||||||||||||||||||||||||||||||||||||||
| 12/31/14 | $ | 22.49 | $ | .44 | $ | .81 | $ | 1.25 | $ | (.39 | ) | $ | (1.12 | ) | $ | (1.51 | ) | $ | 22.23 | 5.66 | % | $ | 11,997 | .30 | % | 1.95 | % | |||||||||||||||||||||
| 12/31/13 | 18.43 | .35 | 4.07 | 4.42 | (.36 | ) | — | (.36 | ) | 22.49 | 24.04 | 10,515 | .31 | 1.71 | ||||||||||||||||||||||||||||||||||
| 12/31/12 | 16.17 | .37 | 2.28 | 2.65 | (.39 | ) | — | (.39 | ) | 18.43 | 16.44 | 7,199 | .31 | 2.11 | ||||||||||||||||||||||||||||||||||
| 12/31/11 | 16.28 | .37 | (.12 | ) | .25 | (.36 | ) | — | (.36 | ) | 16.17 | 1.56 | 5,932 | .31 | 2.25 | |||||||||||||||||||||||||||||||||
| 12/31/10 | 14.75 | .35 | 1.52 | 1.87 | (.34 | ) | — | (.34 | ) | 16.28 | 12.75 | 5,235 | .31 | 2.33 | ||||||||||||||||||||||||||||||||||
| Class 2: | ||||||||||||||||||||||||||||||||||||||||||||||||
| 12/31/14 | 22.33 | .37 | .81 | 1.18 | (.33 | ) | (1.12 | ) | (1.45 | ) | 22.06 | 5.40 | 5,494 | .55 | 1.69 | |||||||||||||||||||||||||||||||||
| 12/31/13 | 18.31 | .30 | 4.03 | 4.33 | (.31 | ) | — | (.31 | ) | 22.33 | 23.69 | 5,760 | .56 | 1.47 | ||||||||||||||||||||||||||||||||||
| 12/31/12 | 16.06 | .33 | 2.27 | 2.60 | (.35 | ) | — | (.35 | ) | 18.31 | 16.19 | 5,225 | .56 | 1.86 | ||||||||||||||||||||||||||||||||||
| 12/31/11 | 16.17 | .33 | (.13 | ) | .20 | (.31 | ) | — | (.31 | ) | 16.06 | 1.30 | 5,151 | .56 | 1.99 | |||||||||||||||||||||||||||||||||
| 12/31/10 | 14.65 | .31 | 1.51 | 1.82 | (.30 | ) | — | (.30 | ) | 16.17 | 12.50 | 5,689 | .57 | 2.08 | ||||||||||||||||||||||||||||||||||
| Class 3: | ||||||||||||||||||||||||||||||||||||||||||||||||
| 12/31/14 | 22.51 | .39 | .81 | 1.20 | (.34 | ) | (1.12 | ) | (1.46 | ) | 22.25 | 5.47 | 40 | .48 | 1.76 | |||||||||||||||||||||||||||||||||
| 12/31/13 | 18.45 | .32 | 4.06 | 4.38 | (.32 | ) | — | (.32 | ) | 22.51 | 23.81 | 42 | .49 | 1.54 | ||||||||||||||||||||||||||||||||||
| 12/31/12 | 16.18 | .34 | 2.29 | 2.63 | (.36 | ) | — | (.36 | ) | 18.45 | 16.28 | 38 | .49 | 1.93 | ||||||||||||||||||||||||||||||||||
| 12/31/11 | 16.29 | .34 | (.13 | ) | .21 | (.32 | ) | — | (.32 | ) | 16.18 | 1.36 | 38 | .49 | 2.05 | |||||||||||||||||||||||||||||||||
| 12/31/10 | 14.75 | .32 | 1.53 | 1.85 | (.31 | ) | — | (.31 | ) | 16.29 | 12.62 | 44 | .50 | 2.15 | ||||||||||||||||||||||||||||||||||
| Class 4: | ||||||||||||||||||||||||||||||||||||||||||||||||
| 12/31/14 | 22.46 | .34 | .79 | 1.13 | (.36 | ) | (1.12 | ) | (1.48 | ) | 22.11 | 5.16 | 32 | .80 | 1.55 | |||||||||||||||||||||||||||||||||
| 12/31/13 | 18.43 | .27 | 4.12 | 4.39 | (.36 | ) | — | (.36 | ) | 22.46 | 23.89 | 1 | .79 | 1.22 | ||||||||||||||||||||||||||||||||||
| 12/31/123,4 | 18.52 | .01 | .21 | .22 | (.31 | ) | — | (.31 | ) | 18.43 | 1.17 | 5 | — | 6 | .01 | 2,5 | .08 | 2,5 | ||||||||||||||||||||||||||||||
| Global Balanced Fund | ||||||||||||||||||||||||||||||||||||||||||||||||
| Class 1: | ||||||||||||||||||||||||||||||||||||||||||||||||
| 12/31/14 | $ | 11.37 | $ | .25 | 7 | $ | (.03 | ) | $ | .22 | $ | (.18 | ) | $ | (.30 | ) | $ | (.48 | ) | $ | 11.11 | 1.87 | % | $ | 37 | .71 | % | 2.14 | %7 | |||||||||||||||||||
| 12/31/13 | 10.34 | .22 | 1.07 | 1.29 | (.18 | ) | (.08 | ) | (.26 | ) | 11.37 | 12.56 | 36 | .70 | 2.05 | |||||||||||||||||||||||||||||||||
| 12/31/12 | 9.35 | .20 | .98 | 1.18 | (.19 | ) | — | (.19 | ) | 10.34 | 12.58 | 32 | .72 | 2.00 | ||||||||||||||||||||||||||||||||||
| 12/31/113,11 | 10.00 | .13 | (.72 | ) | (.59 | ) | (.06 | ) | — | (.06 | ) | 9.35 | (5.89 | ) | 28 | .69 | 9 | 1.99 | 9 | |||||||||||||||||||||||||||||
| Class 2: | ||||||||||||||||||||||||||||||||||||||||||||||||
| 12/31/14 | 11.35 | .22 | 7 | (.03 | ) | .19 | (.15 | ) | (.30 | ) | (.45 | ) | 11.09 | 1.63 | 179 | .96 | 1.88 | 7 | ||||||||||||||||||||||||||||||
| 12/31/13 | 10.33 | .20 | 1.06 | 1.26 | (.16 | ) | (.08 | ) | (.24 | ) | 11.35 | 12.23 | 156 | .95 | 1.79 | |||||||||||||||||||||||||||||||||
| 12/31/12 | 9.35 | .17 | .97 | 1.14 | (.16 | ) | — | (.16 | ) | 10.33 | 12.24 | 119 | .97 | 1.76 | ||||||||||||||||||||||||||||||||||
| 12/31/113,11 | 10.00 | .09 | (.69 | ) | (.60 | ) | (.05 | ) | — | (.05 | ) | 9.35 | (5.97 | ) | 72 | .94 | 9 | 1.45 | 9 | |||||||||||||||||||||||||||||
| Class 4: | ||||||||||||||||||||||||||||||||||||||||||||||||
| 12/31/14 | 11.35 | .24 | 7 | (.02 | ) | .22 | (.18 | ) | (.30 | ) | (.48 | ) | 11.09 | 1.88 | 5,10 | — | 6 | .67 | 5,10 | 2.07 | 5,7,10 | |||||||||||||||||||||||||||
| 12/31/13 | 10.33 | .22 | 1.06 | 1.28 | (.18 | ) | (.08 | ) | (.26 | ) | 11.35 | 12.49 | 5,10 | — | 6 | .71 | 5,10 | 1.98 | 5,10 | |||||||||||||||||||||||||||||
| 12/31/123,4 | 10.47 | .01 | .03 | .04 | (.18 | ) | — | (.18 | ) | 10.33 | .40 | 5,10 | — | 6 | .03 | 2,5,10 | .05 | 2,5,10 | ||||||||||||||||||||||||||||||
See end of tables for footnotes.
| American Funds Insurance Series | 181 |
Financial highlights (continued)
| Income (loss) from investment operations1 | Dividends and distributions | |||||||||||||||||||||||||||||||||||||||||||||||
| Net asset value, beginning of period | Net investment income (loss) | Net gains (losses) on securities (both realized and unrealized) | Total from investment operations | Dividends (from net investment income) | Distributions (from capital gains) | Total dividends and distributions | Net asset value, end of period | Total return2 | Net assets, end of period (in millions) | Ratio of expenses to average net assets | Ratio of net income (loss) to average net assets | |||||||||||||||||||||||||||||||||||||
| Bond Fund | ||||||||||||||||||||||||||||||||||||||||||||||||
| Class 1: | ||||||||||||||||||||||||||||||||||||||||||||||||
| 12/31/14 | $ | 10.73 | $ | .23 | $ | .37 | $ | .60 | $ | (.25 | ) | $ | — | 12 | $ | (.25 | ) | $ | 11.08 | 5.59 | % | $ | 4,977 | .39 | % | 2.03 | % | |||||||||||||||||||||
| 12/31/13 | 11.29 | .22 | (.43 | ) | (.21 | ) | (.23 | ) | (.12 | ) | (.35 | ) | 10.73 | (1.89 | ) | 4,506 | .39 | 2.01 | ||||||||||||||||||||||||||||||
| 12/31/12 | 10.99 | .25 | .36 | .61 | (.31 | ) | — | (.31 | ) | 11.29 | 5.58 | 3,917 | .39 | 2.23 | ||||||||||||||||||||||||||||||||||
| 12/31/11 | 10.67 | .32 | .36 | .68 | (.36 | ) | — | (.36 | ) | 10.99 | 6.41 | 4,354 | .38 | 2.89 | ||||||||||||||||||||||||||||||||||
| 12/31/10 | 10.33 | .33 | .36 | .69 | (.35 | ) | — | (.35 | ) | 10.67 | 6.73 | 4,768 | .38 | 3.03 | ||||||||||||||||||||||||||||||||||
| Class 2: | ||||||||||||||||||||||||||||||||||||||||||||||||
| 12/31/14 | 10.61 | .20 | .36 | .56 | (.22 | ) | — | 12 | (.22 | ) | 10.95 | 5.28 | 4,565 | .64 | 1.79 | |||||||||||||||||||||||||||||||||
| 12/31/13 | 11.17 | .19 | (.43 | ) | (.24 | ) | (.20 | ) | (.12 | ) | (.32 | ) | 10.61 | (2.16 | ) | 4,763 | .64 | 1.76 | ||||||||||||||||||||||||||||||
| 12/31/12 | 10.87 | .22 | .36 | .58 | (.28 | ) | — | (.28 | ) | 11.17 | 5.37 | 5,044 | .64 | 1.97 | ||||||||||||||||||||||||||||||||||
| 12/31/11 | 10.56 | .29 | .35 | .64 | (.33 | ) | — | (.33 | ) | 10.87 | 6.10 | 4,984 | .63 | 2.64 | ||||||||||||||||||||||||||||||||||
| 12/31/10 | 10.23 | .30 | .36 | .66 | (.33 | ) | — | (.33 | ) | 10.56 | 6.44 | 5,074 | .63 | 2.79 | ||||||||||||||||||||||||||||||||||
| Class 4: | ||||||||||||||||||||||||||||||||||||||||||||||||
| 12/31/14 | 10.69 | .16 | .39 | .55 | (.23 | ) | — | 12 | (.23 | ) | 11.01 | 5.15 | 29 | .89 | 1.43 | |||||||||||||||||||||||||||||||||
| 12/31/13 | 11.29 | .17 | (.43 | ) | (.26 | ) | (.22 | ) | (.12 | ) | (.34 | ) | 10.69 | (2.34 | ) | 3 | .89 | 1.58 | ||||||||||||||||||||||||||||||
| 12/31/123,4 | 11.55 | .01 | (.02 | ) | (.01 | ) | (.25 | ) | — | (.25 | ) | 11.29 | (.04 | )5 | — | 6 | .02 | 2,5 | .10 | 2,5 | ||||||||||||||||||||||||||||
| Global Bond Fund | ||||||||||||||||||||||||||||||||||||||||||||||||
| Class 1: | ||||||||||||||||||||||||||||||||||||||||||||||||
| 12/31/14 | $ | 11.88 | $ | .29 | $ | (.08 | ) | $ | .21 | $ | (.21 | ) | $ | (.11 | ) | $ | (.32 | ) | $ | 11.77 | 1.71 | % | $ | 1,194 | .57 | % | 2.35 | % | ||||||||||||||||||||
| 12/31/13 | 12.32 | .28 | (.58 | ) | (.30 | ) | — | (.14 | ) | (.14 | ) | 11.88 | (2.40 | ) | 1,093 | .56 | 2.37 | |||||||||||||||||||||||||||||||
| 12/31/12 | 11.96 | .28 | .48 | .76 | (.29 | ) | (.11 | ) | (.40 | ) | 12.32 | 6.43 | 959 | .56 | 2.29 | |||||||||||||||||||||||||||||||||
| 12/31/11 | 11.82 | .36 | .22 | .58 | (.37 | ) | (.07 | ) | (.44 | ) | 11.96 | 4.86 | 619 | .56 | 2.97 | |||||||||||||||||||||||||||||||||
| 12/31/10 | 11.57 | .41 | .21 | .62 | (.37 | ) | — | (.37 | ) | 11.82 | 5.44 | 325 | .57 | 3.42 | ||||||||||||||||||||||||||||||||||
| Class 2: | ||||||||||||||||||||||||||||||||||||||||||||||||
| 12/31/14 | 11.81 | .26 | (.09 | ) | .17 | (.15 | ) | (.11 | ) | (.26 | ) | 11.72 | 1.39 | 1,386 | .82 | 2.11 | ||||||||||||||||||||||||||||||||
| 12/31/13 | 12.27 | .25 | (.57 | ) | (.32 | ) | — | (.14 | ) | (.14 | ) | 11.81 | (2.58 | ) | 1,496 | .81 | 2.11 | |||||||||||||||||||||||||||||||
| 12/31/12 | 11.91 | .25 | .48 | .73 | (.26 | ) | (.11 | ) | (.37 | ) | 12.27 | 6.19 | 1,664 | .81 | 2.06 | |||||||||||||||||||||||||||||||||
| 12/31/11 | 11.78 | .33 | .21 | .54 | (.34 | ) | (.07 | ) | (.41 | ) | 11.91 | 4.54 | 1,639 | .81 | 2.75 | |||||||||||||||||||||||||||||||||
| 12/31/10 | 11.53 | .38 | .22 | .60 | (.35 | ) | — | (.35 | ) | 11.78 | 5.23 | 1,497 | .83 | 3.21 | ||||||||||||||||||||||||||||||||||
| Class 4: | ||||||||||||||||||||||||||||||||||||||||||||||||
| 12/31/14 | 11.87 | .20 | (.05 | ) | .15 | (.21 | ) | (.11 | ) | (.32 | ) | 11.70 | 1.16 | 4 | 1.09 | 1.66 | ||||||||||||||||||||||||||||||||
| 12/31/13 | 12.31 | .27 | (.57 | ) | (.30 | ) | — | (.14 | ) | (.14 | ) | 11.87 | (2.41 | ) | — | 6 | .79 | 2.25 | ||||||||||||||||||||||||||||||
| 12/31/123,4 | 12.53 | .01 | (.04 | ) | (.03 | ) | (.19 | ) | — | (.19 | ) | 12.31 | (.28 | )5 | — | 6 | .02 | 2,5 | .11 | 2,5 | ||||||||||||||||||||||||||||
| 182 | American Funds Insurance Series |
| Income (loss) from investment operations1 | Dividends and distributions | |||||||||||||||||||||||||||||||||||||||||||||||
| Net asset value, beginning of period | Net investment income (loss) | Net gains (losses) on securities (both realized and unrealized) | Total from investment operations | Dividends (from net investment income) | Distributions (from capital gains) | Total dividends and distributions | Net asset value, end of period | Total return2 | Net assets, end of period (in millions) | Ratio of expenses to average net assets | Ratio of net income (loss) to average net assets | |||||||||||||||||||||||||||||||||||||
| High-Income Bond Fund | ||||||||||||||||||||||||||||||||||||||||||||||||
| Class 1: | ||||||||||||||||||||||||||||||||||||||||||||||||
| 12/31/14 | $ | 11.13 | $ | .67 | $ | (.59 | ) | $ | .08 | $ | (.67 | ) | $ | — | $ | (.67 | ) | $ | 10.54 | .80 | % | $ | 1,017 | .48 | % | 5.90 | % | |||||||||||||||||||||
| 12/31/13 | 11.16 | .75 | .01 | .76 | (.79 | ) | — | (.79 | ) | 11.13 | 6.89 | 856 | .48 | 6.54 | ||||||||||||||||||||||||||||||||||
| 12/31/12 | 10.54 | .81 | .64 | 1.45 | (.83 | ) | — | (.83 | ) | 11.16 | 13.90 | 894 | .48 | 7.25 | ||||||||||||||||||||||||||||||||||
| 12/31/11 | 11.20 | .88 | (.64 | ) | .24 | (.90 | ) | — | (.90 | ) | 10.54 | 2.18 | 787 | .47 | 7.70 | |||||||||||||||||||||||||||||||||
| 12/31/10 | 10.49 | .91 | .68 | 1.59 | (.88 | ) | — | (.88 | ) | 11.20 | 15.38 | 769 | .48 | 8.15 | ||||||||||||||||||||||||||||||||||
| Class 2: | ||||||||||||||||||||||||||||||||||||||||||||||||
| 12/31/14 | 10.99 | .63 | (.57 | ) | .06 | (.64 | ) | — | (.64 | ) | 10.41 | .63 | 929 | .73 | 5.67 | |||||||||||||||||||||||||||||||||
| 12/31/13 | 11.03 | .71 | .01 | .72 | (.76 | ) | — | (.76 | ) | 10.99 | 6.60 | 1,061 | .73 | 6.29 | ||||||||||||||||||||||||||||||||||
| 12/31/12 | 10.42 | .78 | .63 | 1.41 | (.80 | ) | — | (.80 | ) | 11.03 | 13.70 | 1,135 | .73 | 7.00 | ||||||||||||||||||||||||||||||||||
| 12/31/11 | 11.08 | .84 | (.63 | ) | .21 | (.87 | ) | — | (.87 | ) | 10.42 | 1.92 | 1,064 | .72 | 7.44 | |||||||||||||||||||||||||||||||||
| 12/31/10 | 10.39 | .87 | .68 | 1.55 | (.86 | ) | — | (.86 | ) | 11.08 | 15.07 | 1,142 | .73 | 7.91 | ||||||||||||||||||||||||||||||||||
| Class 3: | ||||||||||||||||||||||||||||||||||||||||||||||||
| 12/31/14 | 11.16 | .65 | (.59 | ) | .06 | (.65 | ) | — | (.65 | ) | 10.57 | .59 | 16 | .66 | 5.74 | |||||||||||||||||||||||||||||||||
| 12/31/13 | 11.18 | .73 | .02 | .75 | (.77 | ) | — | (.77 | ) | 11.16 | 6.77 | 19 | .66 | 6.36 | ||||||||||||||||||||||||||||||||||
| 12/31/12 | 10.56 | .80 | .63 | 1.43 | (.81 | ) | — | (.81 | ) | 11.18 | 13.67 | 21 | .66 | 7.07 | ||||||||||||||||||||||||||||||||||
| 12/31/11 | 11.22 | .86 | (.64 | ) | .22 | (.88 | ) | — | (.88 | ) | 10.56 | 1.97 | 21 | .65 | 7.51 | |||||||||||||||||||||||||||||||||
| 12/31/10 | 10.51 | .89 | .68 | 1.57 | (.86 | ) | — | (.86 | ) | 11.22 | 15.14 | 23 | .66 | 7.98 | ||||||||||||||||||||||||||||||||||
| Class 4: | ||||||||||||||||||||||||||||||||||||||||||||||||
| 12/31/14 | 11.12 | .63 | (.59 | ) | .04 | (.11 | ) | — | (.11 | ) | 11.05 | .35 | — | 6 | .98 | 5.49 | ||||||||||||||||||||||||||||||||
| 12/31/13 | 11.16 | .67 | .08 | .75 | (.79 | ) | — | (.79 | ) | 11.12 | 6.81 | — | 6 | .93 | 5.82 | |||||||||||||||||||||||||||||||||
| 12/31/123,4 | 11.80 | .04 | — | 12 | .04 | (.68 | ) | — | (.68 | ) | 11.16 | .34 | 5 | — | 6 | .02 | 2,5 | .35 | 2,5 | |||||||||||||||||||||||||||||
| Mortgage Fund | ||||||||||||||||||||||||||||||||||||||||||||||||
| Class 1: | ||||||||||||||||||||||||||||||||||||||||||||||||
| 12/31/14 | $ | 10.23 | $ | .12 | $ | .45 | $ | .57 | $ | (.10 | ) | $ | — | $ | (.10 | ) | $ | 10.70 | 5.54 | % | $ | 292 | .45 | % | 1.12 | % | ||||||||||||||||||||||
| 12/31/13 | 10.47 | .04 | (.18 | ) | (.14 | ) | (.08 | ) | (.02 | ) | (.10 | ) | 10.23 | (1.41 | ) | 198 | .44 | .35 | ||||||||||||||||||||||||||||||
| 12/31/12 | 10.37 | .01 | .25 | .26 | (.06 | ) | (.10 | ) | (.16 | ) | 10.47 | 2.57 | 87 | .45 | .08 | |||||||||||||||||||||||||||||||||
| 12/31/113,11 | 10.00 | — | 12 | .48 | .48 | (.01 | ) | (.10 | ) | (.11 | ) | 10.37 | 4.78 | 55 | .42 | 9 | .04 | 9 | ||||||||||||||||||||||||||||||
| Class 2: | ||||||||||||||||||||||||||||||||||||||||||||||||
| 12/31/14 | 10.22 | .10 | .44 | .54 | (.08 | ) | — | (.08 | ) | 10.68 | 5.23 | 52 | .70 | .91 | ||||||||||||||||||||||||||||||||||
| 12/31/13 | 10.46 | — | 12 | (.17 | ) | (.17 | ) | (.05 | ) | (.02 | ) | (.07 | ) | 10.22 | (1.68 | ) | 49 | .69 | (.02 | ) | ||||||||||||||||||||||||||||
| 12/31/12 | 10.36 | (.02 | ) | .26 | .24 | (.04 | ) | (.10 | ) | (.14 | ) | 10.46 | 2.38 | 49 | .70 | (.16 | ) | |||||||||||||||||||||||||||||||
| 12/31/113,11 | 10.00 | (.02 | ) | .48 | .46 | — | 12 | (.10 | ) | (.10 | ) | 10.36 | 4.60 | 22 | .67 | 9 | (.25 | )9 | ||||||||||||||||||||||||||||||
| Class 4: | ||||||||||||||||||||||||||||||||||||||||||||||||
| 12/31/14 | 10.23 | .05 | .46 | .51 | (.09 | ) | — | (.09 | ) | 10.65 | 4.98 | 1 | .94 | .47 | ||||||||||||||||||||||||||||||||||
| 12/31/13 | 10.47 | .02 | (.16 | ) | (.14 | ) | (.08 | ) | (.02 | ) | (.10 | ) | 10.23 | (1.41 | )5 | — | 6 | .38 | 5 | .23 | 5 | |||||||||||||||||||||||||||
| 12/31/123,4 | 10.60 | — | 12 | .01 | .01 | (.06 | ) | (.08 | ) | (.14 | ) | 10.47 | .09 | 5 | — | 6 | .02 | 2,5 | .04 | 2,5 | ||||||||||||||||||||||||||||
See end of tables for footnotes.
| American Funds Insurance Series | 183 |
Financial highlights (continued)
| Income (loss) from investment operations1 | Dividends and distributions | |||||||||||||||||||||||||||||||||||||||||||||||||||
| Net asset value, beginning of period | Net investment income (loss) | Net gains (losses) on securities (both realized and unrealized) | Total from investment operations | Dividends (from net investment income) | Distributions (from capital gains) | Total dividends and distributions | Net asset value, end of period | Total return2,13 | Net assets, end of period (in millions) | Ratio of expenses to average net assets before waivers | Ratio of expenses to average net assets after waivers13 | Ratio of net income (loss) to average net assets13 | ||||||||||||||||||||||||||||||||||||||||
| U.S. Government/AAA-Rated Securities Fund | ||||||||||||||||||||||||||||||||||||||||||||||||||||
| Class 1: | ||||||||||||||||||||||||||||||||||||||||||||||||||||
| 12/31/14 | $ | 11.94 | $ | .15 | $ | .48 | $ | .63 | $ | (.17 | ) | $ | — | $ | (.17 | ) | $ | 12.40 | 5.24 | % | $ | 1,723 | .35 | % | .35 | % | 1.24 | % | ||||||||||||||||||||||||
| 12/31/13 | 12.75 | .08 | (.44 | ) | (.36 | ) | (.11 | ) | (.34 | ) | (.45 | ) | 11.94 | (2.87 | ) | 1,584 | .35 | .35 | .67 | |||||||||||||||||||||||||||||||||
| 12/31/12 | 13.00 | .10 | .18 | .28 | (.16 | ) | (.37 | ) | (.53 | ) | 12.75 | 2.22 | 1,809 | .34 | .34 | .75 | ||||||||||||||||||||||||||||||||||||
| 12/31/11 | 12.59 | .23 | .74 | .97 | (.26 | ) | (.30 | ) | (.56 | ) | 13.00 | 7.85 | 1,785 | .34 | .34 | 1.83 | ||||||||||||||||||||||||||||||||||||
| 12/31/10 | 12.18 | .26 | .46 | .72 | (.25 | ) | (.06 | ) | (.31 | ) | 12.59 | 5.94 | 1,492 | .39 | .36 | 2.07 | ||||||||||||||||||||||||||||||||||||
| Class 2: | ||||||||||||||||||||||||||||||||||||||||||||||||||||
| 12/31/14 | 11.83 | .12 | .47 | .59 | (.13 | ) | — | (.13 | ) | 12.29 | 5.01 | 1,717 | .60 | .60 | 1.00 | |||||||||||||||||||||||||||||||||||||
| 12/31/13 | 12.63 | .05 | (.43 | ) | (.38 | ) | (.08 | ) | (.34 | ) | (.42 | ) | 11.83 | (3.08 | ) | 1,801 | .60 | .60 | .42 | |||||||||||||||||||||||||||||||||
| 12/31/12 | 12.89 | .06 | .18 | .24 | (.13 | ) | (.37 | ) | (.50 | ) | 12.63 | 1.91 | 1,995 | .59 | .59 | .50 | ||||||||||||||||||||||||||||||||||||
| 12/31/11 | 12.49 | .20 | .73 | .93 | (.23 | ) | (.30 | ) | (.53 | ) | 12.89 | 7.58 | 2,002 | .59 | .59 | 1.59 | ||||||||||||||||||||||||||||||||||||
| 12/31/10 | 12.08 | .23 | .46 | .69 | (.22 | ) | (.06 | ) | (.28 | ) | 12.49 | 5.75 | 1,959 | .64 | .62 | 1.83 | ||||||||||||||||||||||||||||||||||||
| Class 3: | ||||||||||||||||||||||||||||||||||||||||||||||||||||
| 12/31/14 | 11.96 | .13 | .48 | .61 | (.14 | ) | — | (.14 | ) | 12.43 | 5.11 | 13 | .53 | .53 | 1.08 | |||||||||||||||||||||||||||||||||||||
| 12/31/13 | 12.76 | .06 | (.43 | ) | (.37 | ) | (.09 | ) | (.34 | ) | (.43 | ) | 11.96 | (3.00 | ) | 14 | .53 | .53 | .47 | |||||||||||||||||||||||||||||||||
| 12/31/12 | 13.01 | .07 | .19 | .26 | (.14 | ) | (.37 | ) | (.51 | ) | 12.76 | 2.02 | 20 | .52 | .52 | .58 | ||||||||||||||||||||||||||||||||||||
| 12/31/11 | 12.61 | .21 | .73 | .94 | (.24 | ) | (.30 | ) | (.54 | ) | 13.01 | 7.56 | 24 | .52 | .52 | 1.65 | ||||||||||||||||||||||||||||||||||||
| 12/31/10 | 12.19 | .24 | .47 | .71 | (.23 | ) | (.06 | ) | (.29 | ) | 12.61 | 5.82 | 26 | .57 | .55 | 1.92 | ||||||||||||||||||||||||||||||||||||
| Class 4: | ||||||||||||||||||||||||||||||||||||||||||||||||||||
| 12/31/14 | 11.93 | .06 | .51 | .57 | (.16 | ) | — | (.16 | ) | 12.34 | 4.76 | 21 | .85 | .85 | .50 | |||||||||||||||||||||||||||||||||||||
| 12/31/13 | 12.75 | .08 | (.44 | ) | (.36 | ) | (.12 | ) | (.34 | ) | (.46 | ) | 11.93 | (2.95 | ) | — | 6 | .84 | .84 | .68 | ||||||||||||||||||||||||||||||||
| 12/31/123,4 | 12.88 | .01 | (.01 | ) | — | (.13 | ) | — | (.13 | ) | 12.75 | (.01 | )5 | — | 6 | .02 | 2,5 | .02 | 2,5 | .05 | 2,5 | |||||||||||||||||||||||||||||||
| 184 | American Funds Insurance Series |
| Income (loss) from investment operations1 | Dividends and distributions | |||||||||||||||||||||||||||||||||||||||||||||||
| Net asset value, beginning of period | Net investment income (loss) | Net gains (losses) on securities (both realized and unrealized) | Total from investment operations | Dividends (from net investment income) | Distributions (from capital gains) | Total dividends and distributions | Net asset value, end of period | Total return2 | Net assets, end of period (in millions) | Ratio of expenses to average net assets | Ratio of net income (loss) to average net assets | |||||||||||||||||||||||||||||||||||||
| Cash Management Fund | ||||||||||||||||||||||||||||||||||||||||||||||||
| Class 1: | ||||||||||||||||||||||||||||||||||||||||||||||||
| 12/31/14 | $ | 11.31 | $ | (.03 | ) | $ | — | $ | (.03 | ) | $ | — | $ | — | $ | — | $ | 11.28 | (.27 | )% | $ | 49 | .34 | % | (.26 | )% | ||||||||||||||||||||||
| 12/31/13 | 11.34 | (.03 | ) | — | 12 | (.03 | ) | — | — | — | 11.31 | (.27 | ) | 57 | .34 | (.24 | ) | |||||||||||||||||||||||||||||||
| 12/31/12 | 11.36 | (.03 | ) | .01 | (.02 | ) | — | — | — | 11.34 | (.18 | ) | 66 | .34 | (.22 | ) | ||||||||||||||||||||||||||||||||
| 12/31/11 | 11.39 | (.02 | ) | (.01 | ) | (.03 | ) | — | — | — | 11.36 | (.26 | ) | 75 | .33 | (.21 | ) | |||||||||||||||||||||||||||||||
| 12/31/10 | 11.40 | (.02 | ) | .01 | (.01 | ) | — | — | — | 11.39 | (.09 | ) | 83 | .33 | (.14 | ) | ||||||||||||||||||||||||||||||||
| Class 2: | ||||||||||||||||||||||||||||||||||||||||||||||||
| 12/31/14 | 11.12 | (.06 | ) | — | (.06 | ) | — | — | — | 11.06 | (.54 | ) | 331 | .59 | (.51 | ) | ||||||||||||||||||||||||||||||||
| 12/31/13 | 11.17 | (.05 | ) | — | 12 | (.05 | ) | — | — | — | 11.12 | (.45 | ) | 395 | .59 | (.49 | ) | |||||||||||||||||||||||||||||||
| 12/31/12 | 11.22 | (.05 | ) | — | 12 | (.05 | ) | — | — | — | 11.17 | (.45 | ) | 459 | .59 | (.47 | ) | |||||||||||||||||||||||||||||||
| 12/31/11 | 11.28 | (.05 | ) | (.01 | ) | (.06 | ) | — | — | — | 11.22 | (.53 | ) | 530 | .58 | (.47 | ) | |||||||||||||||||||||||||||||||
| 12/31/10 | 11.32 | (.04 | ) | — | 12 | (.04 | ) | — | — | — | 11.28 | (.35 | ) | 522 | .58 | (.39 | ) | |||||||||||||||||||||||||||||||
| Class 3: | ||||||||||||||||||||||||||||||||||||||||||||||||
| 12/31/14 | 11.21 | (.05 | ) | — | (.05 | ) | — | — | — | 11.16 | (.45 | ) | 8 | .52 | (.44 | ) | ||||||||||||||||||||||||||||||||
| 12/31/13 | 11.26 | (.05 | ) | — | 12 | (.05 | ) | — | — | — | 11.21 | (.44 | ) | 8 | .52 | (.42 | ) | |||||||||||||||||||||||||||||||
| 12/31/12 | 11.30 | (.05 | ) | .01 | (.04 | ) | — | — | — | 11.26 | (.35 | ) | 11 | .52 | (.40 | ) | ||||||||||||||||||||||||||||||||
| 12/31/11 | 11.34 | (.04 | ) | — | 12 | (.04 | ) | — | — | — | 11.30 | (.35 | ) | 12 | .51 | (.40 | ) | |||||||||||||||||||||||||||||||
| 12/31/10 | 11.38 | (.04 | ) | — | 12 | (.04 | ) | — | — | — | 11.34 | (.35 | ) | 13 | .51 | (.32 | ) | |||||||||||||||||||||||||||||||
| Class 4: | ||||||||||||||||||||||||||||||||||||||||||||||||
| 12/31/14 | 11.30 | (.09 | ) | .04 | (.05 | ) | — | — | — | 11.25 | (.44 | ) | 7 | .84 | (.77 | ) | ||||||||||||||||||||||||||||||||
| 12/31/13 | 11.34 | (.04 | ) | — | 12 | (.04 | ) | — | — | — | 11.30 | (.35 | )5 | — | 6 | .37 | 5 | (.32 | )5 | |||||||||||||||||||||||||||||
| 12/31/123,4 | 11.34 | — | 12 | — | 12 | — | 12 | — | — | — | 11.34 | .00 | 5 | — | 6 | .02 | 2,5 | (.01 | )2,5 | |||||||||||||||||||||||||||||
| Income (loss) from investment operations1 | Dividends and distributions | |||||||||||||||||||||||||||||||||||||||||||||||||||||||
| Net asset value, beginning of period | Net investment income (loss) | Net gains (losses) on securities (both realized and unrealized) | Total from investment operations | Dividends (from net investment income) | Distributions (from capital gains) | Total dividends and distributions | Net asset value, end of period | Total return2,13 | Net assets, end of period (in millions) | Ratio of expenses to average net assets before reimbursements/ waivers | Ratio of expenses to average net assets after reimbursements/ waivers13 | Net effective expense ratio13,14 | Ratio of net income to average net assets13 | |||||||||||||||||||||||||||||||||||||||||||
| Managed Risk Growth Fund | ||||||||||||||||||||||||||||||||||||||||||||||||||||||||
| Class P1: | ||||||||||||||||||||||||||||||||||||||||||||||||||||||||
| 12/31/14 | $ | 11.43 | $ | .31 | $ | (.06 | ) | $ | .25 | $ | (.12 | ) | $ | (.19 | ) | $ | (.31 | ) | $ | 11.37 | 2.18 | % | $ | — | 6 | .50 | % | .32 | % | .65 | % | 2.71 | % | |||||||||||||||||||||||
| 12/31/133,15 | 10.00 | .12 | 1.38 | 1.50 | (.07 | ) | — | (.07 | ) | 11.43 | 15.05 | 5 | — | 6 | .88 | 5,9 | .25 | 5,9 | .58 | 5,9 | 1.64 | 5,9 | ||||||||||||||||||||||||||||||||||
| Class P2: | ||||||||||||||||||||||||||||||||||||||||||||||||||||||||
| 12/31/14 | 11.43 | .12 | .08 | .20 | (.09 | ) | (.19 | ) | (.28 | ) | 11.35 | 1.77 | 79 | .87 | .69 | 1.02 | 1.01 | |||||||||||||||||||||||||||||||||||||||
| 12/31/133,15 | 10.00 | .12 | 1.37 | 1.49 | (.06 | ) | — | (.06 | ) | 11.43 | 14.94 | 5 | 28 | 1.05 | 5,9 | .52 | 5,9 | .85 | 5,9 | 1.69 | 5,9 | |||||||||||||||||||||||||||||||||||
| Managed Risk International Fund | ||||||||||||||||||||||||||||||||||||||||||||||||||||||||
| Class P1: | ||||||||||||||||||||||||||||||||||||||||||||||||||||||||
| 12/31/14 | $ | 10.82 | $ | .14 | $ | (.71 | ) | $ | (.57 | ) | $ | (.15 | ) | $ | — | $ | (.15 | ) | $ | 10.10 | (5.31 | )% | $ | — | 6 | .50 | % | .25 | % | .76 | % | 1.33 | % | |||||||||||||||||||||||
| 12/31/133,15 | 10.00 | .13 | .78 | .91 | (.09 | ) | — | (.09 | ) | 10.82 | 9.08 | 5 | — | 6 | 1.05 | 5,9 | .23 | 5,9 | .73 | 5,9 | 1.92 | 5,9 | ||||||||||||||||||||||||||||||||||
| Class P2: | ||||||||||||||||||||||||||||||||||||||||||||||||||||||||
| 12/31/14 | 10.82 | .16 | (.77 | ) | (.61 | ) | (.12 | ) | — | (.12 | ) | 10.09 | (5.68 | ) | 46 | .91 | .67 | 1.18 | 1.51 | |||||||||||||||||||||||||||||||||||||
| 12/31/133,15 | 10.00 | .18 | .72 | .90 | (.08 | ) | — | (.08 | ) | 10.82 | 8.99 | 5 | 17 | 1.19 | 5,9 | .44 | 5,9 | .94 | 5,9 | 2.66 | 5,9 | |||||||||||||||||||||||||||||||||||
See end of tables for footnotes.
| American Funds Insurance Series | 185 |
Financial highlights (continued)
| Income (loss) from investment operations1 | Dividends and distributions | |||||||||||||||||||||||||||||||||||||||||||||||||||||||
| Net asset value, beginning of period | Net investment income (loss) | Net gains (losses) on securities (both realized and unrealized) | Total from investment operations | Dividends (from net investment income) | Distributions (from capital gains) | Total dividends and distributions | Net asset value, end of period | Total return2,13 | Net assets, end of period (in millions) | Ratio of expenses to average net assets before reimbursements/ waivers | Ratio of expenses to average net assets after reimbursements/ waivers13 | Net effective expense ratio13,14 | Ratio of net income to average net assets13 | |||||||||||||||||||||||||||||||||||||||||||
| Managed Risk Blue Chip Income and Growth Fund | ||||||||||||||||||||||||||||||||||||||||||||||||||||||||
| Class P1: | ||||||||||||||||||||||||||||||||||||||||||||||||||||||||
| 12/31/14 | $ | 11.05 | $ | .40 | $ | .55 | $ | .95 | $ | (.30 | ) | $ | — | $ | (.30 | ) | $ | 11.70 | 8.58 | % | $ | — | 6 | .50 | % | .31 | % | .70 | % | 3.43 | % | |||||||||||||||||||||||||
| 12/31/133,15 | 10.00 | .20 | 1.01 | 1.21 | (.16 | ) | — | (.16 | ) | 11.05 | 12.16 | 5 | — | 6 | .84 | 5,9 | .24 | 5,9 | .64 | 5,9 | 2.80 | 5,9 | ||||||||||||||||||||||||||||||||||
| Class P2: | ||||||||||||||||||||||||||||||||||||||||||||||||||||||||
| 12/31/14 | 11.05 | .50 | .40 | .90 | (.28 | ) | — | (.28 | ) | 11.67 | 8.10 | 98 | .88 | .69 | 1.08 | 4.27 | ||||||||||||||||||||||||||||||||||||||||
| 12/31/133,15 | 10.00 | .28 | .92 | 1.20 | (.15 | ) | — | (.15 | ) | 11.05 | 12.05 | 5 | 26 | 1.04 | 5,9 | .54 | 5,9 | .94 | 5,9 | 3.91 | 5,9 | |||||||||||||||||||||||||||||||||||
| Managed Risk Growth-Income Fund | ||||||||||||||||||||||||||||||||||||||||||||||||||||||||
| Class P1: | ||||||||||||||||||||||||||||||||||||||||||||||||||||||||
| 12/31/14 | $ | 11.50 | $ | .35 | $ | .21 | $ | .56 | $ | (.14 | ) | $ | (.25 | ) | $ | (.39 | ) | $ | 11.67 | 4.85 | % | $ | — | 6 | .45 | % | .25 | % | .52 | % | 2.94 | % | ||||||||||||||||||||||||
| 12/31/133,15 | 10.00 | .14 | 1.47 | 1.61 | (.11 | ) | — | (.11 | ) | 11.50 | 16.15 | 5 | — | 6 | .92 | 5,9 | .23 | 5,9 | .50 | 5,9 | 2.01 | 5,9 | ||||||||||||||||||||||||||||||||||
| Class P2: | ||||||||||||||||||||||||||||||||||||||||||||||||||||||||
| 12/31/14 | 11.50 | .16 | .35 | .51 | (.11 | ) | (.25 | ) | (.36 | ) | 11.65 | 4.42 | 76 | .87 | .69 | .96 | 1.38 | |||||||||||||||||||||||||||||||||||||||
| 12/31/133,15 | 10.00 | .20 | 1.40 | 1.60 | (.10 | ) | — | (.10 | ) | 11.50 | 16.04 | 5 | 24 | 1.09 | 5,9 | .50 | 5,9 | .77 | 5,9 | 2.73 | 5,9 | |||||||||||||||||||||||||||||||||||
| Managed Risk Asset Allocation Fund | ||||||||||||||||||||||||||||||||||||||||||||||||||||||||
| Class P1: | ||||||||||||||||||||||||||||||||||||||||||||||||||||||||
| 12/31/14 | $ | 11.93 | $ | .13 | $ | .26 | $ | .39 | $ | (.03 | ) | $ | — | $ | (.03 | ) | $ | 12.29 | 3.24 | % | $ | 277 | .53 | % | .48 | % | .76 | % | 1.04 | % | ||||||||||||||||||||||||||
| 12/31/13 | 9.99 | .27 | 1.81 | 2.08 | (.14 | ) | — | (.14 | ) | 11.93 | 20.82 | 5 | 112 | .55 | 5 | .47 | 5 | .75 | 5 | 2.37 | 5 | |||||||||||||||||||||||||||||||||||
| 12/31/123,16 | 10.00 | .15 | (.03 | ) | .12 | (.13 | ) | — | (.13 | ) | 9.99 | 1.24 | 5 | — | 6 | .15 | 5 | .07 | 5 | .37 | 5 | 1.72 | 5 | |||||||||||||||||||||||||||||||||
| Class P2: | ||||||||||||||||||||||||||||||||||||||||||||||||||||||||
| 12/31/14 | 11.93 | .16 | .19 | .35 | (.01 | ) | — | (.01 | ) | 12.27 | 2.91 | 1,780 | .79 | .73 | 1.01 | 1.33 | ||||||||||||||||||||||||||||||||||||||||
| 12/31/13 | 9.99 | .28 | 1.77 | 2.05 | (.11 | ) | — | (.11 | ) | 11.93 | 20.58 | 5 | 795 | .80 | 5 | .73 | 5 | 1.01 | 5 | 2.43 | 5 | |||||||||||||||||||||||||||||||||||
| 12/31/123,16 | 10.00 | .17 | (.05 | ) | .12 | (.13 | ) | — | (.13 | ) | 9.99 | 1.21 | 5 | — | 6 | .24 | 5 | .11 | 5 | .41 | 5 | 2.38 | 5 | |||||||||||||||||||||||||||||||||
| 186 | American Funds Insurance Series |
| Portfolio turnover rate for all share classes | Period ended December 31 | |||||||||||||||||||
| including mortgage dollar roll transactions17 | 2014 | 2013 | 2012 | 2011 | 2010 | |||||||||||||||
| Global Growth Fund | 22 | % | 39 | % | 22 | % | 28 | % | 28 | % | ||||||||||
| Global Small Capitalization Fund | 28 | 36 | 40 | 44 | 47 | |||||||||||||||
| Growth Fund | 29 | 19 | 21 | 19 | 28 | |||||||||||||||
| International Fund | 18 | 21 | 29 | 24 | 25 | |||||||||||||||
| New World Fund | 36 | 43 | 32 | 22 | 18 | |||||||||||||||
| Blue Chip Income and Growth Fund | 37 | 30 | 36 | 27 | 22 | |||||||||||||||
| Global Growth and Income Fund | 28 | 31 | 30 | 25 | 30 | |||||||||||||||
| Growth-Income Fund | 25 | 19 | 25 | 22 | 22 | |||||||||||||||
| International Growth and Income Fund | 34 | 34 | 31 | 48 | 31 | |||||||||||||||
| Capital Income Builder | 35 | 8 | ||||||||||||||||||
| Asset Allocation Fund | 88 | 74 | 61 | 43 | 46 | |||||||||||||||
| Global Balanced Fund | 73 | 81 | 80 | 34 | 11 | |||||||||||||||
| Bond Fund | 365 | 354 | 253 | 163 | 187 | |||||||||||||||
| Global Bond Fund | 200 | 213 | 160 | 101 | 106 | |||||||||||||||
| High-Income Bond Fund | 54 | 64 | 48 | 51 | 54 | |||||||||||||||
| Mortgage Fund | 790 | 715 | 444 | 480 | 11 | |||||||||||||||
| U.S. Government/AAA-Rated Securities Fund | 387 | 621 | 447 | 234 | 208 | |||||||||||||||
| Cash Management Fund | — | — | — | — | — | |||||||||||||||
| Managed Risk Growth Fund | 22 | 10 | 15 | |||||||||||||||||
| Managed Risk International Fund | 22 | 6 | 15 | |||||||||||||||||
| Managed Risk Blue Chip Income and Growth Fund | 22 | 3 | 15 | |||||||||||||||||
| Managed Risk Growth-Income Fund | 28 | 2 | 15 | |||||||||||||||||
| Managed Risk Asset Allocation Fund | 3 | 3 | — | 16,18 | ||||||||||||||||
| Portfolio turnover rate for all share classes | Period ended December 31 | |||||||||||||||||||
| excluding mortgage dollar roll transactions17 | 2014 | 2013 | 2012 | 2011 | 2010 | |||||||||||||||
| Capital Income Builder | 24 | % | ||||||||||||||||||
| Asset Allocation Fund | 42 | |||||||||||||||||||
| Global Balanced Fund | 40 | |||||||||||||||||||
| Bond Fund | 121 | Not available | ||||||||||||||||||
| Global Bond Fund | 134 | |||||||||||||||||||
| Mortgage Fund | 108 | |||||||||||||||||||
| U.S. Government/AAA-Rated Securities Fund | 88 | |||||||||||||||||||
| 1 | Based on average shares outstanding. |
| 2 | Not annualized. |
| 3 | Based on operations for the period shown and, accordingly, is not representative of a full year. |
| 4 | Class 4 shares were offered beginning December 14, 2012. |
| 5 | Although the series has a plan of distribution and an insurance administrative services plan for some share classes, distribution services fees and/or insurance administrative services fees are not paid on amounts invested in a fund by the investment adviser and/or its affiliates. If fees for these services were charged on these assets, fund expenses would have been higher and net income and total return would have been lower. |
| 6 | Amount less than $1 million. |
| 7 | For the year ended December 31, 2014, this column reflects the impact of a corporate action event that resulted in a one-time increase to net investment income. If the corporate action event had not occurred, the net investment income per share and ratio of net income to average net assets would have been lower for all share classes. |
| 8 | For the period May 1, 2014, commencement of operations, through December 31, 2014. |
| 9 | Annualized. |
| 10 | This class consisted solely of seed capital invested by CRMC; therefore, certain fees were not accrued. |
| 11 | For the period May 2, 2011, commencement of operations, through December 31, 2011. |
| 12 | Amount less than $.01. |
| 13 | This column reflects the impact, if any, of certain waivers by CRMC. CRMC reduced fees for investment advisory services for U.S. Government/AAA-Rated Securities Fund during 2010 and for the managed risk funds since each fund’s commencement of operations. |
| 14 | Ratio reflects weighted average net expense ratio of the underlying fund for the period presented. See Expense Example for further information regarding fees and expenses. |
| 15 | For the period May 1, 2013, commencement of operations, through December 31, 2013. |
| 16 | For the period September 28, 2012, commencement of operations, through December 31, 2012. |
| 17 | Refer to Note 5 for further information on mortgage dollar rolls. |
| 18 | Amount less than 1%. |
| American Funds Insurance Series | 187 |
Report of Independent Registered Public Accounting Firm
To the Board of Trustees and Shareholders of American Funds Insurance Series
In our opinion, the accompanying statements of assets and liabilities, including the summary investment portfolios (investment portfolios for Cash Management Fund, Managed Risk Growth Fund, Managed Risk International Fund, Managed Risk Blue Chip Income and Growth Fund, Managed Risk Growth-Income Fund and Managed Risk Asset Allocation Fund), and the related statements of operations and of changes in net assets and the financial highlights present fairly, in all material respects, the financial position of Global Growth Fund, Global Small Capitalization Fund, Growth Fund, International Fund, New World Fund, Blue Chip Income and Growth Fund, Global Growth and Income Fund, Growth-Income Fund, International Growth and Income Fund, Capital Income Builder, Asset Allocation Fund, Global Balanced Fund, Bond Fund, Global Bond Fund, High-Income Bond Fund, Mortgage Fund, U.S. Government/ AAA-Rated Securities Fund, Cash Management Fund, Managed Risk Growth Fund, Managed Risk International Fund, Managed Risk Blue Chip Income and Growth Fund, Managed Risk Growth-Income Fund and Managed Risk Asset Allocation Fund (constituting American Funds Insurance Series, hereafter referred to as the “Series”) at December 31, 2014, and the results of each of their operations, the changes in each of their net assets and the financial highlights for each of the periods presented, in conformity with accounting principles generally accepted in the United States of America. These financial statements and financial highlights (hereafter referred to as “financial statements”) are the responsibility of the Series’ management. Our responsibility is to express an opinion on these financial statements based on our audits. We conducted our audits of these financial statements in accordance with the standards of the Public Company Accounting Oversight Board (United States). Those standards require that we plan and perform the audit to obtain reasonable assurance about whether the financial statements are free of material misstatement. An audit includes examining, on a test basis, evidence supporting the amounts and disclosures in the financial statements, assessing the accounting principles used and significant estimates made by management, and evaluating the overall financial statement presentation. We believe that our audits, which included confirmation of securities at December 31, 2014 by correspondence with the custodians and brokers, provide a reasonable basis for our opinion.
PricewaterhouseCoopers, LLP
Los Angeles, California
February 6, 2015
| 188 | American Funds Insurance Series |
| Expense example | unaudited |
The funds in American Funds Insurance Series serve as the underlying investment vehicle for various insurance products. As an owner of an insurance contract that invests in one of the funds in the series, you incur two types of costs: (1) transaction costs, such as initial sales charges on purchase payments and contingent deferred sales charges on redemptions (loads), and (2) ongoing costs, including management fees, distribution and service (12b-1) fees, and other expenses. Additional fees are charged by the insurance companies related to the various benefits they provide. This example is intended to help you understand your ongoing costs (in dollars) of investing in the underlying funds so you can compare these costs with the ongoing costs of investing in other mutual funds that serve a similar function in other annuity products. The example is based on an investment of $1,000 invested at the beginning of the period and held for the entire six-month period (July 1, 2014, through December 31, 2014).
Actual expenses:
The first line of each share class in the tables on the following pages provides information about actual account values and actual expenses. You may use the information in this line, together with the amount you invested, to estimate the expenses that you paid over the period. Simply divide your account value by $1,000 (for example, an $8,600 account value divided by $1,000 = 8.6), then multiply the result by the number in the first line under the heading entitled “Expenses paid during period” to estimate the expenses you paid on your account during this period.
Hypothetical example for comparison purposes:
The second line of each share class in the tables on the following pages provides information about hypothetical account values and hypothetical expenses based on the actual expense ratio for the share class and an assumed rate of return of 5.00% per year before expenses, which is not the actual return of the share class. The hypothetical account values and expenses may not be used to estimate the actual ending account balance or expenses you paid for the period. You may use this information to compare the ongoing costs of investing in the fund and other funds. To do so, compare this 5.00% hypothetical example with the 5.00% hypothetical examples that appear in the shareholder reports of the other funds.
Notes:
Additional fees are charged by the insurance companies related to the various benefits they provide. You can estimate the impact of these fees by adding the amount of the fees to the total estimated expenses you paid on your account during the period as calculated above. In addition, your ending account value would be lower by the amount of these fees.
Note that the expenses shown in the tables on the following pages are meant to highlight your ongoing costs only and do not reflect any transactional costs. Therefore, the second line of each share class in the tables is useful in comparing ongoing costs only and will not help you determine the relative total costs of owning different funds. In addition, if these transactional costs were included, your costs would have been higher.
| American Funds Insurance Series | 189 |
| Beginning account value 7/1/2014 | Ending account value 12/31/2014 | Expenses paid during period1 | Annualized expense ratio | |||||||||||||
| Global Growth Fund | ||||||||||||||||
| Class 1 – actual return | $ | 1,000.00 | $ | 998.73 | $ | 2.77 | .55 | % | ||||||||
| Class 1 – assumed 5% return | 1,000.00 | 1,022.43 | 2.80 | .55 | ||||||||||||
| Class 2 – actual return | 1,000.00 | 997.95 | 4.03 | .80 | ||||||||||||
| Class 2 – assumed 5% return | 1,000.00 | 1,021.17 | 4.08 | .80 | ||||||||||||
| Class 4 – actual return | 1,000.00 | 996.38 | 5.28 | 1.05 | ||||||||||||
| Class 4 – assumed 5% return | 1,000.00 | 1,019.91 | 5.35 | 1.05 | ||||||||||||
| Global Small Capitalization Fund | ||||||||||||||||
| Class 1 – actual return | $ | 1,000.00 | $ | 955.18 | $ | 3.65 | .74 | % | ||||||||
| Class 1 – assumed 5% return | 1,000.00 | 1,021.48 | 3.77 | .74 | ||||||||||||
| Class 2 – actual return | 1,000.00 | 953.68 | 4.88 | .99 | ||||||||||||
| Class 2 – assumed 5% return | 1,000.00 | 1,020.21 | 5.04 | .99 | ||||||||||||
| Class 4 – actual return | 1,000.00 | 952.56 | 6.10 | 1.24 | ||||||||||||
| Class 4 – assumed 5% return | 1,000.00 | 1,018.95 | 6.31 | 1.24 | ||||||||||||
| Growth Fund | ||||||||||||||||
| Class 1 – actual return | $ | 1,000.00 | $ | 1,029.61 | $ | 1.79 | .35 | % | ||||||||
| Class 1 – assumed 5% return | 1,000.00 | 1,023.44 | 1.79 | .35 | ||||||||||||
| Class 2 – actual return | 1,000.00 | 1,028.26 | 3.07 | .60 | ||||||||||||
| Class 2 – assumed 5% return | 1,000.00 | 1,022.18 | 3.06 | .60 | ||||||||||||
| Class 3 – actual return | 1,000.00 | 1,028.61 | 2.71 | .53 | ||||||||||||
| Class 3 – assumed 5% return | 1,000.00 | 1,022.53 | 2.70 | .53 | ||||||||||||
| Class 4 – actual return | 1,000.00 | 1,026.89 | 4.34 | .85 | ||||||||||||
| Class 4 – assumed 5% return | 1,000.00 | 1,020.92 | 4.33 | .85 | ||||||||||||
| International Fund | ||||||||||||||||
| Class 1 – actual return | $ | 1,000.00 | $ | 939.11 | $ | 2.64 | .54 | % | ||||||||
| Class 1 – assumed 5% return | 1,000.00 | 1,022.48 | 2.75 | .54 | ||||||||||||
| Class 2 – actual return | 1,000.00 | 937.99 | 3.86 | .79 | ||||||||||||
| Class 2 – assumed 5% return | 1,000.00 | 1,021.22 | 4.02 | .79 | ||||||||||||
| Class 3 – actual return | 1,000.00 | 938.42 | 3.52 | .72 | ||||||||||||
| Class 3 – assumed 5% return | 1,000.00 | 1,021.58 | 3.67 | .72 | ||||||||||||
| Class 4 – actual return | 1,000.00 | 936.89 | 5.13 | 1.05 | ||||||||||||
| Class 4 – assumed 5% return | 1,000.00 | 1,019.91 | 5.35 | 1.05 | ||||||||||||
| New World Fund | ||||||||||||||||
| Class 1 – actual return | $ | 1,000.00 | $ | 879.65 | $ | 3.74 | .79 | % | ||||||||
| Class 1 – assumed 5% return | 1,000.00 | 1,021.22 | 4.02 | .79 | ||||||||||||
| Class 2 – actual return | 1,000.00 | 878.45 | 4.92 | 1.04 | ||||||||||||
| Class 2 – assumed 5% return | 1,000.00 | 1,019.96 | 5.30 | 1.04 | ||||||||||||
| Class 4 – actual return | 1,000.00 | 877.36 | 6.10 | 1.29 | ||||||||||||
| Class 4 – assumed 5% return | 1,000.00 | 1,018.70 | 6.56 | 1.29 | ||||||||||||
| Blue Chip Income and Growth Fund | ||||||||||||||||
| Class 1 – actual return | $ | 1,000.00 | $ | 1,069.58 | $ | 2.19 | .42 | % | ||||||||
| Class 1 – assumed 5% return | 1,000.00 | 1,023.09 | 2.14 | .42 | ||||||||||||
| Class 2 – actual return | 1,000.00 | 1,067.94 | 3.49 | .67 | ||||||||||||
| Class 2 – assumed 5% return | 1,000.00 | 1,021.83 | 3.41 | .67 | ||||||||||||
| Class 4 – actual return | 1,000.00 | 1,066.75 | 4.79 | .92 | ||||||||||||
| Class 4 – assumed 5% return | 1,000.00 | 1,020.57 | 4.69 | .92 | ||||||||||||
| 190 | American Funds Insurance Series |
| Beginning account value 7/1/2014 | Ending account value 12/31/2014 | Expenses paid during period1 | Annualized expense ratio | |||||||||||||
| Global Growth and Income Fund | ||||||||||||||||
| Class 1 – actual return | $ | 1,000.00 | $ | 994.32 | $ | 3.17 | .63 | % | ||||||||
| Class 1 – assumed 5% return | 1,000.00 | 1,022.03 | 3.21 | .63 | ||||||||||||
| Class 2 – actual return | 1,000.00 | 992.80 | 4.42 | .88 | ||||||||||||
| Class 2 – assumed 5% return | 1,000.00 | 1,020.77 | 4.48 | .88 | ||||||||||||
| Class 4 – actual return | 1,000.00 | 992.28 | 5.67 | 1.13 | ||||||||||||
| Class 4 – assumed 5% return | 1,000.00 | 1,019.51 | 5.75 | 1.13 | ||||||||||||
| Growth-Income Fund | ||||||||||||||||
| Class 1 – actual return | $ | 1,000.00 | $ | 1,035.89 | $ | 1.49 | .29 | % | ||||||||
| Class 1 – assumed 5% return | 1,000.00 | 1,023.74 | 1.48 | .29 | ||||||||||||
| Class 2 – actual return | 1,000.00 | 1,034.47 | 2.77 | .54 | ||||||||||||
| Class 2 – assumed 5% return | 1,000.00 | 1,022.48 | 2.75 | .54 | ||||||||||||
| Class 3 – actual return | 1,000.00 | 1,034.80 | 2.41 | .47 | ||||||||||||
| Class 3 – assumed 5% return | 1,000.00 | 1,022.84 | 2.40 | .47 | ||||||||||||
| Class 4 – actual return | 1,000.00 | 1,033.24 | 4.05 | .79 | ||||||||||||
| Class 4 – assumed 5% return | 1,000.00 | 1,021.22 | 4.02 | .79 | ||||||||||||
| International Growth and Income Fund | ||||||||||||||||
| Class 1 – actual return | $ | 1,000.00 | $ | 919.68 | $ | 3.92 | .81 | % | ||||||||
| Class 1 – assumed 5% return | 1,000.00 | 1,021.12 | 4.13 | .81 | ||||||||||||
| Class 2 – actual return | 1,000.00 | 918.41 | 4.84 | 1.00 | ||||||||||||
| Class 2 – assumed 5% return | 1,000.00 | 1,020.16 | 5.09 | 1.00 | ||||||||||||
| Class 4 – actual return | 1,000.00 | 917.20 | 7.49 | 1.55 | ||||||||||||
| Class 4 – assumed 5% return | 1,000.00 | 1,017.39 | 7.88 | 1.55 | ||||||||||||
| Capital Income Builder | ||||||||||||||||
| Class 1 – actual return | $ | 1,000.00 | $ | 976.68 | $ | 2.84 | .57 | % | ||||||||
| Class 1 – assumed 5% return | 1,000.00 | 1,022.33 | 2.91 | .57 | ||||||||||||
| Class 2 – actual return | 1,000.00 | 976.68 | 2.39 | .48 | ||||||||||||
| Class 2 – assumed 5% return | 1,000.00 | 1,022.79 | 2.45 | .48 | ||||||||||||
| Class 4 – actual return | 1,000.00 | 974.81 | 5.28 | 1.06 | ||||||||||||
| Class 4 – assumed 5% return | 1,000.00 | 1,019.86 | 5.40 | 1.06 | ||||||||||||
| Asset Allocation Fund | ||||||||||||||||
| Class 1 – actual return | $ | 1,000.00 | $ | 1,014.60 | $ | 1.52 | .30 | % | ||||||||
| Class 1 – assumed 5% return | 1,000.00 | 1,023.69 | 1.53 | .30 | ||||||||||||
| Class 2 – actual return | 1,000.00 | 1,013.46 | 2.79 | .55 | ||||||||||||
| Class 2 – assumed 5% return | 1,000.00 | 1,022.43 | 2.80 | .55 | ||||||||||||
| Class 3 – actual return | 1,000.00 | 1,013.89 | 2.44 | .48 | ||||||||||||
| Class 3 – assumed 5% return | 1,000.00 | 1,022.79 | 2.45 | .48 | ||||||||||||
| Class 4 – actual return | 1,000.00 | 1,012.33 | 4.06 | .80 | ||||||||||||
| Class 4 – assumed 5% return | 1,000.00 | 1,021.17 | 4.08 | .80 | ||||||||||||
| Global Balanced Fund | ||||||||||||||||
| Class 1 – actual return | $ | 1,000.00 | $ | 971.60 | $ | 3.48 | .70 | % | ||||||||
| Class 1 – assumed 5% return | 1,000.00 | 1,021.68 | 3.57 | .70 | ||||||||||||
| Class 2 – actual return | 1,000.00 | 970.08 | 4.72 | .95 | ||||||||||||
| Class 2 – assumed 5% return | 1,000.00 | 1,020.42 | 4.84 | .95 | ||||||||||||
| Class 4 – actual return | 1,000.00 | 971.68 | 3.28 | .66 | ||||||||||||
| Class 4 – assumed 5% return | 1,000.00 | 1,021.88 | 3.36 | .66 | ||||||||||||
| American Funds Insurance Series | 191 |
| Beginning account value 7/1/2014 | Ending account value 12/31/2014 | Expenses paid during period1 | Annualized expense ratio | |||||||||||||
| Bond Fund | ||||||||||||||||
| Class 1 – actual return | $ | 1,000.00 | $ | 1,013.80 | $ | 1.98 | .39 | % | ||||||||
| Class 1 – assumed 5% return | 1,000.00 | 1,023.24 | 1.99 | .39 | ||||||||||||
| Class 2 – actual return | 1,000.00 | 1,011.76 | 3.25 | .64 | ||||||||||||
| Class 2 – assumed 5% return | 1,000.00 | 1,021.98 | 3.26 | .64 | ||||||||||||
| Class 4 – actual return | 1,000.00 | 1,011.51 | 4.51 | .89 | ||||||||||||
| Class 4 – assumed 5% return | 1,000.00 | 1,020.72 | 4.53 | .89 | ||||||||||||
| Global Bond Fund | ||||||||||||||||
| Class 1 – actual return | $ | 1,000.00 | $ | 960.74 | $ | 2.87 | .58 | % | ||||||||
| Class 1 – assumed 5% return | 1,000.00 | 1,022.28 | 2.96 | .58 | ||||||||||||
| Class 2 – actual return | 1,000.00 | 959.94 | 4.10 | .83 | ||||||||||||
| Class 2 – assumed 5% return | 1,000.00 | 1,021.02 | 4.23 | .83 | ||||||||||||
| Class 4 – actual return | 1,000.00 | 957.68 | 5.38 | 1.09 | ||||||||||||
| Class 4 – assumed 5% return | 1,000.00 | 1,019.71 | 5.55 | 1.09 | ||||||||||||
| High-Income Bond Fund | ||||||||||||||||
| Class 1 – actual return | $ | 1,000.00 | $ | 966.90 | $ | 2.38 | .48 | % | ||||||||
| Class 1 – assumed 5% return | 1,000.00 | 1,022.79 | 2.45 | .48 | ||||||||||||
| Class 2 – actual return | 1,000.00 | 966.04 | 3.62 | .73 | ||||||||||||
| Class 2 – assumed 5% return | 1,000.00 | 1,021.53 | 3.72 | .73 | ||||||||||||
| Class 3 – actual return | 1,000.00 | 965.32 | 3.27 | .66 | ||||||||||||
| Class 3 – assumed 5% return | 1,000.00 | 1,021.88 | 3.36 | .66 | ||||||||||||
| Class 4 – actual return | 1,000.00 | 964.22 | 4.80 | .97 | ||||||||||||
| Class 4 – assumed 5% return | 1,000.00 | 1,020.32 | 4.94 | .97 | ||||||||||||
| Mortgage Fund | ||||||||||||||||
| Class 1 – actual return | $ | 1,000.00 | $ | 1,013.71 | $ | 2.23 | .44 | % | ||||||||
| Class 1 – assumed 5% return | 1,000.00 | 1,022.99 | 2.24 | .44 | ||||||||||||
| Class 2 – actual return | 1,000.00 | 1,011.66 | 3.50 | .69 | ||||||||||||
| Class 2 – assumed 5% return | 1,000.00 | 1,021.73 | 3.52 | .69 | ||||||||||||
| Class 4 – actual return | 1,000.00 | 1,010.24 | 4.76 | .94 | ||||||||||||
| Class 4 – assumed 5% return | 1,000.00 | 1,020.47 | 4.79 | .94 | ||||||||||||
| U.S. Government/AAA-Rated Securities Fund | ||||||||||||||||
| Class 1 – actual return | $ | 1,000.00 | $ | 1,012.67 | $ | 1.78 | .35 | % | ||||||||
| Class 1 – assumed 5% return | 1,000.00 | 1,023.44 | 1.79 | .35 | ||||||||||||
| Class 2 – actual return | 1,000.00 | 1,011.41 | 3.04 | .60 | ||||||||||||
| Class 2 – assumed 5% return | 1,000.00 | 1,022.18 | 3.06 | .60 | ||||||||||||
| Class 3 – actual return | 1,000.00 | 1,011.84 | 2.69 | .53 | ||||||||||||
| Class 3 – assumed 5% return | 1,000.00 | 1,022.53 | 2.70 | .53 | ||||||||||||
| Class 4 – actual return | 1,000.00 | 1,010.44 | 4.31 | .85 | ||||||||||||
| Class 4 – assumed 5% return | 1,000.00 | 1,020.92 | 4.33 | .85 | ||||||||||||
| Cash Management Fund | ||||||||||||||||
| Class 1 – actual return | $ | 1,000.00 | $ | 998.23 | $ | 1.71 | .34 | % | ||||||||
| Class 1 – assumed 5% return | 1,000.00 | 1,023.49 | 1.73 | .34 | ||||||||||||
| Class 2 – actual return | 1,000.00 | 997.29 | 2.97 | .59 | ||||||||||||
| Class 2 – assumed 5% return | 1,000.00 | 1,022.23 | 3.01 | .59 | ||||||||||||
| Class 3 – actual return | 1,000.00 | 998.21 | 2.62 | .52 | ||||||||||||
| Class 3 – assumed 5% return | 1,000.00 | 1,022.58 | 2.65 | .52 | ||||||||||||
| Class 4 – actual return | 1,000.00 | 997.34 | 4.23 | .84 | ||||||||||||
| Class 4 – assumed 5% return | 1,000.00 | 1,020.97 | 4.28 | .84 | ||||||||||||
| 192 | American Funds Insurance Series |
| Beginning account value 7/1/2014 | Ending account value 12/31/14 | Expenses paid during period1,2 | Annualized expense ratio2 | Effective expenses paid during period3 | Effective annualized expense ratio4 | |||||||||||||||
| Managed Risk Growth Fund | ||||||||||||||||||||
| Class P1 – actual return | $ | 1,000.00 | $ | 989.71 | $ | 1.60 | .32 | % | $ | 3.26 | .65 | % | ||||||||
| Class P1 – assumed 5% return | 1,000.00 | 1,023.59 | 1.63 | .32 | 3.31 | .65 | ||||||||||||||
| Class P2 – actual return | 1,000.00 | 988.23 | 3.56 | .71 | 5.21 | 1.04 | ||||||||||||||
| Class P2 – assumed 5% return | 1,000.00 | 1,021.63 | 3.62 | .71 | 5.30 | 1.04 | ||||||||||||||
| Managed Risk International Fund | ||||||||||||||||||||
| Class P1 – actual return | $ | 1,000.00 | $ | 931.14 | $ | 1.27 | .26 | % | $ | 3.75 | .77 | % | ||||||||
| Class P1 – assumed 5% return | 1,000.00 | 1,023.89 | 1.23 | .26 | 3.92 | .77 | ||||||||||||||
| Class P2 – actual return | 1,000.00 | 929.21 | 3.36 | .69 | 5.84 | 1.20 | ||||||||||||||
| Class P2 – assumed 5% return | 1,000.00 | 1,021.73 | 3.52 | .69 | 6.11 | 1.20 | ||||||||||||||
| Managed Risk Blue Chip Income and Growth Fund | ||||||||||||||||||||
| Class P1 – actual return | $ | 1,000.00 | $ | 1,026.28 | $ | 1.69 | .33 | % | $ | 3.68 | .72 | % | ||||||||
| Class P1 – assumed 5% return | 1,000.00 | 1,023.54 | 1.68 | .33 | 3.67 | .72 | ||||||||||||||
| Class P2 – actual return | 1,000.00 | 1,024.39 | 3.62 | .71 | 5.61 | 1.10 | ||||||||||||||
| Class P2 – assumed 5% return | 1,000.00 | 1,081.63 | 3.62 | .71 | 5.60 | 1.10 | ||||||||||||||
| Managed Risk Growth-Income Fund | ||||||||||||||||||||
| Class P1 – actual return | $ | 1,000.00 | $ | 998.12 | $ | 1.31 | .26 | % | $ | 2.67 | .53 | % | ||||||||
| Class P1 – assumed 5% return | 1,000.00 | 1,023.89 | 1.33 | .26 | 2.70 | .53 | ||||||||||||||
| Class P2 – actual return | 1,000.00 | 996.41 | 3.57 | .71 | 4.93 | .98 | ||||||||||||||
| Class P2 – assumed 5% return | 1,000.00 | 1,021.63 | 3.62 | .71 | 4.99 | .98 | ||||||||||||||
| Managed Risk Asset Allocation Fund | ||||||||||||||||||||
| Class P1 – actual return | $ | 1,000.00 | $ | 1,003.76 | $ | 2.42 | .48 | % | $ | 3.84 | .76 | % | ||||||||
| Class P1 – assumed 5% return | 1,000.00 | 1,022.79 | 2.45 | .48 | 3.87 | .76 | ||||||||||||||
| Class P2 – actual return | 1,000.00 | 1,002.13 | 3.68 | .73 | 5.10 | 1.01 | ||||||||||||||
| Class P2 – assumed 5% return | 1,000.00 | 1,021.53 | 3.72 | .73 | 5.14 | 1.01 | ||||||||||||||
| 1 | The “expenses paid during period” are equal to the “annualized expense ratio,” multiplied by the average account value over the period, multiplied by the number of days in the period, and divided by 365 (to reflect the one-half year period). |
| 2 | The “expenses paid during period” and “annualized expense ratio” do not include the expenses of the underlying funds in which each fund invests. |
| 3 | The “effective expenses paid during period” are equal to the “effective annualized expense ratio,” multiplied by the average account value over the period, multiplied by the number of days in the period, and divided by 365 (to reflect the one-half year period). |
| 4 | The “effective annualized expense ratio” reflects the net annualized expense ratio of the class plus the class’s pro-rata share of the weighted average expense ratio of the underlying funds in which it invests. |
| American Funds Insurance Series | 193 |
Approval of Investment Advisory and Service Agreement – American Funds Insurance Series
The American Funds Insurance Series’ board has approved the renewal of the series’ Investment Advisory and Service Agreement (the “agreement”) with Capital Research and Management Company (“CRMC”) through January 31, 2016. The agreement was amended to add an additional advisory fee breakpoint for Blue Chip Income and Growth Fund when the fund’s net assets exceed $4 billion and $6.5 billion. The board approved the agreement following the recommendation of the series’ Contracts Committee (the “committee”), which is composed of all of the series’ independent board members. The board and the committee determined that each fund’s advisory fee structure was fair and reasonable in relation to the services provided, and that approving the agreement was in the best interests of each fund and its shareholders.
In reaching this decision, the board and the committee took into account information furnished to them throughout the year and otherwise provided to them, as well as information prepared specifically in connection with their review of the agreement, and were advised by their independent counsel. They considered the factors discussed below, among others, but did not identify any single issue or particular piece of information that, in isolation, was the controlling factor, and each board and committee member did not necessarily attribute the same weight to each factor.
1. Nature, extent and quality of services
The board and the committee considered the depth and quality of CRMC’s investment management process, including its global research capabilities; the experience, capability and integrity of its senior management and other personnel; the low turnover rates of its key personnel; the overall financial strength and stability of its organization; and the ongoing evolution of CRMC’s organizational structure designed to maintain and strengthen these qualities. The board and the committee also considered the nature, extent and quality of administrative, compliance and shareholder services provided by CRMC to the funds under each fund’s agreement and other agreements, as well as the benefits to each fund’s shareholders from investing in a fund that is part of a large family of funds. The board and the committee concluded that the nature, extent and quality of the services provided by CRMC have benefited and should continue to benefit each fund and its shareholders.
2. Investment results
The board and the committee considered the investment results of each fund in light of its objectives. They compared each fund’s investment results with those of other relevant funds (including funds that form the basis of the Lipper index for the category in which the fund is included), and data such as relevant market and fund indexes, over various periods through June 30, 2014. This report, including the letter to shareholders and related disclosures, contains certain information about each fund’s investment results.
Global Growth Fund seeks to provide long-term growth of capital by investing primarily in common stocks of companies located around the world. The board and the committee reviewed the fund’s investment results measured against (i) the Lipper Global Funds Average (the Lipper category that includes the fund) and (ii) MSCI All Country World Index. They noted that the fund’s investment results were above both benchmarks over the one-, three-, five- and 10-year periods, as well as over the lifetime of the fund since April 30, 1997, but below the benchmarks for the six-month period.
Global Small Capitalization Fund seeks to provide long-term growth of capital by investing primarily in stocks of smaller companies located around the world. The board and the committee reviewed the fund’s investment results measured against (i) the Lipper Global Small/Mid-Cap Funds Average (the Lipper category that includes the fund) and (ii) MSCI All Country World Small Cap Index. They noted that the fund’s investment results were higher than both benchmarks over the six-month, one-year and 10-year periods, as well as over the lifetime of the fund since April 30, 1998, but below the benchmarks for the three- and five-year periods.
| 194 | American Funds Insurance Series |
Growth Fund seeks to provide growth of capital by investing primarily in common stocks of companies that appear to offer superior opportunities for growth of capital. The board and the committee reviewed the fund’s investment results measured against (i) the Lipper Capital Appreciation Funds Average, (ii) Lipper Growth Funds Average (the Lipper category that includes the fund) and (iii) Standard & Poor’s 500 Composite Index. They noted that the fund’s investment results were higher than all three benchmarks over the one-year and 10-year periods, and over the lifetime of the fund since February 8, 1984, and were mixed over three-year, five-year and six-month periods.
International Fund seeks to provide long-term growth of capital by investing primarily in common stocks of companies domiciled outside the United States. The board and the committee reviewed the fund’s investment results measured against (i) the Lipper International Funds Average (the Lipper category that includes the fund) and (ii) MSCI All Country World Index ex USA. They noted that the fund’s investment results were higher than both benchmarks over the one-, three- and 10-year periods, and over the lifetime of the fund since May 1, 1990, mixed over the five-year period, and lower than the benchmarks over the six-month period.
New World Fund seeks long-term capital appreciation by investing primarily in stocks of companies with significant exposure to countries with developing economies and/or markets. The board and the committee reviewed the fund’s investment results measured against (i) the Lipper Emerging Markets Funds Average (the Lipper category that includes the fund) and (ii) MSCI All Country World Index. They noted that the fund’s investment results were higher than the benchmarks over the 10-year period and lifetime of the fund since June 17, 1999, mixed for the one-, three- and five-year periods, and lower than the benchmarks over the six-month period.
Blue Chip Income and Growth Fund seeks to produce income exceeding the average yield on U.S. stocks generally and to provide an opportunity for growth of principal by investing primarily in dividend-paying common stocks of larger, more established companies domiciled in the United States, with market capitalizations of $4 billion and above. The board and the committee reviewed the fund’s investment results measured against (i) the Lipper Growth & Income Funds Average (the Lipper category that includes the fund) and (ii) Standard & Poor’s 500 Composite Index. They noted that the fund’s investment results were higher than both benchmarks over the six-month and one-year periods. Over the three-, five- and 10-year periods, the results of the fund were higher than the Lipper average but lower than the S&P 500. Results were lower than both benchmarks over the lifetime of the fund since July 5, 2001.
Global Growth and Income Fund seeks to provide long-term growth of capital while providing current income by investing primarily in well-established companies located around the world. The board and the committee reviewed the fund’s investment results measured against (i) the Lipper Global Funds Average (the Lipper category that includes the fund) and (ii) MSCI All Country World Index. They noted that the fund’s investment results were higher than the Lipper average and MSCI index over the six-month, three-and five-year periods, and over the lifetime of the fund since May 1, 2006, and were lower than both indexes for the one-year period.
Growth-Income Fund seeks to provide long-term growth of capital and income by investing primarily in common stocks or other securities that demonstrate the potential for appreciation and/or dividends. The board and the committee reviewed the fund’s investment results measured against (i) the Lipper Growth & Income Funds Average (the Lipper category that includes the fund) and (ii) Standard & Poor’s 500 Composite Index. They noted that the fund’s investment results were higher than both benchmarks over the one- and three-year periods, and over the lifetime of the fund since February 8, 1984, and were mixed for the six-month, five-year and 10-year periods.
| American Funds Insurance Series | 195 |
International Growth and Income Fund seeks to provide long-term growth of capital while providing current income by investing primarily in stocks of larger, well-established companies domiciled outside the United States, including in developing countries. The board and the committee reviewed the fund’s investment results measured against (i) the Lipper International Funds Average (the Lipper category that includes the fund) and (ii) MSCI All Country World Index ex USA. They noted that the fund’s investment results were above both benchmarks over the three- and five-year periods, as well as over the lifetime of the fund since November 18, 2008, but were lower than both benchmarks over the one-year period and mixed for the six-month period.
Capital Income Builder seeks to provide a level of current income that exceeds the average yield on U.S. stocks generally and to provide a growing stream of income over the years. The board and the committee reviewed the fund’s investment results measured against (i) the Lipper Income Funds Average (the Lipper category that includes the fund) and (ii) Standard and Poor’s 500 Composite Index. They noted that the fund’s investment results were above the Lipper average, but below the S&P 500 over the short lifetime of the fund since May 1, 2014.
Asset Allocation Fund seeks to provide high total return (including income and capital gains) consistent with preservation of capital over the long term by investing in a diversified portfolio of stocks and other equity securities, bonds and other intermediate and long-term debt securities, and money market instruments (debt securities maturing in one year or less). The board and the committee reviewed the fund’s investment results measured against (i) the Lipper Balanced Funds Average (the Lipper category that includes the fund), (ii) Barclays U.S. Aggregate Index, (iii) Standard and Poor’s 500 Composite Index and (iv) a customized index composed of the S&P 500 (60%) and Barclays index (40%). They noted that the fund’s investment results were above all the benchmarks for the 10-year period. For the three- and five-year periods and lifetime of the fund since August 1, 1989, the fund’s results were above all comparisons except the S&P 500. For the one-year period, the fund’s results were above the Lipper average and Barclays index, but below the S&P 500 and 60/40 index, and for the six-month period the fund’s results were above the Barclays index but below the Lipper average, S&P 500 and 60/40 index.
Global Balanced Fund seeks the balanced accomplishment of three objectives: long-term growth of capital, conservation of principal and current income by investing in equity and debt securities of companies around the world that offer the opportunity for growth and/or provide dividend income, while also constructing its portfolio to protect principal and limit volatility. The board and the committee reviewed the fund’s investment results measured against (i) the Lipper Global Flexible Portfolio Funds Average (the Lipper category that includes the fund), (ii) Barclays Global Aggregate Bond Index, (iii) MSCI All Country World Index and (iv) a customized index composed of the MSCI index (60%) and Barclays index (40%). They noted that the fund’s investment results were above all benchmarks for the three-year period and over the lifetime of the fund since May 2, 2011, except for the MSCI index, but mixed for the one-year period, and below the benchmarks for the six-month period.
Bond Fund seeks to maximize current income and preserve capital by investing primarily in bonds. The board and the committee reviewed the fund’s investment results measured against (i) the Lipper Core Bond Funds Average (the Lipper category that includes the fund) and (ii) Barclays U.S. Aggregate Index. They noted that the fund’s investment results were above both benchmarks for the six-month period, and mixed over the one-, three- and five-year periods compared to the benchmark indexes. They also noted that the fund’s investment results were below the Lipper average and Barclays index over the 10-year period and the lifetime of the fund since January 2, 1996.
Global Bond Fund seeks to provide a high level of total return by investing primarily in debt securities of governmental, supranational and corporate issuers domiciled in various countries and dominated in various currencies, including U.S. dollars. The board and the committee reviewed the fund’s investment results measured against (i) the Lipper Global Income Funds Average (the Lipper category that includes the fund) and (ii) Barclays Global Aggregate Bond Index. They noted that the fund’s results were higher than both benchmarks for the six-month and one-year periods as well as over the life of the fund since October 4, 2006. They also noted that the fund’s investment results were mixed for the three- and five-year periods.
| 196 | American Funds Insurance Series |
High-Income Bond Fund seeks to provide a high level of current income and, secondarily, capital appreciation by investing primarily in higher yielding and generally lower quality debt securities. The board and the committee reviewed the fund’s investment results measured against (i) the Lipper High Yield Funds Average (the Lipper category that includes the fund) and (ii) Barclays U.S. Corporate High Yield 2% Issuer Capped Index. They noted that the fund’s investment results were higher than the Lipper average over the lifetime of the fund since February 8, 1984. They also noted that the fund’s investment results were lower than both benchmarks over the six-month, one-, three-, five- and 10-year periods.
Mortgage Fund seeks to provide current income and preservation of capital by investing in mortgage-related securities, including securities collateralized by mortgage loans and contracts for future delivery of such securities. The board and the committee reviewed the fund’s investment results measured against (i) the Lipper GNMA Funds Average, (ii) Lipper U.S. Mortgage Funds Average (the Lipper category that includes the fund) and (iii) Barclays U.S. Mortgage Backed Securities Index. They noted that the fund’s results were above all the benchmarks over the six-month period. They also noted that the fund’s investment results were higher than those of the three benchmarks for the one- and three-year periods and lifetime of the fund since May 2, 2011.
U.S. Government/AAA-Rated Securities Fund seeks to provide a high level of current income consistent with preservation of capital. The board and the committee reviewed the fund’s investment results measured against (i) the Lipper General U.S. Government Funds Average (the Lipper category that includes the fund) and (ii) Barclays U.S. Government/Mortgage-Backed Securities Index. They noted that the fund’s results were higher than both benchmarks for the six-month, one-, three- and five-year periods, and mixed for the 10-year period as well as over the lifetime of the fund since December 2, 1985.
Cash Management Fund seeks to provide a way to earn income on your cash reserves while preserving capital and maintaining liquidity. The board and the committee reviewed the fund’s investment results measured against the Lipper Money Market Funds Average (the Lipper category that includes the fund). They noted that the fund’s investment results were higher than the Lipper average over the 10-year period, but lower than the average over the six-month and one-, three- and five-year periods and the lifetime of the fund since February 8, 1984.
The board and the committee concluded that each fund’s investment results have been satisfactory, and that CRMC’s record in managing the funds indicated that its continued management should benefit each fund and its shareholders.
| American Funds Insurance Series | 197 |
3. Advisory fees and total expenses
The board and the committee compared the advisory fees and total expense levels of each fund to those of other relevant funds. They observed that the expenses of each fund except Cash Management Fund were less than the median fees and expenses of the other funds included in its Lipper category described above. They also observed that each fund’s advisory fees were at or less than the median fees of the other funds included in its Lipper category, except Cash Management Fund, which was 20% above the median. They also noted that Cash Management Fund is not a stable net asset value fund, and that unlike many other money market funds, CRMC does not otherwise waive any fees.
The board and the committee also considered the breakpoint discounts in each fund’s advisory fee structure that reduce the level of fees charged by CRMC to the fund as fund assets increase. In addition, they reviewed information regarding advisory fees charged to clients of an affiliate of CRMC. They noted that, to the extent there were differences between the advisory fees paid by each fund and the advisory fees paid by those clients, the differences appropriately reflected the investment, operational and regulatory differences between advising the fund and the other clients. The board and the committee concluded that each fund’s cost structure was fair and reasonable in relation to the services provided, and that each fund’s shareholders receive reasonable value in return for the advisory fees and other amounts paid to CRMC by the funds.
4. Ancillary benefits
The board and the committee considered a variety of other benefits that CRMC and its affiliates receive as a result of CRMC’s relationship with the series and the other American Funds, including fees for administrative services provided to certain share classes; fees paid to CRMC’s affiliated transfer agent; sales charges and distribution fees received and retained by the series’ principal underwriter, an affiliate of CRMC; and possible ancillary benefits to CRMC and its institutional management affiliates in managing other investment accounts. The board and the committee reviewed CRMC’s portfolio trading practices, noting that while CRMC received the benefit of research provided by broker-dealers executing portfolio transactions on behalf of each fund, it did not obtain third-party research or other services in return for allocating brokerage to such broker-dealers. The board and the committee took these ancillary benefits into account in evaluating the reasonableness of the advisory fees and other amounts paid to CRMC by each fund.
5. Adviser financial information
The board and the committee reviewed information regarding CRMC’s costs of providing services to the American Funds, including personnel, systems and resources of investment, compliance, trading, accounting and other administrative operations. They considered CRMC’s costs and willingness to invest in technology, infrastructure and staff to maintain and expand services and capabilities, respond to industry and regulatory developments, and attract and retain qualified personnel. They noted information regarding the compensation structure for CRMC’s investment professionals. The board and the committee also compared CRMC’s profitability and compensation data to the reported results and data of several large, publicly held investment management companies. The board and the committee noted the competitiveness and cyclicality of both the mutual fund industry and the capital markets, and the importance in that environment of CRMC’s long-term profitability for maintaining its independence, company culture and management continuity. The board and the committee concluded that each fund’s advisory fee structure reflected a reasonable sharing of benefits between CRMC and each fund’s shareholders.
| 198 | American Funds Insurance Series |
Approval of Investment Advisory and Service Agreement – American Funds Insurance Series Managed Risk Funds
The American Funds Insurance Series’ board has approved the renewal of the series’ Investment Advisory and Service Agreement (the “advisory agreement”) with Capital Research and Management Company (“CRMC”) through January 31, 2016. The board has also approved the series’ Subadvisory Agreement (the “subadvisory agreement”) with CRMC and Milliman Financial Risk Management LLC (“Milliman FRM”) for the same term. The advisory and subadvisory agreements are jointly referred to below as the “agreements.” The board approved the agreements following the recommendation of the series’ Contracts Committee (the “committee”), which is composed of all of the series’ independent board members. The board and the committee determined that each fund’s advisory fee structure was fair and reasonable in relation to the services provided, and that approving the agreements was in the best interests of each fund and its shareholders.
In reaching this decision, the board and the committee took into account information furnished to them throughout the year and otherwise provided to them, as well as information prepared specifically in connection with their review of the agreements, and were advised by their independent counsel. They considered the factors discussed below, among others, but did not identify any single issue or particular piece of information that, in isolation, was the controlling factor, and each board and committee member did not necessarily attribute the same weight to each factor.
1. Nature, extent and quality of services
The board and the committee considered the depth and quality of CRMC’s investment management process, including its global research capabilities; the experience, capability and integrity of its senior management and other personnel; the low turnover rates of its key personnel; the overall financial strength and stability of its organization; and the ongoing evolution of CRMC’s organizational structure designed to maintain and strengthen these qualities. The board and the committee also considered the nature, extent and quality of the oversight of Milliman FRM’s services that would be provided by CRMC, the administrative and compliance and shareholder services that would be provided by CRMC to the funds under the agreements and other agreements, as well as the benefits to each fund’s shareholders from investing in a fund that is part of a large family of funds. The board and the committee concluded that the nature, extent and quality of the services provided by CRMC have benefited and should continue to benefit each fund and its shareholders.
The board also considered the depth and quality of Milliman FRM’s investment management process, including its experience in applying the Milliman Managed Risk Strategy and risk management services for other clients; the experience, capability and integrity of its senior management and other personnel; and the services that would be provided to each fund under the subadvisory agreement. The board concluded that the nature, extent and quality of the services to be provided by Milliman FRM have benefited and should continue to benefit each fund and its shareholders.
2. Investment results
The board and the committee considered the investment results of each fund in light of its objectives. In addition to the factors considered below, they compared each fund’s investment results and volatility with those of other funds with similar objectives and strategies, and a composite index which is based on a combination of Standard & Poor’s 500 Composite Index, Barclays U.S. Aggregate Index, as applicable, and a money market index, over various periods through June 30, 2014. This report, including the letter to shareholders and related disclosures, contains certain information about each fund’s investment results.
Managed Risk Growth Fund seeks to provide growth of capital while seeking to manage volatility and provide downside protection. The board and the committee reviewed the fund’s investment results measured against the investment results of (i) the Lipper Growth Funds Average (the Lipper category that includes the fund) and (ii) Standard & Poor’s 500 Composite Index. They noted that the fund’s investment results were substantially below the Lipper average and S&P 500 index for the one-year, six-month and since-inception periods. In addition, they noted that the total return of the fund since its inception on May 1, 2013, was above that of a composite index composed of the S&P 500 (70%) and a mix of money market securities (30%).
| American Funds Insurance Series | 199 |
Managed Risk International Fund seeks to provide long-term growth of capital while seeking to manage volatility and provide downside protection. The board and the committee reviewed the fund’s investment results measured against the investment results of (i) the Lipper International Funds Average (the Lipper category that includes the fund) and (ii) MSCI All Country World Index ex USA. They noted that the fund’s investment results were below the Lipper average and MSCI index for the one-year, six-month and since-inception periods. In addition, they noted that the total return of the fund since its inception on May 1, 2013, was above that of a composite index composed of the MSCI index (70%) and a mix of money market securities (30%).
Managed Risk Blue Chip Income and Growth Fund seeks to produce income exceeding the average yield on U.S. stocks generally and to provide an opportunity for growth of principal consistent with sound common stock investing, in each case while seeking to manage volatility and provide downside protection. The board and the committee reviewed the fund’s investment results measured against the investment results of (i) the Lipper Growth & Income Funds Average (the Lipper category that includes the fund) and (ii) Standard & Poor’s 500 Composite Index. They noted that the fund’s investment results were mixed for the six-month period, and below both benchmarks for the inception-to-date period. In addition, they noted that the total return of the fund since its inception on May 1, 2013, was above that of a composite index composed of the S&P 500 (70%) and a mix of money market securities (30%).
Managed Risk Growth-Income Fund seeks to achieve long-term growth of capital and income while seeking to manage volatility and provide downside protection. The board and the committee reviewed the fund’s investment results measured against the investment results of (i) the Lipper Growth & Income Funds Average (the Lipper category that includes the fund) and (ii) Standard & Poor’s 500 Composite Index. They noted that the fund’s investment results were above the Lipper average for the one-year and inception-to-date periods, and below both benchmarks for the six-month period. In addition, they noted that the total return of the fund since its inception on May 1, 2013, was above that of a composite index composed of the S&P 500 (70%) and a mix of money market securities (30%).
Managed Risk Asset Allocation Fund seeks to provide high total return (including income and capital gains) consistent with preservation of capital over the long term while seeking to manage volatility and provide downside protection. The board and the committee reviewed the fund’s investment results measured against the investment results of (i) the Lipper Balanced Funds Average (the Lipper category that includes the fund), (ii) Barclays U.S. Aggregate Index and (iii) Standard & Poor’s 500 Composite Index. They noted that the fund’s investment results were mixed for the one-year and since-inception periods, and below the benchmarks for the six-month period. In addition, they noted that the total return of the fund since its inception on October 1, 2012, was above that of a composite index composed of the S&P 500 (60%), Barclays index (30%) and a mix of money market securities (30%).
The board and the committee reviewed each fund’s standard deviation (a measure of volatility) of investment results based on monthly returns from the fund’s inception through June 30, 2014, with the volatility for that period of the composite index and of a group of funds with volatility management strategies identified by management. They noted that each fund’s volatility for the period was greater than that of the composite index and most of the selected funds. The board and committee also noted, however, that for those periods the equity markets did not encounter large sustained market declines of the type that Milliman FRM’s volatility management program was designed to protect against. The board and the committee concluded that, in view of the funds’ short history, each fund’s investment results and the results of the services provided by Milliman FRM have been satisfactory, and that CRMC’s and Milliman FRM’s record in managing the funds indicated that their continued management should benefit each fund and its shareholders.
| 200 | American Funds Insurance Series |
3. Advisory fees and total expenses
The board and the committee compared the advisory fees and total expense levels of each fund to those of other relevant funds. The board noted CRMC’s waiver of a portion of the advisory fee payable by each fund under the advisory agreement, CRMC’s commitment not to remove the waiver without board approval and CRMC’s agreement to pay the fees due Milliman FRM under the subadvisory agreement. They observed that each fund’s total advisory fees and expenses were at or near the median of the other funds in its Lipper category.
The board and the committee also considered the breakpoint discounts in each underlying fund’s advisory fee structure that reduce the level of fees charged by CRMC to the underlying fund as its assets increase. In addition, they reviewed information regarding advisory fees paid by clients of an affiliate of CRMC. They noted that, to the extent there were differences between the advisory fee schedule for the funds and the advisory fees paid by those clients, the differences appropriately reflected the investment, operational and regulatory differences between advising the funds and the other clients. The board and the committee concluded that each fund’s cost structure was fair and reasonable in relation to the services that CRMC provided, directly and through Milliman FRM, and that each fund’s shareholders receive reasonable value in return for the advisory fees and other amounts paid to CRMC by the funds.
4. Ancillary benefits
The board and the committee considered a variety of other benefits that CRMC and its affiliates receive as a result of CRMC’s relationship with the series and the other American Funds, including fees for administrative services provided to certain share classes; fees paid to CRMC’s affiliated transfer agent; sales charges and distribution fees received and retained by the series’ principal underwriter, an affiliate of CRMC; and possible ancillary benefits to CRMC and its institutional management affiliates in managing other investment accounts. The board and the committee reviewed CRMC’s portfolio trading practices, noting that while CRMC received the benefit of research provided by broker-dealers executing portfolio transactions on behalf of each fund, it did not obtain third-party research or other services in return for allocating brokerage to such broker-dealers. The board and the committee took these ancillary benefits into account in evaluating the reasonableness of the advisory fees and other amounts paid to CRMC by each fund.
5. Adviser financial information
The board and the committee reviewed information regarding CRMC’s costs of providing services to the American Funds, including personnel, systems and resources of investment, compliance, trading, accounting and other administrative operations. They considered CRMC’s costs and willingness to invest in technology, infrastructure and staff to maintain and expand services and capabilities, respond to industry and regulatory developments, and attract and retain qualified personnel. They noted information regarding the compensation structure for CRMC’s investment professionals. The board and the committee also compared CRMC’s profitability and compensation data to the reported results and data of several large, publicly held investment management companies. The board and the committee noted the competitiveness and cyclicality of both the mutual fund industry and the capital markets, and the importance in that environment of CRMC’s long-term profitability for maintaining its independence, company culture and management continuity. The board and the committee concluded that each fund’s advisory fee structure reflected a reasonable sharing of benefits between CRMC and each fund’s shareholders.
| American Funds Insurance Series | 201 |
Board of trustees and other officers
Independent trustees1
| Year first | Number of | |||||||
| elected | portfolios in fund | |||||||
| a trustee | complex overseen | Other directorships3 | ||||||
| Name and year of birth | of the series2 | Principal occupation(s) during past five years | by trustee | held by trustee | ||||
| William H. Baribault, 1945 | 2009 | CEO and President, Richard Nixon Foundation; former Chairman of the Board and CEO, Oakwood Enterprises (private investment and consulting) | 72 | None | ||||
| James G. Ellis, 1947 | 2010 | Dean and Professor of Marketing, Marshall School of Business, University of Southern California | 72 | Mercury General Corp. | ||||
| Leonard R. Fuller, 1946 | 1999 | President and CEO, Fuller Consulting (financial management consulting firm) | 72 | None | ||||
| R. Clark Hooper, 1946 Chairman of the Board (Independent and Non-Executive) | 2010 | Private investor | 74 | The Swiss Helvetia Fund, Inc. | ||||
| Merit E. Janow, 1958 | 2007 | Dean and Professor, Columbia University, School of International and Public Affairs | 71 | MasterCard Incorporated; The NASDAQ Stock Market LLC; Trimble Navigation Limited | ||||
| Laurel B. Mitchell, PhD, 1955 | 2010 | Distinguished Professor of Accounting, University of Redlands | 68 | None | ||||
| Frank M. Sanchez, 1943 | 2010 | Principal, The Sanchez Family Corporation dba McDonald’s Restaurants (McDonald’s licensee) | 68 | None | ||||
| Margaret Spellings, 1957 | 2010 | President, George W. Bush Foundation; former President and CEO, Margaret Spellings & Company (public policy and strategic consulting); former President, U.S. Chamber Foundation and Senior Advisor to the President and CEO, U.S. Chamber of Commerce | 72 | None | ||||
| Steadman Upham, PhD, 1949 | 2010 | President and University Professor, The University of Tulsa | 71 | None |
| 202 | American Funds Insurance Series |
Interested trustee4,5
| Name, year of birth and position with series | Year first elected a trustee or officer of the series2 | Principal occupation(s) during past five years and positions held with affiliated entities or the principal underwriter of the series | Number of portfolios in fund complex overseen by trustee | Other directorships3 held by trustee | ||||
| Donald D. O’Neal, 1960 Vice Chairman of the Board | 1998 | Partner — Capital Research Global Investors, Capital Research and Management Company; Director, Capital Research and Management Company | 26 | None |
The series statement of additional information includes further details about the series trustees and is available without charge upon request by calling American Funds Service Company at (800) 421-4225 or by visiting the American Funds website at americanfunds.com. The address for all trustees and officers of the series is 333 South Hope Street, Los Angeles, CA 90071, Attention: Secretary.
See next page for footnotes.
| American Funds Insurance Series | 203 |
Other officers5
| Name, year of birth and position with series | Year first elected an officer of the series2 | Principal occupation(s) during past five years and positions held with affiliated entities or the principal underwriter of the series | ||
| Alan N. Berro, 1960 President | 1998 | Partner — Capital World Investors, Capital Research and Management Company | ||
| Michael J. Downer, 1955 Executive Vice President | 1991 | Director, Senior Vice President and Secretary, Capital Research and Management Company; Director, American Funds Distributors, Inc.;6 Chairman of the Board, Capital Bank and Trust Company6 | ||
| Abner D. Goldstine, 1929 Senior Vice President | 1993 | Partner — Capital Fixed Income Investors, Capital Research and Management Company | ||
| John H. Smet, 1956 Senior Vice President | 1994 | Partner — Capital Fixed Income Investors, Capital Research and Management Company; Director, Capital Research and Management Company | ||
| Carl M. Kawaja, 1964 Vice President | 2008 | Partner — Capital World Investors, Capital Research and Management Company; Director, Capital Research and Management Company; Chairman of the Board, Capital International Asset Management (Canada), Inc.6 | ||
| Sung Lee, 1966 Vice President | 2008 | Partner — Capital Research Global Investors, Capital International, Inc.6 | ||
| Maria T. Manotok, 1974 Vice President | 2012 | Vice President and Senior Counsel — Fund Business Management Group, Capital Research and Management Company | ||
| S. Keiko McKibben, 1969 Vice President | 2010 | Partner — Capital Research Global Investors, Capital Research and Management Company | ||
| Renaud H. Samyn, 1974 Vice President | 2010 | Partner — Capital Research Global Investors, Capital International, Inc.6 | ||
| Dylan Yolles, 1969 Vice President | 2012 | Partner — Capital International Investors, Capital Research and Management Company | ||
| Steven I. Koszalka, 1964 Secretary | 2003 | Vice President — Fund Business Management Group, Capital Research and Management Company | ||
| Gregory F. Niland, 1971 Treasurer | 2008 | Vice President — Investment Operations, Capital Research and Management Company | ||
| Susan K. Countess, 1966 Assistant Secretary | 2014 | Fund Boards Coordinator — Fund Business Management Group, Capital Research and Management Company | ||
| Karl C. Grauman, 1968 Assistant Treasurer | 2006 | Vice President — Investment Operations, Capital Research and Management Company | ||
| Dori Laskin, 1951 Assistant Treasurer | 2010 | Vice President — Investment Operations, Capital Research and Management Company |
| 1 | The term independent trustee refers to a trustee who is not an “interested person” of the series within the meaning of the Investment Company Act of 1940. |
| 2 | Trustees and officers of the series serve until their resignation, removal or retirement. |
| 3 | This includes all directorships/trusteeships (other than those in the American Funds or other funds managed by Capital Research and Management Company or its affiliates) that are held by each trustee as a trustee or director of a public company or a registered investment company. |
| 4 | The term interested trustee refers to a trustee who is an “interested person” within the meaning of the Investment Company Act of 1940, on the basis of their affiliation with the series’ investment adviser, Capital Research and Management Company, or affiliated entities (including the series’ principal underwriter). |
| 5 | All of the directors/trustees and/or officers listed, with the exception of Abner D. Goldstine, S. Keiko McKibben, Renaud H. Samyn and DylanYolles, are officers and/or directors/trustees of one or more of the other funds for which Capital Research and Management Company serves as investment adviser. |
| 6 | Company affiliated with Capital Research and Management Company. |
| 204 | American Funds Insurance Series |
This page intentionally left blank.
| American Funds Insurance Series | 205 |
This page intentionally left blank.
| 206 | American Funds Insurance Series |
This page intentionally left blank.
| American Funds Insurance Series | 207 |
This page intentionally left blank.
| 208 | American Funds Insurance Series |
Offices of the series and of the investment adviser
Capital Research and
Management Company
333 South Hope Street
Los Angeles, CA 90071-1406
6455 Irvine Center Drive
Irvine, CA 92618-4518
Investment subadviser
Milliman Financial Risk Management LLC
(Managed Risk Funds only)
71 South Wacker Drive, 31st Floor
Chicago, IL 60606
Custodians of assets
State Street Bank and Trust Company
One Lincoln Street
Boston, MA 02111
Bank of New York Mellon
(Managed Risk Funds only)
One Wall Street
New York, NY 10286
Counsel
Morgan, Lewis & Bockius LLP
355 South Grand Avenue, Suite 4400
Los Angeles, CA 90071-3106
Independent registered public accounting firm
PricewaterhouseCoopers LLP
601 South Figueroa Street
Los Angeles, CA 90017-3874
Investors should carefully consider investment objectives, risks, charges and expenses. This and other important information is contained in the series prospectuses and summary prospectuses, which can be obtained from your financial professional and should be read carefully before investing. You may also call American Funds Service Company (AFS) at (800) 421-4225 or visit the American Funds website at americanfunds.com.
“American Funds Proxy Voting Procedures and Principles” — which describes how we vote proxies relating to portfolio securities — is available on the American Funds website or upon request by calling AFS. The series files its proxy voting record with the U.S. Securities and Exchange Commission (SEC) for the 12 months ended June 30 by August 31. The proxy voting record is available free of charge on the SEC website at sec.gov and on the American Funds website.
Complete December 31, 2014, portfolios of American Funds Insurance Series’ investments are available free of charge by calling AFS or visiting the SEC website (where they are part of Form N-CSR).
American Funds Insurance Series files a complete list of its portfolio holdings with the SEC for the first and third quarters of each fiscal year on Form N-Q. This filing is available free of charge on the SEC website. You may also review or, for a fee, copy this filing at the SEC’s Public Reference Room in Washington, D.C. Additional information regarding the operation of the Public Reference Room may be obtained by calling the SEC’s Office of Investor Education and Advocacy at (800) SEC-0330. Additionally, the list of portfolio holdings is available by calling AFS.
This report is for the information of American Funds Insurance Series investors, but it also may be used as sales literature when preceded or accompanied by the current prospectuses or summary prospectuses for American Funds Insurance Series and the prospectus for the applicable insurance contract, which give details about charges, expenses, investment objectives and operating policies of the series. If used as sales material after March 31, 2015, this report must be accompanied by a statistical update for the most recently completed calendar quarter.
| Printed on paper containing 10% post-consumer waste | Printed with inks containing soy and/or vegetable oil |
The American Funds Advantage
Since 1931, American Funds, part of Capital Group, has helped investors pursue long-term investment success. Our consistent approach — in combination with The Capital SystemSM — has resulted in a superior long-term track record for American Funds Insurance Series®.
| Aligned with investor success | |
| We base our decisions on a long-term perspective, which we believe aligns our goals with the interests of our clients. American Funds Insurance Series (AFIS) portfolio managers average 26 years of investment experience, including 23 years at our company, reflecting a career commitment to our long-term approach.1 | |
| The Capital SystemSM | |
| Our investment process, The Capital System, combines individual accountability with teamwork. Each fund is divided into portions that are managed independently by investment professionals with diverse backgrounds, ages and investment approaches. An extensive global research effort is the backbone of The Capital System. | |
| Superior long-term track record | |
| Our AFIS equity funds have beaten their comparable Lipper indexes in 90% of 10-year periods and 100% of 20-year periods. Our AFIS fixed-income funds have beaten comparable Lipper indexes in 58% of 10-year periods and 86% of 20-year periods.2 We strive to keep management fees competitive. Over the past 20 years, most funds’ fees have been below industry averages.3 |
| 1 | Portfolio manager experience as of November 2014. | |
| 2 | Based on Class 2 share results for rolling periods through December 31, 2014. Periods covered are the shorter of the fund’s lifetime or since the inception date of the comparable Lipper index (except Global Small Capitalization Fund, for which the Lipper average was used). The comparable Lipper indexes are: Global Funds Index (Global Growth Fund), Growth Funds Index (Growth Fund), International Funds Index (International Fund), Emerging Markets Funds Index (New World Fund), Growth & Income Funds Index (Blue Chip Income and Growth Fund, Growth-Income Fund), Flexible Portfolio Funds Index (Asset Allocation Fund), Core Bond Funds Index (Bond Fund), High Yield Funds Index (High-Income Bond Fund) and Lipper General U.S. Government Funds Index (U.S. Government/ AAA-Rated Securities Fund). | |
| 3 | Based on management fees for the 20-year period ended December 31, 2014, versus comparable Lipper categories, excluding funds of funds. |
Lit. No. INGEARX-998-0215P Litho in USA RCG/Q/8074-S42827
ITEM 2 – Code of Ethics
The Registrant has adopted a Code of Ethics that applies to its Principal Executive Officer and Principal Financial Officer. The Registrant undertakes to provide to any person without charge, upon request, a copy of the Code of Ethics. Such request can be made to American Funds Service Company at 800/421-9225 or to the Secretary of the Registrant, 333 South Hope Street, Los Angeles, California 90071.
ITEM 3 – Audit Committee Financial Expert
The Registrant’s board has determined that Laurel B. Mitchell, a member of the Registrant’s audit committee, is an “audit committee financial expert” and "independent," as such terms are defined in this Item. This designation will not increase the designee’s duties, obligations or liability as compared to his or her duties, obligations and liability as a member of the audit committee and of the board, nor will it reduce the responsibility of the other audit committee members. There may be other individuals who, through education or experience, would qualify as "audit committee financial experts" if the board had designated them as such. Most importantly, the board believes each member of the audit committee contributes significantly to the effective oversight of the Registrant’s financial statements and condition.
ITEM 4 – Principal Accountant Fees and Services
| Registrant: | ||||
| a) Audit Fees: | ||||
| 2013 | $543,000 | |||
| 2014 | $611,000 | |||
| b) Audit-Related Fees: | ||||
| 2013 | None | |||
| 2014 | None | |||
| c) Tax Fees: | ||||
| 2013 | $117,000 | |||
| 2014 | $115,000 | |||
| The tax fees consist of professional services relating to the preparation of the Registrant’s tax returns. | ||||
| d) All Other Fees: | ||||
| 2013 | None | |||
| 2014 | None | |||
| Adviser and affiliates (includes only fees for non-audit services billed to the adviser and affiliates for engagements that relate directly to the operations and financial reporting of the Registrant and were subject to the pre-approval policies described below): | ||||
| a) Audit Fees: | ||||
| Not Applicable | ||||
| b) Audit-Related Fees: | ||||
| 2013 | None | |||
| 2014 | None | |||
| c) Tax Fees: | ||||
| 2013 | $31,000 | |||
| 2014 | $44,000 | |||
| The tax fees consist of consulting services relating to the Registrant’s investments. | ||||
| d) All Other Fees: | ||||
| 2013 | $2,000 | |||
| 2014 | $2,000 | |||
| The other fees consist of subscription services related to an accounting research tool. | ||||
All audit and permissible non-audit services that the Registrant’s audit committee considers compatible with maintaining the independent registered public accounting firm’s independence are required to be pre-approved by the committee. The pre-approval requirement will extend to all non-audit services provided to the Registrant, the investment adviser, and any entity controlling, controlled by, or under common control with the investment adviser that provides ongoing services to the Registrant, if the engagement relates directly to the operations and financial reporting of the Registrant. The committee will not delegate its responsibility to pre-approve these services to the investment adviser. The committee may delegate to one or more committee members the authority to review and pre-approve audit and permissible non-audit services. Actions taken under any such delegation will be reported to the full committee at its next meeting. The pre-approval requirement is waived with respect to non-audit services if certain conditions are met. The pre-approval requirement was not waived for any of the non-audit services listed above provided to the Registrant, adviser and affiliates.
Aggregate non-audit fees paid to the Registrant’s auditors, including fees for all services billed to the Registrant, adviser and affiliates that provide ongoing services to the Registrant, were $150,000 for fiscal year 2013 and $161,000 for fiscal year 2014. The non-audit services represented by these amounts were brought to the attention of the committee and considered to be compatible with maintaining the auditors’ independence.
ITEM 5 – Audit Committee of Listed Registrants
Not applicable to this Registrant, insofar as the Registrant is not a listed issuer as defined in Rule 10A-3 under the Securities Exchange Act of 1934.
ITEM 6 – Schedule of Investments

| Common stocks 94.45% Health care 19.43% | Shares | Value (000) |
| Vertex Pharmaceuticals Inc.1 | 1,693,000 | $201,128 |
| Novo Nordisk A/S, Class B2 | 4,401,000 | 186,213 |
| Regeneron Pharmaceuticals, Inc.1 | 314,600 | 129,065 |
| UnitedHealth Group Inc. | 960,000 | 97,046 |
| Merck & Co., Inc. | 1,544,000 | 87,684 |
| Express Scripts Holding Co.1 | 770,000 | 65,196 |
| Bristol-Myers Squibb Co. | 929,600 | 54,874 |
| Novartis AG2 | 580,000 | 53,341 |
| Bayer AG2 | 349,300 | 47,753 |
| Hologic, Inc.1 | 1,613,000 | 43,132 |
| Roche Holding AG2 | 110,000 | 29,814 |
| Grifols, SA, Class B (ADR) | 708,000 | 24,065 |
| UCB SA2 | 210,374 | 15,965 |
| Edwards Lifesciences Corp.1 | 94,000 | 11,974 |
| DaVita HealthCare Partners Inc.1 | 144,000 | 10,907 |
| Merck KGaA2 | 99,358 | 9,426 |
| Boston Scientific Corp.1 | 550,000 | 7,287 |
| Gilead Sciences, Inc.1 | 75,000 | 7,070 |
| 1,081,940 | ||
| Information technology 18.67% | ||
| ASML Holding NV (New York registered) | 647,176 | 69,785 |
| ASML Holding NV2 | 624,897 | 66,949 |
| Taiwan Semiconductor Manufacturing Co. Ltd.2 | 23,380,000 | 103,170 |
| Taiwan Semiconductor Manufacturing Co. Ltd. (ADR) | 480,000 | 10,742 |
| Google Inc., Class A1 | 107,700 | 57,152 |
| Google Inc., Class C1 | 107,700 | 56,693 |
| Alcatel-Lucent1,2 | 22,539,144 | 80,018 |
| Visa Inc., Class A | 263,300 | 69,037 |
| Microsoft Corp. | 1,202,000 | 55,833 |
| Nintendo Co., Ltd.2 | 535,000 | 55,758 |
| Alibaba Group Holding Ltd. (ADR)1 | 476,150 | 49,491 |
| ASM Pacific Technology Ltd.2 | 3,900,000 | 37,077 |
| Wirecard AG2 | 825,662 | 36,420 |
| Avago Technologies Ltd. | 310,000 | 31,183 |
| Murata Manufacturing Co., Ltd.2 | 285,000 | 31,132 |
| LinkedIn Corp., Class A1 | 130,000 | 29,862 |
| Tencent Holdings Ltd.2 | 1,800,000 | 25,827 |
| salesforce.com, inc.1 | 425,000 | 25,207 |
| MercadoLibre, Inc. | 180,000 | 22,981 |
| TE Connectivity Ltd. | 347,500 | 21,979 |
| Naver Corp.2 | 28,500 | 18,412 |
| Infosys Ltd.2 | 540,000 | 16,795 |
| AAC Technologies Holdings Inc.2 | 2,960,000 | 15,730 |
| VeriSign, Inc.1 | 240,000 | 13,680 |
| TDK Corp.2 | 167,000 | 9,840 |
| Infineon Technologies AG2 | 880,000 | 9,434 |
| Common stocks Information technology (continued) | Shares | Value (000) |
| Rackspace Hosting, Inc.1 | 196,900 | $9,217 |
| Texas Instruments Inc. | 155,000 | 8,287 |
| OMRON Corp.2 | 51,000 | 2,286 |
| 1,039,977 | ||
| Consumer discretionary 18.12% | ||
| Amazon.com, Inc.1 | 508,900 | 157,937 |
| Home Depot, Inc. | 1,161,000 | 121,870 |
| Priceline Group Inc.1 | 104,000 | 118,582 |
| Walt Disney Co. | 683,705 | 64,398 |
| Toyota Motor Corp.2 | 950,000 | 59,243 |
| Liberty Global PLC, Class C1 | 816,465 | 39,443 |
| Liberty Global PLC, Class A1 | 327,449 | 16,440 |
| Industria de Diseño Textil, SA2 | 1,460,000 | 41,833 |
| HUGO BOSS AG2 | 335,500 | 41,191 |
| Swatch Group Ltd, non-registered shares2 | 64,530 | 28,654 |
| Swatch Group Ltd2 | 135,500 | 11,720 |
| CBS Corp., Class B | 702,500 | 38,876 |
| ASOS PLC1,2 | 747,299 | 29,678 |
| Dixons Carphone PLC2 | 3,800,000 | 27,370 |
| Publicis Groupe SA2 | 371,135 | 26,582 |
| Navitas Ltd.2 | 5,950,000 | 24,423 |
| Burberry Group PLC2 | 860,000 | 21,791 |
| NIKE, Inc., Class B | 226,000 | 21,730 |
| Time Warner Inc. | 246,000 | 21,013 |
| TOD’S SpA2 | 194,000 | 16,835 |
| MGM Resorts International1 | 735,000 | 15,714 |
| Christian Dior SA2 | 69,000 | 11,789 |
| Naspers Ltd., Class N2 | 87,300 | 11,240 |
| Dufry AG1,2 | 74,115 | 10,987 |
| Nokian Renkaat Oyj2 | 306,180 | 7,500 |
| Carnival Corp., units | 149,028 | 6,756 |
| Suzuki Motor Corp.2 | 195,000 | 5,862 |
| Honda Motor Co., Ltd.2 | 196,500 | 5,714 |
| Arcos Dorados Holdings Inc., Class A | 740,000 | 4,003 |
| 1,009,174 | ||
| Financials 14.09% | ||
| Moody’s Corp. | 1,651,000 | 158,182 |
| JPMorgan Chase & Co. | 1,145,000 | 71,654 |
| ORIX Corp.2 | 4,990,000 | 62,380 |
| AIA Group Ltd.2 | 11,202,500 | 61,686 |
| Bankia, SA1,2 | 29,520,000 | 43,764 |
| HSBC Holdings PLC (GBP denominated)2 | 4,320,228 | 40,828 |
| ICICI Bank Ltd.2 | 6,625,000 | 36,797 |
| BNP Paribas SA2 | 500,000 | 29,382 |
| Prudential PLC2 | 1,272,434 | 29,281 |
| AEON Financial Service Co., Ltd.2 | 1,365,000 | 26,685 |
| AXA SA2 | 1,080,630 | 24,959 |
| East West Bancorp, Inc. | 630,000 | 24,387 |
| Deutsche Bank AG2 | 725,777 | 21,937 |
| CME Group Inc., Class A | 239,700 | 21,249 |
| Sumitomo Mitsui Trust Holdings, Inc.2 | 4,881,000 | 18,628 |
| ACE Ltd. | 160,000 | 18,381 |
| Sumitomo Mitsui Financial Group, Inc.2 | 462,000 | 16,693 |
| Common stocks Financials (continued) | Shares | Value (000) |
| Bankinter, SA2 | 2,030,000 | $16,187 |
| Housing Development Finance Corp. Ltd.2 | 850,000 | 15,207 |
| Berkshire Hathaway Inc., Class A1 | 60 | 13,560 |
| Shinsei Bank, Ltd.2 | 6,401,000 | 11,175 |
| BDO Unibank, Inc.2 | 3,981,333 | 9,738 |
| Tokio Marine Holdings, Inc.2 | 247,000 | 8,021 |
| Allianz SE2 | 21,750 | 3,614 |
| 784,375 | ||
| Industrials 9.21% | ||
| AA PLC1,2 | 12,217,000 | 66,850 |
| Geberit AG2 | 150,000 | 50,975 |
| KONE Oyj, Class B2 | 880,000 | 39,968 |
| Airbus Group NV2 | 645,000 | 32,035 |
| United Technologies Corp. | 259,000 | 29,785 |
| Rolls-Royce Holdings PLC1,2 | 2,150,000 | 28,963 |
| Adecco SA2 | 417,000 | 28,566 |
| Ryanair Holdings PLC (ADR)1 | 382,500 | 27,261 |
| Deere & Co. | 300,000 | 26,541 |
| United Continental Holdings, Inc.1 | 385,000 | 25,753 |
| Boeing Co. | 190,000 | 24,696 |
| International Consolidated Airlines Group, SA (CDI)1,2 | 3,070,000 | 22,943 |
| American Airlines Group Inc. | 390,000 | 20,916 |
| Fastenal Co. | 405,000 | 19,262 |
| ASSA ABLOY AB, Class B2 | 310,000 | 16,382 |
| Caterpillar Inc. | 160,000 | 14,645 |
| IDEX Corp. | 180,000 | 14,011 |
| Masco Corp. | 480,000 | 12,096 |
| Komatsu Ltd.2 | 425,700 | 9,438 |
| Waste Management, Inc. | 35,800 | 1,837 |
| 512,923 | ||
| Consumer staples 6.68% | ||
| Associated British Foods PLC2 | 1,590,000 | 77,251 |
| Nestlé SA2 | 780,000 | 57,175 |
| Colgate-Palmolive Co. | 632,000 | 43,728 |
| Orion Corp.2 | 43,000 | 39,548 |
| ITC Ltd.2 | 4,629,975 | 26,957 |
| Pernod Ricard SA2 | 218,739 | 24,253 |
| PepsiCo, Inc. | 201,000 | 19,007 |
| Alimentation Couche-Tard Inc., Class B | 453,000 | 18,985 |
| Shiseido Co., Ltd.2 | 1,260,000 | 17,644 |
| British American Tobacco PLC2 | 288,000 | 15,648 |
| Procter & Gamble Co. | 125,000 | 11,386 |
| Coca-Cola HBC AG (CDI)2 | 444,107 | 8,450 |
| Seven & i Holdings Co., Ltd.2 | 184,000 | 6,637 |
| SABMiller PLC2 | 100,000 | 5,175 |
| 371,844 | ||
| Materials 2.93% | ||
| First Quantum Minerals Ltd. | 2,669,400 | 37,934 |
| Linde AG2 | 110,000 | 20,517 |
| Rio Tinto PLC2 | 410,000 | 18,890 |
| Glencore PLC2 | 4,000,000 | 18,411 |
| Axalta Coating Systems Ltd.1 | 666,700 | 17,347 |
| Common stocks Materials (continued) | Shares | Value (000) |
| Northam Platinum Ltd.1,2 | 5,196,035 | $16,406 |
| Dow Chemical Co. | 355,000 | 16,192 |
| FMC Corp. | 252,000 | 14,372 |
| Monsanto Co. | 24,800 | 2,963 |
| 163,032 | ||
| Energy 2.68% | ||
| Oil Search Ltd.2 | 4,986,113 | 32,214 |
| Royal Dutch Shell PLC, Class B2 | 480,000 | 16,490 |
| Royal Dutch Shell PLC, Class B (ADR) | 150,000 | 10,434 |
| Canadian Natural Resources, Ltd. | 700,000 | 21,642 |
| Enbridge Inc. | 396,030 | 20,364 |
| EOG Resources, Inc. | 220,000 | 20,255 |
| China Petroleum & Chemical Corp., Class H2 | 17,950,000 | 14,533 |
| Schlumberger Ltd. | 65,000 | 5,552 |
| Pacific Rubiales Energy Corp. | 769,600 | 4,763 |
| Petróleo Brasileiro SA - Petrobras, preferred nominative (ADR) | 274,700 | 2,082 |
| Petróleo Brasileiro SA - Petrobras, ordinary nominative (ADR) | 133,000 | 971 |
| 149,300 | ||
| Telecommunication services 1.31% | ||
| SoftBank Corp.2 | 784,000 | 46,657 |
| TalkTalk Telecom Group PLC2 | 5,625,000 | 26,431 |
| 73,088 | ||
| Utilities 0.49% | ||
| ENN Energy Holdings Ltd.2 | 3,720,000 | 21,037 |
| National Grid PLC2 | 159,000 | 2,267 |
| EDP - Energias de Portugal, SA2 | 564,000 | 2,181 |
| Snam SPA2 | 400,000 | 1,973 |
| 27,458 | ||
| Miscellaneous 0.84% | ||
| Other common stocks in initial period of acquisition | 46,641 | |
| Total common stocks (cost: $3,872,317,000) | 5,259,752 | |
| Preferred securities 0.07% Miscellaneous 0.07% | ||
| Other preferred securities in initial period of acquisition | 3,641 | |
| Total preferred securities (cost: $10,355,000) | 3,641 | |
| Bonds, notes & other debt instruments 0.64% U.S. Treasury bonds & notes 0.64% U.S. Treasury 0.64% | Principal amount (000) | |
| U.S. Treasury 0.25% 2015 | $8,175 | 8,182 |
| U.S. Treasury 0.25% 2015 | 2,600 | 2,600 |
| U.S. Treasury 4.00% 2015 | 24,925 | 25,043 |
| Total bonds, notes & other debt instruments (cost: $35,814,000) | 35,825 |
| Short-term securities 4.63% | Principal amount (000) | Value (000) |
| Fannie Mae 0.08%–0.11% due 5/1/2015–5/18/2015 | $30,900 | $30,891 |
| Federal Home Loan Bank 0.05%–0.12% due 1/16/2015–5/6/2015 | 42,000 | 41,998 |
| General Electric Co. 0.10% due 1/2/2015 | 11,000 | 11,000 |
| Microsoft Corp. 0.10% due 2/10/20153 | 24,300 | 24,297 |
| Nordea Bank AB 0.18% due 1/8/20153 | 38,400 | 38,399 |
| Province of Ontario 0.10% due 2/13/2015 | 15,000 | 14,999 |
| Siemens Capital Co. LLC 0.11% due 1/5/20153 | 10,000 | 10,000 |
| Sumitomo Mitsui Banking Corp. 0.12%–0.22% due 1/13/2015–1/16/20153 | 61,100 | 61,096 |
| Svenska Handelsbanken Inc. 0.18% due 2/23/20153 | 20,000 | 19,995 |
| Toronto-Dominion Holdings USA Inc. 0.14% due 1/16/20153 | 5,000 | 5,000 |
| Total short-term securities (cost: $257,667,000) | 257,675 | |
| Total investment securities 99.79% (cost: $4,176,153,000) | 5,556,893 | |
| Other assets less liabilities 0.21% | 11,952 | |
| Net assets 100.00% | $5,568,845 |
| 1 | Security did not produce income during the last 12 months. |
| 2 | Valued under fair value procedures adopted by authority of the board of trustees. The total value of all such securities, including those in “Miscellaneous,“ was $2,548,710,000, which represented 45.77% of the net assets of the fund. This entire amount relates to certain securities trading outside the U.S. whose values were adjusted as a result of significant market movements following the close of local trading. |
| 3 | Acquired in a transaction exempt from registration under Section 4(2) of the Securities Act of 1933. May be resold in the U.S. in transactions exempt from registration, normally to qualified institutional buyers. The total value of all such securities was $158,787,000, which represented 2.85% of the net assets of the fund. |
| Key to abbreviations |
| ADR = American Depositary Receipts |
| CDI = CREST Depository Interest |
| GBP = British pounds |
| Common stocks 93.16% Consumer discretionary 20.05% | Shares | Value (000) |
| Netflix, Inc.1 | 304,000 | $103,849 |
| Lions Gate Entertainment Corp. | 2,844,500 | 91,081 |
| Domino’s Pizza, Inc. | 512,000 | 48,215 |
| Paddy Power PLC2 | 523,300 | 43,560 |
| Penske Automotive Group, Inc. | 812,000 | 39,845 |
| Melco Crown Entertainment Ltd. (ADR) | 1,432,000 | 36,373 |
| Cedar Fair, LP | 687,000 | 32,859 |
| zooplus AG, non-registered shares1,2,3 | 357,716 | 28,557 |
| John Wiley & Sons, Inc., Class A | 347,500 | 20,586 |
| Five Below, Inc.1 | 489,390 | 19,982 |
| Hankook Tire Co., Ltd.1,2 | 418,940 | 19,932 |
| Brinker International, Inc. | 325,000 | 19,074 |
| Melco International Development Ltd.2 | 8,216,000 | 17,987 |
| Ted Baker PLC2 | 517,162 | 17,747 |
| Entertainment One Ltd.2 | 3,485,300 | 17,423 |
| Group 1 Automotive, Inc. | 180,000 | 16,132 |
| Eros International PLC, Class A1 | 759,296 | 16,067 |
| Chow Sang Sang Holdings International Ltd.2 | 5,598,300 | 14,670 |
| Home Inns & Hotels Management Inc. (ADR)1 | 475,250 | 14,267 |
| Rightmove PLC2 | 361,000 | 12,568 |
| NagaCorp Ltd.2 | 14,382,000 | 11,720 |
| Hathway Cable and Datacom Ltd.1,2,4 | 2,350,000 | 11,597 |
| Stella International Holdings Ltd.2 | 4,230,167 | 11,154 |
| L’Occitane International SA2 | 4,295,000 | 10,808 |
| Lands’ End, Inc.1 | 200,000 | 10,792 |
| Inchcape PLC2 | 959,300 | 10,737 |
| China Lodging Group, Ltd. (ADR)1 | 379,000 | 9,960 |
| OSIM International Ltd2 | 6,282,000 | 9,354 |
| Tesla Motors, Inc.1 | 35,000 | 7,784 |
| Toll Brothers, Inc.1 | 225,000 | 7,711 |
| Mothercare PLC2 | 2,451,000 | 6,633 |
| Daily Mail and General Trust PLC, Class A, nonvoting2 | 485,000 | 6,228 |
| Playmates Toys Ltd.2 | 27,164,000 | 6,104 |
| Intercontinental Hotels Group PLC2 | 149,530 | 5,992 |
| PT Multipolar Tbk2 | 77,730,000 | 5,204 |
| TravelCenters of America LLC1 | 400,000 | 5,048 |
| Zhongsheng Group Holdings Ltd.2 | 5,067,500 | 4,570 |
| American Axle & Manufacturing Holdings, Inc.1 | 202,000 | 4,563 |
| START TODAY Co., Ltd.2 | 200,000 | 4,173 |
| Brunello Cucinelli SpA2 | 178,865 | 4,010 |
| SSI Group, Inc.1,2 | 18,000,000 | 3,988 |
| Parkson Retail Asia Ltd.2 | 6,212,000 | 3,752 |
| Cie. Plastic Omnium SA2 | 135,757 | 3,687 |
| Sitoy Group Holdings Ltd.2 | 4,206,000 | 3,404 |
| Poundland Group PLC1,2 | 621,264 | 3,161 |
| Talwalkars Better Value Fitness Ltd.2 | 650,000 | 2,989 |
| Common stocks Consumer discretionary (continued) | Shares | Value (000) |
| Mood Media Corp.1 | 4,819,000 | $2,281 |
| Mood Media Corp. (CDI)1 | 1,335,000 | 632 |
| GVC Holdings PLC2 | 374,748 | 2,810 |
| SeaWorld Entertainment, Inc. | 156,100 | 2,794 |
| I.T Limited2 | 9,630,000 | 2,776 |
| POLYTEC Holding AG, non-registered shares2 | 364,350 | 2,741 |
| Dick Smith Holdings Ltd.2 | 1,363,670 | 2,312 |
| PT Astra Otoparts Tbk2 | 6,431,000 | 2,182 |
| Delticom AG2 | 83,000 | 1,900 |
| Ripley Corp SA | 3,750,000 | 1,817 |
| Phorm Corp. Ltd.1,2 | 10,260,000 | 1,659 |
| Golden Eagle Retail Group Ltd.2 | 1,442,000 | 1,616 |
| William Hill PLC2 | 205,200 | 1,154 |
| China Zenix Auto International Ltd. (ADR)1 | 428,500 | 613 |
| zulily, inc., Class A1 | 25,200 | 590 |
| PT Global Mediacom Tbk2 | 3,025,000 | 348 |
| Five Star Travel Corp.1,2,4 | 219,739 | 47 |
| Ten Alps PLC1,2 | 2,600,000 | 21 |
| 834,190 | ||
| Health care 18.79% | ||
| Synageva BioPharma Corp.1 | 1,326,100 | 123,049 |
| bluebird bio, Inc.1 | 1,144,159 | 104,942 |
| athenahealth, Inc.1 | 396,600 | 57,785 |
| Endo International PLC1 | 798,824 | 57,611 |
| Illumina, Inc.1 | 289,100 | 53,362 |
| BioMarin Pharmaceutical Inc.1 | 516,800 | 46,719 |
| Hikma Pharmaceuticals PLC2 | 1,424,000 | 43,669 |
| Myriad Genetics, Inc.1 | 1,274,898 | 43,423 |
| Ultragenyx Pharmaceutical Inc.1 | 836,206 | 36,693 |
| Kite Pharma, Inc.1,5 | 343,739 | 19,823 |
| Kite Pharma, Inc.1 | 168,000 | 9,689 |
| Novadaq Technologies Inc.1 | 1,505,700 | 25,025 |
| GW Pharmaceuticals PLC (ADR)1 | 358,950 | 24,294 |
| Team Health Holdings, Inc.1 | 330,745 | 19,028 |
| Lijun International Pharmaceutical (Holding) Co., Ltd.2 | 34,730,000 | 15,918 |
| NuVasive, Inc.1 | 277,400 | 13,082 |
| Insulet Corp.1 | 255,033 | 11,747 |
| Fisher & Paykel Healthcare Corp. Ltd.2 | 2,151,385 | 10,469 |
| Genomma Lab Internacional, SAB de CV, Series B1 | 5,400,000 | 10,270 |
| Orexigen Therapeutics, Inc.1 | 1,532,176 | 9,285 |
| Teleflex Inc. | 60,200 | 6,912 |
| Mauna Kea Technologies SA1,2,3 | 881,400 | 6,123 |
| PT Siloam International Hospitals Tbk1,2 | 5,128,200 | 5,674 |
| Glenmark Pharmaceuticals Ltd.2 | 372,345 | 4,528 |
| Ocular Therapeutix, Inc.1 | 186,000 | 4,375 |
| Pharmstandard OJSC (GDR)1,2 | 706,865 | 4,253 |
| CONMED Corp. | 93,000 | 4,181 |
| Hologic, Inc.1 | 140,000 | 3,743 |
| Circassia Pharmaceuticals PLC1,2 | 815,000 | 3,519 |
| EOS imaging SA1,2 | 380,000 | 2,400 |
| QRxPharma Ltd.1,2 | 4,129,927 | 70 |
| 781,661 |
| Common stocks Information technology 14.64% | Shares | Value (000) |
| TriQuint Semiconductor, Inc.1 | 4,084,978 | $112,541 |
| Palo Alto Networks, Inc.1 | 523,200 | 64,129 |
| AAC Technologies Holdings Inc.2 | 11,687,100 | 62,108 |
| Semiconductor Manufacturing International Corp.1,2 | 358,447,500 | 32,738 |
| Topcon Corp.2 | 1,306,310 | 27,850 |
| Hamamatsu Photonics KK2 | 480,300 | 22,951 |
| Kakaku.com, Inc.2 | 1,510,500 | 21,716 |
| National Instruments Corp. | 625,000 | 19,431 |
| Cray Inc.1 | 469,700 | 16,195 |
| Cognex Corp. | 290,000 | 11,986 |
| Itron, Inc.1 | 267,000 | 11,291 |
| Goldpac Group Ltd.2 | 16,280,000 | 11,149 |
| Spectris PLC2 | 340,000 | 11,086 |
| Cypress Semiconductor Corp.1 | 745,000 | 10,639 |
| OBIC Co., Ltd.2 | 292,300 | 9,378 |
| RIB Software AG2 | 699,167 | 9,196 |
| Atmel Corp.1 | 997,980 | 8,378 |
| VTech Holdings Ltd.2 | 570,000 | 8,156 |
| Silicon Laboratories Inc.1 | 170,000 | 8,095 |
| Delta Electronics (Thailand) PCL2 | 3,667,800 | 7,850 |
| Veeco Instruments Inc.1 | 224,922 | 7,845 |
| Persistent Systems Ltd.2 | 278,600 | 7,327 |
| iDreamSky Technology Ltd., Class A (ADR)1 | 429,000 | 7,327 |
| Halma PLC2 | 682,500 | 7,276 |
| Suprema Inc.1,2 | 310,000 | 7,106 |
| Knowles Corp.1 | 300,000 | 7,065 |
| JDS Uniphase Corp.1 | 410,600 | 5,633 |
| Inphi Corp.1 | 296,639 | 5,482 |
| RF Micro Devices, Inc.1 | 320,000 | 5,309 |
| Semtech Corp.1 | 191,000 | 5,266 |
| CDW Corp. | 140,000 | 4,924 |
| Jay Mart PCL2 | 15,621,250 | 4,773 |
| FireEye, Inc.1 | 146,200 | 4,617 |
| Finisar Corp.1 | 233,000 | 4,523 |
| QIWI PLC, Class B (ADR) | 210,800 | 4,256 |
| Ixia1 | 340,000 | 3,825 |
| SciQuest, Inc.1 | 262,744 | 3,797 |
| ON Semiconductor Corp.1 | 370,000 | 3,748 |
| Domino Printing Sciences PLC2 | 365,000 | 3,731 |
| Alten SA, non-registered shares2 | 85,500 | 3,656 |
| Zebra Technologies Corp., Class A1 | 42,900 | 3,321 |
| Taiyo Yuden Co., Ltd.2 | 240,000 | 2,806 |
| M/A-COM Technology Solutions Holdings, Inc.1 | 78,415 | 2,453 |
| Tangoe, Inc.1 | 185,975 | 2,423 |
| Pandora Media, Inc.1 | 135,000 | 2,407 |
| Remark Media, Inc.1 | 250,952 | 1,122 |
| China High Precision Automation Group Ltd.1,2 | 5,500,000 | 71 |
| 608,952 | ||
| Industrials 13.81% | ||
| International Container Terminal Services, Inc.2 | 34,610,000 | 88,650 |
| AA PLC1,2 | 6,770,800 | 37,049 |
| Intertek Group PLC2 | 955,000 | 34,618 |
| ITT Corp. | 801,000 | 32,408 |
| Moog Inc., Class A1 | 432,100 | 31,988 |
| Common stocks Industrials (continued) | Shares | Value (000) |
| Polypore International, Inc.1 | 672,000 | $31,618 |
| JVM Co., Ltd.1,2,3 | 411,500 | 22,472 |
| Northgate PLC2 | 1,838,270 | 17,391 |
| Rotork PLC2 | 405,000 | 14,574 |
| Carborundum Universal Ltd.2 | 5,090,000 | 14,386 |
| Alliance Global Group, Inc.2 | 23,370,000 | 11,664 |
| Gujarat Pipavav Port Ltd.1,2 | 3,420,397 | 11,154 |
| Clean Harbors, Inc.1 | 229,000 | 11,003 |
| PT AKR Corporindo Tbk2 | 32,680,000 | 10,834 |
| BTS Rail Mass Transit Growth Infrastructure Fund2 | 35,979,200 | 10,821 |
| J. Kumar Infraprojects Ltd.2 | 1,300,000 | 10,572 |
| Amara Raja Batteries Ltd.2 | 810,712 | 10,542 |
| Orient Overseas (International) Ltd.2 | 1,698,000 | 9,886 |
| Orbital Sciences Corp.1 | 350,000 | 9,412 |
| PARK24 Co., Ltd.2 | 621,600 | 9,154 |
| Johnson Electric Holdings Ltd.2 | 2,378,000 | 8,735 |
| NORMA Group SE, non-registered shares2 | 180,718 | 8,624 |
| Waste Connections, Inc. | 194,600 | 8,560 |
| Summit Ascent Holdings Ltd.1,2 | 16,730,000 | 8,124 |
| MonotaRO Co., Ltd.2 | 400,700 | 8,039 |
| BELIMO Holding AG2 | 3,450 | 8,017 |
| KEYW Holding Corp.1 | 750,000 | 7,785 |
| Pegasus Hava Tasimaciligi AS1,2 | 541,000 | 7,631 |
| Cebu Air, Inc.2 | 3,850,000 | 7,350 |
| PayPoint PLC2 | 520,000 | 7,255 |
| Bossard Holding AG2 | 55,562 | 6,057 |
| Advisory Board Co.1 | 115,000 | 5,633 |
| Geberit AG2 | 16,500 | 5,607 |
| CJ Korea Express Co., Ltd.1,2 | 24,500 | 4,338 |
| Boer Power Holdings Ltd.2 | 4,687,000 | 4,181 |
| CIMC Enric Holdings Ltd.2 | 5,016,000 | 3,967 |
| Okabe Co., Ltd.2 | 386,000 | 3,505 |
| Landstar System, Inc. | 46,600 | 3,380 |
| Frigoglass SAIC1,2 | 1,626,030 | 3,285 |
| Mills Estruturas e Serviços de Engenharia SA, ordinary nominative | 880,000 | 3,162 |
| China Shipping Container Lines Co., Ltd., Class H1,2 | 8,865,000 | 2,796 |
| Pfeiffer Vacuum Technology AG, non-registered shares2 | 32,000 | 2,656 |
| TD Power Systems Ltd.2 | 343,200 | 2,452 |
| Globaltrans Investment PLC (GDR)2 | 465,000 | 2,361 |
| National Express Group PLC2 | 591,000 | 2,271 |
| Chart Industries, Inc.1 | 64,900 | 2,220 |
| Shun Tak Holdings Ltd.2 | 4,714,000 | 2,174 |
| COSCO Pacific Ltd.2 | 1,500,000 | 2,125 |
| Avianca Holdings SA, preferred, restricted-voting (ADR) | 166,600 | 1,954 |
| 574,440 | ||
| Financials 6.45% | ||
| SVB Financial Group1 | 257,600 | 29,900 |
| Kemper Corp. | 595,000 | 21,485 |
| Old Republic International Corp. | 1,450,000 | 21,214 |
| K. Wah International Holdings Ltd.2 | 39,420,410 | 20,870 |
| Avanza Bank Holding AB2 | 602,547 | 19,940 |
| Chailease Holding Co. Ltd.2 | 6,622,000 | 16,421 |
| Shriram Transport Finance Co. Ltd.2 | 919,257 | 16,120 |
| Ocwen Financial Corp.1 | 809,000 | 12,216 |
| Common stocks Financials (continued) | Shares | Value (000) |
| ING Vysya Bank Ltd.2 | 838,954 | $11,548 |
| Altisource Residential Corp. | 451,407 | 8,757 |
| Starwood Property Trust, Inc. | 360,000 | 8,366 |
| Endurance Specialty Holdings Ltd. | 110,000 | 6,582 |
| EFG International AG2 | 562,925 | 6,551 |
| Tune Ins Holdings Bhd.2 | 13,112,000 | 6,321 |
| LSL Property Services PLC2 | 1,190,000 | 5,518 |
| Signature Bank1 | 42,000 | 5,290 |
| Bank of Ireland1,2 | 14,099,515 | 5,250 |
| Springleaf Holdings, Inc.1 | 144,700 | 5,234 |
| Golden Wheel Tiandi Holdings Co. Ltd.2 | 50,254,000 | 5,182 |
| Mahindra Lifespace Developers Ltd.2 | 681,356 | 5,078 |
| Texas Capital Bancshares, Inc.1 | 91,600 | 4,977 |
| City National Corp. | 58,900 | 4,760 |
| Crédito Real, SAB de CV | 2,109,422 | 4,519 |
| Airesis SA1,2,3 | 3,231,392 | 4,233 |
| Cathay General Bancorp, Inc. | 155,000 | 3,966 |
| Altisource Asset Management Corp.1 | 9,620 | 2,983 |
| Lai Sun Development Co. Ltd.2 | 118,000,000 | 2,659 |
| Inversiones La Construcción SA | 157,000 | 1,903 |
| Bao Viet Holdings2 | 351,607 | 526 |
| 268,369 | ||
| Materials 4.41% | ||
| PolyOne Corp. | 720,168 | 27,302 |
| AptarGroup, Inc. | 345,500 | 23,093 |
| OM Group, Inc. | 735,000 | 21,903 |
| Yingde Gases Group Co. Ltd.2 | 16,410,000 | 11,477 |
| Lundin Mining Corp.1 | 2,285,000 | 11,250 |
| Silgan Holdings Inc. | 194,000 | 10,398 |
| Time Technoplast Ltd.2,3 | 11,888,000 | 9,979 |
| FUCHS PETROLUB SE2 | 246,000 | 9,387 |
| Sirius Minerals PLC1,2 | 44,159,510 | 7,221 |
| Greatview Aseptic Packaging Co. Ltd.2 | 13,852,000 | 7,131 |
| CPMC Holdings Ltd.2 | 12,800,000 | 6,909 |
| United States Steel Corp. | 207,600 | 5,551 |
| Lenzing AG2 | 82,000 | 5,201 |
| Stillwater Mining Co.1 | 294,900 | 4,347 |
| Arkema SA2 | 56,300 | 3,734 |
| Synthomer PLC2 | 900,000 | 3,290 |
| Mayr-Melnhof Karton AG, non-registered shares2 | 27,300 | 2,833 |
| Kenmare Resources PLC1,2 | 54,706,150 | 2,759 |
| Nampak Ltd.2 | 582,849 | 2,193 |
| Sylvania Platinum Ltd. (CDI)1,2,3 | 15,000,000 | 1,955 |
| Hummingbird Resources PLC1,2 | 3,475,000 | 1,843 |
| Huntsman Corp. | 68,600 | 1,563 |
| Yip’s Chemical Holdings Ltd.2 | 1,182,000 | 718 |
| Indochine Mining Ltd.1,2,3 | 73,199,466 | 717 |
| Rusoro Mining Ltd.1 | 25,530,432 | 440 |
| Sundance Resources Ltd.1,2 | 19,500,000 | 392 |
| Orsu Metals Corp.1 | 588,231 | 15 |
| African Minerals Ltd.1,2 | 3,987,000 | — |
| 183,601 |
| Common stocks Energy 4.14% | Shares | Value (000) |
| InterOil Corp.1 | 1,184,235 | $57,779 |
| Amerisur Resources PLC1,2 | 27,117,360 | 18,672 |
| Ophir Energy PLC1,2 | 7,981,562 | 17,331 |
| Veresen Inc. | 680,000 | 10,746 |
| C&J Energy Services, Inc.1 | 802,000 | 10,594 |
| Memorial Resource Development Corp.1 | 477,700 | 8,613 |
| Exillon Energy PLC1,2 | 3,546,000 | 8,279 |
| Lekoil Ltd. (CDI)1,2 | 16,491,600 | 7,169 |
| Victoria Oil & Gas PLC1,2,3 | 6,966,560 | 7,018 |
| Genel Energy PLC1,2 | 400,600 | 4,288 |
| Circle Oil PLC1,2 | 22,687,000 | 4,196 |
| Oasis Petroleum Inc.1 | 224,000 | 3,705 |
| Cairn Energy PLC1,2 | 1,205,000 | 3,308 |
| Providence Resources PLC1,2 | 2,490,250 | 3,301 |
| Canadian Overseas Petroleum Ltd.1,3 | 19,225,000 | 1,655 |
| Canadian Overseas Petroleum Ltd. (GBP denominated)1,2,3 | 6,050,000 | 448 |
| Tethys Petroleum Ltd.1 | 8,112,100 | 1,536 |
| Tethys Petroleum Ltd. (GBP denominated)1,2 | 1,963,450 | 368 |
| International Petroleum Ltd.1,2 | 54,894,353 | 999 |
| Prosafe SE2 | 240,000 | 734 |
| Borders & Southern Petroleum PLC1,2 | 7,028,100 | 710 |
| Range Resources Ltd.1,2 | 67,000,000 | 668 |
| African Petroleum Corp. Ltd.1,2 | 3,363,637 | 117 |
| Esrey Energy Ltd.1 | 825,000 | 39 |
| Wildhorse Energy Ltd.1,2,3 | 540,900 | 23 |
| Wildhorse Energy Ltd. (CDI)1,2,3 | 240,859 | 11 |
| 172,307 | ||
| Consumer staples 3.28% | ||
| Puregold Price Club, Inc.1,2 | 37,418,000 | 32,071 |
| COSMOS Pharmaceutical Corp.2 | 124,500 | 17,007 |
| Petra Foods Ltd.2 | 4,800,000 | 13,755 |
| Hypermarcas SA, ordinary nominative1 | 1,853,800 | 11,612 |
| PZ Cussons PLC2 | 2,105,000 | 9,984 |
| Super Group Ltd.2 | 11,464,000 | 9,868 |
| Sprouts Farmers Market, Inc.1 | 204,926 | 6,963 |
| Wumart Stores, Inc., Class H2 | 7,895,000 | 6,742 |
| Treasury Wine Estates Ltd.2 | 1,245,400 | 4,845 |
| Coca-Cola Icecek AS, Class C2 | 191,100 | 4,132 |
| Sundrug Co., Ltd.2 | 97,500 | 3,946 |
| Kernel Holding SA1,2 | 493,041 | 3,913 |
| Stock Spirits Group PLC2 | 1,053,100 | 3,601 |
| O’Key Group SA (GDR)2 | 525,000 | 2,325 |
| Del Monte Pacific Ltd.2 | 6,534,400 | 2,254 |
| Convenience Retail Asia Ltd.2 | 2,850,000 | 1,836 |
| Lenta Ltd. (GDR)1,2 | 240,000 | 1,622 |
| 136,476 | ||
| Utilities 2.03% | ||
| ENN Energy Holdings Ltd.2 | 9,515,700 | 53,812 |
| Glow Energy PCL2 | 3,930,000 | 10,641 |
| CT Environmental Group Ltd.2 | 5,986,000 | 6,121 |
| Greenko Group PLC1,2 | 2,280,000 | 5,078 |
| Ratchaburi Electricity Generating Holding PCL2 | 2,300,000 | 4,105 |
| Common stocks Utilities (continued) | Shares | Value (000) |
| Energy World Corp. Ltd.1,2 | 10,560,000 | $2,539 |
| Mytrah Energy Ltd.1,2 | 1,700,000 | 2,008 |
| 84,304 | ||
| Telecommunication services 0.63% | ||
| Telephone and Data Systems, Inc. | 634,830 | 16,029 |
| Total Access Communication PCL2 | 1,602,200 | 4,679 |
| Level 3 Communications, Inc.1 | 87,500 | 4,321 |
| Hutchison Telecommunications Hong Kong Holdings Ltd.2 | 3,200,000 | 1,353 |
| 26,382 | ||
| Miscellaneous 4.93% | ||
| Other common stocks in initial period of acquisition | 205,254 | |
| Total common stocks (cost: $2,953,292,000) | 3,875,936 | |
| Rights & warrants 0.00% Energy 0.00% | ||
| Canadian Overseas Petroleum Ltd., warrants, expire 20171,2,3 | 2,555,000 | 44 |
| Range Resources Ltd., warrants, expire 20161,2 | 33,500,000 | 21 |
| Wildhorse Energy Ltd., rights, expire 20151,2,3 | 2,704,500 | 11 |
| Wildhorse Energy Ltd., rights, expire 2015 (GBP denominated)1,2,3 | 1,204,295 | 7 |
| 83 | ||
| Miscellaneous 0.00% | ||
| Other rights & warrants in initial period of acquisition | 53 | |
| Total rights & warrants (cost: $506,000) | 136 | |
| Convertible stocks 0.12% Health care 0.12% | ||
| Stem CentRx, Inc., Series F-1, convertible preferred2,5 | 274,000 | 4,961 |
| Total convertible stocks (cost: $3,307,000) | 4,961 | |
| Bonds, notes & other debt instruments 0.25% U.S. Treasury bonds & notes 0.25% U.S. Treasury 0.25% | Principal amount (000) | |
| U.S. Treasury 0.25% 2015 | $4,300 | 4,303 |
| U.S. Treasury 4.00% 2015 | 5,800 | 5,827 |
| Total bonds, notes & other debt instruments (cost: $10,126,000) | 10,130 | |
| Short-term securities 6.53% | ||
| Abbott Laboratories 0.10% due 2/2/20154 | 20,000 | 19,999 |
| American Honda Finance Corp. 0.11% due 1/9/2015 | 27,000 | 26,999 |
| ExxonMobil Corp. 0.14% due 3/2/2015 | 5,000 | 4,999 |
| Federal Home Loan Bank 0.11% due 5/15/2015 | 5,210 | 5,208 |
| Freddie Mac 0.09% due 2/25/2015 | 16,200 | 16,200 |
| General Electric Co. 0.10% due 1/2/2015 | 6,100 | 6,100 |
| John Deere Capital Corp. 0.12% due 2/12/20154 | 19,600 | 19,596 |
| Nordea Bank AB 0.23% due 5/19/20154 | 15,000 | 14,988 |
| Short-term securities | Principal amount (000) | Value (000) |
| Province of Ontario 0.10% due 2/13/2015 | $20,000 | $19,998 |
| Québec (Province of) 0.06% due 1/8/20154 | 18,900 | 18,900 |
| Sumitomo Mitsui Banking Corp. 0.12%–0.22% due 1/13/2015–1/16/20154 | 39,000 | 38,997 |
| Toronto-Dominion Holdings USA Inc. 0.16% due 1/22/20154 | 30,000 | 29,998 |
| Victory Receivables Corp. 0.16%–0.19% due 1/12/2015–1/28/20154 | 49,700 | 49,696 |
| Total short-term securities (cost: $271,673,000) | 271,678 | |
| Total investment securities 100.06% (cost: $3,238,904,000) | 4,162,841 | |
| Other assets less liabilities (0.06)% | (2,297) | |
| Net assets 100.00% | $4,160,544 |
| 1 | Security did not produce income during the last 12 months. |
| 2 | Valued under fair value procedures adopted by authority of the board of trustees. The total value of all such securities, including those in “Miscellaneous,“ was $1,668,893,000, which represented 40.11% of the net assets of the fund. This amount includes $1,650,402,000 related to certain securities trading outside the U.S. whose values were adjusted as a result of significant market movements following the close of local trading. |
| 3 | Represents an affiliated company as defined under the Investment Company Act of 1940. |
| 4 | Acquired in a transaction exempt from registration under Section 4(2) of the Securities Act of 1933. May be resold in the U.S. in transactions exempt from registration, normally to qualified institutional buyers. The total value of all such securities was $203,818,000, which represented 4.90% of the net assets of the fund. |
| 5 | Acquired through a private placement transaction exempt from registration under the Securities Act of 1933. May be subject to legal or contractual restrictions on resale. Further details on these holdings appear below. |
| Private placement securities | Acquisition date(s) | Cost (000) | Value (000) | Percent of net assets |
| Stem CentRx, Inc., Series F-1, convertible preferred | 6/10/2014 | $3,307 | $4,961 | .12% |
| Kite Pharma, Inc. | 4/24/2014-6/24/2014 | 5,259 | 19,823 | .48 |
| Total private placement securities | $8,566 | $24,784 | .60% |
| Key to abbreviations and symbols | ||
| ADR = American Depositary Receipts | ||
| CDI = CREST Depository Interest | ||
| GDR = Global Depositary Receipts | ||
| A$ = Australian dollars | ||
| € = Euros | ||
| GBP = British pounds | ||
| ¥ = Japanese yen |
| Common stocks 95.50% Consumer discretionary 18.78% | Shares | Value (000) |
| Amazon.com, Inc.1 | 2,648,216 | $821,874 |
| Home Depot, Inc. | 6,320,000 | 663,410 |
| Comcast Corp., Class A | 9,555,000 | 554,286 |
| Twenty-First Century Fox, Inc., Class A | 9,540,000 | 366,384 |
| Tiffany & Co. | 2,389,000 | 255,289 |
| Johnson Controls, Inc. | 3,099,100 | 149,810 |
| NIKE, Inc., Class B | 1,530,000 | 147,109 |
| MGM Resorts International1 | 5,718,800 | 122,268 |
| Lowe’s Companies, Inc. | 1,546,000 | 106,365 |
| Starbucks Corp. | 1,255,000 | 102,973 |
| Norwegian Cruise Line Holdings Ltd.1 | 2,000,000 | 93,520 |
| Carnival Corp., units | 1,886,700 | 85,524 |
| Charter Communications, Inc., Class A1 | 500,000 | 83,310 |
| Walt Disney Co. | 750,000 | 70,642 |
| Luxottica Group SpA2 | 1,164,000 | 63,726 |
| Toll Brothers, Inc.1 | 1,767,290 | 60,565 |
| L’Occitane International SA2 | 23,700,000 | 59,638 |
| Expedia, Inc. | 693,000 | 59,154 |
| Hyatt Hotels Corp., Class A1 | 858,751 | 51,705 |
| Ralph Lauren Corp., Class A | 273,000 | 50,549 |
| Toyota Motor Corp.2 | 765,000 | 47,706 |
| Netflix, Inc.1 | 115,000 | 39,285 |
| Tesla Motors, Inc.1 | 153,000 | 34,029 |
| Wynn Macau, Ltd.2 | 11,400,000 | 31,782 |
| CBS Corp., Class B | 545,000 | 30,160 |
| Chipotle Mexican Grill, Inc.1 | 38,500 | 26,354 |
| Domino’s Pizza, Inc. | 275,000 | 25,897 |
| Priceline Group Inc.1 | 20,000 | 22,804 |
| Wynn Resorts, Ltd. | 126,140 | 18,765 |
| Sturm, Ruger & Co., Inc. | 522,800 | 18,105 |
| Markit Ltd.1 | 500,000 | 13,215 |
| 4,276,203 | ||
| Information technology 18.78% | ||
| ASML Holding NV (New York registered) | 3,444,016 | 371,368 |
| ASML Holding NV2 | 1,808,186 | 193,723 |
| Microsoft Corp. | 11,590,000 | 538,355 |
| Google Inc., Class C1 | 511,000 | 268,991 |
| Google Inc., Class A1 | 423,000 | 224,469 |
| Visa Inc., Class A | 1,083,000 | 283,963 |
| LinkedIn Corp., Class A1 | 1,235,000 | 283,692 |
| Apple Inc. | 2,500,000 | 275,950 |
| Facebook, Inc., Class A1 | 3,282,685 | 256,115 |
| Avago Technologies Ltd. | 1,816,000 | 182,671 |
| salesforce.com, inc.1 | 2,880,000 | 170,813 |
| Nintendo Co., Ltd.2 | 1,114,960 | 116,203 |
| Common stocks Information technology (continued) | Shares | Value (000) |
| Taiwan Semiconductor Manufacturing Co. Ltd.2 | 22,278,000 | $98,307 |
| Hexagon AB, Class B2 | 3,152,551 | 97,492 |
| Dolby Laboratories, Inc., Class A | 2,166,221 | 93,407 |
| Wirecard AG2 | 1,923,972 | 84,866 |
| Autodesk, Inc.1 | 1,365,000 | 81,982 |
| Adobe Systems Inc.1 | 1,000,000 | 72,700 |
| Trimble Navigation Ltd.1 | 2,565,500 | 68,088 |
| MercadoLibre, Inc. | 440,000 | 56,175 |
| Amphenol Corp., Class A | 1,015,000 | 54,617 |
| Twitter, Inc.1 | 1,500,000 | 53,805 |
| eBay Inc.1 | 907,000 | 50,901 |
| Intuit Inc. | 545,000 | 50,244 |
| Finisar Corp.1 | 2,554,000 | 49,573 |
| Murata Manufacturing Co., Ltd.2 | 380,000 | 41,509 |
| Cisco Systems, Inc. | 1,240,000 | 34,491 |
| Cognizant Technology Solutions Corp., Class A1 | 588,000 | 30,964 |
| TE Connectivity Ltd. | 420,000 | 26,565 |
| Rackspace Hosting, Inc.1 | 461,900 | 21,622 |
| Texas Instruments Inc. | 385,000 | 20,584 |
| NetSuite Inc.1 | 185,000 | 20,196 |
| 4,274,401 | ||
| Health care 17.05% | ||
| Express Scripts Holding Co.1 | 4,668,208 | 395,257 |
| Incyte Corp.1 | 5,340,000 | 390,407 |
| UnitedHealth Group Inc. | 3,510,000 | 354,826 |
| Regeneron Pharmaceuticals, Inc.1 | 847,600 | 347,728 |
| Vertex Pharmaceuticals Inc.1 | 2,680,000 | 318,384 |
| Centene Corp.1 | 2,288,500 | 237,661 |
| Hologic, Inc.1 | 7,913,000 | 211,594 |
| Edwards Lifesciences Corp.1 | 1,285,400 | 163,734 |
| Biogen Idec Inc.1 | 445,500 | 151,225 |
| Agios Pharmaceuticals, Inc.1 | 1,255,126 | 140,624 |
| Humana Inc. | 947,000 | 136,018 |
| Merck & Co., Inc. | 2,220,000 | 126,074 |
| Grifols, SA, Class B (ADR) | 3,391,750 | 115,285 |
| Grifols, SA, Class A, non-registered shares2 | 216,534 | 8,620 |
| Myriad Genetics, Inc.1 | 3,480,000 | 118,529 |
| Baxter International Inc. | 1,397,119 | 102,395 |
| Gilead Sciences, Inc.1 | 1,070,000 | 100,858 |
| Intuitive Surgical, Inc.1 | 116,800 | 61,780 |
| PerkinElmer, Inc. | 1,195,000 | 52,257 |
| Pharmacyclics, Inc.1 | 419,166 | 51,247 |
| Abbott Laboratories | 1,137,200 | 51,197 |
| Quintiles Transnational Holdings Inc.1 | 740,000 | 43,564 |
| Novartis AG2 | 470,000 | 43,225 |
| Boston Scientific Corp.1 | 2,080,000 | 27,560 |
| Bristol-Myers Squibb Co. | 410,000 | 24,202 |
| Roche Holding AG2 | 84,900 | 23,011 |
| Intercept Pharmaceuticals, Inc.1 | 146,900 | 22,916 |
| Novo Nordisk A/S, Class B2 | 470,000 | 19,887 |
| Theravance, Inc. | 1,300,000 | 18,395 |
| Common stocks Health care (continued) | Shares | Value (000) |
| HeartWare International, Inc.1 | 194,699 | $14,297 |
| InnovaCare Inc.1,2,3 | 2,843,000 | 9,240 |
| 3,881,997 | ||
| Financials 12.97% | ||
| Wells Fargo & Co. | 10,751,096 | 589,375 |
| Berkshire Hathaway Inc., Class A1 | 1,630 | 368,380 |
| American Express Co. | 3,000,000 | 279,120 |
| Capital One Financial Corp. | 2,580,000 | 212,979 |
| Legal & General Group PLC2 | 45,158,246 | 173,445 |
| Onex Corp. | 2,523,500 | 146,527 |
| American International Group, Inc. | 2,333,300 | 130,688 |
| JPMorgan Chase & Co. | 2,053,720 | 128,522 |
| American Tower Corp. | 1,195,000 | 118,126 |
| Arch Capital Group Ltd.1 | 1,800,000 | 106,380 |
| ACE Ltd. | 900,000 | 103,392 |
| Goldman Sachs Group, Inc. | 434,400 | 84,200 |
| CME Group Inc., Class A | 771,300 | 68,376 |
| Leucadia National Corp. | 2,589,740 | 58,062 |
| Financial Engines, Inc. | 1,365,000 | 49,891 |
| FCB Financial Holdings, Inc., Class A1 | 1,890,000 | 46,569 |
| Bank of America Corp. | 2,140,000 | 38,285 |
| Iron Mountain Inc. | 963,453 | 37,247 |
| Umpqua Holdings Corp. | 2,041,280 | 34,722 |
| MB Financial, Inc. | 1,010,000 | 33,189 |
| Legg Mason Partners Equity Fund | 565,000 | 30,154 |
| W. R. Berkley Corp. | 550,000 | 28,193 |
| First Republic Bank | 495,000 | 25,799 |
| PNC Financial Services Group, Inc. | 233,600 | 21,311 |
| Crown Castle International Corp. | 265,000 | 20,855 |
| Charles Schwab Corp. | 590,000 | 17,812 |
| 2,951,599 | ||
| Industrials 9.20% | ||
| American Airlines Group Inc. | 5,525,000 | 296,306 |
| Boeing Co. | 2,250,000 | 292,455 |
| Oshkosh Corp.4 | 4,947,000 | 240,672 |
| United Continental Holdings, Inc.1 | 3,200,700 | 214,095 |
| Union Pacific Corp. | 1,500,000 | 178,695 |
| Rockwell Collins, Inc. | 1,775,000 | 149,952 |
| MTU Aero Engines AG2 | 1,057,696 | 92,351 |
| Meggitt PLC2 | 10,934,373 | 87,402 |
| Fastenal Co. | 1,695,000 | 80,614 |
| Grafton Group PLC, units2 | 7,866,000 | 77,860 |
| Cummins Inc. | 515,000 | 74,248 |
| Robert Half International Inc. | 1,100,000 | 64,218 |
| General Dynamics Corp. | 395,000 | 54,360 |
| Airbus Group NV2 | 1,043,402 | 51,823 |
| Precision Castparts Corp. | 190,000 | 45,767 |
| Caterpillar Inc. | 490,000 | 44,850 |
| TransDigm Group Inc. | 150,000 | 29,452 |
| Masco Corp. | 722,000 | 18,194 |
| 2,093,314 |
| Common stocks Energy 8.05% | Shares | Value (000) |
| Noble Energy, Inc. | 4,510,000 | $213,909 |
| Concho Resources Inc.1 | 2,065,000 | 205,984 |
| Suncor Energy Inc. | 5,502,090 | 174,752 |
| FMC Technologies, Inc.1 | 3,400,000 | 159,256 |
| Pioneer Natural Resources Co. | 935,000 | 139,175 |
| Chesapeake Energy Corp. | 6,350,000 | 124,269 |
| Weatherford International PLC1 | 10,515,000 | 120,397 |
| Plains GP Holdings, LP, Class A | 3,471,872 | 89,158 |
| Schlumberger Ltd. | 900,000 | 76,869 |
| Core Laboratories NV | 561,198 | 67,535 |
| Chevron Corp. | 500,000 | 56,090 |
| Peyto Exploration & Development Corp. | 1,870,000 | 53,872 |
| Royal Dutch Shell PLC, Class B (ADR) | 760,100 | 52,873 |
| EOG Resources, Inc. | 572,400 | 52,701 |
| Murphy Oil Corp. | 956,000 | 48,297 |
| Enbridge Inc. | 570,712 | 29,346 |
| Cobalt International Energy, Inc.1 | 3,215,000 | 28,581 |
| Paramount Resources Ltd.1 | 1,170,000 | 28,318 |
| Cimarex Energy Co. | 250,000 | 26,500 |
| Parsley Energy, Inc., Class A1 | 1,340,000 | 21,386 |
| Tourmaline Oil Corp.1 | 547,000 | 18,221 |
| Bonanza Creek Energy, Inc.1 | 582,600 | 13,982 |
| Laricina Energy Ltd.1,2,5 | 1,403,000 | 13,163 |
| Oil States International, Inc.1 | 260,000 | 12,714 |
| Oceaneering International, Inc. | 41,200 | 2,423 |
| Africa Oil Corp. (SEK denominated)1,2 | 942,070 | 2,043 |
| Africa Oil Corp.1,5 | 91,004 | 189 |
| Africa Oil Corp.1 | 2,000 | 4 |
| 1,832,007 | ||
| Consumer staples 7.32% | ||
| Costco Wholesale Corp. | 2,580,000 | 365,715 |
| Coca-Cola Co. | 4,670,000 | 197,168 |
| Philip Morris International Inc. | 2,280,000 | 185,706 |
| PepsiCo, Inc. | 1,715,000 | 162,171 |
| Kerry Group PLC, Class A2 | 2,000,000 | 137,992 |
| CVS/Caremark Corp. | 1,090,000 | 104,978 |
| Nu Skin Enterprises, Inc., Class A | 2,000,000 | 87,400 |
| Sprouts Farmers Market, Inc.1 | 2,530,000 | 85,969 |
| Walgreens Boots Alliance, Inc. | 875,000 | 66,675 |
| Herbalife Ltd. | 1,704,594 | 64,263 |
| Glanbia PLC2 | 3,314,077 | 50,886 |
| Diageo PLC2 | 1,724,726 | 49,467 |
| TreeHouse Foods, Inc.1 | 472,766 | 40,436 |
| Raia Drogasil SA, ordinary nominative | 4,000,000 | 38,146 |
| Procter & Gamble Co. | 315,000 | 28,693 |
| 1,665,665 | ||
| Materials 2.17% | ||
| Potash Corp. of Saskatchewan Inc. | 4,000,000 | 141,280 |
| James Hardie Industries PLC (CDI)2 | 11,204,855 | 119,307 |
| Nucor Corp. | 1,250,000 | 61,313 |
| HudBay Minerals Inc. | 5,617,200 | 48,929 |
| First Quantum Minerals Ltd. | 3,429,400 | 48,734 |
| Mosaic Co. | 660,000 | 30,129 |
| Common stocks Materials (continued) | Shares | Value (000) |
| FMC Corp. | 397,400 | $22,664 |
| Dow Chemical Co. | 475,000 | 21,665 |
| 494,021 | ||
| Telecommunication services 0.19% | ||
| Orange2 | 1,589,000 | 27,023 |
| T-Mobile US, Inc.1 | 650,000 | 17,511 |
| 44,534 | ||
| Utilities 0.17% | ||
| Exelon Corp. | 1,025,000 | 38,007 |
| KGen Power Corp.1,2,4,5 | 3,166,128 | 886 |
| 38,893 | ||
| Miscellaneous 0.82% | ||
| Other common stocks in initial period of acquisition | 186,562 | |
| Total common stocks (cost: $14,434,935,000) | 21,739,196 | |
| Preferred securities 0.00% Miscellaneous 0.00% | ||
| Other preferred securities in initial period of acquisition | 827 | |
| Total preferred securities (cost: $2,353,000) | 827 | |
| Rights & warrants 0.08% Energy 0.08% | ||
| Kinder Morgan, Inc., warrants, expire 20171 | 4,088,400 | 17,417 |
| Total rights & warrants (cost: $17,736,000) | 17,417 | |
| Short-term securities 4.47% | Principal amount (000) | |
| Apple Inc. 0.11% due 1/9/20153 | $ 18,500 | 18,500 |
| Caterpillar Financial Services Corp. 0.12% due 2/19/2015 | 50,000 | 49,989 |
| Chariot Funding, LLC 0.17%–0.20% due 4/27/2015–4/29/20153 | 54,000 | 53,965 |
| Coca-Cola Co. 0.25% due 7/13/20153 | 55,000 | 54,935 |
| Fannie Mae 0.06%–0.10% due 4/6/2015–8/3/2015 | 90,000 | 89,959 |
| Federal Farm Credit Banks 0.08%–0.12% due 5/20/2015–7/28/2015 | 138,600 | 138,530 |
| Federal Home Loan Bank 0.05%–0.17% due 1/16/2015–8/18/2015 | 430,381 | 430,249 |
| Freddie Mac 0.06%–0.11% due 2/5/2015–4/14/2015 | 62,900 | 62,896 |
| General Electric Co. 0.10% due 1/2/2015 | 7,050 | 7,050 |
| Google Inc. 0.09%–0.15% due 2/25/2015–3/24/20153 | 38,400 | 38,392 |
| Intel Corp. 0.14% due 1/14/2015 | 25,000 | 24,999 |
| Jupiter Securitization Co., LLC 0.21% due 5/26/20153 | 25,000 | 24,975 |
| Private Export Funding Corp. 0.26% due 2/6/20153 | 7,000 | 6,999 |
| Regents of the University of California 0.12% due 2/23/2015 | 15,000 | 14,997 |
| Total short-term securities (cost: $1,016,410,000) | 1,016,435 | |
| Total investment securities 100.05% (cost: $15,471,434,000) | 22,773,875 | |
| Other assets less liabilities (0.05)% | (10,910) | |
| Net assets 100.00% | $22,762,965 |
| 1 | Security did not produce income during the last 12 months. |
| 2 | Valued under fair value procedures adopted by authority of the board of trustees. The total value of all such securities, including those in “Miscellaneous,“ was $1,832,419,000, which represented 8.05% of the net assets of the fund. This amount includes $1,809,130,000 related to certain securities trading outside the U.S. whose values were adjusted as a result of significant market movements following the close of local trading. |
| 3 | Acquired in a transaction exempt from registration under Rule 144A or Section 4(2) of the Securities Act of 1933. May be resold in the U.S. in transactions exempt from registration, normally to qualified institutional buyers. The total value of all such securities was $207,006,000, which represented .91% of the net assets of the fund. |
| 4 | Represents an affiliated company as defined under the Investment Company Act of 1940. |
| 5 | Acquired through a private placement transaction exempt from registration under the Securities Act of 1933. May be subject to legal or contractual restrictions on resale. Further details on this holding appear below. |
| Private placement securities | Acquisition date | Cost (000) | Value (000) | Percent of net assets |
| Laricina Energy Ltd. | 6/21/2011 | $61,323 | $13,163 | .06% |
| KGen Power Corp. | 12/19/2006 | — | 886 | .00 |
| Africa Oil Corp. | 11/24/2014 | 801 | 189 | .00 |
| Total private placement securities | $62,124 | $14,238 | .06% |
| Key to abbreviations |
| ADR = American Depositary Receipts |
| CDI = CREST Depository Interest |
| SEK = Swedish kronor |
| Common stocks 92.68% Financials 19.59% | Shares | Value (000) |
| AIA Group Ltd.1 | 34,668,700 | $190,902 |
| Axis Bank Ltd.1 | 22,781,004 | 179,974 |
| Barclays PLC1 | 37,251,875 | 140,048 |
| Prudential PLC1 | 4,688,265 | 107,887 |
| HDFC Bank Ltd.1 | 5,164,608 | 77,452 |
| Credit Suisse Group AG1 | 2,879,624 | 72,189 |
| Sun Hung Kai Properties Ltd.1 | 4,412,783 | 66,728 |
| UniCredit SpA1 | 10,059,241 | 64,113 |
| Housing Development Finance Corp. Ltd.1 | 3,333,000 | 59,628 |
| Henderson Land Development Co. Ltd.1 | 8,419,450 | 58,443 |
| BNP Paribas SA1 | 966,046 | 56,769 |
| Commerzbank AG, non-registered shares1,2 | 4,267,872 | 56,697 |
| ICICI Bank Ltd.1 | 5,810,450 | 32,272 |
| China Overseas Land & Investment Ltd.1 | 9,866,000 | 29,117 |
| UBS Group AG1,2 | 1,563,651 | 26,879 |
| Sberbank of Russia (ADR)1 | 6,554,000 | 26,336 |
| Cheung Kong (Holdings) Ltd.1 | 1,450,000 | 24,195 |
| HSBC Holdings PLC (HKD denominated)1 | 2,522,795 | 24,001 |
| Assicurazioni Generali SpA1 | 1,100,000 | 22,479 |
| Siam Commercial Bank PCL1 | 3,945,100 | 21,796 |
| AEON Financial Service Co., Ltd.1 | 975,000 | 19,060 |
| ING Groep NV, depository receipts1,2 | 1,183,000 | 15,317 |
| Bankia, SA1,2 | 10,320,309 | 15,300 |
| Investor AB, Class B1 | 407,632 | 14,772 |
| Société Générale1 | 350,575 | 14,732 |
| Link Real Estate Investment Trust1 | 2,063,732 | 12,882 |
| RSA Insurance Group PLC1,2 | 1,787,250 | 12,028 |
| AXA SA1 | 497,312 | 11,486 |
| Bank of the Philippine Islands1 | 5,405,000 | 11,309 |
| Svenska Handelsbanken AB, Class A1 | 230,000 | 10,739 |
| Bank of Ireland1,2 | 22,000,000 | 8,193 |
| Sumitomo Mitsui Financial Group, Inc.1 | 212,400 | 7,675 |
| Industrial and Commercial Bank of China Ltd., Class H1 | 9,119,950 | 6,625 |
| Eurobank Ergasias SA1,2 | 29,325,523 | 6,517 |
| Mizuho Financial Group, Inc.1 | 1,990,200 | 3,344 |
| Shinsei Bank, Ltd.1 | 1,855,000 | 3,239 |
| 1,511,123 | ||
| Consumer discretionary 15.11% | ||
| Volkswagen AG, nonvoting preferred1 | 492,162 | 109,935 |
| Numericable Group SA, non-registered shares1,2 | 2,011,856 | 99,205 |
| Sands China Ltd.1 | 16,642,000 | 80,943 |
| Altice SA1,2 | 1,014,127 | 80,027 |
| Toyota Motor Corp.1 | 876,200 | 54,640 |
| Melco Crown Entertainment Ltd. (ADR) | 1,985,000 | 50,419 |
| Daimler AG1 | 592,000 | 49,391 |
| Common stocks Consumer discretionary (continued) | Shares | Value (000) |
| Li & Fung Ltd.1 | 50,242,000 | $46,986 |
| H & M Hennes & Mauritz AB, Class B1 | 1,132,000 | 46,957 |
| Galaxy Entertainment Group Ltd.1 | 8,363,000 | 46,554 |
| Mahindra & Mahindra Ltd.1 | 2,262,000 | 44,038 |
| Techtronic Industries Co. Ltd.1 | 13,116,000 | 42,033 |
| Kering SA1 | 187,233 | 35,997 |
| Tata Motors Ltd.1 | 4,025,000 | 31,391 |
| PT Astra International Tbk1 | 49,710,000 | 29,506 |
| Shangri-La Asia Ltd.1 | 20,660,571 | 28,430 |
| adidas AG1 | 395,408 | 27,559 |
| Renault SA1 | 354,148 | 25,880 |
| PT Surya Citra Media Tbk1 | 88,000,000 | 24,887 |
| Cie. Générale des Établissements Michelin1 | 273,934 | 24,835 |
| Genting Singapore PLC1 | 22,971,000 | 18,612 |
| Hyundai Mobis Co., Ltd.1 | 85,000 | 18,091 |
| Liberty Global PLC, Class A2 | 206,300 | 10,357 |
| Liberty Global PLC, Class C2 | 144,900 | 7,000 |
| Porsche Automobil Holding SE, nonvoting preferred1 | 212,300 | 17,250 |
| Global Brands Group Holding Ltd.1,2 | 73,060,000 | 14,281 |
| SEGA SAMMY HOLDINGS INC.1 | 1,020,000 | 13,086 |
| Nissan Motor Co., Ltd.1 | 1,471,000 | 12,813 |
| Hermès International1 | 33,622 | 11,989 |
| Industria de Diseño Textil, SA1 | 417,500 | 11,963 |
| Kia Motors Corp.1 | 230,000 | 10,867 |
| Hyundai Motor Co.1 | 70,000 | 10,627 |
| Kingfisher PLC1 | 1,896,000 | 9,991 |
| Panasonic Corp.1 | 840,500 | 9,875 |
| Bajaj Auto Ltd.1 | 181,000 | 6,950 |
| Daily Mail and General Trust PLC, Class A, nonvoting1 | 135,000 | 1,733 |
| 1,165,098 | ||
| Health care 14.05% | ||
| Novartis AG1 | 3,642,900 | 335,028 |
| Bayer AG1 | 1,819,055 | 248,682 |
| Novo Nordisk A/S, Class B1 | 2,309,340 | 97,712 |
| Grifols, SA, Class B, non-registered shares1 | 1,735,509 | 58,951 |
| Grifols, SA, Class A, non-registered shares1 | 440,500 | 17,535 |
| Grifols, SA, Class B (ADR) | 396,845 | 13,489 |
| Fresenius SE & Co. KGaA1 | 1,381,806 | 72,158 |
| UCB SA1 | 900,000 | 68,301 |
| Merck KGaA1 | 620,000 | 58,817 |
| Fresenius Medical Care AG & Co. KGaA1 | 537,000 | 40,190 |
| Teva Pharmaceutical Industries Ltd. (ADR) | 635,000 | 36,519 |
| Dr. Reddy’s Laboratories Ltd.1 | 400,000 | 20,577 |
| Sonic Healthcare Ltd.1 | 681,000 | 10,227 |
| Pharmstandard OJSC (GDR)1,2 | 705,600 | 4,246 |
| Lupin Ltd.1 | 43,311 | 980 |
| 1,083,412 | ||
| Information technology 11.49% | ||
| Baidu, Inc., Class A (ADR)2 | 790,000 | 180,096 |
| Samsung Electronics Co. Ltd.1 | 137,640 | 165,450 |
| Murata Manufacturing Co., Ltd.1 | 757,100 | 82,701 |
| ASML Holding NV1 | 617,834 | 66,192 |
| Tencent Holdings Ltd.1 | 4,262,500 | 61,160 |
| Common stocks Information technology (continued) | Shares | Value (000) |
| Gemalto NV1 | 709,453 | $57,952 |
| MediaTek Inc.1 | 3,463,000 | 50,414 |
| Nintendo Co., Ltd.1 | 476,100 | 49,620 |
| NetEase, Inc. (ADR) | 451,673 | 44,779 |
| Alibaba Group Holding Ltd. (ADR)2 | 256,600 | 26,671 |
| Samsung SDI Co., Ltd.1 | 254,899 | 26,501 |
| Infineon Technologies AG1 | 1,508,440 | 16,172 |
| Yandex NV, Class A2 | 852,600 | 15,313 |
| Delta Electronics, Inc.1 | 2,269,623 | 13,486 |
| Tech Mahindra Ltd.1 | 320,212 | 13,134 |
| Keyence Corp.1 | 22,100 | 9,789 |
| Mail.Ru Group Ltd. (GDR)1,2 | 400,000 | 6,460 |
| 885,890 | ||
| Industrials 11.01% | ||
| Ryanair Holdings PLC (ADR)2 | 1,654,800 | 117,937 |
| SMC Corp.1 | 440,100 | 114,605 |
| Jardine Matheson Holdings Ltd.1 | 1,217,600 | 74,092 |
| Legrand SA1 | 1,180,000 | 61,772 |
| Airbus Group NV1 | 1,140,514 | 56,646 |
| KONE Oyj, Class B1 | 1,211,900 | 55,042 |
| Schneider Electric SE1 | 647,950 | 47,081 |
| Bureau Veritas SA1 | 1,941,096 | 42,863 |
| Babcock International Group PLC1 | 2,374,615 | 38,851 |
| easyJet PLC1 | 1,282,446 | 33,102 |
| Hutchison Whampoa Ltd.1 | 2,779,000 | 31,816 |
| Rolls-Royce Holdings PLC1,2 | 2,033,986 | 27,400 |
| ASSA ABLOY AB, Class B1 | 498,000 | 26,318 |
| Komatsu Ltd.1 | 1,008,000 | 22,347 |
| China State Construction International Holdings Ltd.1 | 13,878,000 | 19,392 |
| Groupe Eurotunnel SA1 | 1,288,727 | 16,636 |
| Siemens AG1 | 143,300 | 16,252 |
| DP World Ltd. | 550,859 | 11,568 |
| ITOCHU Corp.1 | 800,000 | 8,553 |
| Rexel SA1 | 440,277 | 7,862 |
| SGS SA1 | 3,700 | 7,544 |
| VINCI, SA1 | 110,441 | 6,043 |
| Andritz AG1 | 93,000 | 5,111 |
| 848,833 | ||
| Consumer staples 5.79% | ||
| Nestlé SA1 | 1,836,700 | 134,633 |
| Pernod Ricard SA1 | 840,200 | 93,159 |
| Associated British Foods PLC1 | 1,443,588 | 70,138 |
| British American Tobacco PLC1 | 612,000 | 33,252 |
| ITC Ltd.1 | 3,035,000 | 17,670 |
| Japan Tobacco Inc.1 | 570,000 | 15,651 |
| Danone SA1 | 226,867 | 14,925 |
| PT Indofood Sukses Makmur Tbk1 | 24,400,000 | 13,302 |
| Reckitt Benckiser Group PLC1 | 147,500 | 11,899 |
| SABMiller PLC1 | 217,400 | 11,251 |
| Orion Corp.1 | 10,790 | 9,924 |
| Hypermarcas SA, ordinary nominative2 | 1,280,000 | 8,017 |
| Common stocks Consumer staples (continued) | Shares | Value (000) |
| Alimentation Couche-Tard Inc., Class B | 184,500 | $7,732 |
| Treasury Wine Estates Ltd.1 | 1,341,000 | 5,217 |
| 446,770 | ||
| Materials 3.98% | ||
| Syngenta AG1 | 189,900 | 60,977 |
| Rio Tinto PLC1 | 1,062,000 | 48,929 |
| BASF SE1 | 421,000 | 35,589 |
| Grasim Industries Ltd.1 | 502,785 | 26,921 |
| Grasim Industries Ltd. (GDR)1 | 131,304 | 7,030 |
| Linde AG1 | 181,100 | 33,779 |
| Anhui Conch Cement Co. Ltd., Class H1 | 6,195,000 | 23,103 |
| ArcelorMittal1 | 1,846,400 | 19,999 |
| Fortescue Metals Group Ltd.1 | 6,495,000 | 14,313 |
| Amcor Ltd.1 | 1,240,000 | 13,646 |
| First Quantum Minerals Ltd. | 630,000 | 8,953 |
| Givaudan SA1 | 4,632 | 8,282 |
| Akzo Nobel NV1 | 73,350 | 5,086 |
| 306,607 | ||
| Utilities 3.46% | ||
| Power Grid Corp. of India Ltd.1 | 68,214,040 | 148,711 |
| ENN Energy Holdings Ltd.1 | 9,758,000 | 55,182 |
| SSE PLC1 | 1,439,741 | 36,144 |
| GDF SUEZ1 | 605,515 | 14,142 |
| PT Perusahaan Gas Negara (Persero) Tbk1 | 25,650,000 | 12,355 |
| 266,534 | ||
| Telecommunication services 2.96% | ||
| SoftBank Corp.1 | 2,175,700 | 129,481 |
| MTN Group Ltd.1 | 2,712,400 | 51,473 |
| China Telecom Corp. Ltd., Class H1 | 32,600,000 | 19,158 |
| TIM Participações SA, ordinary nominative | 2,344,000 | 10,388 |
| China Unicom (Hong Kong) Ltd.1 | 7,450,000 | 9,997 |
| Intouch Holdings PCL1 | 3,391,000 | 8,073 |
| Bayan Telecommunications Holdings Corp., Class A1,2,3 | 43,010 | — |
| Bayan Telecommunications Holdings Corp., Class B1,2,3 | 14,199 | — |
| 228,570 | ||
| Energy 2.79% | ||
| Royal Dutch Shell PLC, Class B1 | 1,730,000 | 59,432 |
| Royal Dutch Shell PLC, Class A (GBP denominated)1 | 461,000 | 15,281 |
| BG Group PLC1 | 2,926,700 | 38,957 |
| Canadian Natural Resources, Ltd. | 965,700 | 29,857 |
| BP PLC1 | 4,373,437 | 27,770 |
| INPEX CORP.1 | 1,898,000 | 21,059 |
| Suncor Energy Inc. | 261,000 | 8,290 |
| Gazprom OJSC (ADR)1 | 1,713,500 | 7,925 |
| Eni SpA1 | 397,035 | 6,934 |
| 215,505 | ||
| Miscellaneous 2.45% | ||
| Other common stocks in initial period of acquisition | 188,732 | |
| Total common stocks (cost: $5,674,301,000) | 7,147,074 |
| Bonds, notes & other debt instruments 0.62% U.S. Treasury bonds & notes 0.55% U.S. Treasury 0.55% | Principal amount (000) | Value (000) |
| U.S. Treasury 0.25% 2015 | $28,200 | $28,222 |
| U.S. Treasury 0.375% 2015 | 14,100 | 14,114 |
| Total U.S. Treasury bonds & notes | 42,336 | |
| Bonds & notes of governments outside the U.S. 0.07% | ||
| Argentina (Republic of) 7.00% 2015 | 6,110 | 5,954 |
| Total bonds, notes & other debt instruments (cost: $48,208,000) | 48,290 | |
| Short-term securities 6.38% | ||
| American Honda Finance Corp. 0.11% due 2/9/2015 | 51,600 | 51,592 |
| Bank of Nova Scotia 0.17%–0.18% due 1/13/2015–1/26/20154 | 91,600 | 91,595 |
| Bank of Tokyo-Mitsubishi UFJ, Ltd. 0.16%–0.21% due 1/6/2015–1/22/20154 | 27,500 | 27,499 |
| Canadian Imperial Holdings Inc. 0.20% due 1/26/2015 | 25,000 | 24,997 |
| Fannie Mae 0.09% due 1/7/2015 | 9,600 | 9,600 |
| Federal Home Loan Bank 0.09%–0.10% due 2/18/2015–4/17/2015 | 65,600 | 65,596 |
| General Electric Co. 0.10% due 1/2/2015 | 14,800 | 14,800 |
| GlaxoSmithKline Finance PLC 0.16% due 1/22/20154 | 10,700 | 10,699 |
| Mizuho Funding LLC 0.19%–0.21% due 1/5/2015–2/17/20154 | 73,500 | 73,487 |
| Nordea Bank AB 0.19% due 4/1/20154 | 40,000 | 39,983 |
| Old Line Funding, LLC 0.17%–0.24% due 1/26/2015–6/5/20154 | 50,300 | 50,272 |
| Svenska Handelsbanken Inc. 0.19% due 2/2/20154 | 19,100 | 19,098 |
| Toronto-Dominion Holdings USA Inc. 0.12% due 1/16/20154 | 12,700 | 12,699 |
| Total short-term securities (cost: $491,905,000) | 491,917 | |
| Total investment securities 99.68% (cost: $6,214,414,000) | 7,687,281 | |
| Other assets less liabilities 0.32% | 24,573 | |
| Net assets 100.00% | $7,711,854 |
| 1 | Valued under fair value procedures adopted by authority of the board of trustees. The total value of all such securities, including those in “Miscellaneous,“ was $6,549,203,000, which represented 84.92% of the net assets of the fund. This amount includes $6,542,173,000 related to certain securities trading outside the U.S. whose values were adjusted as a result of significant market movements following the close of local trading. |
| 2 | Security did not produce income during the last 12 months. |
| 3 | Acquired through a private placement transaction exempt from registration under the Securities Act of 1933. May be subject to legal or contractual restrictions on resale. Further details on these holdings appear below. |
| 4 | Acquired in a transaction exempt from registration under Section 4(2) of the Securities Act of 1933. May be resold in the U.S. in transactions exempt from registration, normally to qualified institutional buyers. The total value of all such securities was $303,632,000, which represented 3.94% of the net assets of the fund. |
| Private placement securities | Acquisition dates | Cost (000) | Value (000) | Percent of net assets |
| Bayan Telecommunications Holdings Corp., Class A | 2/11/1998-8/31/1998 | $104 | $— | .00% |
| Bayan Telecommunications Holdings Corp., Class B | 2/11/1998-8/31/1998 | 34 | — | .00 |
| Total private placement securities | $138 | $— | .00% |
| Key to abbreviations |
| ADR = American Depositary Receipts |
| GDR = Global Depositary Receipts |
| GBP = British pounds |
| HKD = Hong Kong dollars |
| Common stocks 75.75% Information technology 13.41% | Shares | Value (000) |
| Alcatel-Lucent1,2 | 16,426,961 | $58,319 |
| Baidu, Inc., Class A (ADR)1 | 184,700 | 42,106 |
| Google Inc., Class A1 | 37,400 | 19,847 |
| Google Inc., Class C1 | 37,400 | 19,687 |
| Taiwan Semiconductor Manufacturing Co. Ltd.2 | 5,322,000 | 23,485 |
| Taiwan Semiconductor Manufacturing Co. Ltd. (ADR) | 540,000 | 12,085 |
| Murata Manufacturing Co., Ltd.2 | 301,000 | 32,879 |
| Infosys Ltd.2 | 798,222 | 24,826 |
| Cognizant Technology Solutions Corp., Class A1 | 435,000 | 22,907 |
| AAC Technologies Holdings Inc.2 | 3,139,500 | 16,684 |
| Mail.Ru Group Ltd. (GDR)1,2 | 737,359 | 11,908 |
| Hexagon AB, Class B2 | 357,000 | 11,040 |
| ASM Pacific Technology Ltd.2 | 1,141,800 | 10,855 |
| Tencent Holdings Ltd.2 | 566,500 | 8,128 |
| MasterCard Inc., Class A | 90,000 | 7,754 |
| Yandex NV, Class A1 | 299,214 | 5,374 |
| EPAM Systems, Inc.1 | 90,500 | 4,321 |
| Wirecard AG2 | 96,000 | 4,235 |
| STMicroelectronics NV2 | 500,147 | 3,730 |
| TDK Corp.2 | 59,000 | 3,476 |
| OMRON Corp.2 | 55,000 | 2,465 |
| 346,111 | ||
| Financials 12.85% | ||
| ICICI Bank Ltd.2 | 5,603,830 | 31,125 |
| ICICI Bank Ltd. (ADR) | 1,000,000 | 11,550 |
| AEON Financial Service Co., Ltd.2 | 1,740,000 | 34,016 |
| Citigroup Inc. | 560,000 | 30,302 |
| Fibra Uno Administración, SA de CV | 9,301,578 | 27,412 |
| Housing Development Finance Corp. Ltd.2 | 1,353,000 | 24,205 |
| Grupo Financiero Santander México, SAB de CV, Class B (ADR) | 2,230,000 | 23,103 |
| American Tower Corp. | 225,000 | 22,241 |
| HDFC Bank Ltd. (ADR) | 208,400 | 10,576 |
| HDFC Bank Ltd.2 | 390,000 | 5,849 |
| Kotak Mahindra Bank Ltd.2 | 823,886 | 16,404 |
| Eurobank Ergasias SA1,2 | 58,050,000 | 12,900 |
| Agricultural Bank of China, Class H2 | 24,315,000 | 12,212 |
| Bangkok Bank PCL, nonvoting depository receipt2 | 1,800,000 | 10,566 |
| IDFC Ltd.2 | 3,300,000 | 8,151 |
| AIA Group Ltd.2 | 1,391,600 | 7,663 |
| Banco Santander, SA1,2 | 872,813 | 7,298 |
| Sberbank of Russia (ADR)2 | 1,150,000 | 4,621 |
| Sberbank of Russia (ADR) | 682,500 | 2,643 |
| Piraeus Bank SA1,2 | 6,600,000 | 7,261 |
| ACE Ltd. | 54,000 | 6,204 |
| Ping An Insurance (Group) Co. of China, Ltd., Class H2 | 538,000 | 5,439 |
| Common stocks Financials (continued) | Shares | Value (000) |
| Prudential PLC2 | 181,320 | $4,173 |
| Metropolitan Bank & Trust Co.2 | 1,842,750 | 3,397 |
| Banco Industrial e Comercial SA, preferred nominative | 512,900 | 1,100 |
| MMI Holdings Ltd.2 | 323,208 | 838 |
| FirstRand Ltd.2 | 132,000 | 572 |
| Ayala Land, Inc., preference shares1,2 | 15,000,000 | 34 |
| China Construction Bank Corp., Class H2 | 535 | — |
| 331,855 | ||
| Consumer discretionary 12.33% | ||
| Naspers Ltd., Class N2 | 309,919 | 39,901 |
| Domino’s Pizza, Inc. | 418,000 | 39,363 |
| Ctrip.com International, Ltd. (ADR)1 | 718,500 | 32,692 |
| Maruti Suzuki India Ltd.2 | 519,500 | 27,311 |
| Toyota Motor Corp.2 | 398,900 | 24,876 |
| Arcos Dorados Holdings Inc., Class A | 4,289,656 | 23,207 |
| Zee Entertainment Enterprises Ltd.2 | 3,832,000 | 23,011 |
| Melco International Development Ltd.2 | 8,155,000 | 17,854 |
| Kroton Educacional SA, ordinary nominative | 2,740,000 | 15,977 |
| NIKE, Inc., Class B | 117,000 | 11,250 |
| Hyundai Mobis Co., Ltd.2 | 35,976 | 7,657 |
| Hero MotoCorp Ltd.2 | 150,000 | 7,385 |
| Nokian Renkaat Oyj2 | 300,000 | 7,348 |
| JD.com, Inc., Class A (ADR)1 | 313,510 | 7,255 |
| L’Occitane International SA2 | 2,715,000 | 6,832 |
| Publicis Groupe SA2 | 89,807 | 6,432 |
| Industria de Diseño Textil, SA2 | 180,000 | 5,157 |
| Swatch Group Ltd, non-registered shares2 | 8,450 | 3,752 |
| Swatch Group Ltd2 | 11,600 | 1,003 |
| Dufry AG1,2 | 27,528 | 4,081 |
| Mr Price Group Ltd.2 | 156,420 | 3,160 |
| Wynn Macau, Ltd.2 | 997,000 | 2,779 |
| 318,283 | ||
| Consumer staples 8.80% | ||
| LT Group, Inc.2 | 104,395,900 | 28,302 |
| Pernod Ricard SA2 | 208,900 | 23,162 |
| Lenta Ltd. (GDR)1,2 | 3,267,900 | 22,088 |
| ITC Ltd.2 | 3,715,000 | 21,630 |
| Nestlé SA2 | 293,696 | 21,528 |
| Magnit OJSC (GDR)2 | 388,100 | 17,501 |
| Coca-Cola Co. | 405,000 | 17,099 |
| British American Tobacco PLC2 | 293,000 | 15,920 |
| United Breweries Ltd.2 | 874,904 | 11,500 |
| Grupo Nutresa SA | 827,458 | 9,958 |
| Kimberly-Clark de México, SAB de CV, Class A | 3,900,000 | 8,483 |
| Unilever NV, depository receipts2 | 200,000 | 7,857 |
| Shoprite Holdings Ltd.2 | 450,000 | 6,514 |
| Procter & Gamble Co. | 60,000 | 5,465 |
| PepsiCo, Inc. | 50,000 | 4,728 |
| SABMiller PLC2 | 63,500 | 3,286 |
| Coca-Cola Icecek AS, Class C2 | 100,000 | 2,162 |
| 227,183 |
| Common stocks Health care 6.84% | Shares | Value (000) |
| Novo Nordisk A/S, Class B2 | 1,035,600 | $43,818 |
| Novartis AG2 | 280,500 | 25,797 |
| Novartis AG (ADR) | 134,000 | 12,416 |
| Krka, dd, Novo mesto2 | 232,246 | 16,756 |
| Merck & Co., Inc. | 260,000 | 14,766 |
| Cochlear Ltd.2 | 225,000 | 14,201 |
| Teva Pharmaceutical Industries Ltd. (ADR) | 200,000 | 11,502 |
| AstraZeneca PLC2 | 128,000 | 9,004 |
| Thermo Fisher Scientific Inc. | 52,000 | 6,515 |
| Grifols, SA, Class B (ADR) | 97,473 | 3,313 |
| Grifols, SA, Class A, non-registered shares2 | 73,576 | 2,929 |
| PerkinElmer, Inc. | 140,000 | 6,122 |
| Hikma Pharmaceuticals PLC2 | 170,000 | 5,213 |
| PT Kalbe Farma Tbk2 | 27,870,000 | 4,119 |
| 176,471 | ||
| Energy 6.70% | ||
| Reliance Industries Ltd.2 | 3,042,302 | 42,796 |
| Royal Dutch Shell PLC, Class B2 | 600,000 | 20,612 |
| Royal Dutch Shell PLC, Class B (ADR) | 95,000 | 6,608 |
| InterOil Corp.1 | 518,000 | 25,273 |
| Oil Search Ltd.2 | 2,716,613 | 17,551 |
| Galp Energia, SGPS, SA, Class B2 | 1,426,775 | 14,435 |
| Pacific Rubiales Energy Corp. | 1,770,600 | 10,958 |
| Oil and Gas Development Co. Ltd.2 | 4,000,000 | 8,171 |
| Cobalt International Energy, Inc.1 | 869,800 | 7,732 |
| Noble Energy, Inc. | 134,000 | 6,356 |
| Petróleo Brasileiro SA - Petrobras, ordinary nominative (ADR) | 700,000 | 5,110 |
| Africa Oil Corp.1 | 1,453,099 | 3,014 |
| Africa Oil Corp.1,2 | 71,775 | 156 |
| China Petroleum & Chemical Corp., Class H2 | 3,510,000 | 2,842 |
| Oceaneering International, Inc. | 21,000 | 1,235 |
| African Petroleum Corp. Ltd.1,2 | 4,979,942 | 163 |
| 173,012 | ||
| Industrials 4.12% | ||
| Cummins Inc. | 198,000 | 28,546 |
| Airbus Group NV2 | 431,929 | 21,453 |
| ASSA ABLOY AB, Class B2 | 330,886 | 17,486 |
| Chart Industries, Inc.1 | 437,500 | 14,962 |
| United Technologies Corp. | 63,000 | 7,245 |
| Rolls-Royce Holdings PLC1,2 | 480,000 | 6,466 |
| Toshiba Corp.2 | 1,000,000 | 4,234 |
| Spirax-Sarco Engineering PLC2 | 87,600 | 3,893 |
| CIMC Enric Holdings Ltd.2 | 2,728,000 | 2,158 |
| 106,443 | ||
| Telecommunication services 2.76% | ||
| Reliance Communications Ltd.1,2 | 23,578,631 | 29,696 |
| Globe Telecom, Inc.2 | 441,000 | 16,935 |
| SoftBank Corp.2 | 282,200 | 16,794 |
| China Telecom Corp. Ltd., Class H2 | 5,947,000 | 3,495 |
| Common stocks Telecommunication services (continued) | Shares | Value (000) |
| Hellenic Telecommunications Organization SA1,2 | 247,500 | $2,701 |
| MegaFon OJSC (GDR)2 | 122,500 | 1,680 |
| 71,301 | ||
| Materials 1.92% | ||
| First Quantum Minerals Ltd. | 1,297,000 | 18,431 |
| Tianhe Chemicals Group Ltd.1,2 | 81,100,000 | 12,117 |
| Holcim Ltd2 | 92,000 | 6,533 |
| L’Air Liquide SA, bonus shares2 | 45,000 | 5,553 |
| Glencore PLC2 | 850,000 | 3,913 |
| Anhui Conch Cement Co. Ltd., Class H2 | 808,000 | 3,013 |
| 49,560 | ||
| Utilities 1.57% | ||
| Power Grid Corp. of India Ltd.2 | 7,459,630 | 16,262 |
| Cheung Kong Infrastructure Holdings Ltd.2 | 1,020,000 | 7,517 |
| China Resources Gas Group Ltd.2 | 2,400,000 | 6,208 |
| Infraestructura Energética Nova, SAB de CV | 1,139,700 | 5,701 |
| ENN Energy Holdings Ltd.2 | 848,000 | 4,796 |
| 40,484 | ||
| Miscellaneous 4.45% | ||
| Other common stocks in initial period of acquisition | 114,856 | |
| Total common stocks (cost: $1,833,406,000) | 1,955,559 | |
| Preferred securities 0.04% Consumer discretionary 0.04% | ||
| Zee Entertainment Enterprises Ltd., 6.00% preferred, expires 2022 | 80,472,000 | 1,083 |
| Total preferred securities (cost: $570,000) | 1,083 | |
| Bonds, notes & other debt instruments 7.38% Bonds & notes of governments & government agencies outside the U.S. 5.79% | Principal amount (000) | |
| Argentina (Republic of) 7.00% 2017 | $7,395 | 7,041 |
| Brazil (Federal Republic of) 10.00% 2017 | BRL3,100 | 1,107 |
| Brazil (Federal Republic of) 6.00% 20203 | 2,925 | 1,079 |
| Brazil (Federal Republic of) 10.00% 2023 | 3,010 | 999 |
| Brazil (Federal Republic of) 10.00% 2025 | 1,990 | 652 |
| Brazil (Federal Republic of) 6.00% 20453 | 2,034 | 742 |
| Colombia (Republic of), Series B, 5.00% 2018 | COP4,541,700 | 1,862 |
| Colombia (Republic of), Series B, 10.00% 2024 | 2,570,000 | 1,292 |
| Colombia (Republic of), Series B, 6.00% 2028 | 8,470,300 | 3,110 |
| Colombia (Republic of) Global 4.375% 2021 | $1,100 | 1,166 |
| Colombia (Republic of) Global 4.00% 2024 | 400 | 410 |
| Colombia (Republic of) Global 6.125% 2041 | 1,100 | 1,325 |
| Colombia (Republic of) Global 5.625% 2044 | 200 | 226 |
| Croatian Government 6.75% 20194 | 1,650 | 1,815 |
| Croatian Government 6.625% 2020 | 880 | 969 |
| Croatian Government 6.375% 20214 | 1,000 | 1,098 |
| Croatian Government 5.50% 20234 | 200 | 208 |
| Dominican Republic 9.04% 20184,5 | 65 | 69 |
| Dominican Republic 7.50% 20214,5 | 1,000 | 1,101 |
| Bonds, notes & other debt instruments Bonds & notes of governments & government agencies outside the U.S. (continued) | Principal amount (000) | Value (000) |
| Dominican Republic 7.50% 20215 | $250 | $275 |
| Dominican Republic 8.625% 20274,5 | 1,150 | 1,357 |
| Dominican Republic 7.45% 20444 | 3,525 | 3,872 |
| Ghana (Republic of) 8.50% 2017 | 200 | 201 |
| Ghana (Republic of) 8.125% 20264,5 | 975 | 904 |
| Greek Government 2.00%/3.00% 20236 | €105 | 81 |
| Greek Government 2.00%/3.00% 20246 | 105 | 80 |
| Greek Government 2.00%/3.00% 20256 | 105 | 76 |
| Greek Government 2.00%/3.00% 20266 | 105 | 73 |
| Greek Government 2.00%/3.00% 20276 | 105 | 71 |
| Greek Government 2.00%/3.00% 20286 | 105 | 69 |
| Greek Government 2.00%/3.00% 20296 | 190 | 123 |
| Greek Government 2.00%/3.00% 20306 | 190 | 122 |
| Greek Government 2.00%/3.00% 20316 | 190 | 121 |
| Greek Government 2.00%/3.00% 20326 | 190 | 119 |
| Greek Government 2.00%/3.00% 20336 | 190 | 119 |
| Greek Government 2.00%/3.00% 20346 | 190 | 118 |
| Greek Government 2.00%/3.00% 20356 | 190 | 117 |
| Greek Government 2.00%/3.00% 20366 | 260 | 159 |
| Greek Government 2.00%/3.00% 20376 | 260 | 157 |
| Greek Government 2.00%/3.00% 20386 | 260 | 158 |
| Greek Government 2.00%/3.00% 20396 | 260 | 159 |
| Greek Government 2.00%/3.00% 20406 | 260 | 159 |
| Greek Government 2.00%/3.00% 20416 | 260 | 159 |
| Greek Government 2.00%/3.00% 20426 | 260 | 160 |
| Hungarian Government 4.00% 2019 | $200 | 206 |
| Hungarian Government 6.25% 2020 | 2,925 | 3,302 |
| Hungarian Government 6.375% 2021 | 1,550 | 1,780 |
| Hungarian Government 5.375% 2023 | 640 | 697 |
| Hungarian Government, Series 23A, 6.00% 2023 | HUF155,840 | 708 |
| Hungarian Government 5.375% 2024 | $200 | 217 |
| Hungarian Government, Series 25B, 5.50% 2025 | HUF269,160 | 1,191 |
| India (Republic of) 7.28% 2019 | INR200,000 | 3,108 |
| India (Republic of) 8.83% 2023 | 110,000 | 1,835 |
| India (Republic of) 8.60% 2028 | 40,000 | 674 |
| Indonesia (Republic of) 5.875% 2020 | $3,650 | 4,061 |
| Indonesia (Republic of) 4.875% 20214 | 3,000 | 3,184 |
| Indonesia (Republic of) 4.875% 2021 | 605 | 642 |
| Indonesia (Republic of) 8.25% 2021 | IDR15,000,000 | 1,245 |
| Indonesia (Republic of) 5.25% 2042 | $1,100 | 1,115 |
| Indonesia (Republic of) 4.625% 2043 | 500 | 466 |
| Indonesia (Republic of) 6.75% 2044 | 1,745 | 2,164 |
| Indonesia (Republic of) 6.75% 20444 | 500 | 620 |
| Kenya (Republic of) 6.875% 20244 | 4,050 | 4,263 |
| Kenya (Republic of) 6.875% 2024 | 1,000 | 1,053 |
| Morocco Government 4.25% 2022 | 600 | 605 |
| Morocco Government 4.25% 20224 | 250 | 252 |
| Morocco Government 5.50% 2042 | 2,300 | 2,398 |
| Nigeria (Republic of) 5.125% 20184 | 475 | 472 |
| Nigeria (Republic of) 6.75% 20214 | 910 | 935 |
| Nigeria (Republic of) 6.375% 2023 | 2,200 | 2,172 |
| Nigeria (Republic of) 6.375% 20234 | 235 | 232 |
| Panama (Republic of) Global 8.875% 2027 | 300 | 437 |
| Panama (Republic of) Global 9.375% 2029 | 1,148 | 1,748 |
| Panama (Republic of) Global 6.70% 20365 | 859 | 1,115 |
| Bonds, notes & other debt instruments Bonds & notes of governments & government agencies outside the U.S. (continued) | Principal amount (000) | Value (000) |
| Peru (Republic of) 8.75% 2033 | $864 | $1,350 |
| Peru (Republic of) 6.55% 20375 | 782 | 1,019 |
| Perusahaan Penerbit SBSN 4.35% 20244 | 500 | 504 |
| Philippines (Republic of) 4.95% 2021 | PHP129,000 | 3,035 |
| Philippines (Republic of) 5.50% 2026 | $1,000 | 1,188 |
| Philippines (Republic of) 7.75% 2031 | 2,235 | 3,227 |
| Philippines (Republic of) 6.25% 2036 | PHP50,000 | 1,258 |
| Polish Government 5.00% 2022 | $1,100 | 1,235 |
| Polish Government, Series 102, 4.00% 2023 | PLN3,800 | 1,210 |
| Polish Government 4.00% 2024 | $1,650 | 1,759 |
| Russian Federation 6.20% 2018 | RUB120,950 | 1,573 |
| Russian Federation 7.50% 20305 | $2,260 | 2,349 |
| Russian Federation 7.50% 20304,5 | 2,231 | 2,319 |
| Slovenia (Republic of) 4.75% 20184 | 610 | 654 |
| Slovenia (Republic of) 4.125% 20194 | 200 | 210 |
| Slovenia (Republic of) 5.85% 20234 | 2,690 | 3,055 |
| Slovenia (Republic of) 5.85% 2023 | 300 | 341 |
| South Africa (Republic of) 5.50% 2020 | 200 | 220 |
| South Africa (Republic of), Series R-2023, 7.75% 2023 | ZAR21,325 | 1,836 |
| South Africa (Republic of) 4.665% 2024 | $950 | 988 |
| South Africa (Republic of), Series R-214, 6.50% 2041 | ZAR29,800 | 2,009 |
| Turkey (Republic of) 6.30% 2018 | TRY1,200 | 495 |
| Turkey (Republic of) 4.557% 20184 | $785 | 825 |
| Turkey (Republic of) 3.50% 20193 | TRY542 | 253 |
| Turkey (Republic of) 3.00% 20213 | 1,362 | 632 |
| Turkey (Republic of) 5.625% 2021 | $2,500 | 2,759 |
| Turkey (Republic of) 9.00% 2024 | TRY700 | 324 |
| Turkey (Republic of) 6.75% 2040 | $2,000 | 2,477 |
| Turkey (Republic of) 6.00% 2041 | 1,300 | 1,480 |
| United Mexican States Government, Series M, 5.00% 2017 | MXN10,000 | 695 |
| United Mexican States Government, Series M10, 7.75% 2017 | 10,000 | 742 |
| United Mexican States Government 2.50% 20203 | 18,470 | 1,282 |
| United Mexican States Government, Series M, 6.50% 2021 | 24,400 | 1,745 |
| United Mexican States Government, Series M20, 10.00% 2024 | 23,500 | 2,090 |
| United Mexican States Government Global 3.60% 2025 | $1,650 | 1,652 |
| United Mexican States Government 4.00% 20403 | MXN15,304 | 1,169 |
| United Mexican States Government Global, Series A, 5.625% 2017 | $1,152 | 1,253 |
| United Mexican States Government Global, Series A, 5.125% 2020 | 3,210 | 3,547 |
| United Mexican States Government Global, Series A, 3.625% 2022 | 2,100 | 2,150 |
| United Mexican States Government Global, Series A, 4.00% 2023 | 3,800 | 3,947 |
| United Mexican States Government Global, Series A, 6.05% 2040 | 1,280 | 1,572 |
| United Mexican States Government Global 5.55% 2045 | 2,200 | 2,563 |
| Uruguay (Republic of) 5.00% 20183 | UYU13,867 | 584 |
| Uruguay (Republic of) 4.375% 20283,5 | 13,204 | 545 |
| Venezuela (Republic of) 9.25% 2027 | $4,615 | 2,153 |
| Venezuela (Republic of) 9.25% 2028 | 750 | 333 |
| Zambia (Republic of) 5.375% 2022 | 1,450 | 1,345 |
| Zambia (Republic of) 8.50% 20244 | 1,200 | 1,316 |
| 149,444 | ||
| Corporate bonds & notes 0.92% Energy 0.41% | ||
| Ecopetrol SA 5.875% 2023 | 325 | 345 |
| Ecopetrol SA 5.875% 2045 | 550 | 511 |
| Gazprom OJSC 5.092% 20154 | 1,275 | 1,253 |
| Bonds, notes & other debt instruments Corporate bonds & notes (continued) Energy (continued) | Principal amount (000) | Value (000) |
| Gazprom OJSC 6.51% 20224 | $600 | $540 |
| Pemex Project Funding Master Trust, Series 13, 6.625% 2035 | 1,800 | 2,088 |
| Petróleos Mexicanos 5.50% 2021 | 845 | 919 |
| Petróleos Mexicanos 4.875% 2022 | 1,435 | 1,506 |
| Petróleos Mexicanos 3.50% 2023 | 420 | 403 |
| Petróleos Mexicanos 6.50% 2041 | 500 | 576 |
| Petróleos Mexicanos 5.50% 20444 | 1,025 | 1,051 |
| Petróleos Mexicanos 5.50% 2044 | 425 | 436 |
| PTT Exploration & Production Ltd. 5.692% 20214 | 400 | 445 |
| Ras Laffan Liquefied Natural Gas II 5.298% 20204,5 | 434 | 467 |
| 10,540 | ||
| Utilities 0.24% | ||
| AES Panamá, SA 6.35% 20164 | 1,100 | 1,144 |
| CEZ, a s 4.25% 20224 | 945 | 1,009 |
| Eskom Holdings Ltd. 5.75% 20214 | 2,985 | 3,015 |
| Eskom Holdings SOC Ltd. 5.75% 2021 | 1,000 | 1,010 |
| 6,178 | ||
| Financials 0.16% | ||
| Banco de Crédito del Perú 5.375% 20204 | 100 | 109 |
| Bank of India 3.625% 20184 | 700 | 716 |
| BBVA Bancomer SA 6.50% 20214 | 1,075 | 1,169 |
| HSBK (Europe) BV 7.25% 20214 | 1,125 | 1,111 |
| Magyar Export-Import Bank 4.00% 20204 | 605 | 603 |
| VEB Finance Ltd. 6.902% 2020 | 600 | 483 |
| 4,191 | ||
| Telecommunication services 0.08% | ||
| Digicel Group Ltd. 8.25% 20204 | 600 | 585 |
| Digicel Group Ltd. 6.00% 20214 | 750 | 703 |
| Digicel Group Ltd. 7.125% 20224 | 800 | 746 |
| 2,034 | ||
| Industrials 0.02% | ||
| Brunswick Rail Finance Ltd. 6.50% 2017 | 850 | 374 |
| Brunswick Rail Finance Ltd. 6.50% 20174 | 550 | 242 |
| 616 | ||
| Consumer discretionary 0.01% | ||
| Grupo Televisa, SAB 7.25% 2043 | MXN2,000 | 117 |
| Total corporate bonds & notes | 23,676 | |
| U.S. Treasury bonds & notes 0.67% U.S. Treasury 0.67% | ||
| U.S. Treasury 4.00% 2015 | $17,200 | 17,281 |
| Total U.S. Treasury bonds & notes | 17,281 | |
| Total bonds, notes & other debt instruments (cost: $193,381,000) | 190,401 |
| Short-term securities 16.83% | Principal amount (000) | Value (000) |
| Abbott Laboratories 0.10% due 2/2/20154 | $10,000 | $9,999 |
| CAFCO, LLC 0.12% due 1/16/2015 | 25,000 | 24,999 |
| Chevron Corp. 0.11%–0.14% due 2/9/2015–4/14/20154 | 40,000 | 39,984 |
| ExxonMobil Corp. 0.14% due 3/2/2015 | 5,000 | 4,999 |
| Fannie Mae 0.05%–0.09% due 1/20/2015–5/4/2015 | 45,782 | 45,778 |
| Federal Home Loan Bank 0.05%–0.11% due 1/16/2015–2/6/2015 | 109,600 | 109,598 |
| General Electric Co. 0.10% due 1/2/2015 | 9,400 | 9,400 |
| Intel Corp. 0.14% due 1/14/2015 | 20,000 | 19,999 |
| KfW 0.11% due 1/16/20154 | 12,600 | 12,599 |
| Mitsubishi UFJ Trust and Banking Corp. 0.17% due 1/9/20154 | 10,000 | 10,000 |
| Nordea Bank AB 0.18% due 1/8/20154 | 12,300 | 12,300 |
| Province of Ontario 0.10% due 2/13/2015 | 40,000 | 39,996 |
| Sumitomo Mitsui Banking Corp. 0.12% due 1/13/20154 | 14,900 | 14,899 |
| Svenska Handelsbanken Inc. 0.20% due 2/20/20154 | 20,000 | 19,996 |
| Victory Receivables Corp. 0.17%–0.19% due 1/16/2015–1/28/20154 | 60,000 | 59,995 |
| Total short-term securities (cost: $434,535,000) | 434,541 | |
| Total investment securities 100.00% (cost: $2,461,892,000) | 2,581,584 | |
| Other assets less liabilities (0.00)% | (106) | |
| Net assets 100.00% | $2,581,478 |
| 1 | Security did not produce income during the last 12 months. |
| 2 | Valued under fair value procedures adopted by authority of the board of trustees. The total value of all such securities, including those in “Miscellaneous,“ was $1,265,473,000, which represented 49.02% of the net assets of the fund. This amount includes $1,259,886,000 related to certain securities trading outside the U.S. whose values were adjusted as a result of significant market movements following the close of local trading. |
| 3 | Index-linked bond whose principal amount moves with a government price index. |
| 4 | Acquired in a transaction exempt from registration under Rule 144A or Section 4(2) of the Securities Act of 1933. May be resold in the U.S. in transactions exempt from registration, normally to qualified institutional buyers. The total value of all such securities was $223,945,000, which represented 8.68% of the net assets of the fund. |
| 5 | Principal payments may be made periodically. Therefore, the effective maturity date may be earlier than the stated maturity date. |
| 6 | Step bond; coupon rate will increase at a later date. |
| Key to abbreviations and symbol |
| ADR = American Depositary Receipts |
| GDR = Global Depositary Receipts |
| BRL = Brazilian reais |
| COP = Colombian pesos |
| € = Euros |
| HUF = Hungarian forints |
| IDR = Indonesian rupiah |
| INR = Indian rupees |
| MXN = Mexican pesos |
| PHP = Philippine pesos |
| PLN = Polish zloty |
| RUB = Russian rubles |
| TRY = Turkish lira |
| UYU = Uruguayan pesos |
| ZAR = South African rand |
| Common stocks 96.20% Health care 16.59% | Shares | Value (000) |
| Amgen Inc. | 2,694,600 | $429,223 |
| Gilead Sciences, Inc.1 | 3,197,735 | 301,418 |
| AbbVie Inc. | 1,664,800 | 108,944 |
| Medtronic, Inc. | 1,375,000 | 99,275 |
| Teva Pharmaceutical Industries Ltd. (ADR) | 1,202,000 | 69,127 |
| Bristol-Myers Squibb Co. | 1,125,000 | 66,409 |
| Novartis AG (ADR) | 708,500 | 65,650 |
| Abbott Laboratories | 850,000 | 38,267 |
| Merck & Co., Inc. | 500,000 | 28,395 |
| 1,206,708 | ||
| Industrials 15.00% | ||
| Precision Castparts Corp. | 706,000 | 170,061 |
| General Dynamics Corp. | 1,060,900 | 146,001 |
| CSX Corp. | 3,372,000 | 122,168 |
| United Parcel Service, Inc., Class B | 850,000 | 94,494 |
| Union Pacific Corp. | 750,000 | 89,347 |
| Cummins Inc. | 473,100 | 68,207 |
| Norfolk Southern Corp. | 592,800 | 64,977 |
| Illinois Tool Works Inc. | 650,000 | 61,555 |
| General Electric Co. | 2,400,000 | 60,648 |
| United Technologies Corp. | 500,000 | 57,500 |
| Rockwell Automation | 450,000 | 50,040 |
| Eaton Corp. PLC | 600,000 | 40,776 |
| PACCAR Inc | 500,000 | 34,005 |
| Waste Management, Inc. | 600,000 | 30,792 |
| 1,090,571 | ||
| Information technology 13.49% | ||
| Apple Inc. | 1,642,377 | 181,285 |
| Western Union Co. | 8,225,000 | 147,310 |
| Texas Instruments Inc. | 2,630,000 | 140,613 |
| Cisco Systems, Inc. | 5,015,000 | 139,492 |
| Oracle Corp. | 2,395,000 | 107,703 |
| Google Inc., Class A1 | 66,760 | 35,427 |
| Google Inc., Class C1 | 57,760 | 30,405 |
| Microsoft Corp. | 1,400,000 | 65,030 |
| International Business Machines Corp. | 330,000 | 52,945 |
| Broadcom Corp., Class A | 1,020,000 | 44,197 |
| Intel Corp. | 1,000,000 | 36,290 |
| 980,697 | ||
| Consumer staples 10.84% | ||
| Altria Group, Inc. | 4,654,000 | 229,303 |
| Philip Morris International Inc. | 2,497,400 | 203,413 |
| Kraft Foods Group, Inc. | 1,076,666 | 67,464 |
| Common stocks Consumer staples (continued) | Shares | Value (000) |
| Kimberly-Clark Corp. | 500,000 | $57,770 |
| Mondelez International, Inc. | 1,580,000 | 57,394 |
| Coca-Cola Co. | 1,250,000 | 52,775 |
| ConAgra Foods, Inc. | 1,200,000 | 43,536 |
| Kellogg Co. | 592,000 | 38,740 |
| PepsiCo, Inc. | 400,000 | 37,824 |
| 788,219 | ||
| Telecommunication services 8.90% | ||
| Verizon Communications Inc. | 7,491,339 | 350,445 |
| CenturyLink, Inc. | 4,908,135 | 194,264 |
| AT&T Inc. | 3,060,000 | 102,785 |
| 647,494 | ||
| Consumer discretionary 7.99% | ||
| Johnson Controls, Inc. | 3,546,000 | 171,414 |
| General Motors Co. | 3,625,000 | 126,549 |
| Darden Restaurants, Inc. | 2,045,000 | 119,898 |
| Las Vegas Sands Corp. | 1,234,000 | 71,769 |
| Wynn Resorts, Ltd. | 339,900 | 50,564 |
| Royal Caribbean Cruises Ltd. | 500,000 | 41,215 |
| 581,409 | ||
| Utilities 7.55% | ||
| Exelon Corp. | 5,913,000 | 219,254 |
| FirstEnergy Corp. | 3,544,200 | 138,188 |
| PG&E Corp. | 2,413,000 | 128,468 |
| Southern Co. | 1,000,000 | 49,110 |
| Xcel Energy Inc. | 250,000 | 8,980 |
| NextEra Energy, Inc. | 50,000 | 5,315 |
| 549,315 | ||
| Energy 5.16% | ||
| Canadian Natural Resources, Ltd. | 4,221,000 | 130,345 |
| Cabot Oil & Gas Corp. | 3,129,000 | 92,650 |
| Royal Dutch Shell PLC, Class B (ADR) | 750,000 | 52,170 |
| Exxon Mobil Corp. | 546,300 | 50,505 |
| Kinder Morgan, Inc. | 1,000,000 | 42,310 |
| Baker Hughes Inc. | 93,800 | 5,259 |
| Chevron Corp. | 20,000 | 2,244 |
| 375,483 | ||
| Materials 2.98% | ||
| Praxair, Inc. | 688,000 | 89,137 |
| Vale SA, Class A, preferred nominative (ADR) | 7,002,000 | 50,835 |
| Dow Chemical Co. | 850,000 | 38,769 |
| Celanese Corp., Series A | 350,000 | 20,986 |
| International Flavors & Fragrances Inc. | 168,000 | 17,028 |
| 216,755 |
| Common stocks Financials 2.78% | Shares | Value (000) |
| JPMorgan Chase & Co. | 1,870,000 | $117,025 |
| American International Group, Inc. | 998,000 | 55,898 |
| HSBC Holdings PLC (ADR) | 618,749 | 29,223 |
| 202,146 | ||
| Miscellaneous 4.92% | ||
| Other common stocks in initial period of acquisition | 357,685 | |
| Total common stocks (cost: $5,089,072,000) | 6,996,482 | |
| Short-term securities 3.51% | Principal amount (000) | |
| Abbott Laboratories 0.09% due 2/2/20152 | $ 25,000 | 24,998 |
| CAFCO, LLC 0.12% due 1/16/2015 | 15,000 | 14,999 |
| Coca-Cola Co. 0.11% due 1/22/20152 | 15,000 | 14,999 |
| Emerson Electric Co. 0.11% due 1/23/20152 | 27,000 | 26,998 |
| ExxonMobil Corp. 0.08% due 1/27/2015 | 24,100 | 24,098 |
| Federal Farm Credit Banks 0.10% due 6/8/2015 | 25,100 | 25,088 |
| Federal Home Loan Bank 0.11%–0.12% due 5/15/2015–5/22/2015 | 25,710 | 25,702 |
| Freddie Mac 0.06%–0.10% due 2/5/2015–5/6/2015 | 54,100 | 54,093 |
| General Electric Co. 0.10% due 1/2/2015 | 4,100 | 4,100 |
| John Deere Capital Corp. 0.12% due 2/12/20152 | 15,000 | 14,997 |
| Jupiter Securitization Co., LLC 0.27% due 4/27/20152 | 10,000 | 9,993 |
| Kimberly-Clark Corp. 0.12% due 1/14/20152 | 15,000 | 14,999 |
| Total short-term securities (cost: $255,056,000) | 255,064 | |
| Total investment securities 99.71% (cost: $5,344,128,000) | 7,251,546 | |
| Other assets less liabilities 0.29% | 21,338 | |
| Net assets 100.00% | $7,272,884 |
| 1 | Security did not produce income during the last 12 months. |
| 2 | Acquired in a transaction exempt from registration under Section 4(2) of the Securities Act of 1933. May be resold in the U.S. in transactions exempt from registration, normally to qualified institutional buyers. The total value of all such securities was $106,984,000, which represented 1.47% of the net assets of the fund. |
| Key to abbreviation |
| ADR = American Depositary Receipts |
| Common stocks 95.00% Financials 21.91% | Shares | Value (000) |
| AXA SA1 | 1,834,360 | $42,367 |
| CME Group Inc., Class A | 365,500 | 32,402 |
| Wells Fargo & Co. | 445,000 | 24,395 |
| Banco Santander, SA1,2 | 2,746,403 | 22,965 |
| ICICI Bank Ltd. (ADR) | 1,575,000 | 18,191 |
| Suncorp Group Ltd.1 | 1,495,191 | 17,038 |
| Sun Hung Kai Properties Ltd.1 | 1,094,201 | 16,546 |
| JPMorgan Chase & Co. | 255,000 | 15,958 |
| Oaktree Capital Group, LLC | 285,000 | 14,772 |
| Shinsei Bank, Ltd.1 | 8,060,000 | 14,071 |
| McGraw Hill Financial, Inc. | 145,500 | 12,947 |
| Bankia, SA1,2 | 8,354,000 | 12,385 |
| Ping An Insurance (Group) Co. of China, Ltd., Class H1 | 1,140,000 | 11,526 |
| Iron Mountain Inc. | 295,905 | 11,440 |
| BNP Paribas SA1 | 194,031 | 11,402 |
| Goldman Sachs Group, Inc. | 55,200 | 10,699 |
| W. R. Berkley Corp. | 200,000 | 10,252 |
| Sumitomo Mitsui Financial Group, Inc.1 | 280,000 | 10,117 |
| Fairfax Financial Holdings Ltd. (CAD denominated) | 19,000 | 9,956 |
| Brookfield Property Partners LP | 400,000 | 9,148 |
| Blackstone Group LP | 270,000 | 9,134 |
| American Express Co. | 92,000 | 8,560 |
| Metropolitan Bank & Trust Co.1 | 4,200,000 | 7,743 |
| KeyCorp | 535,000 | 7,436 |
| Howard Hughes Corp.2 | 54,000 | 7,043 |
| Grupo Financiero Santander México, SAB de CV, Class B (ADR) | 678,997 | 7,034 |
| AIA Group Ltd.1 | 1,220,000 | 6,718 |
| HSBC Holdings PLC (GBP denominated)1 | 600,000 | 5,670 |
| ORIX Corp.1 | 450,000 | 5,625 |
| BM&FBOVESPA SA, ordinary nominative | 1,250,000 | 4,632 |
| Prudential PLC1 | 200,000 | 4,602 |
| Deutsche Bank AG1 | 131,611 | 3,978 |
| Tokyo Tatemono Co., Ltd.1 | 450,000 | 3,277 |
| Macquarie International Infrastructure Fund Ltd.1 | 36,200,164 | 2,513 |
| CenterState Banks, Inc. | 60,945 | 726 |
| 413,268 | ||
| Consumer discretionary 12.38% | ||
| D.R. Horton, Inc. | 1,000,000 | 25,290 |
| Carnival Corp., units | 475,000 | 21,532 |
| Home Depot, Inc. | 178,000 | 18,685 |
| HUGO BOSS AG1 | 150,000 | 18,416 |
| Amazon.com, Inc.2 | 49,400 | 15,331 |
| Comcast Corp., Class A | 255,000 | 14,792 |
| Toll Brothers, Inc.2 | 400,000 | 13,708 |
| Twenty-First Century Fox, Inc., Class A | 335,000 | 12,866 |
| Common stocks Consumer discretionary (continued) | Shares | Value (000) |
| Toyota Motor Corp.1 | 156,000 | $9,728 |
| Zee Entertainment Enterprises Ltd.1 | 1,620,000 | 9,728 |
| Don Quijote Holdings Co., Ltd.1 | 140,000 | 9,562 |
| Daily Mail and General Trust PLC, Class A, nonvoting1 | 695,000 | 8,924 |
| Carnival PLC1 | 165,000 | 7,450 |
| Liberty Global PLC, Class C2 | 103,008 | 4,976 |
| Liberty Global PLC, Class A2 | 41,312 | 2,074 |
| ProSiebenSat.1 Media AG1 | 155,000 | 6,530 |
| OPAP SA1 | 555,000 | 5,931 |
| Maruti Suzuki India Ltd.1 | 110,000 | 5,783 |
| Walt Disney Co. | 60,000 | 5,651 |
| GameStop Corp., Class A | 165,000 | 5,577 |
| SES SA, Class A (FDR)1 | 150,000 | 5,381 |
| adidas AG1 | 40,700 | 2,837 |
| Honda Motor Co., Ltd.1 | 95,000 | 2,763 |
| 233,515 | ||
| Information technology 11.99% | ||
| Taiwan Semiconductor Manufacturing Co. Ltd.1 | 12,460,800 | 54,986 |
| Microsoft Corp. | 922,000 | 42,827 |
| Cisco Systems, Inc. | 920,000 | 25,590 |
| Google Inc., Class C2 | 23,850 | 12,555 |
| Google Inc., Class A2 | 18,400 | 9,764 |
| ASM Pacific Technology Ltd.1 | 1,477,000 | 14,042 |
| Avago Technologies Ltd. | 125,000 | 12,573 |
| TE Connectivity Ltd. | 175,000 | 11,069 |
| STMicroelectronics NV1 | 1,250,000 | 9,322 |
| Alcatel-Lucent1,2 | 2,450,000 | 8,698 |
| Halma PLC1 | 610,000 | 6,503 |
| Nintendo Co., Ltd.1 | 60,000 | 6,253 |
| Quanta Computer Inc.1 | 2,149,910 | 5,356 |
| Wirecard AG1 | 110,000 | 4,852 |
| Alibaba Group Holding Ltd. (ADR)2 | 17,000 | 1,767 |
| 226,157 | ||
| Industrials 11.95% | ||
| United Continental Holdings, Inc.2 | 500,000 | 33,445 |
| Lockheed Martin Corp. | 150,000 | 28,886 |
| Geberit AG1 | 60,000 | 20,390 |
| Meggitt PLC1 | 2,519,290 | 20,138 |
| Abertis Infraestructuras, SA, Class A1 | 969,750 | 19,158 |
| Masco Corp. | 700,000 | 17,640 |
| Airbus Group NV1 | 284,000 | 14,105 |
| Rickmers Maritime1,3 | 54,840,000 | 11,584 |
| Delta Air Lines, Inc. | 220,000 | 10,822 |
| Ryanair Holdings PLC (ADR)2 | 145,000 | 10,334 |
| Wolseley PLC1 | 100,000 | 5,693 |
| Caterpillar Inc. | 60,000 | 5,492 |
| United Technologies Corp. | 42,000 | 4,830 |
| Rolls-Royce Holdings PLC1,2 | 340,000 | 4,580 |
| Cummins Inc. | 30,000 | 4,325 |
| Union Pacific Corp. | 34,500 | 4,110 |
| Randstad Holding NV1 | 83,817 | 4,031 |
| Common stocks Industrials (continued) | Shares | Value (000) |
| Boeing Co. | 30,000 | $3,899 |
| ASSA ABLOY AB, Class B1 | 36,000 | 1,902 |
| 225,364 | ||
| Health care 10.86% | ||
| Merck & Co., Inc. | 1,233,900 | 70,073 |
| Novartis AG1 | 349,000 | 32,097 |
| Vertex Pharmaceuticals Inc.2 | 238,877 | 28,379 |
| Pfizer Inc. | 451,000 | 14,049 |
| Novo Nordisk A/S, Class B1 | 197,500 | 8,356 |
| Takeda Pharmaceutical Co. Ltd.1 | 200,000 | 8,299 |
| UnitedHealth Group Inc. | 75,000 | 7,582 |
| Regeneron Pharmaceuticals, Inc.2 | 18,000 | 7,384 |
| AstraZeneca PLC1 | 100,000 | 7,035 |
| Medtronic, Inc. | 86,000 | 6,209 |
| Roche Holding AG1 | 20,000 | 5,421 |
| Thermo Fisher Scientific Inc. | 42,000 | 5,262 |
| Boston Scientific Corp.2 | 355,000 | 4,704 |
| 204,850 | ||
| Telecommunication services 7.01% | ||
| Orange1 | 1,970,000 | 33,502 |
| MTN Group Ltd.1 | 1,100,000 | 20,874 |
| AT&T Inc. | 525,000 | 17,635 |
| TalkTalk Telecom Group PLC1 | 3,704,000 | 17,405 |
| Globe Telecom, Inc.1 | 399,695 | 15,349 |
| KDDI Corp.1 | 170,000 | 10,637 |
| Verizon Communications Inc. (CDI)1 | 145,105 | 6,760 |
| SoftBank Corp.1 | 106,000 | 6,308 |
| TDC A/S1 | 508,958 | 3,879 |
| 132,349 | ||
| Consumer staples 6.15% | ||
| British American Tobacco PLC1 | 338,500 | 18,392 |
| Philip Morris International Inc. | 175,000 | 14,254 |
| Procter & Gamble Co. | 125,000 | 11,386 |
| Alimentation Couche-Tard Inc., Class B | 250,000 | 10,477 |
| Imperial Tobacco Group PLC1 | 225,000 | 9,853 |
| Walgreens Boots Alliance, Inc. | 123,000 | 9,373 |
| Unilever NV, depository receipts1 | 200,000 | 7,857 |
| Associated British Foods PLC1 | 130,000 | 6,316 |
| Nestlé SA1 | 79,700 | 5,842 |
| PepsiCo, Inc. | 60,000 | 5,674 |
| Shiseido Co., Ltd.1 | 335,000 | 4,691 |
| Seven & i Holdings Co., Ltd.1 | 120,000 | 4,329 |
| LAWSON, INC.1 | 53,000 | 3,205 |
| Booker Group PLC1 | 990,400 | 2,523 |
| Avon Products, Inc. | 190,000 | 1,784 |
| 115,956 | ||
| Materials 5.13% | ||
| Potash Corp. of Saskatchewan Inc. | 841,000 | 29,704 |
| Newmont Mining Corp. | 1,000,000 | 18,900 |
| Dow Chemical Co. | 335,000 | 15,279 |
| Nucor Corp. | 150,000 | 7,358 |
| Common stocks Materials (continued) | Shares | Value (000) |
| E.I. du Pont de Nemours and Co. | 75,000 | $5,546 |
| Rio Tinto PLC1 | 113,000 | 5,206 |
| Impala Platinum Holdings Ltd.1,2 | 685,648 | 4,468 |
| Grasim Industries Ltd.1 | 70,000 | 3,748 |
| Fletcher Building Ltd.1 | 550,000 | 3,547 |
| Cliffs Natural Resources Inc. | 431,000 | 3,077 |
| 96,833 | ||
| Utilities 4.24% | ||
| Exelon Corp. | 500,000 | 18,540 |
| EDP - Energias de Portugal, SA1 | 4,220,000 | 16,320 |
| NRG Yield, Inc., Class A | 337,800 | 15,924 |
| ENN Energy Holdings Ltd.1 | 1,888,000 | 10,677 |
| Power Assets Holdings Ltd.1 | 640,500 | 6,188 |
| PG&E Corp. | 90,500 | 4,818 |
| National Grid PLC1 | 310,000 | 4,419 |
| NextEra Energy Partners, LP, restricted-voting shares | 94,100 | 3,176 |
| 80,062 | ||
| Energy 3.38% | ||
| Coal India Ltd.1 | 1,500,000 | 9,105 |
| Royal Dutch Shell PLC, Class A (ADR) | 130,000 | 8,703 |
| Enbridge Inc. | 156,578 | 8,051 |
| ConocoPhillips | 75,000 | 5,180 |
| Oil Search Ltd.1 | 764,000 | 4,936 |
| Peyto Exploration & Development Corp. | 157,000 | 4,523 |
| Noble Energy, Inc. | 90,000 | 4,269 |
| Crescent Point Energy Corp. | 180,000 | 4,169 |
| Chevron Corp. | 36,800 | 4,128 |
| Galp Energia, SGPS, SA, Class B1 | 355,000 | 3,592 |
| BG Group PLC1 | 240,000 | 3,195 |
| Plains GP Holdings, LP, Class A | 96,200 | 2,470 |
| PrairieSky Royalty Ltd. | 53,900 | 1,420 |
| 63,741 | ||
| Total common stocks (cost: $1,482,814,000) | 1,792,095 | |
| Preferred securities 0.02% Consumer discretionary 0.02% | ||
| Zee Entertainment Enterprises Ltd., 6.00% preferred, expires 2022 | 34,020,000 | 458 |
| Total preferred securities (cost: $256,000) | 458 | |
| Rights & warrants 0.01% Financials 0.01% | ||
| Sun Hung Kai Properties Ltd, warrants, expire 20162 | 51,071 | 129 |
| Total rights & warrants (cost: $0) | 129 |
| Convertible bonds 0.06% Consumer discretionary 0.06% | Principal amount (000) | Value (000) |
| MGM Resorts International 4.25% convertible notes 2015 | $939 | $1,111 |
| Total convertible bonds (cost: $927,000) | 1,111 | |
| Bonds, notes & other debt instruments 0.75% U.S. Treasury bonds & notes 0.38% U.S. Treasury 0.38% | ||
| U.S. Treasury 0.25% 2015 | 6,805 | 6,810 |
| U.S. Treasury 0.25% 2015 | 400 | 400 |
| Total U.S. Treasury bonds & notes | 7,210 | |
| Corporate bonds & notes 0.37% Consumer discretionary 0.29% | ||
| Royal Caribbean Cruises Ltd. 11.875% 2015 | 5,100 | 5,381 |
| Telecommunication services 0.08% | ||
| NII Capital Corp. 8.875% 20194 | 575 | 204 |
| NII Capital Corp. 11.375% 20194,5 | 800 | 580 |
| NII Capital Corp. 7.625% 20214 | 3,625 | 689 |
| 1,473 | ||
| Total corporate bonds & notes | 6,854 | |
| Total bonds, notes & other debt instruments (cost: $16,339,000) | 14,064 | |
| Short-term securities 3.52% | ||
| Fannie Mae 0.15% due 7/1/2015 | 11,900 | 11,892 |
| General Electric Co. 0.10% due 1/2/2015 | 10,000 | 10,000 |
| Mitsubishi UFJ Trust and Banking Corp. 0.16% due 1/15/20155 | 29,100 | 29,098 |
| Mizuho Funding LLC 0.19% due 1/5/20155 | 15,500 | 15,500 |
| Total short-term securities (cost: $66,489,000) | 66,490 | |
| Total investment securities 99.36% (cost: $1,566,825,000) | 1,874,347 | |
| Other assets less liabilities 0.64% | 12,004 | |
| Net assets 100.00% | $1,886,351 |
| 1 | Valued under fair value procedures adopted by authority of the board of trustees. The total value of all such securities, was $817,501,000, which represented 43.34% of the net assets of the fund. This entire amount relates to certain securities trading outside the U.S. whose values were adjusted as a result of significant market movements following the close of local trading. |
| 2 | Security did not produce income during the last 12 months. |
| 3 | Represents an affiliated company as defined under the Investment Company Act of 1940. |
| 4 | Scheduled interest and/or principal payment was not received. |
| 5 | Acquired in a transaction exempt from registration under Rule 144A or Section 4(2) of the Securities Act of 1933. May be resold in the U.S. in transactions exempt from registration, normally to qualified institutional buyers. The total value of all such securities was $45,178,000, which represented 2.39% of the net assets of the fund. |
| Key to abbreviations | |||
| ADR = American Depositary Receipts | GBP = British pounds | ||
| CDI = CREST Depository Interest | CAD = Canadian dollars | ||
| FDR = Fiduciary Depositary Receipts |
| Common stocks 91.60% Health care 17.32% | Shares | Value (000) |
| Amgen Inc. | 5,356,100 | $853,173 |
| Gilead Sciences, Inc.1 | 7,759,200 | 731,382 |
| Alexion Pharmaceuticals, Inc.1 | 1,590,000 | 294,198 |
| Express Scripts Holding Co.1 | 2,600,309 | 220,168 |
| Stryker Corp. | 2,185,011 | 206,112 |
| Merck & Co., Inc. | 3,626,080 | 205,925 |
| UnitedHealth Group Inc. | 1,766,396 | 178,565 |
| Illumina, Inc.1 | 948,000 | 174,982 |
| Humana Inc. | 1,193,600 | 171,437 |
| Edwards Lifesciences Corp.1 | 1,193,900 | 152,079 |
| Hologic, Inc.1 | 5,661,300 | 151,383 |
| Cardinal Health, Inc. | 1,800,000 | 145,314 |
| Quest Diagnostics Inc. | 1,939,800 | 130,083 |
| Endo International PLC1 | 1,671,000 | 120,512 |
| Bayer AG2 | 672,000 | 91,869 |
| AbbVie Inc. | 1,300,000 | 85,072 |
| Thermo Fisher Scientific Inc. | 606,000 | 75,926 |
| BioMarin Pharmaceutical Inc.1 | 725,000 | 65,540 |
| Pfizer Inc. | 1,995,851 | 62,171 |
| St. Jude Medical, Inc. | 933,285 | 60,691 |
| Bristol-Myers Squibb Co. | 950,500 | 56,108 |
| Novartis AG2 | 485,150 | 44,618 |
| Medtronic, Inc. | 600,000 | 43,320 |
| Boston Scientific Corp.1 | 2,900,000 | 38,425 |
| Abbott Laboratories | 781,800 | 35,197 |
| 4,394,250 | ||
| Information technology 16.43% | ||
| Texas Instruments Inc. | 12,199,259 | 652,233 |
| Google Inc., Class A1 | 606,000 | 321,580 |
| Google Inc., Class C1 | 577,600 | 304,049 |
| Oracle Corp. | 10,356,500 | 465,732 |
| Microsoft Corp. | 8,090,000 | 375,781 |
| Yahoo! Inc.1 | 5,038,000 | 254,469 |
| Apple Inc. | 2,246,300 | 247,947 |
| Accenture PLC, Class A | 2,068,500 | 184,738 |
| Intuit Inc. | 1,989,400 | 183,403 |
| Broadcom Corp., Class A | 3,201,500 | 138,721 |
| Intel Corp. | 3,000,000 | 108,870 |
| Autodesk, Inc.1 | 1,800,000 | 108,108 |
| Adobe Systems Inc.1 | 1,220,000 | 88,694 |
| KLA-Tencor Corp. | 1,250,000 | 87,900 |
| Infosys Ltd.2 | 1,540,000 | 47,896 |
| Infosys Ltd. (ADR) | 802,200 | 25,237 |
| Tata Consultancy Services Ltd.2 | 1,800,000 | 72,887 |
| Automatic Data Processing, Inc. | 847,600 | 70,664 |
| Common stocks Information technology (continued) | Shares | Value (000) |
| MercadoLibre, Inc. | 402,000 | $51,323 |
| NetApp, Inc. | 1,213,690 | 50,307 |
| VeriSign, Inc.1 | 840,900 | 47,931 |
| Visa Inc., Class A | 161,900 | 42,450 |
| Linear Technology Corp. | 900,000 | 41,040 |
| Mobileye NV1 | 985,200 | 39,960 |
| Computer Sciences Corp. | 623,000 | 39,280 |
| Avago Technologies Ltd. | 377,900 | 38,013 |
| Motorola Solutions, Inc. | 450,000 | 30,186 |
| SAP SE2 | 239,500 | 16,934 |
| Nintendo Co., Ltd.2 | 75,000 | 7,817 |
| First Solar, Inc.1 | 170,000 | 7,581 |
| Verint Systems Inc.1 | 125,924 | 7,339 |
| Western Union Co. | 400,000 | 7,164 |
| Comverse, Inc.1 | 97,000 | 1,822 |
| 4,168,056 | ||
| Consumer discretionary 13.03% | ||
| Amazon.com, Inc.1 | 1,898,800 | 589,293 |
| Home Depot, Inc. | 3,200,000 | 335,904 |
| Time Warner Inc. | 3,525,000 | 301,105 |
| Comcast Corp., Class A | 3,962,500 | 229,865 |
| Comcast Corp., Class A, special nonvoting shares | 1,000,000 | 57,565 |
| General Motors Co. | 6,952,256 | 242,703 |
| Royal Caribbean Cruises Ltd. | 1,983,000 | 163,459 |
| Carnival Corp., units | 3,320,000 | 150,496 |
| Newell Rubbermaid Inc. | 3,671,300 | 139,840 |
| Johnson Controls, Inc. | 2,437,730 | 117,840 |
| Fiat Chrysler Automobiles NV1,2 | 9,000,000 | 103,279 |
| Netflix, Inc.1 | 282,300 | 96,436 |
| Daily Mail and General Trust PLC, Class A, nonvoting2 | 6,400,000 | 82,178 |
| Daimler AG2 | 949,800 | 79,242 |
| Twenty-First Century Fox, Inc., Class A | 2,006,200 | 77,048 |
| Sirius XM Holdings Inc.1 | 21,377,000 | 74,819 |
| Ryohin Keikaku Co., Ltd.2 | 604,500 | 74,694 |
| Bajaj Auto Ltd.2 | 1,888,000 | 72,497 |
| Toyota Motor Corp.2 | 900,000 | 56,124 |
| Delphi Automotive PLC | 747,500 | 54,358 |
| Cedar Fair, LP | 1,031,500 | 49,337 |
| Starbucks Corp. | 579,800 | 47,573 |
| NIKE, Inc., Class B | 402,600 | 38,710 |
| Marks and Spencer Group PLC2 | 4,879,000 | 36,023 |
| Garmin Ltd. | 650,100 | 34,345 |
| Motors Liquidation Co. GUC Trust1 | 21,864 | 421 |
| 3,305,154 | ||
| Industrials 9.51% | ||
| CSX Corp. | 8,124,200 | 294,340 |
| General Dynamics Corp. | 1,909,300 | 262,758 |
| Precision Castparts Corp. | 969,800 | 233,605 |
| Nielsen NV | 4,401,039 | 196,859 |
| Waste Management, Inc. | 3,138,000 | 161,042 |
| Union Pacific Corp. | 1,081,200 | 128,803 |
| Towers Watson & Co., Class A | 1,127,802 | 127,633 |
| Cummins Inc. | 859,000 | 123,842 |
| Common stocks Industrials (continued) | Shares | Value (000) |
| Schneider Electric SE2 | 1,301,100 | $94,540 |
| Siemens AG (ADR) | 391,000 | 43,792 |
| Siemens AG2 | 378,400 | 42,914 |
| Rockwell Automation | 767,600 | 85,357 |
| United Technologies Corp. | 699,600 | 80,454 |
| Norfolk Southern Corp. | 685,000 | 75,083 |
| 3M Co. | 442,700 | 72,745 |
| Verisk Analytics, Inc., Class A1 | 1,100,000 | 70,455 |
| United Parcel Service, Inc., Class B | 621,400 | 69,081 |
| Republic Services, Inc. | 1,430,000 | 57,558 |
| Caterpillar Inc. | 590,000 | 54,003 |
| Zodiac Aerospace SA2 | 1,201,100 | 40,534 |
| ABB Ltd2 | 1,820,500 | 38,507 |
| United Continental Holdings, Inc.1 | 553,322 | 37,012 |
| Lockheed Martin Corp. | 109,900 | 21,163 |
| 2,412,080 | ||
| Financials 7.87% | ||
| Crown Castle International Corp. | 2,808,200 | 221,005 |
| State Street Corp. | 2,534,500 | 198,958 |
| Marsh & McLennan Companies, Inc. | 3,426,100 | 196,110 |
| JPMorgan Chase & Co. | 2,455,300 | 153,653 |
| Weyerhaeuser Co.1 | 3,784,541 | 135,827 |
| Wells Fargo & Co. | 2,410,900 | 132,165 |
| Principal Financial Group, Inc. | 2,200,000 | 114,268 |
| Goldman Sachs Group, Inc. | 555,000 | 107,576 |
| HSBC Holdings PLC (HKD denominated)2 | 7,241,433 | 68,893 |
| HSBC Holdings PLC (ADR) | 769,270 | 36,333 |
| Intercontinental Exchange, Inc. | 463,533 | 101,648 |
| Iron Mountain Inc. | 2,570,121 | 99,361 |
| American International Group, Inc. | 1,665,000 | 93,257 |
| Barclays PLC2 | 20,543,750 | 77,234 |
| Aon PLC, Class A | 725,700 | 68,818 |
| Moody’s Corp. | 447,458 | 42,871 |
| U.S. Bancorp | 745,000 | 33,488 |
| Bank of New York Mellon Corp. | 805,000 | 32,659 |
| Citigroup Inc. | 600,000 | 32,466 |
| Prudential Financial, Inc. | 300,000 | 27,138 |
| UBS Group AG1,2 | 1,343,666 | 23,097 |
| 1,996,825 | ||
| Materials 6.80% | ||
| Celanese Corp., Series A | 5,930,400 | 355,587 |
| Dow Chemical Co. | 6,573,500 | 299,817 |
| Monsanto Co. | 1,980,243 | 236,580 |
| Mosaic Co. | 2,903,500 | 132,545 |
| Valspar Corp. | 1,433,600 | 123,978 |
| Freeport-McMoRan Inc. | 4,625,800 | 108,059 |
| Vale SA, Class A, preferred nominative (ADR) | 13,303,200 | 96,581 |
| Praxair, Inc. | 722,000 | 93,542 |
| Rio Tinto PLC2 | 1,742,000 | 80,258 |
| International Flavors & Fragrances Inc. | 762,000 | 77,236 |
| Rockwood Holdings, Inc. | 960,600 | 75,695 |
| Common stocks Materials (continued) | Shares | Value (000) |
| Koninklijke DSM NV2 | 419,424 | $25,504 |
| ArcelorMittal2 | 1,675,000 | 18,142 |
| 1,723,524 | ||
| Energy 6.65% | ||
| ConocoPhillips | 3,334,460 | 230,278 |
| EOG Resources, Inc. | 2,341,300 | 215,563 |
| Royal Dutch Shell PLC, Class A (ADR) | 3,016,000 | 201,921 |
| Schlumberger Ltd. | 2,055,000 | 175,518 |
| Chevron Corp. | 1,223,200 | 137,219 |
| FMC Technologies, Inc.1 | 2,687,300 | 125,873 |
| BP PLC2 | 15,199,845 | 96,515 |
| Apache Corp. | 1,370,000 | 85,858 |
| Baker Hughes Inc. | 1,502,600 | 84,251 |
| Veresen Inc. | 5,120,000 | 80,912 |
| Devon Energy Corp. | 1,000,000 | 61,210 |
| Golar LNG Ltd. | 1,569,000 | 57,221 |
| BG Group PLC2 | 3,212,000 | 42,754 |
| Tullow Oil PLC2 | 6,204,000 | 39,254 |
| Eni SpA2 | 2,239,795 | 39,118 |
| Cobalt International Energy, Inc.1 | 1,465,200 | 13,026 |
| 1,686,491 | ||
| Consumer staples 6.42% | ||
| Philip Morris International Inc. | 4,627,444 | 376,905 |
| Altria Group, Inc. | 4,050,700 | 199,578 |
| Coca-Cola Co. | 4,708,400 | 198,789 |
| CVS/Caremark Corp. | 1,670,000 | 160,838 |
| Walgreens Boots Alliance, Inc. | 1,500,000 | 114,300 |
| PepsiCo, Inc. | 998,419 | 94,410 |
| Avon Products, Inc. | 9,936,100 | 93,300 |
| Pernod Ricard SA2 | 826,600 | 91,651 |
| Herbalife Ltd. | 2,360,000 | 88,972 |
| L’Oréal SA, bonus shares2 | 470,000 | 78,907 |
| Asahi Group Holdings, Ltd.2 | 2,122,000 | 65,498 |
| Mondelez International, Inc. | 1,774,400 | 64,455 |
| 1,627,603 | ||
| Telecommunication services 1.61% | ||
| Verizon Communications Inc. | 6,731,501 | 314,900 |
| CenturyLink, Inc. | 2,018,200 | 79,880 |
| T-Mobile US, Inc.1 | 515,000 | 13,874 |
| 408,654 | ||
| Utilities 0.97% | ||
| Sempra Energy | 1,455,000 | 162,029 |
| Exelon Corp. | 2,263,650 | 83,936 |
| 245,965 | ||
| Miscellaneous 4.99% | ||
| Other common stocks in initial period of acquisition | 1,265,338 | |
| Total common stocks (cost: $15,610,703,000) | 23,233,940 |
| Rights & warrants 0.02% Consumer discretionary 0.02% | Shares | Value (000) |
| General Motors Co., Series A, warrants, expire 20161 | 85,694 | $2,165 |
| General Motors Co., Series B, warrants, expire 20191 | 85,694 | 1,468 |
| Total rights & warrants (cost: $3,908,000) | 3,633 | |
| Convertible stocks 0.04% Financials 0.04% | ||
| OFG Bancorp, Series C, 8.75% noncumulative convertible preferred3 | 6,000 | 9,007 |
| Total convertible stocks (cost: $6,000,000) | 9,007 | |
| Convertible bonds 0.12% Information technology 0.12% | Principal amount (000) | |
| VeriSign, Inc. 3.25% convertible note 2037 | $18,020 | 30,961 |
| Total convertible bonds (cost: $27,669,000) | 30,961 | |
| Bonds, notes & other debt instruments 0.17% Corporate bonds & notes 0.11% Telecommunication services 0.07% | ||
| Sprint Nextel Corp. 9.125% 2017 | 13,000 | 14,332 |
| Sprint Nextel Corp. 11.50% 2021 | 3,700 | 4,468 |
| 18,800 | ||
| Financials 0.04% | ||
| JPMorgan Chase & Co., Series I, junior subordinated 7.90% (undated)4 | 8,214 | 8,882 |
| Total corporate bonds & notes | 27,682 | |
| U.S. Treasury bonds & notes 0.06% U.S. Treasury 0.06% | ||
| U.S. Treasury 0.25% 2015 | 14,925 | 14,935 |
| Total U.S. Treasury bonds & notes | 14,935 | |
| Total bonds, notes & other debt instruments (cost: $40,155,000) | 42,617 | |
| Short-term securities 8.10% | ||
| Abbott Laboratories 0.10%–0.14% due 1/12/2015–2/24/20155 | $88,400 | 88,392 |
| Apple Inc. 0.13% due 1/8/20155 | 17,200 | 17,200 |
| Army and Air Force Exchange Service 0.11%–0.12% due 2/2/2015–2/17/20155 | 50,000 | 49,992 |
| Caterpillar Financial Services Corp. 0.12% due 2/19/2015 | 70,100 | 70,085 |
| Chariot Funding, LLC 0.22% due 4/16/20155 | 50,000 | 49,974 |
| Chevron Corp. 0.10%–0.12% due 1/12/2015–2/24/20155 | 94,600 | 94,593 |
| Coca-Cola Co. 0.10%–0.19% due 1/15/2015–5/8/20155 | 117,800 | 117,760 |
| Emerson Electric Co. 0.09%–0.10% due 1/16/2015–2/26/20155 | 76,300 | 76,289 |
| ExxonMobil Corp. 0.10% due 2/9/2015 | 30,900 | 30,895 |
| Fannie Mae 0.07%–0.15% due 3/2/2015–10/5/2015 | 183,900 | 183,795 |
| Federal Home Loan Bank 0.05%–0.17% due 1/14/2015–10/5/2015 | 585,200 | 585,112 |
| Freddie Mac 0.09%–0.17% due 1/6/2015–11/3/2015 | 321,800 | 321,632 |
| General Electric Capital Corp. 0.13%–0.19% due 1/23/2015–2/20/2015 | 125,000 | 124,991 |
| General Electric Co. 0.10% due 1/2/2015 | 900 | 900 |
| John Deere Capital Corp. 0.09%–0.10% due 1/8/2015–1/22/20155 | 73,000 | 72,995 |
| Short-term securities | Principal amount (000) | Value (000) |
| Paccar Financial Corp. 0.11% due 1/20/2015 | $32,500 | $32,497 |
| Procter & Gamble Co. 0.08% due 1/22/2015–1/23/20155 | 53,100 | 53,098 |
| U.S. Treasury Bills 0.13% due 6/25/2015 | 7,600 | 7,597 |
| United Parcel Service Inc. 0.13% due 1/2/20155 | 45,700 | 45,700 |
| Walt Disney Co. 0.09% due 2/13/20155 | 32,650 | 32,645 |
| Total short-term securities (cost: $2,056,061,000) | 2,056,142 | |
| Total investment securities 100.05% (cost: $17,744,496,000) | 25,376,300 | |
| Other assets less liabilities (0.05)% | (12,752) | |
| Net assets 100.00% | $25,363,548 |
| 1 | Security did not produce income during the last 12 months. |
| 2 | Valued under fair value procedures adopted by authority of the board of trustees. The total value of all such securities, including those in “Miscellaneous,“ was $1,838,773,000, which represented 7.25% of the net assets of the fund. This amount includes $1,759,866,000 related to certain securities trading outside the U.S. whose values were adjusted as a result of significant market movements following the close of local trading. |
| 3 | Acquired through a private placement transaction exempt from registration under the Securities Act of 1933. May be subject to legal or contractual restrictions on resale. Further details on these holdings appear below. |
| 4 | Coupon rate may change periodically. |
| 5 | Acquired in a transaction exempt from registration under Section 4(2) of the Securities Act of 1933. May be resold in the U.S. in transactions exempt from registration, normally to qualified institutional buyers. The total value of all such securities was $698,638,000, which represented 2.75% of the net assets of the fund. |
| Private placement security | Acquisition date | Cost (000) | Value (000) | Percent of net assets |
| OFG Bancorp, Series C, 8.75% noncumulative convertible preferred | 6/28/2012 | $6,000 | $9,007 | .04% |
| Key to abbreviations | ||
| ADR = American Depositary Receipts | ||
| HKD = Hong Kong dollars |
| Common stocks 90.06% Financials 23.43% | Shares | Value (000) |
| Prudential PLC1 | 1,049,574 | $24,153 |
| Aviva PLC1 | 2,081,000 | 15,593 |
| Wharf (Holdings) Ltd.1 | 2,071,000 | 14,872 |
| Siam Commercial Bank PCL1 | 2,665,000 | 14,724 |
| Barclays PLC1 | 3,872,500 | 14,559 |
| BNP Paribas SA1 | 233,700 | 13,733 |
| St. James’s Place PLC1 | 1,048,000 | 13,170 |
| Cheung Kong (Holdings) Ltd.1 | 610,000 | 10,179 |
| Banco Bilbao Vizcaya Argentaria, SA1 | 635,533 | 5,981 |
| Banco Bilbao Vizcaya Argentaria, SA (ADR) | 320,944 | 3,014 |
| Axis Bank Ltd.1 | 906,000 | 7,158 |
| Assicurazioni Generali SpA1 | 340,000 | 6,948 |
| Japan Real Estate Investment Corp.1 | 1,432 | 6,892 |
| Banco Santander, SA1,2 | 822,244 | 6,875 |
| Mitsubishi UFJ Financial Group, Inc.1 | 1,205,000 | 6,605 |
| Credit Suisse Group AG1 | 240,219 | 6,022 |
| Fibra Uno Administración, SA de CV | 1,975,000 | 5,820 |
| Toronto-Dominion Bank | 113,000 | 5,399 |
| Legal & General Group PLC1 | 1,390,000 | 5,339 |
| Link Real Estate Investment Trust1 | 821,000 | 5,125 |
| HDFC Bank Ltd.1 | 333,000 | 4,994 |
| Mitsui Fudosan Co., Ltd.1 | 172,000 | 4,626 |
| HSBC Holdings PLC (HKD denominated)1 | 461,368 | 4,389 |
| Bank of Ireland1,2 | 11,762,000 | 4,380 |
| Standard Life PLC1 | 647,120 | 3,986 |
| Sampo Oyj, Class A1 | 82,700 | 3,878 |
| PT Bank Rakyat Indonesia (Persero) Tbk1 | 4,084,000 | 3,803 |
| Investor AB, Class B1 | 93,600 | 3,392 |
| Svenska Handelsbanken AB, Class A1 | 67,500 | 3,152 |
| Bankia, SA1,2 | 1,908,000 | 2,829 |
| Sberbank of Russia (ADR)1 | 580,500 | 2,333 |
| Sberbank of Russia (GDR)1,3 | 116,832 | 469 |
| ING Groep NV, depository receipts1,2 | 109,000 | 1,411 |
| BM&FBOVESPA SA, ordinary nominative | 110,800 | 411 |
| 236,214 | ||
| Utilities 12.75% | ||
| EDP - Energias de Portugal, SA1 | 8,130,084 | 31,443 |
| SSE PLC1 | 1,056,225 | 26,516 |
| Fortum Oyj1 | 865,793 | 18,709 |
| National Grid PLC1 | 1,044,870 | 14,895 |
| ENDESA, SA1 | 650,236 | 12,915 |
| Power Assets Holdings Ltd.1 | 1,013,000 | 9,786 |
| PT Perusahaan Gas Negara (Persero) Tbk1 | 15,009,239 | 7,230 |
| Common stocks Utilities (continued) | Shares | Value (000) |
| ENN Energy Holdings Ltd.1 | 858,000 | $4,852 |
| Power Grid Corp. of India Ltd.1 | 1,000,853 | 2,182 |
| 128,528 | ||
| Consumer discretionary 12.30% | ||
| H & M Hennes & Mauritz AB, Class B1 | 460,700 | 19,111 |
| HUGO BOSS AG1 | 84,900 | 10,423 |
| Numericable Group SA, non-registered shares1,2 | 210,435 | 10,377 |
| L’Occitane International SA1 | 2,840,000 | 7,147 |
| Daily Mail and General Trust PLC, Class A, nonvoting1 | 543,600 | 6,980 |
| Barratt Developments PLC1 | 879,000 | 6,401 |
| Crown Resorts Ltd.1 | 564,000 | 5,794 |
| Genting Singapore PLC1 | 7,083,000 | 5,739 |
| SJM Holdings Ltd.1 | 3,148,000 | 4,978 |
| WPP PLC1 | 221,600 | 4,597 |
| ProSiebenSat.1 Media AG1 | 107,549 | 4,531 |
| Inchcape PLC1 | 373,000 | 4,175 |
| Rightmove PLC1 | 119,000 | 4,143 |
| Liberty Global PLC, Class C2 | 57,700 | 2,787 |
| Liberty Global PLC, Class A2 | 18,500 | 929 |
| Whitbread PLC1 | 44,297 | 3,269 |
| adidas AG1 | 46,000 | 3,206 |
| PT Surya Citra Media Tbk1 | 11,260,000 | 3,184 |
| Galaxy Entertainment Group Ltd.1 | 550,000 | 3,062 |
| RTL Group SA, non-registered shares1 | 32,100 | 3,050 |
| Sands China Ltd.1 | 486,000 | 2,364 |
| Daimler AG1 | 24,700 | 2,061 |
| Ladbrokes PLC1 | 938,100 | 1,602 |
| Porsche Automobil Holding SE, nonvoting preferred1 | 18,500 | 1,503 |
| Li & Fung Ltd.1 | 1,146,900 | 1,073 |
| Golden Eagle Retail Group Ltd.1 | 427,000 | 479 |
| Volkswagen AG, nonvoting preferred1 | 1,873 | 418 |
| Kingfisher PLC1 | 68,900 | 363 |
| Global Brands Group Holding Ltd.1,2 | 1,146,900 | 224 |
| 123,970 | ||
| Consumer staples 10.81% | ||
| Philip Morris International Inc. | 348,000 | 28,345 |
| British American Tobacco PLC1 | 292,400 | 15,887 |
| Imperial Tobacco Group PLC1 | 317,000 | 13,882 |
| Japan Tobacco Inc.1 | 396,600 | 10,890 |
| CALBEE, Inc.1 | 284,400 | 9,818 |
| Nestlé SA1 | 124,000 | 9,089 |
| Glanbia PLC1 | 428,000 | 6,572 |
| Associated British Foods PLC1 | 129,700 | 6,301 |
| Pernod Ricard SA1 | 49,250 | 5,461 |
| Orion Corp.1 | 3,000 | 2,759 |
| 109,004 | ||
| Health care 10.60% | ||
| Novartis AG1 | 393,870 | 36,223 |
| Glenmark Pharmaceuticals Ltd.1 | 1,180,000 | 14,351 |
| Orion Oyj, Class B1 | 429,600 | 13,337 |
| Sonic Healthcare Ltd.1 | 618,000 | 9,281 |
| Bayer AG1 | 49,500 | 6,767 |
| Common stocks Health care (continued) | Shares | Value (000) |
| UCB SA1 | 85,200 | $6,466 |
| Fresenius SE & Co. KGaA1 | 111,000 | 5,796 |
| Novo Nordisk A/S, Class B1 | 136,430 | 5,773 |
| Grifols, SA, Class B, non-registered shares1 | 166,000 | 5,639 |
| Fresenius Medical Care AG & Co. KGaA1 | 43,100 | 3,226 |
| 106,859 | ||
| Industrials 7.83% | ||
| easyJet PLC1 | 580,489 | 14,983 |
| ASSA ABLOY AB, Class B1 | 206,800 | 10,929 |
| Ryanair Holdings PLC (ADR)2 | 106,000 | 7,555 |
| BAE Systems PLC1 | 1,000,000 | 7,300 |
| Rolls-Royce Holdings PLC1,2 | 525,000 | 7,072 |
| Jardine Matheson Holdings Ltd.1 | 115,000 | 6,998 |
| Bunzl PLC1 | 170,752 | 4,655 |
| Deutsche Post AG1 | 141,000 | 4,613 |
| Hutchison Whampoa Ltd.1 | 347,000 | 3,973 |
| Schneider Electric SE1 | 45,314 | 3,292 |
| AB Volvo, Class B1 | 249,800 | 2,698 |
| Babcock International Group PLC1 | 164,300 | 2,688 |
| Andritz AG1 | 40,000 | 2,198 |
| 78,954 | ||
| Energy 4.48% | ||
| Royal Dutch Shell PLC, Class A (GBP denominated)1 | 389,000 | 12,894 |
| Veresen Inc. | 692,000 | 10,936 |
| BP PLC1 | 1,336,800 | 8,488 |
| BG Group PLC1 | 474,000 | 6,309 |
| Suncor Energy Inc. | 123,987 | 3,938 |
| Canadian Natural Resources, Ltd. | 83,000 | 2,566 |
| 45,131 | ||
| Materials 3.18% | ||
| Syngenta AG1 | 29,080 | 9,338 |
| Fortescue Metals Group Ltd.1 | 3,175,000 | 6,997 |
| Rio Tinto PLC1 | 115,000 | 5,298 |
| Vale SA, Class A, preferred nominative (ADR) | 429,185 | 3,116 |
| Amcor Ltd.1 | 282,000 | 3,103 |
| BASF SE1 | 31,200 | 2,637 |
| Rexam PLC1 | 231,111 | 1,625 |
| 32,114 | ||
| Telecommunication services 3.15% | ||
| China Mobile Ltd.1 | 700,000 | 8,223 |
| Intouch Holdings PCL1 | 1,983,000 | 4,721 |
| Advanced Info Service PCL1 | 530,400 | 4,039 |
| Bharti Infratel Ltd.1 | 620,000 | 3,306 |
| China Communications Services Corp. Ltd., Class H1 | 7,054,800 | 3,302 |
| Singapore Telecommunications Ltd.1 | 1,075,000 | 3,156 |
| OJSC Mobile TeleSystems (ADR) | 362,500 | 2,603 |
| TeliaSonera AB1 | 377,000 | 2,424 |
| 31,774 |
| Common stocks Information technology 1.53% | Shares | Value (000) |
| Delta Electronics, Inc.1 | 1,380,760 | $8,204 |
| Youku Tudou Inc., Class A (ADR)2 | 265,378 | 4,726 |
| Yandex NV, Class A2 | 100,000 | 1,796 |
| Mail.Ru Group Ltd. (GDR)1,2 | 45,000 | 727 |
| 15,453 | ||
| Total common stocks (cost: $865,333,000) | 908,001 | |
| Rights & warrants 0.01% Financials 0.01% | ||
| Banco Bilbao Vizcaya Argentaria, SA, rights, non-registered shares, expire 20151,2 | 635,533 | 61 |
| Total rights & warrants (cost: $62,000) | 61 | |
| Convertible bonds 0.25% Financials 0.25% | Principal amount (000) | |
| Bank of Ireland 10.00% convertible notes 2016 | €1,950 | 2,556 |
| Total convertible bonds (cost: $2,560,000) | 2,556 | |
| Bonds, notes & other debt instruments 0.92% Corporate bonds & notes 0.54% Telecommunication services 0.36% | ||
| Altice Finco SA, First Lien, 7.75% 20223 | $450 | 452 |
| América Móvil, SAB de CV 8.46% 2036 | MXN18,100 | 1,237 |
| MTS International Funding Ltd. 8.625% 2020 | $1,050 | 1,034 |
| Numericable Group SA, First Lien, 6.00% 20223 | 950 | 956 |
| 3,679 | ||
| Energy 0.09% | ||
| Gazprom OJSC 4.95% 20223 | 825 | 673 |
| Gazprom OJSC, Series 9, 6.51% 2022 | 270 | 243 |
| 916 | ||
| Financials 0.09% | ||
| Bank of Ireland 10.24% (undated) | €680 | 866 |
| Total corporate bonds & notes | 5,461 | |
| Bonds & notes of governments & government agencies outside the U.S. 0.38% | ||
| Hungarian Government, Series 20A, 7.50% 2020 | HUF118,480 | 554 |
| Portuguese Government 5.65% 2024 | €1,270 | 1,907 |
| United Mexican States Government, Series M20, 10.00% 2024 | MXN15,000 | 1,334 |
| 3,795 | ||
| Total bonds, notes & other debt instruments (cost: $10,167,000) | 9,256 | |
| Short-term securities 8.39% | ||
| ExxonMobil Corp. 0.14% due 3/2/2015 | $13,100 | 13,097 |
| Federal Home Loan Bank 0.04% due 1/6/2015 | 10,000 | 10,000 |
| Freddie Mac 0.08% due 2/25/2015 | 10,000 | 10,000 |
| General Electric Co. 0.10% due 1/2/2015 | 7,700 | 7,700 |
| Short-term securities | Principal amount (000) | Value (000) |
| Mitsubishi UFJ Trust and Banking Corp. 0.14% due 1/13/20153 | $5,000 | $4,999 |
| Siemens Capital Co. LLC 0.11% due 1/5/20153 | 15,000 | 15,000 |
| Toronto-Dominion Holdings USA Inc. 0.14% due 1/16/20153 | 23,800 | 23,799 |
| Total short-term securities (cost: $84,594,000) | 84,595 | |
| Total investment securities 99.63% (cost: $962,716,000) | 1,004,469 | |
| Other assets less liabilities 0.37% | 3,741 | |
| Net assets 100.00% | $1,008,210 |
| 1 | Valued under fair value procedures adopted by authority of the board of trustees. The total value of all such securities, was $824,121,000, which represented 81.74% of the net assets of the fund. This entire amount relates to certain securities trading outside the U.S. whose values were adjusted as a result of significant market movements following the close of local trading. |
| 2 | Security did not produce income during the last 12 months. |
| 3 | Acquired in a transaction exempt from registration under Rule 144A or Section 4(2) of the Securities Act of 1933. May be resold in the U.S. in transactions exempt from registration, normally to qualified institutional buyers. The total value of all such securities was $46,348,000, which represented 4.60% of the net assets of the fund. |
| Key to abbreviations and symbol |
| ADR = American Depositary Receipts |
| GDR = Global Depositary Receipts |
| HKD = Hong Kong dollars |
| HUF = Hungarian forints |
| MXN = Mexican pesos |
| € = Euros |
| Common stocks 81.31% Consumer staples 12.90% | Shares | Value (000) |
| Altria Group, Inc. | 48,910 | $2,410 |
| Philip Morris International Inc. | 25,375 | 2,067 |
| Coca-Cola Co. | 31,745 | 1,340 |
| Unilever PLC1 | 25,710 | 1,044 |
| Japan Tobacco Inc.1 | 28,100 | 772 |
| Reynolds American Inc. | 7,270 | 467 |
| Kraft Foods Group, Inc. | 7,035 | 441 |
| British American Tobacco PLC1 | 7,380 | 401 |
| Procter & Gamble Co. | 3,270 | 298 |
| Coca-Cola Amatil Ltd.1 | 35,613 | 269 |
| Nestlé SA1 | 2,506 | 184 |
| 9,693 | ||
| Financials 11.39% | ||
| Sampo Oyj, Class A1 | 32,009 | 1,501 |
| Swedbank AB, Class A1 | 39,771 | 990 |
| BB&T Corp. | 22,080 | 859 |
| Mercury General Corp. | 12,410 | 703 |
| CME Group Inc., Class A | 7,595 | 673 |
| HSBC Holdings PLC (GBP denominated)1 | 69,820 | 660 |
| Wells Fargo & Co. | 11,700 | 641 |
| Bank of China Ltd., Class H1 | 978,000 | 548 |
| Svenska Handelsbanken AB, Class A1 | 10,680 | 499 |
| Aberdeen Asset Management PLC1 | 73,700 | 492 |
| Skandinaviska Enskilda Banken AB, Class A1 | 29,136 | 369 |
| People’s United Financial, Inc. | 21,050 | 319 |
| BNP Paribas SA1 | 3,309 | 194 |
| Iron Mountain Inc. | 2,895 | 112 |
| 8,560 | ||
| Health care 10.49% | ||
| Novartis AG1 | 19,363 | 1,781 |
| AstraZeneca PLC1 | 13,950 | 981 |
| AstraZeneca PLC (ADR) | 8,490 | 598 |
| Pfizer Inc. | 45,480 | 1,417 |
| GlaxoSmithKline PLC1 | 43,700 | 935 |
| Bristol-Myers Squibb Co. | 14,285 | 843 |
| Merck & Co., Inc. | 9,295 | 528 |
| Roche Holding AG1 | 1,909 | 517 |
| AbbVie Inc. | 4,320 | 282 |
| 7,882 | ||
| Utilities 9.46% | ||
| National Grid PLC1 | 109,300 | 1,558 |
| SSE PLC1 | 55,070 | 1,383 |
| Red Eléctrica Corporación, SA1 | 8,075 | 709 |
| Common stocks Utilities (continued) | Shares | Value (000) |
| Duke Energy Corp. | 8,450 | $706 |
| Infratil Ltd.1 | 226,262 | 530 |
| Power Assets Holdings Ltd.1 | 53,000 | 512 |
| Cheung Kong Infrastructure Holdings Ltd.1 | 67,000 | 494 |
| Snam SPA1 | 84,799 | 418 |
| Fortum Oyj1 | 16,126 | 348 |
| EDP - Energias de Portugal, SA1 | 83,849 | 324 |
| GDF SUEZ1 | 5,434 | 127 |
| 7,109 | ||
| Telecommunication services 9.41% | ||
| Verizon Communications Inc. | 30,770 | 1,440 |
| HKT Trust and HKT Ltd., units1 | 1,004,340 | 1,307 |
| Singapore Telecommunications Ltd.1 | 290,000 | 851 |
| CenturyLink, Inc. | 18,365 | 727 |
| Swisscom AG1 | 1,281 | 673 |
| AT&T Inc. | 18,380 | 617 |
| Vodafone Group PLC1 | 138,400 | 474 |
| TDC A/S1 | 55,720 | 425 |
| NTT DoCoMo, Inc.1 | 25,300 | 370 |
| Telstra Corp. Ltd.1 | 39,151 | 190 |
| 7,074 | ||
| Consumer discretionary 6.76% | ||
| Daimler AG1 | 12,371 | 1,032 |
| Leggett & Platt, Inc. | 17,690 | 754 |
| Greene King PLC1 | 64,220 | 745 |
| AB Electrolux, Series B1 | 20,760 | 609 |
| SES SA, Class A (FDR)1 | 15,367 | 551 |
| Gannett Co., Inc. | 11,980 | 382 |
| Bayerische Motoren Werke AG1 | 3,461 | 376 |
| Li & Fung Ltd.1 | 314,000 | 294 |
| SJM Holdings Ltd.1 | 141,000 | 223 |
| Marks and Spencer Group PLC1 | 16,000 | 118 |
| 5,084 | ||
| Energy 6.70% | ||
| Royal Dutch Shell PLC, Class B1 | 33,360 | 1,146 |
| ConocoPhillips | 11,915 | 823 |
| Enbridge Inc. | 12,370 | 636 |
| Crescent Point Energy Corp. | 25,530 | 591 |
| Kinder Morgan, Inc. | 10,300 | 436 |
| Eni SpA1 | 24,847 | 434 |
| Exxon Mobil Corp. | 4,600 | 425 |
| Chevron Corp. | 3,780 | 424 |
| Seadrill Ltd. | 10,340 | 124 |
| 5,039 | ||
| Information technology 6.33% | ||
| Microsoft Corp. | 36,160 | 1,680 |
| VTech Holdings Ltd.1 | 58,600 | 838 |
| Texas Instruments Inc. | 11,030 | 590 |
| Xilinx, Inc. | 12,940 | 560 |
| Common stocks Information technology (continued) | Shares | Value (000) |
| Paychex, Inc. | 12,010 | $554 |
| Apple Inc. | 4,872 | 538 |
| 4,760 | ||
| Industrials 4.10% | ||
| Siemens AG1 | 6,464 | 733 |
| Lockheed Martin Corp. | 3,655 | 704 |
| BAE Systems PLC1 | 69,000 | 504 |
| Boeing Co. | 3,600 | 468 |
| Nielsen NV | 8,200 | 367 |
| Safran, SA1 | 2,944 | 181 |
| Emerson Electric Co. | 2,000 | 123 |
| 3,080 | ||
| Materials 3.13% | ||
| Dow Chemical Co. | 16,715 | 762 |
| Amcor Ltd.1 | 58,498 | 644 |
| Givaudan SA1 | 285 | 510 |
| Air Products and Chemicals, Inc. | 1,610 | 232 |
| Nucor Corp. | 4,230 | 207 |
| 2,355 | ||
| Miscellaneous 0.64% | ||
| Other common stocks in initial period of acquisition | 477 | |
| Total common stocks (cost: $62,169,000) | 61,113 | |
| Bonds, notes & other debt instruments 15.53% Mortgage-backed obligations 5.90% Commercial mortgage-backed securities 3.03% | Principal amount (000) | |
| Bear Stearns Commercial Mortgage Securities Trust, Series 2007-PW16, Class A1A, 5.897% 20402,3 | $250 | 272 |
| Greenwich Capital Commercial Funding Corp., Series 2007-GG11, Class A-1-A, 5.704% 20493 | 500 | 548 |
| J.P. Morgan Chase Commercial Mortgage Securities Corp., Series 2007-LDPX, Class A-1-A, 5.439% 20493 | 474 | 507 |
| LB-UBS Commercial Mortgage Trust, Series 2006-C3, Class A1A, 5.641% 20392,3 | 239 | 249 |
| ML-CFC Commercial Mortgage Trust, Series 2006-3, Class A1A 5.409% 20462,3 | 243 | 258 |
| ML-CFC Commercial Mortgage Trust, Series 2006-4, Class A1A, 5.166% 20493 | 222 | 234 |
| Wachovia Bank Commercial Mortgage Trust, Series 2006-C25, Class A1A, 5.707% 20432,3 | 198 | 207 |
| 2,275 | ||
| Federal agency mortgage-backed obligations 2.87% | ||
| Government National Mortgage Assn. 5.616% 20593 | 240 | 254 |
| Government National Mortgage Assn. 4.81% 20603 | 161 | 172 |
| Government National Mortgage Assn. 5.46% 20603 | 155 | 169 |
| Government National Mortgage Assn. 4.664% 20613 | 212 | 228 |
| Government National Mortgage Assn. 4.797% 20613 | 196 | 210 |
| Government National Mortgage Assn. 6.856% 20613 | 114 | 124 |
| Government National Mortgage Assn. 4.559% 20623 | 58 | 63 |
| Government National Mortgage Assn. 4.625% 20623 | 462 | 503 |
| Government National Mortgage Assn. 4.356% 20633 | 145 | 159 |
| Government National Mortgage Assn. 4.491% 20633 | 59 | 65 |
| Government National Mortgage Assn. 4.549% 20633 | 192 | 211 |
| 2,158 | ||
| Total mortgage-backed obligations | 4,433 |
| Bonds, notes & other debt instruments U.S. Treasury bonds & notes 4.74% U.S. Treasury 2.78% | Principal amount (000) | Value (000) |
| U.S. Treasury 3.625% 2019 | $150 | $164 |
| U.S. Treasury 3.50% 2020 | 1,450 | 1,582 |
| U.S. Treasury 2.75% 2023 | 330 | 347 |
| 2,093 | ||
| U.S. Treasury inflation-protected securities 1.96% | ||
| U.S. Treasury Inflation-Protected Security 0.125% 20244 | 1,400 | 1,355 |
| U.S. Treasury Inflation-Protected Security 1.375% 20444 | 102 | 116 |
| 1,471 | ||
| Total U.S. Treasury bonds & notes | 3,564 | |
| Corporate bonds & notes 3.35% Financials 1.09% | ||
| American International Group, Inc. 6.40% 2020 | 100 | 119 |
| Bank of America Corp. 5.625% 2020 | 100 | 114 |
| Developers Diversified Realty Corp. 7.875% 2020 | 100 | 124 |
| Goldman Sachs Group, Inc., Series D, 6.00% 2020 | 100 | 116 |
| JPMorgan Chase & Co. 6.30% 2019 | 100 | 116 |
| Morgan Stanley 7.30% 2019 | 100 | 119 |
| Wells Fargo & Co. 5.625% 2017 | 100 | 111 |
| 819 | ||
| Consumer discretionary 0.87% | ||
| Comcast Corp. 5.15% 2020 | 100 | 113 |
| Ford Motor Credit Co. 8.125% 2020 | 100 | 124 |
| Time Warner Inc. 4.05% 2023 | 169 | 178 |
| Time Warner Inc. 3.55% 2024 | 132 | 132 |
| Viacom Inc. 5.625% 2019 | 100 | 112 |
| 659 | ||
| Energy 0.45% | ||
| Enbridge Energy Partners, LP, Series B, 6.50% 2018 | 100 | 113 |
| Enterprise Products Operating LLC 6.50% 2019 | 100 | 115 |
| Kinder Morgan Energy Partners, LP 5.30% 2020 | 100 | 108 |
| 336 | ||
| Industrials 0.16% | ||
| Caterpillar Financial Services Corp. 7.15% 2019 | 100 | 120 |
| Health care 0.16% | ||
| McKesson Corp. 7.50% 2019 | 100 | 120 |
| Utilities 0.16% | ||
| Nevada Power Co., General and Refunding Mortgage Notes, Series V, 7.125% 2019 | 100 | 119 |
| Materials 0.16% | ||
| BHP Billiton Finance (USA) Ltd. 6.50% 2019 | 100 | 118 |
| Bonds, notes & other debt instruments Corporate bonds & notes (continued) Consumer staples 0.15% | Principal amount (000) | Value (000) |
| Kraft Foods Inc. 6.125% 2018 | $100 | $114 |
| Telecommunication services 0.15% | ||
| Verizon Communications Inc. 5.50% 2018 | 100 | 111 |
| Total corporate bonds & notes | 2,516 | |
| Asset-backed obligations 1.54% | ||
| AmeriCredit Automobile Receivables Trust, Series 2014-4, Class A-2-A, 0.72% 20183 | 110 | 110 |
| Santander Drive Auto Receivables Trust, Series 2012-2, Class C, 3.20% 20153 | 850 | 859 |
| Santander Drive Auto Receivables Trust, Series 2011-4, Class C, 3.82% 20153 | 189 | 191 |
| 1,160 | ||
| Total bonds, notes & other debt instruments (cost: $11,676,000) | 11,673 | |
| Short-term securities 2.79% | ||
| ExxonMobil Corp. 0.08% due 1/27/2015 | 1,000 | 1,000 |
| General Electric Co. 0.10% due 1/2/2015 | 1,100 | 1,100 |
| Total short-term securities (cost: $2,100,000) | 2,100 | |
| Total investment securities 99.63% (cost: $75,945,000) | 74,886 | |
| Other assets less liabilities 0.37% | 280 | |
| Net assets 100.00% | $75,166 |
| 1 | Valued under fair value procedures adopted by authority of the board of trustees. The total value of all such securities, including those in “Miscellaneous,“ was $32,245,000, which represented 42.90% of the net assets of the fund. This entire amount relates to certain securities trading outside the U.S. whose values were adjusted as a result of significant market movements following the close of local trading. |
| 2 | Coupon rate may change periodically. |
| 3 | Principal payments may be made periodically. Therefore, the effective maturity date may be earlier than the stated maturity date. |
| 4 | Index-linked bond whose principal amount moves with a government price index. |
| Key to abbreviations |
| ADR = American Depositary Receipts |
| FDR = Fiduciary Depositary Receipts |
| GBP = British pounds |
| Common stocks 67.47% Information technology 11.11% | Shares | Value (000) |
| Microsoft Corp. | 14,225,000 | $660,751 |
| ASML Holding NV (New York registered) | 2,162,000 | 233,128 |
| KLA-Tencor Corp. | 2,500,000 | 175,800 |
| Texas Instruments Inc. | 3,000,000 | 160,395 |
| VeriSign, Inc.1 | 2,675,000 | 152,475 |
| Autodesk, Inc.1 | 2,000,000 | 120,120 |
| Taiwan Semiconductor Manufacturing Co. Ltd. (ADR) | 5,000,000 | 111,900 |
| Cisco Systems, Inc. | 4,000,000 | 111,260 |
| AAC Technologies Holdings Inc.2 | 19,000,000 | 100,971 |
| Google Inc., Class A1 | 77,000 | 40,861 |
| Google Inc., Class C1 | 77,000 | 40,533 |
| Analog Devices, Inc. | 438,026 | 24,319 |
| Amphenol Corp., Class A | 350,000 | 18,834 |
| 1,951,347 | ||
| Consumer discretionary 10.81% | ||
| Comcast Corp., Class A | 7,100,000 | 411,871 |
| Amazon.com, Inc.1 | 1,065,000 | 330,523 |
| Home Depot, Inc. | 2,405,000 | 252,453 |
| Twenty-First Century Fox, Inc., Class A | 4,750,000 | 182,424 |
| VF Corp. | 1,800,000 | 134,820 |
| Gentex Corp. | 3,500,000 | 126,455 |
| General Motors Co. | 3,500,000 | 122,185 |
| Walt Disney Co. | 1,150,000 | 108,318 |
| NIKE, Inc., Class B | 1,040,000 | 99,996 |
| Johnson Controls, Inc. | 1,120,000 | 54,141 |
| Norwegian Cruise Line Holdings Ltd.1 | 450,000 | 21,042 |
| Naspers Ltd., Class N2 | 140,000 | 18,025 |
| Time Warner Inc. | 200,000 | 17,084 |
| Cooper-Standard Holdings Inc.1 | 208,685 | 12,079 |
| Hyatt Hotels Corp., Class A1 | 127,395 | 7,670 |
| Revel AC, Inc. (CVR)1,2,3 | 8,851,470 | 0 |
| Revel AC, Inc.1,2,3 | 91,401 | 0 |
| 1,899,086 | ||
| Financials 10.01% | ||
| ACE Ltd. | 2,620,000 | 300,986 |
| JPMorgan Chase & Co. | 4,750,000 | 297,255 |
| American Express Co. | 2,400,000 | 223,296 |
| Citigroup Inc. | 2,750,000 | 148,802 |
| First Republic Bank | 2,000,000 | 104,240 |
| Marsh & McLennan Companies, Inc. | 1,740,000 | 99,598 |
| Capital One Financial Corp. | 1,200,000 | 99,060 |
| Bank of America Corp. | 5,000,000 | 89,450 |
| Goldman Sachs Group, Inc. | 450,000 | 87,223 |
| Allstate Corp. | 1,000,000 | 70,250 |
| Common stocks Financials (continued) | Shares | Value (000) |
| Synchrony Financial1 | 2,000,000 | $59,500 |
| Sumitomo Mitsui Financial Group, Inc. (ADR) | 7,500,000 | 54,600 |
| Arch Capital Group Ltd.1 | 860,000 | 50,826 |
| Weyerhaeuser Co.1 | 600,000 | 21,534 |
| U.S. Bancorp | 450,000 | 20,227 |
| Moody’s Corp. | 165,798 | 15,885 |
| American Tower Corp. | 150,000 | 14,828 |
| 1,757,560 | ||
| Industrials 8.00% | ||
| Lockheed Martin Corp. | 2,115,000 | 407,286 |
| Boeing Co. | 1,720,000 | 223,566 |
| Cummins Inc. | 1,230,000 | 177,329 |
| Danaher Corp. | 1,220,000 | 104,566 |
| Rockwell Collins, Inc. | 1,180,000 | 99,687 |
| Parker-Hannifin Corp. | 700,000 | 90,265 |
| General Electric Co. | 3,500,000 | 88,445 |
| Fastenal Co. | 1,800,000 | 85,608 |
| United Technologies Corp. | 515,000 | 59,225 |
| Precision Castparts Corp. | 80,000 | 19,270 |
| Rockwell Automation | 165,000 | 18,348 |
| Rolls-Royce Holdings PLC1,2 | 1,100,000 | 14,818 |
| Waste Connections, Inc. | 275,000 | 12,097 |
| CEVA Group PLC1,2,4 | 6,142 | 4,760 |
| Atrium Corp.1,2,4 | 535 | 1 |
| 1,405,271 | ||
| Health care 7.29% | ||
| Merck & Co., Inc. | 6,350,000 | 360,616 |
| Johnson & Johnson | 2,075,000 | 216,983 |
| UnitedHealth Group Inc. | 1,500,000 | 151,635 |
| Incyte Corp.1 | 2,000,000 | 146,220 |
| Pfizer Inc. | 4,210,000 | 131,141 |
| Roche Holding AG2 | 350,000 | 94,864 |
| Thermo Fisher Scientific Inc. | 600,000 | 75,174 |
| Bristol-Myers Squibb Co. | 750,000 | 44,273 |
| Humana Inc. | 304,000 | 43,664 |
| PerkinElmer, Inc. | 300,000 | 13,119 |
| Rotech Healthcare Inc.1,2 | 184,138 | 3,106 |
| 1,280,795 | ||
| Energy 7.19% | ||
| Chevron Corp. | 1,625,000 | 182,292 |
| Noble Energy, Inc. | 3,600,000 | 170,748 |
| Chesapeake Energy Corp. | 7,700,000 | 150,689 |
| Concho Resources Inc.1 | 1,238,816 | 123,572 |
| Core Laboratories NV | 800,000 | 96,272 |
| Kinder Morgan, Inc. | 2,150,000 | 90,967 |
| Schlumberger Ltd. | 870,000 | 74,307 |
| ConocoPhillips | 965,000 | 66,643 |
| National Oilwell Varco Inc. | 1,000,000 | 65,530 |
| Denbury Resources Inc. | 8,000,000 | 65,040 |
| Weatherford International PLC1 | 4,000,000 | 45,800 |
| Enbridge Inc. | 875,450 | 45,007 |
| Transocean Ltd. | 2,000,000 | 36,660 |
| Common stocks Energy (continued) | Shares | Value (000) |
| Royal Dutch Shell PLC, Class B (ADR) | 440,000 | $30,606 |
| FMC Technologies, Inc.1 | 400,000 | 18,736 |
| 1,262,869 | ||
| Materials 4.84% | ||
| FMC Corp. | 3,250,000 | 185,347 |
| Dow Chemical Co. | 2,500,000 | 114,025 |
| Potash Corp. of Saskatchewan Inc. | 3,100,000 | 109,492 |
| Monsanto Co. | 900,000 | 107,523 |
| LyondellBasell Industries NV | 1,250,000 | 99,237 |
| Mosaic Co. | 1,850,000 | 84,453 |
| Nucor Corp. | 1,500,000 | 73,575 |
| First Quantum Minerals Ltd. | 2,700,000 | 38,369 |
| Cliffs Natural Resources Inc. | 2,700,000 | 19,278 |
| Praxair, Inc. | 135,000 | 17,491 |
| NewPage Holdings Inc.3 | 11,920 | 1,043 |
| 849,833 | ||
| Consumer staples 4.62% | ||
| Coca-Cola Co. | 3,440,000 | 145,237 |
| Philip Morris International Inc. | 1,750,000 | 142,537 |
| Unilever NV (New York registered) | 3,445,000 | 134,493 |
| Nestlé SA2 | 1,310,000 | 96,025 |
| Procter & Gamble Co. | 770,000 | 70,139 |
| Colgate-Palmolive Co. | 920,000 | 63,655 |
| Kraft Foods Group, Inc. | 970,000 | 60,780 |
| Kimberly-Clark Corp. | 475,000 | 54,882 |
| Altria Group, Inc. | 375,000 | 18,476 |
| PepsiCo, Inc. | 150,000 | 14,184 |
| Herbalife Ltd. | 300,000 | 11,310 |
| 811,718 | ||
| Telecommunication services 0.71% | ||
| Verizon Communications Inc. | 1,565,000 | 73,211 |
| AT&T Inc. | 1,500,000 | 50,385 |
| 123,596 | ||
| Utilities 0.27% | ||
| Exelon Corp. | 1,250,000 | 46,350 |
| Miscellaneous 2.62% | ||
| Other common stocks in initial period of acquisition | 460,600 | |
| Total common stocks (cost: $8,330,362,000) | 11,849,025 | |
| Convertible stocks 0.06% Industrials 0.06% | ||
| CEVA Group PLC, Series A-1, 3.253% convertible preferred2 | 6,267 | 6,266 |
| CEVA Group PLC, Series A-2, 2.253% convertible preferred2,3 | 5,998 | 4,649 |
| Total convertible stocks (cost: $15,028,000) | 10,915 |
| Bonds, notes & other debt instruments 25.00% U.S. Treasury bonds & notes 10.96% U.S. Treasury 7.99% | Principal amount (000) | Value (000) |
| U.S. Treasury 0.25% 2015 | $236,000 | $236,156 |
| U.S. Treasury 1.375% 2015 | 30,000 | 30,305 |
| U.S. Treasury 1.50% 20165 | 79,000 | 80,190 |
| U.S. Treasury 2.00% 2016 | 10,500 | 10,687 |
| U.S. Treasury 7.25% 2016 | 2,000 | 2,185 |
| U.S. Treasury 0.875% 2017 | 50,000 | 50,023 |
| U.S. Treasury 0.625% 2018 | 143,000 | 140,129 |
| U.S. Treasury 3.50% 2018 | 20,000 | 21,428 |
| U.S. Treasury 1.50% 2019 | 400,000 | 400,220 |
| U.S. Treasury 1.50% 2019 | 59,000 | 58,619 |
| U.S. Treasury 1.625% 2019 | 35,000 | 35,057 |
| U.S. Treasury 1.75% 2019 | 21,000 | 21,120 |
| U.S. Treasury 2.25% 2024 | 8,000 | 8,058 |
| U.S. Treasury 2.375% 2024 | 70,000 | 71,280 |
| U.S. Treasury 2.75% 2024 | 130,000 | 136,764 |
| U.S. Treasury 3.75% 2041 | 12,000 | 14,475 |
| U.S. Treasury 4.75% 2041 | 15,000 | 20,974 |
| U.S. Treasury 3.125% 2043 | 49,500 | 53,170 |
| U.S. Treasury 3.375% 2044 | 10,000 | 11,263 |
| 1,402,103 | ||
| U.S. Treasury inflation-protected securities 2.97% | ||
| U.S. Treasury Inflation-Protected Security 0.125% 20196 | 101,337 | 100,429 |
| U.S. Treasury Inflation-Protected Security 0.625% 20246 | 179,108 | 180,727 |
| U.S. Treasury Inflation-Protected Security 0.75% 20426 | 4,204 | 4,117 |
| U.S. Treasury Inflation-Protected Security 0.625% 20436 | 15,492 | 14,687 |
| U.S. Treasury Inflation-Protected Security 1.375% 20446 | 194,373 | 222,160 |
| 522,120 | ||
| Total U.S. Treasury bonds & notes | 1,924,223 | |
| Corporate bonds & notes 7.77% Financials 1.41% | ||
| American Campus Communities, Inc. 3.75% 2023 | 2,000 | 2,000 |
| American Campus Communities, Inc. 4.125% 2024 | 2,835 | 2,869 |
| American International Group, Inc. 3.375% 2020 | 5,500 | 5,721 |
| Bank of America Corp., Series L, 2.65% 2019 | 3,500 | 3,529 |
| Bank of America Corp. 4.00% 2024 | 5,500 | 5,733 |
| Bank of Nova Scotia 2.55% 2017 | 6,000 | 6,157 |
| BB&T Corp. 2.45% 2020 | 6,000 | 5,991 |
| BPCE SA group 4.00% 2024 | 3,000 | 3,143 |
| BPCE SA group 4.625% 20244 | 2,400 | 2,334 |
| BPCE SA group 5.15% 20244 | 2,955 | 3,051 |
| Brandywine Operating Partnership, LP 3.95% 2023 | 380 | 384 |
| CIT Group Inc. 5.00% 2017 | 5,700 | 5,928 |
| CIT Group Inc. 5.25% 2018 | 1,125 | 1,176 |
| CIT Group Inc. 3.875% 2019 | 12,735 | 12,735 |
| CIT Group Inc., Series C, 5.50% 20194 | 1,100 | 1,164 |
| Corporate Office Properties LP 5.25% 2024 | 3,595 | 3,868 |
| Credit Suisse Group AG 3.625% 2024 | 3,950 | 4,023 |
| Crescent Resources 10.25% 20174 | 2,050 | 2,209 |
| Developers Diversified Realty Corp. 7.50% 2017 | 3,460 | 3,879 |
| Essex Portfolio L.P. 3.875% 2024 | 2,115 | 2,156 |
| Goldman Sachs Group, Inc. 2.55% 2019 | 8,000 | 7,971 |
| Bonds, notes & other debt instruments Corporate bonds & notes (continued) Financials (continued) | Principal amount (000) | Value (000) |
| Goldman Sachs Group, Inc. 3.85% 2024 | $3,000 | $3,080 |
| Hospitality Properties Trust 6.30% 2016 | 3,000 | 3,135 |
| Hospitality Properties Trust 6.70% 2018 | 6,540 | 7,231 |
| HSBC Holdings PLC 4.25% 2024 | 3,000 | 3,128 |
| Icahn Enterprises Finance Corp. 3.50% 2017 | 8,825 | 8,847 |
| Intercontinentalexchange, Inc. 2.50% 2018 | 7,000 | 7,134 |
| Intesa Sanpaolo SpA 5.017% 20244 | 5,730 | 5,571 |
| iStar Financial Inc. 4.00% 2017 | 7,275 | 7,102 |
| iStar Financial Inc., Series B, 9.00% 2017 | 2,330 | 2,557 |
| JPMorgan Chase & Co. 1.35% 2017 | 1,515 | 1,516 |
| JPMorgan Chase & Co. 3.25% 2022 | 3,000 | 3,023 |
| JPMorgan Chase & Co. 3.20% 2023 | 3,000 | 3,004 |
| JPMorgan Chase & Co. 3.875% 2024 | 6,000 | 6,012 |
| Kimco Realty Corp. 6.875% 2019 | 2,375 | 2,818 |
| Kimco Realty Corp. 3.125% 2023 | 2,820 | 2,768 |
| Lloyds Banking Group PLC 2.30% 2018 | 1,810 | 1,829 |
| Lloyds Banking Group PLC 4.50% 2024 | 6,000 | 6,067 |
| MetLife Global Funding I 2.30% 20194 | 4,720 | 4,743 |
| Morgan Stanley, Series F, 3.875% 2024 | 9,500 | 9,766 |
| Ocwen Financial Corp. 6.625% 20194 | 2,725 | 2,507 |
| PNC Financial Services Group, Inc. 2.854% 2022 | 1,500 | 1,478 |
| PNC Financial Services Group, Inc. 3.90% 2024 | 6,000 | 6,110 |
| Prudential Financial, Inc. 3.50% 2024 | 6,000 | 6,111 |
| QBE Insurance Group Ltd. 2.40% 20184 | 5,000 | 5,004 |
| Rabobank Nederland 4.625% 2023 | 4,640 | 4,931 |
| Realogy Corp. 4.50% 20194 | 11,225 | 11,169 |
| Realogy Corp. 5.25% 20214 | 1,500 | 1,464 |
| Realogy Corp., LOC, 4.40% 20167,8,9 | 380 | 377 |
| Scentre Group, 3.50% 20254 | 3,970 | 3,994 |
| Toronto-Dominion Bank 2.25% 2019 | 5,000 | 5,016 |
| US Bancorp. 3.70% 2024 | 7,000 | 7,373 |
| Wells Fargo & Co. 2.125% 2019 | 9,000 | 9,007 |
| Wells Fargo & Co. 3.30% 2024 | 8,000 | 8,060 |
| 247,953 | ||
| Health care 1.28% | ||
| AbbVie Inc. 4.40% 2042 | 4,000 | 4,143 |
| Bayer AG 2.375% 20194 | 2,750 | 2,764 |
| Celgene Corp 3.625% 2024 | 3,000 | 3,069 |
| Celgene Corp 4.625% 2044 | 1,000 | 1,042 |
| Centene Corp. 5.75% 2017 | 2,745 | 2,923 |
| Centene Corp. 4.75% 2022 | 4,485 | 4,502 |
| Community Health Systems, Inc. 5.125% 2018 | 1,895 | 1,966 |
| ConvaTec Finance International SA 8.25% 20194,7,10 | 5,125 | 5,205 |
| DJO Finance LLC 9.75% 2017 | 2,835 | 2,849 |
| DJO Finance LLC 7.75% 2018 | 5,955 | 5,806 |
| DJO Finance LLC 9.875% 2018 | 3,015 | 3,075 |
| Forest Laboratories, Inc. 5.00% 20214 | 2,565 | 2,782 |
| Gilead Sciences, Inc. 3.05% 2016 | 4,300 | 4,465 |
| Gilead Sciences, Inc. 3.70% 2024 | 1,360 | 1,429 |
| HCA Inc. 3.75% 2019 | 15,415 | 15,473 |
| inVentiv Health Inc, Term Loan B4, 7.75% 20187,8,9 | 3,075 | 3,065 |
| inVentiv Health Inc. 9.00% 20184 | 5,700 | 5,843 |
| inVentiv Health Inc. 11.00% 20184 | 4,776 | 4,167 |
| Bonds, notes & other debt instruments Corporate bonds & notes (continued) Health care (continued) | Principal amount (000) | Value (000) |
| inVentiv Health Inc. 11.00% 20184 | $2,010 | $1,764 |
| inVentiv Health Inc. 12.00% 20184,7,10 | 9,750 | 9,214 |
| Jaguar Holding Co. 9.375% 20174,7,10 | 300 | 307 |
| Kindred Healthcare, Inc. 8.00% 20204 | 2,925 | 3,123 |
| Kinetic Concepts, Inc. 10.50% 2018 | 12,990 | 14,159 |
| Kinetic Concepts, Inc. 12.50% 2019 | 7,235 | 8,031 |
| McKesson Corp. 3.796% 2024 | 3,500 | 3,602 |
| Medtronic, Inc. 4.375% 20354 | 2,710 | 2,885 |
| Medtronic, Inc. 4.625% 20454 | 2,885 | 3,141 |
| Multiplan Inc., Term Loan B, 3.75% 20217,8,9 | 10,682 | 10,408 |
| Novartis Capital Corp. 2.90% 2015 | 6,000 | 6,047 |
| Novartis Capital Corp. 3.40% 2024 | 3,660 | 3,815 |
| Ortho-Clinical Diagnostics Inc., Term Loan B, 4.75% 20217,8,9 | 4,637 | 4,570 |
| Pfizer Inc. 2.10% 2019 | 4,190 | 4,217 |
| Pfizer Inc. 3.40% 2024 | 915 | 954 |
| Pfizer Inc. 4.40% 2044 | 3,000 | 3,277 |
| PRA Holdings, Inc. 9.50% 20234 | 1,260 | 1,367 |
| Roche Holdings, Inc. 2.875% 20214 | 8,000 | 8,112 |
| Rotech Healthcare Inc., Term Loan A, 5.50% 20182,7,8,9 | 3,061 | 3,046 |
| Rotech Healthcare Inc., Term Loan B, 10.00% 20192,7,8,9 | 2,400 | 2,388 |
| Rotech Healthcare Inc., Term Loan, 13.00% 20202,7,8,9,10 | 5,112 | 5,086 |
| Tenet Healthcare Corp., First Lien, 4.75% 2020 | 5,240 | 5,345 |
| Tenet Healthcare Corp., First Lien, 6.00% 2020 | 6,780 | 7,298 |
| Tenet Healthcare Corp., First Lien, 4.50% 2021 | 3,725 | 3,748 |
| Thermo Fisher Scientific Inc. 2.40% 2019 | 4,000 | 4,010 |
| Thermo Fisher Scientific Inc. 4.15% 2024 | 4,000 | 4,226 |
| VPI Escrow Corp. 6.75% 20184 | 8,150 | 8,690 |
| VPI Escrow Corp. 6.375% 20204 | 7,530 | 7,897 |
| VWR Funding, Inc. 7.25% 2017 | 9,195 | 9,643 |
| 224,938 | ||
| Telecommunication services 0.93% | ||
| Deutsche Telekom International Finance BV 9.25% 2032 | 3,870 | 6,272 |
| Deutsche Telekom International Finance BV 4.875% 20424 | 200 | 215 |
| France Télécom 4.125% 2021 | 5,000 | 5,364 |
| Frontier Communications Corp. 8.125% 2018 | 7,200 | 8,118 |
| Frontier Communications Corp. 8.50% 2020 | 1,700 | 1,904 |
| Frontier Communications Corp. 6.875% 2025 | 1,225 | 1,228 |
| Intelsat Jackson Holding Co. 6.625% 2022 | 13,500 | 13,939 |
| Intelsat Luxembourg Holding Co. 6.75% 2018 | 1,300 | 1,333 |
| MetroPCS Wireless, Inc. 6.25% 2021 | 6,775 | 6,960 |
| MetroPCS Wireless, Inc. 6.625% 2023 | 8,550 | 8,798 |
| NII Capital Corp. 10.00% 201611 | 9,700 | 3,395 |
| NII Capital Corp. 7.875% 20194,11 | 5,225 | 3,788 |
| NII Capital Corp. 8.875% 201911 | 3,800 | 1,349 |
| NII Capital Corp. 11.375% 20194,11 | 5,860 | 4,248 |
| NII Capital Corp. 7.625% 202111 | 13,670 | 2,597 |
| Numericable Group SA, First Lien, 4.875% 20194 | 14,350 | 14,278 |
| Orange SA 5.50% 2044 | 3,000 | 3,533 |
| SoftBank Corp. 4.50% 20204 | 3,850 | 3,807 |
| Sprint Nextel Corp. 7.00% 2020 | 9,200 | 9,246 |
| Sprint Nextel Corp. 11.50% 2021 | 3,700 | 4,468 |
| Sprint Nextel Corp. 7.875% 2023 | 10,000 | 9,922 |
| Telecom Italia Capital SA 6.999% 2018 | 6,325 | 7,052 |
| Bonds, notes & other debt instruments Corporate bonds & notes (continued) Telecommunication services (continued) | Principal amount (000) | Value (000) |
| T-Mobile US, Inc. 6.542% 2020 | $6,475 | $6,710 |
| T-Mobile US, Inc. 6.375% 2025 | 725 | 738 |
| Trilogy International Partners, LLC 10.25% 20164 | 10,500 | 10,539 |
| Verizon Communications Inc. 3.00% 2021 | 3,000 | 2,963 |
| Verizon Communications Inc. 6.55% 2043 | 2,640 | 3,387 |
| Verizon Communications Inc. 4.862% 20464 | 3,000 | 3,089 |
| Wind Acquisition SA 4.75% 20204 | 7,575 | 7,102 |
| Wind Acquisition SA 7.375% 20214 | 7,000 | 6,624 |
| 162,966 | ||
| Industrials 0.84% | ||
| ADT Corp. 4.125% 2019 | 5,900 | 5,856 |
| AECOM Technology Corp. 5.75% 20224 | 1,090 | 1,117 |
| Altegrity, Inc. 9.50% 20194 | 4,300 | 4,096 |
| Associated Materials, LLC and AMH New Finance, Inc. 9.125% 2017 | 17,795 | 14,770 |
| Atlas Copco AB 5.60% 20174 | 2,750 | 3,001 |
| Builders Firstsource 7.625% 20214 | 3,375 | 3,468 |
| Burlington Northern Santa Fe LLC 3.00% 2023 | 2,500 | 2,497 |
| Burlington Northern Santa Fe LLC 4.90% 2044 | 5,000 | 5,644 |
| CEVA Group PLC, LOC, 6.50% 20217,8,9 | 650 | 611 |
| CEVA Group PLC, Term Loan B, 6.50% 20217,8,9 | 939 | 882 |
| CEVA Group PLC, Term Loan, 6.50% 20217,8,9 | 681 | 640 |
| CEVA Group PLC, Term Loan, 6.50% 20217,8,9 | 117 | 110 |
| Continental Airlines, Inc., Series 1997-4B, Class B, 6.90% 20188 | 38 | 40 |
| Continental Airlines, Inc., Series 2000-2, Class B, 8.307% 20198 | 5 | 5 |
| CSX Corp. 3.40% 2024 | 1,460 | 1,482 |
| DAE Aviation Holdings, Inc. and Standard Aero Ltd., Term Loan B-1, 5.00% 20187,8,9 | 1,237 | 1,234 |
| Euramax International, Inc. 9.50% 2016 | 7,390 | 6,910 |
| General Electric Capital Corp. 3.45% 2024 | 5,000 | 5,172 |
| General Electric Co. 2.70% 2022 | 6,535 | 6,549 |
| General Electric Co. 4.125% 2042 | 2,500 | 2,599 |
| Hardwoods Acquisition Inc 7.50% 20214 | 3,150 | 3,118 |
| Hawker Beechcraft Acquisition Co., LLC, LOC, 0.008% 20152,7,8,9 | 370 | 352 |
| HD Supply, Inc. 11.50% 2020 | 7,560 | 8,694 |
| HD Supply, Inc. 5.25% 20214 | 1,675 | 1,709 |
| HDTFS Inc. 5.875% 2020 | 650 | 658 |
| Jeld-Wen Escrow Corp., Term Loan B, 5.25% 20217,8,9 | 6,800 | 6,769 |
| KLX Inc. 5.875% 20224 | 1,810 | 1,833 |
| Navios Maritime Acquisition Corp. and Navios Acquisition Finance (US) Inc. 8.125% 20214 | 5,750 | 5,635 |
| Navios Maritime Holdings Inc. 7.375% 20224 | 5,925 | 5,510 |
| Navios Maritime Holdings Inc. and Navios Maritime Finance II (US) Inc. 8.125% 2019 | 2,795 | 2,474 |
| Nielsen Finance LLC and Nielsen Finance Co. 4.50% 2020 | 1,675 | 1,692 |
| Nielsen Finance LLC and Nielsen Finance Co. 5.50% 20214 | 4,550 | 4,664 |
| Nortek Inc. 10.00% 2018 | 4,800 | 5,052 |
| Nortek Inc. 8.50% 2021 | 7,845 | 8,433 |
| Ply Gem Industries, Inc. 6.50% 2022 | 5,400 | 5,096 |
| Ply Gem Industries, Inc. 6.50% 20224 | 1,350 | 1,262 |
| R.R. Donnelley & Sons Co. 7.25% 2018 | 4,530 | 5,028 |
| R.R. Donnelley & Sons Co. 7.875% 2021 | 1,775 | 1,970 |
| R.R. Donnelley & Sons Co. 7.00% 2022 | 3,500 | 3,771 |
| R.R. Donnelley & Sons Co. 6.50% 2023 | 210 | 216 |
| Silver II Borrower S.C.A./Silver II U.S. Holdings, LLC 7.75% 20204 | 2,675 | 2,541 |
| United Air Lines, Inc., Series 2007-1, Class B, 7.336% 20214,8 | 48 | 51 |
| US Investigations Services, Inc. 13.00% 20204,10 | 3,668 | 1,632 |
| Bonds, notes & other debt instruments Corporate bonds & notes (continued) Industrials (continued) | Principal amount (000) | Value (000) |
| US Investigations Services, Inc. 14.00% 20204,8,10 | $252 | $112 |
| US Investigations Services, Inc. 15.00% 20214,10 | 873 | 261 |
| Volvo Treasury AB 5.95% 20154 | 2,205 | 2,231 |
| 147,447 | ||
| Energy 0.83% | ||
| Alpha Natural Resources, Inc. 9.75% 2018 | 4,265 | 1,941 |
| Alpha Natural Resources, Inc. 6.00% 2019 | 725 | 232 |
| Alpha Natural Resources, Inc. 7.50% 20204 | 1,925 | 1,218 |
| Alpha Natural Resources, Inc. 6.25% 2021 | 975 | 302 |
| American Energy (Marcellus), Term Loan B, 5.25% 20207,8,9 | 1,825 | 1,615 |
| American Energy (Marcellus), Term Loan A, 8.50% 20217,8,9 | 1,475 | 1,265 |
| American Energy (Permian Basin) 7.125% 20204 | 1,450 | 1,080 |
| American Energy (Permian Basin) 7.375% 20214 | 1,325 | 980 |
| Anadarko Petroleum Corp. 3.45% 2024 | 1,540 | 1,506 |
| Anadarko Petroleum Corp. 6.45% 2036 | 1,370 | 1,651 |
| Arch Coal, Inc. 7.00% 2019 | 2,300 | 701 |
| Arch Coal, Inc. 8.00% 20194 | 700 | 392 |
| Arch Coal, Inc. 9.875% 2019 | 325 | 112 |
| Arch Coal, Inc. 7.25% 2021 | 1,525 | 452 |
| Blue Racer Midstream LLC / Blue Racer Finance Corp. 6.125% 20224 | 480 | 464 |
| Bonanza Creek Energy, Inc. 6.75% 2021 | 625 | 553 |
| Canadian Natural Resources Ltd. 5.70% 2017 | 3,000 | 3,254 |
| Cenovus Energy Inc. 3.80% 2023 | 3,970 | 3,884 |
| CONSOL Energy Inc. 8.25% 2020 | 2,795 | 2,910 |
| Denbury Resources Inc. 4.625% 2023 | 950 | 829 |
| Diamond Offshore Drilling, Inc. 4.875% 2043 | 4,500 | 3,847 |
| Enbridge Energy Partners, LP, Series B, 6.50% 2018 | 1,900 | 2,154 |
| Enbridge Energy Partners, LP 5.20% 2020 | 1,150 | 1,254 |
| Enbridge Energy Partners, LP, Series B, 7.50% 2038 | 2,000 | 2,454 |
| Enbridge Inc. 4.00% 2023 | 8,500 | 8,316 |
| EnLink Midstream Partners, LP 5.05% 2045 | 3,135 | 3,040 |
| Enterprise Products Operating LLC 5.20% 2020 | 1,710 | 1,888 |
| Enterprise Products Operating LLC 3.90% 2024 | 4,500 | 4,592 |
| Exxon Mobil Corp. 1.819% 2019 | 7,000 | 7,023 |
| Halliburton Co. 2.00% 2018 | 3,000 | 2,990 |
| Kinder Morgan Energy Partners, LP 5.40% 2044 | 4,380 | 4,405 |
| Kinder Morgan Energy Partners, LP 5.50% 2044 | 1,828 | 1,865 |
| Kinder Morgan, Inc. 3.05% 2019 | 2,520 | 2,503 |
| Laredo Petroleum, Inc. 9.50% 2019 | 675 | 675 |
| NGL Energy Partners LP 6.875% 20214 | 625 | 619 |
| NGPL PipeCo LLC 9.625% 20194 | 4,640 | 4,675 |
| Oasis Petroleum Inc. 6.875% 2022 | 2,150 | 1,967 |
| PDC Energy Inc. 7.75% 2022 | 1,825 | 1,743 |
| Peabody Energy Corp. 7.375% 2016 | 400 | 413 |
| Peabody Energy Corp. 6.00% 2018 | 16,085 | 14,678 |
| Peabody Energy Corp. 6.25% 2021 | 3,675 | 3,156 |
| Petróleos Mexicanos 3.50% 2023 | 7,000 | 6,713 |
| QGOG Constellation SA 6.25% 20194 | 850 | 538 |
| Rice Energy Inc. 6.25% 20224 | 500 | 468 |
| Sabine Pass Liquefaction, LLC 5.625% 2021 | 700 | 691 |
| Sabine Pass Liquefaction, LLC 5.75% 2024 | 5,050 | 4,981 |
| Statoil ASA 2.75% 2021 | 1,925 | 1,934 |
| Statoil ASA 3.25% 2024 | 2,850 | 2,865 |
| Bonds, notes & other debt instruments Corporate bonds & notes (continued) Energy (continued) | Principal amount (000) | Value (000) |
| Statoil ASA 4.25% 2041 | $2,000 | $2,058 |
| StatoilHydro ASA 1.80% 2016 | 4,000 | 4,060 |
| Targa Resources Corp. 4.125% 20194 | 1,575 | 1,524 |
| Teekay Corp. 8.50% 2020 | 5,680 | 6,346 |
| Tesoro Logistics LP 5.50% 20194 | 900 | 895 |
| TransCanada PipeLines Ltd. 7.625% 2039 | 4,000 | 5,515 |
| Williams Partners LP 4.00% 2021 | 195 | 196 |
| Williams Partners LP 4.50% 2023 | 5,000 | 5,055 |
| Williams Partners LP 3.90% 2025 | 2,500 | 2,408 |
| Williams Partners LP 5.40% 2044 | 385 | 378 |
| 146,223 | ||
| Consumer discretionary 0.68% | ||
| 21st Century Fox America, Inc. 3.70% 20244 | 6,000 | 6,184 |
| Amazon.com, Inc. 4.80% 2034 | 6,000 | 6,294 |
| Boyd Gaming Corp. 9.125% 2018 | 5,945 | 6,123 |
| Cequel Communications Holdings I, LLC and Cequel Capital Corp. 6.375% 20204 | 7,600 | 7,904 |
| Charter Communications Operating, LLC and Charter Communications Operating Capital Corp. 5.50% 2022 | 3,900 | 3,968 |
| Clear Channel Worldwide Holdings, Inc. 7.625% 2020 | 2,635 | 2,787 |
| Comcast Corp. 5.65% 2035 | 1,750 | 2,176 |
| Comcast Corp. 4.75% 2044 | 5,500 | 6,154 |
| Cooper-Standard Holdings Inc., Term Loan B, 4.00% 20217,8,9 | 2,289 | 2,264 |
| Cumulus Media Holdings Inc. 7.75% 2019 | 605 | 613 |
| DaimlerChrysler North America Holding Corp. 2.25% 20194 | 6,000 | 5,986 |
| DISH DBS Corp. 4.25% 2018 | 17,275 | 17,685 |
| DISH DBS Corp. 5.125% 2020 | 2,800 | 2,828 |
| Ford Motor Credit Co. 2.597% 2019 | 6,000 | 5,974 |
| Gannett Co., Inc. 4.875% 20214 | 1,255 | 1,249 |
| General Motors Co. 5.20% 2045 | 5,000 | 5,288 |
| General Motors Financial Co. 3.00% 2017 | 1,160 | 1,175 |
| General Motors Financial Co. 3.25% 2018 | 675 | 678 |
| Home Depot, Inc. 2.00% 2019 | 5,500 | 5,519 |
| Jaguar Land Rover PLC 4.25% 20194 | 1,215 | 1,230 |
| MGM Resorts International 8.625% 2019 | 7,975 | 9,082 |
| Neiman Marcus Group LTD Inc. 8.00% 20214 | 1,425 | 1,514 |
| Neiman Marcus Group LTD Inc. 8.75% 20214,7,10 | 575 | 612 |
| Time Inc., Term Loan B, 4.25% 20217,8,9 | 5,298 | 5,259 |
| Time Warner Inc. 4.05% 2023 | 2,630 | 2,764 |
| Time Warner Inc. 4.65% 2044 | 2,000 | 2,094 |
| Volkswagen International Finance NV 2.375% 20174 | 5,000 | 5,100 |
| Warner Music Group 5.625% 20224 | 100 | 97 |
| Wynn Macau, Ltd. 5.25% 20214 | 750 | 709 |
| 119,310 | ||
| Materials 0.59% | ||
| ArcelorMittal 6.00% 20217 | 3,040 | 3,173 |
| ArcelorMittal 7.25% 20417 | 6,500 | 6,597 |
| CEMEX Finance LLC 9.375% 20224 | 3,750 | 4,200 |
| Eastman Chemical Co. 2.70% 2020 | 7,000 | 7,048 |
| Ecolab Inc. 3.00% 2016 | 2,545 | 2,630 |
| First Quantum Minerals Ltd. 6.75% 20204 | 7,127 | 6,486 |
| First Quantum Minerals Ltd. 7.00% 20214 | 5,102 | 4,617 |
| First Quantum Minerals Ltd. 7.25% 20224 | 2,800 | 2,527 |
| FMG Resources 6.00% 20174 | 15,710 | 15,072 |
| Bonds, notes & other debt instruments Corporate bonds & notes (continued) Materials (continued) | Principal amount (000) | Value (000) |
| FMG Resources 6.875% 20184,8 | $3,907 | $3,555 |
| Georgia Gulf Corp. 4.625% 2021 | 1,000 | 951 |
| Georgia-Pacific Corp. 2.539% 20194 | 7,000 | 7,005 |
| Holcim Ltd. 5.15% 20234 | 6,165 | 6,883 |
| International Paper Co. 7.30% 2039 | 2,005 | 2,667 |
| JMC Steel Group Inc. 8.25% 20184 | 5,800 | 5,532 |
| Reynolds Group Inc. 5.75% 2020 | 17,220 | 17,737 |
| Tembec Industries Inc. 9.00% 20194 | 1,685 | 1,662 |
| Walter Energy, Inc. 9.50% 20194 | 6,725 | 5,145 |
| 103,487 | ||
| Utilities 0.51% | ||
| American Electric Power Co. 2.95% 2022 | 4,020 | 3,950 |
| Berkshire Hathaway Energy Co. 2.40% 20204 | 1,245 | 1,241 |
| CenterPoint Energy Resources Corp. 4.50% 2021 | 4,690 | 5,150 |
| CMS Energy Corp. 8.75% 2019 | 2,000 | 2,506 |
| Consumers Energy Co., First Mortgage Bonds, 3.125% 2024 | 4,310 | 4,334 |
| Dominion Gas Holdings LLC 2.50% 2019 | 2,450 | 2,459 |
| Duke Energy Progress Inc. 4.15% 2044 | 3,020 | 3,224 |
| Dynegy Finance Inc. 7.375% 20224 | 1,025 | 1,044 |
| EDP Finance BV 4.125% 20204 | 6,000 | 6,043 |
| Electricité de France SA 6.95% 20394 | 4,000 | 5,453 |
| MidAmerican Energy Co. 5.95% 2017 | 1,375 | 1,529 |
| MidAmerican Energy Co. 2.40% 2019 | 1,500 | 1,525 |
| National Rural Utilities Cooperative Finance Corp. 2.15% 2019 | 7,000 | 7,011 |
| Northern States Power Co. 4.125% 2044 | 6,000 | 6,375 |
| NRG Energy, Inc. 6.25% 2022 | 1,525 | 1,567 |
| Pacific Gas and Electric Co. 3.25% 2023 | 1,220 | 1,225 |
| Pacific Gas and Electric Co. 3.85% 2023 | 6,879 | 7,173 |
| Pacific Gas and Electric Co. 3.40% 2024 | 1,310 | 1,328 |
| Pacific Gas and Electric Co. 4.30% 2045 | 1,270 | 1,309 |
| PacifiCorp., First Mortgage Bonds, 5.65% 2018 | 1,250 | 1,413 |
| PacifiCorp., First Mortgage Bonds, 3.60% 2024 | 6,695 | 6,933 |
| Puget Sound Energy, Inc., First Lien, 6.50% 2020 | 1,245 | 1,465 |
| Puget Sound Energy, Inc., First Lien, 6.00% 2021 | 1,790 | 2,097 |
| Puget Sound Energy, Inc., First Lien, 5.625% 2022 | 1,965 | 2,277 |
| Sierra Pacific Power Co., General and Refunding Mortgage Notes, Series T, 3.375% 2023 | 3,500 | 3,640 |
| Tampa Electric Co. 4.35% 2044 | 5,260 | 5,633 |
| Tri-State Generation and Transmission Assn. Inc., Pass Through Trust, Series 2003-A, 6.04% 20184,8 | 527 | 560 |
| Virginia Electric and Power Co., Series B, 5.95% 2017 | 1,800 | 2,009 |
| 90,473 | ||
| Information technology 0.43% | ||
| Alcatel-Lucent USA Inc. 4.625% 20174 | 3,525 | 3,578 |
| Alcatel-Lucent USA Inc. 6.75% 20204 | 1,015 | 1,076 |
| Alcatel-Lucent USA Inc. 8.875% 20204 | 6,990 | 7,637 |
| First Data Corp. 8.25% 20214 | 4,350 | 4,676 |
| First Data Corp. 11.75% 2021 | 6,260 | 7,215 |
| First Data Corp. 12.625% 2021 | 1,000 | 1,190 |
| Freescale Semiconductor, Inc. 5.00% 20214 | 9,000 | 9,045 |
| Freescale Semiconductor, Inc. 6.00% 20224 | 10,700 | 11,208 |
| Freescale Semiconductor, Inc., Term Loan B4, 4.25% 20207,8,9 | 1,980 | 1,935 |
| NXP BV and NXP Funding LLC 3.75% 20184 | 8,825 | 8,869 |
| Oracle Corp. 2.25% 2019 | 7,500 | 7,559 |
| Bonds, notes & other debt instruments Corporate bonds & notes (continued) Information technology (continued) | Principal amount (000) | Value (000) |
| SRA International, Inc. 11.00% 2019 | $3,865 | $4,126 |
| SRA International, Inc., Term Loan B, 6.50% 20187,8,9 | 6,083 | 6,090 |
| TIBCO Software, Inc., Term Loan B, 6.50% 20207,8,9 | 1,650 | 1,601 |
| 75,805 | ||
| Consumer staples 0.27% | ||
| Altria Group, Inc. 4.50% 2043 | 6,000 | 6,067 |
| Anheuser-Busch InBev NV 3.625% 2015 | 3,750 | 3,784 |
| British American Tobacco International Finance PLC 9.50% 20184 | 2,470 | 3,112 |
| General Mills, Inc. 2.20% 2019 | 3,595 | 3,569 |
| Imperial Tobacco Finance PLC 3.50% 20234 | 4,000 | 3,937 |
| Kraft Foods Inc. 5.375% 2020 | 1,570 | 1,784 |
| Pernod Ricard SA 2.95% 20174 | 3,000 | 3,071 |
| Philip Morris International Inc. 3.25% 2024 | 5,000 | 5,021 |
| Philip Morris International Inc. 4.875% 2043 | 1,000 | 1,119 |
| Philip Morris International Inc. 4.25% 2044 | 2,000 | 2,042 |
| Reynolds American Inc. 6.15% 2043 | 580 | 675 |
| Rite Aid Corp. 8.00% 2020 | 900 | 966 |
| Walgreens Boots Alliance, Inc. 3.30% 2021 | 7,000 | 7,059 |
| Wal-Mart Stores, Inc. 3.30% 2024 | 4,445 | 4,599 |
| 46,805 | ||
| Total corporate bonds & notes | 1,365,407 | |
| Mortgage-backed obligations 4.13% Federal agency mortgage-backed obligations 3.48% | ||
| Fannie Mae 6.00% 20218 | 68 | 74 |
| Fannie Mae 6.00% 20268 | 714 | 808 |
| Fannie Mae 5.50% 20338 | 1,195 | 1,343 |
| Fannie Mae 5.50% 20338 | 820 | 923 |
| Fannie Mae 5.50% 20368 | 1,736 | 1,952 |
| Fannie Mae 5.50% 20378 | 649 | 732 |
| Fannie Mae 5.50% 20378 | 431 | 481 |
| Fannie Mae 6.00% 20378 | 4,452 | 5,039 |
| Fannie Mae 6.00% 20378 | 71 | 80 |
| Fannie Mae 6.00% 20388 | 9,038 | 10,239 |
| Fannie Mae 6.00% 20388 | 2,800 | 3,179 |
| Fannie Mae 6.00% 20388 | 2,533 | 2,870 |
| Fannie Mae 6.00% 20388 | 192 | 218 |
| Fannie Mae 6.00% 20388 | 135 | 154 |
| Fannie Mae 6.00% 20388 | 114 | 130 |
| Fannie Mae 6.00% 20398 | 3 | 3 |
| Fannie Mae 4.00% 20408 | 8,085 | 8,671 |
| Fannie Mae 4.186% 20407,8 | 678 | 720 |
| Fannie Mae 4.00% 20418 | 6,477 | 6,959 |
| Fannie Mae 4.00% 20418 | 4,991 | 5,363 |
| Fannie Mae 4.00% 20428 | 36,199 | 38,896 |
| Fannie Mae 4.00% 20438 | 12,700 | 13,700 |
| Fannie Mae 4.00% 20438 | 9,691 | 10,455 |
| Fannie Mae 4.00% 20438 | 5,333 | 5,763 |
| Fannie Mae 4.00% 20438 | 4,545 | 4,904 |
| Fannie Mae 4.00% 20438 | 4,353 | 4,698 |
| Fannie Mae 4.00% 20438 | 3,432 | 3,706 |
| Fannie Mae 4.00% 20438 | 3,242 | 3,494 |
| Bonds, notes & other debt instruments Mortgage-backed obligations (continued) Federal agency mortgage-backed obligations (continued) | Principal amount (000) | Value (000) |
| Fannie Mae 4.00% 20438 | $3,155 | $3,404 |
| Fannie Mae 4.00% 20438 | 1,000 | 1,068 |
| Fannie Mae 3.50% 20458,12 | 94,608 | 98,582 |
| Fannie Mae 4.00% 20458,12 | 108,000 | 114,939 |
| Fannie Mae 4.50% 20458,12 | 81,507 | 88,468 |
| Fannie Mae 4.50% 20458,12 | 54,493 | 59,045 |
| Fannie Mae 6.00% 20458,12 | 24,158 | 27,399 |
| Fannie Mae 7.00% 20478 | 289 | 326 |
| Fannie Mae 7.00% 20478 | 153 | 173 |
| Fannie Mae 7.00% 20478 | 11 | 13 |
| Fannie Mae, Series 2006-43, Class JO, principal only, 0% 20368 | 231 | 212 |
| Fannie Mae, Series 2006-49, Class PA, 6.00% 20368 | 621 | 687 |
| Fannie Mae, Series 2007-40, Class PT, 5.50% 20378 | 120 | 133 |
| Fannie Mae, Series 2007-33, Class HE, 5.50% 20378 | 84 | 92 |
| Fannie Mae, Series 2001-T10, Class A-1, 7.00% 20418 | 297 | 347 |
| Fannie Mae, Series 2002-W3, Class A-5, 7.50% 20418 | 72 | 84 |
| Freddie Mac 5.00% 20238 | 446 | 485 |
| Freddie Mac 6.00% 20268 | 1,705 | 1,931 |
| Freddie Mac 5.00% 20388 | 3,189 | 3,520 |
| Freddie Mac 6.50% 20388 | 484 | 550 |
| Freddie Mac 4.50% 20398 | 528 | 573 |
| Freddie Mac 5.00% 20408 | 4,848 | 5,369 |
| Freddie Mac 4.00% 20438 | 10,640 | 11,422 |
| Freddie Mac 4.00% 20438 | 6,263 | 6,748 |
| Freddie Mac 4.00% 20438 | 6,157 | 6,630 |
| Freddie Mac 4.00% 20438 | 3,922 | 4,234 |
| Freddie Mac 4.00% 20438 | 3,778 | 4,067 |
| Freddie Mac, Series T-041, Class 3-A, 6.539% 20327,8 | 445 | 508 |
| Freddie Mac, Series 3233, Class PA, 6.00% 20368 | 1,462 | 1,640 |
| Freddie Mac, Series 3312, Class PA, 5.50% 20378 | 1,390 | 1,531 |
| Government National Mortgage Assn. 3.50% 20458,12 | 30,000 | 31,480 |
| 611,214 | ||
| Commercial mortgage-backed securities 0.60% | ||
| Aventura Mall Trust, Series A, 3.743% 20324,7,8 | 5,500 | 5,852 |
| Banc of America Commercial Mortgage Inc., Series 2007-3, Class A-4, 5.563% 20497,8 | 9,100 | 9,775 |
| Bear Stearns Commercial Mortgage Securities Trust, Series 2007-PW17, Class A-4, 5.694% 20507,8 | 2,585 | 2,807 |
| Bear Stearns Commercial Mortgage Securities Trust, Series 2007-PW18, Class A-M, 6.084% 20507,8 | 1,430 | 1,575 |
| Citigroup-Deutsche Bank Commercial Mortgage Trust, Series 2005-CD1, Class A-4, 5.40% 20447,8 | 2,106 | 2,141 |
| COMM Mortgage Trust Series 2014-277P, Class A, 3.611% 20494,7,8 | 5,000 | 5,232 |
| CS First Boston Mortgage Securities Corp., Series 2007-C5, Class A4, 5.695% 20407,8 | 2,320 | 2,506 |
| Greenwich Capital Commercial Funding Corp., Series 2006-GG7, Class A-4, 5.819% 20387,8 | 2,889 | 3,022 |
| Greenwich Capital Commercial Funding Corp., Series 2007-GG9, Class A-4, 5.444% 20398 | 10,000 | 10,676 |
| Greenwich Capital Commercial Funding Corp., Series 2007-GG11, Class A-M, 5.867% 20497,8 | 5,000 | 5,428 |
| J.P. Morgan Chase Commercial Mortgage Securities Corp., Series 2005-CIBC12, Class A-3B, 5.467% 20377,8 | 1,262 | 1,262 |
| J.P. Morgan Chase Commercial Mortgage Securities Corp., Series 2011-C4, Class A-2, 3.341% 20464,8 | 4,484 | 4,604 |
| J.P. Morgan Chase Commercial Mortgage Securities Corp., Series 2011-C3A, Class A-2, 3.673% 20464,8 | 4,799 | 4,940 |
| J.P. Morgan Chase Commercial Mortgage Securities Corp., Series 2007-CB19, Class A-4, 5.703% 20497,8 | 8,543 | 9,179 |
| J.P. Morgan Chase Commercial Mortgage Securities Corp., Series 2007-C1, Class A-4, 5.716% 20518 | 1,992 | 2,146 |
| LB-UBS Commercial Mortgage Trust, Series 2007-C2, Class A-3, 5.43% 20408 | 1,635 | 1,751 |
| LB-UBS Commercial Mortgage Trust, Series 2007-C6, Class A-M, 6.114% 20407,8 | 5,500 | 5,972 |
| LB-UBS Commercial Mortgage Trust, Series 2007-C7, Class A-M, 6.163% 20457,8 | 2,570 | 2,864 |
| ML-CFC Commercial Mortgage Trust, Series 2007-8, Class A-3, 6.079% 20497,8 | 4,000 | 4,368 |
| Bonds, notes & other debt instruments Mortgage-backed obligations (continued) Commercial mortgage-backed securities (continued) | Principal amount (000) | Value (000) |
| Morgan Stanley Capital I Trust, Series 2014-CPT, Class A, 3.35% 20214,8 | $2,650 | $2,746 |
| Morgan Stanley Capital I Trust, Series 2007-IQ15, Class A-4, 6.105% 20497,8 | 3,868 | 4,211 |
| Wachovia Bank Commercial Mortgage Trust, Series 2007-C30, Class A-5, 5.342% 20438 | 3,000 | 3,205 |
| Wachovia Bank Commercial Mortgage Trust, Series 2007-C31, Class A-M, 5.591% 20477,8 | 3,000 | 3,207 |
| Wachovia Bank Commercial Mortgage Trust, Series 2007-C33, Class A-M, 5.941% 20517,8 | 3,000 | 3,274 |
| WFLD Mortgage Trust, Series 2014-MONT, Class A, 3.755% 20314,7,8 | 2,400 | 2,541 |
| 105,284 | ||
| Other mortgage-backed securities 0.03% | ||
| Commonwealth Bank of Australia 0.75% 20164,8 | 3,000 | 3,001 |
| National Australia Bank 1.25% 20184,8 | 3,000 | 2,963 |
| 5,964 | ||
| Collateralized mortgage-backed (privately originated) 0.02% | ||
| CS First Boston Mortgage Securities Corp., Series 2004-5, Class IV-A-1, 6.00% 20348 | 743 | 766 |
| MASTR Alternative Loan Trust, Series 2004-2, Class 2-A-1, 6.00% 20348 | 1,688 | 1,743 |
| 2,509 | ||
| Total mortgage-backed obligations | 724,971 | |
| Federal agency bonds & notes 1.57% | ||
| CoBank, ACB 0.834% 20224,7 | 1,695 | 1,589 |
| Fannie Mae 0.50% 2015 | 75,000 | 75,102 |
| Fannie Mae 2.625% 2024 | 11,190 | 11,347 |
| Fannie Mae, Series 2012-M14, Class A2, multifamily 2.301% 20227,8 | 2,145 | 2,116 |
| Fannie Mae, Series 2012-M9, Class A2, multifamily 2.482% 20228 | 5,242 | 5,243 |
| Fannie Mae, Series 2012-M5, Class A2, multifamily 2.715% 20228 | 4,000 | 4,068 |
| Fannie Mae, Series 2013-M14, Class A2, multifamily 3.329% 20237,8 | 7,530 | 7,933 |
| Fannie Mae, Series 2014-M1, multifamily 3.373% 20237,8 | 9,000 | 9,443 |
| Fannie Mae, Series 2014-M2, Class A2, multifamily 3.513% 20237,8 | 6,450 | 6,888 |
| Fannie Mae, Series 2014-M9, multifamily 3.103% 20247,8 | 6,215 | 6,430 |
| Fannie Mae, Series 2014-M3, Class A2, multifamily 3.477% 20247,8 | 7,000 | 7,448 |
| Freddie Mac 2.50% 2016 | 18,000 | 18,495 |
| Freddie Mac 0.75% 2018 | 40,300 | 39,800 |
| Freddie Mac 2.375% 2022 | 13,750 | 13,940 |
| Freddie Mac, Series K711, Class A2, multifamily 1.73% 20198 | 5,000 | 4,964 |
| Freddie Mac, Series K710, Class A2, multifamily 1.883% 20198 | 3,837 | 3,848 |
| Freddie Mac, Series K714, Class A2, multifamily 3.034% 20207,8 | 4,175 | 4,367 |
| Freddie Mac, Series K716, Class A2, multifamily 3.132% 20218 | 4,350 | 4,550 |
| Freddie Mac, Series KS01, Class A1, multifamily 1.693% 20228 | 4,670 | 4,638 |
| Freddie Mac, Series K019, Class A2, multifamily 2.272% 20228 | 4,000 | 3,976 |
| Freddie Mac, Series K021, Class A2, multifamily 2.396% 20228 | 3,680 | 3,674 |
| Freddie Mac, Series K025, Class A2, multifamily 2.682% 20228 | 4,000 | 4,047 |
| Freddie Mac, Series K030, Class A1, multifamily 2.779% 20228 | 6,492 | 6,701 |
| Freddie Mac, Series K027, Class A2, multifamily 2.637% 20238 | 5,500 | 5,533 |
| Freddie Mac, Series K034, Class A1, multifamily 2.669% 20238 | 2,455 | 2,521 |
| Freddie Mac, Series K028, Class A2, multifamily 3.111% 20238 | 5,900 | 6,133 |
| Freddie Mac, Series K041, Class A-2, multifamily 3.171% 20248 | 6,000 | 6,238 |
| Freddie Mac, Series K040, Class A2, multifamily 3.241% 20248 | 4,470 | 4,675 |
| 275,707 |
| Bonds, notes & other debt instruments Bonds & notes of governments & government agencies outside the U.S. 0.31% | Principal amount (000) | Value (000) |
| Colombia (Republic of) Global 5.625% 2044 | $5,900 | $6,667 |
| Province of Manitoba 3.05% 2024 | 2,600 | 2,690 |
| Slovenia (Republic of) 5.50% 2022 | 6,000 | 6,675 |
| Spanish Government 4.00% 20184 | 27,000 | 28,448 |
| United Mexican States Government Global 3.60% 2025 | 4,000 | 4,006 |
| United Mexican States Government Global 5.55% 2045 | 5,000 | 5,825 |
| 54,311 | ||
| Asset-backed obligations 0.26% | ||
| American Express Credit Account Master Trust, Series 2014-4, Class A, 1.43% 20208 | 4,770 | 4,763 |
| AmeriCredit Automobile Receivables Trust, Series 2014-4, Class A-3, 1.27% 20198 | 1,605 | 1,600 |
| Chase Issuance Trust, Series 2014-A7, Class A, 1.38% 20198 | 8,000 | 8,002 |
| Enterprise Fleet Financing LLC, Series 2014-2, Class A2, 1.05% 20204,8 | 5,460 | 5,456 |
| Ford Credit Auto Lease Trust, Series 2014-B, Class A3, 0.89% 20178 | 3,910 | 3,901 |
| Ford Credit Auto Owner Trust, Series 2014-B-A3, 0.90% 20188 | 4,060 | 4,057 |
| Ford Credit Auto Owner Trust, Series 2014-2-A, 2.31% 20264,8 | 5,430 | 5,457 |
| Origen Manufactured Housing Contract Trust, Series 2004-B, Class A-4, 5.46% 20358 | 1,449 | 1,489 |
| RAMP Trust, Series 2003-RS11, Class A-I-7, 4.828% 20338 | 267 | 279 |
| Santander Drive Auto Receivables Trust, Series 2014-5, Class A-3, 1.15% 20198 | 1,500 | 1,498 |
| Toyota Auto Receivables Owner Trust, Series 2014-B, Class A3, 0.76% 20188 | 1,900 | 1,896 |
| Volkswagen Auto Loan Enhanced Trust, Series 2014-2, Class A-3 0.95% 20198 | 7,000 | 6,965 |
| 45,363 | ||
| Total bonds, notes & other debt instruments (cost: $4,354,101,000) | 4,389,982 | |
| Short-term securities 9.63% | ||
| Abbott Laboratories 0.10% due 2/2/20154 | 10,000 | 9,999 |
| Caterpillar Financial Services Corp. 0.10%–0.12% due 1/5/2015–2/19/2015 | 41,000 | 40,995 |
| Chariot Funding, LLC 0.22% due 4/23/20154 | 15,000 | 14,991 |
| Chevron Corp. 0.10%–0.14% due 1/21/2015–4/10/20154 | 96,400 | 96,387 |
| Coca-Cola Co. 0.17% due 4/23/20154 | 40,000 | 39,981 |
| Emerson Electric Co. 0.10%–0.13% due 2/26/2015–3/11/20154 | 42,000 | 41,989 |
| ExxonMobil Corp. 0.09% due 2/5/2015 | 12,700 | 12,698 |
| Fannie Mae 0.07%–0.11% due 1/5/2015–5/18/2015 | 311,100 | 311,051 |
| Federal Farm Credit Banks 0.12% due 2/2/2015 | 25,000 | 25,000 |
| Federal Home Loan Bank 0.06%–0.16% due 1/22/2015–7/31/2015 | 524,700 | 524,591 |
| Freddie Mac 0.07%–0.18% due 2/4/2015–11/3/2015 | 293,600 | 293,514 |
| General Electric Capital Corp. 0.19% due 1/5/2015 | 40,000 | 40,000 |
| General Electric Co. 0.10% due 1/2/2015 | 19,900 | 19,900 |
| John Deere Bank SA 0.11% due 1/14/20154 | 35,900 | 35,898 |
| John Deere Capital Corp. 0.09% due 1/8/20154 | 24,800 | 24,799 |
| John Deere Financial Ltd. 0.14% due 1/16/20154 | 21,700 | 21,699 |
| Paccar Financial Corp. 0.11% due 1/23/2015–1/28/2015 | 45,000 | 44,995 |
| Private Export Funding Corp. 0.26% due 1/22/20154 | 3,400 | 3,400 |
| Procter & Gamble Co. 0.08% due 1/22/20154 | 25,000 | 24,999 |
| United Parcel Service Inc. 0.11% due 1/15/20154 | 44,700 | 44,698 |
| Wal-Mart Stores, Inc. 0.07% due 1/13/20154 | 19,900 | 19,899 |
| Total short-term securities (cost: $1,691,354,000) | 1,691,483 | |
| Total investment securities 102.16% (cost: $14,390,845,000) | 17,941,405 | |
| Other assets less liabilities (2.16)% | (378,537) | |
| Net assets 100.00% | $17,562,868 |
| 1 | Security did not produce income during the last 12 months. |
| 2 | Valued under fair value procedures adopted by authority of the board of trustees. The total value of all such securities, including those in “Miscellaneous,“ was $394,040,000, which represented 2.24% of the net assets of the fund. This amount includes $364,386,000 related to certain securities trading outside the U.S. whose values were adjusted as a result of significant market movements following the close of local trading. |
| 3 | Acquired through a private placement transaction exempt from registration under the Securities Act of 1933. May be subject to legal or contractual restrictions on resale. Further details on these holdings appear below. |
| 4 | Acquired in a transaction exempt from registration under Rule 144A or Section 4(2) of the Securities Act of 1933. May be resold in the U.S. in transactions exempt from registration, normally to qualified institutional buyers. The total value of all such securities was $839,403,000, which represented 4.78% of the net assets of the fund. |
| 5 | A portion of this security was pledged as collateral. The total value of pledged collateral was $10,940,000, which represented .06% of the net assets of the fund. |
| 6 | Index-linked bond whose principal amount moves with a government price index. |
| 7 | Coupon rate may change periodically. |
| 8 | Principal payments may be made periodically. Therefore, the effective maturity date may be earlier than the stated maturity date. |
| 9 | Loan participations and assignments; may be subject to legal or contractual restrictions on resale. The total value of all such loans was $0, which represented less than .01% of the net assets of the fund. |
| 10 | Payment in kind; the issuer has the option of paying additional securities in lieu of cash. |
| 11 | Scheduled interest and/or principal payment was not received. |
| 12 | A portion or all of the security purchased on a TBA basis. |
| Private placement securities | Acquisition dates | Cost (000) | Value (000) | Percent of net assets |
| CEVA Group PLC, Series A-2, 2.253% convertible preferred | 3/10/2010–1/23/2012 | $8,674 | $4,649 | .03% |
| NewPage Holdings Inc. | 6/22/2011–7/24/2014 | 2,095 | 1,043 | .00 |
| Revel AC, Inc. | 2/14/2011–10/25/2012 | 8,939 | — | .00 |
| Revel AC, Inc. (CVR) | 2/15/2011–3/15/2013 | 7,911 | — | .00 |
| Total private placement securities | $27,620 | $5,692 | .03% |
| Key to abbreviations | ||
| ADR = American Depositary Receipts | ||
| CVR = Contingent Value Rights | ||
| LOC = Letter of credit | ||
| TBA = To be announced |
| Common stocks 60.73% Industrials 10.43% | Shares | Value (000) |
| Cummins Inc. | 19,200 | $2,768 |
| General Electric Co. | 93,700 | 2,368 |
| KONE Oyj, Class B1 | 49,600 | 2,253 |
| Boeing Co. | 17,000 | 2,210 |
| BAE Systems PLC1 | 284,400 | 2,076 |
| Robert Half International Inc. | 30,000 | 1,751 |
| Schneider Electric SE1 | 20,000 | 1,453 |
| Rolls-Royce Holdings PLC1,2 | 105,045 | 1,415 |
| ASSA ABLOY AB, Class B1 | 22,000 | 1,163 |
| Randstad Holding NV1 | 22,947 | 1,103 |
| Geberit AG1 | 3,000 | 1,019 |
| TransDigm Group Inc. | 4,500 | 884 |
| AB Volvo, Class B1 | 70,000 | 756 |
| International Consolidated Airlines Group, SA (CDI)1,2 | 100,000 | 747 |
| Abertis Infraestructuras, SA, Class A1 | 27,825 | 550 |
| 22,516 | ||
| Financials 9.76% | ||
| Link Real Estate Investment Trust1 | 429,509 | 2,681 |
| Banco Santander, SA1,2 | 306,406 | 2,562 |
| ORIX Corp.1 | 182,000 | 2,275 |
| AIA Group Ltd.1 | 380,000 | 2,092 |
| JPMorgan Chase & Co. | 32,700 | 2,046 |
| Bankia, SA1,2 | 1,179,000 | 1,748 |
| Deutsche Bank AG1 | 51,750 | 1,564 |
| Wells Fargo & Co. | 24,000 | 1,316 |
| Prudential PLC1 | 56,000 | 1,289 |
| BNP Paribas SA1 | 19,230 | 1,130 |
| AXA SA1 | 40,300 | 931 |
| Goldman Sachs Group, Inc. | 3,000 | 582 |
| Sumitomo Mitsui Financial Group, Inc.1 | 13,500 | 488 |
| Suncorp Group Ltd.1 | 30,564 | 348 |
| 21,052 | ||
| Consumer staples 8.45% | ||
| Nestlé SA1 | 40,240 | 2,950 |
| Pernod Ricard SA1 | 22,220 | 2,464 |
| Lorillard, Inc. | 33,900 | 2,134 |
| British American Tobacco PLC1 | 35,950 | 1,953 |
| Altria Group, Inc. | 31,000 | 1,527 |
| SABMiller PLC1 | 28,500 | 1,475 |
| Costco Wholesale Corp. | 10,170 | 1,441 |
| Lenta Ltd. (GDR)1,2 | 191,700 | 1,296 |
| PepsiCo, Inc. | 11,000 | 1,040 |
| Common stocks Consumer staples (continued) | Shares | Value (000) |
| Philip Morris International Inc. | 12,700 | $1,034 |
| Procter & Gamble Co. | 10,000 | 911 |
| 18,225 | ||
| Information technology 8.14% | ||
| ASML Holding NV1 | 47,969 | 5,139 |
| Microsoft Corp. | 103,000 | 4,784 |
| Murata Manufacturing Co., Ltd.1 | 12,600 | 1,376 |
| Taiwan Semiconductor Manufacturing Co. Ltd.1 | 300,000 | 1,324 |
| Cisco Systems, Inc. | 36,000 | 1,001 |
| OMRON Corp.1 | 20,000 | 897 |
| Google Inc., Class A2 | 800 | 425 |
| Google Inc., Class C2 | 800 | 421 |
| Texas Instruments Inc. | 15,000 | 802 |
| Nintendo Co., Ltd.1 | 7,400 | 771 |
| KLA-Tencor Corp. | 9,000 | 633 |
| 17,573 | ||
| Health care 6.43% | ||
| Merck & Co., Inc. | 79,120 | 4,493 |
| Novartis AG1 | 27,860 | 2,562 |
| Humana Inc. | 12,780 | 1,836 |
| AstraZeneca PLC1 | 16,000 | 1,126 |
| Bayer AG1 | 8,000 | 1,094 |
| Novo Nordisk A/S, Class B1 | 25,000 | 1,058 |
| Pfizer Inc. | 28,000 | 872 |
| Bristol-Myers Squibb Co. | 14,000 | 826 |
| 13,867 | ||
| Consumer discretionary 6.38% | ||
| Comcast Corp., Class A | 49,930 | 2,897 |
| Home Depot, Inc. | 21,030 | 2,208 |
| SES SA, Class A (FDR)1 | 53,700 | 1,926 |
| HUGO BOSS AG1 | 12,600 | 1,547 |
| Tiffany & Co. | 12,600 | 1,346 |
| Amazon.com, Inc.2 | 4,100 | 1,272 |
| Industria de Diseño Textil, SA1 | 32,100 | 920 |
| Carnival Corp., units | 19,000 | 861 |
| General Motors Co. | 22,500 | 786 |
| 13,763 | ||
| Energy 3.39% | ||
| Royal Dutch Shell PLC, Class B1 | 71,220 | 2,447 |
| Chevron Corp. | 13,030 | 1,462 |
| ConocoPhillips | 18,906 | 1,305 |
| Enbridge Inc. | 21,055 | 1,083 |
| Spectra Energy Corp | 27,800 | 1,009 |
| 7,306 | ||
| Materials 3.19% | ||
| MeadWestvaco Corp. | 34,000 | 1,509 |
| Dow Chemical Co. | 33,000 | 1,505 |
| Potash Corp. of Saskatchewan Inc. | 36,000 | 1,272 |
| E.I. du Pont de Nemours and Co. | 12,000 | 887 |
| Nucor Corp. | 12,000 | 589 |
| Common stocks Materials (continued) | Shares | Value (000) |
| L’Air Liquide SA1 | 2,556 | $315 |
| L’Air Liquide SA, bonus shares1 | 1,724 | 213 |
| Rio Tinto PLC1 | 11,000 | 507 |
| Cliffs Natural Resources Inc. | 13,000 | 93 |
| 6,890 | ||
| Telecommunication services 1.41% | ||
| Orange1 | 60,000 | 1,020 |
| HKT Trust and HKT Ltd., units1 | 702,196 | 914 |
| Verizon Communications Inc. | 13,850 | 648 |
| Telstra Corp. Ltd.1 | 96,500 | 469 |
| 3,051 | ||
| Utilities 1.12% | ||
| EDP - Energias de Portugal, SA1 | 625,000 | 2,417 |
| Miscellaneous 2.03% | ||
| Other common stocks in initial period of acquisition | 4,379 | |
| Total common stocks (cost: $110,011,000) | 131,039 | |
| Preferred securities 0.08% Financials 0.08% | ||
| PNC Financial Services Group, Inc., Series P, noncumulative depositary shares | 6,000 | 166 |
| Total preferred securities (cost: $150,000) | 166 | |
| Convertible bonds 0.41% Consumer staples 0.41% | Principal amount (000) | |
| Shoprite Holdings Ltd. 6.50% convertible notes 2017 | ZAR9,230 | 873 |
| Total convertible bonds (cost: $1,198,000) | 873 | |
| Bonds, notes & other debt instruments 30.38% Bonds & notes of governments & government agencies outside the U.S. 13.58% | ||
| Belgium (Kingdom of), Series 68, 2.25% 2023 | €300 | 411 |
| Bermuda Government 5.603% 2020 | $200 | 220 |
| Bermuda Government 4.854% 20243 | 200 | 209 |
| Chilean Government 5.50% 2020 | CLP50,000 | 87 |
| Colombia (Republic of), Series B, 5.00% 2018 | COP335,000 | 137 |
| Colombia (Republic of), Series B, 6.00% 2028 | 453,000 | 166 |
| Colombia (Republic of) Global 4.375% 2021 | $200 | 212 |
| French Government O.A.T. Eurobond 0.50% 2019 | €150 | 184 |
| French Government O.A.T. Eurobond 1.00% 2018 | 300 | 376 |
| French Government O.A.T. Eurobond 2.25% 2024 | 150 | 206 |
| French Government O.A.T. Eurobond 1.75% 2024 | 250 | 329 |
| French Government O.A.T. Eurobond 3.25% 2045 | 170 | 270 |
| German Government, Series 6, 4.00% 2016 | 100 | 128 |
| German Government, Series 8, 4.25% 2018 | 230 | 321 |
| German Government 3.00% 2020 | 700 | 984 |
| German Government 2.25% 2021 | 60 | 83 |
| Bonds, notes & other debt instruments Bonds & notes of governments & government agencies outside the U.S. (continued) | Principal amount (000) | Value (000) |
| German Government 2.00% 2022 | €500 | $681 |
| German Government 2.50% 2044 | 225 | 346 |
| India (Republic of) 7.28% 2019 | INR30,000 | 466 |
| India (Republic of) 8.83% 2023 | 10,000 | 167 |
| Indonesia (Republic of), Series 71, 9.00% 2029 | IDR400,000 | 35 |
| Indonesia (Republic of) 8.375% 2034 | 1,300,000 | 106 |
| Irish Government 4.50% 2020 | €100 | 146 |
| Irish Government 5.00% 2020 | 100 | 152 |
| Irish Government 3.90% 2023 | 510 | 753 |
| Irish Government 3.40% 2024 | 250 | 359 |
| Irish Government 5.40% 2025 | 100 | 167 |
| Irish Government 2.40% 2030 | 50 | 65 |
| Israeli Government 3.15% 2023 | $400 | 409 |
| Italian Government 4.25% 2020 | €500 | 704 |
| Italian Government 5.50% 2022 | 275 | 427 |
| Italian Government 4.50% 2024 | 400 | 596 |
| Italian Government 4.75% 2044 | 50 | 78 |
| Japanese Government, Series 269, 1.30% 2015 | ¥12,500 | 105 |
| Japanese Government, Series 336, 0.10% 2016 | 5,000 | 42 |
| Japanese Government, Series 115, 0.20% 2018 | 85,000 | 715 |
| Japanese Government, Series 315, 1.20% 2021 | 30,000 | 269 |
| Japanese Government, Series 17, 0.10% 20234 | 10,360 | 91 |
| Japanese Government, Series 116, 2.20% 2030 | 33,000 | 335 |
| Japanese Government, Series 36, 2.00% 2042 | 20,000 | 197 |
| Japanese Government, Series 42, 1.70% 2044 | 25,000 | 231 |
| Morocco Government 4.25% 2022 | $200 | 201 |
| Netherlands Government 1.00% 2017 | 100 | 100 |
| Netherlands Government Eurobond 4.00% 2019 | €150 | 214 |
| Netherlands Government Eurobond 2.25% 2022 | 625 | 860 |
| Netherlands Government Eurobond 2.00% 2024 | 175 | 238 |
| Netherlands Government Eurobond 5.50% 2028 | 100 | 189 |
| Norwegian Government 4.25% 2017 | NKr1,370 | 198 |
| Norwegian Government 3.75% 2021 | 2,900 | 449 |
| Norwegian Government 3.00% 2024 | 4,200 | 635 |
| Polish Government, Series 1020, 5.25% 2020 | PLN3,250 | 1,068 |
| Polish Government, Series 1021, 5.75% 2021 | 2,070 | 711 |
| Queensland Treasury Corp., Series 24, 5.75% 2024 | A$370 | 367 |
| Russian Federation 6.20% 2018 | RUB6,900 | 90 |
| Russian Federation 7.50% 2018 | 11,600 | 155 |
| South Africa (Republic of), Series R-2023, 7.75% 2023 | ZAR3,525 | 304 |
| South Africa (Republic of), Series R-214, 6.50% 2041 | 2,900 | 195 |
| South Korean Government, Series 2106, 4.25% 2021 | KRW412,000 | 416 |
| Spanish Government 4.00% 20183 | $500 | 527 |
| Spanish Government 5.40% 2023 | €670 | 1,061 |
| Spanish Government 2.75% 2024 | 490 | 654 |
| State of Qatar 3.125% 20173 | $250 | 261 |
| Swedish Government, Series 1057, 1.50% 2023 | SKr6,400 | 870 |
| United Kingdom 2.75% 2015 | £200 | 312 |
| United Kingdom 1.25% 2018 | 70 | 110 |
| United Kingdom 1.75% 2019 | 300 | 480 |
| United Kingdom 2.00% 2020 | 150 | 242 |
| United Kingdom 3.75% 2020 | 75 | 133 |
| United Kingdom 1.75% 2022 | 550 | 870 |
| United Kingdom 2.25% 2023 | 355 | 580 |
| United Kingdom 5.00% 2025 | 100 | 203 |
| Bonds, notes & other debt instruments Bonds & notes of governments & government agencies outside the U.S. (continued) | Principal amount (000) | Value (000) |
| United Kingdom 4.50% 2034 | £60 | $125 |
| United Kingdom 4.75% 2038 | 70 | 156 |
| United Kingdom 4.25% 2040 | 50 | 105 |
| United Kingdom 3.25% 2044 | 250 | 450 |
| United Kingdom 4.25% 2046 | 250 | 542 |
| United Mexican States Government 4.00% 20194 | MXN3,166 | 235 |
| United Mexican States Government 2.00% 20224 | 3,694 | 247 |
| United Mexican States Government Global 3.60% 2025 | $200 | 200 |
| United Mexican States Government 4.00% 20404 | MXN2,639 | 202 |
| United Mexican States Government, Series M10, 8.00% 2015 | 1,800 | 127 |
| United Mexican States Government, Series M10, 7.75% 2017 | 5,500 | 408 |
| United Mexican States Government, Series M, 6.50% 2021 | 13,000 | 930 |
| United Mexican States Government, Series M20, 10.00% 2024 | 7,600 | 676 |
| United Mexican States Government, Series M30, 10.00% 2036 | 2,500 | 238 |
| 29,299 | ||
| U.S. Treasury bonds & notes 6.96% U.S. Treasury 5.20% | ||
| U.S. Treasury 1.75% 2015 | $145 | 146 |
| U.S. Treasury 1.50% 2016 | 70 | 71 |
| U.S. Treasury 2.00% 2016 | 70 | 71 |
| U.S. Treasury 0.875% 2017 | 400 | 399 |
| U.S. Treasury 1.00% 2017 | 445 | 447 |
| U.S. Treasury 0.625% 2018 | 200 | 196 |
| U.S. Treasury 0.875% 2018 | 200 | 199 |
| U.S. Treasury 1.25% 2018 | 1,000 | 994 |
| U.S. Treasury 1.375% 2018 | 500 | 501 |
| U.S. Treasury 1.375% 2018 | 300 | 300 |
| U.S. Treasury 1.50% 2018 | 200 | 201 |
| U.S. Treasury 1.25% 2019 | 50 | 50 |
| U.S. Treasury 1.50% 2019 | 500 | 497 |
| U.S. Treasury 1.625% 2019 | 1,925 | 1,930 |
| U.S. Treasury 1.625% 2019 | 1,110 | 1,111 |
| U.S. Treasury 1.625% 2019 | 750 | 751 |
| U.S. Treasury 1.75% 2019 | 400 | 402 |
| U.S. Treasury 3.125% 2019 | 225 | 240 |
| U.S. Treasury 1.375% 2020 | 150 | 147 |
| U.S. Treasury 3.50% 2020 | 200 | 218 |
| U.S. Treasury 2.00% 2021 | 108 | 109 |
| U.S. Treasury 2.125% 2021 | 200 | 202 |
| U.S. Treasury 2.00% 2022 | 75 | 75 |
| U.S. Treasury 1.75% 2023 | 100 | 97 |
| U.S. Treasury 2.25% 2024 | 250 | 252 |
| U.S. Treasury 2.50% 2024 | 500 | 515 |
| U.S. Treasury 4.375% 2038 | 100 | 131 |
| U.S. Treasury 2.875% 2043 | 480 | 491 |
| U.S. Treasury 3.75% 2043 | 200 | 241 |
| U.S. Treasury 3.375% 2044 | 200 | 225 |
| 11,209 | ||
| U.S. Treasury inflation-protected securities 1.76% | ||
| U.S. Treasury Inflation-Protected Security 0.125% 20174 | 125 | 126 |
| U.S. Treasury Inflation-Protected Security 0.125% 20194 | 1,277 | 1,265 |
| U.S. Treasury Inflation-Protected Security 0.375% 20234 | 459 | 456 |
| U.S. Treasury Inflation-Protected Security 0.125% 20244 | 150 | 145 |
| Bonds, notes & other debt instruments U.S. Treasury bonds & notes (continued) U.S. Treasury inflation-protected securities (continued) | Principal amount (000) | Value (000) |
| U.S. Treasury Inflation-Protected Security 0.625% 20244 | $1,170 | $1,181 |
| U.S. Treasury Inflation-Protected Security 2.375% 20254 | 63 | 74 |
| U.S. Treasury Inflation-Protected Security 1.375% 20444 | 484 | 553 |
| 3,800 | ||
| Total U.S. Treasury bonds & notes | 15,009 | |
| Corporate bonds & notes 6.79% Financials 1.96% | ||
| American Campus Communities, Inc. 3.75% 2023 | 100 | 100 |
| American International Group, Inc. 4.125% 2024 | 100 | 107 |
| AvalonBay Communities, Inc. 3.625% 2020 | 100 | 104 |
| AvalonBay Communities, Inc. 2.85% 2023 | 20 | 19 |
| Bank of America Corp. 4.00% 2024 | 375 | 391 |
| Barclays Bank PLC 6.625% 2022 | €140 | 219 |
| Berkshire Hathaway Inc. 3.00% 2022 | $75 | 76 |
| BNP Paribas 5.00% 2021 | 100 | 113 |
| Boston Properties, Inc. 3.70% 2018 | 100 | 106 |
| CaixaBank, SA 5.00% 20235 | €100 | 130 |
| Citigroup Inc. 3.953% 2016 | $75 | 78 |
| Citigroup Inc. 4.45% 2017 | 75 | 79 |
| Citigroup Inc. 3.75% 2024 | 105 | 108 |
| Corporate Office Properties Trust 3.60% 2023 | 65 | 63 |
| Goldman Sachs Group, Inc. 5.75% 2022 | 70 | 81 |
| Goldman Sachs Group, Inc. 3.625% 2023 | 150 | 152 |
| Goldman Sachs Group, Inc. 4.00% 2024 | 60 | 62 |
| HSBC Holdings PLC 4.00% 2022 | 100 | 107 |
| JPMorgan Chase & Co. 3.25% 2022 | 28 | 28 |
| JPMorgan Chase & Co., Series S, junior subordinated, perpetual, 6.75% (undated)5 | 135 | 143 |
| Kimco Realty Corp., Series C, 5.783% 2016 | 100 | 105 |
| Lloyds Banking Group PLC 6.50% 2020 | €210 | 314 |
| Morgan Stanley 1.75% 2016 | $150 | 151 |
| Morgan Stanley 3.70% 2024 | 55 | 56 |
| PNC Financial Services Group, Inc. 2.854% 2022 | 100 | 99 |
| Prologis, Inc. 3.375% 2024 | €100 | 139 |
| Rabobank Nederland 3.875% 2023 | 100 | 138 |
| Simon Property Group, LP 3.375% 2022 | $100 | 103 |
| VEB Finance Ltd. 6.902% 20203 | 100 | 81 |
| WEA Finance LLC 2.70% 20193 | 200 | 200 |
| WEA Finance LLC 3.75% 20243 | 200 | 203 |
| Wells Fargo & Co. 4.60% 2021 | 100 | 111 |
| Wells Fargo & Co. 3.30% 2024 | 250 | 252 |
| 4,218 | ||
| Energy 1.09% | ||
| Chevron Corp. 2.355% 2022 | 150 | 146 |
| Devon Energy Corp. 3.25% 2022 | 90 | 89 |
| Ecopetrol SA 5.875% 2045 | 100 | 93 |
| El Paso Pipeline Partners Operating Co., LLC 4.70% 2042 | 75 | 68 |
| Gazprom OJSC 5.875% 2015 | €100 | 120 |
| Kinder Morgan Energy Partners, LP 3.50% 2016 | $100 | 102 |
| Kinder Morgan Energy Partners, LP 3.50% 2021 | 30 | 30 |
| Kinder Morgan Energy Partners, LP 5.50% 2044 | 200 | 204 |
| Kinder Morgan, Inc. 4.30% 2025 | 150 | 151 |
| Bonds, notes & other debt instruments Corporate bonds & notes (continued) Energy (continued) | Principal amount (000) | Value (000) |
| Pemex Project Funding Master Trust 5.75% 2018 | $200 | $216 |
| Petrobras International Finance Co. 5.375% 2021 | 80 | 74 |
| Petróleos Mexicanos 4.875% 2022 | 100 | 105 |
| Petróleos Mexicanos 6.50% 2041 | 45 | 52 |
| Spectra Energy Partners, LP 2.95% 2016 | 75 | 77 |
| Statoil ASA 3.125% 2017 | 40 | 42 |
| Statoil ASA 1.95% 2018 | 25 | 25 |
| Statoil ASA 3.15% 2022 | 160 | 162 |
| Statoil ASA 3.70% 2024 | 50 | 52 |
| StatoilHydro ASA 2.45% 2023 | 100 | 95 |
| Total Capital International 2.875% 2022 | 250 | 248 |
| Transocean Inc. 5.05% 2016 | 25 | 25 |
| Transocean Inc. 2.50% 2017 | 25 | 22 |
| Transocean Inc. 6.375% 2021 | 50 | 46 |
| Williams Partners LP 4.50% 2023 | 100 | 101 |
| 2,345 | ||
| Health care 0.83% | ||
| AbbVie Inc. 2.90% 2022 | 60 | 59 |
| Aetna Inc. 2.75% 2022 | 50 | 49 |
| Bayer AG 3.375% 20243 | 200 | 204 |
| Becton, Dickinson and Co. 3.734% 2024 | 75 | 77 |
| Gilead Sciences, Inc. 3.70% 2024 | 100 | 105 |
| Gilead Sciences, Inc. 3.50% 2025 | 200 | 206 |
| Humana Inc. 3.15% 2022 | 100 | 97 |
| Medtronic, Inc. 3.50% 20253 | 250 | 256 |
| Novartis Capital Corp. 2.90% 2015 | 50 | 50 |
| Novartis Capital Corp. 3.40% 2024 | 100 | 104 |
| Novartis Securities Investment Ltd. 5.125% 2019 | 25 | 28 |
| Pfizer Inc. 2.10% 2019 | 100 | 101 |
| Pfizer Inc. 3.40% 2024 | 200 | 209 |
| Pfizer Inc. 4.40% 2044 | 200 | 218 |
| Roche Holdings, Inc. 6.00% 20193 | 29 | 34 |
| 1,797 | ||
| Telecommunication services 0.73% | ||
| Deutsche Telekom International Finance BV 2.25% 20173 | 150 | 152 |
| Deutsche Telekom International Finance BV 6.00% 2017 | €75 | 101 |
| Orange SA 2.75% 2019 | $140 | 143 |
| Verizon Communications Inc. 2.625% 20203 | 40 | 40 |
| Verizon Communications Inc. 2.45% 2022 | 125 | 118 |
| Verizon Communications Inc. 5.15% 2023 | 630 | 696 |
| Verizon Communications Inc. 3.50% 2024 | 253 | 249 |
| Verizon Communications Inc. 6.55% 2043 | 34 | 44 |
| Verizon Communications Inc. 4.862% 20463 | 33 | 34 |
| 1,577 | ||
| Consumer staples 0.60% | ||
| Altria Group, Inc. 2.625% 2020 | 100 | 100 |
| Altria Group, Inc. 4.75% 2021 | 150 | 166 |
| Altria Group, Inc. 4.25% 2042 | 150 | 144 |
| Coca-Cola Co. 1.80% 2016 | 85 | 86 |
| ConAgra Foods, Inc. 1.90% 2018 | 25 | 25 |
| Kraft Foods Inc. 3.50% 2022 | 100 | 103 |
| Bonds, notes & other debt instruments Corporate bonds & notes (continued) Consumer staples (continued) | Principal amount (000) | Value (000) |
| PepsiCo, Inc. 2.50% 2016 | $50 | $51 |
| Pernod Ricard SA 4.45% 20223 | 150 | 161 |
| Philip Morris International Inc. 1.875% 2019 | 100 | 100 |
| Philip Morris International Inc. 2.90% 2021 | 100 | 102 |
| Procter & Gamble Co. 1.45% 2016 | 20 | 20 |
| Wal-Mart Stores, Inc. 2.80% 2016 | 150 | 154 |
| Wal-Mart Stores, Inc. 2.55% 2023 | 75 | 74 |
| 1,286 | ||
| Industrials 0.45% | ||
| Boeing Company 0.95% 2018 | 45 | 44 |
| Burlington Northern Santa Fe LLC 3.40% 2024 | 35 | 36 |
| General Electric Capital Corp. 2.30% 2017 | 165 | 169 |
| General Electric Capital Corp. 3.15% 2022 | 50 | 51 |
| General Electric Capital Corp. 3.10% 2023 | 100 | 101 |
| General Electric Capital Corp., Series A, junior subordinated 7.125% (undated)5 | 100 | 117 |
| Red de Carreteras de Occidente 9.00% 20286 | MXN2,000 | 133 |
| Union Pacific Corp. 2.95% 2023 | $100 | 101 |
| United Technologies Corp. 3.10% 2022 | 215 | 220 |
| 972 | ||
| Consumer discretionary 0.40% | ||
| Comcast Corp. 4.65% 2042 | 75 | 82 |
| DaimlerChrysler North America Holding Corp. 1.875% 20183 | 150 | 151 |
| McDonald’s Corp. 3.50% 2020 | 50 | 53 |
| NBCUniversal Media, LLC 4.375% 2021 | 50 | 55 |
| President & Fellows of Harvard College 3.619% 2037 | 150 | 151 |
| Thomson Reuters Corp. 4.30% 2023 | 75 | 80 |
| Time Warner Inc. 4.75% 2021 | 150 | 164 |
| Viacom Inc. 4.25% 2023 | 55 | 57 |
| Viacom Inc. 3.875% 2024 | 75 | 75 |
| 868 | ||
| Utilities 0.39% | ||
| Abu Dhabi National Energy Co. PJSC (TAQA) 6.165% 2017 | 125 | 139 |
| Berkshire Hathaway Energy Co. 3.50% 20253 | 150 | 151 |
| Duke Energy Corp. 3.75% 2024 | 70 | 73 |
| E.ON International Finance BV 5.80% 20183 | 25 | 28 |
| MidAmerican Energy Holdings Co. 2.00% 2018 | 100 | 100 |
| National Grid PLC 6.30% 2016 | 40 | 43 |
| Niagara Mohawk Power Corp. 3.508% 20243 | 85 | 88 |
| Pacific Gas and Electric Co. 3.85% 2023 | 70 | 73 |
| PacifiCorp., First Mortgage Bonds, 3.60% 2024 | 30 | 31 |
| PSEG Power LLC 2.75% 2016 | 15 | 16 |
| Sierra Pacific Power Co., General and Refunding Mortgage Notes, Series T, 3.375% 2023 | 100 | 104 |
| 846 | ||
| Information technology 0.27% | ||
| First Data Corp. 7.375% 20193 | 75 | 79 |
| International Business Machines Corp. 1.95% 2016 | 200 | 204 |
| International Business Machines Corp. 1.25% 2018 | 100 | 99 |
| Samsung Electronics America, Inc. 1.75% 20173 | 200 | 201 |
| 583 |
| Bonds, notes & other debt instruments Corporate bonds & notes (continued) Materials 0.07% | Principal amount (000) | Value (000) |
| Monsanto Co. 4.40% 2044 | $100 | $104 |
| Rio Tinto Finance (USA) Ltd. 2.50% 2016 | 50 | 51 |
| 155 | ||
| Total corporate bonds & notes | 14,647 | |
| Mortgage-backed obligations 3.05% | ||
| Fannie Mae 2.50% 20286 | 178 | 182 |
| Fannie Mae 5.00% 20416 | 94 | 105 |
| Fannie Mae 5.00% 20416 | 36 | 40 |
| Fannie Mae 4.50% 20416 | 101 | 111 |
| Fannie Mae 4.00% 20436 | 306 | 329 |
| Fannie Mae 3.50% 20456,7 | 750 | 781 |
| Fannie Mae 4.50% 20456,7 | 1,050 | 1,140 |
| Fannie Mae 3.50% 20456,7 | 1,625 | 1,689 |
| Fannie Mae 4.00% 20456,7 | 1,825 | 1,942 |
| Hilton USA Trust, Series 2013-HLF-AFX, 2.662% 20303,6 | 230 | 230 |
| WFLD Mortgage Trust, Series 2014-MONT, Class A, 3.755% 20313,5,6 | 30 | 32 |
| 6,581 | ||
| Total bonds, notes & other debt instruments (cost: $66,396,000) | 65,536 | |
| Short-term securities 10.52% | ||
| Federal Home Loan Bank 0.10% due 2/20/2015 | 6,500 | 6,500 |
| Freddie Mac 0.05% due 1/9/2015 | 5,900 | 5,900 |
| General Electric Co. 0.10% due 1/2/2015 | 3,300 | 3,300 |
| Sumitomo Mitsui Banking Corp. 0.12% due 1/13/20153 | 3,000 | 3,000 |
| Victory Receivables Corp. 0.16% due 1/5/20153 | 4,000 | 4,000 |
| Total short-term securities (cost: $22,699,000) | 22,700 | |
| Total investment securities 102.12% (cost: $200,454,000) | 220,314 | |
| Other assets less liabilities (2.12)% | (4,565) | |
| Net assets 100.00% | $215,749 |
| 1 | Valued under fair value procedures adopted by authority of the board of trustees. The total value of all such securities, including those in “Miscellaneous,“ was $69,790,000, which represented 32.35% of the net assets of the fund. This amount includes $69,262,000 related to certain securities trading outside the U.S. whose values were adjusted as a result of significant market movements following the close of local trading. |
| 2 | Security did not produce income during the last 12 months. |
| 3 | Acquired in a transaction exempt from registration under Rule 144A or Section 4(2) of the Securities Act of 1933. May be resold in the U.S. in transactions exempt from registration, normally to qualified institutional buyers. The total value of all such securities was $10,322,000, which represented 4.78% of the net assets of the fund. |
| 4 | Index-linked bond whose principal amount moves with a government price index. |
| 5 | Coupon rate may change periodically. |
| 6 | Principal payments may be made periodically. Therefore, the effective maturity date may be earlier than the stated maturity date. |
| 7 | A portion or all of the security purchased on a TBA basis. |
| Key to abbreviations and symbols | |||
| CDI = CREST Depository Interest | CLP = Chilean pesos | INR = Indian rupees | PLN = Polish zloty |
| FDR = Fiduciary Depositary Receipts | COP = Colombian pesos | ¥ = Japanese yen | RUB = Russian rubles |
| GDR = Global Depositary Receipts | € = Euros | KRW = South Korean won | SKr = Swedish kronor |
| TBA = To be announced | £ = British pounds | MXN = Mexican pesos | ZAR = South African rand |
| A$ = Australian dollars | IDR = Indonesian rupiah | NKr = Norwegian kroner |
| Bonds, notes & other debt instruments 95.74% U.S. Treasury bonds & notes 37.80% U.S. Treasury 30.56% | Principal amount (000) | Value (000) |
| U.S. Treasury 0.625% 20161 | $25,000 | $25,034 |
| U.S. Treasury 7.50% 2016 | 35,000 | 39,468 |
| U.S. Treasury 0.75% 20171 | 109,229 | 108,819 |
| U.S. Treasury 8.75% 2017 | 50,000 | 59,313 |
| U.S. Treasury 0.75% 2018 | 16,250 | 16,005 |
| U.S. Treasury 1.00% 2018 | 12,500 | 12,377 |
| U.S. Treasury 1.25% 2018 | 218,100 | 216,702 |
| U.S. Treasury 1.25% 2018 | 21,750 | 21,592 |
| U.S. Treasury 1.375% 2018 | 108,000 | 108,110 |
| U.S. Treasury 1.50% 2018 | 86,875 | 87,289 |
| U.S. Treasury 1.00% 2019 | 32,750 | 31,958 |
| U.S. Treasury 1.50% 2019 | 185,000 | 183,822 |
| U.S. Treasury 1.50% 2019 | 178,755 | 177,602 |
| U.S. Treasury 1.50% 2019 | 43,000 | 43,024 |
| U.S. Treasury 1.625% 2019 | 310,000 | 310,825 |
| U.S. Treasury 1.625% 2019 | 152,750 | 152,910 |
| U.S. Treasury 1.625% 2019 | 152,625 | 152,875 |
| U.S. Treasury 1.625% 2019 | 573 | 572 |
| U.S. Treasury 1.75% 2019 | 155,320 | 156,205 |
| U.S. Treasury 1.125% 2020 | 67,300 | 65,381 |
| U.S. Treasury 1.25% 2020 | 44,425 | 43,488 |
| U.S. Treasury 1.375% 2020 | 68,250 | 66,979 |
| U.S. Treasury 2.00% 2020 | 17,000 | 17,146 |
| U.S. Treasury 8.75% 2020 | 40,000 | 55,000 |
| U.S. Treasury 2.125% 2021 | 55,000 | 55,560 |
| U.S. Treasury 3.625% 2021 | 7,500 | 8,260 |
| U.S. Treasury 1.625% 2022 | 22,776 | 22,088 |
| U.S. Treasury 1.625% 2022 | 22,665 | 22,035 |
| U.S. Treasury 1.75% 2023 | 22,750 | 22,142 |
| U.S. Treasury 2.00% 2023 | 44,809 | 44,613 |
| U.S. Treasury 2.25% 2024 | 96,985 | 97,682 |
| U.S. Treasury 2.375% 2024 | 180,000 | 183,290 |
| U.S. Treasury 2.75% 2024 | 40,050 | 42,134 |
| U.S. Treasury 7.625% 2025 | 20,000 | 29,969 |
| U.S. Treasury 6.125% 2027 | 25,000 | 35,598 |
| U.S. Treasury 3.75% 2041 | 19,565 | 23,600 |
| U.S. Treasury 3.625% 2043 | 75,400 | 88,713 |
| U.S. Treasury 3.00% 2044 | 88,679 | 93,189 |
| U.S. Treasury 3.125% 2044 | 3,341 | 3,596 |
| 2,924,965 | ||
| U.S. Treasury inflation-protected securities 7.24% | ||
| U.S. Treasury Inflation-Protected Security 0.50% 20152 | 41,286 | 40,750 |
| U.S. Treasury Inflation-Protected Security 1.625% 20152 | 21,035 | 20,997 |
| U.S. Treasury Inflation-Protected Security 0.125% 20182 | 12,327 | 12,296 |
| Bonds, notes & other debt instruments U.S. Treasury bonds & notes (continued) U.S. Treasury inflation-protected securities (continued) | Principal amount (000) | Value (000) |
| U.S. Treasury Inflation-Protected Security 0.125% 20192 | $150,739 | $149,387 |
| U.S. Treasury Inflation-Protected Security 0.125% 20232 | 3,307 | 3,212 |
| U.S. Treasury Inflation-Protected Security 0.125% 20242 | 74,152 | 71,752 |
| U.S. Treasury Inflation-Protected Security 0.625% 20242 | 189,641 | 191,355 |
| U.S. Treasury Inflation-Protected Security 2.00% 20262 | 4,785 | 5,506 |
| U.S. Treasury Inflation-Protected Security 1.375% 20442 | 172,855 | 197,385 |
| 692,640 | ||
| Total U.S. Treasury bonds & notes | 3,617,605 | |
| Corporate bonds & notes 29.87% Financials 7.40% | ||
| ACE INA Holdings Inc. 2.60% 2015 | 2,580 | 2,621 |
| ACE INA Holdings Inc. 3.35% 2024 | 350 | 354 |
| Alexandria Real Estate Equities, Inc. 2.75% 2020 | 3,720 | 3,689 |
| Alexandria Real Estate Equities, Inc. 3.90% 2023 | 3,690 | 3,708 |
| Alexandria Real Estate Equities, Inc. 4.50% 2029 | 150 | 154 |
| American Campus Communities, Inc. 3.75% 2023 | 4,050 | 4,050 |
| American Campus Communities, Inc. 4.125% 2024 | 6,680 | 6,760 |
| American Express Co. 6.15% 2017 | 2,500 | 2,787 |
| American Express Co. 1.55% 2018 | 8,500 | 8,426 |
| American International Group, Inc. 2.30% 2019 | 3,050 | 3,056 |
| American International Group, Inc. 3.375% 2020 | 1,155 | 1,201 |
| American International Group, Inc. 4.125% 2024 | 3,300 | 3,520 |
| American International Group, Inc. 4.50% 2044 | 3,945 | 4,185 |
| American Tower Corp. 3.40% 2019 | 7,525 | 7,666 |
| Assicurazioni Generali SPA 7.75% 20423 | €3,100 | 4,701 |
| Assicurazioni Generali SPA 10.125% 2042 | 3,800 | 6,380 |
| AvalonBay Communities, Inc. 3.625% 2020 | $5,885 | 6,129 |
| AXA SA 8.60% 2030 | 2,625 | 3,573 |
| Bank of America Corp. 3.75% 2016 | 3,415 | 3,539 |
| Bank of America Corp. 2.60% 2019 | 14,463 | 14,584 |
| Bank of America Corp., Series L, 2.65% 2019 | 11,412 | 11,507 |
| Bank of America Corp. 3.30% 2023 | 6,995 | 7,003 |
| Bank of America Corp. 4.00% 2024 | 1,480 | 1,543 |
| Bank of America Corp. junior subordinated 6.50% noncumulative (undated)3 | 900 | 918 |
| Barclays Bank PLC 2.50% 2019 | 5,175 | 5,249 |
| Barclays Bank PLC 6.00% 2021 | €6,775 | 10,070 |
| Barclays Bank PLC 10.179% 20214 | $13,250 | 17,834 |
| BB&T Corp. 2.45% 2020 | 13,000 | 12,981 |
| Berkshire Hathaway Inc. 4.40% 2042 | 735 | 794 |
| BNP Paribas 4.25% 2024 | 660 | 668 |
| BPCE SA group 2.50% 2019 | 300 | 302 |
| BPCE SA group 5.70% 20234 | 23,390 | 25,191 |
| BPCE SA group 4.50% 20254 | 3,225 | 3,158 |
| Brandywine Operating Partnership, LP 4.95% 2018 | 5,295 | 5,696 |
| CIT Group Inc. 3.875% 2019 | 2,100 | 2,100 |
| CIT Group Inc., Series C, 5.50% 20194 | 2,750 | 2,910 |
| Citigroup Inc. 2.50% 2019 | 10,750 | 10,766 |
| Citigroup Inc. 2.55% 2019 | 17,239 | 17,370 |
| Citigroup Inc. 8.50% 2019 | 969 | 1,209 |
| Citigroup Inc., Series N, junior subordinated 5.80% (undated)3 | 3,840 | 3,850 |
| CME Group Inc. 5.30% 2043 | 3,995 | 4,860 |
| CNA Financial Corp. 6.50% 2016 | 3,750 | 4,059 |
| Bonds, notes & other debt instruments Corporate bonds & notes (continued) Financials (continued) | Principal amount (000) | Value (000) |
| CNA Financial Corp. 7.35% 2019 | $1,800 | $2,153 |
| CNA Financial Corp. 7.25% 2023 | 3,000 | 3,747 |
| CNA Financial Corp. 3.95% 2024 | 455 | 461 |
| Credit Suisse Group AG 1.375% 2017 | 10,750 | 10,729 |
| Credit Suisse Group AG 2.30% 2019 | 10,750 | 10,743 |
| Credit Suisse Group AG 3.00% 2021 | 1,000 | 997 |
| Crescent Resources 10.25% 20174 | 1,350 | 1,455 |
| DCT Industrial Trust Inc. 4.50% 2023 | 3,760 | 3,923 |
| Developers Diversified Realty Corp. 5.50% 2015 | 1,105 | 1,121 |
| Developers Diversified Realty Corp. 9.625% 2016 | 10,920 | 11,993 |
| Developers Diversified Realty Corp. 7.50% 2017 | 2,650 | 2,971 |
| Developers Diversified Realty Corp. 4.75% 2018 | 775 | 828 |
| Developers Diversified Realty Corp. 7.875% 2020 | 3,155 | 3,896 |
| ERP Operating LP 7.125% 2017 | 380 | 434 |
| ERP Operating LP 3.00% 2023 | 2,735 | 2,672 |
| Essex Portfolio L.P. 3.25% 2023 | 685 | 664 |
| Essex Portfolio L.P. 3.875% 2024 | 1,500 | 1,529 |
| Goldman Sachs Group, Inc. 2.55% 2019 | 2,980 | 2,969 |
| Goldman Sachs Group, Inc. 5.75% 2022 | 5,000 | 5,789 |
| Goldman Sachs Group, Inc. 3.625% 2023 | 5,000 | 5,072 |
| Goldman Sachs Group, Inc. 3.85% 2024 | 11,490 | 11,798 |
| Goldman Sachs Group, Inc. 4.00% 2024 | 17,650 | 18,344 |
| Goldman Sachs Group, Inc., Series L, 5.70% 20493 | 1,182 | 1,200 |
| Goodman Funding Pty Ltd. 6.00% 20224 | 11,850 | 13,525 |
| HBOS PLC 6.75% 20184 | 8,315 | 9,288 |
| Hospitality Properties Trust 6.30% 2016 | 300 | 314 |
| Hospitality Properties Trust 5.625% 2017 | 2,900 | 3,108 |
| Hospitality Properties Trust 6.70% 2018 | 6,140 | 6,788 |
| Hospitality Properties Trust 5.00% 2022 | 1,470 | 1,551 |
| Hospitality Properties Trust 4.50% 2023 | 3,705 | 3,777 |
| Hospitality Properties Trust 4.50% 2025 | 1,925 | 1,942 |
| HSBC Holdings PLC 5.25% 2044 | 975 | 1,096 |
| Intercontinentalexchange, Inc. 2.50% 2018 | 1,295 | 1,320 |
| Intercontinentalexchange, Inc. 4.00% 2023 | 2,445 | 2,578 |
| Intesa Sanpaolo SpA 5.017% 20244 | 1,955 | 1,901 |
| iStar Financial Inc. 4.875% 2018 | 1,650 | 1,627 |
| iStar Financial Inc. 5.00% 2019 | 3,725 | 3,632 |
| JPMorgan Chase & Co. 3.40% 2015 | 7,000 | 7,092 |
| JPMorgan Chase & Co. 3.875% 2024 | 1,540 | 1,543 |
| JPMorgan Chase & Co., Series-V, junior subordinated, perpetual, 5.00% (undated)3 | 1,000 | 983 |
| Kimco Realty Corp., Series C, 4.904% 2015 | 1,120 | 1,126 |
| Kimco Realty Corp. 5.70% 2017 | 4,250 | 4,632 |
| Kimco Realty Corp. 6.875% 2019 | 3,975 | 4,716 |
| Leucadia National Corp. 5.50% 2023 | 770 | 791 |
| Liberty Mutual Group Inc. 6.70% 20164 | 3,750 | 4,071 |
| Liberty Mutual Group Inc. 4.85% 20444 | 1,525 | 1,556 |
| Lloyds Banking Group PLC 6.50% 20204 | 875 | 1,015 |
| Lloyds Banking Group PLC 4.50% 2024 | 11,900 | 12,032 |
| Merrill Lynch & Co., Inc. 4.625% 2018 | €6,515 | 8,877 |
| MetLife Capital Trust IV, junior subordinated 7.875% 20673,4 | $2,505 | 3,213 |
| MetLife Capital Trust X, junior subordinated 9.25% 20683,4 | 300 | 431 |
| MetLife Global Funding I 2.30% 20194 | 675 | 678 |
| Metlife, Inc. 3.60% 2024 | 1,055 | 1,085 |
| Morgan Stanley 3.80% 2016 | 5,000 | 5,168 |
| Bonds, notes & other debt instruments Corporate bonds & notes (continued) Financials (continued) | Principal amount (000) | Value (000) |
| Morgan Stanley 2.125% 2018 | $23,980 | $24,015 |
| Morgan Stanley 2.375% 2019 | 4,675 | 4,661 |
| Morgan Stanley 2.50% 2019 | 14,600 | 14,627 |
| Morgan Stanley 3.70% 2024 | 10,991 | 11,163 |
| Morgan Stanley, Series F, 3.875% 2024 | 1,300 | 1,336 |
| New York Life Global Funding 1.45% 20174 | 1,250 | 1,247 |
| New York Life Global Funding 2.10% 20194 | 1,250 | 1,256 |
| NN Group NV, 4.50% (undated)3 | €8,750 | 10,580 |
| Nordea Bank AB 4.875% 20214 | $700 | 759 |
| Piedmont Operating Partnership LP 3.40% 2023 | 365 | 354 |
| PNC Bank 2.40% 2019 | 13,500 | 13,572 |
| PNC Financial Services Group, Inc. 2.854% 2022 | 6,050 | 5,960 |
| PNC Financial Services Group, Inc. 3.90% 2024 | 1,000 | 1,018 |
| PNC Funding Corp. 3.30% 2022 | 9,000 | 9,270 |
| PRICOA Global Funding I 1.35% 20174 | 300 | 299 |
| Prologis, Inc. 2.75% 2019 | 6,630 | 6,731 |
| Prologis, Inc. 3.35% 2021 | 10,900 | 11,061 |
| Prologis, Inc. 4.25% 2023 | 7,410 | 7,843 |
| Prudential Financial, Inc. 2.30% 2018 | 2,175 | 2,202 |
| Prudential Financial, Inc. 3.50% 2024 | 12,395 | 12,624 |
| Prudential Financial, Inc. 4.60% 2044 | 925 | 979 |
| QBE Insurance Group Ltd. 2.40% 20184 | 5,710 | 5,715 |
| Rabobank Nederland 4.625% 2023 | 15,185 | 16,136 |
| Realogy Corp. 4.50% 20194 | 1,800 | 1,791 |
| Realogy Corp. 5.25% 20214 | 925 | 903 |
| Realogy Corp., LOC, 4.40% 20163,5,6 | 132 | 131 |
| Regions Financial Corp., Series A-I, 5.20% 2015 | 205 | 207 |
| Regions Financial Corp. 5.75% 2015 | 1,840 | 1,878 |
| Regions Financial Corp. 2.00% 2018 | 11,475 | 11,373 |
| Royal Bank of Canada 1.50% 2018 | 2,700 | 2,687 |
| Royal Bank of Scotland Group PLC, junior subordinated 6.99% (undated)3,4 | 2,450 | 2,769 |
| RSA Insurance Group PLC 9.375% 20393 | £6,450 | 12,369 |
| Ryman Hospitality Properties, Inc. 5.00% 2021 | $2,800 | 2,800 |
| Scentre Group 2.375% 20194 | 3,605 | 3,583 |
| Scentre Group, 3.50% 20254 | 6,190 | 6,227 |
| Simon Property Group, LP 10.35% 2019 | 5,655 | 7,403 |
| Svenska Handelsbanken AB 2.25% 2019 | 1,000 | 1,006 |
| UBS AG 5.75% 2018 | 2,240 | 2,522 |
| UDR, Inc., Series A, 5.25% 2015 | 5,400 | 5,407 |
| UDR, Inc. 3.70% 2020 | 500 | 519 |
| Unum Group 7.125% 2016 | 3,400 | 3,717 |
| Unum Group 5.625% 2020 | 1,100 | 1,242 |
| UnumProvident Finance Co. PLC 6.85% 20154 | 767 | 804 |
| WEA Finance LLC 1.75% 20174 | 540 | 537 |
| WEA Finance LLC 2.70% 20194 | 7,610 | 7,616 |
| WEA Finance LLC 3.75% 20244 | 3,375 | 3,432 |
| Wells Fargo & Co. 3.30% 2024 | 5,480 | 5,521 |
| 707,917 | ||
| Energy 3.86% | ||
| Alpha Natural Resources, Inc. 9.75% 2018 | 1,000 | 455 |
| Alpha Natural Resources, Inc. 6.00% 2019 | 503 | 161 |
| Alpha Natural Resources, Inc. 7.50% 20204 | 3,000 | 1,897 |
| Alpha Natural Resources, Inc. 6.25% 2021 | 1,425 | 442 |
| Bonds, notes & other debt instruments Corporate bonds & notes (continued) Energy (continued) | Principal amount (000) | Value (000) |
| American Energy (Marcellus), Term Loan B, 5.25% 20203,5,6 | $550 | $487 |
| American Energy (Marcellus), Term Loan A, 8.50% 20213,5,6 | 1,875 | 1,608 |
| American Energy (Permian Basin) 7.125% 20204 | 2,075 | 1,546 |
| American Energy (Permian Basin) 7.375% 20214 | 725 | 537 |
| American Energy (Woodford LLC), 9.00% 20224 | 1,000 | 650 |
| Anadarko Petroleum Corp. 6.375% 2017 | 10,000 | 11,126 |
| Anadarko Petroleum Corp. 8.70% 2019 | 1,255 | 1,539 |
| Arch Coal, Inc. 7.00% 2019 | 1,875 | 572 |
| Arch Coal, Inc. 7.25% 2021 | 1,525 | 452 |
| Boardwalk Pipeline Partners 3.375% 2023 | 3,750 | 3,422 |
| Boardwalk Pipelines, LP 4.95% 2024 | 1,525 | 1,519 |
| BP Capital Markets PLC 0.657% 20163 | 14,560 | 14,569 |
| Canadian Natural Resources Ltd. 3.45% 2021 | 3,440 | 3,399 |
| Canadian Natural Resources Ltd. 3.80% 2024 | 280 | 275 |
| Cenovus Energy Inc. 3.80% 2023 | 1,120 | 1,096 |
| Chevron Corp. 2.193% 2019 | 2,145 | 2,155 |
| Chevron Corp. 2.355% 2022 | 5,000 | 4,857 |
| CONSOL Energy Inc. 8.25% 2020 | 4,900 | 5,102 |
| CONSOL Energy Inc. 5.875% 20224 | 2,625 | 2,454 |
| Denbury Resources Inc. 4.625% 2023 | 1,000 | 872 |
| Devon Energy Corp. 2.25% 2018 | 7,310 | 7,290 |
| Devon Energy Corp. 3.25% 2022 | 5,200 | 5,117 |
| Diamond Offshore Drilling, Inc. 4.875% 2043 | 10,375 | 8,870 |
| Ecopetrol SA 5.875% 2045 | 2,165 | 2,013 |
| Enbridge Energy Partners, LP, Series B, 6.50% 2018 | 7,940 | 9,000 |
| Enbridge Energy Partners, LP 9.875% 2019 | 10,500 | 13,295 |
| Enbridge Energy Partners, LP 5.20% 2020 | 5,655 | 6,169 |
| Enbridge Energy Partners, LP 4.20% 2021 | 9,025 | 9,440 |
| Enbridge Inc. 4.00% 2023 | 7,030 | 6,878 |
| Enbridge Inc. 4.50% 2044 | 5,250 | 4,550 |
| EnLink Midstream Partners, LP 2.70% 2019 | 155 | 153 |
| EnLink Midstream Partners, LP 4.40% 2024 | 525 | 533 |
| EnLink Midstream Partners, LP 5.05% 2045 | 1,880 | 1,823 |
| Enterprise Products Operating LLC 2.55% 2019 | 2,095 | 2,076 |
| Enterprise Products Operating LLC 5.20% 2020 | 1,260 | 1,391 |
| Enterprise Products Operating LLC 4.05% 2022 | 5,000 | 5,196 |
| Enterprise Products Operating LLC 3.35% 2023 | 1,275 | 1,263 |
| Enterprise Products Operating LLC 3.90% 2024 | 885 | 903 |
| Enterprise Products Operating LLC 3.75% 2025 | 7,010 | 7,051 |
| Enterprise Products Operating LLC 4.85% 2044 | 2,580 | 2,701 |
| Exxon Mobil Corp. 1.819% 2019 | 880 | 883 |
| Exxon Mobil Corp. 3.176% 2024 | 440 | 455 |
| Harvest Operations Corp. 2.125% 20184 | 840 | 836 |
| Husky Energy Inc. 7.25% 2019 | 3,390 | 3,979 |
| Jupiter Resources Inc. 8.50% 20224 | 2,000 | 1,515 |
| Kinder Morgan Energy Partners, LP 6.85% 2020 | 7,650 | 8,797 |
| Kinder Morgan Energy Partners, LP 3.50% 2021 | 555 | 547 |
| Kinder Morgan Energy Partners, LP 3.50% 2023 | 3,175 | 3,020 |
| Kinder Morgan Energy Partners, LP 4.15% 2024 | 4,025 | 4,022 |
| Kinder Morgan Energy Partners, LP 4.25% 2024 | 1,080 | 1,084 |
| Kinder Morgan Energy Partners, LP 6.50% 2037 | 900 | 1,015 |
| Kinder Morgan Energy Partners, LP 5.00% 2043 | 525 | 501 |
| Kinder Morgan Energy Partners, LP 5.40% 2044 | 5,845 | 5,878 |
| Kinder Morgan Energy Partners, LP 5.50% 2044 | 1,680 | 1,714 |
| Bonds, notes & other debt instruments Corporate bonds & notes (continued) Energy (continued) | Principal amount (000) | Value (000) |
| Kinder Morgan, Inc. 4.30% 2025 | $9,150 | $9,199 |
| Kinder Morgan, Inc. 5.30% 2034 | 1,895 | 1,929 |
| Kinder Morgan, Inc. 5.55% 2045 | 9,650 | 9,920 |
| NGL Energy Partners LP 6.875% 20214 | 1,000 | 990 |
| NGPL PipeCo LLC 7.119% 20174 | 3,025 | 2,987 |
| NGPL PipeCo LLC 9.625% 20194 | 4,850 | 4,886 |
| Oasis Petroleum Inc. 6.875% 2022 | 1,125 | 1,029 |
| Odebrecht Offshore Drilling Finance Ltd. 6.75% 20224,5 | 2,691 | 2,469 |
| Odebrecht Offshore Drilling Finance Ltd., First Lien, 6.625% 20234,5 | 217 | 195 |
| PDC Energy Inc. 7.75% 2022 | 2,275 | 2,173 |
| Peabody Energy Corp. 6.00% 2018 | 3,300 | 3,011 |
| Peabody Energy Corp. 6.25% 2021 | 2,200 | 1,889 |
| Petrobras Global Finance Co. 6.25% 2024 | 6,455 | 6,158 |
| Petrobras International Finance Co. 2.875% 2015 | 1,000 | 996 |
| Petrobras International Finance Co. 5.75% 2020 | 190 | 184 |
| Petrobras International Finance Co. 5.375% 2021 | 2,360 | 2,199 |
| Petrobras International Finance Co. 6.875% 2040 | 2,240 | 2,084 |
| QGOG Atlantic/Alaskan Rigs Ltd. 5.25% 20194,5 | 2,124 | 2,007 |
| Ras Laffan Liquefied Natural Gas II 5.298% 20205 | 678 | 731 |
| Ras Laffan Liquefied Natural Gas III 5.832% 20165 | 758 | 791 |
| Regency Energy Partners LP and Regency Energy Finance Corp. 6.50% 2021 | 3,375 | 3,459 |
| Rice Energy Inc. 6.25% 20224 | 1,075 | 1,005 |
| Sabine Pass Liquefaction, LLC 5.625% 2021 | 3,300 | 3,259 |
| Sabine Pass Liquefaction, LLC 5.625% 2023 | 1,300 | 1,277 |
| Sabine Pass Liquefaction, LLC 5.75% 2024 | 1,330 | 1,312 |
| Samson Investment Co. 9.75% 2020 | 4,000 | 1,677 |
| Samson Investment Co., Term Loan B, 5.00% 20183,5,6 | 150 | 119 |
| Shell International Finance BV 3.10% 2015 | 5,000 | 5,064 |
| Spectra Energy Partners, LP 2.95% 2018 | 1,615 | 1,654 |
| Spectra Energy Partners, LP 4.75% 2024 | 1,150 | 1,235 |
| Statoil ASA 0.524% 20183 | 5,275 | 5,273 |
| Statoil ASA 1.95% 2018 | 6,640 | 6,645 |
| Statoil ASA 2.25% 2019 | 1,640 | 1,643 |
| Statoil ASA 2.75% 2021 | 4,350 | 4,370 |
| Statoil ASA 3.25% 2024 | 4,945 | 4,972 |
| Tesoro Logistics LP 5.50% 20194 | 525 | 522 |
| Tesoro Logistics LP 6.25% 20224 | 2,200 | 2,205 |
| Total Capital Canada Ltd. 2.75% 2023 | 2,140 | 2,080 |
| Total Capital International 3.75% 2024 | 12,000 | 12,458 |
| TransCanada PipeLines Ltd. 6.50% 2018 | 10,900 | 12,376 |
| TransCanada PipeLines Ltd., junior subordinated 6.35% 20673 | 11,145 | 10,839 |
| Transocean Inc. 2.50% 2017 | 795 | 703 |
| Transocean Inc. 6.375% 2021 | 4,435 | 4,097 |
| Transocean Inc. 3.80% 2022 | 2,780 | 2,256 |
| Western Gas Partners LP 2.60% 2018 | 280 | 281 |
| Williams Companies, Inc. 4.55% 2024 | 2,590 | 2,413 |
| Williams Partners LP 3.80% 2015 | 2,950 | 2,959 |
| Williams Partners LP 5.25% 2020 | 6,035 | 6,559 |
| Williams Partners LP 4.50% 2023 | 500 | 505 |
| Williams Partners LP 4.30% 2024 | 10,060 | 10,060 |
| Williams Partners LP 3.90% 2025 | 1,680 | 1,618 |
| Williams Partners LP 5.40% 2044 | 555 | 545 |
| Bonds, notes & other debt instruments Corporate bonds & notes (continued) Energy (continued) | Principal amount (000) | Value (000) |
| Williams Partners LP 4.90% 2045 | $455 | $428 |
| Woodside Finance Ltd. 4.60% 20214 | 6,535 | 6,972 |
| 369,817 | ||
| Health care 3.84% | ||
| AbbVie Inc. 1.75% 2017 | 9,750 | 9,779 |
| AbbVie Inc. 2.90% 2022 | 19,050 | 18,788 |
| AbbVie Inc. 4.40% 2042 | 1,115 | 1,155 |
| Aetna Inc. 1.50% 2017 | 3,755 | 3,729 |
| Aetna Inc. 2.20% 2019 | 400 | 398 |
| Aetna Inc. 4.75% 2044 | 250 | 277 |
| Amgen Inc. 2.20% 2019 | 70 | 70 |
| Baxter International Inc. 1.85% 2018 | 2,565 | 2,555 |
| Bayer AG 2.375% 20194 | 6,855 | 6,890 |
| Bayer AG 3.00% 20214 | 1,000 | 1,010 |
| Bayer AG 3.375% 20244 | 1,590 | 1,621 |
| Becton, Dickinson and Co. 1.80% 2017 | 8,750 | 8,789 |
| Becton, Dickinson and Co. 2.675% 2019 | 4,425 | 4,488 |
| Becton, Dickinson and Co. 3.734% 2024 | 6,060 | 6,249 |
| Becton, Dickinson and Co. 4.685% 2044 | 5,025 | 5,434 |
| Boston Scientific Corp. 6.00% 2020 | 3,675 | 4,146 |
| Cardinal Health, Inc. 1.90% 2017 | 4,710 | 4,750 |
| Cardinal Health, Inc. 1.70% 2018 | 1,400 | 1,392 |
| Celgene Corp 3.625% 2024 | 2,750 | 2,814 |
| Celgene Corp 4.625% 2044 | 9,575 | 9,972 |
| Centene Corp. 5.75% 2017 | 2,050 | 2,183 |
| DJO Finance LLC 7.75% 2018 | 175 | 171 |
| DJO Finance LLC 8.75% 2018 | 2,215 | 2,315 |
| DJO Finance LLC 9.875% 2018 | 2,070 | 2,111 |
| Endo Finance LLC & Endo Finco Inc. 7.00% 20194 | 430 | 450 |
| Endo Pharmaceuticals Holdings Inc. 5.75% 20224 | 685 | 687 |
| Express Scripts Inc. 3.125% 2016 | 19,500 | 20,056 |
| Express Scripts Inc. 2.65% 2017 | 6,250 | 6,394 |
| Forest Laboratories, Inc. 5.00% 20214 | 1,035 | 1,122 |
| Gilead Sciences, Inc. 3.70% 2024 | 3,660 | 3,846 |
| Gilead Sciences, Inc. 3.50% 2025 | 8,865 | 9,118 |
| Gilead Sciences, Inc. 4.80% 2044 | 1,460 | 1,626 |
| Gilead Sciences, Inc. 4.50% 2045 | 3,400 | 3,649 |
| Grifols Worldwide Operations Ltd. 5.25% 20224 | 800 | 820 |
| HCA Inc. 6.375% 2015 | 1,000 | 1,002 |
| HCA Inc. 3.75% 2019 | 720 | 723 |
| HCA Inc. 6.50% 2020 | 1,550 | 1,741 |
| Humana Inc. 2.625% 2019 | 2,000 | 2,002 |
| Humana Inc. 3.85% 2024 | 8,650 | 8,781 |
| Humana Inc. 4.95% 2044 | 12,245 | 13,072 |
| inVentiv Health Inc. 11.00% 20184 | 2,365 | 2,063 |
| inVentiv Health Inc. 12.00% 20183,4,7 | 3,398 | 3,211 |
| Kindred Healthcare, Inc. 8.00% 20204 | 1,175 | 1,254 |
| Kinetic Concepts, Inc. 10.50% 2018 | 1,230 | 1,341 |
| Kinetic Concepts, Inc. 12.50% 2019 | 2,295 | 2,547 |
| McKesson Corp. 3.25% 2016 | 3,051 | 3,125 |
| McKesson Corp. 1.292% 2017 | 1,300 | 1,294 |
| McKesson Corp. 2.284% 2019 | 8,810 | 8,800 |
| McKesson Corp. 3.796% 2024 | 7,160 | 7,369 |
| Bonds, notes & other debt instruments Corporate bonds & notes (continued) Health care (continued) | Principal amount (000) | Value (000) |
| McKesson Corp. 4.883% 2044 | $1,705 | $1,886 |
| Medtronic, Inc. 2.50% 20204 | 1,785 | 1,792 |
| Medtronic, Inc. 3.50% 20254 | 14,150 | 14,506 |
| Medtronic, Inc. 4.375% 20354 | 1,505 | 1,602 |
| Medtronic, Inc. 4.625% 2044 | 450 | 486 |
| Medtronic, Inc. 4.625% 20454 | 28,195 | 30,692 |
| Merck & Co., Inc. 2.80% 2023 | 9,950 | 9,899 |
| Multiplan Inc., Term Loan B, 3.75% 20213,5,6 | 3,145 | 3,065 |
| Novartis Capital Corp. 3.40% 2024 | 8,370 | 8,725 |
| Omnicare, Inc. 4.75% 2022 | 150 | 153 |
| Omnicare, Inc. 5.00% 2024 | 175 | 180 |
| Ortho-Clinical Diagnostics Inc. 6.625% 20224 | 1,660 | 1,494 |
| Ortho-Clinical Diagnostics Inc., Term Loan B, 4.75% 20213,5,6 | 949 | 935 |
| Pfizer Inc. 7.20% 2039 | 450 | 656 |
| Pfizer Inc. 3.40% 2024 | 2,085 | 2,174 |
| Pfizer Inc. 4.40% 2044 | 2,355 | 2,573 |
| Roche Holdings, Inc. 2.25% 20194 | 12,435 | 12,528 |
| Roche Holdings, Inc. 6.00% 20194 | 12,118 | 13,995 |
| Roche Holdings, Inc. 2.875% 20214 | 10,750 | 10,901 |
| Roche Holdings, Inc. 3.35% 20244 | 3,740 | 3,873 |
| Roche Holdings, Inc. 4.00% 20444 | 200 | 211 |
| Tenet Healthcare Corp., First Lien, 6.25% 2018 | 500 | 544 |
| Tenet Healthcare Corp., First Lien, 6.00% 2020 | 1,340 | 1,442 |
| Tenet Healthcare Corp., First Lien, 4.50% 2021 | 625 | 629 |
| Thermo Fisher Scientific Inc. 1.30% 2017 | 310 | 308 |
| Thermo Fisher Scientific Inc. 2.40% 2019 | 150 | 150 |
| Thermo Fisher Scientific Inc. 3.30% 2022 | 1,180 | 1,184 |
| Thermo Fisher Scientific Inc. 4.15% 2024 | 1,750 | 1,849 |
| Thermo Fisher Scientific Inc. 5.30% 2044 | 750 | 865 |
| UnitedHealth Group Inc. 1.40% 2017 | 3,020 | 3,019 |
| UnitedHealth Group Inc. 2.875% 2023 | 10,540 | 10,491 |
| VPI Escrow Corp. 6.75% 20184 | 3,000 | 3,199 |
| VPI Escrow Corp. 6.375% 20204 | 2,435 | 2,554 |
| VWR Funding, Inc. 7.25% 2017 | 2,500 | 2,622 |
| WellPoint, Inc. 2.30% 2018 | 7,440 | 7,487 |
| WellPoint, Inc. 2.25% 2019 | 1,250 | 1,239 |
| WellPoint, Inc. 3.50% 2024 | 1,000 | 1,009 |
| 368,096 | ||
| Utilities 3.50% | ||
| AES Corp. 8.00% 2020 | 2,000 | 2,295 |
| AES Corp. 7.375% 2021 | 975 | 1,107 |
| American Electric Power Co. 1.65% 2017 | 2,870 | 2,873 |
| American Electric Power Co. 2.95% 2022 | 2,000 | 1,965 |
| Berkshire Hathaway Energy Co. 3.50% 20254 | 4,095 | 4,130 |
| Berkshire Hathaway Energy Co. 4.50% 20454 | 13,830 | 14,532 |
| Boston Gas Co. 4.487% 20424 | 470 | 508 |
| Calpine Corp. 5.375% 2023 | 2,500 | 2,528 |
| Calpine Corp. 7.875% 20234 | 937 | 1,038 |
| CEZ, a s 4.25% 20224 | 5,285 | 5,642 |
| Cleveland Electric Illuminating Co. 8.875% 2018 | 7,475 | 9,233 |
| CMS Energy Corp. 8.75% 2019 | 6,984 | 8,752 |
| CMS Energy Corp. 5.05% 2022 | 16,788 | 18,850 |
| CMS Energy Corp. 3.875% 2024 | 3,595 | 3,740 |
| Bonds, notes & other debt instruments Corporate bonds & notes (continued) Utilities (continued) | Principal amount (000) | Value (000) |
| CMS Energy Corp. 4.875% 2044 | $2,915 | $3,202 |
| Comision Federal de Electricidad 4.875% 20244 | 600 | 629 |
| Consumers Energy Co., First Mortgage Bonds, Series P, 5.50% 2016 | 5,645 | 6,061 |
| Dominion Gas Holdings LLC 2.50% 2019 | 2,835 | 2,845 |
| Dominion Gas Holdings LLC 3.60 2024 | 9,176 | 9,354 |
| Dominion Gas Holdings LLC 4.60 2044 | 6,500 | 6,837 |
| Duke Energy Corp. 3.95% 2023 | 2,520 | 2,677 |
| Duke Energy Corp. 3.75% 2024 | 2,995 | 3,122 |
| Dynegy Finance Inc. 6.75% 20194 | 380 | 387 |
| Dynegy Finance Inc. 7.375% 20224 | 1,125 | 1,146 |
| Dynegy Finance Inc. 7.625% 20244 | 1,430 | 1,460 |
| E.ON International Finance BV 5.80% 20184 | 5,000 | 5,581 |
| EDP Finance BV 4.125% 20204 | 1,000 | 1,007 |
| Electricité de France SA 2.15% 20194 | 145 | 145 |
| Electricité de France SA 4.60% 20204 | 1,191 | 1,313 |
| Enel Società per Azioni 8.75% 20733,4 | 1,000 | 1,166 |
| Eskom Holdings SOC Ltd. 6.75% 20234 | 1,400 | 1,456 |
| Iberdrola Finance Ireland 5.00% 20194 | 2,575 | 2,844 |
| MidAmerican Energy Co. 3.50% 2024 | 520 | 539 |
| MidAmerican Energy Holdings Co. 5.75% 2018 | 7,740 | 8,680 |
| MidAmerican Energy Holdings Co. 3.75% 2023 | 15,890 | 16,598 |
| Midwest Generation, LLC, Series B, 8.56% 20165,8,9 | 324 | 327 |
| National Grid PLC 6.30% 2016 | 2,815 | 3,041 |
| National Rural Utilities Cooperative Finance Corp. 10.375% 2018 | 13,750 | 17,927 |
| National Rural Utilities Cooperative Finance Corp. 3.40% 2023 | 1,800 | 1,865 |
| Nevada Power Co., General and Refunding Mortgage Notes, Series V, 7.125% 2019 | 5,500 | 6,568 |
| Niagara Mohawk Power Corp. 3.508% 20244 | 7,875 | 8,127 |
| Niagara Mohawk Power Corp. 4.278% 20344 | 1,000 | 1,062 |
| NV Energy, Inc 6.25% 2020 | 10,219 | 12,021 |
| Pacific Gas and Electric Co. 2.45% 2022 | 7,500 | 7,229 |
| Pacific Gas and Electric Co. 3.25% 2023 | 5,815 | 5,837 |
| Pacific Gas and Electric Co. 3.85% 2023 | 1,195 | 1,246 |
| Pacific Gas and Electric Co. 3.40% 2024 | 4,445 | 4,507 |
| Pacific Gas and Electric Co. 4.75% 2044 | 1,000 | 1,104 |
| Pacific Gas and Electric Co. 4.30% 2045 | 1,670 | 1,721 |
| PG&E Corp. 2.40% 2019 | 3,810 | 3,820 |
| Progress Energy, Inc. 7.05% 2019 | 3,180 | 3,772 |
| Progress Energy, Inc. 7.75% 2031 | 1,920 | 2,788 |
| PSEG Power LLC 2.75% 2016 | 3,400 | 3,487 |
| Public Service Co. of Colorado 5.80% 2018 | 7,860 | 8,940 |
| Public Service Co. of Colorado 3.20% 2020 | 5,000 | 5,209 |
| Public Service Electric and Gas Co., Series E, 5.30% 2018 | 2,460 | 2,735 |
| Public Service Electric and Gas Co. 2.00% 2019 | 500 | 499 |
| Puget Sound Energy, Inc., First Lien, 6.50% 2020 | 5,896 | 6,938 |
| Puget Sound Energy, Inc., First Lien, 6.00% 2021 | 11,161 | 13,075 |
| Puget Sound Energy, Inc., First Lien, 5.625% 2022 | 9,057 | 10,496 |
| Southern Co. 2.15% 2019 | 10,675 | 10,618 |
| Tampa Electric Co. 2.60% 2022 | 5,250 | 5,146 |
| Tampa Electric Co. 4.10% 2042 | 3,240 | 3,326 |
| Tampa Electric Co. 4.35% 2044 | 625 | 669 |
| Teco Finance, Inc. 4.00% 2016 | 80 | 83 |
| Teco Finance, Inc. 5.15% 2020 | 4,026 | 4,501 |
| TXU, Term Loan, 4.65% 20173,5,6,9 | 3,749 | 2,427 |
| Virginia Electric and Power Co. 1.20% 2018 | 5,400 | 5,337 |
| Bonds, notes & other debt instruments Corporate bonds & notes (continued) Utilities (continued) | Principal amount (000) | Value (000) |
| Virginia Electric and Power Co. 2.95% 2022 | $3,090 | $3,126 |
| Virginia Electric and Power Co. 4.45% 2044 | 8,295 | 9,099 |
| Xcel Energy Inc. 4.70% 2020 | 1,800 | 2,000 |
| 334,915 | ||
| Consumer discretionary 3.28% | ||
| Amazon.com, Inc. 2.60% 2019 | 750 | 758 |
| Amazon.com, Inc. 3.30% 2021 | 500 | 508 |
| Amazon.com, Inc. 3.80% 2024 | 1,680 | 1,725 |
| Amazon.com, Inc. 4.80% 2034 | 425 | 446 |
| Amazon.com, Inc. 4.95% 2044 | 1,010 | 1,048 |
| AOL Time Warner Inc. 7.625% 2031 | 1,750 | 2,446 |
| Bed Bath & Beyond Inc. 5.165% 2044 | 2,500 | 2,614 |
| Boyd Gaming Corp. 9.125% 2018 | 3,600 | 3,708 |
| Burger King Corp. 6.00% 20224 | 2,075 | 2,137 |
| CBS Corp. 2.30% 2019 | 1,000 | 989 |
| CBS Corp. 4.90% 2044 | 300 | 306 |
| Cedar Fair, LP 5.375% 20244 | 400 | 398 |
| Cequel Communications Holdings I, LLC and Cequel Capital Corp. 6.375% 20204 | 2,725 | 2,834 |
| Charter Communications Operating, LLC and Charter Communications Operating Capital Corp. 5.50% 2022 | 3,450 | 3,510 |
| Cinemark USA, Inc. 5.125% 2022 | 1,050 | 1,032 |
| Clear Channel Worldwide Holdings, Inc. 7.625% 2020 | 700 | 740 |
| Comcast Corp. 5.85% 2015 | 4,525 | 4,734 |
| Comcast Corp. 6.30% 2017 | 1,880 | 2,131 |
| Comcast Corp. 5.15% 2020 | 2,500 | 2,835 |
| Comcast Corp. 4.20% 2034 | 580 | 609 |
| Comcast Corp. 4.75% 2044 | 3,175 | 3,553 |
| Cox Communications, Inc. 2.95% 20234 | 7,750 | 7,446 |
| Cumulus Media Inc., Term Loan B, 4.25% 20203,5,6 | 1,697 | 1,645 |
| DaimlerChrysler North America Holding Corp. 1.25% 20164 | 7,000 | 7,022 |
| DaimlerChrysler North America Holding Corp. 1.45% 20164 | 2,940 | 2,954 |
| DaimlerChrysler North America Holding Corp. 2.625% 20164 | 8,000 | 8,201 |
| DaimlerChrysler North America Holding Corp. 1.10% 20183,4 | 7,500 | 7,602 |
| DaimlerChrysler North America Holding Corp. 2.875% 20214 | 21,000 | 21,218 |
| DaimlerChrysler North America Holding Corp. 3.25% 20244 | 1,180 | 1,191 |
| Delta 2 (Formula One), Term Loan B, 4.75% 20213,5,6 | 875 | 856 |
| Delta 2 (Formula One), Term Loan B, 7.75% 20223,5,6 | 475 | 464 |
| Dollar General Corp. 4.125% 2017 | 622 | 642 |
| Dollar General Corp. 1.875% 2018 | 1,211 | 1,171 |
| Ford Motor Credit Co. 2.375% 2018 | 3,290 | 3,311 |
| Ford Motor Credit Co. 2.375% 2019 | 24,900 | 24,751 |
| Ford Motor Credit Co. 2.597% 2019 | 12,525 | 12,472 |
| Ford Motor Credit Co. 3.664% 2024 | 500 | 502 |
| Gannett Co., Inc. 5.125% 2019 | 1,130 | 1,161 |
| Gannett Co., Inc. 4.875% 20214 | 290 | 289 |
| Gannett Co., Inc. 6.375% 2023 | 340 | 362 |
| General Motors Co. 4.00% 2025 | 1,030 | 1,035 |
| General Motors Co. 5.00% 2035 | 15,385 | 16,071 |
| General Motors Co. 5.20% 2045 | 425 | 449 |
| General Motors Financial Co. 3.25% 2018 | 675 | 678 |
| General Motors Financial Co. 6.75% 2018 | 300 | 340 |
| General Motors Financial Co. 4.375% 2021 | 2,400 | 2,508 |
| Grupo Televisa, SAB 7.25% 2043 | MXN6,080 | 355 |
| Hilton Worldwide, Term Loan B, 3.50% 20203,5,6 | $1,990 | 1,970 |
| Bonds, notes & other debt instruments Corporate bonds & notes (continued) Consumer discretionary (continued) | Principal amount (000) | Value (000) |
| Home Depot, Inc. 4.40% 2021 | $7,500 | $8,355 |
| Limited Brands, Inc. 7.00% 2020 | 1,192 | 1,359 |
| Limited Brands, Inc. 6.625% 2021 | 2,724 | 3,078 |
| Mediacom Broadband LLC and Mediacom Broadband Corp. 6.375% 2023 | 2,000 | 2,060 |
| Mediacom LLC and Mediacom Capital Corp. 7.25% 2022 | 975 | 1,046 |
| MGM Resorts International 7.50% 2016 | 1,875 | 1,983 |
| MGM Resorts International 6.75% 2020 | 875 | 921 |
| MGM Resorts International 7.75% 2022 | 2,000 | 2,220 |
| Michaels Stores, Inc. 5.875% 20204 | 2,050 | 2,081 |
| Mohegan Tribal Gaming Authority 11.00% 20183,4,7 | 3,300 | 3,234 |
| NBC Universal Enterprise, Inc. 5.25% (undated)4 | 2,375 | 2,476 |
| NBCUniversal Media, LLC 5.15% 2020 | 10,000 | 11,361 |
| NBCUniversal Media, LLC 2.875% 2023 | 2,500 | 2,502 |
| NCL Corp. Ltd. 5.25% 20194 | 725 | 734 |
| Needle Merger Sub Corp. 8.125% 20194 | 3,500 | 3,272 |
| Neiman Marcus Group LTD Inc. 8.00% 20214 | 950 | 1,009 |
| Neiman Marcus Group LTD Inc. 8.75% 20213,4,7 | 1,160 | 1,235 |
| Neiman Marcus, Term Loan B, 4.25% 20203,5,6 | 4,950 | 4,856 |
| News America Inc. 4.50% 2021 | 7,930 | 8,692 |
| News America Inc. 4.00% 2023 | 1,100 | 1,170 |
| News America Inc. 6.15% 2037 | 1,000 | 1,257 |
| PETCO Animal Supplies, Inc. 9.25% 20184 | 5,000 | 5,250 |
| Pinnacle Entertainment, Inc. 6.375% 2021 | 1,025 | 1,061 |
| Playa Resorts Holding BV 8.00% 20204 | 1,725 | 1,729 |
| Playa Resorts Holding BV, Term Loan B, 4.00% 20193,5,6 | 766 | 755 |
| RCI Banque 3.50% 20184 | 8,280 | 8,579 |
| Sally Holdings LLC and Sally Capital Inc. 6.875% 2019 | 1,200 | 1,281 |
| Schaeffler Holding Finance BV 6.25% 20194,7 | 2,500 | 2,587 |
| Seminole Tribe of Florida 7.804% 20204,5 | 750 | 799 |
| Six Flags Entertainment Corp. 5.25% 20214 | 2,500 | 2,512 |
| Stackpole Intl. 7.75% 20214 | 2,815 | 2,829 |
| Target Corp. 6.00% 2018 | 3,000 | 3,383 |
| Thomson Reuters Corp. 1.30% 2017 | 285 | 284 |
| Thomson Reuters Corp. 1.65% 2017 | 5,445 | 5,416 |
| Thomson Reuters Corp. 4.30% 2023 | 240 | 256 |
| Thomson Reuters Corp. 5.65% 2043 | 635 | 737 |
| Time Inc. 5.75% 20224 | 1,125 | 1,091 |
| Time Inc., Term Loan B, 4.25% 20213,5,6 | 846 | 839 |
| Time Warner Inc. 2.10% 2019 | 330 | 325 |
| Time Warner Inc. 4.05% 2023 | 450 | 473 |
| Time Warner Inc. 3.55% 2024 | 300 | 299 |
| Time Warner Inc. 6.20% 2040 | 5,450 | 6,658 |
| Toyota Motor Credit Corp. 2.125% 2019 | 1,000 | 1,004 |
| Toys "R" Us-Delaware, Inc., Term Loan B2, 5.25% 20183,5,6 | 1,107 | 827 |
| Univision Communications Inc., Term Loan D, 4.00% 20203,5,6 | 1,992 | 1,952 |
| Viacom Inc. 2.75% 2019 | 2,515 | 2,523 |
| Viacom Inc. 4.25% 2023 | 1,950 | 2,014 |
| Viacom Inc. 4.85% 2034 | 6,455 | 6,627 |
| Viacom Inc. 5.85% 2043 | 5,150 | 5,748 |
| Viacom Inc. 5.25% 2044 | 1,105 | 1,173 |
| Volkswagen Group of America Finance, LLC 2.45% 20194 | 520 | 524 |
| Volkswagen International Finance NV 4.00% 20204 | 4,200 | 4,531 |
| Walt Disney Co. 5.50% 2019 | 5,000 | 5,712 |
| Bonds, notes & other debt instruments Corporate bonds & notes (continued) Consumer discretionary (continued) | Principal amount (000) | Value (000) |
| Weather Company, Term Loan, 7.00% 20203,5,6 | $500 | $477 |
| Wynn Macau, Ltd. 5.25% 20214 | 3,100 | 2,929 |
| 313,812 | ||
| Consumer staples 2.90% | ||
| Altria Group, Inc. 2.625% 2020 | 435 | 437 |
| Altria Group, Inc. 2.85% 2022 | 5,650 | 5,499 |
| Altria Group, Inc. 4.00% 2024 | 150 | 157 |
| Altria Group, Inc. 9.95% 2038 | 3,200 | 5,491 |
| Altria Group, Inc. 10.20% 2039 | 3,100 | 5,414 |
| Altria Group, Inc. 4.50% 2043 | 3,000 | 3,033 |
| Altria Group, Inc. 5.375% 2044 | 6,100 | 6,971 |
| Anheuser-Busch InBev NV 3.625% 2015 | 2,525 | 2,548 |
| Anheuser-Busch InBev NV 4.125% 2015 | 10,000 | 10,009 |
| British American Tobacco International Finance PLC 9.50% 20184 | 14,137 | 17,810 |
| C&S Group Enterprises LLC 5.375% 20224 | 1,950 | 1,940 |
| Coca-Cola Co. 1.50% 2015 | 8,110 | 8,192 |
| Coca-Cola Co. 3.15% 2020 | 6,285 | 6,579 |
| ConAgra Foods, Inc. 1.30% 2016 | 6,725 | 6,727 |
| ConAgra Foods, Inc. 1.90% 2018 | 7,175 | 7,133 |
| ConAgra Foods, Inc. 3.20% 2023 | 11,295 | 11,083 |
| ConAgra Foods, Inc. 4.65% 2043 | 6,254 | 6,553 |
| Constellation Brands, Inc. 3.875% 2019 | 2,100 | 2,121 |
| Constellation Brands, Inc. 4.25% 2023 | 400 | 398 |
| CVS Caremark Corp. 2.25% 2018 | 500 | 505 |
| CVS Caremark Corp. 2.25% 2019 | 1,060 | 1,057 |
| CVS Caremark Corp. 5.30% 2043 | 3,395 | 4,075 |
| General Mills, Inc. 1.40% 2017 | 430 | 429 |
| General Mills, Inc. 2.20% 2019 | 310 | 308 |
| Imperial Tobacco Finance PLC 2.05% 20184 | 4,252 | 4,231 |
| Imperial Tobacco Finance PLC 3.50% 20234 | 2,835 | 2,790 |
| Ingles Markets, Inc. 5.75% 2023 | 1,575 | 1,585 |
| Kraft Foods Inc. 1.625% 2015 | 3,880 | 3,897 |
| Kraft Foods Inc. 2.25% 2017 | 3,485 | 3,545 |
| Kraft Foods Inc. 5.00% 2042 | 370 | 409 |
| Kroger Co. 3.90% 2015 | 7,500 | 7,663 |
| Kroger Co. 2.95% 2021 | 1,495 | 1,485 |
| Kroger Co. 5.00% 2042 | 250 | 273 |
| Kroger Co. 5.15% 2043 | 3,300 | 3,772 |
| Mondelez International, Inc. 4.00% 2024 | 555 | 582 |
| PepsiCo, Inc. 2.50% 2016 | 5,000 | 5,111 |
| Pernod Ricard SA 4.25% 20224 | 1,875 | 1,985 |
| Pernod Ricard SA 4.45% 20224 | 22,870 | 24,523 |
| Philip Morris International Inc. 1.875% 2019 | 17,375 | 17,286 |
| Philip Morris International Inc. 3.25% 2024 | 4,750 | 4,770 |
| Philip Morris International Inc. 4.875% 2043 | 800 | 896 |
| Philip Morris International Inc. 4.25% 2044 | 9,075 | 9,267 |
| Reynolds American Inc. 3.25% 2022 | 4,500 | 4,391 |
| Reynolds American Inc. 4.85% 2023 | 6,430 | 6,933 |
| Reynolds American Inc. 6.15% 2043 | 4,855 | 5,651 |
| SABMiller Holdings Inc. 2.45% 20174 | 7,410 | 7,564 |
| SABMiller Holdings Inc. 2.20% 20184 | 785 | 788 |
| SABMiller Holdings Inc. 3.75% 20224 | 3,800 | 3,972 |
| Smithfield Foods, Inc. 5.25% 20184 | 1,000 | 1,020 |
| Bonds, notes & other debt instruments Corporate bonds & notes (continued) Consumer staples (continued) | Principal amount (000) | Value (000) |
| Stater Bros. Holdings Inc., Term Loan B, 4.75% 20213,5,6 | $499 | $494 |
| Tyson Foods, Inc. 2.65% 2019 | 600 | 606 |
| Tyson Foods, Inc. 3.95% 2024 | 1,050 | 1,088 |
| Tyson Foods, Inc. 5.15% 2044 | 6,680 | 7,533 |
| Wal-Mart Stores, Inc. 5.80% 2018 | 7,395 | 8,365 |
| WM. Wrigley Jr. Co 2.40% 20184 | 500 | 504 |
| WM. Wrigley Jr. Co 3.375% 20204 | 19,230 | 19,681 |
| WM. Wrigley Jr. Co. 2.90% 20194 | 500 | 507 |
| 277,636 | ||
| Industrials 1.88% | ||
| AAF Holdings LLC 12.75% 20193,4,7 | 625 | 609 |
| AECOM Technology Corp. 5.75% 20224 | 1,125 | 1,153 |
| AerCap Holdings NV 2.75% 20174 | 150 | 147 |
| Altegrity, Inc. 9.50% 20194 | 2,000 | 1,905 |
| Atlas Copco AB 5.60% 20174 | 2,340 | 2,553 |
| B/E Aerospace, Inc., Term Loan B, 4.00% 20213,5,6 | 1,360 | 1,360 |
| BNSF Funding Trust I 6.613% 20553 | 1,680 | 1,900 |
| Burlington Northern Santa Fe LLC 5.75% 2018 | 1,505 | 1,688 |
| Burlington Northern Santa Fe LLC 4.70% 2019 | 3,740 | 4,139 |
| Canadian National Railway Co. 5.55% 2018 | 5,000 | 5,621 |
| Canadian National Railway Co. 2.85% 2021 | 5,000 | 5,124 |
| CEVA Group PLC 7.00% 20214 | 775 | 752 |
| CEVA Group PLC, LOC, 6.50% 20213,5,6 | 853 | 802 |
| CEVA Group PLC, Term Loan B, 6.50% 20213,5,6 | 1,232 | 1,158 |
| CEVA Group PLC, Term Loan, 6.50% 20213,5,6 | 893 | 839 |
| CEVA Group PLC, Term Loan, 6.50% 20213,5,6 | 154 | 145 |
| Continental Airlines, Inc., Series 1998-1, Class B, 6.748% 20185 | 57 | 61 |
| Continental Airlines, Inc., Series 1997-4B, Class B, 6.90% 20185 | 97 | 101 |
| Continental Airlines, Inc., Series 1998-1, Class A, 6.648% 20195 | 681 | 715 |
| Continental Airlines, Inc., Series 1997-4, Class A, 6.90% 20195 | 1,661 | 1,747 |
| Continental Airlines, Inc., Series 1999-1, Class A, 6.545% 20205 | 535 | 592 |
| Continental Airlines, Inc., Series 1999-2, Class B, 7.566% 20215 | 286 | 299 |
| Continental Airlines, Inc., Series 2001-1, Class A-1, 6.703% 20225 | 469 | 506 |
| Continental Airlines, Inc., Series 2000-2, Class A-1, 7.707% 20225 | 1,837 | 2,053 |
| Continental Airlines, Inc., Series 2000-1, Class A-1, 8.048% 20225 | 941 | 1,068 |
| CSX Corp. 6.25% 2015 | 1,667 | 1,690 |
| CSX Corp. 3.40% 2024 | 3,395 | 3,446 |
| DAE Aviation Holdings, Inc. and Standard Aero Ltd., Term Loan B-1, 5.00% 20183,5,6 | 1,548 | 1,544 |
| DAE Aviation Holdings, Inc. and Standard Aero Ltd., Term Loan B-2, 5.00% 20183,5,6 | 650 | 648 |
| Esterline Technologies Corp. 7.00% 2020 | 2,475 | 2,611 |
| Euramax International, Inc. 9.50% 2016 | 1,775 | 1,660 |
| European Aeronautic Defence and Space Company 2.70% 20234 | 7,500 | 7,376 |
| Far East Capital Limited SA 8.00% 20184 | 540 | 224 |
| Far East Capital Limited SA 8.75% 20204 | 1,085 | 450 |
| Gardner Denver, Inc. Term Loan B, 4.25% 20203,5,6 | 4,431 | 4,165 |
| Gates Global LLC 6.00% 20224 | 1,050 | 1,011 |
| Gates Global LLC, Term Loan B, 4.25% 20213,5,6 | 1,197 | 1,167 |
| General Electric Capital Corp. 1.50% 2016 | 5,212 | 5,269 |
| General Electric Capital Corp. 2.30% 2017 | 5,000 | 5,124 |
| General Electric Capital Corp. 3.10% 2023 | 12,460 | 12,629 |
| General Electric Co. 2.70% 2022 | 5,000 | 5,011 |
| General Electric Co. 4.50% 2044 | 250 | 276 |
| Hawker Beechcraft Acquisition Co., LLC, LOC, 0.008% 20153,5,6,8 | 108 | 103 |
| Bonds, notes & other debt instruments Corporate bonds & notes (continued) Industrials (continued) | Principal amount (000) | Value (000) |
| HD Supply, Inc. 5.25% 20214 | $825 | $842 |
| KLX Inc. 5.875% 20224 | 800 | 810 |
| LMI Aerospace Inc. 7.375% 20194 | 1,450 | 1,421 |
| Nielsen Finance LLC and Nielsen Finance Co. 5.50% 20214 | 925 | 948 |
| Nielsen Finance LLC and Nielsen Finance Co. 5.00% 20224 | 4,075 | 4,116 |
| Norfolk Southern Corp. 5.75% 2016 | 5,270 | 5,525 |
| Norfolk Southern Corp. 3.00% 2022 | 9,860 | 9,916 |
| Norfolk Southern Corp. 3.95% 2042 | 5,000 | 4,925 |
| Parker-Hannifin Corp. 4.45% 2044 | 250 | 271 |
| R.R. Donnelley & Sons Co. 6.50% 2023 | 625 | 644 |
| Republic Services, Inc. 5.00% 2020 | 5,000 | 5,534 |
| Silver II Borrower S.C.A./Silver II U.S. Holdings, LLC 7.75% 20204 | 1,750 | 1,663 |
| TransDigm Inc. 5.50% 2020 | 2,175 | 2,137 |
| United Air Lines, 1991 Equipment Trust Certificates, Series A, 10.11% 20065,8,9 | 230 | — |
| United Technologies Corp. 1.80% 2017 | 2,340 | 2,372 |
| United Technologies Corp. 4.50% 2042 | 9,280 | 10,145 |
| US Investigations Services, Inc. 13.00% 20204,7 | 867 | 386 |
| US Investigations Services, Inc. 14.00% 20204,5,7 | 628 | 279 |
| US Investigations Services, Inc. 15.00% 20214,7 | 1,515 | 453 |
| Volvo Treasury AB 5.95% 20154 | 34,000 | 34,398 |
| Watco Companies 6.375% 20234 | 1,505 | 1,497 |
| 179,723 | ||
| Telecommunication services 1.59% | ||
| Altice Finco SA, First Lien, 7.75% 20224 | 1,000 | 1,004 |
| AT&T Inc. 1.40% 2017 | 3,615 | 3,582 |
| AT&T Inc. 4.80% 2044 | 1,410 | 1,442 |
| Clearwire Communications and Clearwire Finance, Inc. 14.75% 20164 | 1,575 | 1,898 |
| Deutsche Telekom International Finance BV 3.125% 20164 | 5,495 | 5,635 |
| Deutsche Telekom International Finance BV 6.00% 2019 | 1,415 | 1,643 |
| Deutsche Telekom International Finance BV 9.25% 2032 | 5,878 | 9,526 |
| Digicel Group Ltd. 8.25% 20204 | 1,800 | 1,755 |
| Digicel Group Ltd. 6.00% 20214 | 950 | 891 |
| Frontier Communications Corp. 8.125% 2018 | 1,100 | 1,240 |
| Frontier Communications Corp. 6.25% 2021 | 300 | 302 |
| Frontier Communications Corp. 9.25% 2021 | 2,100 | 2,433 |
| Frontier Communications Corp. 8.75% 2022 | 425 | 477 |
| Frontier Communications Corp. 7.625% 2024 | 2,500 | 2,587 |
| Intelsat Jackson Holding Co. 6.625% 2022 | 2,500 | 2,581 |
| MetroPCS Wireless, Inc. 6.25% 2021 | 2,750 | 2,825 |
| MetroPCS Wireless, Inc. 6.625% 2023 | 3,275 | 3,370 |
| NII Capital Corp. 7.875% 20194,9 | 1,000 | 725 |
| NII Capital Corp. 8.875% 20199 | 475 | 169 |
| NII Capital Corp. 11.375% 20194,9 | 1,700 | 1,233 |
| NII Capital Corp. 7.625% 20219 | 2,325 | 442 |
| Numericable Group SA, First Lien, 4.875% 20194 | 600 | 597 |
| Numericable Group SA, First Lien, 6.00% 20224 | 4,400 | 4,430 |
| Numericable Group SA, First Lien, 6.25% 20244 | 1,900 | 1,917 |
| Orange SA 2.75% 2019 | 3,570 | 3,640 |
| Orange SA 5.50% 2044 | 1,980 | 2,331 |
| Sprint Nextel Corp. 9.00% 20184 | 2,000 | 2,280 |
| Sprint Nextel Corp. 7.00% 2020 | 3,000 | 3,015 |
| Sprint Nextel Corp. 7.25% 2021 | 1,925 | 1,918 |
| Sprint Nextel Corp. 11.50% 2021 | 925 | 1,117 |
| Bonds, notes & other debt instruments Corporate bonds & notes (continued) Telecommunication services (continued) | Principal amount (000) | Value (000) |
| Sprint Nextel Corp. 7.875% 2023 | $2,500 | $2,480 |
| Sprint Nextel Corp. 7.125% 2024 | 3,000 | 2,805 |
| Telecom Italia Capital SA 6.999% 2018 | 3,910 | 4,360 |
| T-Mobile US, Inc. 6.542% 2020 | 5,000 | 5,181 |
| Verizon Communications Inc. 2.625% 20204 | 1,315 | 1,302 |
| Verizon Communications Inc. 5.15% 2023 | 21,007 | 23,213 |
| Verizon Communications Inc. 3.50% 2024 | 5,275 | 5,193 |
| Verizon Communications Inc. 4.15% 2024 | 7,000 | 7,252 |
| Verizon Communications Inc. 4.40% 2034 | 10,584 | 10,555 |
| Verizon Communications Inc. 4.862% 20464 | 16,987 | 17,492 |
| Wind Acquisition SA 4.75% 20204 | 2,850 | 2,672 |
| Wind Acquisition SA 7.375% 20214 | 2,500 | 2,366 |
| 151,876 | ||
| Materials 1.01% | ||
| ArcelorMittal 6.00% 20213 | 665 | 694 |
| ArcelorMittal 6.75% 20223 | 1,775 | 1,904 |
| ArcelorMittal 7.25% 20413 | 2,500 | 2,538 |
| Dow Chemical Co. 3.00% 2022 | 5,000 | 4,894 |
| E.I. du Pont de Nemours and Co. 2.75% 2016 | 3,920 | 4,016 |
| E.I. du Pont de Nemours and Co. 2.80% 2023 | 7,500 | 7,391 |
| Ecolab Inc. 3.00% 2016 | 5,455 | 5,637 |
| First Quantum Minerals Ltd. 6.75% 20204 | 3,917 | 3,564 |
| First Quantum Minerals Ltd. 7.00% 20214 | 3,917 | 3,545 |
| FMG Resources 6.00% 20174 | 2,650 | 2,542 |
| FMG Resources 6.875% 20184,5 | 133 | 121 |
| FMG Resources 8.25% 20194 | 1,550 | 1,416 |
| Georgia Gulf Corp. 4.875% 2023 | 1,600 | 1,516 |
| Georgia-Pacific Corp. 3.60% 20254 | 2,000 | 2,013 |
| Glencore Xstrata LLC 1.594% 20193,4 | 3,000 | 3,018 |
| Holcim Ltd. 5.15% 20234 | 1,760 | 1,965 |
| JMC Steel Group Inc. 8.25% 20184 | 3,950 | 3,767 |
| LSB Industries, Inc. 7.75% 2019 | 1,200 | 1,254 |
| Monsanto Co. 2.75% 2021 | 3,200 | 3,195 |
| Monsanto Co. 3.375% 2024 | 600 | 611 |
| Monsanto Co. 4.40% 2044 | 900 | 938 |
| Monsanto Co. 4.70% 2064 | 10,750 | 11,327 |
| Owens-Illinois, Inc. 5.00% 20224 | 560 | 572 |
| Owens-Illinois, Inc. 5.375% 20254 | 420 | 425 |
| PQ Corp. 8.75% 20184 | 2,560 | 2,659 |
| Rayonier Advanced Materials Inc. 5.50% 20244 | 1,960 | 1,619 |
| Reynolds Group Inc. 5.75% 2020 | 4,235 | 4,362 |
| Rio Tinto Finance (USA) Ltd. 9.00% 2019 | 3,780 | 4,787 |
| Ryerson Inc. 9.00% 2017 | 1,925 | 1,983 |
| Ryerson Inc. 11.25% 2018 | 401 | 429 |
| Solenis, Term Loan, 7.75% 20223,5,6 | 2,425 | 2,370 |
| Teck Resources Ltd. 3.15% 2017 | 2,880 | 2,938 |
| Tembec Industries Inc. 9.00% 20194 | 705 | 695 |
| U.S. Coatings Acquisition Inc. (Flash Dutch 2 BV) 7.375% 20214 | 1,285 | 1,369 |
| U.S. Coatings Acquisition Inc. (Flash Dutch 2 BV), Term Loan B, 3.75% 20203,5,6 | 1,375 | 1,343 |
| Walter Energy, Inc. 9.875% 2020 | 625 | 131 |
| Xstrata Canada Financial Corp. 4.95% 20214 | 2,650 | 2,800 |
| 96,348 |
| Bonds, notes & other debt instruments Corporate bonds & notes (continued) Information technology 0.61% | Principal amount (000) | Value (000) |
| Alcatel-Lucent USA Inc. 4.625% 20174 | $3,375 | $3,426 |
| Alcatel-Lucent USA Inc. 6.75% 20204 | 2,580 | 2,736 |
| Alcatel-Lucent USA Inc. 8.875% 20204 | 1,925 | 2,103 |
| First Data Corp. 6.75% 20204 | 666 | 712 |
| First Data Corp. 8.25% 20214 | 600 | 645 |
| First Data Corp. 11.75% 2021 | 975 | 1,124 |
| First Data Corp. 12.625% 2021 | 3,500 | 4,165 |
| First Data Corp. 8.75% 20223,4,7 | 4,641 | 5,012 |
| Freescale Semiconductor, Inc. 5.00% 20214 | 1,500 | 1,507 |
| International Business Machines Corp. 5.70% 2017 | 7,500 | 8,364 |
| International Business Machines Corp. 4.00% 2042 | 300 | 300 |
| Lawson Software, Inc. 9.375% 2019 | 3,000 | 3,221 |
| Oracle Corp. 1.20% 2017 | 3,600 | 3,589 |
| Oracle Corp. 2.80% 2021 | 6,500 | 6,590 |
| Oracle Corp. 4.30% 2034 | 600 | 644 |
| Serena Software, Inc. Term Loan B 7.50% 20203,5,6 | 2,125 | 2,120 |
| SRA International, Inc. 11.00% 2019 | 1,625 | 1,735 |
| SRA International, Inc., Term Loan B, 6.50% 20183,5,6 | 2,668 | 2,672 |
| SunGard Data Systems Inc. 7.375% 2018 | 1,067 | 1,111 |
| SunGard Data Systems Inc. 7.625% 2020 | 3,825 | 4,074 |
| TIBCO Software, Inc. 11.375% 20214 | 1,475 | 1,431 |
| Xerox Corp. 2.95% 2017 | 1,670 | 1,717 |
| 58,998 | ||
| Total corporate bonds & notes | 2,859,138 | |
| Mortgage-backed obligations 21.46% Federal agency mortgage-backed obligations 17.61% | ||
| Fannie Mae 5.50% 20235 | 1,848 | 2,019 |
| Fannie Mae 4.00% 20245 | 579 | 616 |
| Fannie Mae 4.50% 20255 | 857 | 925 |
| Fannie Mae, Series 2001-4, Class GA, 9.437% 20253,5 | 16 | 18 |
| Fannie Mae 6.00% 20265 | 634 | 718 |
| Fannie Mae 5.50% 20275 | 404 | 452 |
| Fannie Mae 6.00% 20275 | 1,035 | 1,173 |
| Fannie Mae 1.765% 20373,5 | 1,832 | 1,926 |
| Fannie Mae 6.00% 20375 | 2,923 | 3,311 |
| Fannie Mae 6.00% 20375 | 416 | 468 |
| Fannie Mae 5.50% 20385 | 6,896 | 7,706 |
| Fannie Mae 5.50% 20385 | 717 | 805 |
| Fannie Mae 2.191% 20393,5 | 2,042 | 2,178 |
| Fannie Mae 2.25% 20393,5 | 606 | 648 |
| Fannie Mae 2.28% 20393,5 | 202 | 217 |
| Fannie Mae 3.446% 20393,5 | 1,914 | 2,044 |
| Fannie Mae 2.335% 20393,5 | 225 | 241 |
| Fannie Mae 3.058% 20393,5 | 855 | 917 |
| Fannie Mae 3.636% 20393,5 | 161 | 172 |
| Fannie Mae 3.47% 20393,5 | 241 | 258 |
| Fannie Mae 4.38% 20403,5 | 1,177 | 1,248 |
| Fannie Mae 5.00% 20405 | 1,234 | 1,381 |
| Fannie Mae 2.924% 20413,5 | 2,034 | 2,116 |
| Fannie Mae 3.547% 20413,5 | 4,973 | 5,218 |
| Fannie Mae 4.00% 20415 | 14,587 | 15,762 |
| Fannie Mae 5.00% 20415 | 9,287 | 10,312 |
| Bonds, notes & other debt instruments Mortgage-backed obligations (continued) Federal agency mortgage-backed obligations (continued) | Principal amount (000) | Value (000) |
| Fannie Mae 5.00% 20415 | $7,018 | $7,792 |
| Fannie Mae 5.00% 20415 | 3,987 | 4,487 |
| Fannie Mae 5.00% 20415 | 3,035 | 3,416 |
| Fannie Mae 5.00% 20415 | 1,995 | 2,247 |
| Fannie Mae 5.00% 20415 | 1,248 | 1,405 |
| Fannie Mae, Series 2001-T10, Class A-1, 7.00% 20415 | 45 | 52 |
| Fannie Mae, Series 2001-50, Class BA, 7.00% 20415 | 33 | 37 |
| Fannie Mae, Series 2002-W3, Class A-5, 7.50% 20415 | 52 | 61 |
| Fannie Mae 4.00% 20425 | 10,265 | 11,091 |
| Fannie Mae 4.00% 20425 | 1,575 | 1,702 |
| Fannie Mae, Series 2002-W1, Class 2A, 6.532% 20423,5 | 67 | 78 |
| Fannie Mae 4.00% 20435 | 12,606 | 13,624 |
| Fannie Mae 4.00% 20445 | 9,244 | 9,972 |
| Fannie Mae 4.00% 20445 | 4,351 | 4,703 |
| Fannie Mae 3.50% 20455,10 | 135,000 | 140,670 |
| Fannie Mae 3.50% 20455,10 | 75,000 | 77,945 |
| Fannie Mae 4.00% 20455,10 | 215,000 | 228,814 |
| Fannie Mae 4.50% 20455,10 | 446,334 | 483,618 |
| Fannie Mae 4.50% 20455,10 | 377,845 | 410,116 |
| Freddie Mac 5.50% 20335 | 368 | 414 |
| Freddie Mac, Series 3061, Class PN, 5.50% 20355 | 321 | 355 |
| Freddie Mac, Series 3146, Class PO, principal only, 0% 20365 | 709 | 667 |
| Freddie Mac, Series 3156, Class PO, principal only, 0% 20365 | 624 | 585 |
| Freddie Mac, Series 3257, Class PA, 5.50% 20365 | 1,942 | 2,163 |
| Freddie Mac, Series 3318, Class JT, 5.50% 20375 | 900 | 992 |
| Freddie Mac 5.00% 20385 | 69 | 77 |
| Freddie Mac 5.50% 20385 | 9,058 | 10,139 |
| Freddie Mac 5.50% 20385 | 411 | 459 |
| Freddie Mac 5.50% 20385 | 313 | 350 |
| Freddie Mac 2.874% 20393,5 | 742 | 793 |
| Freddie Mac 3.347% 20393,5 | 313 | 335 |
| Freddie Mac 5.50% 20395 | 596 | 667 |
| Freddie Mac 4.50% 20405 | 1,214 | 1,318 |
| Freddie Mac 5.50% 20405 | 2,123 | 2,374 |
| Freddie Mac 4.50% 20415 | 4,333 | 4,726 |
| Freddie Mac 4.50% 20415 | 1,271 | 1,379 |
| Freddie Mac 5.00% 20415 | 9,500 | 10,678 |
| Freddie Mac 5.50% 20415 | 3,104 | 3,472 |
| Freddie Mac 4.00% 20435 | 7,807 | 8,410 |
| Freddie Mac 4.00% 20435 | 3,843 | 4,141 |
| Freddie Mac 4.00% 20435 | 3,086 | 3,332 |
| Freddie Mac 4.00% 20445 | 3,193 | 3,447 |
| Government National Mortgage Assn. 4.50% 20405 | 2,836 | 3,119 |
| Government National Mortgage Assn. 4.00% 20445 | 131,804 | 141,621 |
| Government National Mortgage Assn. 4.00% 20445 | 13,890 | 14,919 |
| 1,685,611 | ||
| Commercial mortgage-backed securities 3.75% | ||
| Banc of America Commercial Mortgage Inc., Series 2006-3, Class A-4, 5.889% 20443,5 | 3,033 | 3,195 |
| Banc of America Commercial Mortgage Inc., Series 2006-1, Class A1A, 5.378% 20453,5 | 6,562 | 6,779 |
| Banc of America Commercial Mortgage Inc., Series 2007-3, Class A-4, 5.563% 20493,5 | 2,405 | 2,583 |
| Banc of America Commercial Mortgage Inc., Series 2007-4, Class A-M, 5.821% 20513,5 | 3,020 | 3,289 |
| Banc of America Commercial Mortgage Inc., Series 2008-1, Class A-4, 6.427% 20513,5 | 3,438 | 3,800 |
| Bear Stearns Commercial Mortgage Securities Trust, Series 2007-PW17, Class A-4, 5.694% 20503,5 | 1,755 | 1,906 |
| Bonds, notes & other debt instruments Mortgage-backed obligations (continued) Commercial mortgage-backed securities (continued) | Principal amount (000) | Value (000) |
| Bear Stearns Commercial Mortgage Securities Trust, Series 2007-PW18, Class A-M, 6.084% 20503,5 | $2,380 | $2,621 |
| Citigroup Commercial Mortgage Trust, Series 2006-C4, Class A-3, 5.974% 20493,5 | 2,190 | 2,290 |
| Citigroup Commercial Mortgage Trust, Series 2008-C7, Class A-M, 6.133% 20493,5 | 5,000 | 5,480 |
| Citigroup-Deutsche Bank Commercial Mortgage Trust, Series 2005-CD1, Class A-4, 5.40% 20443,5 | 11,825 | 12,021 |
| Citigroup-Deutsche Bank Commercial Mortgage Trust, Series 2006-CD3, Class A-5, 5.617% 20485 | 13,152 | 13,822 |
| Commercial Mortgage Trust, Series 2006-C8, Class A1A, 5.292% 20465 | 3,371 | 3,603 |
| CS First Boston Mortgage Securities Corp., Series 2006-C5, Class A-3, 5.311% 20395 | 17,722 | 18,688 |
| CS First Boston Mortgage Securities Corp., Series 2007-C3, Class A-1-A-1, 5.893% 20393,5 | 5,222 | 5,610 |
| CS First Boston Mortgage Securities Corp., Series 2007-C2, Class A-M, 5.615% 20493,5 | 10,650 | 11,419 |
| DBUBS Mortgage Trust, Series 2011-LC1A, Class A1, 3.742% 20464,5 | 17,578 | 18,004 |
| GE Commercial Mortgage Corp., Series 2005-C4, Class A-3A, 5.312% 20453,5 | 1,492 | 1,494 |
| Greenwich Capital Commercial Funding Corp., Series 2006-GG7, Class A-4, 5.819% 20383,5 | 10,916 | 11,418 |
| Greenwich Capital Commercial Funding Corp., Series 2006-GG7, Class A-1-A, 5.819% 20383,5 | 2,291 | 2,405 |
| Greenwich Capital Commercial Funding Corp., Series 2007-GG9, Class A-4, 5.444% 20395 | 18,925 | 20,204 |
| Greenwich Capital Commercial Funding Corp., Series 2007-GG11, Class A-M, 5.867% 20493,5 | 12,610 | 13,690 |
| Hilton USA Trust, Series 2013-HLF-AFX, 2.662% 20304,5 | 7,820 | 7,837 |
| Hilton USA Trust, Series 2013-HLF-BFX, 3.367% 20304,5 | 2,000 | 2,027 |
| Hilton USA Trust, Series 2013-HLF, CFX, 3.714% 20304,5 | 2,935 | 2,969 |
| Hilton USA Trust, Series 2013-HLF, DFX, 4.407% 20304,5 | 600 | 614 |
| Hilton USA Trust, Series 2013-HLT, EFX, 5.609% 20303,4,5 | 400 | 411 |
| J.P. Morgan Chase Commercial Mortgage Securities Corp., Series 2005-CIBC12, Class A-3B, 5.467% 20373,5 | 421 | 421 |
| J.P. Morgan Chase Commercial Mortgage Securities Corp., Series 2006-CB15, Class A-4, 5.814% 20433,5 | 3,375 | 3,541 |
| J.P. Morgan Chase Commercial Mortgage Securities Corp., Series 2006-CB-16, Class A1A, 5.546% 20455 | 3,001 | 3,180 |
| J.P. Morgan Chase Commercial Mortgage Securities Corp., Series 2006-LDP7, Class A-4, 5.863% 20453,5 | 10,315 | 10,777 |
| J.P. Morgan Chase Commercial Mortgage Securities Corp., Series 2011-C3A, Class A-2, 3.673% 20464,5 | 11,208 | 11,539 |
| J.P. Morgan Chase Commercial Mortgage Securities Corp., Series 2007-CB18, Class A-1-A, 5.092% 20473,5 | 1,492 | 1,594 |
| J.P. Morgan Chase Commercial Mortgage Securities Corp., Series 2007-CB19, Class A-4, 5.703% 20493,5 | 26,820 | 28,815 |
| J.P. Morgan Chase Commercial Mortgage Securities Corp., Series 2007-C1, Class A-4, 5.716% 20515 | 5,906 | 6,362 |
| J.P. Morgan Chase Commercial Mortgage Securities Corp., Series 2007-LD12, Class A-1-A, 5.85% 20513,5 | 3,064 | 3,345 |
| J.P. Morgan Chase Commercial Mortgage Securities Trust, Series 2006-LDP8, Class A-4, 5.399% 20455 | 9,238 | 9,728 |
| L.A. Arena Funding, LLC, Series 1, Class A, 7.656% 20264,5 | 1,187 | 1,330 |
| LB Commercial Mortgage Trust, Series 2007-C3, Class A-1-A, multifamily 5.858% 20443,5 | 3,619 | 3,946 |
| LB-UBS Commercial Mortgage Trust, Series 2007-C2, Class A-3, 5.43% 20405 | 2,452 | 2,627 |
| LB-UBS Commercial Mortgage Trust, Series 2007-C2, Class A-M, 5.493% 20403,5 | 2,200 | 2,323 |
| LB-UBS Commercial Mortgage Trust, Series 2007-C6, Class A-M, 6.114% 20403,5 | 13,725 | 14,904 |
| LB-UBS Commercial Mortgage Trust, Series 2007-C7, Class A-M, 6.163% 20453,5 | 2,110 | 2,351 |
| Merrill Lynch Mortgage Trust, Series 2007-C1, Class A-4, 6.028% 20503,5 | 1,955 | 2,103 |
| ML-CFC Commercial Mortgage Trust, Series 2006-4, Class A-3, 5.172% 20495 | 21,310 | 22,569 |
| ML-CFC Commercial Mortgage Trust, Series 2007-8, Class A-3, 6.079% 20493,5 | 6,195 | 6,765 |
| Morgan Stanley Capital I Trust, Series 2014-CPT, Class A, 3.35% 20214,5 | 1,380 | 1,430 |
| Morgan Stanley Capital I Trust, Series 2006-IQ12, Class A1A, 5.319% 20435 | 5,051 | 5,370 |
| Morgan Stanley Capital I Trust, Series 2007-IQ13, Class A-M, 5.406% 20445 | 5,025 | 5,356 |
| Morgan Stanley Capital I Trust, Series 2007-IQ15, Class A-4, 6.105% 20493,5 | 10,511 | 11,443 |
| Wachovia Bank Commercial Mortgage Trust, Series 2006-C25, Class A1A, 5.707% 20433,5 | 2,591 | 2,702 |
| Wachovia Bank Commercial Mortgage Trust, Series 2007-C31, Class A-5, 5.50% 20475 | 2,700 | 2,913 |
| Wachovia Bank Commercial Mortgage Trust, Series 2007-C31, Class A-M, 5.591% 20473,5 | 8,810 | 9,417 |
| Wachovia Bank Commercial Mortgage Trust, Series 2007-C32, Class A-3, 5.933% 20493,5 | 3,500 | 3,763 |
| 358,793 |
| Bonds, notes & other debt instruments Mortgage-backed obligations (continued) Other mortgage-backed securities 0.10% | Principal amount (000) | Value (000) |
| Northern Rock PLC 5.625% 20174,5 | $1,868 | $2,052 |
| Royal Bank of Canada 3.125% 20154,5 | 6,840 | 6,891 |
| 8,943 | ||
| Total mortgage-backed obligations | 2,053,347 | |
| Bonds & notes of governments & government agencies outside the U.S. 3.51% | ||
| Argentina (Republic of) 7.00% 2017 | 2,300 | 2,190 |
| Bermuda Government 5.603% 20204 | 4,710 | 5,181 |
| Bermuda Government 5.603% 2020 | 2,735 | 3,009 |
| Bermuda Government 4.138% 20234 | 1,000 | 1,015 |
| Bermuda Government 4.854% 20244 | 6,215 | 6,495 |
| Croatian Government 6.375% 2021 | 1,500 | 1,646 |
| Croatian Government 5.50% 20234 | 1,625 | 1,692 |
| Greek Government 2.00%/3.00% 202311 | €420 | 324 |
| Greek Government 2.00%/3.00% 202411 | 420 | 321 |
| Greek Government 2.00%/3.00% 202511 | 420 | 304 |
| Greek Government 2.00%/3.00% 202611 | 420 | 291 |
| Greek Government 2.00%/3.00% 202711 | 420 | 283 |
| Greek Government 2.00%/3.00% 202811 | 420 | 274 |
| Greek Government 2.00%/3.00% 202911 | 420 | 273 |
| Greek Government 2.00%/3.00% 203011 | 420 | 269 |
| Greek Government 2.00%/3.00% 203111 | 420 | 267 |
| Greek Government 2.00%/3.00% 203211 | 420 | 263 |
| Greek Government 2.00%/3.00% 203311 | 420 | 263 |
| Greek Government 2.00%/3.00% 203411 | 420 | 260 |
| Greek Government 2.00%/3.00% 203511 | 420 | 259 |
| Greek Government 2.00%/3.00% 203611 | 420 | 257 |
| Greek Government 2.00%/3.00% 203711 | 420 | 254 |
| Greek Government 2.00%/3.00% 203811 | 420 | 256 |
| Greek Government 2.00%/3.00% 203911 | 420 | 256 |
| Greek Government 2.00%/3.00% 204011 | 420 | 256 |
| Greek Government 2.00%/3.00% 204111 | 420 | 257 |
| Greek Government 2.00%/3.00% 204211 | 420 | 258 |
| Hungarian Government 4.75% 2015 | $750 | 752 |
| Hungarian Government 4.125% 2018 | 2,310 | 2,408 |
| Hungarian Government 6.25% 2020 | 2,425 | 2,737 |
| India (Republic of) 7.28% 2019 | INR1,270,000 | 19,737 |
| Indonesia (Republic of), Series 71, 9.00% 2029 | IDR27,000,000 | 2,343 |
| Indonesia (Republic of) 8.375% 2034 | 189,000,000 | 15,456 |
| Irish Government 3.90% 2023 | €5,000 | 7,386 |
| Italian Government 4.50% 2024 | 7,000 | 10,428 |
| Portuguese Government 5.125% 20244 | $800 | 840 |
| Portuguese Government 5.65% 2024 | €22,180 | 33,302 |
| Province of Manitoba 3.05% 2024 | $5,050 | 5,225 |
| Province of Ontario 3.20% 2024 | 9,000 | 9,389 |
| Slovenia (Republic of) 5.50% 2022 | 18,585 | 20,676 |
| Slovenia (Republic of) 5.85% 2023 | 15,150 | 17,205 |
| Slovenia (Republic of) 5.85% 20234 | 6,650 | 7,552 |
| Slovenia (Republic of) 5.25% 2024 | 3,820 | 4,216 |
| South Africa (Republic of), Series R-213, 7.00% 2031 | ZAR150,000 | 11,334 |
| Spanish Government 4.00% 20184 | $7,000 | 7,375 |
| Spanish Government 5.40% 2023 | €10,000 | 15,837 |
| Spanish Government 5.15% 2028 | 14,000 | 22,719 |
| Bonds, notes & other debt instruments Bonds & notes of governments & government agencies outside the U.S. (continued) | Principal amount (000) | Value (000) |
| Spanish Government 5.15% 2044 | €26,750 | $46,332 |
| United Mexican States Government 3.50% 20172 | MXN1,272 | 9,206 |
| United Mexican States Government, Series M20, 10.00% 2024 | 225,000 | 20,013 |
| United Mexican States Government Global 3.60% 2025 | $7,500 | 7,511 |
| United Mexican States Government Global, Series A, 6.05% 2040 | 3,990 | 4,900 |
| United Mexican States Government Global 5.55% 2045 | 4,030 | 4,695 |
| 336,247 | ||
| Federal agency bonds & notes 1.89% | ||
| CoBank, ACB 7.875% 20184 | 2,285 | 2,667 |
| CoBank, ACB 0.834% 20223,4 | 14,990 | 14,053 |
| Fannie Mae 1.25% 2016 | 10,000 | 10,105 |
| Fannie Mae 5.375% 2016 | 2,080 | 2,232 |
| Fannie Mae 2.625% 2024 | 12,910 | 13,091 |
| Freddie Mac 0.50% 2015 | 20,000 | 20,027 |
| Freddie Mac 1.25% 2019 | 44,500 | 43,623 |
| Freddie Mac, Series K716, Class A2, multifamily 3.132% 20215 | 10,875 | 11,375 |
| Freddie Mac, Series K020, Class A2, multifamily 2.373% 20225 | 7,500 | 7,462 |
| Freddie Mac, Series K036, Class A2, multifamily 3.527% 20233,5 | 6,650 | 7,108 |
| Tennessee Valley Authority 5.88% 2036 | 3,750 | 5,153 |
| Tennessee Valley Authority 5.25% 2039 | 15,315 | 19,563 |
| United States Agency for International Development, Jordan (Kingdom of) 1.945% 2019 | 19,000 | 19,254 |
| United States Agency for International Development, Republic of Egypt 4.45% 2015 | 5,000 | 5,136 |
| 180,849 | ||
| Asset-backed obligations 0.31% | ||
| American Express Credit Account Master Trust, Series 2014-4, Class A, 1.43% 20205 | 15,895 | 15,873 |
| CenterPoint Energy Transition Bond Co. III, LLC, Series 2008, Class A-2, 5.234% 20235 | 1,500 | 1,678 |
| Ford Credit Auto Owner Trust, Series 2014-1-A, 2.26% 20254,5 | 2,830 | 2,848 |
| Ford Credit Auto Owner Trust, Series 2014-2-A, 2.31% 20264,5 | 1,000 | 1,005 |
| Hertz Vehicle Financing LLC, Rental Car Asset-backed Notes, Series 2013-1A, Class A-2, 1.83% 20194,5 | 8,000 | 7,893 |
| Home Equity Mortgage Trust, Series 2006-6, Class 2A-1, 0.355% 20373,5 | 1,474 | 319 |
| 29,616 | ||
| Municipals 0.90% | ||
| State of California, Various Purpose G.O. Bonds, 7.30% 20395 | 1,890 | 2,780 |
| State of California, Various Purpose G.O. Bonds, 7.35% 2039 | 3,260 | 4,824 |
| State of California, Various Purpose G.O. Bonds, 7.50% 2034 | 2,200 | 3,302 |
| State of California, Various Purpose G.O. Bonds, 7.55% 2039 | 865 | 1,338 |
| State of California, Various Purpose G.O. Bonds, 7.60% 2040 | 22,040 | 35,015 |
| State of California, Various Purpose G.O. Bonds, 7.625% 2040 | 2,900 | 4,461 |
| State of Florida, Hurricane Catastrophe Fund Fin. Corp., Rev. Bonds, Series 2013-A, 2.995% 2020 | 15,000 | 15,263 |
| State of New Jersey, G.O. Ref. Bonds, Series H, Assured Guaranty Municipal insured, 5.25% 2015 | 8,000 | 8,204 |
| State of Texas, Board of Regents of the University of Texas System, Rev. Fncg. System Bonds (Build America Bonds - Direct Payment), Series 2010-D, 3.076% 2016 | 10,450 | 10,830 |
| 86,017 | ||
| Total bonds, notes & other debt instruments (cost: $9,020,873,000) | 9,162,819 | |
| Convertible bonds 0.01% Financials 0.01% | ||
| Bank of Ireland 10.00% convertible notes 2016 | €1,000 | 1,311 |
| Total convertible bonds (cost: $1,333,000) | 1,311 |
| Preferred securities 0.03% Financials 0.02% | Shares | Value (000) |
| Citigroup Inc., Series K, depositary shares | 62,395 | $1,658 |
| Miscellaneous 0.01% | ||
| Other preferred securities in initial period of acquisition | 628 | |
| Total preferred securities (cost: $2,180,000) | 2,286 | |
| Common stocks 0.00% Consumer discretionary 0.00% | ||
| Adelphia Recovery Trust, Series ACC-112 | 2,409,545 | 6 |
| Adelphia Recovery Trust, Series ACC-6B8,12 | 500,000 | — |
| Revel AC, Inc.8,12,13 | 19,511 | — |
| Total common stocks (cost: $2,376,000) | 6 | |
| Short-term securities 17.20% | Principal amount (000) | |
| Abbott Laboratories 0.09%–0.12% due 1/7/2015–3/4/20154 | $101,700 | 101,687 |
| Apple Inc. 0.13% due 1/13/20154 | 25,000 | 24,999 |
| Caterpillar Financial Services Corp. 0.12% due 2/19/2015 | 33,000 | 32,993 |
| Chariot Funding, LLC 0.20% due 4/27/20154 | 26,200 | 26,183 |
| Chevron Corp. 0.10%–0.12% due 1/12/2015–2/24/20154 | 39,900 | 39,895 |
| Coca-Cola Co. 0.13%–0.20% due 2/6/2015–5/8/20154 | 135,000 | 134,943 |
| Emerson Electric Co. 0.09%–0.10% due 1/7/2015–3/2/20154 | 52,200 | 52,193 |
| Fannie Mae 0.07%–0.12% due 1/14/2015–6/1/2015 | 143,800 | 143,776 |
| Federal Farm Credit Banks 0.11%–0.13% due 6/11/2015–7/17/2015 | 42,300 | 42,271 |
| Federal Home Loan Bank 0.08%–0.17% due 1/14/2015–11/4/2015 | 351,900 | 351,764 |
| Freddie Mac 0.06%–0.15% due 1/20/2015–7/23/2015 | 518,000 | 517,872 |
| Microsoft Corp. 0.10% due 2/2/20154 | 62,900 | 62,896 |
| Private Export Funding Corp. 0.15% due 1/7/20154 | 44,800 | 44,799 |
| Procter & Gamble Co. 0.15% due 1/21/20154 | 22,500 | 22,499 |
| U.S. Treasury Bills 0.13% due 6/25/2015 | 20,500 | 20,493 |
| Walt Disney Co. 0.08% due 1/26/20154 | 27,000 | 26,998 |
| Total short-term securities (cost: $1,646,155,000) | 1,646,261 | |
| Total investment securities 112.98% (cost: $10,672,917,000) | 10,812,683 | |
| Other assets less liabilities (12.98)% | (1,242,063) | |
| Net assets 100.00% | $9,570,620 |
| 1 | A portion of this security was pledged as collateral. The total value of pledged collateral was $133,853,000, which represented 1.40% of the net assets of the fund. |
| 2 | Index-linked bond whose principal amount moves with a government price index. |
| 3 | Coupon rate may change periodically. |
| 4 | Acquired in a transaction exempt from registration under Rule 144A or Section 4(2) of the Securities Act of 1933. May be resold in the U.S. in transactions exempt from registration, normally to qualified institutional buyers. The total value of all such securities was $1,331,157,000, which represented 13.91% of the net assets of the fund. |
| 5 | Principal payments may be made periodically. Therefore, the effective maturity date may be earlier than the stated maturity date. |
| 6 | Loan participations and assignments; may be subject to legal or contractual restrictions on resale. The total value of all such loans was $44,343,000, which represented .46% of the net assets of the fund. |
| 7 | Payment in kind; the issuer has the option of paying additional securities in lieu of cash. |
| 8 | Valued under fair value procedures adopted by authority of the board of trustees. The total value of all such securities, was $430,000, which represented less than ..01% of the net assets of the fund. |
| 9 | Scheduled interest and/or principal payment was not received. |
| 10 | A portion or all of the security purchased on a TBA basis. |
| 11 | Step bond; coupon rate will increase at a later date. |
| 12 | Security did not produce income during the last 12 months. |
| 13 | Acquired through a private placement transaction exempt from registration under the Securities Act of 1933. May be subject to legal or contractual restrictions on resale. Further details on these holdings appear below. |
| Private placement security | Acquisition dates | Cost (000) | Value (000) | Percent of net assets |
| Revel AC, Inc. | 12/7/2011–12/13/2011 | $2,194 | $— | .00% |
| Key to abbreviations and symbols |
| £ = British pounds |
| € = Euros |
| Fin. = Finance |
| Fncg. = Financing |
| G.O. = General Obligation |
| IDR = Indonesian rupiah |
| INR = Indian rupees |
| LOC = Letter of credit |
| MXN = Mexican pesos |
| Ref. = Refunding |
| Rev. = Revenue |
| TBA = To be announced |
| ZAR = South African rand |
| Bonds, notes & other debt instruments 97.08% Euros 22.61% | Principal amount (000) | Value (000) |
| Allianz SE, 4.75% (undated)1 | €1,500 | $2,025 |
| Anheuser-Busch InBev NV 8.625% 2017 | 750 | 1,062 |
| Assicurazioni Generali SPA 10.125% 2042 | 1,500 | 2,518 |
| Assicurazioni Generali SPA 7.75% 20421 | 1,300 | 1,971 |
| AT&T Inc. 6.125% 2015 | 1,100 | 1,350 |
| Austrian Government 4.00% 2016 | 550 | 713 |
| Aviva PLC 6.125% 20431 | 3,000 | 4,344 |
| Banco Bilbao Vizcaya Argentaria SA 3.50% 20241 | 7,400 | 9,266 |
| Barclays Bank PLC 4.00% 20192 | 2,450 | 3,477 |
| Barclays Bank PLC 6.00% 2021 | 5,325 | 7,915 |
| Barclays Bank PLC 6.625% 2022 | 1,070 | 1,674 |
| Belgium (Kingdom of), Series 69, 1.25% 2018 | 3,075 | 3,881 |
| Belgium (Kingdom of), Series 67, 3.00% 2019 | 6,380 | 8,765 |
| Belgium (Kingdom of), Series 68, 2.25% 2023 | 5,025 | 6,877 |
| Belgium (Kingdom of), Series 72, 2.60% 2024 | 4,205 | 5,908 |
| Belgium (Kingdom of), Series 71, 3.75% 2045 | 1,940 | 3,337 |
| BNP Paribas 2.875% 20261 | 3,500 | 4,379 |
| BPCE SA group 4.625% 2023 | 1,200 | 1,696 |
| CaixaBank, SA 5.00% 20231 | 9,000 | 11,691 |
| Canadian Government 3.50% 2020 | 2,500 | 3,535 |
| Daimler AG, Series 6, 4.125% 2017 | 300 | 392 |
| Deutsche Telekom International Finance BV 7.50% 2033 | 200 | 434 |
| European Investment Bank 4.75% 2017 | 2,370 | 3,249 |
| French Government O.A.T. Eurobond 1.00% 2018 | 6,750 | 8,466 |
| German Government 3.00% 2020 | 9,300 | 13,079 |
| German Government 1.50% 2024 | 3,130 | 4,130 |
| German Government 6.25% 2030 | 1,800 | 3,810 |
| German Government, Series 00, 5.50% 2031 | 1,000 | 2,009 |
| German Government, Series 8, 4.75% 2040 | 200 | 423 |
| German Government 2.50% 2044 | 3,100 | 4,771 |
| Greek Government 2.00%/3.00% 20233 | 735 | 568 |
| Greek Government 2.00%/3.00% 20243 | 735 | 562 |
| Greek Government 2.00%/3.00% 20253 | 735 | 531 |
| Greek Government 2.00%/3.00% 20263 | 735 | 508 |
| Greek Government 2.00%/3.00% 20273 | 740 | 498 |
| Greek Government 2.00%/3.00% 20283 | 730 | 477 |
| Greek Government 2.00%/3.00% 20293 | 860 | 559 |
| Greek Government 2.00%/3.00% 20303 | 860 | 551 |
| Greek Government 2.00%/3.00% 20313 | 860 | 546 |
| Greek Government 2.00%/3.00% 20323 | 860 | 539 |
| Greek Government 2.00%/3.00% 20333 | 860 | 538 |
| Greek Government 2.00%/3.00% 20343 | 860 | 532 |
| Greek Government 2.00%/3.00% 20353 | 860 | 530 |
| Greek Government 2.00%/3.00% 20363 | 960 | 587 |
| Greek Government 2.00%/3.00% 20373 | 960 | 581 |
| Greek Government 2.00%/3.00% 20383 | 960 | 585 |
| Bonds, notes & other debt instruments Euros (continued) | Principal amount (000) | Value (000) |
| Greek Government 2.00%/3.00% 20393 | €960 | $586 |
| Greek Government 2.00%/3.00% 20403 | 960 | 586 |
| Greek Government 2.00%/3.00% 20413 | 960 | 587 |
| Greek Government 2.00%/3.00% 20423 | 960 | 589 |
| HSBC Holdings PLC 3.375% 20241 | 300 | 386 |
| Hungarian Government 5.75% 2018 | 9,385 | 12,953 |
| Hungarian Government 6.00% 2019 | 6,550 | 9,275 |
| Hungarian Government 3.875% 2020 | 1,000 | 1,322 |
| Imperial Tobacco Finance PLC 8.375% 2016 | 200 | 264 |
| Imperial Tobacco Finance PLC 5.00% 2019 | 2,850 | 4,130 |
| Intesa Sanpaolo SpA 6.625% 2023 | 3,585 | 5,308 |
| Irish Government 4.50% 2020 | 15,595 | 22,748 |
| Irish Government 5.00% 2020 | 2,050 | 3,111 |
| Irish Government 3.90% 2023 | 32,790 | 48,437 |
| Irish Government 3.40% 2024 | 24,155 | 34,653 |
| Irish Government 2.40% 2030 | 1,750 | 2,282 |
| Italian Government 2.15% 2021 | 13,960 | 17,723 |
| Italian Government 4.50% 2024 | 4,900 | 7,299 |
| Lloyds Banking Group PLC 6.50% 2020 | 7,290 | 10,886 |
| Merrill Lynch & Co., Inc. 4.625% 2018 | 4,875 | 6,642 |
| Mondelez International, Inc. 2.375% 2021 | 670 | 874 |
| National Grid Transco PLC 5.00% 2018 | 250 | 350 |
| Netherlands Government Eurobond 2.25% 2022 | 1,800 | 2,476 |
| Netherlands Government Eurobond 2.00% 2024 | 6,275 | 8,521 |
| NN Group NV, 4.625% 2044 | 2,335 | 2,985 |
| NN Group NV, 4.50% (undated)1 | 3,720 | 4,498 |
| Novartis Finance SA, 4.25% 2016 | 750 | 962 |
| Orange SA 4.25% (undated) | 1,300 | 1,661 |
| Orange SA 5.00% (undated)1 | 1,450 | 1,868 |
| Portuguese Government 3.85% 2021 | 8,640 | 11,618 |
| Portuguese Government 5.65% 2024 | 35,165 | 52,797 |
| Rabobank Nederland 3.875% 2023 | 3,250 | 4,496 |
| RCI Banque 2.875% 2018 | 1,080 | 1,393 |
| Roche Holdings, Inc. 5.625% 2016 | 225 | 290 |
| Slovenia (Republic of) 4.375% 2019 | 375 | 516 |
| Slovenia (Republic of) 4.125% 2020 | 7,395 | 10,162 |
| Slovenia (Republic of) 4.625% 2024 | 6,350 | 9,370 |
| Spanish Government 1.40% 2020 | 16,420 | 20,383 |
| Spanish Government 5.85% 2022 | 21,085 | 33,643 |
| Spanish Government 5.40% 2023 | 11,025 | 17,460 |
| Spanish Government 2.75% 2024 | 19,320 | 25,796 |
| Spanish Government 5.15% 2028 | 8,700 | 14,118 |
| Spanish Government 5.15% 2044 | 17,165 | 29,731 |
| Svenska Handelsbanken AB 2.656% 20241 | 2,170 | 2,734 |
| 584,308 | ||
| British pounds 5.26% | ||
| Lloyds Banking Group PLC 7.625 % 2025 | £580 | 1,171 |
| RSA Insurance Group PLC 9.375% 20391 | 1,669 | 3,201 |
| United Kingdom 2.75% 2015 | 4,650 | 7,257 |
| United Kingdom 1.00% 2017 | 7,550 | 11,872 |
| United Kingdom 2.00% 2020 | 18,816 | 30,366 |
| United Kingdom 3.75% 2020 | 8,583 | 15,174 |
| United Kingdom 1.75% 2022 | 3,125 | 4,941 |
| United Kingdom 2.25% 2023 | 15,620 | 25,517 |
| Bonds, notes & other debt instruments British pounds (continued) | Principal amount (000) | Value (000) |
| United Kingdom 4.75% 2030 | £5,350 | $11,264 |
| United Kingdom 4.50% 2034 | 1,380 | 2,887 |
| United Kingdom 4.25% 2040 | 2,950 | 6,170 |
| United Kingdom 3.25% 2044 | 8,895 | 16,002 |
| 135,822 | ||
| Mexican pesos 3.16% | ||
| United Mexican States Government, Series M10, 8.00% 2015 | MXN36,000 | 2,548 |
| United Mexican States Government, Series M, 6.25% 2016 | 65,500 | 4,617 |
| United Mexican States Government, Series M10, 7.25% 2016 | 56,000 | 4,056 |
| United Mexican States Government, Series M, 5.00% 2017 | 120,000 | 8,340 |
| United Mexican States Government, Series M10, 7.75% 2017 | 45,000 | 3,339 |
| United Mexican States Government 4.00% 20194 | 36,940 | 2,738 |
| United Mexican States Government, Series M, 8.00% 2020 | 92,500 | 7,088 |
| United Mexican States Government, Series M, 6.50% 2021 | 40,000 | 2,861 |
| United Mexican States Government 2.00% 20224 | 81,797 | 5,460 |
| United Mexican States Government, Series M20, 10.00% 2024 | 247,500 | 22,014 |
| United Mexican States Government, Series M30, 10.00% 2036 | 95,000 | 9,040 |
| United Mexican States Government, Series M30, 8.50% 2038 | 57,000 | 4,796 |
| United Mexican States Government 4.00% 20404 | 36,940 | 2,823 |
| United Mexican States Government, Series M, 7.75% 2042 | 23,000 | 1,799 |
| 81,519 | ||
| Japanese yen 2.53% | ||
| Japanese Government, Series 336, 0.10% 2016 | ¥495,000 | 4,138 |
| Japanese Government, Series 315, 1.20% 2021 | 1,246,950 | 11,173 |
| Japanese Government, Series 323, 0.90% 2022 | 860,000 | 7,591 |
| Japanese Government, Series 116, 2.20% 2030 | 1,970,000 | 20,011 |
| Japanese Government, Series 136, 1.60% 2032 | 626,300 | 5,850 |
| Japanese Government, Series 145, 1.70% 2033 | 1,580,000 | 14,856 |
| Japanese Government, Series 36, 2.00% 2042 | 75,000 | 737 |
| Japanese Government, Series 37, 1.90% 2042 | 113,000 | 1,090 |
| 65,446 | ||
| Indian rupees 1.83% | ||
| India (Republic of) 7.28% 2019 | INR1,727,000 | 26,839 |
| India (Republic of) 8.83% 2023 | 1,230,000 | 20,524 |
| 47,363 | ||
| Polish zloty 1.78% | ||
| Polish Government, Series 1017, 5.25% 2017 | PLN39,872 | 12,281 |
| Polish Government, Series 1020, 5.25% 2020 | 12,500 | 4,109 |
| Polish Government, Series 1021, 5.75% 2021 | 31,280 | 10,739 |
| Polish Government, Series 0922, 5.75% 2022 | 34,600 | 12,115 |
| Polish Government, Series 102, 4.00% 2023 | 21,140 | 6,729 |
| 45,973 | ||
| Hungarian forints 1.57% | ||
| Hungarian Government, Series 19/A, 6.50% 2019 | HUF450,000 | 1,969 |
| Hungarian Government, Series 20A, 7.50% 2020 | 6,694,000 | 31,329 |
| Hungarian Government, Series 22A, 7.00% 2022 | 943,820 | 4,443 |
| Hungarian Government, Series 23A, 6.00% 2023 | 358,200 | 1,629 |
| Hungarian Government, Series 25B, 5.50% 2025 | 285,000 | 1,261 |
| 40,631 |
| Bonds, notes & other debt instruments Norwegian kroner 1.41% | Principal amount (000) | Value (000) |
| Norwegian Government 4.25% 2017 | NKr6,250 | $906 |
| Norwegian Government 4.50% 2019 | 32,560 | 5,030 |
| Norwegian Government 3.75% 2021 | 145,225 | 22,503 |
| Norwegian Government 3.00% 2024 | 53,300 | 8,059 |
| 36,498 | ||
| Colombian pesos 1.14% | ||
| Colombia (Republic of), Series B, 5.00% 2018 | COP17,595,500 | 7,213 |
| Colombia (Republic of), Series B, 10.00% 2024 | 27,232,100 | 13,689 |
| Colombia (Republic of), Series B, 6.00% 2028 | 23,104,200 | 8,484 |
| Colombia (Republic of) Global 9.85% 2027 | 130,000 | 69 |
| 29,455 | ||
| Canadian dollars 0.52% | ||
| Canada Housing Trust 3.35% 2020 | C$3,250 | 3,048 |
| Canadian Government 1.75% 2019 | 5,670 | 4,984 |
| Canadian Government 2.75% 2022 | 4,270 | 3,964 |
| Hydro One Inc. 5.49% 2040 | 750 | 832 |
| Rogers Communications Inc. 5.80% 2016 | 625 | 568 |
| 13,396 | ||
| Israeli shekels 0.50% | ||
| Israeli Government 4.25% 2023 | ILS43,490 | 12,913 |
| Swedish kronor 0.36% | ||
| Swedish Government, Series 105, 3.50% 2022 | SKr60,290 | 9,358 |
| Indonesian rupiah 0.34% | ||
| Indonesia (Republic of), Series 71, 9.00% 2029 | IDR26,500,000 | 2,300 |
| Indonesia (Republic of) 8.375% 2034 | 79,700,000 | 6,518 |
| 8,818 | ||
| Australian dollars 0.28% | ||
| European Investment Bank 6.125% 2017 | A$1,000 | 874 |
| Queensland Treasury Corp., Series 17, 6.00% 2017 | 500 | 448 |
| Queensland Treasury Corp., Series 24, 5.75% 2024 | 5,800 | 5,754 |
| 7,076 | ||
| Brazilian reais 0.27% | ||
| Brazil (Federal Republic of) 6.00% 20154 | BRL636 | 239 |
| Brazil (Federal Republic of) 10.00% 2017 | 11,500 | 4,107 |
| Brazil (Federal Republic of) 6.00% 20184 | 5,341 | 1,970 |
| Brazil (Federal Republic of) 6.00% 20204 | 1,526 | 563 |
| 6,879 | ||
| Russian rubles 0.22% | ||
| Russian Federation 6.20% 2018 | RUB94,600 | 1,230 |
| Russian Federation 7.50% 2018 | 333,960 | 4,467 |
| 5,697 | ||
| South African rand 0.18% | ||
| South Africa (Republic of), Series R-2023, 7.75% 2023 | ZAR54,250 | 4,672 |
| Bonds, notes & other debt instruments Malaysian ringgits 0.11% | Principal amount (000) | Value (000) |
| Malaysian Government, Series 0613, 3.889% 2020 | MYR10,000 | $2,843 |
| Turkish lira 0.09% | ||
| Turkey (Republic of) 8.80% 2023 | TRY2,510 | 1,140 |
| Turkey (Republic of) 2.80% 20234 | 2,436 | 1,126 |
| 2,266 | ||
| Philippine pesos 0.04% | ||
| Philippines (Republic of) 3.90% 2022 | PHP10,000 | 219 |
| Philippines (Republic of) 6.25% 2036 | 35,000 | 881 |
| 1,100 | ||
| U.S. dollars 52.88% | ||
| 21st Century Fox America, Inc. 3.70% 20245 | $345 | 356 |
| 21st Century Fox America, Inc. 4.75% 20445 | 430 | 472 |
| ABB Finance (USA) Inc. 2.875% 2022 | 510 | 513 |
| AbbVie Inc. 1.75% 2017 | 200 | 201 |
| AbbVie Inc. 2.90% 2022 | 1,790 | 1,765 |
| AbbVie Inc. 4.40% 2042 | 300 | 311 |
| ACE INA Holdings Inc. 2.60% 2015 | 365 | 371 |
| ACE INA Holdings Inc. 3.35% 2024 | 720 | 729 |
| ADT Corp. 4.125% 2019 | 625 | 620 |
| ADT Corp. 5.25% 2020 | 775 | 789 |
| AECOM Technology Corp. 5.75% 20225 | 575 | 589 |
| Alcatel-Lucent USA Inc. 4.625% 20175 | 700 | 710 |
| Alcatel-Lucent USA Inc. 8.875% 20205 | 900 | 983 |
| Alcatel-Lucent USA Inc. 6.75% 20205 | 950 | 1,007 |
| Alexandria Real Estate Equities, Inc. 2.75% 2020 | 430 | 426 |
| Alpha Natural Resources, Inc. 6.00% 2019 | 500 | 160 |
| Alpha Natural Resources, Inc. 7.50% 20205 | 625 | 395 |
| Alpha Natural Resources, Inc. 6.25% 2021 | 1,000 | 310 |
| Altegrity, Inc. 9.50% 20195 | 1,500 | 1,429 |
| Altria Group, Inc. 2.625% 2020 | 1,800 | 1,807 |
| Altria Group, Inc. 9.95% 2038 | 750 | 1,287 |
| Altria Group, Inc. 4.50% 2043 | 2,500 | 2,528 |
| Altria Group, Inc. 5.375% 2044 | 500 | 571 |
| American Campus Communities, Inc. 3.75% 2023 | 1,740 | 1,740 |
| American Campus Communities, Inc. 4.125% 2024 | 885 | 896 |
| American Electric Power Co. 1.65% 2017 | 815 | 816 |
| American Energy (Marcellus), Term Loan B, 5.25% 20201,2,6 | 575 | 509 |
| American Energy (Marcellus), Term Loan A, 8.50% 20211,2,6 | 625 | 536 |
| American Energy (Permian Basin) 7.125% 20205 | 625 | 466 |
| American Energy (Permian Basin) 7.375% 20215 | 375 | 278 |
| American Express Co. 1.55% 2018 | 1,875 | 1,859 |
| American International Group, Inc. 2.30% 2019 | 800 | 802 |
| American International Group, Inc. 3.375% 2020 | 1,500 | 1,560 |
| American International Group, Inc. 4.50% 2044 | 460 | 488 |
| American Tower Corp. 7.00% 2017 | 700 | 791 |
| Anadarko Petroleum Corp. 3.45% 2024 | 375 | 367 |
| Anheuser-Busch InBev NV 3.625% 2015 | 730 | 737 |
| Anheuser-Busch InBev NV 7.75% 2019 | 700 | 849 |
| Anheuser-Busch InBev NV 5.375% 2020 | 250 | 283 |
| ArcelorMittal 7.25% 20411 | 1,990 | 2,020 |
| Arch Coal, Inc. 7.00% 2019 | 1,125 | 343 |
| Bonds, notes & other debt instruments U.S. dollars (continued) | Principal amount (000) | Value (000) |
| Associated Materials, LLC and AMH New Finance, Inc. 9.125% 2017 | $1,450 | $1,203 |
| AT&T Inc. 1.40% 2017 | 300 | 297 |
| AvalonBay Communities, Inc. 3.625% 2020 | 2,900 | 3,020 |
| AXA SA 8.60% 2030 | 220 | 299 |
| Banc of America Commercial Mortgage Inc., Series 2006-3, Class A-4, 5.889% 20441,2 | 513 | 541 |
| Banc of America Commercial Mortgage Inc., Series 2006-1, Class A1A, 5.378% 20451,2 | 1,015 | 1,049 |
| Banc of America Commercial Mortgage Inc., Series 2007-3, Class A-4, 5.563% 20491,2 | 835 | 897 |
| Banc of America Commercial Mortgage Inc., Series 2007-4, Class A-M, 5.821% 20511,2 | 955 | 1,040 |
| Banc of America Commercial Mortgage Inc., Series 2008-1, Class A-4, 6.427% 20511,2 | 558 | 617 |
| Bank of America Corp. 2.60% 2019 | 462 | 466 |
| Bank of America Corp., Series L, 2.65% 2019 | 463 | 467 |
| Bank of America Corp. 4.00% 2024 | 1,190 | 1,240 |
| Bayer AG 2.375% 20195 | 300 | 302 |
| Bear Stearns Commercial Mortgage Securities Trust, Series 2007-PW17, Class A-4, 5.694% 20501,2 | 565 | 614 |
| Bear Stearns Commercial Mortgage Securities Trust, Series 2007-PW18, Class A-M, 6.084% 20501,2 | 690 | 760 |
| Becton, Dickinson and Co. 1.80% 2017 | 1,350 | 1,356 |
| Becton, Dickinson and Co. 2.675% 2019 | 710 | 720 |
| Becton, Dickinson and Co. 3.734% 2024 | 660 | 681 |
| Becton, Dickinson and Co. 4.685% 2044 | 145 | 157 |
| Berkshire Hathaway Energy Co. 3.50% 20255 | 375 | 378 |
| Berkshire Hathaway Inc. 2.00% 2018 | 2,000 | 2,024 |
| Bermuda Government 5.603% 20205 | 1,220 | 1,342 |
| Bermuda Government 4.138% 20235 | 300 | 305 |
| Bermuda Government 4.854% 20245 | 8,210 | 8,579 |
| Blue Racer Midstream LLC / Blue Racer Finance Corp. 6.125% 20225 | 550 | 532 |
| Bonanza Creek Energy, Inc. 6.75% 2021 | 150 | 133 |
| Boyd Gaming Corp. 9.125% 2018 | 700 | 721 |
| BP Capital Markets PLC 0.657% 20161 | 2,060 | 2,061 |
| BPCE SA group 5.70% 20235 | 6,045 | 6,511 |
| Brandywine Operating Partnership, LP 3.95% 2023 | 190 | 192 |
| British American Tobacco International Finance PLC 2.125% 20175 | 150 | 151 |
| British American Tobacco International Finance PLC 9.50% 20185 | 2,378 | 2,996 |
| Builders Firstsource 7.625% 20215 | 1,300 | 1,336 |
| Burlington Northern Santa Fe LLC 3.40% 2024 | 1,050 | 1,071 |
| Canadian Natural Resources Ltd. 5.70% 2017 | 100 | 108 |
| Celgene Corp 3.625% 2024 | 600 | 614 |
| Celgene Corp 4.625% 2044 | 610 | 635 |
| CEMEX Finance LLC 9.375% 20225 | 465 | 521 |
| Centene Corp. 4.75% 2022 | 2,000 | 2,007 |
| CenterPoint Energy Resources Corp. 4.50% 2021 | 580 | 637 |
| CenterPoint Energy Transition Bond Co. III, LLC, Series 2008, Class A-2, 5.234% 20232 | 400 | 448 |
| Cequel Communications Holdings I, LLC and Cequel Capital Corp. 6.375% 20205 | 2,725 | 2,834 |
| CEVA Group PLC 4.00% 20185 | 750 | 656 |
| CEVA Group PLC 7.00% 20215 | 1,175 | 1,140 |
| CEVA Group PLC, LOC, 6.50% 20211,2,6 | 325 | 306 |
| CEVA Group PLC, Term Loan B, 6.50% 20211,2,6 | 469 | 441 |
| CEVA Group PLC, Term Loan, 6.50% 20211,2,6 | 340 | 320 |
| CEVA Group PLC, Term Loan, 6.50% 20211,2,6 | 59 | 55 |
| CEZ, a s 4.25% 20225 | 1,340 | 1,431 |
| Charter Communications Operating, LLC and Charter Communications Operating Capital Corp. 5.50% 2022 | 925 | 941 |
| Chevron Corp. 1.718% 2018 | 250 | 251 |
| CIT Group Inc. 3.875% 2019 | 4,000 | 4,000 |
| Citigroup Commercial Mortgage Trust, Series 2014-CG19, Class A-1, 1.199% 20472 | 463 | 462 |
| Citigroup Commercial Mortgage Trust, Series 2006-C5, Class A-4, 5.431% 20492 | 1,500 | 1,589 |
| Citigroup Inc. 2.50% 2018 | 200 | 203 |
| Bonds, notes & other debt instruments U.S. dollars (continued) | Principal amount (000) | Value (000) |
| Citigroup Inc. 2.55% 2019 | $3,100 | $3,124 |
| Citigroup Inc. 2.50% 2019 | 2,250 | 2,253 |
| Citigroup Inc. 3.75% 2024 | 1,145 | 1,173 |
| Citigroup-Deutsche Bank Commercial Mortgage Trust, Series 2005-CD1, Class A-4, 5.40% 20441,2 | 1,076 | 1,094 |
| Citigroup-Deutsche Bank Commercial Mortgage Trust, Series 2006-CD3, Class A-5, 5.617% 20482 | 1,232 | 1,294 |
| CME Group Inc. 5.30% 2043 | 300 | 365 |
| CMS Energy Corp. 8.75% 2019 | 258 | 323 |
| CMS Energy Corp. 5.05% 2022 | 392 | 440 |
| CMS Energy Corp. 3.875% 2024 | 100 | 104 |
| CMS Energy Corp. 4.70% 2043 | 412 | 441 |
| CMS Energy Corp. 4.875% 2044 | 709 | 779 |
| CNA Financial Corp. 7.35% 2019 | 230 | 275 |
| Comcast Corp. 6.30% 2017 | 1,020 | 1,156 |
| Comcast Corp. 5.875% 2018 | 340 | 383 |
| Comcast Corp. 6.40% 2040 | 150 | 204 |
| Comcast Corp. 4.65% 2042 | 2,325 | 2,555 |
| Comcast Corp. 4.75% 2044 | 945 | 1,057 |
| Commercial Mortgage Trust, Series 2006-C8, Class A1A, 5.292% 20462 | 1,021 | 1,092 |
| Commercial Mortgage Trust, Series 2014-UBS2, Class A-1, 1.298% 20472 | 1,356 | 1,351 |
| Commercial Mortgage Trust, Series 2007-C9, Class A-1-A, 5.796% 20491,2 | 100 | 108 |
| Commonwealth Bank of Australia 0.75% 20162,5 | 1,650 | 1,651 |
| ConAgra Foods, Inc. 1.30% 2016 | 600 | 600 |
| ConAgra Foods, Inc. 3.20% 2023 | 869 | 853 |
| Consumers Energy Co. 3.375% 2023 | 345 | 357 |
| Continental Airlines, Inc., Series 1999-1, Class A, 6.545% 20202 | 26 | 28 |
| Continental Airlines, Inc., Series 2000-1, Class A-1, 8.048% 20222 | 118 | 134 |
| Continental Airlines, Inc., Series 2000-2, Class A-1, 7.707% 20222 | 51 | 57 |
| ConvaTec Finance International SA 8.25% 20191,5,7 | 2,200 | 2,234 |
| Cox Communications, Inc. 2.95% 20235 | 7,300 | 7,013 |
| Credit Suisse Group AG 1.375% 2017 | 1,850 | 1,846 |
| Credit Suisse Group AG 2.30% 2019 | 1,850 | 1,849 |
| Crescent Resources 10.25% 20175 | 225 | 242 |
| CS First Boston Mortgage Securities Corp., Series 2006-C4, Class A1A, 5.46% 20392 | 1,506 | 1,589 |
| CS First Boston Mortgage Securities Corp., Series 2006-C5, Class A-3, 5.311% 20392 | 1,387 | 1,463 |
| CS First Boston Mortgage Securities Corp., Series 2007-C5, Class A4, 5.695% 20401,2 | 1,000 | 1,080 |
| CS First Boston Mortgage Securities Corp., Series 2007-C2, Class A-M, 5.615% 20491,2 | 200 | 214 |
| Cumulus Media Holdings Inc. 7.75% 2019 | 1,180 | 1,196 |
| CVS Caremark Corp. 2.25% 2019 | 480 | 479 |
| DaimlerChrysler North America Holding Corp. 2.40% 20175 | 750 | 766 |
| DaimlerChrysler North America Holding Corp. 2.875% 20215 | 2,275 | 2,299 |
| DBUBS Mortgage Trust, Series 2011-LC1A, Class A1, 3.742% 20462,5 | 1,048 | 1,074 |
| DBUBS Mortgage Trust, Series 2011-LC1A, Class A3, 5.002% 20462,5 | 1,000 | 1,130 |
| DCT Industrial Trust Inc. 4.50% 2023 | 110 | 115 |
| Denbury Resources Inc. 4.625% 2023 | 225 | 196 |
| Deutsche Telekom International Finance BV 3.125% 20165 | 560 | 574 |
| Deutsche Telekom International Finance BV 9.25% 2032 | 2,980 | 4,829 |
| Developers Diversified Realty Corp. 7.50% 2017 | 750 | 841 |
| Developers Diversified Realty Corp. 4.75% 2018 | 940 | 1,005 |
| Devon Energy Corp. 3.25% 2022 | 1,010 | 994 |
| Diamond Offshore Drilling, Inc. 4.875% 2043 | 550 | 470 |
| Digicel Group Ltd. 8.25% 20205 | 2,500 | 2,437 |
| Digicel Group Ltd. 7.125% 20225 | 675 | 629 |
| DISH DBS Corp. 5.125% 2020 | 4,300 | 4,343 |
| DJO Finance LLC 9.75% 2017 | 890 | 894 |
| DJO Finance LLC 8.75% 2018 | 175 | 183 |
| Bonds, notes & other debt instruments U.S. dollars (continued) | Principal amount (000) | Value (000) |
| DJO Finance LLC 7.75% 2018 | $1,130 | $1,102 |
| DJO Finance LLC 9.875% 2018 | 560 | 571 |
| Dominion Gas Holdings LLC 2.50% 2019 | 410 | 411 |
| Dominion Gas Holdings LLC 3.60 2024 | 595 | 607 |
| Dominion Gas Holdings LLC 4.60 2044 | 1,000 | 1,052 |
| Dynacast International LLC 9.25% 2019 | 1,750 | 1,886 |
| Dynegy Finance Inc. 7.375% 20225 | 415 | 423 |
| Dynegy Finance Inc. 7.625% 20245 | 760 | 776 |
| Econ. Dev. Auth., Energy Fac. Rev. Bonds (ACR Energy Partners, LLC Project), Series 2011-B, 12.00% 20305,8 | 240 | 108 |
| Electricité de France SA 6.95% 20395 | 625 | 852 |
| Electricité de France SA 4.875% 20445 | 600 | 669 |
| Enbridge Energy Partners, LP, Series B, 6.50% 2018 | 820 | 929 |
| Enbridge Energy Partners, LP 9.875% 2019 | 750 | 950 |
| Enbridge Energy Partners, LP 5.20% 2020 | 1,535 | 1,674 |
| Enbridge Inc. 4.00% 2023 | 600 | 587 |
| Enbridge Inc. 4.50% 2044 | 250 | 217 |
| Endo Pharmaceuticals Holdings Inc. 5.75% 20225 | 1,955 | 1,960 |
| EnLink Midstream Partners, LP 4.40% 2024 | 135 | 137 |
| Enterprise Products Operating LLC 2.55% 2019 | 475 | 471 |
| Enterprise Products Operating LLC 3.75% 2025 | 1,865 | 1,876 |
| Enterprise Products Operating LLC 4.85% 2044 | 590 | 618 |
| Enterprise Products Operating LLC 5.10% 2045 | 360 | 389 |
| EQTY 2014-INNS Mortgage Trust Commercial Mortgage Pass-Through Certificates, Series 2014-A, 1.003% 20311,2,5 | 2,370 | 2,372 |
| ERP Operating LP 4.625% 2021 | 940 | 1,030 |
| Euramax International, Inc. 9.50% 2016 | 1,750 | 1,636 |
| Express Scripts Inc. 3.125% 2016 | 2,600 | 2,674 |
| Fannie Mae 3.50% 20252 | 721 | 763 |
| Fannie Mae 3.50% 20252 | 485 | 514 |
| Fannie Mae 2.50% 20272 | 153 | 157 |
| Fannie Mae 2.50% 20282 | 733 | 748 |
| Fannie Mae 2.50% 20282 | 177 | 181 |
| Fannie Mae 2.50% 20282 | 125 | 127 |
| Fannie Mae 2.50% 20282 | 216 | 220 |
| Fannie Mae 2.50% 20282 | 891 | 908 |
| Fannie Mae 2.50% 20282 | 1,265 | 1,290 |
| Fannie Mae 2.50% 20282 | 1,304 | 1,331 |
| Fannie Mae 2.50% 20282 | 896 | 914 |
| Fannie Mae 2.50% 20282 | 933 | 951 |
| Fannie Mae 2.50% 20282 | 932 | 950 |
| Fannie Mae 6.50% 20362 | 292 | 332 |
| Fannie Mae 6.00% 20372 | 147 | 167 |
| Fannie Mae 6.00% 20372 | 10 | 11 |
| Fannie Mae 6.00% 20382 | 320 | 364 |
| Fannie Mae 6.00% 20392 | 510 | 579 |
| Fannie Mae 2.25% 20391,2 | 65 | 69 |
| Fannie Mae 2.28% 20391,2 | 3 | 3 |
| Fannie Mae 2.335% 20391,2 | 3 | 3 |
| Fannie Mae 2.191% 20391,2 | 10 | 10 |
| Fannie Mae 3.058% 20391,2 | 89 | 96 |
| Fannie Mae 3.47% 20391,2 | 3 | 3 |
| Fannie Mae 4.50% 20402 | 698 | 758 |
| Fannie Mae 6.00% 20402 | 63 | 72 |
| Fannie Mae 4.00% 20412 | 1,028 | 1,098 |
| Bonds, notes & other debt instruments U.S. dollars (continued) | Principal amount (000) | Value (000) |
| Fannie Mae 4.50% 20412 | $1,738 | $1,888 |
| Fannie Mae 2.924% 20411,2 | 575 | 598 |
| Fannie Mae 3.547% 20411,2 | 1,779 | 1,867 |
| Fannie Mae 3.50% 20422 | 643 | 671 |
| Fannie Mae 3.50% 20422 | 1,192 | 1,246 |
| Fannie Mae 3.50% 20422 | 403 | 422 |
| Fannie Mae 3.50% 20432 | 1,099 | 1,152 |
| Fannie Mae 4.00% 20432 | 1,282 | 1,383 |
| Fannie Mae 3.50% 20432 | 642 | 672 |
| Fannie Mae 3.50% 20452,9 | 32,675 | 34,047 |
| Fannie Mae 4.50% 20452,9 | 16,312 | 17,705 |
| Fannie Mae 3.50% 20452,9 | 11,650 | 12,107 |
| Fannie Mae 4.00% 20452,9 | 16,050 | 17,081 |
| Fannie Mae 4.50% 20452,9 | 27,348 | 29,632 |
| Fannie Mae, Series 2012-M9, Class A2, multifamily 2.482% 20222 | 1,747 | 1,747 |
| Fannie Mae, Series 2012-M17, Class A2, multifamily 2.184% 20222 | 2,000 | 1,951 |
| First Data Corp. 12.625% 2021 | 3,398 | 4,044 |
| First Data Corp. 11.75% 2021 | 1,300 | 1,498 |
| First Quantum Minerals Ltd. 6.75% 20205 | 1,931 | 1,757 |
| First Quantum Minerals Ltd. 7.00% 20215 | 1,931 | 1,748 |
| FMG Resources 6.00% 20175 | 2,875 | 2,758 |
| FMG Resources 6.875% 20182,5 | 1,622 | 1,476 |
| Ford Motor Credit Co. 2.375% 2018 | 1,260 | 1,268 |
| Ford Motor Credit Co. 2.375% 2019 | 4,550 | 4,523 |
| Ford Motor Credit Co. 2.597% 2019 | 2,020 | 2,011 |
| Forest Laboratories, Inc. 5.00% 20215 | 730 | 792 |
| Freddie Mac 2.50% 2016 | 625 | 642 |
| Freddie Mac 0.75% 2018 | 2,800 | 2,765 |
| Freddie Mac 6.50% 20392 | 396 | 451 |
| Freddie Mac 3.347% 20391,2 | 4 | 5 |
| Freddie Mac 4.50% 20392 | 54 | 58 |
| Freddie Mac, Series K710, Class A2, multifamily 1.883% 20192 | 1,535 | 1,539 |
| Freddie Mac, Series K712, Class A2, multifamily 1.869% 20192 | 1,530 | 1,523 |
| Freddie Mac, Series K021, Class A2, multifamily 2.396% 20222 | 1,840 | 1,837 |
| Freddie Mac, Series 3213, Class OG, principal only, 0% 20362 | 28 | 25 |
| Freddie Mac, Series 3292, Class BO, principal only, 0% 20372 | 121 | 112 |
| Freescale Semiconductor, Inc. 6.00% 20225 | 1,475 | 1,545 |
| Freescale Semiconductor, Inc., Term Loan B4, 4.25% 20201,2,6 | 2,472 | 2,416 |
| Frontier Communications Corp. 8.50% 2020 | 1,350 | 1,512 |
| Frontier Communications Corp. 9.25% 2021 | 1,850 | 2,144 |
| Frontier Communications Corp. 6.25% 2021 | 1,350 | 1,360 |
| Gannett Co., Inc. 4.875% 20215 | 195 | 194 |
| Gardner Denver, Inc. Term Loan B, 4.25% 20201,2,6 | 1,225 | 1,151 |
| Gazprom OJSC, Series 9, 6.51% 2022 | 400 | 360 |
| General Electric Capital Corp. 3.45% 2024 | 3,545 | 3,667 |
| General Electric Co. 2.70% 2022 | 80 | 80 |
| Georgia Gulf Corp. 4.625% 2021 | 725 | 690 |
| Gilead Sciences, Inc. 3.05% 2016 | 160 | 166 |
| Gilead Sciences, Inc. 4.40% 2021 | 200 | 221 |
| Gilead Sciences, Inc. 3.70% 2024 | 600 | 631 |
| Gilead Sciences, Inc. 3.50% 2025 | 5,120 | 5,266 |
| Gilead Sciences, Inc. 4.80% 2044 | 400 | 446 |
| Gilead Sciences, Inc. 4.50% 2045 | 390 | 419 |
| Glencore Xstrata LLC 1.594% 20191,5 | 1,325 | 1,333 |
| Goldman Sachs Group, Inc. 2.55% 2019 | 1,530 | 1,524 |
| Bonds, notes & other debt instruments U.S. dollars (continued) | Principal amount (000) | Value (000) |
| Goldman Sachs Group, Inc. 4.00% 2024 | $5,020 | $5,217 |
| Goldman Sachs Group, Inc. 3.85% 2024 | 1,950 | 2,002 |
| Goldman Sachs Group, Inc. 4.80% 2044 | 310 | 333 |
| Government National Mortgage Assn. 3.00% 20272 | 263 | 277 |
| Government National Mortgage Assn. 2.50% 20282 | 1,726 | 1,773 |
| Government National Mortgage Assn. 2.50% 20282 | 214 | 220 |
| Government National Mortgage Assn. 2.50% 20282 | 149 | 153 |
| Government National Mortgage Assn. 2.50% 20282 | 150 | 154 |
| Government National Mortgage Assn. 2.50% 20282 | 130 | 134 |
| Greenwich Capital Commercial Funding Corp., Series 2006-GG7, Class A-1-A, 5.819% 20381,2 | 1,283 | 1,347 |
| Greenwich Capital Commercial Funding Corp., Series 2006-GG7, Class A-4, 5.819% 20381,2 | 867 | 907 |
| Greenwich Capital Commercial Funding Corp., Series 2007-GG9, Class A-1-A, 5.426% 20392 | 1,493 | 1,605 |
| Greenwich Capital Commercial Funding Corp., Series 2007-GG9, Class A-4, 5.444% 20392 | 4,500 | 4,804 |
| Greenwich Capital Commercial Funding Corp., Series 2007-GG11, Class A-1-A, 5.704% 20492 | 1,839 | 2,016 |
| Greenwich Capital Commercial Funding Corp., Series 2007-GG11, Class A-M, 5.867% 20491,2 | 1,510 | 1,639 |
| GS Mortgage Securities Corp. II, Series 2007-GG10, Class A-1-A, 5.796% 20451,2 | 299 | 325 |
| Hardwoods Acquisition Inc 7.50% 20215 | 750 | 742 |
| Hawker Beechcraft Acquisition Co., LLC, LOC, 0.008% 20151,2,6,10 | 7 | 7 |
| HBOS PLC 6.75% 20185 | 375 | 419 |
| HCA Inc. 3.75% 2019 | 3,000 | 3,011 |
| HD Supply, Inc. 7.50% 2020 | 1,450 | 1,526 |
| HD Supply, Inc. 5.25% 20215 | 1,100 | 1,122 |
| HDTFS Inc. 5.875% 2020 | 150 | 152 |
| Hilton USA Trust, Series 2013-HLF-AFX, 2.662% 20302,5 | 4,765 | 4,775 |
| Holcim Ltd. 5.15% 20235 | 1,290 | 1,440 |
| Home Depot, Inc. 4.40% 2045 | 560 | 615 |
| Hospitality Properties Trust 6.70% 2018 | 680 | 752 |
| HSBC Bank PLC 1.50% 20185 | 200 | 198 |
| HSBC Holdings PLC 4.00% 2022 | 175 | 187 |
| HSBC Holdings PLC 4.25% 2024 | 4,400 | 4,587 |
| HSBC Holdings PLC 5.25% 2044 | 285 | 320 |
| Humana Inc. 2.625% 2019 | 265 | 265 |
| Humana Inc. 3.85% 2024 | 1,000 | 1,015 |
| Humana Inc. 4.95% 2044 | 1,000 | 1,068 |
| Hungarian Government 4.125% 2018 | 4,782 | 4,985 |
| Hungarian Government 4.00% 2019 | 2,500 | 2,575 |
| Hungarian Government 6.25% 2020 | 810 | 914 |
| Hungarian Government 5.375% 2023 | 460 | 501 |
| Hungarian Government 5.375% 2024 | 2,000 | 2,170 |
| Hungarian Government 7.625% 2041 | 3,746 | 4,999 |
| Husky Energy Inc. 7.25% 2019 | 1,040 | 1,221 |
| Icahn Enterprises Finance Corp. 3.50% 2017 | 1,900 | 1,905 |
| Imperial Tobacco Finance PLC 3.50% 20235 | 2,000 | 1,969 |
| Indonesia (Republic of) 5.875% 20205 | 1,505 | 1,674 |
| Indonesia (Republic of) 5.875% 2020 | 120 | 134 |
| Indonesia (Republic of) 3.75% 2022 | 4,150 | 4,108 |
| Intelsat Jackson Holding Co. 7.25% 2020 | 350 | 371 |
| Intelsat Jackson Holding Co. 6.625% 2022 | 3,625 | 3,743 |
| International Business Machines Corp. 1.625% 2020 | 550 | 531 |
| International Paper Co. 7.30% 2039 | 600 | 798 |
| Intesa Sanpaolo SpA 5.017% 20245 | 1,830 | 1,779 |
| inVentiv Health Inc, Term Loan B4, 7.75% 20181,2,6 | 1,470 | 1,465 |
| inVentiv Health Inc. 9.00% 20185 | 2,875 | 2,947 |
| inVentiv Health Inc. 11.00% 20185 | 200 | 176 |
| Bonds, notes & other debt instruments U.S. dollars (continued) | Principal amount (000) | Value (000) |
| inVentiv Health Inc. 11.00% 20185 | $100 | $87 |
| inVentiv Health Inc. 12.00% 20181,5,7 | 425 | 402 |
| iStar Financial Inc. 5.00% 2019 | 1,875 | 1,828 |
| J.P. Morgan Chase Commercial Mortgage Securities Corp., Series 2005-CIBC12, Class A-3B, 5.467% 20371,2 | 21 | 21 |
| J.P. Morgan Chase Commercial Mortgage Securities Corp., Series 2006-CB15, Class A-1-A, 5.811% 20431,2 | 143 | 150 |
| J.P. Morgan Chase Commercial Mortgage Securities Corp., Series 2006-CB15, Class A-4, 5.814% 20431,2 | 253 | 266 |
| J.P. Morgan Chase Commercial Mortgage Securities Corp., Series 2006-LDP7, Class A-4, 5.863% 20451,2 | 1,250 | 1,306 |
| J.P. Morgan Chase Commercial Mortgage Securities Corp., Series 2006-CB-16, Class A1A, 5.546% 20452 | 468 | 496 |
| J.P. Morgan Chase Commercial Mortgage Securities Corp., Series 2011-C3A, Class A-2, 3.673% 20462,5 | 1,714 | 1,764 |
| J.P. Morgan Chase Commercial Mortgage Securities Corp., Series 2011-C4, Class A-2, 3.341% 20462,5 | 897 | 921 |
| J.P. Morgan Chase Commercial Mortgage Securities Corp., Series 2007-CB18, Class A-1-A, 5.092% 20471,2 | 1,510 | 1,612 |
| J.P. Morgan Chase Commercial Mortgage Securities Corp., Series 2007-LDPX, Class A-1-A, 5.439% 20492 | 1,520 | 1,627 |
| J.P. Morgan Chase Commercial Mortgage Securities Corp., Series 2007-CB19, Class A-1-A, 5.703% 20491,2 | 2,019 | 2,186 |
| J.P. Morgan Chase Commercial Mortgage Securities Corp., Series 2007-CB19, Class A-4, 5.703% 20491,2 | 2,000 | 2,149 |
| J.P. Morgan Chase Commercial Mortgage Securities Corp., Series 2007-C1, Class A-4, 5.716% 20512 | 1,494 | 1,609 |
| J.P. Morgan Chase Commercial Mortgage Securities Corp., Series 2007-LD12, Class A-1-A, 5.85% 20511,2 | 556 | 607 |
| Jaguar Holding Co. 9.375% 20171,5,7 | 2,000 | 2,049 |
| JMC Steel Group Inc. 8.25% 20185 | 1,850 | 1,764 |
| JPMorgan Chase & Co. 1.625% 2018 | 1,875 | 1,856 |
| JPMorgan Chase & Co. 3.25% 2022 | 1,000 | 1,008 |
| JPMorgan Chase & Co. 3.625% 2024 | 590 | 605 |
| JPMorgan Chase & Co. 3.875% 2024 | 695 | 696 |
| Kenya (Republic of) 6.875% 20245 | 900 | 947 |
| Kimco Realty Corp., Series C, 4.904% 2015 | 235 | 236 |
| Kimco Realty Corp. 5.70% 2017 | 500 | 545 |
| Kimco Realty Corp. 6.875% 2019 | 1,250 | 1,483 |
| Kinder Morgan Energy Partners, LP 6.00% 2017 | 140 | 151 |
| Kinder Morgan Energy Partners, LP 3.50% 2021 | 175 | 172 |
| Kinder Morgan Energy Partners, LP 3.45% 2023 | 2,250 | 2,158 |
| Kinder Morgan Energy Partners, LP 3.50% 2023 | 1,600 | 1,522 |
| Kinder Morgan Energy Partners, LP 4.15% 2024 | 3,075 | 3,073 |
| Kinder Morgan Energy Partners, LP 5.50% 2044 | 4,609 | 4,702 |
| Kinder Morgan, Inc. 4.30% 2025 | 3,060 | 3,077 |
| Kinder Morgan, Inc. 5.55% 2045 | 1,850 | 1,902 |
| Kindred Healthcare, Inc. 8.00% 20205 | 700 | 747 |
| Kinetic Concepts, Inc. 10.50% 2018 | 2,080 | 2,267 |
| Kinetic Concepts, Inc. 12.50% 2019 | 2,305 | 2,559 |
| KLX Inc. 5.875% 20225 | 430 | 435 |
| Kraft Foods Inc. 2.25% 2017 | 455 | 463 |
| Kraft Foods Inc. 5.375% 2020 | 523 | 594 |
| Laredo Petroleum, Inc. 9.50% 2019 | 150 | 150 |
| Latvia (Republic of) 2.75% 2020 | 900 | 891 |
| Latvia (Republic of) 5.25% 2021 | 375 | 424 |
| LB Commercial Mortgage Trust, Series 2007-C3, Class A-1-A, multifamily 5.858% 20441,2 | 78 | 85 |
| LB-UBS Commercial Mortgage Trust, Series 2007-C2, Class A-3, 5.43% 20402 | 818 | 876 |
| LB-UBS Commercial Mortgage Trust, Series 2007-C7, Class A-M, 6.163% 20451,2 | 615 | 685 |
| Lithuania (Republic of) 7.375% 2020 | 375 | 454 |
| Lithuania (Republic of) 6.125% 20215 | 450 | 526 |
| Lithuania (Republic of) 6.625% 20225 | 200 | 242 |
| LSB Industries, Inc. 7.75% 2019 | 1,025 | 1,071 |
| Marks and Spencer Group PLC 6.25% 20175 | 1,250 | 1,377 |
| McClatchy Co. 9.00% 2022 | 1,625 | 1,777 |
| McKesson Corp. 3.25% 2016 | 180 | 184 |
| McKesson Corp. 2.284% 2019 | 1,065 | 1,064 |
| McKesson Corp. 3.796% 2024 | 680 | 700 |
| Bonds, notes & other debt instruments U.S. dollars (continued) | Principal amount (000) | Value (000) |
| McKesson Corp. 4.883% 2044 | $300 | $332 |
| Mediacom Broadband LLC and Mediacom Broadband Corp. 6.375% 2023 | 1,500 | 1,545 |
| Mediacom LLC and Mediacom Capital Corp. 7.25% 2022 | 2,000 | 2,145 |
| Medtronic, Inc. 2.50% 20205 | 1,455 | 1,461 |
| Medtronic, Inc. 3.50% 20255 | 7,260 | 7,443 |
| Medtronic, Inc. 4.625% 20455 | 520 | 566 |
| Merrill Lynch Mortgage Trust, Series 2007-C1, Class A-4, 6.028% 20501,2 | 630 | 678 |
| MetroPCS Wireless, Inc. 6.25% 2021 | 2,725 | 2,799 |
| MetroPCS Wireless, Inc. 6.625% 2023 | 1,650 | 1,698 |
| MidAmerican Energy Co. 4.40% 2044 | 240 | 265 |
| ML-CFC Commercial Mortgage Trust, Series 2007-8, Class A-3, 6.079% 20491,2 | 260 | 284 |
| Morgan Stanley 2.125% 2018 | 2,275 | 2,278 |
| Morgan Stanley 2.50% 2019 | 2,675 | 2,680 |
| Morgan Stanley 2.375% 2019 | 325 | 324 |
| Morgan Stanley, Series F, 3.875% 2024 | 555 | 571 |
| Morgan Stanley 3.70% 2024 | 380 | 386 |
| Morgan Stanley Capital I Trust, Series 2006-IQ12, Class A1A, 5.319% 20432 | 783 | 832 |
| Morgan Stanley Capital I Trust, Series 2007-IQ13, Class A-M, 5.406% 20442 | 200 | 213 |
| Morgan Stanley Capital I Trust, Series 2007-IQ15, Class A-4, 6.105% 20491,2 | 68 | 74 |
| Morocco Government 5.50% 2042 | 3,100 | 3,232 |
| National Grid PLC 6.30% 2016 | 250 | 270 |
| National Rural Utilities Cooperative Finance Corp. 10.375% 2018 | 2,850 | 3,716 |
| Navios Maritime Holdings Inc. 7.375% 20225 | 3,100 | 2,883 |
| NBC Universal Enterprise, Inc. 1.974% 20195 | 600 | 595 |
| Needle Merger Sub Corp. 8.125% 20195 | 1,500 | 1,402 |
| Neiman Marcus Group LTD Inc. 8.00% 20215 | 1,325 | 1,408 |
| Neiman Marcus Group LTD Inc. 8.75% 20211,5,7 | 1,675 | 1,784 |
| NGL Energy Partners LP 6.875% 20215 | 150 | 149 |
| NGPL PipeCo LLC 7.119% 20175 | 750 | 741 |
| NGPL PipeCo LLC 9.625% 20195 | 2,100 | 2,116 |
| Niagara Mohawk Power Corp. 3.508% 20245 | 180 | 186 |
| Niagara Mohawk Power Corp. 4.278% 20345 | 300 | 318 |
| Nielsen Finance LLC and Nielsen Finance Co. 5.50% 20215 | 1,425 | 1,461 |
| NII Capital Corp. 10.00% 20168 | 50 | 18 |
| NII Capital Corp. 7.875% 20195,8 | 1,500 | 1,087 |
| NII Capital Corp. 11.375% 20195,8 | 525 | 381 |
| NII Capital Corp. 8.875% 20198 | 800 | 284 |
| NII Capital Corp. 7.625% 20218 | 3,250 | 617 |
| Norfolk Southern Corp. 5.75% 2016 | 810 | 849 |
| Norfolk Southern Corp. 3.00% 2022 | 720 | 724 |
| Nortek Inc. 10.00% 2018 | 700 | 737 |
| Nortek Inc. 8.50% 2021 | 1,895 | 2,037 |
| Novartis Capital Corp. 3.40% 2024 | 910 | 949 |
| Numericable Group SA, First Lien, 4.875% 20195 | 225 | 224 |
| Numericable Group SA, First Lien, 6.00% 20225 | 1,775 | 1,787 |
| NXP BV and NXP Funding LLC 3.75% 20185 | 1,425 | 1,432 |
| Oasis Petroleum Inc. 6.875% 2022 | 500 | 457 |
| Odebrecht Offshore Drilling Finance Ltd. 6.75% 20222,5 | 1,225 | 1,124 |
| Oracle Corp. 3.40% 2024 | 615 | 629 |
| Orange SA 5.50% 2044 | 600 | 707 |
| Ortho-Clinical Diagnostics Inc., Term Loan B, 4.75% 20211,2,6 | 1,059 | 1,044 |
| Pacific Gas and Electric Co. 3.25% 2023 | 580 | 582 |
| Pacific Gas and Electric Co. 3.85% 2023 | 300 | 313 |
| PacifiCorp., First Mortgage Bonds, 3.60% 2024 | 1,015 | 1,051 |
| PDC Energy Inc. 7.75% 2022 | 1,800 | 1,719 |
| Bonds, notes & other debt instruments U.S. dollars (continued) | Principal amount (000) | Value (000) |
| Peabody Energy Corp. 6.00% 2018 | $4,425 | $4,038 |
| Pernod Ricard SA 4.45% 20225 | 1,885 | 2,021 |
| PETCO Animal Supplies, Inc. 9.25% 20185 | 800 | 840 |
| Petrobras International Finance Co. 5.75% 2020 | 200 | 193 |
| Petróleos Mexicanos 3.50% 2018 | 3,135 | 3,182 |
| Petróleos Mexicanos 8.00% 2019 | 1,400 | 1,662 |
| Petróleos Mexicanos 4.875% 2022 | 4,100 | 4,305 |
| Pfizer Inc. 3.40% 2024 | 900 | 938 |
| PG&E Corp. 2.40% 2019 | 555 | 556 |
| Philip Morris International Inc. 1.875% 2019 | 840 | 836 |
| Philip Morris International Inc. 4.25% 2044 | 1,750 | 1,787 |
| Ply Gem Industries, Inc. 6.50% 2022 | 1,425 | 1,345 |
| Ply Gem Industries, Inc. 6.50% 20225 | 950 | 888 |
| PNC Bank 2.40% 2019 | 2,250 | 2,262 |
| PNC Financial Services Group, Inc. 3.90% 2024 | 910 | 927 |
| PNC Funding Corp. 3.30% 2022 | 2,211 | 2,277 |
| Popular, Inc. 7.00% 2019 | 515 | 518 |
| PRA Holdings, Inc. 9.50% 20235 | 609 | 661 |
| Progress Energy, Inc. 7.05% 2019 | 910 | 1,079 |
| Progress Energy, Inc. 7.75% 2031 | 550 | 799 |
| Prologis, Inc. 3.35% 2021 | 200 | 203 |
| Prologis, Inc. 4.25% 2023 | 2,575 | 2,726 |
| Public Service Electric and Gas Co., Series E, 5.30% 2018 | 1,520 | 1,690 |
| Puget Sound Energy, Inc., First Lien, 6.50% 2020 | 335 | 394 |
| Puget Sound Energy, Inc., First Lien, 6.00% 2021 | 1,023 | 1,198 |
| Puget Sound Energy, Inc., First Lien, 5.625% 2022 | 480 | 556 |
| QBE Insurance Group Ltd. 2.40% 20185 | 1,100 | 1,101 |
| QGOG Constellation SA 6.25% 20195 | 2,150 | 1,360 |
| R.R. Donnelley & Sons Co. 7.875% 2021 | 1,050 | 1,165 |
| R.R. Donnelley & Sons Co. 6.50% 2023 | 1,100 | 1,133 |
| Rabobank Nederland 4.625% 2023 | 3,420 | 3,634 |
| Ras Laffan Liquefied Natural Gas II 5.298% 20202,5 | 681 | 734 |
| RCI Banque 3.50% 20185 | 1,500 | 1,554 |
| Realogy Corp. 5.25% 20215 | 350 | 342 |
| Realogy Corp., LOC, 4.40% 20161,2,6 | 10 | 10 |
| Regions Financial Corp. 5.75% 2015 | 150 | 153 |
| Regions Financial Corp. 2.00% 2018 | 1,175 | 1,165 |
| Reynolds American Inc. 4.85% 2023 | 110 | 119 |
| Reynolds American Inc. 6.15% 2043 | 935 | 1,088 |
| Reynolds Group Inc. 5.75% 2020 | 3,965 | 4,084 |
| Rice Energy Inc. 6.25% 20225 | 2,025 | 1,893 |
| Rio Tinto Finance (USA) Ltd. 2.875% 2022 | 300 | 289 |
| Roche Holdings, Inc. 6.00% 20195 | 144 | 166 |
| Roche Holdings, Inc. 2.25% 20195 | 1,250 | 1,259 |
| Roche Holdings, Inc. 2.875% 20215 | 1,250 | 1,268 |
| Roche Holdings, Inc. 3.35% 20245 | 200 | 207 |
| Royal Bank of Scotland PLC 5.625% 2020 | 290 | 331 |
| Sabine Pass Liquefaction, LLC 5.625% 2021 | 700 | 691 |
| Sabine Pass Liquefaction, LLC 5.75% 2024 | 1,075 | 1,060 |
| SABMiller Holdings Inc. 3.75% 20225 | 775 | 810 |
| SABMiller Holdings Inc. 4.95% 20425 | 1,230 | 1,391 |
| Samson Investment Co. 9.75% 2020 | 425 | 178 |
| Scentre Group, 3.50% 20255 | 600 | 604 |
| Select Medical Holdings Corp. 6.375% 2021 | 1,645 | 1,678 |
| Sierra Pacific Power Co., General and Refunding Mortgage Notes, Series T, 3.375% 2023 | 2,450 | 2,548 |
| Bonds, notes & other debt instruments U.S. dollars (continued) | Principal amount (000) | Value (000) |
| Silver II Borrower S.C.A./Silver II U.S. Holdings, LLC 7.75% 20205 | $1,800 | $1,710 |
| Simon Property Group, LP 10.35% 2019 | 750 | 982 |
| Slovenia (Republic of) 4.75% 20185 | 1,620 | 1,737 |
| Slovenia (Republic of) 4.125% 20195 | 1,000 | 1,050 |
| Slovenia (Republic of) 4.375% 20225 | 1,500 | 1,639 |
| Slovenia (Republic of) 5.50% 2022 | 3,165 | 3,521 |
| Slovenia (Republic of) 5.50% 20225 | 425 | 473 |
| Slovenia (Republic of) 5.85% 2023 | 4,010 | 4,554 |
| Slovenia (Republic of) 5.85% 20235 | 2,470 | 2,805 |
| Slovenia (Republic of) 5.25% 2024 | 1,010 | 1,115 |
| SoftBank Corp. 4.50% 20205 | 725 | 717 |
| Spectra Energy Partners, LP 4.75% 2024 | 405 | 435 |
| Sprint Nextel Corp. 7.00% 2020 | 825 | 829 |
| Sprint Nextel Corp. 7.25% 2021 | 575 | 573 |
| Sprint Nextel Corp. 7.875% 2023 | 4,075 | 4,043 |
| SRA International, Inc. 11.00% 2019 | 500 | 534 |
| SRA International, Inc., Term Loan B, 6.50% 20181,2,6 | 1,389 | 1,391 |
| Stackpole Intl. 7.75% 20215 | 925 | 930 |
| Standard Chartered PLC 3.85% 20155 | 1,245 | 1,258 |
| Statoil ASA 0.524% 20181 | 1,175 | 1,174 |
| Statoil ASA 1.95% 2018 | 960 | 961 |
| Statoil ASA 2.75% 2021 | 675 | 678 |
| Statoil ASA 3.70% 2024 | 1,950 | 2,023 |
| Statoil ASA 3.25% 2024 | 300 | 302 |
| Statoil ASA 4.25% 2041 | 1,000 | 1,029 |
| Tampa Electric Co. 4.10% 2042 | 930 | 955 |
| Tampa Electric Co. 4.35% 2044 | 360 | 385 |
| Targa Resources Corp. 4.125% 20195 | 375 | 363 |
| Teco Finance, Inc. 5.15% 2020 | 75 | 84 |
| Teekay Corp. 8.50% 2020 | 1,375 | 1,536 |
| Tenet Healthcare Corp., First Lien, 4.75% 2020 | 625 | 637 |
| Tenet Healthcare Corp., First Lien, 4.50% 2021 | 3,125 | 3,145 |
| Tennessee Valley Authority 5.88% 2036 | 500 | 687 |
| Tennessee Valley Authority 5.25% 2039 | 1,750 | 2,235 |
| Tesoro Logistics LP 5.50% 20195 | 250 | 249 |
| Thermo Fisher Scientific Inc. 4.15% 2024 | 660 | 697 |
| Thomson Reuters Corp. 1.65% 2017 | 1,005 | 1,000 |
| Thomson Reuters Corp. 5.65% 2043 | 670 | 777 |
| TIBCO Software, Inc., Term Loan B, 6.50% 20201,2,6 | 400 | 388 |
| Time Inc. 5.75% 20225 | 475 | 461 |
| T-Mobile US, Inc. 6.731% 2022 | 1,250 | 1,292 |
| Total Capital International 1.55% 2017 | 540 | 542 |
| Total Capital International 2.875% 2022 | 465 | 461 |
| TRAC Intermodal 11.00% 2019 | 575 | 624 |
| TransCanada PipeLines Ltd. 7.625% 2039 | 250 | 345 |
| Transocean Inc. 2.50% 2017 | 115 | 102 |
| Transocean Inc. 6.375% 2021 | 710 | 656 |
| Transocean Inc. 3.80% 2022 | 1,200 | 974 |
| Turkey (Republic of) 4.557% 20185 | 775 | 815 |
| Turkey (Republic of) 6.25% 2022 | 1,880 | 2,150 |
| Turkey (Republic of) 6.75% 2040 | 210 | 260 |
| U.S. Treasury 0.375% 2015 | 4,960 | 4,966 |
| U.S. Treasury 5.125% 2016 | 1,350 | 1,437 |
| U.S. Treasury 0.875% 2017 | 12,400 | 12,369 |
| U.S. Treasury 0.625% 2017 | 2,135 | 2,114 |
| Bonds, notes & other debt instruments U.S. dollars (continued) | Principal amount (000) | Value (000) |
| U.S. Treasury 0.75% 2017 | $12,180 | $12,052 |
| U.S. Treasury 3.50% 2018 | 15,275 | 16,366 |
| U.S. Treasury 0.625% 2018 | 4,350 | 4,263 |
| U.S. Treasury 1.375% 2018 | 15,000 | 15,015 |
| U.S. Treasury 1.50% 2018 | 67,050 | 67,370 |
| U.S. Treasury 1.25% 2018 | 36,150 | 35,918 |
| U.S. Treasury 1.50% 2019 | 13,950 | 13,958 |
| U.S. Treasury 1.625% 2019 | 18,550 | 18,630 |
| U.S. Treasury 1.50% 2019 | 9,150 | 9,129 |
| U.S. Treasury 1.00% 2019 | 27,500 | 26,835 |
| U.S. Treasury 1.625% 201911 | 44,800 | 44,919 |
| U.S. Treasury 1.625% 2019 | 4,400 | 4,407 |
| U.S. Treasury 1.625% 2019 | 46,905 | 46,954 |
| U.S. Treasury 1.75% 2019 | 11,000 | 11,063 |
| U.S. Treasury 1.25% 2020 | 9,450 | 9,251 |
| U.S. Treasury 1.125% 2020 | 30,350 | 29,484 |
| U.S. Treasury 1.375% 2020 | 39,600 | 38,862 |
| U.S. Treasury 2.50% 2024 | 19,530 | 20,111 |
| U.S. Treasury 2.25% 2024 | 2,100 | 2,115 |
| U.S. Treasury 2.875% 2043 | 6,300 | 6,447 |
| U.S. Treasury Inflation-Protected Security 0.125% 20184 | 5,033 | 5,021 |
| U.S. Treasury Inflation-Protected Security 0.125% 20194 | 45,678 | 45,268 |
| U.S. Treasury Inflation-Protected Security 0.125% 20234 | 874 | 849 |
| U.S. Treasury Inflation-Protected Security 0.625% 20244 | 46,202 | 46,619 |
| U.S. Treasury Inflation-Protected Security 0.125% 20244 | 9,300 | 8,999 |
| U.S. Treasury Inflation-Protected Security 2.375% 20254 | 1,449 | 1,708 |
| U.S. Treasury Inflation-Protected Security 0.75% 20424 | 657 | 643 |
| U.S. Treasury Inflation-Protected Security 0.625% 20434 | 1,239 | 1,175 |
| U.S. Treasury Inflation-Protected Security 1.375% 20444 | 14,517 | 16,592 |
| UniCredito Italiano SpA 6.00% 20175 | 600 | 642 |
| United Mexican States Government Global 3.60% 2025 | 2,825 | 2,829 |
| United Mexican States Government Global, Series A, 3.625% 2022 | 1,700 | 1,741 |
| UnitedHealth Group Inc. 2.875% 2023 | 200 | 199 |
| Unum Group 5.625% 2020 | 225 | 254 |
| US Investigations Services, Inc. 13.00% 20205,7 | 629 | 280 |
| US Investigations Services, Inc. 14.00% 20202,5,7 | 9 | 4 |
| US Investigations Services, Inc. 15.00% 20215,7 | 23 | 7 |
| Various Purpose G.O. Bonds, 7.60% 2040 | 5,310 | 8,436 |
| Various Purpose G.O. Bonds, 7.625% 2040 | 285 | 438 |
| Verizon Communications Inc. 5.15% 2023 | 2,730 | 3,017 |
| Verizon Communications Inc. 3.50% 2024 | 9,960 | 9,806 |
| Verizon Communications Inc. 4.862% 20465 | 5,840 | 6,014 |
| Viacom Inc. 2.75% 2019 | 1,535 | 1,540 |
| Viacom Inc. 4.25% 2023 | 1,335 | 1,379 |
| Viacom Inc. 4.85% 2034 | 250 | 257 |
| Viacom Inc. 5.85% 2043 | 575 | 642 |
| Vodafone Group PLC 2.50% 2022 | 317 | 296 |
| Volkswagen Group of America Finance, LLC 2.45% 20195 | 545 | 549 |
| Volvo Treasury AB 5.95% 20155 | 1,920 | 1,942 |
| VPI Escrow Corp. 6.375% 20205 | 535 | 561 |
| VPI Escrow Corp. 7.50% 20215 | 2,000 | 2,167 |
| Wachovia Bank Commercial Mortgage Trust, Series 2006-C25, Class A1A, 5.707% 20431,2 | 1,540 | 1,606 |
| Wachovia Bank Commercial Mortgage Trust, Series 2007-C30, Class A-5, 5.342% 20432 | 90 | 96 |
| Wachovia Bank Commercial Mortgage Trust, Series 2007-C31, Class A-5, 5.50% 20472 | 250 | 270 |
| Wachovia Bank Commercial Mortgage Trust, Series 2007-C31, Class A-M, 5.591% 20471,2 | 380 | 406 |
| Bonds, notes & other debt instruments U.S. dollars (continued) | Principal amount (000) | Value (000) |
| Wachovia Bank Commercial Mortgage Trust, Series 2007-C32, Class A-3, 5.933% 20491,2 | $150 | $161 |
| Walter Energy, Inc. 9.50% 20195 | 900 | 688 |
| Warner Music Group 5.625% 20225 | 25 | 24 |
| WEA Finance LLC 1.75% 20175 | 655 | 652 |
| WEA Finance LLC 2.70% 20195 | 1,500 | 1,501 |
| WEA Finance LLC 3.75% 20245 | 535 | 544 |
| WellPoint, Inc. 2.30% 2018 | 585 | 589 |
| Wells Fargo & Co. 3.30% 2024 | 4,500 | 4,534 |
| Western Gas Partners LP 4.00% 2022 | 1,500 | 1,523 |
| WFLD Mortgage Trust, Series 2014-MONT, Class A, 3.755% 20311,2,5 | 660 | 699 |
| Williams Partners LP 5.25% 2020 | 225 | 245 |
| Williams Partners LP 4.125% 2020 | 375 | 385 |
| Williams Partners LP 4.50% 2023 | 760 | 768 |
| Williams Partners LP 4.30% 2024 | 1,180 | 1,180 |
| Wind Acquisition SA 4.75% 20205 | 2,000 | 1,875 |
| Wind Acquisition SA 7.375% 20215 | 1,425 | 1,348 |
| WM. Wrigley Jr. Co 3.375% 20205 | 505 | 517 |
| Xstrata Canada Financial Corp. 2.70% 20171,5 | 1,250 | 1,266 |
| Xstrata Canada Financial Corp. 4.95% 20215 | 200 | 211 |
| 1,366,666 | ||
| Total bonds, notes & other debt instruments (cost: $2,546,783,000) | 2,508,699 | |
| Convertible stocks 0.01% U.S. dollars 0.01% | Shares | |
| CEVA Group PLC, Series A-1, 3.253% convertible preferred10 | 329 | 329 |
| CEVA Group PLC, Series A-2, 2.253% convertible preferred10,12 | 37 | 28 |
| Total convertible stocks (cost: $386,000) | 357 | |
| Common stocks 0.01% U.S. dollars 0.01% | ||
| CEVA Group PLC5,10,13 | 431 | 334 |
| Atrium Corp.5,10,13 | 2 | — |
| Total common stocks (cost: $998,000) | 334 | |
| Short-term securities 5.89% | Principal amount (000) | |
| Abbott Laboratories 0.09% due 2/2/20155 | $ 20,000 | 19,999 |
| Coca-Cola Co. 0.14% due 1/12/20155 | 25,000 | 24,999 |
| ExxonMobil Corp. 0.14% due 3/2/2015 | 17,000 | 16,996 |
| Federal Home Loan Bank 0.09% due 2/13/2015 | 30,000 | 29,999 |
| General Electric Co. 0.10% due 1/2/2015 | 5,100 | 5,100 |
| John Deere Financial Ltd. 0.09% due 1/13/20155 | 35,000 | 34,998 |
| Toronto-Dominion Holdings USA Inc. 0.16% due 1/22/20155 | 20,000 | 19,999 |
| Total short-term securities (cost: $152,087,000) | 152,090 | |
| Total investment securities 102.99% (cost: $2,700,254,000) | 2,661,480 | |
| Other assets less liabilities (2.99)% | (77,177) | |
| Net assets 100.00% | $2,584,303 |
| 1 | Coupon rate may change periodically. |
| 2 | Principal payments may be made periodically. Therefore, the effective maturity date may be earlier than the stated maturity date. |
| 3 | Step bond; coupon rate will increase at a later date. |
| 4 | Index-linked bond whose principal amount moves with a government price index. |
| 5 | Acquired in a transaction exempt from registration under Rule 144A or Section 4(2) of the Securities Act of 1933. May be resold in the U.S. in transactions exempt from registration, normally to qualified institutional buyers. The total value of all such securities was $284,687,000, which represented 11.02% of the net assets of the fund. |
| 6 | Loan participations and assignments; may be subject to legal or contractual restrictions on resale. The total value of all such loans was $10,039,000, which represented .39% of the net assets of the fund. |
| 7 | Payment in kind; the issuer has the option of paying additional securities in lieu of cash. |
| 8 | Scheduled interest and/or principal payment was not received. |
| 9 | A portion or all of the security purchased on a TBA basis. |
| 10 | Valued under fair value procedures adopted by authority of the board of trustees. The total value of all such securities, was $698,000, which represented .03% of the net assets of the fund. |
| 11 | A portion of this security was pledged as collateral. The total value of pledged collateral was $4,587,000, which represented .18% of the net assets of the fund. |
| 12 | Acquired through a private placement transaction exempt from registration under the Securities Act of 1933. May be subject to legal or contractual restrictions on resale. Further details on this holding appear below. |
| 13 | Security did not produce income during the last 12 months. |
| Private placement security | Acquisition date | Cost (000) | Value (000) | Percent of net assets |
| CEVA Group PLC, Series A-2, 2.253% convertible preferred | 3/10/2010 | $ 52 | $28 | .00% |
| Key to abbreviations |
| Auth. = Authority |
| Dev. = Development |
| Econ. = Economic |
| Fac. = Facility |
| G.O. = General Obligation |
| Rev. = Revenue |
| TBA = To be announced |
| Bonds, notes & other debt instruments 89.08% Corporate bonds & notes 86.38% Telecommunication services 15.03% | Principal amount (000) | Value (000) |
| Altice Finco SA 6.50% 20221 | $2,225 | $2,181 |
| Altice Finco SA, First Lien, 7.75% 20221 | 4,750 | 4,771 |
| Altice Finco SA 8.125% 20241 | 1,325 | 1,299 |
| Clearwire Communications and Clearwire Finance, Inc. 14.75% 20161 | 1,250 | 1,506 |
| Digicel Group Ltd. 8.25% 20201 | 17,300 | 16,867 |
| Digicel Group Ltd. 6.00% 20211 | 5,650 | 5,297 |
| Digicel Group Ltd. 7.125% 20221 | 3,250 | 3,031 |
| Frontier Communications Corp. 8.125% 2018 | 6,925 | 7,808 |
| Frontier Communications Corp. 8.50% 2020 | 5,775 | 6,468 |
| Frontier Communications Corp. 6.25% 2021 | 5,525 | 5,566 |
| Frontier Communications Corp. 9.25% 2021 | 4,525 | 5,243 |
| Frontier Communications Corp. 8.75% 2022 | 550 | 617 |
| Frontier Communications Corp. 6.875% 2025 | 1,425 | 1,429 |
| Intelsat Jackson Holding Co. 7.25% 2020 | 1,100 | 1,165 |
| Intelsat Jackson Holding Co. 6.625% 2022 | 22,350 | 23,076 |
| Intelsat Luxembourg Holding Co. 6.75% 2018 | 1,470 | 1,507 |
| MetroPCS Wireless, Inc. 6.25% 2021 | 16,950 | 17,412 |
| MetroPCS Wireless, Inc. 6.625% 2023 | 19,150 | 19,705 |
| Millicom International Cellular SA 6.625% 20211 | 4,040 | 4,222 |
| NII Capital Corp. 10.00% 20162 | 15,300 | 5,355 |
| NII Capital Corp. 7.875% 20191,2 | 10,975 | 7,957 |
| NII Capital Corp. 8.875% 20192 | 6,125 | 2,174 |
| NII Capital Corp. 11.375% 20191,2 | 8,610 | 6,242 |
| NII Capital Corp. 7.625% 20212 | 21,625 | 4,109 |
| Numericable Group SA, First Lien, 4.875% 20191 | 18,800 | 18,706 |
| Numericable Group SA, First Lien, 6.00% 20221 | 8,750 | 8,809 |
| Numericable Group SA, First Lien, 6.25% 20241 | 600 | 605 |
| SoftBank Corp. 4.50% 20201 | 4,525 | 4,474 |
| Sprint Nextel Corp. 7.00% 2020 | 28,050 | 28,190 |
| Sprint Nextel Corp. 7.25% 2021 | 9,900 | 9,863 |
| Sprint Nextel Corp. 11.50% 2021 | 4,950 | 5,977 |
| Sprint Nextel Corp. 7.875% 2023 | 2,050 | 2,034 |
| Telecom Italia Capital SA 6.999% 2018 | 4,075 | 4,544 |
| T-Mobile US, Inc. 6.542% 2020 | 6,379 | 6,610 |
| T-Mobile US, Inc. 6.731% 2022 | 3,500 | 3,618 |
| T-Mobile US, Inc. 6.375% 2025 | 9,400 | 9,574 |
| Trilogy International Partners, LLC 10.25% 20161 | 12,675 | 12,723 |
| Wind Acquisition SA 4.75% 20201 | 7,575 | 7,102 |
| Wind Acquisition SA 7.375% 20211 | 18,000 | 17,033 |
| 294,869 | ||
| Health care 14.64% | ||
| Centene Corp. 5.75% 2017 | 5,080 | 5,410 |
| Centene Corp. 4.75% 2022 | 2,640 | 2,650 |
| Community Health Systems, Inc. 5.125% 2018 | 2,195 | 2,277 |
| Bonds, notes & other debt instruments Corporate bonds & notes (continued) Health care (continued) | Principal amount (000) | Value (000) |
| ConvaTec Finance International SA 8.25% 20191,3,4 | $6,925 | $7,033 |
| DJO Finance LLC 9.75% 2017 | 5,930 | 5,960 |
| DJO Finance LLC 7.75% 2018 | 12,070 | 11,768 |
| DJO Finance LLC 8.75% 2018 | 840 | 878 |
| DJO Finance LLC 9.875% 2018 | 5,525 | 5,636 |
| Endo Pharmaceuticals Holdings Inc. 5.75% 20221 | 6,260 | 6,276 |
| Forest Laboratories, Inc. 5.00% 20211 | 6,315 | 6,848 |
| Grifols Worldwide Operations Ltd. 5.25% 20221 | 250 | 256 |
| HCA Inc. 3.75% 2019 | 16,135 | 16,196 |
| HCA Inc. 6.50% 2020 | 3,830 | 4,301 |
| HCA Inc. 5.00% 2024 | 3,900 | 4,017 |
| inVentiv Health Inc, Term Loan B4, 7.75% 20183,5,6 | 7,585 | 7,561 |
| inVentiv Health Inc. 9.00% 20181 | 10,775 | 11,044 |
| inVentiv Health Inc. 11.00% 20181 | 8,597 | 7,501 |
| inVentiv Health Inc. 11.00% 20181 | 3,495 | 3,067 |
| inVentiv Health Inc. 12.00% 20181,3,4 | 17,376 | 16,420 |
| Jaguar Holding Co. 9.375% 20171,3,4 | 400 | 410 |
| Kindred Healthcare Inc., Term Loan B, 4.25% 20213,5,6 | 3,437 | 3,342 |
| Kindred Healthcare, Inc. 8.00% 20201 | 5,925 | 6,325 |
| Kinetic Concepts, Inc. 10.50% 2018 | 22,795 | 24,847 |
| Kinetic Concepts, Inc. 12.50% 2019 | 15,330 | 17,016 |
| Multiplan Inc., Term Loan B, 3.75% 20213,5,6 | 13,777 | 13,424 |
| Omnicare, Inc. 4.75% 2022 | 2,155 | 2,193 |
| Omnicare, Inc. 5.00% 2024 | 515 | 530 |
| Ortho-Clinical Diagnostics Inc. 6.625% 20221 | 8,340 | 7,506 |
| Ortho-Clinical Diagnostics Inc., Term Loan B, 4.75% 20213,5,6 | 10,599 | 10,447 |
| Patheon Inc. 7.50% 20221 | 600 | 611 |
| PRA Holdings, Inc. 9.50% 20231 | 2,481 | 2,692 |
| Rotech Healthcare Inc., Term Loan A, 5.50% 20183,5,6,7 | 3,061 | 3,046 |
| Rotech Healthcare Inc., Term Loan B, 10.00% 20193,5,6,7 | 2,300 | 2,289 |
| Rotech Healthcare Inc., Term Loan, 13.00% 20203,4,5,6,7 | 4,824 | 4,800 |
| Select Medical Holdings Corp. 6.375% 2021 | 6,540 | 6,671 |
| Tenet Healthcare Corp., First Lien, 4.75% 2020 | 7,485 | 7,635 |
| Tenet Healthcare Corp., First Lien, 6.00% 2020 | 6,405 | 6,894 |
| Tenet Healthcare Corp., First Lien, 4.50% 2021 | 4,705 | 4,734 |
| VPI Escrow Corp. 6.75% 20181 | 14,755 | 15,733 |
| VPI Escrow Corp. 6.375% 20201 | 8,870 | 9,302 |
| VPI Escrow Corp. 7.50% 20211 | 500 | 542 |
| VWR Funding, Inc. 7.25% 2017 | 10,770 | 11,295 |
| 287,383 | ||
| Industrials 12.76% | ||
| AAF Holdings LLC 12.75% 20191,3,4 | 2,400 | 2,338 |
| ADT Corp. 4.125% 2019 | 7,075 | 7,022 |
| ADT Corp. 5.25% 2020 | 950 | 967 |
| AECOM Technology Corp. 5.75% 20221 | 3,570 | 3,659 |
| Altegrity, Inc. 9.50% 20191 | 12,225 | 11,644 |
| Associated Materials, LLC and AMH New Finance, Inc. 9.125% 2017 | 25,580 | 21,231 |
| B/E Aerospace, Inc., Term Loan B, 4.00% 20213,5,6 | 1,360 | 1,360 |
| Builders Firstsource 7.625% 20211 | 10,600 | 10,891 |
| CEVA Group PLC 4.00% 20181 | 6,450 | 5,644 |
| CEVA Group PLC 7.00% 20211 | 1,175 | 1,140 |
| CEVA Group PLC 9.00% 20211 | 2,275 | 2,144 |
| CEVA Group PLC, LOC, 6.50% 20213,5,6 | 2,140 | 2,011 |
| Bonds, notes & other debt instruments Corporate bonds & notes (continued) Industrials (continued) | Principal amount (000) | Value (000) |
| CEVA Group PLC, Term Loan B, 6.50% 20213,5,6 | $3,090 | $2,904 |
| CEVA Group PLC, Term Loan, 6.50% 20213,5,6 | 2,240 | 2,105 |
| CEVA Group PLC, Term Loan, 6.50% 20213,5,6 | 386 | 363 |
| Continental Airlines, Inc., Series 2001-1, Class B, 7.373% 20175 | 249 | 261 |
| Continental Airlines, Inc., Series 1998-1, Class B, 6.748% 20185 | 114 | 121 |
| Continental Airlines, Inc., Series 1997-4B, Class B, 6.90% 20185 | 10 | 10 |
| Continental Airlines, Inc., Series 2000-2, Class B, 8.307% 20195 | 113 | 123 |
| Continental Airlines, Inc., Series 1999-1, Class A, 6.545% 20205 | 326 | 361 |
| Continental Airlines, Inc., Series 2000-1, Class B, 8.388% 20225 | 80 | 82 |
| DAE Aviation Holdings, Inc. and Standard Aero Ltd., Term Loan B-1, 5.00% 20183,5,6 | 1,164 | 1,161 |
| DAE Aviation Holdings, Inc. and Standard Aero Ltd., Term Loan B-2, 5.00% 20183,5,6 | 511 | 510 |
| Esterline Technologies Corp. 7.00% 2020 | 4,000 | 4,220 |
| Euramax International, Inc. 9.50% 2016 | 10,390 | 9,715 |
| Far East Capital Limited SA 8.75% 20201 | 1,335 | 554 |
| Gardner Denver, Inc. Term Loan B, 4.25% 20203,5,6 | 6,063 | 5,698 |
| Gates Global LLC 6.00% 20221 | 5,875 | 5,656 |
| Gates Global LLC, Term Loan B, 4.25% 20213,5,6 | 424 | 413 |
| Hardwoods Acquisition Inc 7.50% 20211 | 7,525 | 7,450 |
| Hawker Beechcraft Acquisition Co., LLC, LOC, 0.008% 20153,5,6,7 | 382 | 363 |
| HD Supply, Inc. 7.50% 2020 | 1,975 | 2,079 |
| HD Supply, Inc. 11.50% 2020 | 7,130 | 8,199 |
| HD Supply, Inc. 5.25% 20211 | 4,125 | 4,207 |
| HDTFS Inc. 4.25% 2018 | 325 | 325 |
| HDTFS Inc. 5.875% 2020 | 875 | 886 |
| HDTFS Inc. 6.25% 2022 | 2,800 | 2,842 |
| Jeld-Wen Escrow Corp., Term Loan B, 5.25% 20213,5,6 | 7,850 | 7,814 |
| KLX Inc. 5.875% 20221 | 5,895 | 5,969 |
| LMI Aerospace Inc. 7.375% 20191 | 3,025 | 2,964 |
| Navios Maritime Acquisition Corp. and Navios Acquisition Finance (US) Inc. 8.125% 20211 | 7,500 | 7,350 |
| Navios Maritime Holdings Inc. 7.375% 20221 | 5,325 | 4,952 |
| Navios Maritime Holdings Inc. and Navios Maritime Finance II (US) Inc. 8.125% 2019 | 5,920 | 5,239 |
| Nielsen Finance LLC and Nielsen Finance Co. 4.50% 2020 | 7,000 | 7,070 |
| Nielsen Finance LLC and Nielsen Finance Co. 5.50% 20211 | 5,755 | 5,899 |
| Nielsen Finance LLC and Nielsen Finance Co. 5.00% 20221 | 550 | 556 |
| Nortek Inc. 10.00% 2018 | 7,460 | 7,852 |
| Nortek Inc. 8.50% 2021 | 7,610 | 8,181 |
| Ply Gem Industries, Inc. 6.50% 2022 | 16,450 | 15,525 |
| Ply Gem Industries, Inc. 6.50% 20221 | 4,800 | 4,488 |
| R.R. Donnelley & Sons Co. 7.25% 2018 | 3,554 | 3,945 |
| R.R. Donnelley & Sons Co. 7.875% 2021 | 5,525 | 6,133 |
| R.R. Donnelley & Sons Co. 7.00% 2022 | 1,500 | 1,616 |
| R.R. Donnelley & Sons Co. 6.50% 2023 | 5,525 | 5,691 |
| Silver II Borrower S.C.A./Silver II U.S. Holdings, LLC 7.75% 20201 | 7,775 | 7,386 |
| TRAC Intermodal 11.00% 2019 | 1,500 | 1,628 |
| United Air Lines, Inc., Series 2007-1, Class B, 7.336% 20211,5 | 21 | 22 |
| United Rentals, Inc. 7.375% 2020 | 1,275 | 1,383 |
| United Rentals, Inc. 7.625% 2022 | 2,525 | 2,789 |
| US Investigations Services, Inc. 13.00% 20201,4 | 4,705 | 2,093 |
| US Investigations Services, Inc. 14.00% 20201,4,5 | 491 | 218 |
| US Investigations Services, Inc. 15.00% 20211,4 | 1,424 | 426 |
| Virgin Australia Holdings Ltd. 8.50% 20191 | 2,125 | 2,160 |
| Watco Companies 6.375% 20231 | 395 | 393 |
| 250,401 |
| Bonds, notes & other debt instruments Corporate bonds & notes (continued) Consumer discretionary 12.52% | Principal amount (000) | Value (000) |
| Academy Sports 9.25% 20191 | $2,500 | $2,638 |
| Boyd Gaming Corp. 9.125% 2018 | 9,190 | 9,466 |
| Boyd Gaming Corp. 9.00% 2020 | 11,000 | 11,316 |
| Burger King Corp. 6.00% 20221 | 4,975 | 5,124 |
| CEC Entertainment, Inc. 8.00% 2022 | 2,850 | 2,779 |
| Cedar Fair, LP 5.375% 20241 | 175 | 174 |
| Cequel Communications Holdings I, LLC and Cequel Capital Corp. 6.375% 20201 | 13,400 | 13,936 |
| Charter Communications Operating, LLC and Charter Communications Operating Capital Corp. 5.50% 2022 | 12,625 | 12,846 |
| Clear Channel Worldwide Holdings, Inc. 7.625% 2020 | 2,800 | 2,961 |
| Cooper-Standard Holdings Inc., Term Loan B, 4.00% 20213,5,6 | 2,711 | 2,683 |
| Cumulus Media Holdings Inc. 7.75% 2019 | 5,960 | 6,042 |
| Cumulus Media Inc., Term Loan B, 4.25% 20203,5,6 | 1,368 | 1,326 |
| Delta 2 (Formula One), Term Loan B, 4.75% 20213,5,6 | 300 | 294 |
| Delta 2 (Formula One), Term Loan B, 7.75% 20223,5,6 | 5,500 | 5,369 |
| DISH DBS Corp. 4.25% 2018 | 18,675 | 19,119 |
| DISH DBS Corp. 7.875% 2019 | 700 | 796 |
| DISH DBS Corp. 5.125% 2020 | 6,250 | 6,312 |
| Gannett Co., Inc. 5.125% 2019 | 915 | 940 |
| Gannett Co., Inc. 4.875% 20211 | 1,535 | 1,527 |
| Gannett Co., Inc. 6.375% 2023 | 7,530 | 8,019 |
| General Motors Co. 4.00% 2025 | 465 | 467 |
| General Motors Co. 5.00% 2035 | 5,815 | 6,074 |
| General Motors Financial Co. 3.00% 2017 | 1,360 | 1,377 |
| General Motors Financial Co. 3.25% 2018 | 800 | 803 |
| Hilton Worldwide Finance LLC 5.625% 2021 | 1,025 | 1,076 |
| Jaguar Land Rover PLC 4.25% 20191 | 1,410 | 1,428 |
| La Quinta Properties, Inc., First Lien Term Loan B, 4.00% 20213,5,6 | 903 | 893 |
| Limited Brands, Inc. 6.625% 2021 | 875 | 989 |
| McClatchy Co. 9.00% 2022 | 3,275 | 3,582 |
| Mediacom Broadband LLC and Mediacom Broadband Corp. 5.50% 2021 | 2,500 | 2,522 |
| Mediacom Broadband LLC and Mediacom Broadband Corp. 6.375% 2023 | 3,400 | 3,502 |
| MGM Resorts International 8.625% 2019 | 5,400 | 6,149 |
| MGM Resorts International 7.75% 2022 | 750 | 833 |
| MGM Resorts International 6.00% 2023 | 2,000 | 2,020 |
| Michaels Stores, Inc. 7.50% 20181,3,4 | 565 | 578 |
| Michaels Stores, Inc. 5.875% 20201 | 850 | 863 |
| NBC Universal Enterprise, Inc. 5.25% (undated)1 | 835 | 870 |
| NCL Corp. Ltd. 5.25% 20191 | 1,625 | 1,645 |
| Needle Merger Sub Corp. 8.125% 20191 | 6,705 | 6,269 |
| Neiman Marcus Group LTD Inc. 8.00% 20211 | 8,050 | 8,553 |
| Neiman Marcus Group LTD Inc. 8.75% 20211,3,4 | 5,145 | 5,479 |
| Neiman Marcus, Term Loan B, 4.25% 20203,5,6 | 1,485 | 1,457 |
| PETCO Animal Supplies, Inc. 9.25% 20181 | 6,875 | 7,219 |
| Pinnacle Entertainment, Inc. 6.375% 2021 | 1,450 | 1,501 |
| Playa Resorts Holding BV 8.00% 20201 | 5,225 | 5,238 |
| Playa Resorts Holding BV, Term Loan B, 4.00% 20193,5,6 | 889 | 875 |
| Revel Entertainment, Term Loan B, 10.00% 20152,3,4,5,6,7 | 2,239 | — |
| Revel Entertainment, Term Loan B, 14.50% 20182,3,4,5,6,7 | 11,915 | — |
| Sally Holdings LLC and Sally Capital Inc. 6.875% 2019 | 1,525 | 1,628 |
| Schaeffler Holding Finance BV 6.875% 20183,4 | €3,800 | 4,794 |
| Schaeffler Holding Finance BV 7.625% 20181,3,4 | $2,300 | 2,409 |
| Six Flags Entertainment Corp. 5.25% 20211 | 1,000 | 1,005 |
| Stackpole Intl. 7.75% 20211 | 1,595 | 1,603 |
| Standard Pacific Corp. 5.875 2024 | 1,550 | 1,558 |
| Bonds, notes & other debt instruments Corporate bonds & notes (continued) Consumer discretionary (continued) | Principal amount (000) | Value (000) |
| Time Inc. 5.75% 20221 | $5,475 | $5,311 |
| Time Inc., Term Loan B, 4.25% 20213,5,6 | 6,318 | 6,271 |
| Univision Communications Inc. 8.50% 20211 | 4,570 | 4,890 |
| Univision Communications Inc., Term Loan C3, 4.00% 20203,5,6 | 441 | 433 |
| Univision Communications Inc., Term Loan D, 4.00% 20203,5,6 | 249 | 244 |
| VTR Finance BV 6.875% 20241 | 1,525 | 1,559 |
| Warner Music Group 13.75% 2019 | 1,275 | 1,460 |
| Warner Music Group 5.625% 20221 | 12,500 | 12,156 |
| Warner Music Group 6.75% 20221 | 7,450 | 6,817 |
| Wynn Macau, Ltd. 5.25% 20211 | 8,125 | 7,678 |
| 245,745 | ||
| Energy 9.50% | ||
| Alpha Natural Resources, Inc. 9.75% 2018 | 5,550 | 2,525 |
| Alpha Natural Resources, Inc. 6.00% 2019 | 2,067 | 661 |
| Alpha Natural Resources, Inc. 7.50% 20201 | 6,125 | 3,874 |
| Alpha Natural Resources, Inc. 6.25% 2021 | 3,775 | 1,170 |
| American Energy (Marcellus), Term Loan B, 5.25% 20203,5,6 | 4,725 | 4,182 |
| American Energy (Marcellus), Term Loan A, 8.50% 20213,5,6 | 4,775 | 4,095 |
| American Energy (Permian Basin) 7.125% 20201 | 5,025 | 3,744 |
| American Energy (Permian Basin) 7.375% 20211 | 4,600 | 3,404 |
| American Energy (Woodford LLC), 9.00% 20221 | 6,625 | 4,306 |
| Arch Coal, Inc. 7.00% 2019 | 7,720 | 2,355 |
| Arch Coal, Inc. 8.00% 20191 | 825 | 462 |
| Arch Coal, Inc. 9.875% 2019 | 525 | 181 |
| Arch Coal, Inc. 7.25% 2021 | 4,975 | 1,474 |
| Arch Coal, Inc., Term Loan B1, 6.25% 20183,5,6 | 5,801 | 4,823 |
| Blue Racer Midstream LLC / Blue Racer Finance Corp. 6.125% 20221 | 5,305 | 5,133 |
| Bonanza Creek Energy, Inc. 6.75% 2021 | 850 | 752 |
| CONSOL Energy Inc. 8.25% 2020 | 6,500 | 6,768 |
| CONSOL Energy Inc. 5.875% 20221 | 750 | 701 |
| Denbury Resources Inc. 4.625% 2023 | 1,550 | 1,352 |
| Ecopetrol SA 5.875% 2023 | 1,450 | 1,539 |
| Jupiter Resources Inc. 8.50% 20221 | 4,900 | 3,712 |
| Laredo Petroleum, Inc. 9.50% 2019 | 6,825 | 6,825 |
| Laredo Petroleum, Inc. 7.375% 2022 | 2,000 | 1,880 |
| NGL Energy Partners LP 6.875% 20211 | 6,100 | 6,039 |
| NGPL PipeCo LLC 7.119% 20171 | 6,715 | 6,631 |
| NGPL PipeCo LLC 9.625% 20191 | 16,825 | 16,951 |
| NGPL PipeCo LLC, Term Loan B, 6.75% 20173,5,6 | 1,787 | 1,728 |
| Oasis Petroleum Inc. 6.875% 2022 | 2,900 | 2,654 |
| Odebrecht Offshore Drilling Finance Ltd., First Lien, 6.625% 20231,5 | 1,636 | 1,472 |
| PDC Energy Inc. 7.75% 2022 | 8,025 | 7,664 |
| Peabody Energy Corp. 7.375% 2016 | 450 | 465 |
| Peabody Energy Corp. 6.00% 2018 | 21,470 | 19,591 |
| Peabody Energy Corp. 6.25% 2021 | 6,220 | 5,341 |
| Petrobras International Finance Co. 5.75% 2020 | 590 | 571 |
| QGOG Constellation SA 6.25% 20191 | 6,105 | 3,861 |
| Regency Energy Partners LP and Regency Energy Finance Corp. 5.50% 2023 | 4,175 | 4,050 |
| Rice Energy Inc. 6.25% 20221 | 9,100 | 8,509 |
| Sabine Pass Liquefaction, LLC 5.625% 2021 | 5,900 | 5,826 |
| Sabine Pass Liquefaction, LLC 5.75% 2024 | 8,925 | 8,802 |
| Samson Investment Co. 9.75% 2020 | 13,115 | 5,500 |
| Samson Investment Co., Term Loan B, 5.00% 20183,5,6 | 150 | 119 |
| Bonds, notes & other debt instruments Corporate bonds & notes (continued) Energy (continued) | Principal amount (000) | Value (000) |
| Targa Resources Corp. 4.125% 20191 | $2,200 | $2,129 |
| Teekay Corp. 8.50% 2020 | 8,543 | 9,544 |
| Tesoro Logistics LP 5.50% 20191 | 1,225 | 1,219 |
| Tesoro Logistics LP 6.25% 20221 | 1,850 | 1,855 |
| 186,439 | ||
| Materials 8.37% | ||
| ArcelorMittal 10.35% 20193 | 500 | 606 |
| ArcelorMittal 6.00% 20213 | 1,760 | 1,837 |
| ArcelorMittal 7.25% 20413 | 9,960 | 10,109 |
| Ball Corp. 5.75% 2021 | 835 | 879 |
| CEMEX Finance LLC 9.375% 20221 | 4,690 | 5,253 |
| First Quantum Minerals Ltd. 6.75% 20201 | 16,543 | 15,054 |
| First Quantum Minerals Ltd. 7.00% 20211 | 17,343 | 15,695 |
| First Quantum Minerals Ltd. 7.25% 20221 | 1,275 | 1,151 |
| FMG Resources 6.00% 20171 | 25,865 | 24,814 |
| FMG Resources 6.875% 20181,5 | 5,216 | 4,746 |
| FMG Resources 8.25% 20191 | 750 | 685 |
| Georgia Gulf Corp. 4.625% 2021 | 1,350 | 1,284 |
| Georgia Gulf Corp. 4.875% 2023 | 800 | 758 |
| JMC Steel Group Inc. 8.25% 20181 | 17,250 | 16,452 |
| LSB Industries, Inc. 7.75% 2019 | 5,275 | 5,512 |
| Mirabela Nickel Ltd. 1.00% 20441,4,7 | 53 | 54 |
| Owens-Illinois, Inc. 5.00% 20221 | 560 | 572 |
| Owens-Illinois, Inc. 5.375% 20251 | 420 | 425 |
| Packaging Dynamics Corp. 8.75% 20161 | 1,968 | 1,978 |
| Rayonier Advanced Materials Inc. 5.50% 20241 | 1,080 | 892 |
| Reynolds Group Inc. 7.125% 2019 | 740 | 767 |
| Reynolds Group Inc. 7.875% 2019 | 355 | 375 |
| Reynolds Group Inc. 9.875% 2019 | 4,820 | 5,133 |
| Reynolds Group Inc. 5.75% 2020 | 29,965 | 30,864 |
| Ryerson Inc. 9.00% 2017 | 1,525 | 1,571 |
| Ryerson Inc. 11.25% 2018 | 1,300 | 1,391 |
| Solenis, Term Loan, 7.75% 20223,5,6 | 640 | 626 |
| Tembec Industries Inc. 9.00% 20191 | 2,300 | 2,268 |
| U.S. Coatings Acquisition Inc. (Flash Dutch 2 BV) 7.375% 20211 | 2,945 | 3,137 |
| U.S. Coatings Acquisition Inc. (Flash Dutch 2 BV), Term Loan B, 3.75% 20203,5,6 | 1,253 | 1,224 |
| Walter Energy, Inc. 9.50% 20191 | 10,550 | 8,071 |
| 164,183 | ||
| Information technology 7.57% | ||
| Alcatel-Lucent USA Inc. 4.625% 20171 | 9,650 | 9,795 |
| Alcatel-Lucent USA Inc. 6.75% 20201 | 5,880 | 6,236 |
| Alcatel-Lucent USA Inc. 8.875% 20201 | 10,090 | 11,023 |
| First Data Corp. 8.25% 20211 | 5,123 | 5,507 |
| First Data Corp. 11.75% 2021 | 17,195 | 19,817 |
| First Data Corp. 12.625% 2021 | 10,804 | 12,857 |
| First Data Corp. 8.75% 20221,3,4 | 935 | 1,010 |
| Freescale Semiconductor, Inc. 5.00% 20211 | 9,000 | 9,045 |
| Freescale Semiconductor, Inc. 6.00% 20221 | 14,575 | 15,267 |
| Freescale Semiconductor, Inc., Term Loan B4, 4.25% 20203,5,6 | 5,433 | 5,311 |
| Lawson Software, Inc. 9.375% 2019 | 3,000 | 3,221 |
| NXP BV and NXP Funding LLC 3.75% 20181 | 9,900 | 9,950 |
| Serena Software, Inc. Term Loan B 7.50% 20203,5,6 | 4,325 | 4,314 |
| Bonds, notes & other debt instruments Corporate bonds & notes (continued) Information technology (continued) | Principal amount (000) | Value (000) |
| SRA International, Inc. 11.00% 2019 | $7,835 | $8,364 |
| SRA International, Inc., Term Loan B, 6.50% 20183,5,6 | 16,913 | 16,934 |
| SunGard Data Systems Inc. 7.625% 2020 | 3,650 | 3,887 |
| TIBCO Software, Inc., Term Loan B, 6.50% 20203,5,6 | 2,325 | 2,255 |
| TIBCO Software, Inc. 11.375% 20211 | 3,925 | 3,807 |
| 148,600 | ||
| Financials 4.72% | ||
| CIT Group Inc. 4.25% 2017 | 2,500 | 2,556 |
| CIT Group Inc. 5.00% 2017 | 4,000 | 4,160 |
| CIT Group Inc. 5.25% 2018 | 1,575 | 1,646 |
| CIT Group Inc. 3.875% 2019 | 13,340 | 13,340 |
| CIT Group Inc., Series C, 5.50% 20191 | 3,800 | 4,021 |
| Citigroup Inc., Series N, junior subordinated 5.80% (undated)3 | 1,839 | 1,844 |
| Crescent Resources 10.25% 20171 | 5,445 | 5,867 |
| Goldman Sachs Group, Inc., Series L, 5.70% 20493 | 522 | 530 |
| Icahn Enterprises Finance Corp. 3.50% 2017 | 8,425 | 8,446 |
| Iron Mountain Inc. 5.75% 2024 | 3,500 | 3,539 |
| iStar Financial Inc. 4.00% 2017 | 8,300 | 8,103 |
| iStar Financial Inc., Series B, 9.00% 2017 | 2,380 | 2,612 |
| iStar Financial Inc. 4.875% 2018 | 1,925 | 1,899 |
| iStar Financial Inc. 5.00% 2019 | 9,575 | 9,336 |
| Liberty Mutual Group Inc., Series A, 7.80% 20871,3 | 1,200 | 1,410 |
| MetLife Capital Trust X, junior subordinated 9.25% 20681,3 | 300 | 430 |
| MetLife Inc., junior subordinated 10.75% 20693 | 500 | 815 |
| Ocwen Financial Corp. 6.625% 20191 | 3,325 | 3,059 |
| Popular, Inc. 7.00% 2019 | 2,315 | 2,327 |
| Realogy Corp. 4.50% 20191 | 9,950 | 9,900 |
| Realogy Corp. 7.625% 20201 | 750 | 806 |
| Realogy Corp. 5.25% 20211 | 4,150 | 4,051 |
| Realogy Corp., LOC, 4.40% 20163,5,6 | 513 | 509 |
| Royal Bank of Scotland Group PLC, junior subordinated 6.99% (undated)1,3 | 1,265 | 1,429 |
| 92,635 | ||
| Utilities 0.81% | ||
| AES Corp. 8.00% 2020 | 3,000 | 3,442 |
| AES Corp. 7.375% 2021 | 850 | 965 |
| Calpine Corp. 5.375% 2023 | 800 | 809 |
| Calpine Corp. 7.875% 20231 | 218 | 241 |
| Dynegy Finance Inc. 6.75% 20191 | 145 | 148 |
| Dynegy Finance Inc. 7.375% 20221 | 3,030 | 3,087 |
| Dynegy Finance Inc. 7.625% 20241 | 3,710 | 3,789 |
| NRG Energy, Inc. 6.25% 2022 | 1,790 | 1,839 |
| TXU, Term Loan, 4.65% 20172,3,5,6 | 2,461 | 1,594 |
| 15,914 | ||
| Consumer staples 0.46% | ||
| C&S Group Enterprises LLC 5.375% 20221 | 650 | 647 |
| Constellation Brands, Inc. 3.875% 2019 | 250 | 252 |
| Constellation Brands, Inc. 6.00% 2022 | 700 | 777 |
| Del Monte Corp. 7.625% 2019 | 5,597 | 5,513 |
| Ingles Markets, Inc. 5.75% 2023 | 475 | 478 |
| Bonds, notes & other debt instruments Corporate bonds & notes (continued) Consumer staples (continued) | Principal amount (000) | Value (000) |
| Smithfield Foods, Inc. 5.25% 20181 | $1,000 | $1,020 |
| Stater Bros. Holdings Inc., Term Loan B, 4.75% 20213,5,6 | 249 | 247 |
| 8,934 | ||
| Total corporate bonds & notes | 1,695,103 | |
| Bonds & notes of governments & government agencies outside the U.S. 2.44% | ||
| Argentina (Republic of) 7.00% 2017 | 4,145 | 3,947 |
| Ghana (Republic of) 7.875% 2023 | 2,700 | 2,511 |
| Greece Government 4.75% 2019 | €1,500 | 1,446 |
| Greek Government 2.00%/3.00% 20238 | 790 | 610 |
| Greek Government 2.00%/3.00% 20248 | 790 | 604 |
| Greek Government 2.00%/3.00% 20258 | 790 | 571 |
| Greek Government 2.00%/3.00% 20268 | 790 | 547 |
| Greek Government 2.00%/3.00% 20278 | 790 | 532 |
| Greek Government 2.00%/3.00% 20288 | 790 | 516 |
| Greek Government 2.00%/3.00% 20298 | 790 | 513 |
| Greek Government 2.00%/3.00% 20308 | 790 | 506 |
| Greek Government 2.00%/3.00% 20318 | 790 | 502 |
| Greek Government 2.00%/3.00% 20328 | 790 | 495 |
| Greek Government 2.00%/3.00% 20338 | 790 | 494 |
| Greek Government 2.00%/3.00% 20348 | 790 | 489 |
| Greek Government 2.00%/3.00% 20358 | 790 | 487 |
| Greek Government 2.00%/3.00% 20368 | 790 | 483 |
| Greek Government 2.00%/3.00% 20378 | 790 | 478 |
| Greek Government 2.00%/3.00% 20388 | 790 | 481 |
| Greek Government 2.00%/3.00% 20398 | 790 | 482 |
| Greek Government 2.00%/3.00% 20408 | 790 | 482 |
| Greek Government 2.00%/3.00% 20418 | 790 | 483 |
| Greek Government 2.00%/3.00% 20428 | 790 | 485 |
| Hungarian Government 6.25% 2020 | $850 | 959 |
| Hungarian Government 6.375% 2021 | 1,000 | 1,148 |
| India (Republic of) 8.83% 2023 | INR440,000 | 7,342 |
| Indonesia (Republic of) 8.375% 2034 | IDR37,600,000 | 3,075 |
| Kenya (Republic of) 6.875% 2024 | $2,500 | 2,631 |
| Portuguese Government 5.65% 2024 | €1,450 | 2,177 |
| Republic of Senegal 6.25% 2024 | $1,400 | 1,341 |
| Slovenia (Republic of) 5.85% 20231 | 2,595 | 2,947 |
| South Africa (Republic of), Series R-2023, 7.75% 2023 | ZAR15,150 | 1,305 |
| United Mexican States Government, Series M20, 10.00% 2024 | MXN27,500 | 2,446 |
| Zambia (Republic of) 8.50% 2024 | $4,000 | 4,388 |
| 47,903 | ||
| U.S. Treasury bonds & notes 0.17% U.S. Treasury 0.17% | ||
| U.S. Treasury 0.25% 2015 | 3,275 | 3,278 |
| Total U.S. Treasury bonds & notes | 3,278 |
| Bonds, notes & other debt instruments Municipals 0.09% | Principal amount (000) | Value (000) |
| State of New Jersey, Econ. Dev. Auth., Energy Fac. Rev. Bonds (ACR Energy Partners, LLC Project), Series 2011-B, 12.00% 20301,2 | $875 | $394 |
| Territory of Puerto Rico, Public Improvement Ref. Bonds (G.O. Bonds), Series 2014-A, 8.00% 2035 | 1,500 | 1,308 |
| Territory of Puerto Rico, University of Puerto Rico, University System Rev. Ref. Bonds, Series 2006-P, 5.00% 2023 | 200 | 125 |
| 1,827 | ||
| Total bonds, notes & other debt instruments (cost: $1,826,064,000) | 1,748,111 | |
| Convertible bonds 0.30% Energy 0.11% | ||
| American Energy Utica, LLC 3.50% convertible notes 20211,3,4 | 3,042 | 2,205 |
| Financials 0.10% | ||
| Bank of Ireland 10.00% convertible notes 2016 | €1,460 | 1,914 |
| Materials 0.09% | ||
| Mirabela Nickel Ltd. 9.50% convertible notes 20191,4 | $2,144 | 1,769 |
| Total convertible bonds (cost: $7,127,000) | 5,888 | |
| Convertible stocks 1.02% Utilities 0.51% | Shares | |
| Dominion Resources, Inc., convertible preferred, Series A, units | 100,000 | 5,201 |
| Exelon Corp., convertible preferred, units | 91,000 | 4,777 |
| 9,978 | ||
| Industrials 0.33% | ||
| CEVA Group PLC, Series A-1, 3.253% convertible preferred7 | 4,788 | 4,788 |
| CEVA Group PLC, Series A-2, 2.253% convertible preferred7,9 | 2,211 | 1,714 |
| 6,502 | ||
| Financials 0.18% | ||
| Weyerhaeuser Co., Series A, 6.375% convertible preferred | 60,000 | 3,462 |
| Total convertible stocks (cost: $19,628,000) | 19,942 | |
| Preferred securities 0.04% Financials 0.04% | ||
| Citigroup Inc., Series K, depositary shares | 30,010 | 798 |
| Total preferred securities (cost: $751,000) | 798 | |
| Common stocks 0.80% Consumer discretionary 0.33% | ||
| Cooper-Standard Holdings Inc.10 | 110,446 | 6,393 |
| Adelphia Recovery Trust, Series Arahova10 | 388,601 | 4 |
| Adelphia Recovery Trust, Series ACC-110 | 449,306 | 1 |
| Adelphia Recovery Trust, Series ACC-6B7,10 | 1,000,000 | — |
| Common stocks Consumer discretionary (continued) | Shares | Value (000) |
| Five Star Travel Corp.1,7,10 | 7,285 | $1 |
| Revel AC, Inc. (CVR)7,9,10 | 13,372,726 | — |
| Revel AC, Inc.7,9,10 | 125,906 | — |
| 6,399 | ||
| Industrials 0.22% | ||
| CEVA Group PLC1,7,10 | 5,622 | 4,357 |
| Quad/Graphics, Inc., Class A | 525 | 12 |
| Atrium Corp.1,7,10 | 361 | 1 |
| 4,370 | ||
| Health care 0.17% | ||
| Rotech Healthcare Inc.7,10 | 201,793 | 3,404 |
| Materials 0.08% | ||
| NewPage Holdings Inc.9 | 16,880 | 1,477 |
| Mirabela Nickel Ltd.7,10 | 6,645,429 | 157 |
| 1,634 | ||
| Total common stocks (cost: $25,260,000) | 15,807 | |
| Short-term securities 5.26% | Principal amount (000) | |
| Abbott Laboratories 0.11% due 2/26/20151 | $35,000 | 34,994 |
| Chevron Corp. 0.12% due 3/11/20151 | 34,700 | 34,689 |
| Federal Home Loan Bank 0.13% due 4/9/2015 | 7,500 | 7,499 |
| General Electric Co. 0.10% due 1/2/2015 | 26,000 | 26,000 |
| Total short-term securities (cost: $103,183,000) | 103,182 | |
| Total investment securities 96.50% (cost: $1,982,013,000) | 1,893,728 | |
| Other assets less liabilities 3.50% | 68,748 | |
| Net assets 100.00% | $1,962,476 |
| 1 | Acquired in a transaction exempt from registration under Rule 144A or Section 4(2) of the Securities Act of 1933. May be resold in the U.S. in transactions exempt from registration, normally to qualified institutional buyers. The total value of all such securities was $797,716,000, which represented 40.65% of the net assets of the fund. |
| 2 | Scheduled interest and/or principal payment was not received. |
| 3 | Coupon rate may change periodically. |
| 4 | Payment in kind; the issuer has the option of paying additional securities in lieu of cash. |
| 5 | Principal payments may be made periodically. Therefore, the effective maturity date may be earlier than the stated maturity date. |
| 6 | Loan participations and assignments; may be subject to legal or contractual restrictions on resale. The total value of all such loans was $137,417,000, which represented .07% of the net assets of the fund. |
| 7 | Valued under fair value procedures adopted by authority of the board of trustees. The total value of all such securities, was $24,973,000, which represented 1.27% of the net assets of the fund. |
| 8 | Step bond; coupon rate will increase at a later date. |
| 9 | Acquired through a private placement transaction exempt from registration under the Securities Act of 1933. May be subject to legal or contractual restrictions on resale. Further details on these holdings appear below. |
| 10 | Security did not produce income during the last 12 months. |
| Private placement securities | Acquisition date(s) | Cost (000) | Value (000) | Percent of net assets |
| CEVA Group PLC, Series A-2, 2.253% convertible preferred | 3/10/2010-1/23/2012 | $2,214 | $1,714 | .09% |
| NewPage Holdings Inc. | 9/17/2009-7/24/2014 | 1,368 | 1,477 | .08 |
| Revel AC, Inc. | 2/14/2011-12/13/2011 | 6,279 | — | .00 |
| Revel AC, Inc. (CVR) | 2/15/2011-3/15/2013 | 2,419 | — | .00 |
| Liberman Broadcasting, Inc., warrants, expire 2022 | 12/31/2012 | — | — | .00 |
| Total private placement securities | $12,280 | $3,191 | .17% |
| Key to abbreviations and symbols |
| Auth. = Authority |
| CVR = Contingent Value Rights |
| Dev. = Development |
| Econ. = Economic |
| € = Euros |
| Fac. = Facility |
| G.O. = General Obligation |
| IDR = Indonesian rupiah |
| INR = Indian rupees |
| LOC = Letter of credit |
| MXN = Mexican pesos |
| Ref. = Refunding |
| Rev. = Revenue |
| ZAR = South African rand |
| Bonds, notes & other debt instruments 98.55% Mortgage-backed obligations 54.01% Federal agency mortgage-backed obligations 44.25% | Principal amount (000) | Value (000) |
| Fannie Mae 5.00% 20361 | $540 | $586 |
| Fannie Mae 3.50% 20451,2 | 49,979 | 52,078 |
| Fannie Mae 3.50% 20451,2 | 5,000 | 5,196 |
| Fannie Mae 4.50% 20451,2 | 7,500 | 8,141 |
| FDIC Structured Sale Guaranteed Notes, Series 2010-S1, Class 1-A, 0.704% 20481,3,4 | 354 | 354 |
| Freddie Mac 5.00% 20341 | 3,267 | 3,608 |
| Freddie Mac 3.50% 20451,2 | 6,000 | 6,236 |
| Government National Mortgage Assn. 3.75% 20341 | 1,541 | 1,617 |
| Government National Mortgage Assn. 3.75% 20381 | 1,102 | 1,149 |
| Government National Mortgage Assn. 3.75% 20391 | 1,132 | 1,185 |
| Government National Mortgage Assn. 4.00% 20391 | 789 | 824 |
| Government National Mortgage Assn. 6.00% 20391 | 704 | 801 |
| Government National Mortgage Assn. 4.00% 20401 | 425 | 444 |
| Government National Mortgage Assn. 5.50% 20401 | 5,246 | 5,920 |
| Government National Mortgage Assn. 4.50% 20411 | 199 | 212 |
| Government National Mortgage Assn. 5.00% 20411 | 2,628 | 2,882 |
| Government National Mortgage Assn. 5.00% 20411 | 1,499 | 1,598 |
| Government National Mortgage Assn. 6.50% 20411 | 1,958 | 2,149 |
| Government National Mortgage Assn. 3.50% 20421 | 1,036 | 1,063 |
| Government National Mortgage Assn. 3.50% 20421 | 605 | 618 |
| Government National Mortgage Assn. 3.50% 20421 | 543 | 570 |
| Government National Mortgage Assn. 4.00% 20421 | 137 | 143 |
| Government National Mortgage Assn. 3.50% 20431 | 2,971 | 3,122 |
| Government National Mortgage Assn. 3.50% 20431 | 2,830 | 2,978 |
| Government National Mortgage Assn. 3.50% 20431 | 2,649 | 2,786 |
| Government National Mortgage Assn. 3.50% 20431 | 2,313 | 2,434 |
| Government National Mortgage Assn. 3.50% 20431 | 2,053 | 2,157 |
| Government National Mortgage Assn. 3.50% 20431 | 558 | 571 |
| Government National Mortgage Assn. 3.50% 20431 | 334 | 352 |
| Government National Mortgage Assn. 3.75% 20441 | 1,465 | 1,558 |
| Government National Mortgage Assn. 4.00% 20441 | 14,615 | 15,703 |
| Government National Mortgage Assn. 4.00% 20441 | 10,000 | 10,740 |
| Government National Mortgage Assn. 4.00% 20441 | 2,562 | 2,749 |
| Government National Mortgage Assn. 4.25% 20441 | 2,366 | 2,569 |
| Vendee Mortgage Trust, Series 2011-2, Class V, 3.75% 20281 | 5,596 | 5,822 |
| Vendee Mortgage Trust, Series 2010-1, Class DA, 4.25% 20351 | 1,548 | 1,654 |
| 152,569 | ||
| Commercial mortgage-backed securities 9.76% | ||
| Banc of America Commercial Mortgage Inc., Series 2006-1, Class A1A, 5.378% 20451,4 | 923 | 954 |
| Bear Stearns Commercial Mortgage Securities Trust, Series 2006-PW14, Class A1A, 5.189% 20381 | 920 | 976 |
| Bear Stearns Commercial Mortgage Securities Trust, Series 2007-PW16, Class A1A, 5.897% 20401,4 | 576 | 628 |
| Bear Stearns Commercial Mortgage Securities Trust, Series 2007-T28, Class A-1A, 5.71% 20421,4 | 360 | 392 |
| Citigroup Commercial Mortgage Trust, Series 2006-C5, Class A1A, 5.425% 20491 | 1,473 | 1,562 |
| Commercial Mortgage Trust, Series 2006-C8, Class A1A, 5.292% 20461 | 809 | 865 |
| Bonds, notes & other debt instruments Mortgage-backed obligations (continued) Commercial mortgage-backed securities (continued) | Principal amount (000) | Value (000) |
| CS First Boston Mortgage Securities Corp., Series 2014-ICE, Class A, 01.05% 20271,3,4 | $1,250 | $1,249 |
| CS First Boston Mortgage Securities Corp., Series 2006-C4, Class A1A, 5.46% 20391 | 4,766 | 5,027 |
| DBUBS Mortgage Trust, Series 2011-LC2A, Class A-2, 3.386% 20441,3 | 263 | 270 |
| EQTY 2014-INNS Mortgage Trust Commercial Mortgage Pass-Through Certificates, Series 2014-A, 1.003% 20311,3,4 | 985 | 986 |
| Hilton USA Trust, Series 2013-HLF-AFX, 2.662% 20301,3 | 795 | 797 |
| J.P. Morgan Chase Commercial Mortgage Securities Corp., Series 2006-CB-16, Class A1A, 5.546% 20451 | 878 | 930 |
| J.P. Morgan Chase Commercial Mortgage Securities Corp., Series 2007-LDPX, Class A-1-A, 5.439% 20491 | 4,699 | 5,029 |
| LB Commercial Mortgage Trust, Series 2007-C3, Class A-1-A, multifamily 5.858% 20441,4 | 2,757 | 3,007 |
| LB-UBS Commercial Mortgage Trust, Series 2006-C7, Class A-1-A, 5.335% 20381 | 1,402 | 1,491 |
| LB-UBS Commercial Mortgage Trust, Series 2006-C3, Class A1A, 5.641% 20391,4 | 1,207 | 1,257 |
| LB-UBS Commercial Mortgage Trust, Series 2007-C2, Class A-1-A, 5.387% 20401 | 1,497 | 1,611 |
| Merrill Lynch Mortgage Trust, Series 2006-C2, Class A1A, 5.739% 20431,4 | 1,898 | 2,009 |
| ML-CFC Commercial Mortgage Trust, Series 2006-4, Class A1A, 5.166% 20491 | 888 | 937 |
| Morgan Stanley Capital I Trust, Series 2007-TA27, Class A-1-A, 5.831% 20421,4 | 332 | 360 |
| Morgan Stanley Capital I Trust, Series 2006-IQ12, Class A1A, 5.319% 20431 | 1,721 | 1,829 |
| Wachovia Bank Commercial Mortgage Trust, Series 2006-C25, Class A1A, 5.707% 20431,4 | 1,292 | 1,347 |
| Wachovia Bank Commercial Mortgage Trust, Series 2006-C27, Class A1A, 5.749% 20451,4 | 128 | 136 |
| 33,649 | ||
| Total mortgage-backed obligations | 186,218 | |
| U.S. Treasury bonds & notes 21.56% U.S. Treasury inflation-protected securities 11.40% | ||
| U.S. Treasury Inflation-Protected Security 1.875% 20155 | 1,312 | 1,316 |
| U.S. Treasury Inflation-Protected Security 0.125% 20165 | 2,689 | 2,682 |
| U.S. Treasury Inflation-Protected Security 2.00% 20165 | 2,991 | 3,036 |
| U.S. Treasury Inflation-Protected Security 0.125% 20195 | 9,120 | 9,039 |
| U.S. Treasury Inflation-Protected Security 0.125% 20245 | 10,350 | 10,015 |
| U.S. Treasury Inflation-Protected Security 1.375% 20445 | 11,576 | 13,231 |
| 39,319 | ||
| U.S. Treasury 10.16% | ||
| U.S. Treasury 1.50% 2019 | 5,000 | 4,968 |
| U.S. Treasury 1.50% 2019 | 1,500 | 1,491 |
| U.S. Treasury 1.625% 20196 | 24,000 | 24,064 |
| U.S. Treasury 1.625% 2019 | 2,000 | 2,002 |
| U.S. Treasury 1.75% 2019 | 2,500 | 2,514 |
| 35,039 | ||
| Total U.S. Treasury bonds & notes | 74,358 | |
| Federal agency bonds & notes 17.17% | ||
| Fannie Mae 1.75% 2019 | 21,900 | 21,957 |
| Federal Home Loan Bank 0.50% 2016 | 13,285 | 13,257 |
| Federal Home Loan Bank 2.00% 2016 | 2,215 | 2,265 |
| Freddie Mac 0.875% 2017 | 8,200 | 8,223 |
| Freddie Mac, Series K031, Class A2, multifamily 3.30% 20231,4 | 4,722 | 4,969 |
| Freddie Mac, Series K032, Class A2, multifamily 3.31% 20231,4 | 1,250 | 1,316 |
| United States Agency for International Development, Jordan (Kingdom of) 2.503% 2020 | 7,000 | 7,210 |
| 59,197 |
| Bonds, notes & other debt instruments Asset-backed obligations 5.81% | Principal amount (000) | Value (000) |
| AmeriCredit Automobile Receivables Trust, Series 2014-4, Class A-2-A, 0.72% 20181 | $1,655 | $1,655 |
| AmeriCredit Automobile Receivables Trust, Series 2013-4, Class B, 1.66% 20181 | 2,000 | 2,011 |
| AmeriCredit Automobile Receivables Trust, Series 2012-5, Class C, 1.69% 20181 | 382 | 383 |
| Flagstar Home Equity Loan Trust, Series 2006-2A, Class A, FSA insured, 0.315% 20191,3,4 | 2,882 | 2,803 |
| Santander Drive Auto Receivables Trust, Series 2012-2, Class C, 3.20% 20151 | 2,000 | 2,022 |
| Santander Drive Auto Receivables Trust, Series 2012-4, Class C, 2.94% 20161 | 3,250 | 3,295 |
| Santander Drive Auto Receivables Trust, Series 2013-3, Class B, 1.19% 20181 | 1,445 | 1,446 |
| Santander Drive Auto Receivables Trust, Series 2013-5, Class B, 1.55% 20181 | 2,285 | 2,293 |
| Santander Drive Auto Receivables Trust, Series 2013-1, Class B, 1.16% 20191 | 4,124 | 4,137 |
| 20,045 | ||
| Total bonds, notes & other debt instruments (cost: $335,972,000) | 339,818 | |
| Short-term securities 21.69% | ||
| ExxonMobil Corp. 0.08% due 1/22/2015 | 7,200 | 7,199 |
| Fannie Mae 0.08%–0.10% due 3/2/2015–5/18/2015 | 15,100 | 15,096 |
| Federal Farm Credit Banks 0.14% due 7/15/2015 | 5,000 | 4,996 |
| Federal Home Loan Bank 0.07%–0.12% due 2/11/2015–3/13/2015 | 28,000 | 27,999 |
| General Electric Co. 0.10% due 1/2/2015 | 8,400 | 8,400 |
| John Deere Financial Ltd. 0.10% due 1/12/20153 | 3,100 | 3,100 |
| National Rural Utilities Cooperative Finance Corp. 0.11% due 1/16/2015 | 8,000 | 8,000 |
| Total short-term securities (cost: $74,786,000) | 74,790 | |
| Total investment securities 120.24% (cost: $410,758,000) | 414,608 | |
| Other assets less liabilities (20.24)% | (69,800) | |
| Net assets 100.00% | $344,808 |
| 1 | Principal payments may be made periodically. Therefore, the effective maturity date may be earlier than the stated maturity date. |
| 2 | A portion or all of the security purchased on a TBA basis. |
| 3 | Acquired in a transaction exempt from registration under Rule 144A or Section 4(2) of the Securities Act of 1933. May be resold in the U.S. in transactions exempt from registration, normally to qualified institutional buyers. The total value of all such securities was $9,559,000, which represented 2.77% of the net assets of the fund. |
| 4 | Coupon rate may change periodically. |
| 5 | Index-linked bond whose principal amount moves with a government price index. |
| 6 | A portion of this security was pledged as collateral. The total value of pledged collateral was $2,638,000, which represented .77% of the net assets of the fund. |
| Key to abbreviation |
| TBA = To be announced |
| Bonds, notes & other debt instruments 91.37% U.S. Treasury bonds & notes 50.26% U.S. Treasury 38.55% | Principal amount (000) | Value (000) |
| U.S. Treasury 1.50% 20161 | $42,150 | $42,792 |
| U.S. Treasury 2.125% 2016 | 12,850 | 13,111 |
| U.S. Treasury 4.50% 2016 | 10,100 | 10,569 |
| U.S. Treasury 0.625% 2017 | 26,000 | 25,749 |
| U.S. Treasury 0.75% 2017 | 25,750 | 25,653 |
| U.S. Treasury 0.875% 2017 | 44,400 | 44,459 |
| U.S. Treasury 2.75% 2017 | 24,000 | 25,094 |
| U.S. Treasury 1.25% 2018 | 32,425 | 32,217 |
| U.S. Treasury 1.25% 2018 | 25,975 | 25,786 |
| U.S. Treasury 1.375% 2018 | 64,000 | 64,065 |
| U.S. Treasury 1.50% 2018 | 25,700 | 25,823 |
| U.S. Treasury 1.00% 2019 | 22,500 | 21,956 |
| U.S. Treasury 1.50% 2019 | 43,775 | 43,496 |
| U.S. Treasury 1.50% 2019 | 25,775 | 25,789 |
| U.S. Treasury 1.50% 2019 | 25,330 | 25,273 |
| U.S. Treasury 1.50% 2019 | 19,350 | 19,359 |
| U.S. Treasury 1.50% 2019 | 17,125 | 17,015 |
| U.S. Treasury 1.625% 2019 | 144,450 | 144,834 |
| U.S. Treasury 1.625% 2019 | 140,000 | 140,230 |
| U.S. Treasury 1.625% 2019 | 25,825 | 25,852 |
| U.S. Treasury 1.625% 2019 | 10,515 | 10,551 |
| U.S. Treasury 1.625% 2019 | 9,625 | 9,666 |
| U.S. Treasury 1.75% 2019 | 21,175 | 21,296 |
| U.S. Treasury 3.625% 2019 | 56,500 | 61,638 |
| U.S. Treasury 1.125% 2020 | 13,350 | 12,969 |
| U.S. Treasury 1.25% 2020 | 6,250 | 6,118 |
| U.S. Treasury 1.375% 2020 | 13,200 | 12,954 |
| U.S. Treasury 2.25% 2021 | 103,575 | 105,748 |
| U.S. Treasury 1.625% 2022 | 46,698 | 45,288 |
| U.S. Treasury 1.625% 2022 | 41,728 | 40,568 |
| U.S. Treasury 1.75% 2022 | 63,000 | 61,935 |
| U.S. Treasury 1.75% 2023 | 13,375 | 13,018 |
| U.S. Treasury 2.00% 2023 | 13,264 | 13,206 |
| U.S. Treasury 2.50% 2023 | 12,500 | 12,896 |
| U.S. Treasury 2.75% 2023 | 52,000 | 54,722 |
| U.S. Treasury 6.25% 2030 | 2,980 | 4,457 |
| U.S. Treasury 2.875% 2043 | 17,225 | 17,627 |
| U.S. Treasury 3.125% 2043 | 6,425 | 6,901 |
| U.S. Treasury 3.625% 2043 | 15,850 | 18,648 |
| U.S. Treasury 3.375% 2044 | 4,675 | 5,266 |
| U.S. Treasury 3.625% 2044 | 3,875 | 4,563 |
| 1,339,157 |
| Bonds, notes & other debt instruments U.S. Treasury bonds & notes (continued) U.S. Treasury inflation-protected securities 11.71% | Principal amount (000) | Value (000) |
| U.S. Treasury Inflation-Protected Security 0.50% 20152 | $18,298 | $18,061 |
| U.S. Treasury Inflation-Protected Security 0.125% 20162 | 16,136 | 16,092 |
| U.S. Treasury Inflation-Protected Security 2.00% 20162 | 17,946 | 18,216 |
| U.S. Treasury Inflation-Protected Security 0.125% 20192 | 44,538 | 44,138 |
| U.S. Treasury Inflation-Protected Security 0.125% 20222 | 4,440 | 4,343 |
| U.S. Treasury Inflation-Protected Security 0.125% 20232 | 4,341 | 4,216 |
| U.S. Treasury Inflation-Protected Security 0.375% 20232 | 12,178 | 12,092 |
| U.S. Treasury Inflation-Protected Security 0.125% 20242 | 75,002 | 72,574 |
| U.S. Treasury Inflation-Protected Security 0.625% 20242 | 72,228 | 72,881 |
| U.S. Treasury Inflation-Protected Security 0.625% 20432 | 7,359 | 6,976 |
| U.S. Treasury Inflation-Protected Security 1.375% 20442 | 120,064 | 137,228 |
| 406,817 | ||
| Total U.S. Treasury bonds & notes | 1,745,974 | |
| Mortgage-backed obligations 23.51% Federal agency mortgage-backed obligations 23.51% | ||
| Fannie Mae 3.306% 20173 | 1,972 | 2,062 |
| Fannie Mae 2.50% 20273 | 2,257 | 2,304 |
| Fannie Mae 2.50% 20273 | 1,060 | 1,082 |
| Fannie Mae 6.50% 20283 | 396 | 452 |
| Fannie Mae 6.50% 20373 | 151 | 167 |
| Fannie Mae 7.00% 20373 | 201 | 224 |
| Fannie Mae 7.00% 20373 | 65 | 72 |
| Fannie Mae 5.50% 20383 | 608 | 680 |
| Fannie Mae 6.00% 20383 | 119 | 134 |
| Fannie Mae 2.19% 20393,4 | 1,098 | 1,171 |
| Fannie Mae 2.578% 20403,4 | 8,969 | 9,482 |
| Fannie Mae 4.186% 20403,4 | 1,018 | 1,080 |
| Fannie Mae 4.38% 20403,4 | 1,392 | 1,476 |
| Fannie Mae 4.50% 20403 | 1,136 | 1,234 |
| Fannie Mae 5.00% 20403 | 482 | 540 |
| Fannie Mae 3.076% 20413,4 | 2,668 | 2,850 |
| Fannie Mae 3.529% 20413,4 | 1,528 | 1,605 |
| Fannie Mae 4.00% 20413 | 3,479 | 3,717 |
| Fannie Mae 4.00% 20413 | 2,641 | 2,854 |
| Fannie Mae 4.50% 20413 | 2,407 | 2,615 |
| Fannie Mae 5.00% 20413 | 1,558 | 1,753 |
| Fannie Mae 5.00% 20413 | 1,186 | 1,334 |
| Fannie Mae 5.00% 20413 | 779 | 878 |
| Fannie Mae 5.00% 20413 | 487 | 548 |
| Fannie Mae 3.50% 20423 | 3,518 | 3,671 |
| Fannie Mae 3.50% 20423 | 2,914 | 3,041 |
| Fannie Mae 4.00% 20423 | 1,858 | 2,008 |
| Fannie Mae 4.00% 20423 | 479 | 518 |
| Fannie Mae 3.50% 20433 | 3,748 | 3,931 |
| Fannie Mae 4.00% 20433 | 3,798 | 4,105 |
| Fannie Mae 4.00% 20443 | 1,674 | 1,806 |
| Fannie Mae 4.00% 20443 | 788 | 852 |
| Fannie Mae 3.50% 20453,5 | 114,850 | 119,674 |
| Fannie Mae 4.50% 20453,5 | 118,880 | 128,810 |
| Fannie Mae 4.50% 20453,5 | 73,420 | 79,691 |
| Fannie Mae 5.00% 20453,5 | 18,160 | 20,064 |
| Fannie Mae, Series 2001-4, Class GA, 9.437% 20253,4 | 4 | 4 |
| Bonds, notes & other debt instruments Mortgage-backed obligations (continued) Federal agency mortgage-backed obligations (continued) | Principal amount (000) | Value (000) |
| Fannie Mae, Series 2001-4, Class NA, 10.005% 20253,4 | $12 | $13 |
| Fannie Mae, Series 2006-56, Class OG, principal only, 0% 20363 | 335 | 308 |
| Fannie Mae, Series 2007-33, Class HE, 5.50% 20373 | 717 | 789 |
| Fannie Mae, Series 2007-40, Class PT, 5.50% 20373 | 343 | 380 |
| Fannie Mae, Series 2001-T10, Class A-1, 7.00% 20413 | 119 | 139 |
| FDIC Structured Sale Guaranteed Notes, Series 2010-S1, Class 1-A, 0.704% 20483,4,6 | 177 | 177 |
| Freddie Mac 5.50% 20243 | 1,503 | 1,642 |
| Freddie Mac 6.00% 20263 | 304 | 345 |
| Freddie Mac 2.375% 20363,4 | 624 | 669 |
| Freddie Mac 2.113% 20373,4 | 113 | 120 |
| Freddie Mac 5.50% 20373 | 37 | 42 |
| Freddie Mac 4.846% 20383,4 | 609 | 653 |
| Freddie Mac 5.50% 20383 | 2,431 | 2,719 |
| Freddie Mac 5.50% 20383 | 125 | 140 |
| Freddie Mac 5.00% 20403 | 2,362 | 2,615 |
| Freddie Mac 3.249% 20413,4 | 5,887 | 6,247 |
| Freddie Mac 3.401% 20413,4 | 1,630 | 1,717 |
| Freddie Mac 5.00% 20413 | 3,712 | 4,172 |
| Freddie Mac 5.00% 20413 | 1,830 | 2,051 |
| Freddie Mac 2.582% 20423,4 | 1,357 | 1,393 |
| Freddie Mac 2.078% 20433,4 | 1,107 | 1,135 |
| Freddie Mac 4.00% 20433 | 18,797 | 20,184 |
| Freddie Mac 4.00% 20433 | 3,899 | 4,194 |
| Freddie Mac 4.00% 20433 | 1,414 | 1,523 |
| Freddie Mac 4.00% 20433 | 723 | 778 |
| Freddie Mac 4.00% 20433 | 696 | 750 |
| Freddie Mac 4.00% 20433 | 559 | 603 |
| Freddie Mac 3.128% 20443,4 | 839 | 868 |
| Freddie Mac 4.00% 20443 | 36,092 | 38,749 |
| Freddie Mac 4.00% 20443 | 578 | 624 |
| Freddie Mac 4.00% 20433,5 | 19,475 | 20,698 |
| Freddie Mac 4.50% 20453,5 | 30,000 | 32,514 |
| Freddie Mac, Series 2356, Class GD, 6.00% 20163 | 105 | 108 |
| Freddie Mac, Series 1567, Class A, 0.561% 20233,4 | 99 | 99 |
| Freddie Mac, Series 3213, Class OG, principal only, 0% 20363 | 554 | 509 |
| Freddie Mac, Series 3233, Class PA, 6.00% 20363 | 425 | 477 |
| Government National Mortgage Assn. 3.00% 20263 | 10,356 | 10,900 |
| Government National Mortgage Assn. 3.00% 20273 | 7,336 | 7,721 |
| Government National Mortgage Assn. 3.75% 20343 | 1,466 | 1,537 |
| Government National Mortgage Assn. 5.50% 20383 | 827 | 925 |
| Government National Mortgage Assn. 5.50% 20383 | 471 | 527 |
| Government National Mortgage Assn. 5.50% 20383 | 298 | 334 |
| Government National Mortgage Assn. 5.50% 20383 | 265 | 297 |
| Government National Mortgage Assn. 6.00% 20383 | 647 | 739 |
| Government National Mortgage Assn. 6.50% 20383 | 1,002 | 1,146 |
| Government National Mortgage Assn. 6.50% 20383 | 284 | 325 |
| Government National Mortgage Assn. 3.50% 20393,4 | 572 | 603 |
| Government National Mortgage Assn. 5.00% 20393 | 1,961 | 2,169 |
| Government National Mortgage Assn. 6.00% 20393 | 704 | 802 |
| Government National Mortgage Assn. 4.50% 20403 | 1,266 | 1,392 |
| Government National Mortgage Assn. 5.50% 20403 | 19,265 | 21,739 |
| Government National Mortgage Assn. 4.50% 20413 | 3,240 | 3,554 |
| Government National Mortgage Assn. 5.00% 20413 | 5,905 | 6,476 |
| Government National Mortgage Assn. 3.00% 20423 | 105 | 107 |
| Bonds, notes & other debt instruments Mortgage-backed obligations (continued) Federal agency mortgage-backed obligations (continued) | Principal amount (000) | Value (000) |
| Government National Mortgage Assn. 3.50% 20433 | $3,917 | $4,117 |
| Government National Mortgage Assn. 4.00% 20443 | 60,673 | 65,109 |
| Government National Mortgage Assn. 4.00% 20443 | 40,419 | 43,412 |
| Government National Mortgage Assn. 4.00% 20443 | 8,647 | 9,291 |
| Government National Mortgage Assn. 4.00% 20443 | 3,593 | 3,859 |
| Government National Mortgage Assn. 4.50% 20453,5 | 24,500 | 26,769 |
| Government National Mortgage Assn. 6.172% 20583 | 41 | 42 |
| Government National Mortgage Assn. 6.22% 20583 | 518 | 538 |
| Government National Mortgage Assn., Series 2003, 6.116% 20583 | 441 | 471 |
| National Credit Union Administration, Series 2011-M1, Class A2, 1.40% 20153 | 760 | 764 |
| National Credit Union Administration, Series 2010-R2, Class 1A, 0.527% 20173,4 | 353 | 354 |
| National Credit Union Administration, Series 2011-R2, Class 1A, 0.556% 20203,4 | 210 | 211 |
| National Credit Union Administration, Series 2011-R3, Class 1A, 0.559% 20203,4 | 824 | 828 |
| National Credit Union Administration, Series 2011-R1, Class 1A, 0.606% 20203,4 | 520 | 523 |
| Vendee Mortgage Trust, Series 2011-2, Class DA, 3.75% 20333 | 20,682 | 21,673 |
| Vendee Mortgage Trust, Series 2010-1, Class DA, 4.25% 20353 | 17,476 | 18,671 |
| Total mortgage-backed obligations | 816,558 | |
| Federal agency bonds & notes 17.60% | ||
| Export-Import Bank of the United States-Guaranteed, Ethiopian Leasing 2012 LLC 2.646% 20263 | 963 | 970 |
| Fannie Mae 5.00% 2017 | 2,655 | 2,890 |
| Fannie Mae 1.75% 2019 | 8,500 | 8,507 |
| Fannie Mae 2.625% 2024 | 10,955 | 11,109 |
| Fannie Mae 7.125% 2030 | 4,000 | 6,151 |
| Fannie Mae, Series 2014-M2, Class A-S-Q2, multifamily 0.478% 20153 | 1,859 | 1,858 |
| Fannie Mae, Series 2012-M9, multifamily 1.513% 20173 | 2,375 | 2,374 |
| Fannie Mae, Series 2013-M4, multifamily 2.608% 20223 | 2,300 | 2,313 |
| Fannie Mae, Series 2012-M2, Class A2, multifamily 2.717% 20223 | 2,350 | 2,396 |
| Fannie Mae, Series 2012-M3, Class 1-A2, multifamily 3.044% 20223 | 2,000 | 2,074 |
| Fannie Mae, Series 2013-M14, Class A2, multifamily 3.329% 20233,4 | 1,841 | 1,940 |
| Fannie Mae, Series 2014-M1, multifamily 3.373% 20233,4 | 2,050 | 2,151 |
| Fannie Mae, Series 2014-M9, multifamily 3.103% 20243,4 | 1,510 | 1,562 |
| Fannie Mae, Series 2014-M3, Class A2, multifamily 3.477% 20243,4 | 3,825 | 4,070 |
| Federal Farm Credit Banks 0.212% 20174 | 6,300 | 6,302 |
| Federal Farm Credit Banks 0.225% 20174 | 7,321 | 7,322 |
| Federal Farm Credit Banks 0.60% 2017 | 41,774 | 41,491 |
| Federal Home Loan Bank 0.375% 2015 | 34,750 | 34,776 |
| Federal Home Loan Bank 2.75% 2015 | 9,250 | 9,293 |
| Federal Home Loan Bank 0.375% 2016 | 20,750 | 20,729 |
| Federal Home Loan Bank 0.625% 2016 | 4,575 | 4,565 |
| Federal Home Loan Bank 1.75% 2018 | 38,000 | 38,326 |
| Federal Home Loan Bank 3.375% 2023 | 16,715 | 17,949 |
| Federal Home Loan Bank 2.875% 2024 | 8,500 | 8,747 |
| Federal Home Loan Bank 5.50% 2036 | 600 | 821 |
| Federal Home Loan Bank, Series 2816, 1.00% 2017 | 56,095 | 56,164 |
| Freddie Mac 1.75% 2015 | 23,425 | 23,663 |
| Freddie Mac 1.00% 2017 | 1,750 | 1,753 |
| Freddie Mac 1.25% 2019 | 18,730 | 18,361 |
| Freddie Mac 3.75% 2019 | 12,750 | 13,854 |
| Freddie Mac, Series K501, Class A1, multifamily 1.337% 20163 | 353 | 353 |
| Freddie Mac, Series K705, Class A2, multifamily 2.303% 20183 | 1,730 | 1,766 |
| Freddie Mac, Series K706, Class A2, multifamily 2.323% 20183 | 2,000 | 2,042 |
| Freddie Mac, Series K704, Class A2, multifamily 2.412% 20183 | 1,800 | 1,845 |
| Freddie Mac, Series K702, Class A2, multifamily 3.154% 20183 | 2,019 | 2,115 |
| Bonds, notes & other debt instruments Federal agency bonds & notes (continued) | Principal amount (000) | Value (000) |
| Freddie Mac, Series K712, Class A2, multifamily 1.869% 20193 | $1,760 | $1,752 |
| Freddie Mac, Series KGRP, Class A, multifamily 0.536% 20203,4 | 5,427 | 5,447 |
| Freddie Mac, Series KF02, Class A3, multifamily 0.80% 20203,4 | 1,130 | 1,134 |
| Freddie Mac, Series K015, Class A1, multifamily 2.257% 20203 | 1,471 | 1,499 |
| Freddie Mac, Series K009, Class A1, multifamily 2.757% 20203 | 924 | 953 |
| Freddie Mac, Series K013, Class A1, multifamily 2.902% 20203 | 1,654 | 1,710 |
| Freddie Mac, Series K010, Class A1, multifamily 3.32% 20203 | 1,222 | 1,279 |
| Freddie Mac, Series K019, Class A1, multifamily 1.459% 20213 | 4,178 | 4,127 |
| Freddie Mac, Series K017, Class A2, multifamily 2.873% 20213 | 2,325 | 2,400 |
| Freddie Mac, Series K022, Class A2, multifamily 2.355% 20223 | 2,375 | 2,358 |
| Freddie Mac, Series K020, Class A2, multifamily 2.373% 20223 | 2,375 | 2,363 |
| Freddie Mac, Series K031, Class A1, multifamily 2.778% 20223 | 1,479 | 1,529 |
| Freddie Mac, Series KS01, Class A2, multifamily 2.522% 20233 | 1,735 | 1,738 |
| Freddie Mac, Series K029, Class A2, multifamily 3.32% 20233,4 | 400 | 422 |
| Freddie Mac, Series K041, Class A-2, multifamily 3.171% 20243 | 1,700 | 1,767 |
| Private Export Funding Corp. 1.45% 2019 | 17,500 | 17,139 |
| Private Export Funding Corp. 2.25% 2020 | 5,000 | 5,051 |
| Private Export Funding Corp. 3.55% 2024 | 6,340 | 6,770 |
| Small Business Administration, Series SBIC-PS 2006-10A, Participating Securities, 5.408% 20163 | 79 | 82 |
| Small Business Administration, Series 2001-20K, 5.34% 20213 | 128 | 137 |
| Small Business Administration, Series 2001-20J, 5.76% 20213 | 88 | 95 |
| Small Business Administration, Series 2001-20F, 6.44% 20213 | 248 | 270 |
| Small Business Administration, Series 2003-20B, 4.84% 20233 | 602 | 646 |
| Tennessee Valley Authority, Series A, 3.875% 2021 | 32,975 | 36,244 |
| Tennessee Valley Authority 1.875% 2022 | 10,150 | 9,771 |
| Tennessee Valley Authority 4.65% 2035 | 2,330 | 2,814 |
| Tennessee Valley Authority 5.88% 2036 | 1,750 | 2,405 |
| Tennessee Valley Authority 5.25% 2039 | 6,500 | 8,303 |
| Tennessee Valley Authority, Series B, 3.50% 2042 | 6,470 | 6,433 |
| Tennessee Valley Authority, Series A, 4.625% 2060 | 250 | 290 |
| TVA Southaven 3.846% 20333 | 1,692 | 1,799 |
| United States Agency for International Development, Jordan (Kingdom of) 1.945% 2019 | 22,750 | 23,054 |
| United States Agency for International Development, Jordan (Kingdom of) 2.503% 2020 | 88,000 | 90,640 |
| United States Agency for International Development, Ukraine, 1.844% 2019 | 1,445 | 1,458 |
| United States Government-Guaranteed Certificates of Participation, Overseas Private Investment Corp, 0% 2016 | 594 | 599 |
| United States Government-Guaranteed Certificates of Participation, Overseas Private Investment Corp, 3.49% 20293 | 971 | 1,020 |
| United States Government-Guaranteed Certificates of Participation, Overseas Private Investment Corp, 3.82% 20323 | 1,079 | 1,159 |
| United States Government-Guaranteed Certificates of Participation, Overseas Private Investment Corp, 3.938% 20323 | 882 | 941 |
| Export-Import Bank of the United States-Guaranteed, VCK Lease SA 2.591% 20263 | 1,311 | 1,308 |
| 611,508 | ||
| Total bonds, notes & other debt instruments (cost: $3,125,272,000) | 3,174,040 | |
| Short-term securities 20.46% | ||
| Abbott Laboratories 0.11% due 1/22/2015–3/2/20156 | 50,000 | 49,994 |
| Apple Inc. 0.13% due 1/6/20156 | 7,200 | 7,200 |
| Caterpillar Financial Services Corp. 0.12% due 2/19/2015 | 19,400 | 19,396 |
| Chevron Corp. 0.12%–0.14% due 3/11/2015–4/14/20156 | 75,000 | 74,968 |
| Coca-Cola Co. 0.11%–0.18% due 2/20/2015–5/8/20156 | 95,000 | 94,963 |
| Emerson Electric Co. 0.10%–0.11% due 1/28/2015–3/4/20156 | 55,400 | 55,391 |
| Short-term securities | Principal amount (000) | Value (000) |
| ExxonMobil Corp. 0.08%–0.10% due 1/22/2015–2/10/2015 | $51,000 | $50,994 |
| Federal Farm Credit Banks 0.10%–0.14% due 1/28/2015–7/15/2015 | 47,750 | 47,732 |
| General Electric Co. 0.10% due 1/2/2015 | 27,400 | 27,400 |
| Harvard University 0.11% due 1/16/2015 | 30,198 | 30,197 |
| John Deere Capital Corp. 0.10% due 1/14/20156 | 50,000 | 49,997 |
| John Deere Financial Ltd. 0.09%–0.10% due 1/7/2015–1/14/20156 | 36,400 | 36,399 |
| Microsoft Corp. 0.10% due 2/2/20156 | 24,700 | 24,698 |
| National Rural Utilities Cooperative Finance Corp. 0.10% due 1/8/2015 | 20,000 | 19,999 |
| Paccar Financial Corp. 0.10%–0.11% due 1/9/2015–1/22/2015 | 11,600 | 11,600 |
| Procter & Gamble Co. 0.08%–0.15% due 1/7/2015–2/9/20156 | 69,800 | 69,796 |
| Regents of the University of California 0.12% due 2/13/2015 | 40,000 | 39,995 |
| Total short-term securities (cost: $710,730,000) | 710,719 | |
| Total investment securities 111.83% (cost: $3,836,002,000) | 3,884,759 | |
| Other assets less liabilities (11.83)% | (410,946) | |
| Net assets 100.00% | $3,473,813 |
| 1 | A portion of this security was pledged as collateral. The total value of pledged collateral was $20,696,000, which represented .60% of the net assets of the fund. |
| 2 | Index-linked bond whose principal amount moves with a government price index. |
| 3 | Principal payments may be made periodically. Therefore, the effective maturity date may be earlier than the stated maturity date. |
| 4 | Coupon rate may change periodically. |
| 5 | A portion or all of the security purchased on a TBA basis. |
| 6 | Acquired in a transaction exempt from registration under Rule 144A or Section 4(2) of the Securities Act of 1933. May be resold in the U.S. in transactions exempt from registration, normally to qualified institutional buyers. The total value of all such securities was $463,583,000, which represented 13.35% of the net assets of the fund. |
| Key to abbreviation | |||
| TBA = To be announced |
| Short-term securities 98.79% Federal agency discount notes 48.70% | Principal amount (000) | Value (000) |
| Fannie Mae 0.03%–0.09% due 1/2/2015–5/18/2015 | $58,660 | $58,653 |
| Federal Home Loan Bank 0.05%–0.11% due 1/14/2015–3/25/2015 | 68,650 | 68,649 |
| Freddie Mac 0.05%–0.10% due 1/20/2015–5/8/2015 | 52,315 | 52,308 |
| International Bank for Reconstruction and Development 0.07% due 1/26/2015 | 5,000 | 5,000 |
| Tennessee Valley Authority 0.06% due 1/6/2015 | 7,800 | 7,800 |
| 192,410 | ||
| U.S. Treasury bills 33.28% | ||
| U.S. Treasury Bills 0.02%–0.06% due 1/2/2015–5/14/2015 | 131,500 | 131,497 |
| Commercial paper 16.81% | ||
| CAFCO, LLC 0.12% due 1/16/2015 | 10,000 | 9,999 |
| Emerson Electric Co. 0.16% due 3/2/20151 | 5,000 | 4,999 |
| Gotham Funding Corp. 0.15% due 1/16/20151 | 10,000 | 9,999 |
| John Deere Capital Corp. 0.12% due 2/12/20151 | 10,600 | 10,598 |
| KfW 0.11% due 1/16/20151 | 7,000 | 7,000 |
| Regents of the University of California 0.12% due 2/23/2015 | 10,000 | 9,998 |
| Sumitomo Mitsui Banking Corp. 0.16% due 1/6/20151 | 13,800 | 13,800 |
| 66,393 | ||
| Total short-term securities (cost: $390,286,000) | 390,300 | |
| Bonds, notes & other debt instruments 1.27% U.S. Treasury bonds & notes 1.27% | ||
| U.S. Treasury 0.093% 20162 | 5,000,000 | 4,997 |
| Total bonds, notes & other debt instruments (cost: $4,995,000) | 4,997 | |
| Total investment securities 100.06% (cost: $395,281,000) | 395,297 | |
| Other assets less liabilities (0.06)% | (232) | |
| Net assets 100.00% | $395,065 |
| 1 | Acquired in a transaction exempt from registration under Section 4(2) of the Securities Act of 1933. May be resold in the U.S. in transactions exempt from registration, normally to qualified institutional buyers. The total value of all such securities was $46,396,000, which represented 11.74% of the net assets of the fund. |
| 2 | Coupon rate may change periodically. |
| Growth funds 93.58% | Shares | Value (000) |
| American Funds Insurance Series – Growth Fund, Class 1 | 925,445 | $74,175 |
| Total growth funds (cost: $72,153,000) | 74,175 | |
| Short-term securities 4.56% | ||
| Government Cash Management Fund | 3,614,218 | 3,614 |
| Total short-term securities (cost: $3,615,000) | 3,614 | |
| Total investment securities 98.14% (cost: $75,768,000) | 77,789 | |
| Other assets less liabilities 1.86% | 1,475 | |
| Net assets 100.00% | $79,264 |
| Growth funds 94.05% | Shares | Value (000) |
| American Funds Insurance Series – International Fund, Class 1 | 2,130,911 | $43,365 |
| Total growth funds (cost: $44,843,000) | 43,365 | |
| Short-term securities 4.63% | ||
| Government Cash Management Fund | 2,134,483 | 2,134 |
| Total short-term securities (cost: $2,134,000) | 2,134 | |
| Total investment securities 98.68% (cost: $46,977,000) | 45,499 | |
| Other assets less liabilities 1.32% | 608 | |
| Net assets 100.00% | $46,107 |
Income and Growth FundSM
| Growth-and-income funds 93.20% | Shares | Value (000) |
| American Funds Insurance Series – Blue Chip Income and Growth Fund, Class 1 | 6,224,439 | $91,437 |
| Total growth-and-income funds (cost: $87,162,000) | 91,437 | |
| Short-term securities 5.54% | ||
| Government Cash Management Fund | 5,435,970 | 5,436 |
| Total short-term securities (cost: $5,436,000) | 5,436 | |
| Total investment securities 98.74% (cost: $92,598,000) | 96,873 | |
| Other assets less liabilities 1.26% | 1,234 | |
| Net assets 100.00% | $98,107 |
| Growth-and-income funds 92.94% | Shares | Value (000) |
| American Funds Insurance Series – Growth-Income Fund, Class 1 | 1,334,756 | $70,421 |
| Total growth-and-income funds (cost: $68,649,000) | 70,421 | |
| Short-term securities 6.29% | ||
| Government Cash Management Fund | 4,764,642 | 4,765 |
| Total short-term securities (cost: $4,764,000) | 4,765 | |
| Total investment securities 99.23% (cost: $73,413,000) | 75,186 | |
| Other assets less liabilities 0.77% | 580 | |
| Net assets 100.00% | $75,766 |
| Asset allocation funds 93.19% | Shares | Value (000) |
| American Funds Insurance Series – Asset Allocation Fund, Class 1 | 86,231,073 | $1,916,917 |
| Total asset allocation funds (cost: $1,885,280,000) | 1,916,917 | |
| Short-term securities 6.57% | ||
| Government Cash Management Fund | 135,125,280 | 135,125 |
| Total short-term securities (cost: $135,125,000) | 135,125 | |
| Total investment securities 99.76% (cost: $2,020,405,000) | 2,052,042 | |
| Other assets less liabilities 0.24% | 4,927 | |
| Net assets 100.00% | $2,056,969 |
| INGEFPX-998-0215O-S42207 | American Funds Insurance Series — Managed Risk Asset Allocation Fund — Page 147 of 147 |
Report of Independent Registered Public Accounting Firm
To the Board of Trustees and Shareholders of American Funds Insurance Series
In our opinion, the accompanying statements of assets and liabilities, including the summary investment portfolios, and the related statements of operations and of changes in net assets and the financial highlights (included in Item 1 of this Form N-CSR) and the investment portfolios (included in Item 6 of this Form N-CSR) present fairly, in all material respects, the financial position of Global Growth Fund, Global Small Capitalization Fund, Growth Fund, International Fund, New World Fund, Blue Chip Income and Growth Fund, Global Growth and Income Fund, Growth-Income Fund, International Growth and Income Fund, Capital Income Builder, Asset Allocation Fund, Global Balanced Fund, Bond Fund, Global Bond Fund, High-Income Bond Fund, Mortgage Fund and U.S. Government/AAA-Rated Securities Fund (seventeen of the portfolios constituting American Funds Insurance Series, hereafter referred to as the “Series”) at December 31, 2014, and the results of each of their operations, the changes in each of their net assets and the financial highlights for each of the periods presented, in conformity with accounting principles generally accepted in the United States of America. These financial statements, financial highlights, and investment portfolios (hereafter referred to as "financial statements") are the responsibility of the Series’ management. Our responsibility is to express an opinion on these financial statements based on our audits. We conducted our audits of these financial statements in accordance with the standards of the Public Company Accounting Oversight Board (United States). Those standards require that we plan and perform the audit to obtain reasonable assurance about whether the financial statements are free of material misstatement. An audit includes examining, on a test basis, evidence supporting the amounts and disclosures in the financial statements, assessing the accounting principles used and significant estimates made by management, and evaluating the overall financial statement presentation. We believe that our audits, which included confirmation of securities at December 31, 2014 by correspondence with the custodians and brokers, provide a reasonable basis for our opinion.
PricewaterhouseCoopers LLP
Los Angeles, California
February 6, 2015
ITEM 7 – Disclosure of Proxy Voting Policies and Procedures for Closed-End Management Investment Companies
Not applicable to this Registrant, insofar as the Registrant is not a closed-end management investment company.
ITEM 8 – Portfolio Managers of Closed-End Management Investment Companies
Not applicable to this Registrant, insofar as the Registrant is not a closed-end management investment company.
ITEM 9 – Purchases of Equity Securities by Closed-End Management Investment Company and Affiliated Purchasers
Not applicable to this Registrant, insofar as the Registrant is not a closed-end management investment company.
ITEM 10 – Submission of Matters to a Vote of Security Holders
There have been no material changes to the procedures by which shareholders may recommend nominees to the Registrant’s board of trustees since the Registrant last submitted a proxy statement to its shareholders. The procedures are as follows. The Registrant has a nominating and governance committee comprised solely of persons who are not considered ‘‘interested persons’’ of the Registrant within the meaning of the Investment Company Act of 1940, as amended. The committee periodically reviews such issues as the board’s composition, responsibilities, committees, compensation and other relevant issues, and recommends any appropriate changes to the full board of trustees. While the committee normally is able to identify from its own resources an ample number of qualified candidates, it will consider shareholder suggestions of persons to be considered as nominees to fill future vacancies on the board. Such suggestions must be sent in writing to the nominating and governance committee of the Registrant, c/o the Registrant’s Secretary, and must be accompanied by complete biographical and occupational data on the prospective nominee, along with a written consent of the prospective nominee for consideration of his or her name by the nominating and governance committee.
ITEM 11 – Controls and Procedures
| (a) | The Registrant’s Principal Executive Officer and Principal Financial Officer have concluded, based on their evaluation of the Registrant’s disclosure controls and procedures (as such term is defined in Rule 30a-3 under the Investment Company Act of 1940), that such controls and procedures are adequate and reasonably designed to achieve the purposes described in paragraph (c) of such rule. |
| (b) | There were no changes in our internal control over financial reporting during the quarter ended December 31, 2014, which were identified in connection with management's evaluation required by paragraph (d) of Rule 13a-15 and 15d-15 under the Exchange Act, that have materially affected, or are reasonably likely to materially affect, our internal control over financial reporting, other than as provided below.
Effective November 10, 2014, the American Funds Insurance Series’s investment adviser implemented a new accounting system. In connection with introducing this new system, additional automated and manual controls were implemented and some existing controls were modified. None of these changes were in response to any identified deficiency or weakness in the American Funds Insurance Series’s internal control over financial reporting. |
ITEM 12 – Exhibits
| (a)(1) | The Code of Ethics that is the subject of the disclosure required by Item 2 is attached as an exhibit hereto. |
| (a)(2) | The certifications required by Rule 30a-2 of the Investment Company Act of 1940 and Sections 302 and 906 of the Sarbanes-Oxley Act of 2002 are attached as exhibits hereto. |
SIGNATURES
Pursuant to the requirements of the Securities Exchange Act of 1934 and the Investment Company Act of 1940, the Registrant has duly caused this report to be signed on its behalf by the undersigned, thereunto duly authorized.
| AMERICAN FUNDS INSURANCE SERIES | |
| By /s/ Michael J. Downer | |
Michael J. Downer, Executive Vice President and Principal Executive Officer | |
| Date: February 27, 2015 |
Pursuant to the requirements of the Securities Exchange Act of 1934 and the Investment Company Act of 1940, this report has been signed below by the following persons on behalf of the Registrant and in the capacities and on the dates indicated.
| By /s/ Michael J. Downer |
Michael J. Downer, Executive Vice President and Principal Executive Officer |
| Date: February 27, 2015 |
| By /s/ Gregory F. Niland |
Gregory F. Niland, Treasurer and Principal Financial Officer |
| Date: February 27, 2015 |