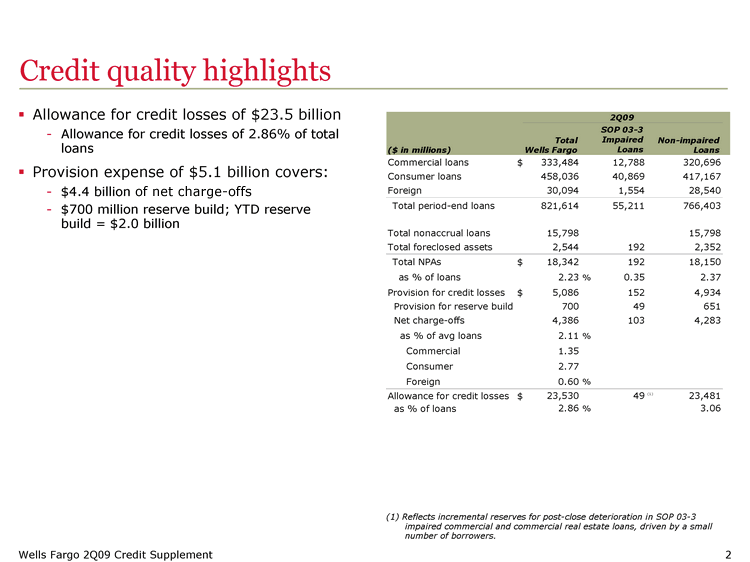
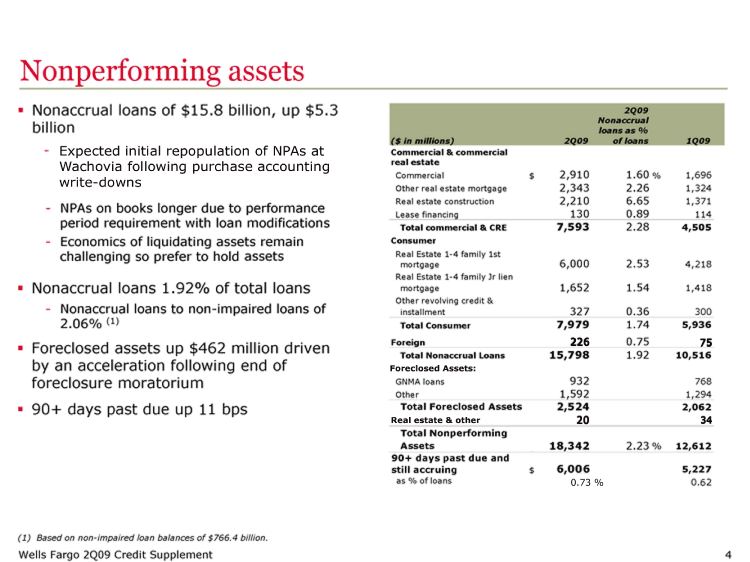
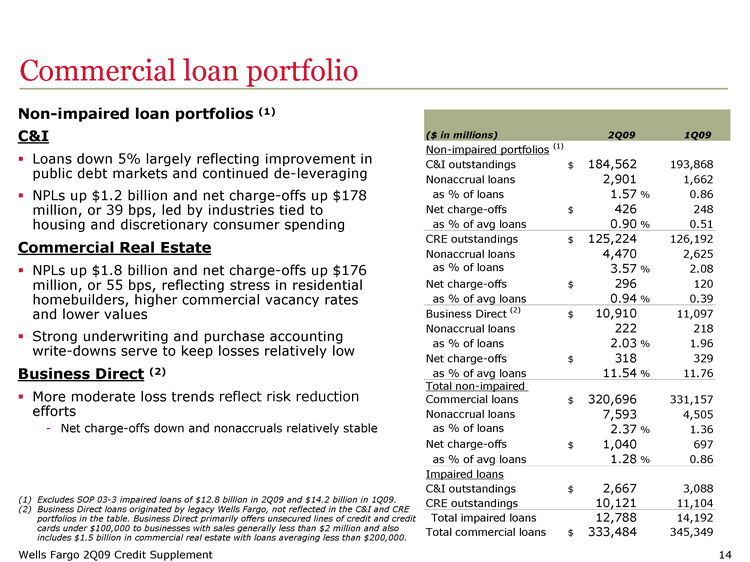
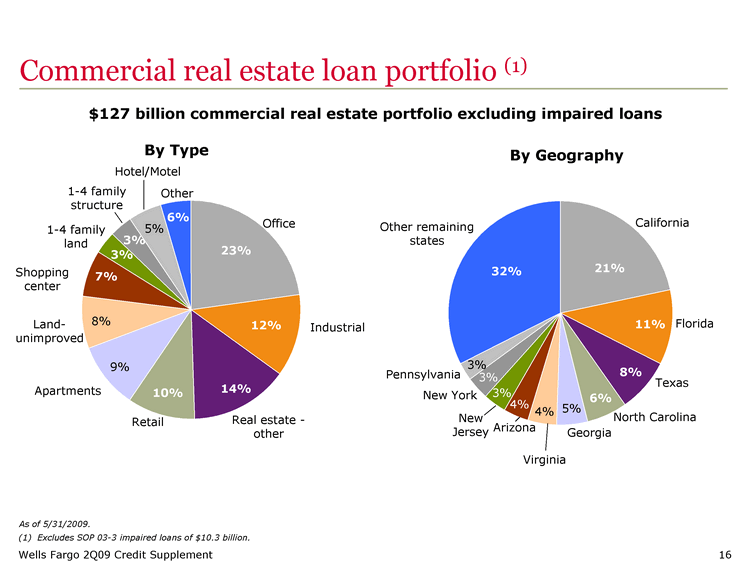
| Commercial loan portfolio Non-impaired loan portfolios (1) C&I Loans down 5% largely reflecting improvement in public debt markets and continued de-leveraging NPLs up $1.2 billion and net charge-offs up $178 million, or 39 bps, led by industries tied to housing and discretionary consumer spending Commercial Real Estate NPLs up $1.8 billion and net charge-offs up $176 million, or 55 bps, reflecting stress in residential homebuilders, higher commercial vacancy rates and lower values Strong underwriting and purchase accounting write-downs serve to keep losses relatively low Business Direct (2) More moderate loss trends reflects risk reduction efforts Net charge-offs down and nonaccruals relatively stable (1) Excludes SOP 03-3 impaired loans of $12.8 billion in 2Q09 and $14.2 billion in 1Q09. (2) Business Direct loans originated by legacy Wells Fargo, not reflected in the C&I and CRE portfolios in the table. Business Direct primarily offers unsecured lines of credit and credit cards under $100,000 to businesses with sales generally less than $2 million and also includes $1.5 billion in commercial real estate with loans averaging less than $200,000. ($ in millions) 2Q09 1Q09 Non-impaired portfolios (1) C&I outstan dings $ 193 , Nonaccrual loans 2,901 1,662 as % of loans 1.57 % 0.86 Net charge-offs $ 426 248 as % of avg loans 0.90 % 0.51 CRE outstandings 125 126 , Nonaccrual loans 4,470 2,625 as % of loans 3.57 % 2.08 Net charge-offs $ 296 120 as % of avg loans 0.94 % 0.39 Business Direct (2) $ 10,910 11,097 Nonaccrual loans 222 218 as % of loans 2.03 % 1.96 Net charge-offs $ 318 329 as % of avg loans 11.54 % 11.76 Total non-impaired Commercial loans 320, 331 , Nonaccrual loans 7,593 4,505 as % of loans 2.37 % 1.36 Net charge-offs $ 1,040 697 as % of avg loans 1.28 % 0.86 Impaired loans C&I outstandings $ 2,667 3,088 CRE outstandings 10,121 11,104 Total impaired loans 12,788 14,192 Total commercial loans $ 333,484 345,349 |

