 3Q12 Quarterly Supplement October 12, 2012 Exhibit 99.2 |
 Wells Fargo 3Q12 Supplement 1 Appendix Pages 22-37 - Non-strategic/liquidating loan portfolio risk reduction 23 - Purchased credit-impaired (PCI) portfolios 24 - PCI nonaccretable difference 25 - PCI accretable yield 26 - PCI accretable yield (Commercial & Pick-a-Pay) 27 - Pick-a-Pay mortgage portfolio 28 - Pick-a-Pay credit highlights 29 - Real estate 1-4 family first mortgage portfolio 30 - Home equity portfolio 31 - Credit card portfolio 32 - Auto portfolios 33 - Student lending portfolio 34 Tier 1 common equity under Basel I 35 Tier 1 common equity under Basel III (Estimated) 36 Forward-looking statements and additional information 37 Table of contents 3Q12 Results - 3Q12 Results Page 2 - Continued strong diversification 3 - Balance Sheet and credit overview 4 - Income Statement overview 5 - Loans 6 - Deposits 7 - Net interest income 8 - Noninterest income 9 - Noninterest expense and efficiency ratio 10 - Community Banking 11 - Wholesale Banking 12 - Wealth, Brokerage and Retirement 13 - 3Q12 Credit quality highlights 14 - Credit quality 15-16 - Mortgage servicing 17-18 - Capital 19 - Demonstrated momentum across the franchise 20 - Summary 21 |
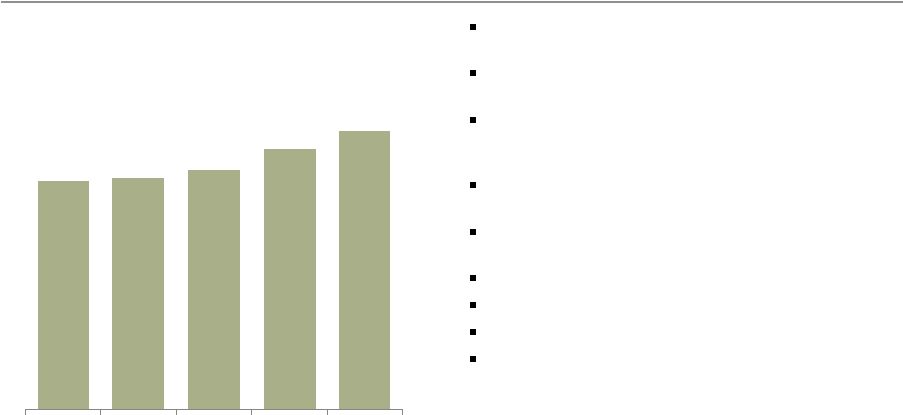 Wells Fargo 3Q12 Supplement 2 Record earnings of $4.9 billion, up 7% linked quarter (LQ) and 22% year-over-year (YoY) Record diluted earnings per common share of $0.88, up 7% LQ and 22% YoY Total revenue of $21.2 billion relatively stable as lower net interest income was largely offset by stronger noninterest income Positive operating leverage; efficiency ratio improvement to 57.1% (1) Pre-tax pre-provision profit (2) of $9.1 billion, up $209 million LQ Strong underlying credit performance ROA = 1.45%, up 4 bps LQ and up 19 bps YoY ROE = 13.38%, up 52 bps LQ and up 152 bps YoY Capital levels remained strong - 10.06% Tier 1 common equity ratio under Basel I and estimated Tier 1 common equity ratio under Basel III of 8.02% (3) 3Q12 Results Wells Fargo Net Income ($ in millions) 4,055 4,107 4,248 4,622 4,937 3Q11 4Q11 1Q12 2Q12 3Q12 (2) Pre-tax pre-provision profit (PTPP) is total revenue less noninterest expense. Management believes PTPP is a useful financial measure because it enables investors and others to assess the Company’s ability to generate capital to cover credit losses through a credit cycle. (3) Estimated Basel III calculation based on management’s current interpretation of the Basel III capital rules proposed by federal banking agencies in notices of proposed rulemaking announced in June 2012. The proposed rules and interpretations and assumptions used in estimating Basel III calculations are subject to change depending on final promulgation of Basel III capital rules. See pages 35-36 for additional information regarding Tier 1 common equity ratios. (1) Efficiency ratio defined as noninterest expense divided by total revenue (net interest income plus noninterest income). |
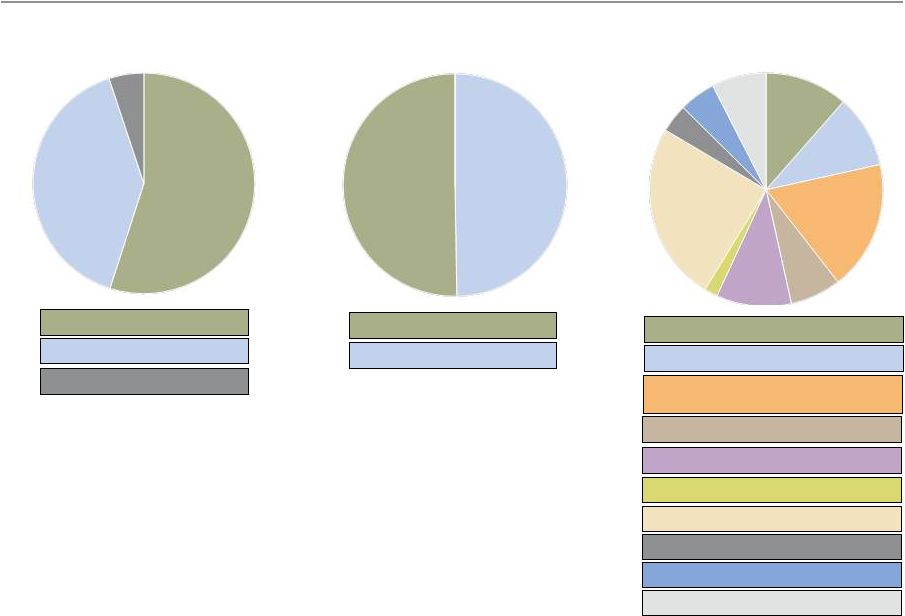 Wells Fargo 3Q12 Supplement 3 Balanced Spread and Fee Income Diversified Fee Generation Deposit Service Charges 11% Card Fees 7% Other Banking Fees 10% Mortgage Servicing, net 2% Insurance 4% Net Gains from Trading 5% Noninterest Income 50% Net Interest Income 50% Diversified Loan Portfolio Commercial Loans 40% Consumer Loans 55% Continued strong diversification Foreign Loans 5% Mortgage Orig./Sales, net 25% Trust, Investment & IRA fees 10% Commissions & All Other Investment Fees 18% Other Noninterest Income (1) 8% 50% 50% 11% 10% 18% 7% 10% 2% 25% 4% 5% 8% 55% 40% 5% All data is for 3Q12. (1) Other noninterest income includes net gains on debt securities available for sale, equity investments, operating leases and all other noninterest income. |
 Wells Fargo 3Q12 Supplement 4 Balance Sheet and credit overview Balance Sheet Loans Total period-end loans up $7.4 billion - Core loans increased $11.9 billion primarily driven by the decision to retain $9.8 billion of 1-4 family conforming first mortgage production - Non-strategic/liquidating portfolio decreased $4.5 billion (1) Short-term investments/ Fed funds sold Balances up $25.8 billion driven by strong deposit growth Securities available for sale (AFS) Balances up $2.5 billion driven by an increase in fair value as new investments were largely offset by the continued run-off of higher-yielding securities Deposits Balances up $23.3 billion Long-term debt Balances up $5.8 billion as $7.4 billion in issuances were partially offset by $2.2 billion in maturities Common stock repurchases Purchased 16.5 million common shares in the quarter and an additional estimated 9 million shares through a forward repurchase transaction that is expected to settle in 4Q12 Credit Strong core credit performance; $200 million reserve release (3) on strong underlying credit Effect of regulatory guidance (2) implementation on credit $1.4 billion reclassification of performing consumer loans to nonaccrual status $567 million in net charge-offs fully covered by loan loss reserves See page 14 for additional information Period-end balances. All result comparisons are 3Q12 compared with 2Q12. (1) See pages 6 and 23 for additional information regarding core loans and the non-strategic/liquidating portfolio, which comprises the Pick-a-Pay, liquidating home equity, legacy WFF indirect auto, legacy WFF debt consolidation, Education Finance-government guaranteed, and legacy Wachovia Commercial & Industrial, Commercial Real Estate, foreign and other PCI loan portfolios. (2) Office of the Comptroller of the Currency update to the Bank Accounting Advisory Series issued third quarter 2012 (OCC guidance). The OCC guidance requires write-down of performing consumer loans restructured in bankruptcy to collateral value. (3) Provision expense minus net charge-offs excluding the effects of OCC guidance implementation. |
 Wells Fargo 3Q12 Supplement 5 Income Statement overview Net interest income NII down $375 million on lower variable income from elevated 2Q12 levels; increased paydowns and cautious reinvestment also reduced AFS portfolio income Net interest margin (NIM) down 25 bps to 3.66% reflecting lower variable income, continued balance sheet repricing and strong deposit growth Noninterest income Mortgage banking down $86 million - Net servicing income down $482 million on increased servicing and foreclosure costs incorporated into our MSR valuation - Gain on sale revenue up $396 million despite ~$200 million in forgone revenue resulting from the retention of new conforming production Market sensitive revenues (1) up $252 million - Trading up $266 million reflecting $153 million higher deferred compensation plan investment income (P&L neutral) as well as stronger customer accommodation trading results Service charges on deposit accounts up $71 million reflecting product and pricing initiatives Trust & investment fees up $56 million on higher asset based fees in retail brokerage and asset management as well as higher retail brokerage transaction revenue Noninterest expense Personnel expense down $29 million despite $152 million higher deferred compensation expense and 2,600 additional FTEs primarily in mortgage and the retail bank Eastern franchise Operating losses down $243 million on lower litigation accruals Insurance commissions expense down $112 million reflecting seasonality All result comparisons are 3Q12 compared with 2Q12. (1) Includes net gains from trading activities, net gains on debt securities available for sale and net gains from equity investments. |
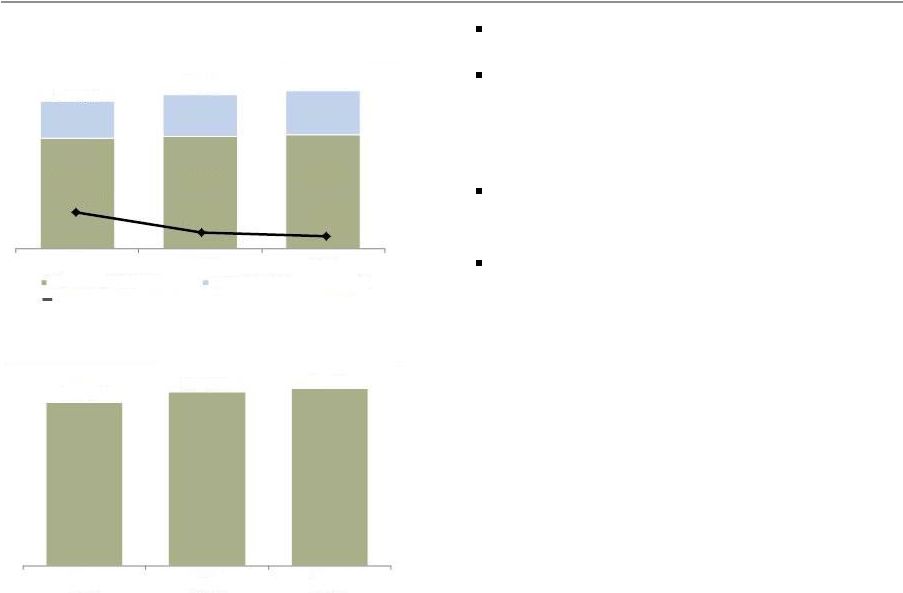
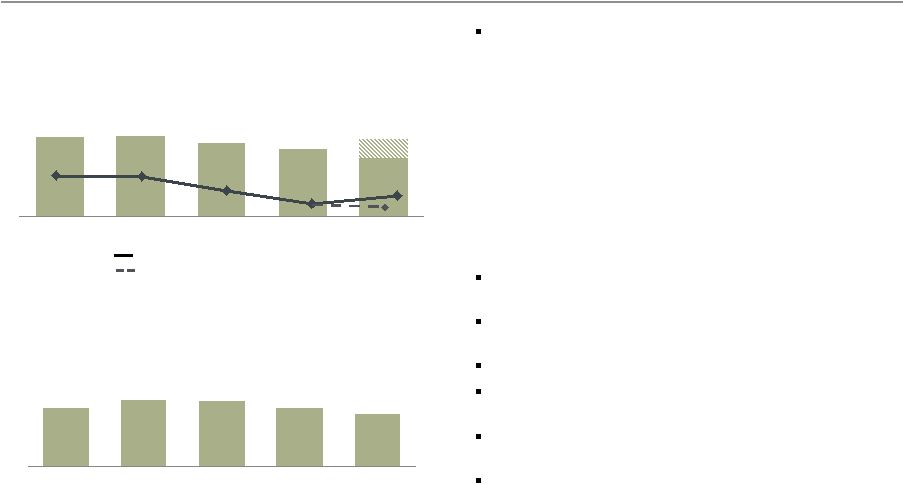
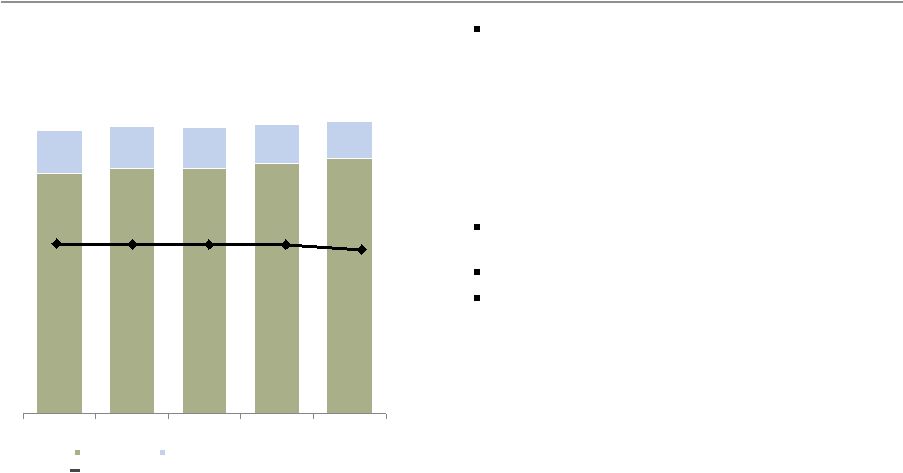 Wells Fargo 3Q12 Supplement 6 643.6 657.3 658.3 672.1 684.0 116.5 112.3 108.2 103.1 98.6 760.1 769.6 766.5 775.2 782.6 3Q11 4Q11 1Q12 2Q12 3Q12 Core loans Non-strategic/liquidating loans Loans Strong core loan growth Period-end loans up $7.4 billion from 2Q12 - Commercial loans down $1.5 billion as growth in C&I was more than offset by declines in CRE and foreign - Consumer loans up $8.9 billion as growth in first mortgage, auto, credit card and private student lending was partially offset by a $2.8 billion decline in junior lien mortgage • Includes retention of $9.8 billion of 1-4 family conforming first mortgages Non-strategic/liquidating loans (1) down $4.5 billion from 2Q12 Core loans grew $11.9 billion from 2Q12 Total average loan yield of 4.63% down 20 bps LQ - 2Q12 loan yields reflected benefit from higher than average PCI loan resolutions - Core loan yield excluding the non-strategic/liquidating portfolio was down 7 bps Period-end balances. (1) See page 23 for additional information regarding the non-strategic/liquidating portfolio, which comprises the Pick-a-Pay, liquidating home equity, legacy WFF indirect auto, legacy WFF debt consolidation, Education Finance-government guaranteed, and legacy Wachovia commercial & industrial, commercial real estate, foreign and other PCI loan portfolios. Period–end Loans Outstanding ($ in billions) (1) Total average loan yield 4.87% 4.81% 4.81% 4.83% 4.63% |
 Wells Fargo 3Q12 Supplement 7 Deposits Strong growth and reduced average cost Average deposits up $22.5 billion LQ to $946.5 billion driven by growth across the franchise Average core deposits of $895.4 billion up $14.7 billion from 2Q12 - 115% of average loans - Average retail core deposits up 4% annualized LQ Average core checking and savings up $16.9 billion, or 2% from 2Q12 - 94% of average core deposits Average deposit cost of 18 bps down 1 bp from 2Q12 Average Deposits and Rates ($ in billions) Average deposit cost Average Core Checking and Savings ($ in billions) 0.25% 0.19% 0.18% 661.4 669.5 679.3 221.2 254.5 267.2 882.6 924.0 946.5 3Q11 2Q12 3Q12 Interest-bearing deposits Noninterest-bearing deposits 769.2 820.3 837.2 3Q11 2Q12 3Q12 |
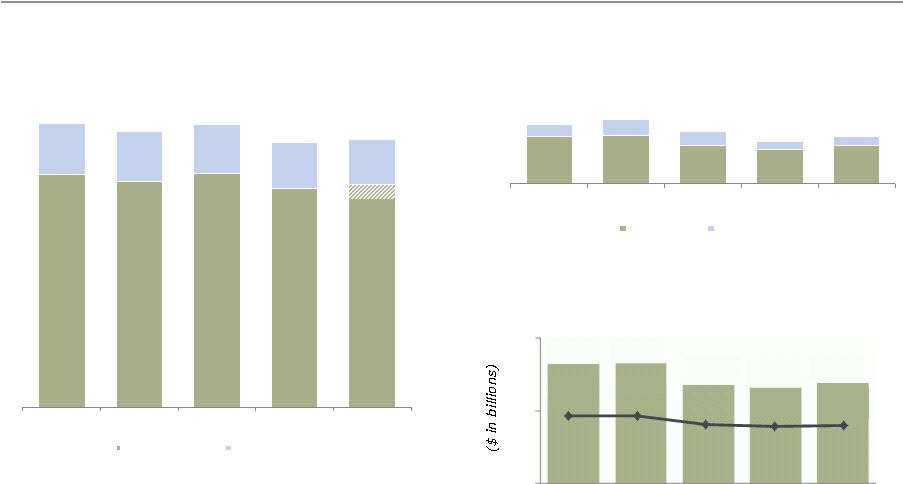
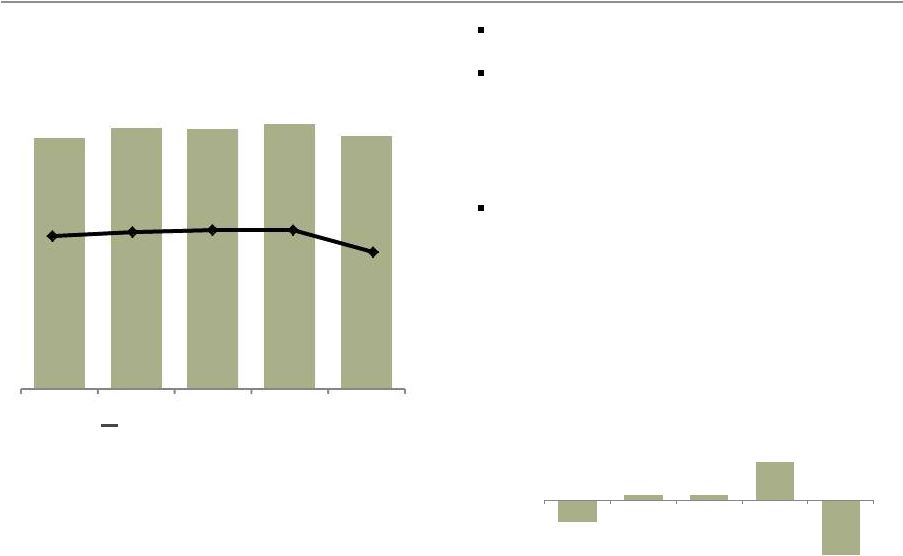 Wells Fargo 3Q12 Supplement 8 (4) 1 1 7 (10) 3Q11 4Q11 1Q12 2Q12 3Q12 LQ Change in Variable Income Contribution (in basis points) Net interest income Net Interest Income (TE) (1) ($ in millions) Tax-equivalent net interest income (1) down $393 million from 2Q12; NIM declined to 3.66% Average earning assets up $26.3 billion or 2% LQ - Short-term investments/fed funds sold up $20.3 billion - $2.6 billion increase in mortgages held for sale - Trading assets down $3.1 billion - AFS securities down $1.9 billion NIM down 25 bps from 2Q12 on: - Lower variable income ~ 10 bps of the decline - Continued balance sheet repricing as higher yielding earning assets ran off and our cautious reinvestment stance included shorter-maturity securities ~8 bps • Securities ~ 6 bps and loans ~ 2bps - Strong deposit inflows with proceeds invested in short-term investments/fed funds sold ~7 bps Net Interest Margin (NIM) (1) Tax equivalent net interest income is based on the federal statutory rate of 35% for the periods presented. Net interest income was $10,542 million, $10,892 million, $10,888 million, $11,037 million and $10,662 million for 3Q11, 4Q11, 1Q12, 2Q12 and 3Q12 respectively. 3.84% 3.89% 3.91% 3.91% 3.66% 10,714 11,083 11,058 11,213 10,820 3Q11 4Q11 1Q12 2Q12 3Q12 |
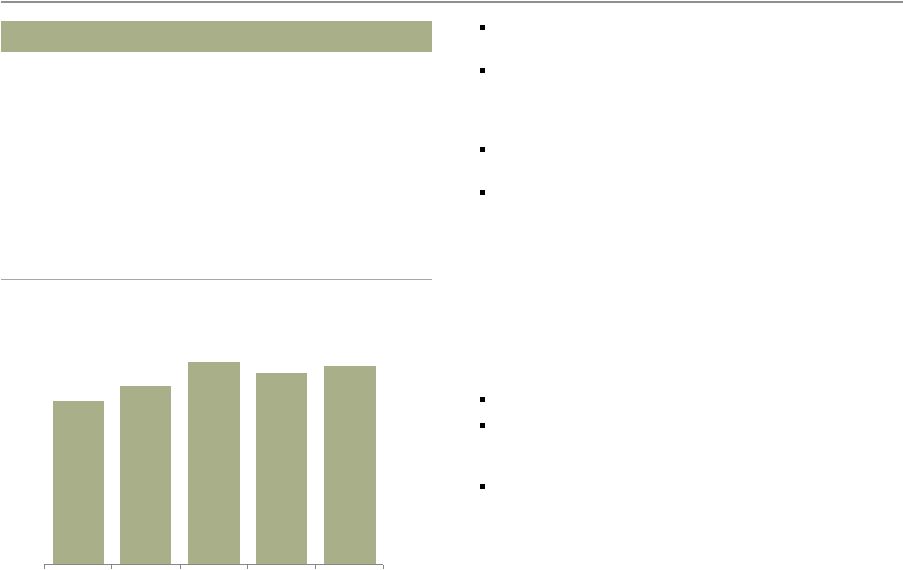 Wells Fargo 3Q12 Supplement 9 Noninterest income Deposit service charges up 6% LQ reflecting product and pricing changes Trust and investment fees up 2% LQ on stronger asset based fees in retail brokerage and asset management as well as higher retail brokerage transaction revenue Card fees up 6% LQ reflecting higher interchange revenue on higher volumes and new account growth Mortgage banking down $86 million, or 3%, LQ as strong originations were offset by lower servicing income • Included a $207 million LQ decrease in the mortgage repurchase build Insurance down 21% LQ reflecting seasonality Trading gains up $266 million LQ on $153 million higher deferred compensation plan investment income and stronger customer accommodation trading results Operating leases up $98 million LQ on early lease termination fees 9,086 9,713 10,748 10,252 10,551 3Q11 4Q11 1Q12 2Q12 3Q12 vs vs ($ in millions) 3Q12 2Q12 3Q11 Noninterest income Service charges on deposit accounts $ 1,210 6 % 10 Trust and investment fees 2,954 2 6 Card fees 744 6 (27) Other fees 1,097 (3) 1 Mortgage banking 2,807 (3) 53 Insurance 414 (21) (2) Net gains from trading activities 529 101 n.m. 3 105 (99) Net gains from equity investments 164 (32) (52) Operating leases 218 82 (23) Other 411 3 15 Total nonterest income $ 10,551 3 % 16 Net gains on debt securities available for sale - Net servicing income down $482 million on increased servicing and foreclosure costs incorporated into our MSR valuation - Gain on sale revenue up $396 million despite ~$200 million in forgone revenue resulting from the retention of conforming production |
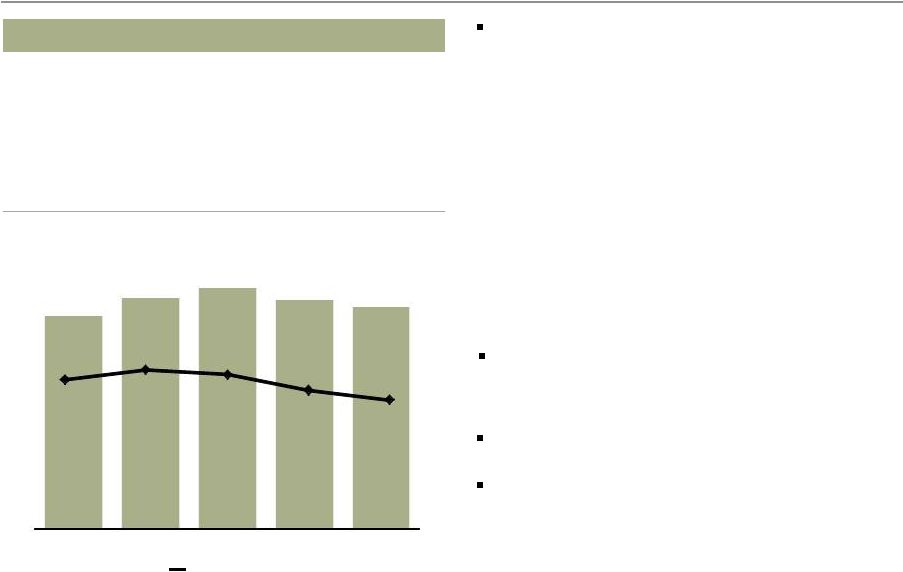 Wells Fargo 3Q12 Supplement 10 Noninterest expense and efficiency ratio (1) Noninterest expense down $285 million from 2Q12 driven by lower operating losses and seasonally lower insurance commissions expense - Salaries expense down $57 million, or 2%, as lower severance expense was partially offset by 2,600 additional FTEs primarily in mortgage and the retail bank Eastern franchise - Employee benefits expense up $14 million, or 1%, as $152 million in higher deferred compensation expense was partially offset by other lower employee benefits - Other expense down $363 million LQ and included: • Operating losses down $243 million on lower litigation accruals • Insurance commissions expense down $132 million driven by seasonality Efficiency ratio of 57.1% in 3Q12 was the lowest in ten quarters Continue to target an efficiency ratio of 55%- 59% Efficiency Ratio 59.5% 60.7% 60.1% 58.2% 57.1% 11,677 12,508 12,993 12,397 12,112 3Q11 4Q11 1Q12 2Q12 3Q12 - ~$100 million in outside professional services expense associated with mortgage servicing regulatory consent orders, stable LQ 3Q12 expenses included: vs vs ($ in millions) 3Q12 2Q12 3Q11 Noninterest expense Salaries $ 3,648 (2) % (2) Commission and incentive compensation 2,368 1 13 Employee benefits 1,063 1 36 Equipment 510 11 (1) Net occupancy 727 4 (3) Core deposit and other intangibles 419 - (10) FDIC and other deposit assessments 359 8 8 Other 3,018 (11) - Total noninterest expense $ 12,112 (2) % 4 (1) Efficiency ratio defined as noninterest expense divided by total revenue (net interest income plus noninterest income). |
 Wells Fargo 3Q12 Supplement 11 Community Banking Average loans were flat LQ as growth in first mortgage, credit card, core auto and private student lending was partially offset by non- strategic/liquidating portfolio run-off and lower home equity outstandings Regional Banking Continued franchise and cross-sell growth (1) - Consumer checking (2) essentially flat to prior year - Business checking (2) up a net 3.9% - Retail bank cross-sell of 6.04 products per household up from 5.90 in 3Q11 • West cross-sell = 6.40 • East cross-sell = 5.56 Consumer Lending Credit card penetration (1) (3) rose to 32.1%, up from 31.0% in 2Q12 and 28.1% in 3Q11 Consumer auto originations of $6.3 billion, down 3% LQ and up 20% YoY Mortgage originations of $139 billion up 6% LQ - 14% of originations were from HARP (4) Quarter-end pipeline of $97 billion down 5% LQ Managed residential mortgage servicing of $1.9 trillion up 1% LQ (1) Metrics reported on a one-month lag from reported quarter-end; for example 3Q12 cross-sell is as of August 2012. (2) Checking account growth is 12-months ending for each respective period. (3) Household penetration as of August 2012 and defined as the percentage of retail banking deposit households that have a credit card with Wells Fargo. Household penetration has been redefined to include legacy Wells Fargo Financial accounts. (4) Home Affordable Refinance Program. vs vs ($ in millions) 3Q12 2Q12 3Q11 Net interest income $ 7,247 (1) % - Noninterest income 5,863 1 12 Provision for credit losses 1,627 3 (18) Noninterest expense 7,402 (2) 7 Income tax expense 1,250 (5) 2 Segment earnings $ 2,740 8 % 18 ($ in billions) Avg loans, net $ 485.3 - (1) Avg core deposits 594.5 1 7 3Q12 2Q12 3Q11 Regional Banking Consumer checking account growth (1)(2) 0.1 % 1.0 6.3 Business checking account growth (1)(2) 3.9 3.8 4.0 Retail Bank household cross-sell (1) 6.04 6.00 5.90 vs vs ($ in billions) 3Q12 2Q12 3Q11 Consumer Lending Credit card payment volumes (POS) $ 12.1 4 % 15 Credit card penetration (1)(3) 32.1 110 bps 400 Home Mortgage Applications $ 188 (10) % 11 Application pipeline 97 (5) 15 Originations 139 6 56 Managed residential mortgage servicing ($ in trillions) $ 1.9 1 4 |
 Wells Fargo 3Q12 Supplement 12 Wholesale Banking Record net income of $2.0 billion Net interest income down 10% driven by lower PCI loan resolution income - Average loans up $6.9 billion driven by 2Q12 acquisitions and growth in commercial banking and capital finance Noninterest income up 5% LQ driven by higher trading, operating lease income and commercial mortgage banking Provision expense down $245 million LQ on lower losses, higher recoveries and a reserve release in the quarter Expenses down 7% LQ driven by seasonally lower insurance expense as well as lower foreclosed asset expense and personnel expense Treasury Management Commercial card spend volume of $4.1 billion up 3% LQ and 24% YoY Investment Banking Investment Banking fees from Commercial and Corporate Banking customers up 13% YTD from 2011 YTD 2012 YTD U.S. investment banking market share (3) of 5.1% Asset Management Total AUM up 3% LQ on higher market valuation and positive net flows across all asset classes (1) Approved and initiated. (2) Source: Dealogic U.S. investment banking fee market share. vs vs ($ in millions) 3Q12 2Q12 3Q11 Net interest income $ 3,028 (10) % 5 Noninterest income 2,921 5 31 Reversal of provision for credit losses (57) n.m. (68) Noninterest expense 2,908 (7) 8 Income tax expense 1,103 18 34 Segment earnings $ 1,993 6 % 11 ($ in billions) Avg loans, net $ 277.1 3 9 Avg core deposits 225.4 2 8 vs vs ($ in billions) 3Q12 2Q12 3Q11 Key Metrics: Commercial card spend volume $ 4.1 3 % 24 CEO Mobile Wire volume (1) 3.4 (19) 36 YTD U.S. investment banking market share % (2) 5.1 % - bps 30 Total AUM $ 450.4 3 % - Advantage Funds AUM 209.4 3 (1) |
 Wells Fargo 3Q12 Supplement 13 Wealth, Brokerage and Retirement Net interest income down 3% LQ driven by lower yields on allocated investments and loan portfolios Noninterest income up 4% LQ due to the impact of the higher equity market on hedged deferred compensation plan investment results (offset in expense) Total revenue rose 2%; excluding $76 million higher deferred compensation plan investment results, revenues were flat as lower securities gains and net interest income were partially offset by higher asset-based fees and brokerage transaction revenue Expenses up 3% LQ primarily due to $77 million higher deferred compensation expense; excluding deferred compensation, expenses were flat Retail Brokerage Managed account assets up 7% LQ and 25% YoY driven by strong net flows and market performance Wealth Management Wealth Management client assets up 1% LQ and 4% YoY Retirement IRA assets up 5% LQ and 13% YoY Institutional Retirement plan assets up 4% LQ and 14% YoY (1) Includes deposits. (2) Data as of August 2012. vs vs ($ in millions) 3Q12 2Q12 3Q11 Net interest income $ 680 (3) % (5) Noninterest income 2,353 4 8 Provision for credit losses 30 (19) (38) Noninterest expense 2,457 3 4 Income tax expense 208 (1) 17 Segment earnings $ 338 (1) % 17 ($ in billions) Avg loans, net $ 42.5 - (1) Avg core deposits 136.7 2 3 vs ($ in billions, except where noted) 3Q12 2Q12 Key Metrics: WBR Clients Assets (1) ($ in trillions) $ 1.4 4 % 10 Cross-sell (2) 10.27 - 2 Retail Brokerage Financial Advisors 15,167 - - Managed account assets $ 297 7 25 Client assets (1) ($ in trillions) 1.2 4 11 Wealth Management Client assets (1) 199 1 4 Retirement IRA Assets 295 5 13 Institutional Retirement Plan Assets 260 4 14 vs 3Q11 |
  Wells Fargo 3Q12 Supplement 14 3Q12 Credit quality highlights ($ in millions) 2Q12 Adjusted (1) Commercial nonaccruals 6,924 6,371 - 6,371 Consumer nonaccruals 13,654 14,673 1,441 13,232 Total nonaccrual loans 20,578 21,044 1,441 19,603 Total foreclosed assets 4,307 4,209 - 4,209 Total NPAs 24,885 25,253 1,441 23,812 as % of loans 3.21 % 3.23 3.04 Provision for credit losses 1,800 1,591 - 1,591 Commercial net charge-offs 358 217 - 217 Consumer net charge-offs 1,842 2,141 567 1,574 Total net charge-offs 2,200 2,358 567 1,791 as % of avg loans 1.15 % 1.21 0.92 Commercial 0.42 0.24 0.24 Consumer 1.76 2.01 1.48 Allowance for credit losses $ 18,646 17,803 (567) 18,370 as % of loans 2.41 % 2.27 2.35 as % of nonaccrual loans 91 85 94 Effect from OCC Guidance Implementation Reported 3Q12 (1) The OCC guidance requires write-down of performing consumer loans restructured in bankruptcy to collateral value. Management believes that the presentation in this Quarterly Supplement of information excluding the impact of the OCC guidance provides useful disclosure regarding the underlying credit quality of the Company’s loan portfolios. |
 Wells Fargo 3Q12 Supplement 15 1.8 2.0 2.0 1.8 1.6 3Q11 4Q11 1Q12 2Q12 3Q12 Credit quality Underlying trends showed continued improvement Excluding the effect of the implementation of OCC guidance as detailed on page 14: - Net charge-offs of $1.8 billion were down $409 million LQ • Commercial net charge-offs down $141 million on fewer losses and higher recoveries • Consumer net charge-offs down $268 million driven by lower consumer real estate losses - 0.92% net charge-off rate, down 23 bps LQ - NPAs declined $1.1 billion LQ on a $975 million decline in nonaccrual loans and a $98 million decline in foreclosed assets Provision expense of $1.6 billion, down $209 million from 2Q12 Early stage consumer delinquency balances increased 4% and rates increased 3 bps LQ Allowance for credit losses = $17.8 billion Currently expect future reserve releases absent significant deterioration in the economy Remaining PCI nonaccretable = 23.2% of remaining UPB (2) Accretable yield balance included a $4.3 billion increase reflecting an improved housing market forecast and credit outlook - $3.6 billion increase in expected cash flows - $687 million in nonaccretable difference reclassified to accretable yield (1) OCC guidance impact. (2) Unpaid principal balance for PCI loans that have not had a UPB charge-off. Net Charge-offs ($ in billions) Provision Expense ($ in billions) 2.6 2.6 2.4 2.2 2.4 3Q11 4Q11 1Q12 2Q12 3Q12 1.37% 1.36% 1.25% 1.15% 1.21% Net charge-off rate (as reported) 1.8 0.6 (1) Net charge-off rate (as adjusted) 0.92% |
 Wells Fargo 3Q12 Supplement 16 21.9 21.3 22.0 20.6 19.7 4.9 4.7 4.6 4.3 4.2 26.8 26.0 26.6 24.9 25.3 3Q11 4Q11 1Q12 2Q12 3Q12 Nonaccrual loans Foreclosed assets 1.5 1.5 1.2 1.1 1.2 0.4 0.5 0.4 0.3 0.3 1.9 2.0 1.6 1.4 1.5 3Q11 4Q11 1Q12 2Q12 3Q12 Consumer Commercial Credit quality Nonperforming Assets ($ in billions) Consumer Loans 30-89 DPD & Still Accruing (3)(4) (Balances and rates) Loans 90+ DPD and Still Accruing (3)(4) ($ in billions) (1) (2) 1.4 (2) (1) Includes $1.7 billion at March 31, 2012, resulting from implementation of Interagency Supervisory Guidance on Allowance for Loan and Lease Losses Estimation Practices for Loans and Lines of Credit Secured by Junior Liens on 1-4 Family Residential Properties issued January 31, 2012. (2) OCC guidance impact. (3) Consumer includes mortgage loans held for sale 30-89 days and 90 days or more past due and still accruing. (4) Excludes mortgage loans insured/guaranteed by the FHA or VA, reverse mortgages, margin loans and student loans whose repayments are predominantly guaranteed by guarantee agencies on behalf of the U.S. Department of Education under the Federal Family Education Loan Program. Also excludes the carrying value of PCI loans contractually delinquent. 2.37% 2.40% 2.00% 1.94% 1.97% 8.2 8.3 6.8 6.6 6.9 $0 $5 $10 3Q11 4Q11 1Q12 2Q12 3Q12 |
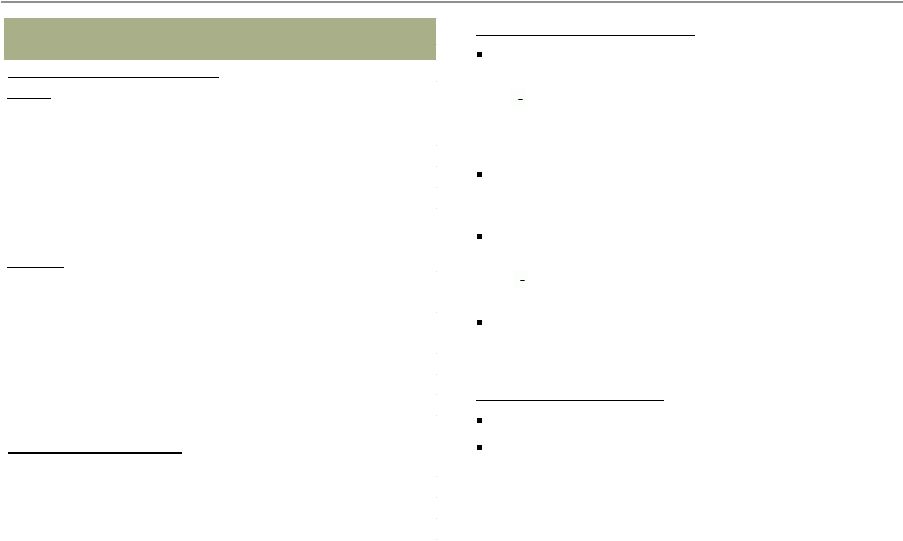
 Wells Fargo 3Q12 Supplement 17 Mortgage servicing Wells Fargo has a high quality servicing portfolio Residential Mortgage Servicing Portfolio $1.9 Trillion (as of September 30, 2012) Agency Retained and acquired portfolio Non-agency securitizations of WFC originated loans Non-agency acquired servicing and private whole loan sales 71% of the portfolio is with the Agencies (FNMA, FHLMC and GNMA) 20% are loans that we retained or acquired - Loss exposure handled through loan loss reserves and PCI nonaccretable 4% are private securitizations where Wells Fargo originated the loan and therefore has some repurchase risk - 78% prime at origination - 58% from pre-2006 vintages - Insignificant amount of home equity and no option ARMs - ~50% do not have traditional reps and warranties 5% are non-agency acquired servicing and private whole loan sales - 4% is acquired servicing where Wells Fargo did not underwrite and securitize and has repurchase recourse with the originator - 1% are private whole loan sales • Less than 2% subprime at origination • Loans sold to others and subsequently securitized are included in private securitizations above 71% 20% 4% 5% |
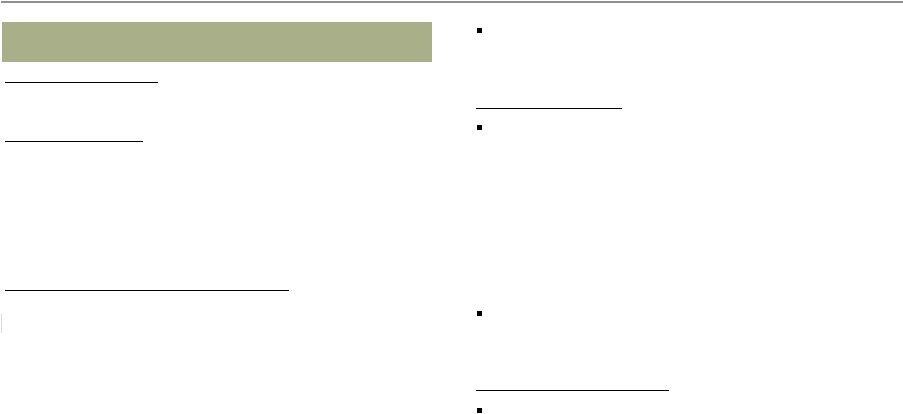
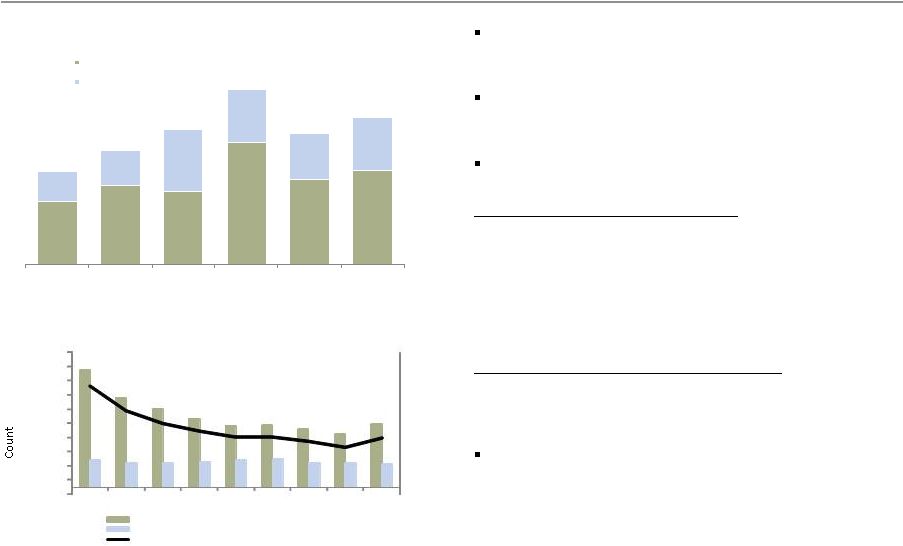 Wells Fargo 3Q12 Supplement 18 4.86 6.10 5.57 9.39 6.52 7.24 2.28 2.64 4.85 4.10 3.58 4.13 7.14% 8.74% 10.42% 13.49% 10.10% 11.37% Wells Fargo Citi JPM Chase Bank of America Industry Industry ex WFC Deliquency Rate Foreclosure Rate Mortgage servicing Delinquency and outstanding repurchase demands 2Q12 Wells Fargo delinquency and foreclosure ratio continued to be significantly lower than peers Wells Fargo’s total delinquency and foreclosure ratio for 3Q12 was 7.32%, up LQ due to seasonality, but down from 7.63% in 3Q11 Balance of total outstanding repurchase demands were up 20% LQ but down 1% YoY Agency demands outstanding - Agency repurchase demands outstanding up from 2Q12 on lower resolutions - New agency demands in total and in the 2006- 2008 vintages down LQ - Demands on newer vintage originations continued to emerge consistent with our estimates Non-Agency demands outstanding - Balance of non-agency repurchase demands outstanding up LQ primarily due to new demands that had been previously reserved for Repurchase reserves of $2.0 billion increased $269 million LQ on lower losses/reserve usage and included a $462 million reserve addition vs. $669 million in 2Q12 - Incorporates current demand levels - Anticipates future expected demands (2) Total Outstanding Repurchase Demands (3) and Agency New Demands for 2006-2008 Vintages 2Q12 Servicing Portfolio Delinquency Performance (1) $3.84 $2.95 $2.49 $2.24 $2.02 $2.01 $1.86 $1.67 $2.00 (1,000) 1,000 3,000 5,000 7,000 9,000 11,000 13,000 15,000 17,000 19,000 3Q10 4Q10 1Q11 2Q11 3Q11 4Q11 1Q12 2Q12 3Q12 Number of Outstanding Demands Agency New Demands for 2006-2008 Vintages Original Loan Balance of Outstanding Demands ($ in B) (2) Industry is all large servicers ($6.1 trillion) including WFC, C, JPM and BAC. (3) Includes mortgage insurance rescissions. (1) Inside Mortgage Finance, data as of June 30, 2012. Industry excluding WFC performance calculated based on IMF data. |
 Wells Fargo 3Q12 Supplement 19 Capital 9.34% 9.46% 9.98% 10.08% 10.06% 3Q11 4Q11 1Q12 2Q12 3Q12 Capital remained strong Tier 1 common equity ratio under Basel I of 10.06% - Ratio reduced by 32 bps resulting from refinements to the risk weighting of certain unused lending commitments that provide for the ability to issue standby letters of credit Tier 1 common equity ratio under Basel III is estimated to be 8.02% at 9/30/12 (1) Tier 1 Common Equity Ratio Under Basel I See Appendix page 35 for additional information on Tier 1 common equity. 3Q12 capital ratios are preliminary estimates. (1) Estimated Basel III calculation based on management’s current interpretation of the Basel III capital rules proposed by federal banking agencies in notices of proposed rulemaking announced in June 2012. The proposed rules and interpretations and assumptions used in estimating Basel III calculations are subject to change depending on final promulgation of Basel III capital rules. See pages 35-36 for additional information regarding Tier 1 common equity ratios. Purchased 16.5 million common shares in 3Q12 and entered into a $300 million 3Q12 forward repurchase transaction, estimated to be 9 million shares, that is expected to settle in 4Q12 |
 Wells Fargo 3Q12 Supplement 20 Demonstrated momentum across the franchise (1) Metrics reported on a one-month lag from reported quarter-end; for example 3Q12 cross-sell is as of August 2012 (2) Checking account growth is 12-months ending August 2012. (3) Household penetration as of August 2012 and defined as the percentage of retail banking deposit households that have a credit card with Wells Fargo. (4) As of June 2012. $11.4 billion in net new loan commitments to small business customers (primarily with annual revenues less than $20 million) in the first three quarters of 2012, up approximately 30% from prior year Consumer credit card new accounts in 3Q12 increased 6% LQ and 46% YoY with household penetration increasing 110 bps LQ to 32.1% (3) Focus on helping clients meet their financial needs contributed to a 7% LQ and 25% YoY increase in managed account assets to $297 billion at quarter end Cross-sell of 6.7 products per relationship (4) up from 6.5 at year-end 2011 driven by increased penetration with eastern commercial banking customers across multiple products CMBS volumes tripled LQ Record cross-sell of 10.27 products per household up from 10.04 in 3Q11 (1) Dealer Services added 960 GM dealers in 3Q12 bringing total new dealers for 2012 to 1,683 Business checking accounts up a net 3.9% YoY (2) Rolled out Wells Fargo Mobile ® Deposit to 13 states; on track to complete roll out by year-end Retail bank cross-sell of 6.04 products per household up from 5.90 in 3Q11 (1) Regional Banking Consumer Lending Group Wholesale Banking Wealth, Brokerage and Retirement |
 Wells Fargo 3Q12 Supplement 21 Summary Record earnings of $4.9 billion and record diluted earnings per share of $0.88 Stable revenue and lower expenses resulted in positive operating leverage Expenses down $285 million from 2Q12 - 3Q12 efficiency ratio of 57.1% within our target range of 55% to 59% (1) Higher PTPP of $9.1 billion Strong core credit performance Solid returns - ROA = 1.45%, up 4 bps LQ and up 19 bps YoY - ROE = 13.38%, up 52 bps LQ and up 152 bps YoY Capital levels remained strong (1) Noninterest expense and our efficiency ratio may be affected by a variety of factors, including business and economic cyclicality, seasonality, changes in our business composition and operating environment, growth in our business and/or acquisitions, and unexpected expenses relating to, among other things, litigation and regulatory matters. |
 Wells Fargo 3Q12 Supplement 22 Appendix |
 Wells Fargo 3Q12 Supplement 23 (1) Net of purchase accounting adjustments. Non-strategic/liquidating loan portfolio risk reduction -$74.3 -$4.2 -$92.2 -$4.1 -$5.1 -$4.5 ($ in billions) 3Q12 2Q12 1Q12 4Q11 3Q11 4Q08 Pick-a-Pay mortgage (1) $ 60.1 62.0 64.0 65.7 67.4 95.3 Liquidating home equity 5.0 5.2 5.5 5.7 6.0 10.3 Legacy WFF indirect auto 1.1 1.5 1.9 2.5 3.1 18.2 Legacy WFF debt consolidation 15.0 15.5 16.0 16.5 17.2 25.3 Education Finance - gov't guaranteed 13.0 13.8 14.8 15.4 15.6 20.5 Legacy WB C&I, CRE and foreign PCI loans (1) 3.8 4.3 5.2 5.7 6.3 18.7 Legacy WB other PCI loans (1) 0.6 0.8 0.8 0.8 0.9 2.5 Total $ 98.6 103.1 108.2 112.3 116.5 190.8 |
 Wells Fargo 3Q12 Supplement 24 Purchased credit-impaired (PCI) portfolios Legacy Wachovia PCI loans continued to perform better than originally expected (2) Reflects releases of $1.8 billion for loan resolutions and $5.2 billion from the reclassification of nonaccretable difference to the accretable yield, which will result in increasing income over the remaining life of the loan or pool of loans. ($ in billions) (1) December 31, 2008 $ 29.2 62.5 6.5 98.2 June 30, 2012 6.6 34.6 1.7 42.9 September 30, 2012 5.9 33.1 1.5 40.5 12/31/08 Nonaccretable difference $ 10.4 26.5 4.0 40.9 Addition of nonaccretable difference due to acquisitions 0.2 - - 0.2 Losses from loan resolutions and write-downs (6.9) (16.8) (2.8) (26.5) Release of nonaccretable difference since merger (3.1) (3.0) (0.9) (7.0) (2) 9/30/12 Remaining nonaccretable difference 0.6 6.7 0.3 7.6 Additional provision since 2008 merger $ (1.7) - (0.1) (1.8) Release of nonaccretable difference since 2008 merger 3.1 3.0 0.9 7.0 (2) Net performance 1.4 3.0 0.8 5.2 Commercial Pick-a-Pay Other consumer Total Life-to-date net performance Nonaccretable difference rollforward Adjusted unpaid principal balance (1) Includes write-downs taken on loans where severe delinquency (normally 180 days) or other indications of severe borrower financial stress exist that indicate there will be a loss of contractually due amounts upon final resolution of the loan. |
 Wells Fargo 3Q12 Supplement 25 $687 million in nonaccretable difference reclassified to accretable yield in the quarter - $603 million reclass from Pick-a-Pay portfolio reflects improved housing market forecast and credit outlook $376 million of the $905 million in losses from loan resolutions and write-downs in the quarter resulted from implementation of OCC guidance $7.6 billion in nonaccretable difference remains to absorb losses on PCI loans - Remaining nonaccretable = 23.2% of unpaid principal balance (UPB) (5) • Remaining Pick-a-Pay nonaccretable = 24.9% of Pick-a-Pay UPB (5) PCI nonaccretable difference Analysis of nonaccretable difference for PCI loans ($ in millions) Pick-a-Pay Total Balance at June 30, 2012 $ 658 8,128 Release of nonaccretable difference due to: Loans resolved by settlement with borrower (1) (24) - - Loans resolved by sales to third parties (2) (4) - - Reclassification to accretable yield for loans with improving credit-related cash flows (3) (41) (603) Use of nonaccretable difference due to: Losses from loan resolutions and write-downs (4) (32) (846) Balance at September 30, 2012 $ 557 6,679 (27) (905) 370 7,606 (24) (4) (43) (687) Other consumer Commercial 440 9,226 (1) Release of the nonaccretable difference for settlement with borrower, on individually accounted PCI loans, increases interest income in the period of settlement. Pick-a-Pay and Other consumer PCI loans do not reflect nonaccretable difference releases for settlements with borrowers due to pool accounting for those loans, which assumes that the amount received approximates the pool performance expectations. (2) Release of the nonaccretable difference as a result of sales to third parties increases noninterest income in the period of the sale. (3) Reclassification of nonaccretable difference to accretable yield for loans with increased cash flow estimates will result in increased interest income as a prospective yield adjustment over the remaining life of the loan or pool of loans. (4) Write-downs to net realizable value of PCI loans are absorbed by the nonaccretable difference when severe delinquency (normally 180 days) or other indications of severe borrower financial stress exist that indicate there will be a loss of contractually due amounts upon final resolution of the loan. (5) Unpaid principal balance of loans without write-downs. |
 Wells Fargo 3Q12 Supplement 26 Accretable yield balance increased $3.8 billion LQ and included: - Accretion into interest income of $495 million, down LQ reflecting lower settlements with borrowers - $687 million reclass from nonaccretable difference - $3.6 billion increase in expected cash flows reflecting an improved housing market forecast and credit outlook Balance of $18.9 billion expected to accrete to income over the remaining life of the underlying loans PCI accretable yield (1) Includes accretable yield released as a result of settlements with borrowers, which is included in interest income. (2) Includes accretable yield released as a result of sales to third parties, which is included in noninterest income. (3) Represents changes in cash flows expected to be collected due to changes in interest rates on variable rate PCI loans, changes in prepayment assumptions and the impact of modifications. Cumulative Accretable yield rollforward since ($ in millions) 3Q12 2Q12 merger Total, beginning of period $ 15,153 15,763 10,447 Addition of accretable yield due to acquisitions - - 128 Accretion into interest income (1) (495) (630) (8,838) Accretion into noninterest income due to sales (2) - (5) (242) Reclassification from nonaccretable difference for loans with improving credit-related cash flows 687 84 5,219 Changes in expected cash flows that do not affect nonaccretable difference (3) 3,567 (59) 12,198 Total, end of period $ 18,912 15,153 18,912 |
 Wells Fargo 3Q12 Supplement 27 PCI accretable yield (Commercial (1) and Pick-a-Pay) Commercial accretion (2) decreased $119 million and accretable yield percentage declined to 16.62% reflecting lower settlements with borrowers Pick-a-Pay accretable yield balance increased $3.7 billion reflecting an improved housing market forecast and credit outlook - Weighted average life increased to 12.7 years Pick-a-Pay PCI Accretable Yield ($ in millions) 3Q12 2Q12 1Q12 PCI interest income Accretion $ 287 303 311 Average carrying value 27,260 28,041 28,734 Accretable yield percentage 4.21 % 4.32 4.32 Accretable yield balance $ 17,189 13,466 13,709 Weighted average life (years) 12.7 11.4 11.0 Commercial (1) PCI Accretable Yield ($ in millions) 3Q12 2Q12 1Q12 PCI interest income Accretion and resolution income $ 204 323 210 Average carrying value 4,914 5,629 6,638 Accretable yield percentage (2) 16.62 % 22.95 12.61 Accretable yield balance $ 978 1,008 1,347 Weighted average life (years) 2.8 2.2 2.8 (1) Includes both legacy Wachovia PCI loans as well as recently purchased PCI loans. (2) Includes resolution income. |
 Wells Fargo 3Q12 Supplement 28 Pick-a-Pay mortgage portfolio Carrying value of $60.1 billion in first lien loans outstanding, down $2.0 billion from 2Q12 and down $35.2 billion from 4Q08 on paid-in-full loans and loss mitigation efforts Adjusted unpaid principal balance of $66.1 billion, down $2.8 billion from 2Q12 and down $49.6 billion from 4Q08 $4.6 billion in modification principal forgiveness since acquisition reflects over 109,000 completed full-term modifications; additional $401 million of conditional forgiveness that can be earned by borrowers through performance over the next 3 years Modification redefault rate has been consistently better than the industry average (as measured by 60+ DPD after six months) ($ in millions) Product type Adjusted unpaid principal balance % of total Adjusted unpaid principal balance % of total Adjusted unpaid principal balance % of total Option payment loans (1) $ 33,364 50 % $ 35,353 51 % $ 99,937 86 % Non-option payment adjustable-rate and fixed-rate loans (1)(2) 8,974 14 9,315 14 15,763 14 Full-term loan modifications (1) 23,736 36 24,184 35 - - Total adjusted unpaid principal balance (1)(2) $ 66,074 100 % $ 68,852 100 % $ 115,700 100 % Total carrying value 60,080 62,045 95,315 At 6/30/2012 At 9/30/2012 (3) At 12/31/2008 (1) Adjusted unpaid principal includes write-downs taken on loans where severe delinquency (normally 180 days) or other indications of severe borrower financial stress exist that indicate there will be a loss of contractually due amounts upon final resolution of the loan. (2) Includes loans refinanced under the Consumer Relief Refinance Program. (3) Reflects OCC guidance. |
 Wells Fargo 3Q12 Supplement 29 Pick-a-Pay credit highlights Non-PCI portfolio Loans down 4% LQ driven by loans paid-in-full 85% of portfolio current Nonaccrual loans increased $210 million, or 6%, LQ $394 million of nonaccruals associated with implementation of OCC guidance $152 million of nonaccrual TDRs reclassified to accruing TDR status based on borrower payment performance $4.0 billion in nonaccruals includes $1.7 billion of nonaccruing TDRs Net charge-offs of $177 million down $26 million LQ and included $42 million in losses from the implementation of OCC guidance 43% of portfolio with LTV (2) 80% PCI portfolio Carrying value down 3% 67% of portfolio current Life-of-loan losses continued to be lower than originally projected at time of merger ($ in millions) 3Q12 2Q12 Non-PCI loans Carrying value (1) $ 33,096 34,342 Nonaccrual loans 4,018 3,808 as a % of loans 12.14 % 11.09 Net charge-offs $ 177 203 as % of avg loans 2.09 % 2.35 90+ days past due as % of loans 10.09 10.16 Current average LTV (2) 84 % 85 Current average FICO 683 682 Contractual average loan size $ 204,000 206,000 Contractual average age of loans 8.54 years 8.29 % of loans in California 49 % 49 ($ in millions) 3Q12 2Q12 PCI loans Adjusted unpaid principal balance (3) $ 33,107 34,644 Carrying value (1) 26,984 27,703 Current average LTV (2) 90 % 89 Current average FICO 617 615 Contractual average loan size $ 304,000 307,000 Contractual average age of loans 6.50 years 6.25 % of loans in California 68 % 68 (1) The carrying value, which does not reflect the allowance for loan losses, includes purchase accounting adjustments, which, for PCI loans, are the nonaccretable difference and the accretable yield, and for all other loans, an adjustment to mark the loans to a market yield at date of merger less any subsequent charge-offs. (2) The current loan-to-value (LTV) ratio is calculated as the net carrying value (defined in (1) above) divided by the collateral value. (3) The adjusted unpaid principal balance includes write-downs taken on loans where severe delinquency (normally 180 days) or other indications of severe borrower financial stress exist that indicate there will be a loss of contractually due amounts upon final resolution of the loan. |
 Wells Fargo 3Q12 Supplement 30 Real estate 1-4 family first mortgage portfolio First lien mortgage loans up 4% as growth in core first lien mortgage was partially offset by continued run-off in the liquidating portfolio Pick-a-Pay non-PCI portfolio down 4% PCI portfolio down 3% Debt consolidation first lien down 3% Core first lien up $12.8 billion, or 8%, reflecting strong origination volumes and the decision to retain $9.8 billion of conforming production Core first lien mortgage nonaccruals up $496 million reflecting the implementation of OCC guidance Core net charge-offs down $67 million - - - - (1) Ratios on Legacy WFF debt consolidation first mortgage loan portfolio only. (2) Ratios on non run-off first lien mortgage loan portfolio only. ($ in millions) 3Q12 2Q12 Total real estate 1-4 family first mortgage $ 240,554 230,263 Less consumer non-strategic/liquidating portfolios: Pick-a-Pay non-PCI first lien mortgage 33,096 34,342 PCI first lien mortgage 27,535 28,331 Debt consolidation first mortgage portfolio 14,640 15,129 Core first lien mortgage 165,283 152,461 Nonaccrual loans $ 2,279 2,158 as % of loans 15.57 % 14.26 Net charge-offs $ 214 191 as % of average loans 5.77 % 4.97 Nonaccrual loans $ 4,898 4,402 as % of loans 2.96 % 2.89 Net charge-offs $ 282 349 as % of loans 0.69 % 0.92 Legacy WFF debt consolidation first mortgage loan performance (1) Core first lien mortgage loan performance (2) |
 Wells Fargo 3Q12 Supplement 31 Home equity portfolio Core Portfolio (1) Outstandings down 3% - High quality new originations with weighted average CLTV of 62%, 777 FICO, and 32% total debt service ratio 3Q12 losses increased $308 million and included $384 million from the implementation of OCC guidance 2+ delinquencies stable Continued decline in delinquency rate for loans with a CLTV >100%, 3 bps improvement Liquidating Portfolio Outstandings down 5% 3Q12 losses increased $40 million and included $52 million from the implementation of OCC guidance 2+ delinquencies declined $19 million Continued decline in delinquency rate for loans with a CLTV >100%, 39 bps improvement Total home equity portfolio = $98 billion 21% in 1 lien position 40% in junior lien position behind WFC owned or serviced 1 lien - Current 1 lien, Current junior lien = 95.9% - Current 1 lien, Delinquent junior lien = 0.9% - Delinquent 1 lien, Current junior lien = 1.4% - Delinquent 1 lien, Delinquent junior lien = 1.8% 39% in junior lien position behind third party 1 lien Excludes purchased credit-impaired loans. (1) Includes equity lines of credit and closed-end junior liens associated with the Pick-a-Pay portfolio totaling $1.4 billion at September 30, 2012 and $1.4 billion at June 30, 2012. (2) CLTV is calculated based on outstanding balance plus unused lines of credit divided by estimated home value. Estimated home values are determined predominantly based on automated valuation models updated through September 2012. (3) Unsecured balances, representing the percentage of outstanding balances above the most recent home value. ($ in millions) 3Q12 2Q12 Core Portfolio (1) Outstandings $ 92,979 95,753 Net charge-offs 935 627 as % of avg loans 3.93 % 2.60 2+ payments past due $ 2,685 2,686 as % loans 2.90 % 2.81 % CLTV > 100% (2) 35 36 2+ payments past due 3.90 3.93 % Unsecured balances (3) 16 16 % 1st lien position 21 21 Liquidating Portfolio Outstandings $ 4,951 5,199 Net charge-offs 148 108 as % of avg loans 11.60 % 8.14 2+ payments past due $ 199 218 as % loans 4.03 % 4.19 % CLTV > 100% (2) 72 73 2+ payments past due 4.07 4.46 % 1st lien position 4 4 st st st st st st st |
 Wells Fargo 3Q12 Supplement 32 Credit card portfolio $23.7 billion credit card outstandings up 4% from 2Q12 and 9% YoY on strong account growth - Consumer credit card new accounts in 3Q12 increased 6% LQ and 46% YoY with household penetration increasing to 32.1% (1) - Purchase dollar volume increased 4% and transactions rose 5% from 2Q12 - Purchase dollar volume increased 15% and transactions rose 18% from 3Q11 Net charge-offs down $28 million, or 70 bps, LQ and down $54 million, or 123 bps, YoY reflecting continued steady improvement (1) Household penetration as of August 2012 and defined as the percentage of retail banking deposit households that have a credit card with Wells Fargo. ($ in millions) 3Q12 2Q12 Credit card outstandings $ 23,692 22,706 Net charge-offs 212 240 as % of avg loans 3.67 % 4.37 |
 Wells Fargo 3Q12 Supplement 33 Auto portfolios (1) Core Consumer Portfolio Core auto outstandings of $46.0 billion up 3% LQ and 10% YoY Continued strong originations; 3Q12 originations down 3% LQ on increased competition and lower risk-adjusted returns but up 20% YoY on growth across the credit spectrum Nonaccrual loans increased $150 million LQ and included $155 million from the implementation of OCC guidance Net charge-offs were up $33 million LQ reflecting seasonality and higher delinquencies September Manheim index of 120.7, down 2% LQ and down 2% from September 2011 30+ days past due increased $96 million LQ reflecting seasonality Commercial Portfolio Loans of $6.6 billion were stable linked quarter Continued strong credit performance (1) Legacy Wells Fargo Financial indirect portfolio balance as of September 30, 2012, was $1,104 million. ($ in millions) 3Q12 2Q12 Direct Auto outstandings $ 2,357 2,387 Nonaccrual loans 46 46 as % of loans 1.95 % 1.92 Net charge-offs $ 6 0 as % of avg loans 1.02 % n.m. 30+ days past due $ 30 26 as % of loans 1.27 % 1.09 Indirect Auto outstandings $ 43,613 42,411 Nonaccrual loans 218 68 as % of loans 0.50 % 0.16 Net charge-offs $ 57 30 as % of avg loans 0.52 % 0.29 30+ days past due $ 609 517 as % of loans 1.40 % 1.22 Auto outstandings $ 6,599 6,652 Nonaccrual loans - - as % of loans - % - Net charge-offs (recoveries) $ - - as % of avg loans n.m. % n.m. Commercial Portfolio Core Consumer Portfolios |
 Wells Fargo 3Q12 Supplement 34 Student lending portfolio $23.5 billion student lending outstandings down 3% LQ Private Portfolio $10.6 billion private loans outstandings up 2% LQ and up 8% YoY Applications increased 67% LQ due to peak season Dollar originations increased 205% LQ due to seasonality Continued to originate high quality loans with an average FICO of 759 and 79% of new loans co- signed Net charge-offs up $1 million LQ due to seasonality of repayments on loans Government Portfolio $13.0 billion liquidating government guaranteed outstandings declined 6% LQ and 17% YoY ($ in millions) 3Q12 2Q12 Education Finance Total outstandings $ 23,504 24,131 Private Portfolio Private outstandings $ 10,553 10,308 Net charge-offs 27 26 as % of avg loans 1.02 % 1.01 30 days past due $ 231 181 as % of loans 2.19 % 1.76 Government Guaranteed Portfolio Government outstandings $ 12,951 13,823 - - - |
 Wells Fargo 3Q12 Supplement 35 Tier 1 common equity under Basel I (1) Quarter ended Sept. 30, June 30, Mar. 31, Dec. 31, Sept. 30, 2012 2012 2012 2011 2011 $ 156.1 149.4 146.8 141.7 139.2 (1.4) (1.3) (1.3) (1.5) (1.5) 154.7 148.1 145.5 140.2 137.7 (11.3) (10.6) (10.6) (10.6) (10.6) (33.4) (33.5) (33.7) (34.0) (34.4) 3.3 3.5 3.7 3.8 4.0 (0.7) (0.7) (0.9) (0.8) (0.7) (6.4) (4.6) (4.1) (3.1) (3.7) (0.4) (0.5) (0.4) (0.4) (0.4) (A) $ 105.8 101.7 99.5 95.1 91.9 (B) $ 1,052.4 1,008.6 996.8 1,005.6 983.2 (A)/(B) 10.06 % 10.08 9.98 9.46 9.34 (1) (2) Total risk-weighted assets (2) Tier 1 common equity to total risk-weighted assets Cumulative other comprehensive income Under the regulatory guidelines for risk-based capital, on-balance sheet assets and credit equivalent amounts of derivatives and off-balance sheet items are assigned to one of several broad risk categories according to the obligor or, if relevant, the guarantor or the nature of any collateral. The aggregate dollar amount in each risk category is then multiplied by the risk weight associated with that category. The resulting weighted values from each of the risk categories are aggregated for determining total risk-weighted assets. The Company’s September 30, 2012, risk-weighted assets are preliminary and reflect the Company’s refinement to its determination of risk weighting of certain unused lending commitments that provide for the ability to issue standby letters of credit. Total estimated on-balance sheet, and total estimated derivative and off-balance sheet risk-weighted assets were $846.5 billion and $205.9 billion at September 30, 2012, respectively. Tier 1 common equity is a non-generally accepted accounting principle (GAAP) financial measure that is used by investors, analysts and bank regulatory agencies to assess the capital position of financial services companies. Management reviews Tier 1 common equity along with other measures of capital as part of its financial analyses and has included this non-GAAP financial information, and the corresponding reconciliation to total equity, because of current interest in such information on the part of market participants. Other Tier 1 common equity MSRs over specified limitations Wells Fargo & Company and Subsidiaries ($ in billions) Total equity Noncontrolling interests Total Wells Fargo stockholders' equity Adjustments: FIVE QUARTER TIER 1 COMMON EQUITY UNDER BASEL I (1) Preferred equity Goodwill and intangible assets (other than MSRs) Applicable deferred taxes |
 Wells Fargo 3Q12 Supplement 36 Tier 1 common equity under Basel III (Estimated) (1) Quarter ended Sept. 30, 2012 $ 105.8 6.0 Other 0.3 Total Adjustments from Basel I to Basel III 6.3 Threshold deductions, as defined under Basel III (4) (5) (0.7) Tier 1 common equity anticipated under Basel III (C) $ 111.4 (D) $ 1,390.1 (C)/(D) 8.02 % (1) (2) (3) (4) (5) (6) Under current Basel proposals, risk-weighted assets incorporate different classifications of assets, with certain risk weights based on a borrower's credit rating or Wells Fargo's own risk models, along with adjustments to address a combination of credit/counterparty, operational and market risks, and other Basel III elements. The amount of risk-weighted assets anticipated under Basel III is preliminary and subject to change depending on final promulgation of Basel III capital rulemaking and interpretations thereof by regulatory authorities. Volatility in interest rates can have a significant impact on the valuation of cumulative other comprehensive income and MSRs and therefore, may impact adjustments from Basel I to Basel III, and MSRs subject to threshold deductions, as defined under Basel III, in future reporting periods. Tier 1 common equity is a non-generally accepted accounting principle (GAAP) financial measure that is used by investors, analysts and bank regulatory agencies to assess the capital position of financial services companies. Management reviews Tier 1 common equity along with other measures of capital as part of its financial analyses and has included this non-GAAP financial information, and the corresponding reconciliation to total equity, because of current interest in such information on the part of market participants. Wells Fargo & Company and Subsidiaries TIER 1 COMMON EQUITY UNDER BASEL III (ESTIMATED) (1)(2) Tier 1 common equity to total risk-weighted assets anticipated under Basel III Threshold deductions, as defined under Basel III, include individual and aggregate limitations, as a percentage of Tier 1 common equity, with respect to MSRs, deferred tax assets and investments in unconsolidated financial companies. ($ in billions) Tier 1 common equity under Basel I Adjustments from Basel I to Basel III (3)(5) : Cumulative other comprehensive income related to AFS securities and defined benefit pension plans Total risk-weighted assets anticipated under Basel III (6) The Basel III Tier 1 common equity and risk-weighted assets are calculated based on management’s current interpretation of the Basel III capital rules proposed by federal banking agencies in notices of proposed rulemaking announced in June 2012. The proposed rules and interpretations and assumptions used in estimating Basel III calculations are subject to change depending on final promulgations of Basel III capital rules. Adjustments from Basel I to Basel III represent reconciling adjustments, primarily certain components of cumulative other comprehensive income deducted for Basel I purposes, to derive Tier 1 common equity under Basel III. |
Wells Fargo 3Q12 Supplement 37 Forward-looking statements and additional information Forward-looking statements: This Quarterly Supplement and management’s related presentation contain forward-looking statements about our future financial performance. These forward-looking statements include statements using words such as “believe,” “expect,” “anticipate,” “estimate,” “target”, “should,” “may,” “can,” “will,” “outlook,” “appears” or similar expressions. These forward- looking statements may include, among others, statements about: future credit quality and performance, including our current expectation of future loan loss reserve releases; mortgage repurchase exposure; exposure related to mortgage practices, including foreclosures and servicing; our noninterest expense and efficiency ratio, including our targeted efficiency ratio range as part of our expense management initiatives; the future economic environment; loan growth; our net interest margin, including our expectations regarding continued pressure on our net interest margin given the low interest rate environment; reduction or mitigation of risk in our loan portfolios; future effects of loan modification programs; life-of-loan loss estimates; the estimated impact of regulatory reform on our financial results and business and expectations regarding our efforts to mitigate such impact; and our estimated Tier 1 common equity ratio as of September 30, 2012, under proposed Basel III capital rules. Investors are urged to not unduly rely on forward-looking statements as actual results could differ materially from expectations. Forward-looking statements speak only as of the date made, and we do not undertake to update them to reflect changes or events that occur after that date. For more information about factors that could cause actual results to differ materially from expectations, refer to page 13 of Wells Fargo’s press release announcing our third quarter 2012 results, as well as Wells Fargo’s reports filed with the Securities and Exchange Commission, including the discussion under “Risk Factors” in our Annual Report on Form 10-K for the year ended December 31, 2011. Purchased credit-impaired loan portfolio: Loans that were acquired from Wachovia that were considered credit impaired were written down at acquisition date in purchase accounting to an amount estimated to be collectible and the related allowance for loan losses was not carried over to Wells Fargo’s allowance. In addition, such purchased credit-impaired loans are not classified as nonaccrual or nonperforming, and are not included in loans that were contractually 90+ days past due and still accruing. Any losses on such loans are charged against the nonaccretable difference established in purchase accounting and are not reported as charge-offs (until such difference is fully utilized). As a result of accounting for purchased loans with evidence of credit deterioration, certain ratios of the combined company are not comparable to a portfolio that does not include purchased credit-impaired loans. In certain cases, the purchased credit-impaired loans may affect portfolio credit ratios and trends. Management believes that the presentation of information adjusted to exclude the purchased credit-impaired loans provides useful disclosure regarding the credit quality of the non-impaired loan portfolio. Accordingly, certain of the loan balances and credit ratios in this Quarterly Supplement have been adjusted to exclude the purchased credit-impaired loans. References in this Quarterly Supplement to impaired loans mean the purchased credit-impaired loans. Please see pages 31-33 of the press release for additional information regarding the purchased credit-impaired loans. |