 2Q13 Quarterly Supplement July 12, 2013 Exhibit 99.2 |
 Wells Fargo 2Q13 Supplement 1 Appendix Pages 22-35 - Non-strategic/liquidating loan portfolio risk reduction 23 - Purchased credit-impaired (PCI) portfolios 24 - PCI nonaccretable difference 25 - PCI accretable yield 26 - Pick-a-Pay credit highlights 27 - Real estate 1-4 family first mortgage portfolio 28 - Home equity portfolio 29 - Consumer credit card portfolio 30 - Auto portfolios 31 - Student lending portfolio 32 Tier 1 common equity under Basel I 33 Tier 1 common equity under Basel III (Estimated) 34 Forward-looking statements and additional information 35 Table of contents 2Q13 Results - 2Q13 Results Page 2 - Year-over-year results 3 - Strong revenue diversification 4 - Balance Sheet and credit overview 5 - Income Statement overview 6 - Loans 7 - Deposits 8 - Net interest income 9 - Noninterest income 10 - Residential mortgage 11 - Noninterest expense and efficiency ratio 12 - Environmentally-elevated cost reduction 13 - Community Banking 14 - Wholesale Banking 15 - Wealth, Brokerage and Retirement 16 - Credit quality 17-18 - Capital 19 - Demonstrated momentum across the franchise 20 - 21 Summary – strong 2Q13 |
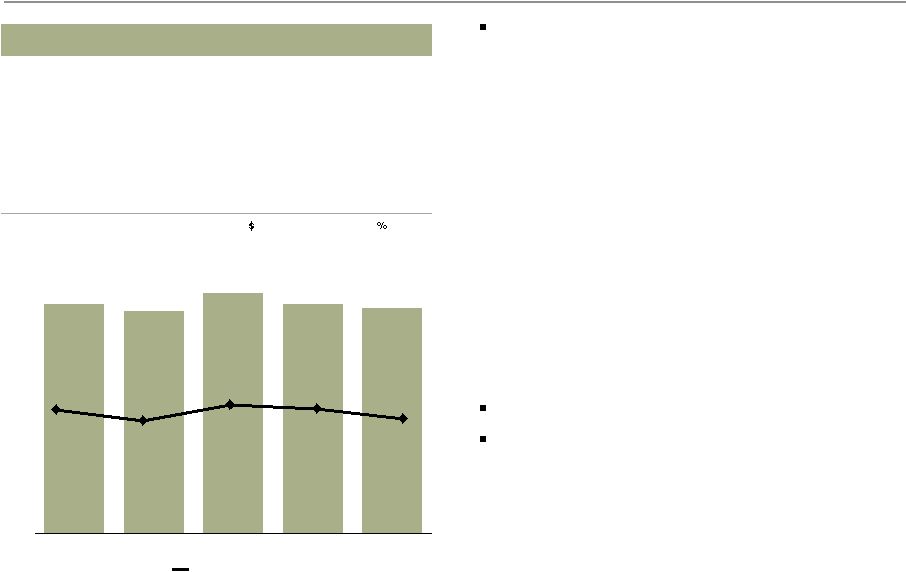
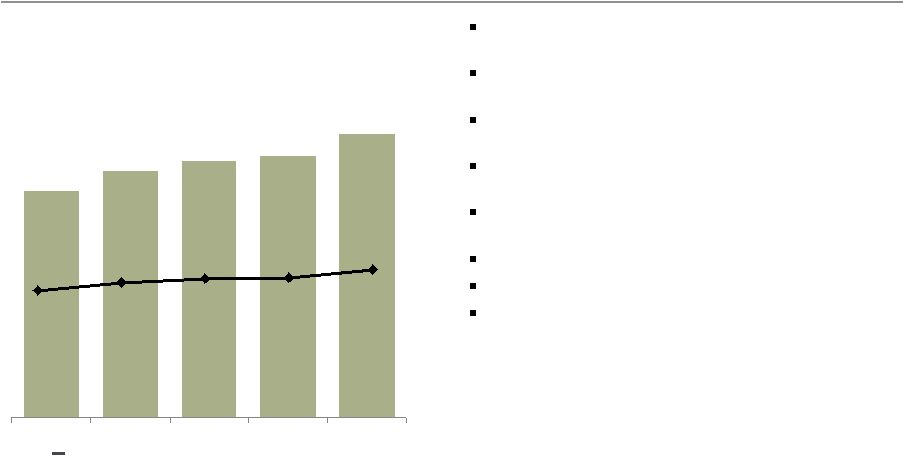 Wells Fargo 2Q13 Supplement 2 4,622 4,937 5,090 5,171 5,519 2Q12 3Q12 4Q12 1Q13 2Q13 Record earnings of $5.5 billion, up 19% year- over-year (YoY) and 7% linked quarter (LQ) Record diluted earnings per common share of $0.98, up 20% YoY and 7% LQ Efficiency ratio of 57.3% (1) , improved 90 bps YoY and 100 bps LQ Pre-tax pre-provision profit (2) of $9.1 billion, up 3% YoY and LQ Strong credit performance with net charge-offs of 58 bps, improved 57 bps YoY and 14 bps LQ ROA = 1.55%, up 14 bps YoY and up 6 bps LQ ROE = 14.02%, up 116 bps YoY and up 43 bps LQ Capital levels continued to grow - 10.73% Tier 1 common equity ratio under Basel I and estimated Tier 1 common equity ratio under Basel III of 8.54% (3) 2Q13 Results Wells Fargo Net Income ($ in millions) (1) Efficiency ratio defined as noninterest expense divided by total revenue (net interest income plus noninterest income). (2) Pre-tax pre-provision profit (PTPP) is total revenue less noninterest expense. Management believes PTPP is a useful financial measure because it enables investors and others to assess the Company’s ability to generate capital to cover credit losses through a credit cycle. (3) Estimated based on management’s interpretation of final rules adopted July 2, 2013, by the Federal Reserve Board establishing a new comprehensive capital framework for U.S. banking organizations that would implement the Basel III capital framework and certain provisions of the Dodd-Frank Act. See pages 33-34 for additional information regarding Tier 1 common equity ratios. Diluted earnings per common share $0.82 $0.88 $0.91 $0.92 $0.98 |
 Wells Fargo 2Q13 Supplement 3 $4.6 $5.5 2Q12 2Q13 Year-over-year results Pre-tax Pre-provision Profit ($ in billions) Net Income ($ in billions, except EPS) Diluted earnings per common share Period-end Loans ($ in billions) Return on Assets Return on Equity Period-end Core Deposits ($ in billions) $0.82 $0.98 12.86% 14.02% 2Q12 2Q13 1.41% 1.55% 2Q12 2Q13 $8.9 $9.1 2Q12 2Q13 672.1 714.4 103.1 87.6 $775.2 $802.0 2Q12 2Q13 Core loans Non-strategic/liquidating loans $882.1 $941.2 2Q12 2Q13 |
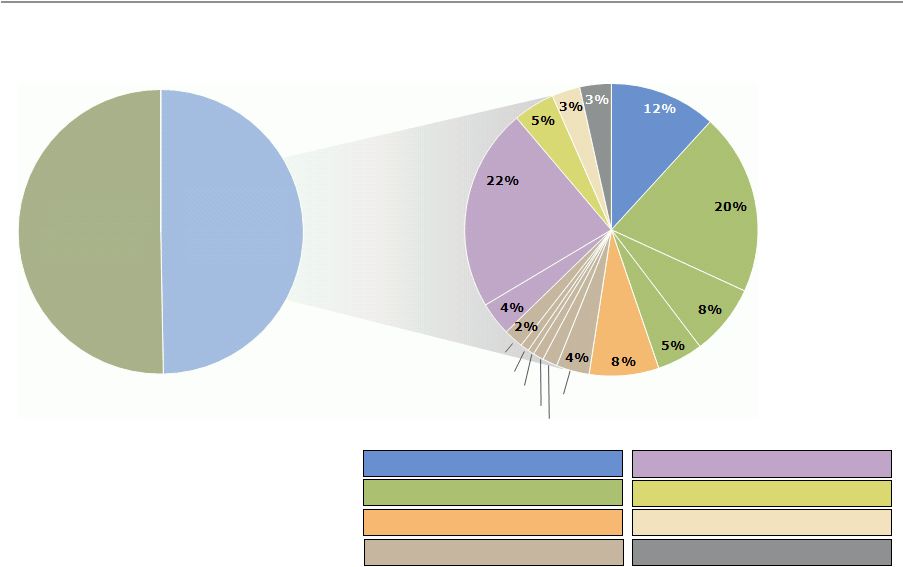 Wells Fargo 2Q13 Supplement 4 Balanced Spread and Fee Income Diversified Fee Generation Deposit Service Charges 12% Card Fees 8% Total Mortgage Banking 26% Insurance 5% Net Gains from Trading 3% All data is for 2Q13. (1) Other noninterest income includes net losses on debt securities available for sale, net gains from equity Strong revenue diversification Total Trust & Investment Fees 33% Total Other Fees 10% Other Noninterest Income (1) 3% Brokerage advisory, commissions and other Mortgage Orig./ Sales, net Mortgage Servicing, net Trust and investment management Investment banking Charges and fees on loans 1% Merchant processing 1% Cash network <1% CRE brokerage commissions 1% Letters of credit Card fees Deposit service charges Other noninterest income (1) Net gains from trading Insurance Net Interest Income Noninterest Income All other fees 50% 50% investments, lease income, life insurance investment income and all other noninterest income. |
 Wells Fargo 2Q13 Supplement 5 Balance Sheet and credit overview Loans Total period-end loans up $2.0 billion - Core loans increased $5.2 billion reflecting growth in nonconforming first mortgage, C&I, auto, foreign and credit card - Non-strategic/liquidating portfolio decreased $3.2 billion Short-term investments/ Fed funds sold Up $4.9 billion on continued strong deposit balance growth Securities available for sale (AFS) Up $1.3 billion as new investments were largely offset by run-off and a $6.1 billion reduction in the net unrealized gain - $21.1 billion in gross purchases, including $15.6 billion in agency MBS Deposits Up $10.9 billion driven by growth in Wholesale Banking Long-term debt Down $2.8 billion as $7.7 billion in issuances were more than offset by maturities and other reductions Common stock repurchases Purchased 26.7 million common shares in the quarter and entered into a $500 million forward repurchase transaction, estimated to be 13 million shares and expected to settle in 3Q13 Credit Provision expense of $652 million, down $567 million - Net charge-offs of $1.2 billion, or 58 bps, down $267 million on $46 million lower losses in commercial and $221 million lower losses in consumer - $500 million reserve release (2) vs. $200 million in 1Q13 Period-end balances. All result comparisons are 2Q13 compared with 1Q13. (2) Provision expense minus net charge-offs. (1) (1) See pages 7 and 23 for additional information regarding core loans and the non-strategic/liquidating portfolio, which comprises the Pick-a-Pay, liquidating home equity, legacy WFF indirect auto, legacy WFF debt consolidation, Education Finance-government guaranteed, and legacy Wachovia commercial & industrial, commercial real estate, foreign and other PCI loan portfolios. |
 Wells Fargo 2Q13 Supplement 6 Income Statement overview Total revenue Revenue of $21.4 billion, up $119 million, or 1%, driven by stronger trust and investment fees and higher net interest income Net interest income NII up 2% reflecting securities purchases, lower funding costs, one more day in the quarter and loan growth Net interest margin (NIM) down 2 bps to 3.46% reflecting continued growth in deposit balances Noninterest income Trust & investment fees up $292 million on strong investment banking and higher retail brokerage asset-based fees Mortgage banking stable as higher servicing income was largely offset by lower gain on sale (1) Market sensitive revenues (2) down $248 million - Lower trading gains and losses on debt securities offset higher gains on equity investments Other income down $465 million reflecting lower income from investments accounted for under the equity method and lower PCI loan sale gains Noninterest expense Personnel expense down $311 million reflecting lower employee benefits expense from 1Q13 seasonal highs and lower deferred compensation expense partially offset by annual merit increases and higher revenue-based incentive compensation Other expense up $312 million - Operating losses up $131 million primarily from litigation accruals on various legal matters - Advertising and promotion up $78 million on seasonality and new campaign launch All result comparisons are 2Q13 compared with 1Q13. (1) Net gains on mortgage loan origination/or sales activities. (2) Includes net gains from trading activities, net gains (losses) on debt securities available for sale and net gains from equity investments. |
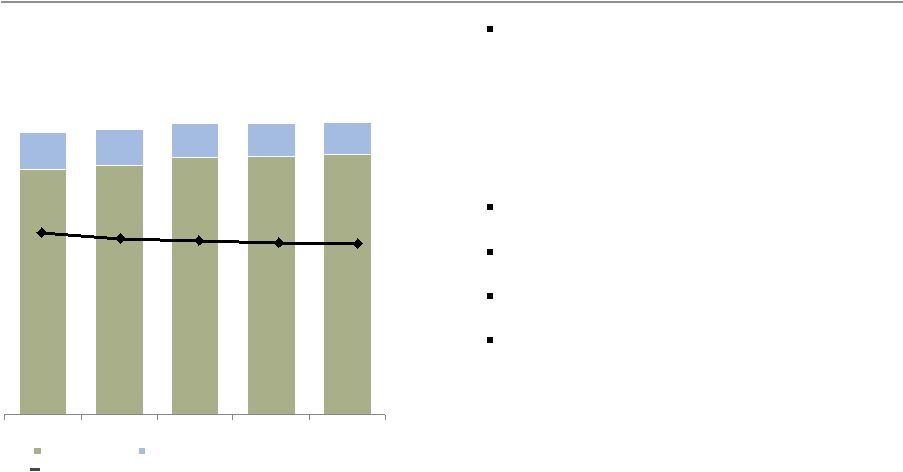 Wells Fargo 2Q13 Supplement 7 672.1 684.0 705.1 709.2 714.4 103.1 98.6 94.5 90.8 87.6 775.2 782.6 799.6 800.0 802.0 2Q12 3Q12 4Q12 1Q13 2Q13 Core loans Non-strategic/liquidating loans Loans Solid core loan growth Period-end loans up $26.8 billion YoY and $2.0 billion from 1Q13 - Commercial loans up $1.8 billion LQ on growth in C&I and foreign - Consumer loans up $250 million LQ as growth in nonconforming mortgage, auto and credit card was partially offset by run-off in the liquidating portfolio and lower core home equity Non-strategic/liquidating loans (1) down $15.5 billion YoY and $3.2 billion from 1Q13 Core loans grew $42.3 billion, or 6%, YoY and $5.2 billion LQ Total average loans of $800.2 billion up $32.0 billion YoY and $2.2 billion LQ Total average loan yield of 4.46%, down 3 bps LQ - Core loan yield excluding the non-strategic/ liquidating portfolio was down 7 bps - Non-strategic/liquidating portfolio yield of 5.33% (1) See page 23 for additional information regarding the non-strategic/liquidating portfolio, which comprises the Pick-a-Pay, liquidating home equity, legacy WFF indirect auto, legacy WFF debt consolidation, Education Finance-government guaranteed, and legacy Wachovia commercial & industrial, commercial real estate, foreign and other PCI loan portfolios. Period–end Loans Outstanding ($ in billions) (1) Total average loan yield 4.83% 4.63% 4.58% 4.49% 4.46% |
 Wells Fargo 2Q13 Supplement 8 669.5 711.9 729.7 254.5 274.3 280.1 924.0 986.2 1,009.8 2Q12 1Q13 2Q13 Interest-bearing deposits Noninterest-bearing deposits 0.19% 0.15% 0.14% Deposits Continued growth and reduced average cost Average deposits up $85.8 billion YoY and $23.6 billion LQ Average core deposits of $936.1 billion up $55.5 billion, or 6%, YoY and up $10.2 billion, or 4% annualized, LQ - 117% of average loans - Average retail core deposits up 7% YoY and 2% annualized LQ Average core checking and savings up $63.2 billion, or 8% YoY, and up $12.9 billion from 1Q13 - 94% of average core deposits Average deposit cost of 14 bps, down 1 bp from 1Q13 and 5 bps from 2Q12 Average Deposits and Rates ($ in billions) Average deposit cost Average Core Checking and Savings ($ in billions) 820.3 870.6 883.5 2Q12 1Q13 2Q13 |
 Wells Fargo 2Q13 Supplement 9 11,213 10,820 10,841 10,675 10,946 2Q12 3Q12 4Q12 1Q13 2Q13 Tax-equivalent net interest income (1) up 3% LQ reflecting securities purchases, lower funding costs, one additional day in the quarter, higher variable income and loan growth Average earning assets up $31.1 billion, or 3%, LQ - Short-term investments/fed funds sold up $15.5 billion - AFS securities up $8.9 billion - Loans up $2.2 billion NIM of 3.46% down 2 bps from 1Q13 on: - Deposit growth = (6) bps - Variable income = +2 bps - Continued balance sheet repricing, growth and mix = +2 bps Net interest income Net Interest Income (TE) (1) ($ in millions) Net Interest Margin (NIM) 3.91% 3.66% 3.56% 3.48% 3.46% (1) Tax-equivalent net interest income is based on the federal statutory rate of 35% for the periods presented. Net interest income was $11,037 million, $10,662 million, $10,643 million, $10,499 million and $10,750 million for 2Q12, 3Q12, 4Q12, 1Q13 and 2Q13 respectively. |
 Wells Fargo 2Q13 Supplement 10 Noninterest income Deposit service charges up $34 million LQ on seasonality and account growth Trust and investment fees up $292 million, or 9% LQ, on strong investment banking and higher retail brokerage asset-based fees - Investment banking fee growth reflects higher equity underwriting and loan syndication fees Card fees up $75 million reflecting credit card and debit card account growth and stronger POS volumes and transactions Other fees up $55 million driven by higher commercial real estate brokerage commissions and seasonally higher purchase volumes in merchant processing Mortgage banking stable - Net servicing income up $79 million which included higher servicing fees and lower net MSR/servicing hedge results - Gain on sale revenue down $71 million as lower margin more than offset a lower repurchase reserve build and stronger origination volumes 10,252 10,551 11,305 10,760 10,628 2Q12 3Q12 4Q12 1Q13 2Q13 vs vs ($ in millions) 2Q13 1Q13 2Q12 Noninterest income Service charges on deposit accounts $ 1,248 3 % 10 Trust and investment fees Brokerage advisory, commissions and other fees 2,127 4 15 Trust and investment management 829 4 9 Investment banking 538 52 85 Card fees 813 10 15 Other fees 1,089 5 (4) Mortgage banking 2,802 - (3) Insurance 485 5 (7) Net gains from trading activities 331 (42) 26 (54) n.m. (11) Net gains from equity investments 203 80 (16) Lease income 225 73 88 Other (8) n.m. n.m. Total noninterest income $ 10,628 (1) % 4 Net losses on debt securities available for sale Trading gains down $239 million LQ and included $126 million lower deferred compensation plan investment income (P&L neutral) and weaker customer accommodation trading Other down $465 million reflecting lower income from investments accounted for under the equity method and lower PCI loan sale gains |
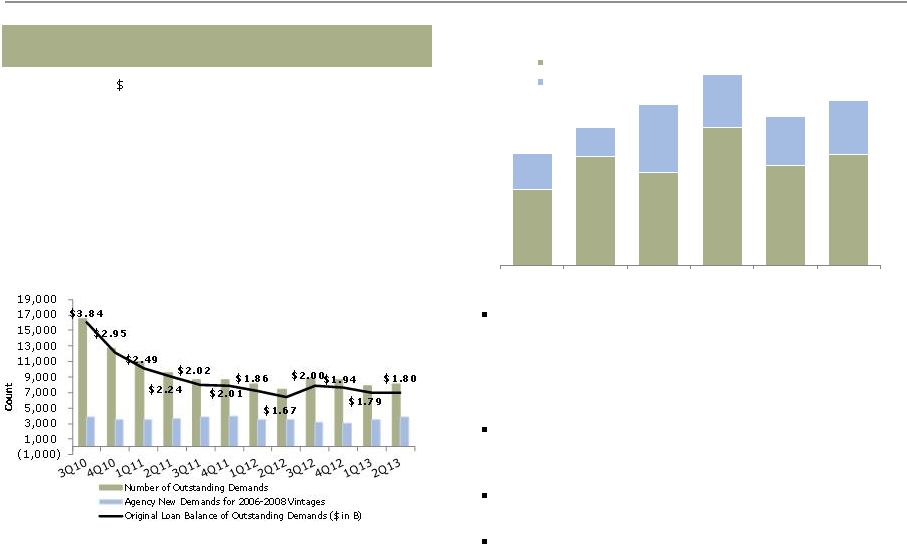 Wells Fargo 2Q13 Supplement 11 4.46 6.38 5.44 8.08 5.86 6.48 2.08 1.66 3.95 3.07 2.83 3.16 6.54% 8.04% 9.39% 11.15% 8.70% 9.64% Wells Fargo Citi JPM Chase Bank of America Industry Industry ex WFC Deliquency Rate Foreclosure Rate Residential mortgage Production, servicing and repurchase trends Seventh consecutive quarter of over $100 billion of originations - Purchase originations up 44% LQ - Gain on sale margin (1) and originations are expected to decline Wells Fargo total delinquency and foreclosure ratio for 2Q13 was 6.65%, up 11 bps LQ on seasonality but down from 7.14% in 2Q12 Number and balance of total outstanding repurchase demands up modestly LQ Repurchase reserves of $2.2 billion decreased $95 million, or 4%, LQ (1) Net gains on mortgage loan origination/or sales activities less repurchase reserve build divided by total originations. (2) Includes mortgage insurance rescissions. (3) Inside Mortgage Finance, data as of March 31, 2013. Industry excluding WFC performance calculated based on IMF data. (4) Industry is all large servicers ($6.0 trillion) including WFC, C, JPM and BAC. (4) Total Outstanding Repurchase Demands (2) and Agency New Demands for 2006-2008 Vintages 1Q13 Servicing Portfolio Delinquency Performance (3) Residential mortgage production trends ($ in billions) 2Q13 1Q13 4Q12 3Q12 2Q12 Applications 146 140 152 188 208 Pipeline 63 74 81 97 102 Originations 112 109 125 139 131 Refinance % 56 % 69 65 62 62 Purchase % 44 31 35 38 38 Gain on Sale (1) 2.21 2.56 2.56 2.21 2.20 |
 Wells Fargo 2Q13 Supplement 12 Noninterest expense and efficiency ratio (1) Noninterest expense down $145 million from 1Q13 - Personnel expense down $311 million, or 4%, from seasonally high employee benefits expense in 1Q13 • Salaries up $105 million reflecting annual merit increases • Commission and incentive compensation up $49 million on higher revenue-based incentive compensation - Other expense up $312 million • Operating losses up $131 million primarily from litigation accruals on various legal matters • Advertising and promotion up $78 million on seasonality and new campaign launch • Outside professional services up $72 million on continued investment in the business for growth, product improvements, system enhancements, and regulatory and compliance requirements Efficiency ratio of 57.3% improved 100 bps LQ Continue to target an efficiency ratio of 55%- 59% 12,397 12,112 12,896 12,400 12,255 2Q12 3Q12 4Q12 1Q13 2Q13 Efficiency Ratio (1) 58.2% 57.1% 58.8% 58.3% 57.3% vs vs ($ in millions) 2Q13 1Q13 2Q12 Noninterest expense Salaries $ 3,768 3 % 2 Commission and incentive compensation 2,626 2 12 Employee benefits 1,118 (29) 7 Equipment 418 (21) (9) Net occupancy 716 - 3 Core deposit and other intangibles 377 - (10) FDIC and other deposit assessments 259 (11) (22) Other 2,973 12 (12) Total noninterest expense 12,255 (1) (1) Efficiency ratio defined as noninterest expense divided by total revenue (net interest income plus noninterest income). Noninterest expense and our efficiency ratio may be affected by a variety of factors, including business and economic cyclicality, seasonality, changes in our business composition and operating environment, growth in our business and/or acquisitions, and unexpected expenses relating to, among other things, litigation and regulatory matters. |
 Wells Fargo 2Q13 Supplement 13 Environmentally-elevated cost reduction (1) Contra revenue item. Change in estimate. (2) Contra revenue item. MSR valuation adjustments include costs to service and unreimbursed foreclosure costs. ($ in millions) Expense description 2Q13 1Q13 4Q12 FY 2012 OCC Consent Order - Foreclosure Review costs: Independent consultant expense $ ~5 ~40 ~100 ~400 Internal costs 0 ~10 ~25 ~100 Foreclosed asset expense 146 195 221 1,061 Mortgage repurchase reserve build (1) 25 250 313 1,665 MSR servicing and foreclosure costs (2) 82 58 127 677 |
 Wells Fargo 2Q13 Supplement 14 Net income of $3.2 billion, up 28% YoY and 11% LQ Regional Banking Continued franchise and cross-sell growth (1) - Primary consumer checking customers (2) (3) up a net 3.5% YoY - Business checking accounts (2) up a net 2.7% YoY - Retail bank cross-sell of 6.14 products per household up from in 6.00 2Q12 Consumer Lending Credit card penetration (1) (4) rose to 34.9%, up from 34.1% in 1Q13 and 31.0% in 2Q12 Record consumer auto originations of $7.1 billion, up 4% LQ and up 9% YoY Mortgage originations of $112 billion up 3% LQ and down 15% YoY - 9% of originations were from HARP (5) vs. 10% in 1Q13 and 16% in 2Q12 Community Banking Wells Fargo 2Q13 Supplement 14 ($ in millions) 2Q13 1Q13 vs vs 2Q12 Net interest income $ 7,251 2 % (1) Noninterest income Provision for credit losses Noninterest expense Income tax expense Segment earnings ($ in billions) Avg loans, net Avg core deposits 5,691 (2) (2) 763 (40) (51) 7,213 (2) (5) 1,633 27 24 $ $ 3,245 11 % 28 498.2 - 3 623.0 1 6 2Q13 1Q13 2Q12 Regional Banking Primary consumer checking customers (1)(2)(3) (1)(2) (1) Business checking account growth 3.5 2.7 6.14 2.1 2.9 6.10 % 6.00 ($ in billions) 2Q13 vs vs 1Q13 2Q12 Consumer Lending (1)(4) Credit card payment volumes (POS) Credit card penetration Home Mortgage Applications Application pipeline Originations $ $ % % % bps 12.7 34.9 146 63 112 9 9 86 4 (15) 3 399 (30) (15) (38) Retail Bank household cross-sell (1) Metrics reported on a one-month lag from reported quarter-end; for example 2Q13 cross-sell is as of May 2013. (2) Checking customer and account growth is 12-months ending for each respective period. (3) Customers who actively use their checking account with transactions such as debit card purchases, online bill payments, and direct deposit. (4) Household penetration as of May 2013 and defined as the percentage of retail banking deposit households that have a credit card with Wells Fargo. Household penetration has been redefined to include legacy Wells Fargo Financial accounts. (5) Home Affordable Refinance Program. |
 Wells Fargo 2Q13 Supplement 15 Wholesale Banking Net income of $2.0 billion, up 7% YoY and down 2% LQ Net interest income up 3% LQ; average loans up 1% on C&I growth Noninterest income down 2% LQ as strong investment banking and higher operating lease gains were more than offset by lower trading and equity gains Provision reflects lower gross losses and higher recoveries Expenses up 3% LQ driven by higher revenue- based incentive compensation Key Metrics Cross-sell of 6.9 products per relationship (1) up from 6.8 in 2Q12 Treasury Management Commercial card spend volume of $4.7 billion up 8% LQ and 18% YoY Investment Banking YTD Investment Banking fees from Wholesale customers up 40% YoY YTD U.S. investment banking market share (2) of 5.8% Asset Management Total AUM up $18.2 billion YoY driven by higher market valuations as $3.9 billion in long-term net flows was largely offset by short-term outflows (1) Cross-sell reported on a one-quarter lag. (2) Source: Dealogic U.S. investment banking fee market share. vs vs ($ in millions) 2Q13 1Q13 2Q12 Net interest income $ 3,101 3 % (7) Noninterest income 3,034 (2) 10 Reversal of provision for credit losses (118) n.m. n.m. Noninterest expense 3,183 3 2 Income tax expense 1,065 6 14 Segment earnings $ 2,004 (2) % 7 ($ in billions) Avg loans, net $ 286.9 1 6 Avg core deposits 230.5 3 4 vs vs ($ in billions) 2Q13 1Q13 2Q12 Key Metrics: Cross-sell (1) 6.9 1 % 1 Commercial card spend volume $ 4.7 8 18 YTD U.S. investment banking market share % (2) 5.8 % Total AUM $ 454.7 (2) % 4 Advantage Funds AUM 220.0 (2) 8 |
 Wells Fargo 2Q13 Supplement 16 Wealth, Brokerage and Retirement Record net income up 27% YoY and 29% LQ Net interest income up 5% LQ; average loans up 4% driven by growth in nonconforming mortgages Noninterest income up 1% LQ as higher asset- based fees were partially offset by lower gains on deferred compensation plan investments Noninterest expense was down 4% LQ due to seasonally higher 1Q13 personnel expenses and lower deferred compensation expense, partially offset by increased broker commissions Retail Brokerage Managed account assets of $331 billion, up 2% LQ; and up 19% YoY driven by strong net flows and market performance Wealth Management Wealth Management client assets down 2% LQ and up 3% YoY Retirement IRA assets flat LQ and up 12% YoY Institutional Retirement plan assets down 1% LQ and up 11% YoY WBR and Community Bank Partnership Closed referred investment assets from the Community Bank grew over 25% YoY (3) (1) Includes deposits. (2) Data as of May 2013. (3) Reported on a one-quarter lag and is as of March 2013 and March 2012, respectively. vs vs ($ in millions) 2Q13 1Q13 2Q12 Net interest income $ 700 5 % - Noninterest income 2,561 1 13 Provision for credit losses 19 36 (49) Noninterest expense 2,542 (4) 7 Income tax expense 266 29 27 Segment earnings $ 434 29 % 27 ($ in billions) Avg loans, net $ 45.4 4 7 Avg core deposits 146.4 (2) 9 vs vs ($ in billions, except where noted) 2Q13 1Q13 2Q12 Key Metrics: WBR Clients Assets (1) ($ in trillions) $ 1.5 (1) % 8 Cross-sell (2) 10.35 - 1 Retail Brokerage Financial Advisors 15,268 (1) - Managed account assets $ 331 2 19 Client assets (1) ($ in trillions) 1.3 (1) 9 Wealth Management Client assets (1) 203 (2) 3 Retirement IRA Assets 315 - 12 Institutional Retirement Plan Assets 277 (1) 11 |
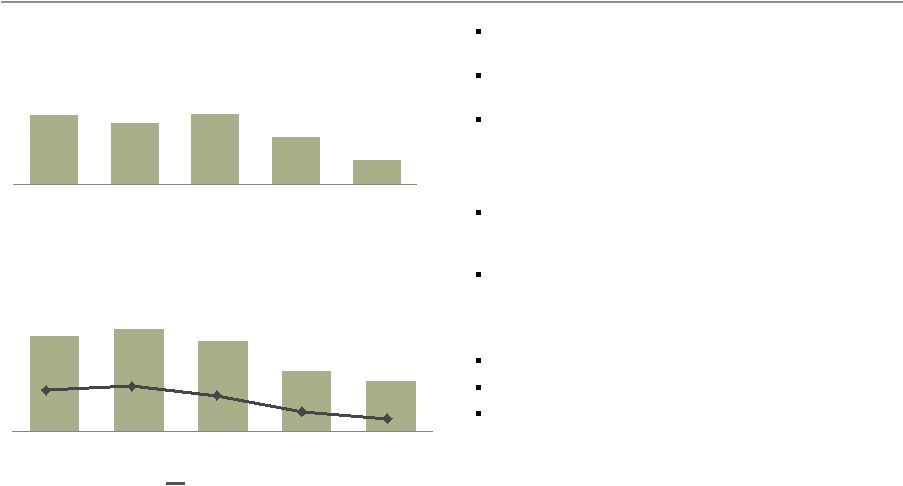 Wells Fargo 2Q13 Supplement 17 2.2 2.4 2.1 1.4 1.2 2Q12 3Q12 4Q12 1Q13 2Q13 1.15% 1.21% 1.05% 0.72% 0.58% 1.8 1.6 1.8 1.2 0.7 2Q12 3Q12 4Q12 1Q13 2Q13 Credit quality Trends showed continued improvement Provision expense of $652 million, down $567 million from 1Q13 Net charge-offs of $1.2 billion were down $267 million, or 19%, LQ 0.58% net charge-off rate - Commercial losses of 0.05%, down 5 bps LQ - Consumer losses of 1.01%, down 21 bps LQ, reflecting both lower severity and frequency NPAs declined $1.8 billion LQ on a $1.6 billion decline in nonaccrual loans and a $210 million decline in foreclosed assets Reserve release (1) of $500 million vs. $200 million in 1Q13 - Absent significant deterioration in the economy we continue to expect future reserve releases Allowance for credit losses = $16.6 billion PCI nonaccretable = 20.0% of remaining UPB (2) Accretable yield balance increased $2.1 billion LQ reflecting continued improvement in the housing market forecast and credit outlook and included: - $876 million reclass from nonaccretable difference primarily from the Pick-a-Pay portfolio - $1.6 billion increase in expected cash flows (1) Provision expense minus net charge-offs. (2) Unpaid principal balance for PCI loans that have not had a UPB charge-off. Net Charge-offs ($ in billions) Provision Expense ($ in billions) Net charge-off rate |
 Wells Fargo 2Q13 Supplement 18 1.1 1.2 1.1 1.1 1.0 0.3 0.3 0.3 0.3 0.2 1.4 1.5 1.4 1.4 1.2 2Q12 3Q12 4Q12 1Q13 2Q13 Consumer Commercial 20.6 21.1 20.5 19.5 17.9 4.3 4.2 4.0 3.4 3.2 24.9 25.3 24.5 22.9 21.1 2Q12 3Q12 4Q12 1Q13 2Q13 Nonaccrual loans Foreclosed assets 6.6 6.9 6.5 5.5 5.4 $0 $5 $10 2Q12 3Q12 4Q12 1Q13 2Q13 1.94% 1.97% 1.79% 1.53% 1.49% Credit quality Trends showed continued improvement Nonperforming Assets (1) ($ in billions) Consumer Loans 30-89 DPD & Still Accruing (1)(2) (Balances and rates) Loans 90+ DPD and Still Accruing (1)(2) ($ in billions) (1) 30-89 days and 90 days or more past due and still accruing, and nonperforming loans, include held for sale loans reported on Balance Sheet. (2) Excludes mortgage loans insured/guaranteed by the FHA or VA, reverse mortgages, margin loans and student loans whose repayments are predominantly guaranteed by guarantee agencies on behalf of the U.S. Department of Education under the Federal Family Education Loan Program. Also excludes the carrying value of PCI loans contractually delinquent. |
 Wells Fargo 2Q13 Supplement 19 Capital 10.08% 9.92% 10.12% 10.39% 10.73% 2Q12 3Q12 4Q12 1Q13 2Q13 Capital remained strong Tier 1 common equity ratio under Basel I of 10.73% increased 34 bps LQ Tier 1 common equity ratio under Basel III is estimated to be 8.54% at 6/30/13 (1) - OCI negatively impacted the ratio by 24 bps in the quarter Purchased 26.7 million common shares in 2Q13 and entered into a $500 million forward repurchase transaction which is expected to settle in 3Q13 for an estimated 13 million shares Increased quarterly common stock dividend to $0.30 per share in 2Q13 See Appendix page 33-34 for additional information regarding Tier 1 common equity ratios. 2Q13 capital ratios are preliminary estimates. (1) Estimated based on management’s interpretation of final rules adopted July 2, 2013, by the Federal Reserve Board establishing a new comprehensive capital framework for U.S. banking organizations that would implement the Basel III capital framework and certain provisions of the Dodd-Frank Act. Tier 1 Common Equity Ratio Under Basel I |
 Wells Fargo 2Q13 Supplement 20 Demonstrated momentum across the franchise Regional Banking Consumer Lending Group Wholesale Banking Wealth, Brokerage and Retirement Record managed account assets of $331 billion increased 2% LQ and 19% YoY Cross-sell of 10.35 products per household up from 10.22 in 2Q12 (1) Closed referred investment assets from the Community Bank grew over 25% YoY (5) Cross-sell of 6.9 products per relationship (5) up from 6.8 in 2Q12 driven by increased penetration of Treasury Management products Eleven consecutive quarters of growth in Wholesale Banking average loan balances YTD Investment banking revenue from Wholesale customers increased 40% YoY, including revenue from commercial and corporate customers which was up 34% Record auto originations of $7.1 billion, up 4% LQ and 9% YoY Consumer credit card new accounts in 2Q13 increased 3% LQ and 16% YoY with household penetration increasing 399 bps YoY to 34.9% (4) Retail bank cross-sell of 6.14 products per household up from 6.00 in 2Q12 (1) $9.3 billion in new loan commitments to small business customers (2) in the first half of 2013, up 25% from 1H12 Primary consumer checking customers up a net 3.5% YoY (3) (1) Metrics reported on a one-month lag from reported quarter-end; for example 2Q13 cross-sell is as of May 2013. (2) Primarily with annual revenues less than $20 million. (3) Checking customer growth is 12-months ending May 2013. Customers who actively use their checking account with transactions such as debit card purchases, online bill payments, and direct deposit. (4) Household penetration as of May 2013 and defined as the percentage of retail banking deposit households that have a credit card with Wells Fargo. (5) Reported on a one-quarter lag and is as of March 2013 and March 2012, respectively. |
 Wells Fargo 2Q13 Supplement 21 Summary – strong 2Q13 Record earnings of $5.5 billion, up $897 million, or 19% from 2Q12 Record diluted earnings per share of $0.98, up 20% - 14 consecutive quarters of EPS growth 2Q13 efficiency ratio of 57.3%, improved 90 bps PTPP of $9.1 billion up $231 million, or 3% Strong credit performance Solid returns - ROA = 1.55%, up 14 bps - ROE = 14.02%, up 116 bps Strong capital generation All comparisons are 2Q13 vs. 2Q12. |
 Wells Fargo 2Q13 Supplement 22 Appendix |
 Wells Fargo 2Q13 Supplement 23 (1) Net of purchase accounting adjustments. -$87.7 Non-strategic/liquidating loan portfolio risk reduction -$4.5 -$103.2 -$4.1 -$3.7 -$3.2 ($ in billions) 2Q13 1Q13 4Q12 3Q12 2Q12 4Q08 Pick-a-Pay mortgage (1) $ 54.8 56.6 58.3 60.1 62.0 95.3 Liquidating home equity 4.2 4.4 4.6 5.0 5.2 10.3 Legacy WFF indirect auto 0.5 0.6 0.8 1.1 1.5 18.2 Legacy WFF debt consolidation 13.7 14.1 14.5 15.0 15.5 25.3 Education Finance - gov't guaranteed 11.5 11.9 12.5 13.0 13.8 20.5 Legacy WB C&I, CRE and foreign PCI loans (1) 2.5 2.8 3.2 3.8 4.3 18.7 Legacy WB other PCI loans (1) 0.4 0.4 0.6 0.6 0.8 2.5 Total $ 87.6 90.8 94.5 98.6 103.1 190.8 |
 Wells Fargo 2Q13 Supplement 24 Purchased credit-impaired (PCI) portfolios Legacy Wachovia PCI loans continued to perform better than originally expected ($ in billions) Adjusted unpaid principal balance (1) December 31, 2008 $ 29.2 62.5 6.5 98.2 March 31, 2013 4.4 31.1 0.9 36.4 June 30, 2013 4.0 30.3 0.9 35.2 Nonaccretable difference rollforward 12/31/08 Nonaccretable difference $ 10.4 26.5 4.0 40.9 Addition of nonaccretable difference due to acquisitions 0.2 - - 0.2 Losses from loan resolutions and write-downs (7.0) (17.7) (2.9) (27.6) Release of nonaccretable difference since merger (3.3) (3.9) (0.9) (8.1) (2) 6/30/13 Remaining nonaccretable difference 0.3 4.9 0.2 5.4 Life-to-date net performance Additional provision since 2008 merger $ (1.7) - (0.1) (1.8) Release of nonaccretable difference since 2008 merger 3.3 3.9 0.9 8.1 (2) Net performance 1.6 3.9 0.8 6.3 Commercial Pick-a-Pay Other consumer Total (1) Includes write-downs taken on loans where severe delinquency (normally 180 days) or other indications of severe borrower financial stress exist that indicate there will be a loss of contractually due amounts upon final resolution of the loan. (2) Reflects releases of $1.8 billion for loan resolutions and $6.3 billion from the reclassification of nonaccretable difference to the accretable yield, which will result in increasing income over the remaining life of the loan or pool of loans. |
 Wells Fargo 2Q13 Supplement 25 $876 million in nonaccretable difference reclassified to accretable yield this quarter primarily from the Pick-a-Pay portfolio; Reflects continued improvement in the housing market forecast and credit outlook $152 million in losses from loan resolutions and write-downs in the quarter $5.4 billion in nonaccretable difference remains to absorb losses on PCI loans - Nonaccretable = 20.0% of remaining unpaid principal balance (UPB) • Pick-a-Pay nonaccretable = 20.6% of Pick-a-Pay UPB (5) PCI nonaccretable difference Pick-a-Pay Total $ 336 5,887 - - - (17) - - - - - (10) (866) 2 (141) $ 311 4,880 Other consumer Commercial 263 6,486 - (17) - (876) - (13) (152) 250 5,441 (1) Release of the nonaccretable difference for settlement with borrower, on individually accounted PCI loans, increases interest income in the period of settlement. Pick-a-Pay and Other consumer PCI loans do not reflect nonaccretable difference releases for settlements with borrowers due to pool accounting for those loans, which assumes that the amount received approximates the pool performance expectations. (2) Release of the nonaccretable difference as a result of sales to third parties increases noninterest income in the period of the sale. (3) Reclassification of nonaccretable difference to accretable yield for loans with increased cash flow estimates will result in increased interest income as a prospective yield adjustment over the remaining life of the loan or pool of loans. (4) Write-downs to net realizable value of PCI loans are absorbed by the nonaccretable difference when severe delinquency (normally 180 days) or other indications of severe borrower financial stress exist that indicate there will be a loss of contractually due amounts upon final resolution of the loan. (5) Unpaid principal balance of loans without write-downs. Analysis of nonaccretable difference for PCI loans ($ in millions) Balance, March 31, 2013 Addition of nonaccretable difference due to acquisitions Release of nonaccretable difference due to: Loans resolved by settlement with borrower (1) Loans resolved by sales to third parties (2) Reclassification to accretable yield for loans with improving credit-related cash flows (3) Use of nonaccretable difference due to: Losses from loan resolutions and write-downs (4) Balance, June 30, 2013 (5) |
 Wells Fargo 2Q13 Supplement 26 Accretable yield balance increased $2.1 billion LQ and included: - Accretion into interest income of $458 million - $876 million reclassification from nonaccretable difference and $1.6 billion increase in expected cash flows; reflects continued improvement in the housing market forecast and credit outlook Balance of $20.0 billion expected to accrete to income over the remaining life of the underlying loans - Commercial accretable yield balance of $851 million; weighted average life of portfolio is 2.6 years • Accretable yield percentage of 19.55% - Pick-a-Pay accretable yield balance of $18.8 billion; weighted average life of 14.5 years • Increases reflect improvements in the housing market and credit trends • Accretable yield percentage of 4.70% PCI accretable yield (1) Includes accretable yield released as a result of settlements with borrowers, which is included in interest income. (2) Includes accretable yield released as a result of sales to third parties, which is included in noninterest income. (3) Represents changes in cash flows expected to be collected due to the impact of modifications, changes in prepayment assumptions, changes in interest rates on variable rate PCI loans and sales to third parties. Cumulative Accretable yield rollforward since ($ in millions) 2Q13 1Q13 merger Total, beginning of period $ 17,965 18,548 10,447 Addition of accretable yield due to acquisitions - - 131 Accretion into interest income (1) (458) (447) (10,256) - (151) (393) Reclassification from nonaccretable difference for loans with improving credit-related cash flows 876 31 6,261 Changes in expected cash flows that do not affect nonaccretable difference (3) 1,638 (16) 13,831 Total, end of period $ 20,021 17,965 20,021 Accretion into noninterest income due to sales (2) |
 Wells Fargo 2Q13 Supplement 27 Pick-a-Pay credit highlights Non-PCI portfolio Loans down 4% LQ driven by loans paid-in-full 85% of portfolio current Nonaccrual loans decreased $136 million, or 3%, LQ - $125 million of nonaccrual TDRs reclassified to accruing TDR status based on borrower payment performance $4.1 billion in nonaccruals included $2.1 billion of nonaccruing TDRs Net charge-offs of $69 million down $35 million LQ on improved portfolio performance and lower severities 53% of portfolio with LTV (2) < 80% PCI portfolio Carrying value down 3% 69% of portfolio current, 1% better than 1Q13 Life-of-loan losses continued to be lower than originally projected at time of merger ($ in millions) 2Q13 1Q13 Non-PCI loans Carrying value (1) $ 29,648 30,843 Nonaccrual loans 4,068 4,204 as a % of loans 13.72 % 13.63 Net charge-offs $ 69 104 as % of avg loans 0.91 % 1.34 90+ days past due as % of loans 10.09 10.23 Current average LTV (2) 78 % 81 ($ in millions) 2Q13 1Q13 PCI loans Adjusted unpaid principal balance (3) $ 30,277 31,078 Carrying value (1) 25,107 25,765 Current average LTV (2) 82 % 86 (1) The carrying value, which does not reflect the allowance for loan losses, includes purchase accounting adjustments, which, for PCI loans, are the nonaccretable difference and the accretable yield, and for all other loans, an adjustment to mark the loans to a market yield at date of merger less any subsequent charge-offs. (2) The current loan-to-value (LTV) ratio is calculated as the net carrying value (defined in (1) above) divided by the collateral value. (3) The adjusted unpaid principal balance includes write-downs taken on loans where severe delinquency (normally 180 days) or other indications of severe borrower financial stress exist that indicate there will be a loss of contractually due amounts upon final resolution of the loan. |
 Wells Fargo 2Q13 Supplement 28 Real estate 1-4 family first mortgage portfolio First lien mortgage loans up slightly as growth in core first lien mortgage was partially offset by continued run-off in the liquidating portfolio - Pick-a-Pay non-PCI portfolio down 4% - PCI portfolio down 3% - Debt consolidation first lien down 3% - Core first lien up $2.8 billion, or 2%, reflecting strong origination volumes • Nonconforming mortgages increased $6.7 billion to $64.6 billion (3) Core net charge-offs down $43 million from 1Q13 reflecting improved severity and frequency (1) Ratios on Legacy WFF debt consolidation first mortgage loan portfolio only. (2) Ratios on non run-off first lien mortgage loan portfolio only. (3) Nonconforming mortgages originated post February 2009. ($ in millions) 2Q13 1Q13 Total real estate 1-4 family first mortgage $ 252,841 252,307 Less consumer non-strategic/liquidating portfolios: Pick-a-Pay non-PCI first lien mortgage 29,648 30,843 PCI first lien mortgage 25,408 26,086 Debt consolidation first mortgage portfolio 13,403 13,794 Core first lien mortgage 184,382 181,584 Nonaccrual loans $ 2,238 2,323 as % of loans 16.70 % 16.84 Net charge-offs $ 96 119 as % of average loans 2.83 % 3.45 Nonaccrual loans $ 4,399 4,793 as % of loans 2.39 % 2.64 Net charge-offs $ 163 206 as % of loans 0.35 % 0.46 Core first lien mortgage loan performance (2) (1) Legacy WFF debt consolidation first mortgage loan performance |
 Wells Fargo 2Q13 Supplement 29 Home equity portfolio Core Portfolio (1) Outstandings down 3% - High quality new originations with weighted average CLTV of 62%, 778 FICO, and 33% total debt service ratio 2Q13 losses decreased $79 million 2+ delinquencies decreased $152 million Delinquency rate for loans with a CLTV >100% improved 9 bps Liquidating Portfolio Outstandings down 6% 2Q13 losses decreased $12 million 2+ delinquencies declined $10 million Delinquency rate for loans with a CLTV >100% improved 12 bps Total home equity portfolio = $89 billion 21% in 1 lien position 39% in junior lien position behind WFC owned or serviced 1 st lien - Current 1 st lien, Current junior lien = 96.4% - Current 1 st lien, Delinquent junior lien = 0.9% - Delinquent 1 st lien, Current junior lien = 1.3% - Delinquent 1 st lien, Delinquent junior lien = 1.4% 40% in junior lien position behind third party 1 st lien Excludes purchased credit-impaired loans. (1) Includes equity lines of credit and closed-end junior liens associated with the Pick-a-Pay portfolio totaling $1.3 billion at June 30, 2013 and March 31, 2013. (2) CLTV is calculated based on outstanding balance plus unused lines of credit divided by estimated home value. Estimated home values are determined predominantly based on automated valuation models updated through June 2013. (3) Unsecured balances, representing the percentage of outstanding balances above the most recent home value. st ($ in millions) 2Q13 1Q13 Core Portfolio (1) Outstandings $ 84,813 87,298 Net charge-offs 335 414 as % of avg loans 1.56 % 1.89 2+ payments past due $ 2,119 2,271 as % loans 2.51 % 2.61 % CLTV > 100% (2) 30 33 2+ payments past due 3.10 3.19 % Unsecured balances (3) 13 15 % 1st lien position 22 22 Liquidating Portfolio Outstandings $ 4,173 4,421 Net charge-offs 54 66 as % of avg loans 5.05 % 5.87 2+ payments past due $ 151 161 as % loans 3.63 % 3.64 % CLTV > 100% (2) 66 70 2+ payments past due 3.16 3.28 % 1st lien position 4 4 |
 Wells Fargo 2Q13 Supplement 30 Consumer credit card portfolio Credit card outstandings of $24.8 billion, rose 3% LQ and 9% YoY reflecting continued new account growth - New accounts in 2Q13 up 3% LQ and 16% YoY - Credit Card household penetration rate rose to 34.9% (1) , up from 34.1% in 1Q13 - Purchase dollar volume is up 9% both LQ and YoY while POS transactions are up 13% LQ and 17% YoY reflecting growth in new accounts and increases in active accounts Net charge-offs down $1 million, or 6 bps, LQ and $6 million, or 47 bps, YoY, reflecting continued steady improvement (1) Household penetration as of May 2013 and defined as the percentage of retail banking deposit households that have a credit card with Wells Fargo. ($ in millions) 2Q13 1Q13 Credit card outstandings $ 24,815 24,120 Net charge-offs 234 235 as % of avg loans 3.90 % 3.96 Key Metrics: Purchase volume $ 12,713 11,658 New accounts 594,368 576,621 Penetration (1) 34.9 % 34.1 |
 Wells Fargo 2Q13 Supplement 31 Auto portfolios (1) Auto outstandings of $48.6 billion up 3% LQ and 8% YoY - 2Q13 originations of $7.1 billion up 4% LQ and up 9% YoY • Maintained disciplined underwriting Nonaccrual loans declined $20 million LQ Net charge-offs were down $34 million LQ on reduced frequency - June Manheim index of 119.7, down 1% LQ and 3% from June 2012 30+ days past due increased $70 million LQ reflecting seasonality and decreased $101 million YoY Loans of $7.6 billion up 1% LQ and 15% YoY as dealer floorplan utilization rates hit highest levels since the merger Continued strong credit performance (1) The consumer auto portfolio includes the liquidating legacy Wells Fargo Financial indirect portfolio of $428 million. ($ in millions) 2Q13 1Q13 Auto outstandings $ 46,289 44,939 Nonaccrual loans 178 192 as % of loans 0.38 % 0.43 Net charge-offs $ 41 71 as % of avg loans 0.36 % 0.65 30+ days past due $ 686 614 as % of loans 1.48 % 1.37 Auto outstandings $ 2,359 2,320 Nonaccrual loans 22 28 as % of loans 0.94 % 1.20 Net charge-offs $ 1 5 as % of avg loans 0.18 % 0.85 30+ days past due $ 17 19 as % of loans 0.74 % 0.83 Commercial Portfolio Auto outstandings $ 7,643 7,570 Nonaccrual loans 2 - as % of loans 0.03 % - Net charge-offs $ - - as % of avg loans n.m. % n.m. Indirect Consumer Portfolio Direct Consumer Portfolio Consumer Portfolio Commercial Portfolio |
 Wells Fargo 2Q13 Supplement 32 Student lending portfolio $22.5 billion student lending outstandings down 2% LQ Private Portfolio $10.9 billion private loans outstandings flat LQ and up 6% YoY - Loans have an average FICO of 746 and 80% of the total outstandings have been co-signed - Applications increased 44% LQ due to summer/fall term applications in the current quarter - Originations decreased 72% LQ due to seasonality Net charge-offs up $1 million LQ Government Portfolio $11.5 billion liquidating government guaranteed outstandings declined 3% LQ and 17% YoY ($ in millions) 2Q13 1Q13 Education Finance Total outstandings $ 22,472 22,897 Private Portfolio Private outstandings $ 10,937 10,975 Net charge-offs 31 30 as % of avg loans 1.14 % 1.10 30 days past due $ 196 226 as % of loans 1.79 % 2.06 Government Guaranteed Portfolio Government outstandings $ 11,534 11,922 |
 Wells Fargo 2Q13 Supplement 33 Tier 1 common equity under Basel I (1) Wells Fargo & Company and Subsidiaries FIVE QUARTER TIER 1 COMMON EQUITY UNDER BASEL I (1) June 30, Mar. 31, Dec. 31, Sept. 30 June 30, ($ in billions) 2013 2013 2012 2012 2012 Total equity 163.8 $ 163.4 158.9 156.1 149.4 Noncontrolling interests (1.4) (1.3) (1.3) (1.4) (1.3) Total Wells Fargo stockholders' equity 162.4 $ 162.1 157.6 154.7 148.1 Adjustments: Preferred equity (12.6) (12.6) (12.0) (11.3) (10.6) Goodwill and intangible assets (other than MSRs) (32.2) (32.5) (32.9) (33.4) (33.5) Applicable deferred assets 3.0 3.1 3.2 3.3 3.5 Deferred tax asset limitation - - - - - MSRs over specified limitations (0.8) (0.8) (0.7) (0.7) (0.7) Cumulative other comprehensive income (1.8) (5.1) (5.6) (6.4) (4.6) Other (0.4) (0.6) (0.6) (0.4) (0.5) Tier 1 common equity (A) 117.6 $ 113.6 109.0 105.8 101.7 Total risk-weighted assets (2) (B) 1,095.8 $ 1,094.3 1,077.1 1,067.10 1,008.6 Tier 1 common equity to total risk-weighted assets (2) (A)/(B) 10.73 % 10.39 10.12 9.92 10.08 (1) (2) Tier 1 common equity is a non-generally accepted accounting principle (GAAP) financial measure that is used by investors, analysts and bank regulatory agencies to assess the capital position of financial services companies. Management reviews Tier 1 common equity along with other measures of capital as part of its financial analyses and has included this non-GAAP financial information, and the corresponding reconciliation to total equity, because of current interest in such information on the part of market participants. Under the regulatory guidelines for risk-based capital, on-balance sheet assets and credit equivalent amounts of derivatives and off-balance sheet items are assigned to one of several broad risk categories according to the obligor, or, if relevant, the guarantor or the nature of any collateral. The aggregate dollar amount in each risk category is then multiplied by the risk weight associated with that category. The Company’s June 30, 2013, risk-weighted assets (RWA) and resulting Tier 1 common equity to total RWA are preliminary and reflect total estimated on-balance sheet and total estimated derivative and off-balance sheet RWA of $881.4 billion and $214.4 billion, respectively. Effective September 30, 2012, the Company refined its determination of the risk weighting of certain unused lending commitments that provide for the ability to issue standby letters of credit and commitments to issue standby letters of credit under syndication arrangements where the Company has an obligation to issue in a lead agent or similar capacity beyond its contractual participation level. |
 Wells Fargo 2Q13 Supplement 34 Tier 1 common equity under Basel III (Estimated) (1) Wells Fargo & Company and Subsidiaries June 30, ($ in billions) 2013 Tier 1 common equity under Basel I 117.6 $ Adjustments from Basel I to Basel III (3)(5) : Cumulative other comprehensive income related to AFS securities and defined benefit pension plans 1.6 $ 0.8 2.4 Threshold deductions, as defined under Basel III (4) (5) - Tier 1 common equity anticipated under Basel III (C) 120.0 $ Total risk-weighted assets anticipated under Basel III (6) (D) 1,404.1 $ Tier 1 common equity to total risk-weighted assets anticipated under Basel III (C)/(D) 8.54 % (1) (2) (3) (4) (5) (6) Volatility in interest rates can have a significant impact on the valuation of cumulative other comprehensive income and MSRs and therefore, may impact adjustments from Basel I to Basel III, and MSRs subject to threshold deductions, as defined under Basel III, in future reporting periods. The estimate of RWA reflects management’s interpretation of RWA determined under Basel III capital rules adopted by the Federal Reserve Board that incorporates different classifications of assets, with certain risk weights based on a borrower’s credit rating or Wells Fargo’s own models, along with adjustments to address a combination of credit/counterparty, operational and market risks, and other Basel III elements. Other Total adjustments from Basel I to Basel III Tier 1 common equity is a non-generally accepted accounting principle (GAAP) financial measure that is used by investors, analysts and bank regulatory agencies to assess the capital position of financial services companies. Management reviews Tier 1 common equity along with other measures of capital as part of its financial analyses and has included this non-GAAP financial information, and the corresponding reconciliation to total equity, because of current interest in such information on the part of market participants. The Basel III Tier 1 common equity and risk-weighted assets are estimated based on management’s interpretation of the Basel III capital rules adopted July 2, 2013, by the Federal Reserve Board. The rules establish a new comprehensive capital framework for U.S. banking organizations that implement the Basel III capital framework and certain provisions of the Dodd-Frank Act. Adjustments from Basel I to Basel III represent reconciling adjustments, primarily certain components of cumulative other comprehensive income deducted for Basel I purposes, to derive Tier 1 common equity under Basel III. Threshold deductions, as defined under Basel III, include individual and aggregate limitations, as a percentage of Tier 1 common equity, with respect to MSRs, deferred tax assets and investments in unconsolidated financial companies. TIER 1 COMMON EQUITY UNDER BASEL III (ESTIMATED) (1) (2) |
Wells Fargo 2Q13 Supplement 35 Forward-looking statements and additional information Forward-looking statements: This document contains “forward-looking statements” within the meaning of the Private Securities Litigation Reform Act of 1995. In addition, we may make forward-looking statements in our other documents filed or furnished with the SEC, and our management may make forward-looking statements orally to analysts, investors, representatives of the media and others. Forward-looking statements can be identified by words such as “anticipates,” “intends,” “plans,” “seeks,” “believes,” “estimates,” “expects,” “target,” “projects,” “outlook,” “forecast,” “will,” “may,” “could,” “should,” “can” and similar references to future periods. Forward-looking statements are not based on historical facts but instead represent our current expectations regarding future events, circumstances or results. In particular, these include, but are not limited to, statements we make about: (i) the future operating or financial performance of the Company, including our outlook for future growth; (ii) our noninterest expense and efficiency ratio; (iii) future credit quality and performance, including our expectations regarding future loan losses; (iv) the appropriateness of the allowance for credit losses; (v) our expectations regarding net interest income and net interest margin; (vi) loan growth or the reduction or mitigation of risk in our loan portfolios; (vii) future capital levels and our estimated Tier 1 common equity ratio under Basel III capital standards; (viii) the performance of our mortgage business and any related exposures; (ix) the expected outcome and impact of legal, regulatory and legislative developments, as well as our expectations regarding compliance therewith; (x) future common stock dividends, common share repurchases and other uses of capital; (xi) the outcome of contingencies, such as legal proceedings; and (xii) the Company’s plans, objectives and strategies. Investors are urged to not unduly rely on forward-looking statements as actual results could differ materially from expectations. Forward-looking statements speak only as of the date made, and we do not undertake to update them to reflect changes or events that occur after that date. For more information about factors that could cause actual results to differ materially from expectations, refer to pages 13-14 of Wells Fargo’s press release announcing our second quarter 2013 results, as well as Wells Fargo’s reports filed with the Securities and Exchange Commission, including the discussion under “Risk Factors” in our Annual Report on Form 10-K for the year ended December 31, 2012. Purchased credit-impaired loan portfolio: Loans that were acquired from Wachovia that were considered credit impaired were written down at acquisition date in purchase accounting to an amount estimated to be collectible and the related allowance for loan losses was not carried over to Wells Fargo’s allowance. In addition, such purchased credit-impaired loans are not classified as nonaccrual or nonperforming, and are not included in loans that were contractually 90+ days past due and still accruing. Any losses on such loans are charged against the nonaccretable difference established in purchase accounting and are not reported as charge-offs (until such difference is fully utilized). As a result of accounting for purchased loans with evidence of credit deterioration, certain ratios of the combined company are not comparable to a portfolio that does not include purchased credit-impaired loans. In certain cases, the purchased credit-impaired loans may affect portfolio credit ratios and trends. Management believes that the presentation of information adjusted to exclude the purchased credit-impaired loans provides useful disclosure regarding the credit quality of the non-impaired loan portfolio. Accordingly, certain of the loan balances and credit ratios in this Quarterly Supplement have been adjusted to exclude the purchased credit-impaired loans. References in this Quarterly Supplement to impaired loans mean the purchased credit-impaired loans. Please see pages 32- 34 of the press release for additional information regarding the purchased credit-impaired loans. |