United Bankshares, Inc. First Quarter 2019 Earnings Review April 25, 2019 Exhibit 99.2
Forward-Looking Statements This presentation and statements made by United Bankshares, Inc. (“United”) and its management may contain statements that constitute “forward-looking statements” within the meaning of the Private Securities Litigation Reform Act of 1995. These statements can be identified by the fact that they do not relate strictly to historical or current facts and often use the words “projects”, “targets”, “intends”, “plans”, “believes,” “expects,” “anticipates” or similar expressions or future or conditional verbs such as “will”, “may”, “might”, “should”, “would” and “could”. These forward-looking statements involve certain risks and uncertainties. You should not place undue reliance on any forward-looking statements, which speak only as of the date made. We assume no obligation to update or revise any forward-looking statements that are made from time to time. There are a number of important factors that could cause future results to differ materially from historical performance and these forward-looking statements. Factors that might cause such a difference include, but are not limited to: competitive pressures among depository institutions increase significantly; changes in interest rate environment may adversely affect net interest income; gain on sale margins; loan accretion; prepayment speeds, loan sale volumes, charge-offs and loan loss provisions; general economic conditions, either national or in the states in which United does business, are less favorable than expected; changes in the securities markets; continued diversification of assets and adverse changes to credit quality; any economic slowdown that could adversely affect credit quality and loan originations. The foregoing list of factors is not exhaustive. For discussion of these and other factors that may cause actual results to differ from expectations, look under the caption “Risk Factors” of United’s Annual Report on Form 10-K for the year ended December 31, 2018, as filed with the SEC. April 2019
1Q19 HIGHLIGHTS Achieved Net Income of $63.6 million and Diluted Earnings Per Share of $0.62 Generated Return on Average Assets of 1.34%, Return on Average Equity of 7.88%, and Return on Average Tangible Equity* of 14.64% Outperformed peer ROAA and ROATE Quarterly dividend of $0.34 per share equates to a yield of 3.5% based upon recent stock price Strong expense control with an efficiency ratio of 51.0% Asset quality and capital position remain sound, with Non Performing Assets decreasing 4.1% LQ Repurchased 354,000 shares of common stock during Q1 *Non GAAP measure. Refer to appendix.
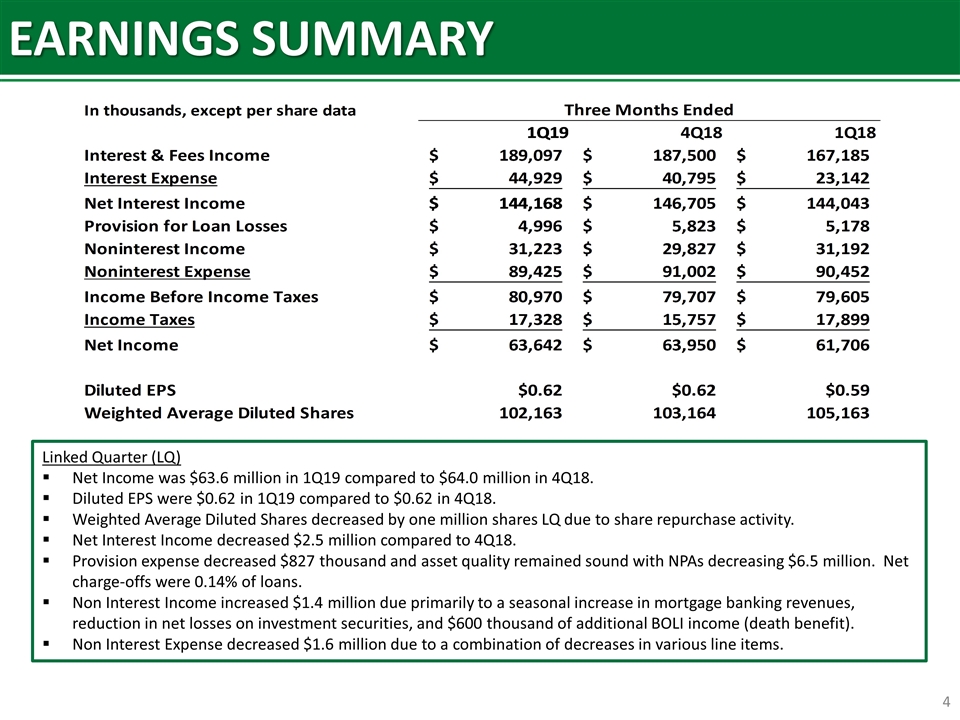
EARNINGS SUMMARY Linked Quarter (LQ) Net Income was $63.6 million in 1Q19 compared to $64.0 million in 4Q18. Diluted EPS were $0.62 in 1Q19 compared to $0.62 in 4Q18. Weighted Average Diluted Shares decreased by one million shares LQ due to share repurchase activity. Net Interest Income decreased $2.5 million compared to 4Q18. Provision expense decreased $827 thousand and asset quality remained sound with NPAs decreasing $6.5 million. Net charge-offs were 0.14% of loans. Non Interest Income increased $1.4 million due primarily to a seasonal increase in mortgage banking revenues, reduction in net losses on investment securities, and $600 thousand of additional BOLI income (death benefit). Non Interest Expense decreased $1.6 million due to a combination of decreases in various line items.
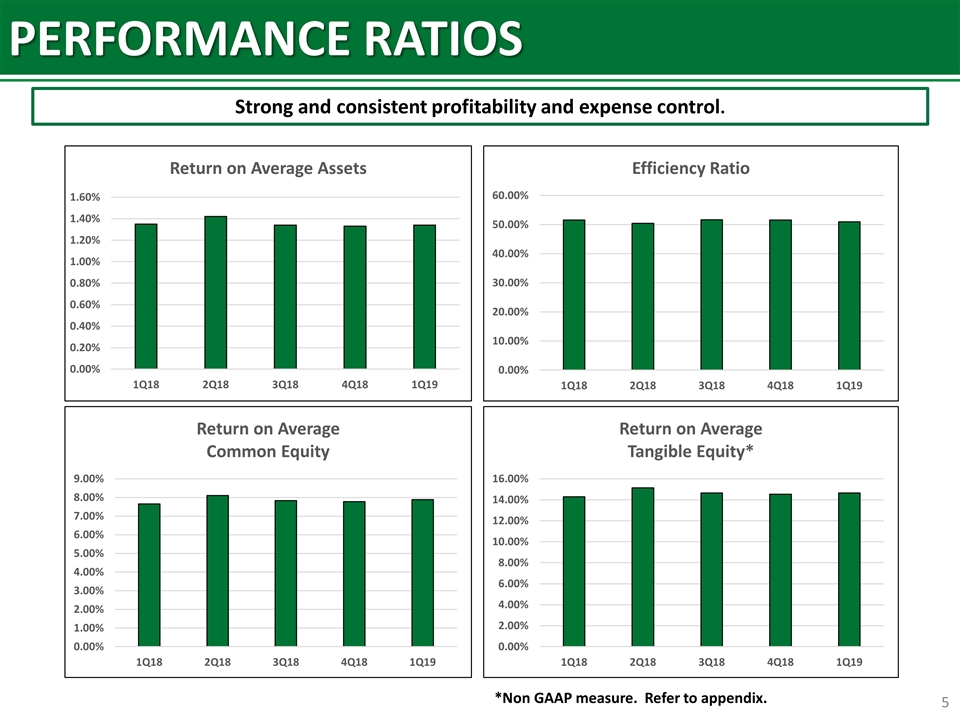
PERFORMANCE RATIOS Strong and consistent profitability and expense control. *Non GAAP measure. Refer to appendix.
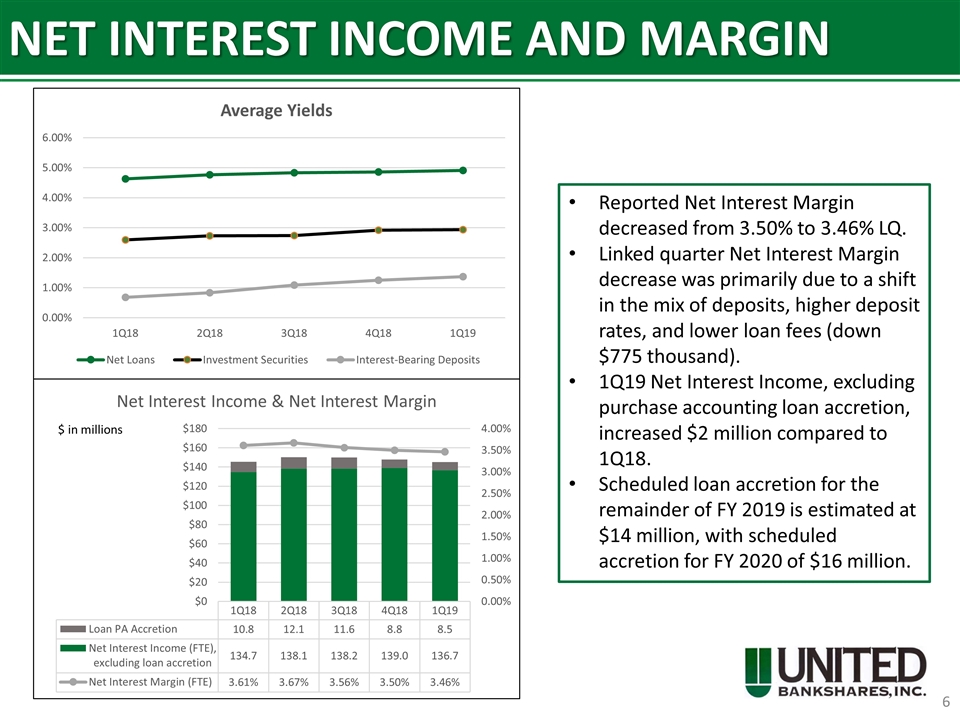
NET INTEREST INCOME AND MARGIN Reported Net Interest Margin decreased from 3.50% to 3.46% LQ. Linked quarter Net Interest Margin decrease was primarily due to a shift in the mix of deposits, higher deposit rates, and lower loan fees (down $775 thousand). 1Q19 Net Interest Income, excluding purchase accounting loan accretion, increased $2 million compared to 1Q18. Scheduled loan accretion for the remainder of FY 2019 is estimated at $14 million, with scheduled accretion for FY 2020 of $16 million. $ in millions
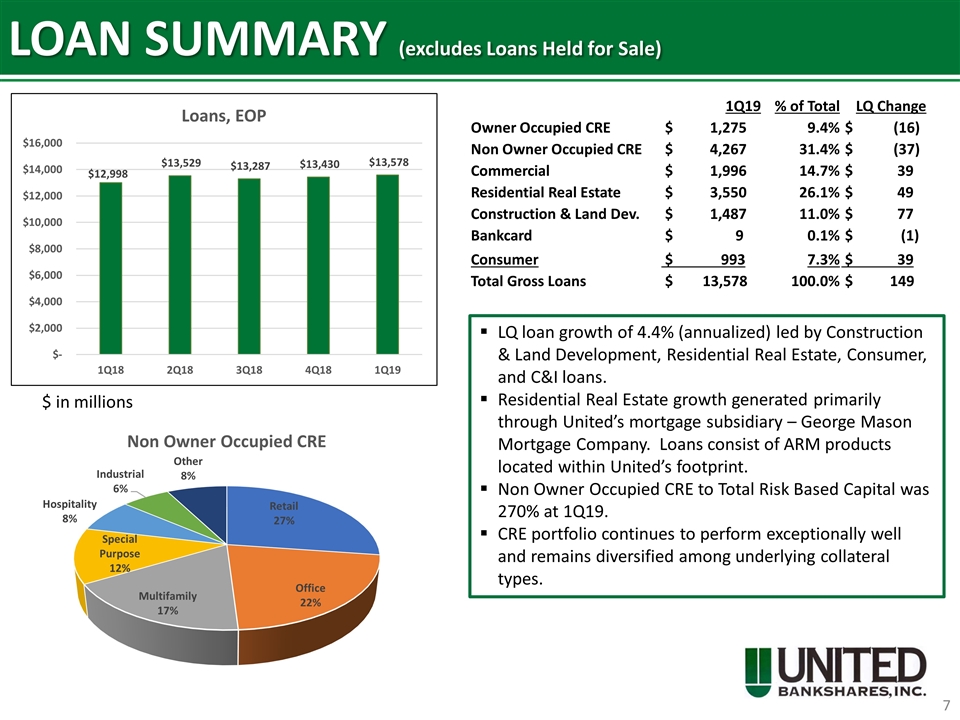
LOAN SUMMARY (excludes Loans Held for Sale) LQ loan growth of 4.4% (annualized) led by Construction & Land Development, Residential Real Estate, Consumer, and C&I loans. Residential Real Estate growth generated primarily through United’s mortgage subsidiary – George Mason Mortgage Company. Loans consist of ARM products located within United’s footprint. Non Owner Occupied CRE to Total Risk Based Capital was 270% at 1Q19. CRE portfolio continues to perform exceptionally well and remains diversified among underlying collateral types. $ in millions 1Q19 % of Total LQ Change Owner Occupied CRE $ 1,275 9.4% $ (16) Non Owner Occupied CRE $ 4,267 31.4% $ (37) Commercial $ 1,996 14.7% $ 39 Residential Real Estate $ 3,550 26.1% $ 49 Construction & Land Dev. $ 1,487 11.0% $ 77 Bankcard $ 9 0.1% $ (1) Consumer $ 993 7.3% $ 39 Total Gross Loans $ 13,578 100.0% $ 149
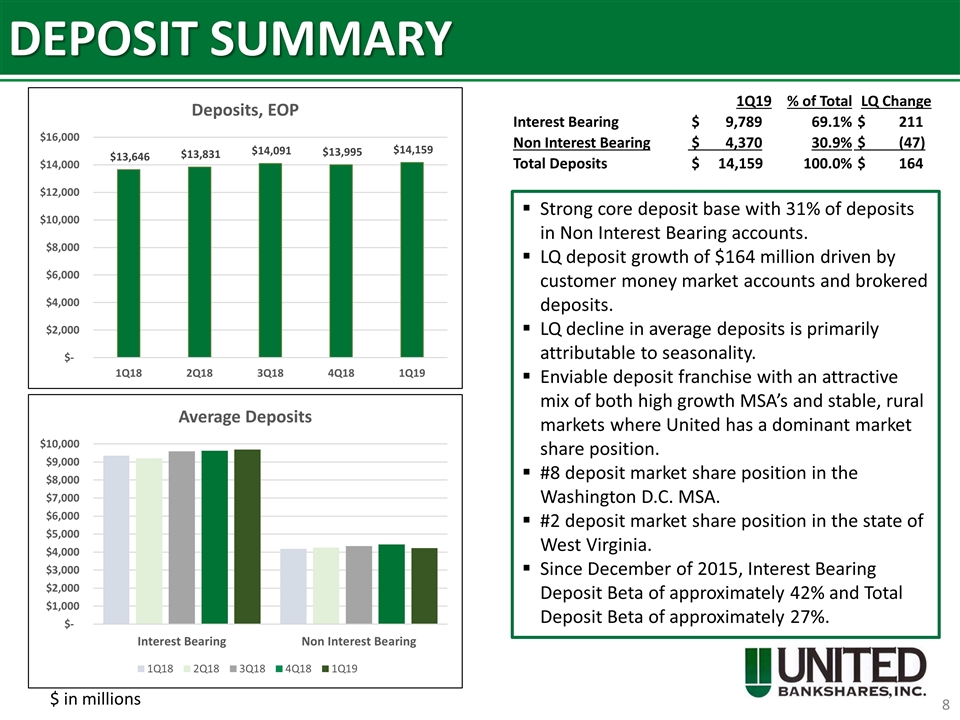
DEPOSIT SUMMARY Strong core deposit base with 31% of deposits in Non Interest Bearing accounts. LQ deposit growth of $164 million driven by customer money market accounts and brokered deposits. LQ decline in average deposits is primarily attributable to seasonality. Enviable deposit franchise with an attractive mix of both high growth MSA’s and stable, rural markets where United has a dominant market share position. #8 deposit market share position in the Washington D.C. MSA. #2 deposit market share position in the state of West Virginia. Since December of 2015, Interest Bearing Deposit Beta of approximately 42% and Total Deposit Beta of approximately 27%. $ in millions 1Q19 % of Total LQ Change Interest Bearing $ 9,789 69.1% $ 211 Non Interest Bearing $ 4,370 30.9% $ (47) Total Deposits $ 14,159 100.0% $ 164
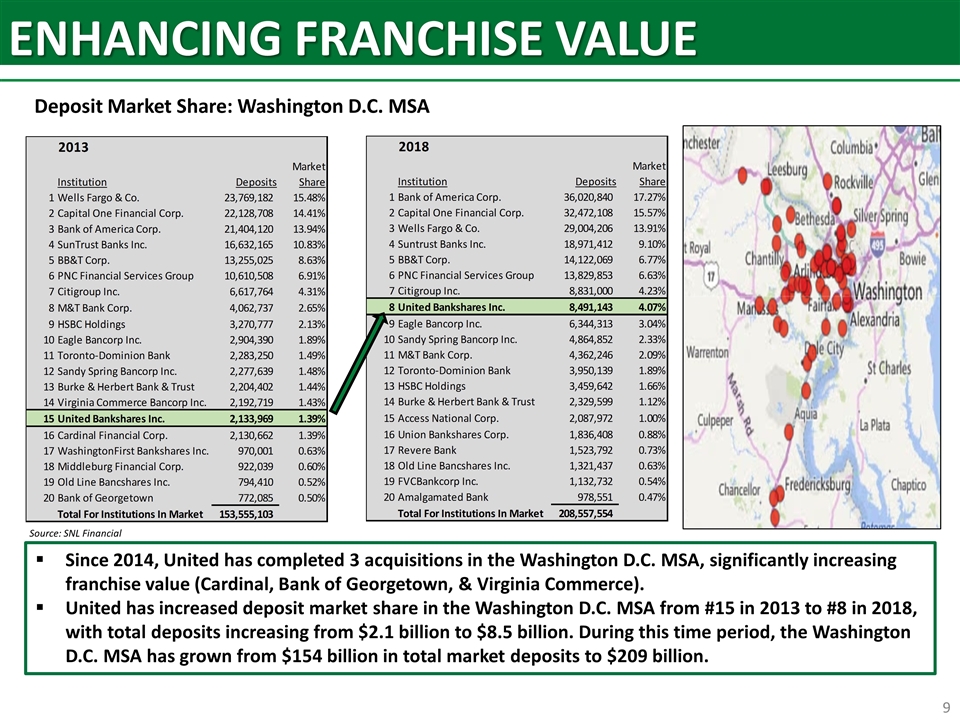
ENHANCING FRANCHISE VALUE Deposit Market Share: Washington D.C. MSA Since 2014, United has completed 3 acquisitions in the Washington D.C. MSA, significantly increasing franchise value (Cardinal, Bank of Georgetown, & Virginia Commerce). United has increased deposit market share in the Washington D.C. MSA from #15 in 2013 to #8 in 2018, with total deposits increasing from $2.1 billion to $8.5 billion. During this time period, the Washington D.C. MSA has grown from $154 billion in total market deposits to $209 billion. Source: SNL Financial
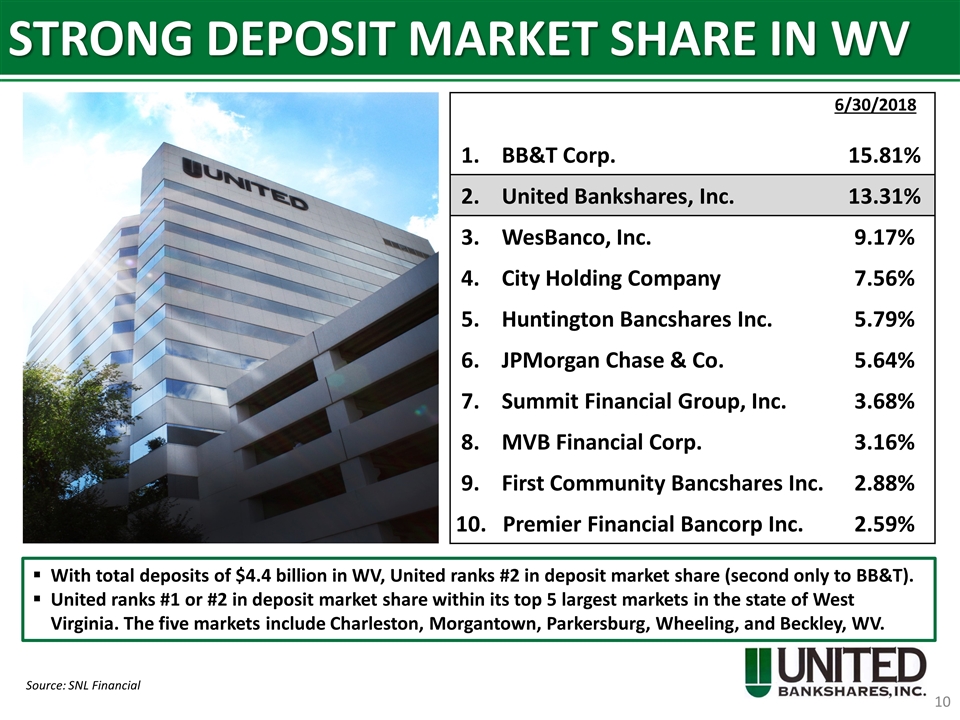
STRONG DEPOSIT MARKET SHARE IN WV Source: SNL Financial 6/30/2018 1. BB&T Corp. 15.81% 2. United Bankshares, Inc. 13.31% 3. WesBanco, Inc. 9.17% 4. City Holding Company 7.56% 5. Huntington Bancshares Inc. 5.79% 6. JPMorgan Chase & Co. 5.64% 7. Summit Financial Group, Inc. 3.68% 8. MVB Financial Corp. 3.16% 9. First Community Bancshares Inc. 2.88% 10. Premier Financial Bancorp Inc. 2.59% With total deposits of $4.4 billion in WV, United ranks #2 in deposit market share (second only to BB&T). United ranks #1 or #2 in deposit market share within its top 5 largest markets in the state of West Virginia. The five markets include Charleston, Morgantown, Parkersburg, Wheeling, and Beckley, WV.
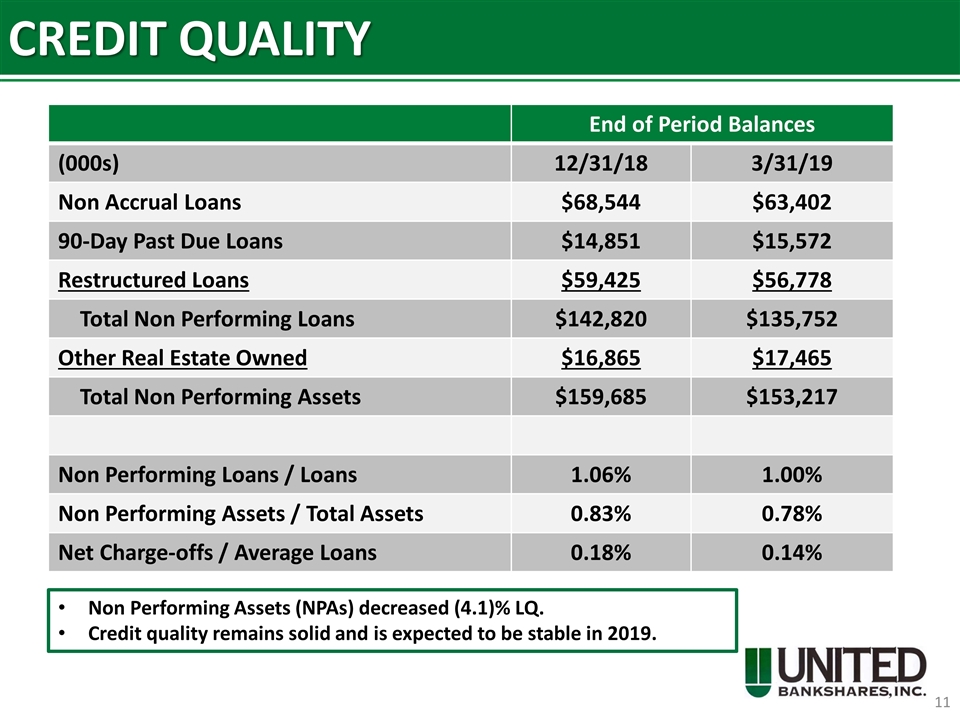
CREDIT QUALITY End of Period Balances (000s) 12/31/18 3/31/19 Non Accrual Loans $68,544 $63,402 90-Day Past Due Loans $14,851 $15,572 Restructured Loans $59,425 $56,778 Total Non Performing Loans $142,820 $135,752 Other Real Estate Owned $16,865 $17,465 Total Non Performing Assets $159,685 $153,217 Non Performing Loans / Loans 1.06% 1.00% Non Performing Assets / Total Assets 0.83% 0.78% Net Charge-offs / Average Loans 0.18% 0.14% Non Performing Assets (NPAs) decreased (4.1)% LQ. Credit quality remains solid and is expected to be stable in 2019.
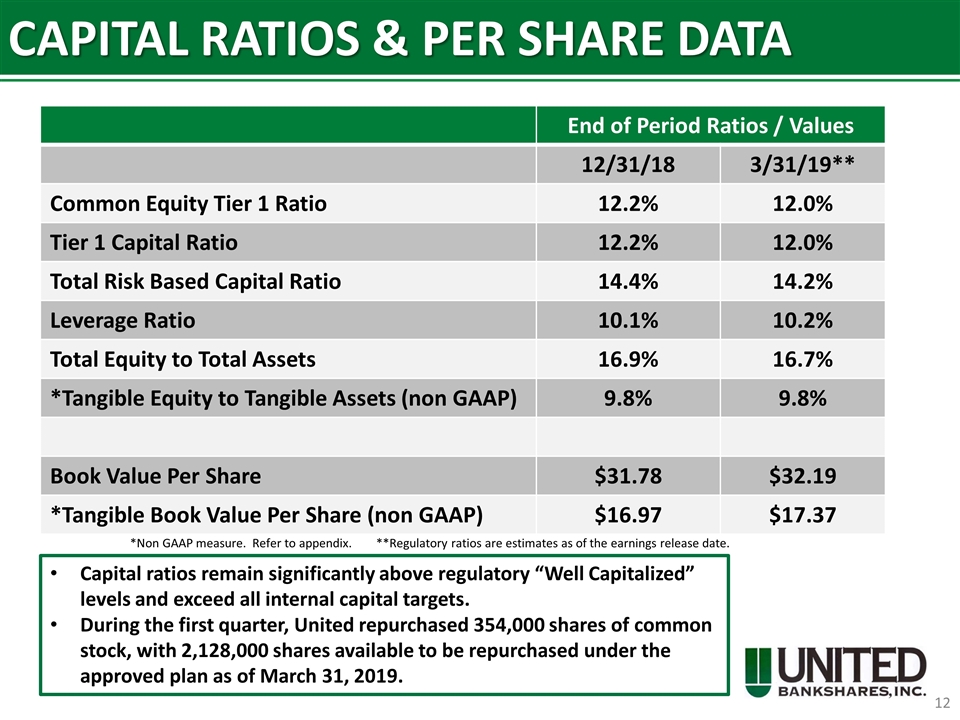
CAPITAL RATIOS & PER SHARE DATA End of Period Ratios / Values 12/31/18 3/31/19** Common Equity Tier 1 Ratio 12.2% 12.0% Tier 1 Capital Ratio 12.2% 12.0% Total Risk Based Capital Ratio 14.4% 14.2% Leverage Ratio 10.1% 10.2% Total Equity to Total Assets 16.9% 16.7% *Tangible Equity to Tangible Assets (non GAAP) 9.8% 9.8% Book Value Per Share $31.78 $32.19 *Tangible Book Value Per Share (non GAAP) $16.97 $17.37 Capital ratios remain significantly above regulatory “Well Capitalized” levels and exceed all internal capital targets. During the first quarter, United repurchased 354,000 shares of common stock, with 2,128,000 shares available to be repurchased under the approved plan as of March 31, 2019. *Non GAAP measure. Refer to appendix. **Regulatory ratios are estimates as of the earnings release date.
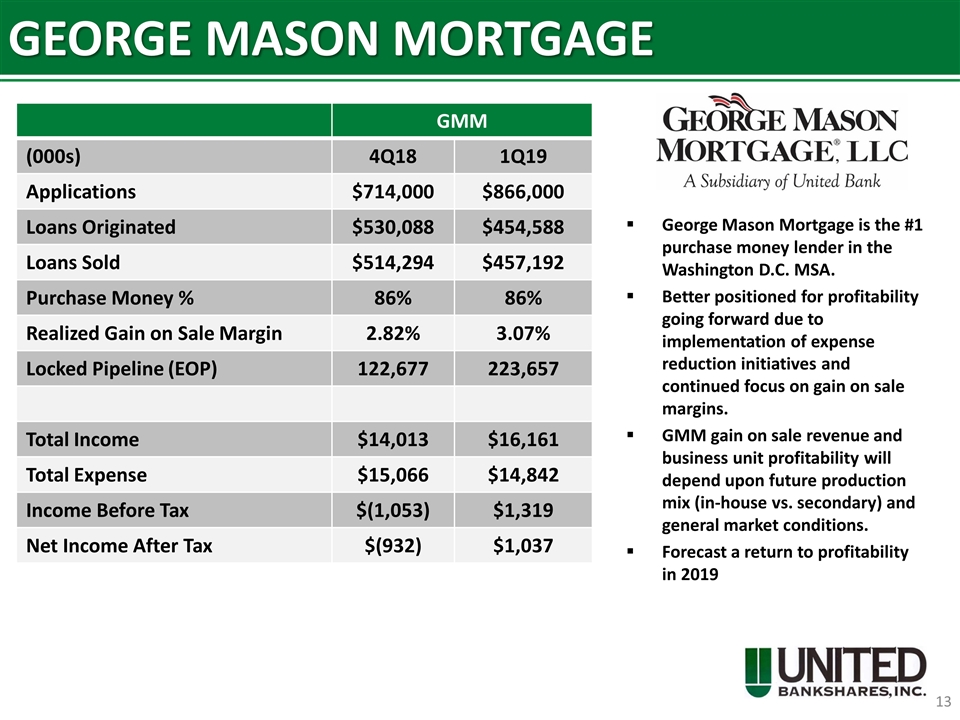
GEORGE MASON MORTGAGE George Mason Mortgage is the #1 purchase money lender in the Washington D.C. MSA. Better positioned for profitability going forward due to implementation of expense reduction initiatives and continued focus on gain on sale margins. GMM gain on sale revenue and business unit profitability will depend upon future production mix (in-house vs. secondary) and general market conditions. Forecast a return to profitability in 2019 GMM (000s) 4Q18 1Q19 Applications $714,000 $866,000 Loans Originated $530,088 $454,588 Loans Sold $514,294 $457,192 Purchase Money % 86% 86% Realized Gain on Sale Margin 2.82% 3.07% Locked Pipeline (EOP) 122,677 223,657 Total Income $14,013 $16,161 Total Expense $15,066 $14,842 Income Before Tax $(1,053) $1,319 Net Income After Tax $(932) $1,037
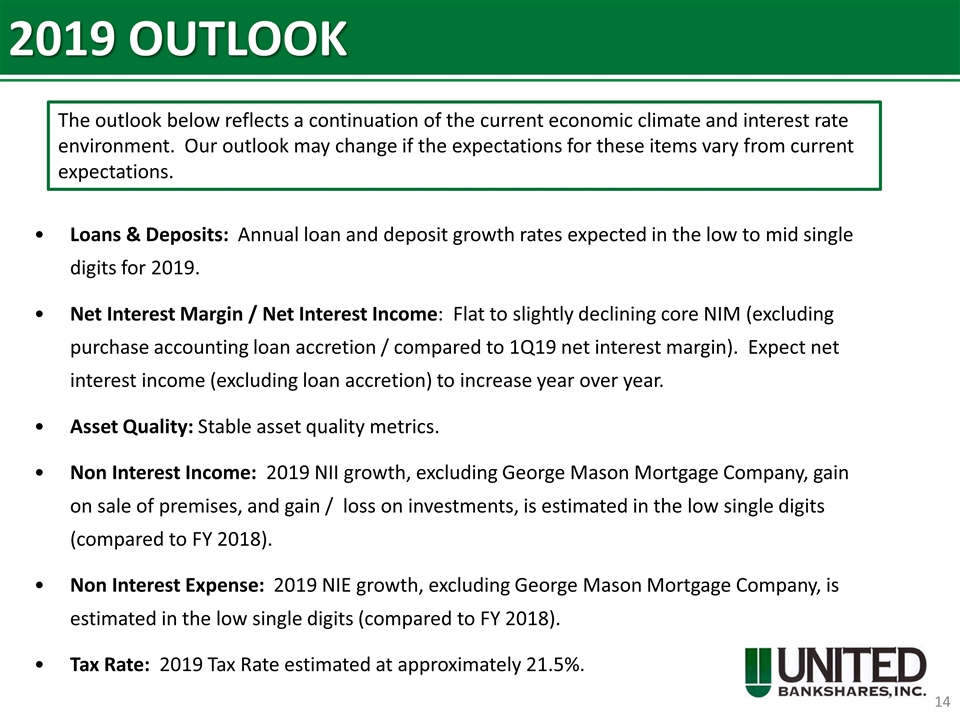
2019 OUTLOOK Loans & Deposits: Annual loan and deposit growth rates expected in the low to mid single digits for 2019. Net Interest Margin / Net Interest Income: Flat to slightly declining core NIM (excluding purchase accounting loan accretion / compared to 1Q19 net interest margin). Expect net interest income (excluding loan accretion) to increase year over year. Asset Quality: Stable asset quality metrics. Non Interest Income: 2019 NII growth, excluding George Mason Mortgage Company, gain on sale of premises, and gain / loss on investments, is estimated in the low single digits (compared to FY 2018). Non Interest Expense: 2019 NIE growth, excluding George Mason Mortgage Company, is estimated in the low single digits (compared to FY 2018). Tax Rate: 2019 Tax Rate estimated at approximately 21.5%. The outlook below reflects a continuation of the current economic climate and interest rate environment. Our outlook may change if the expectations for these items vary from current expectations.
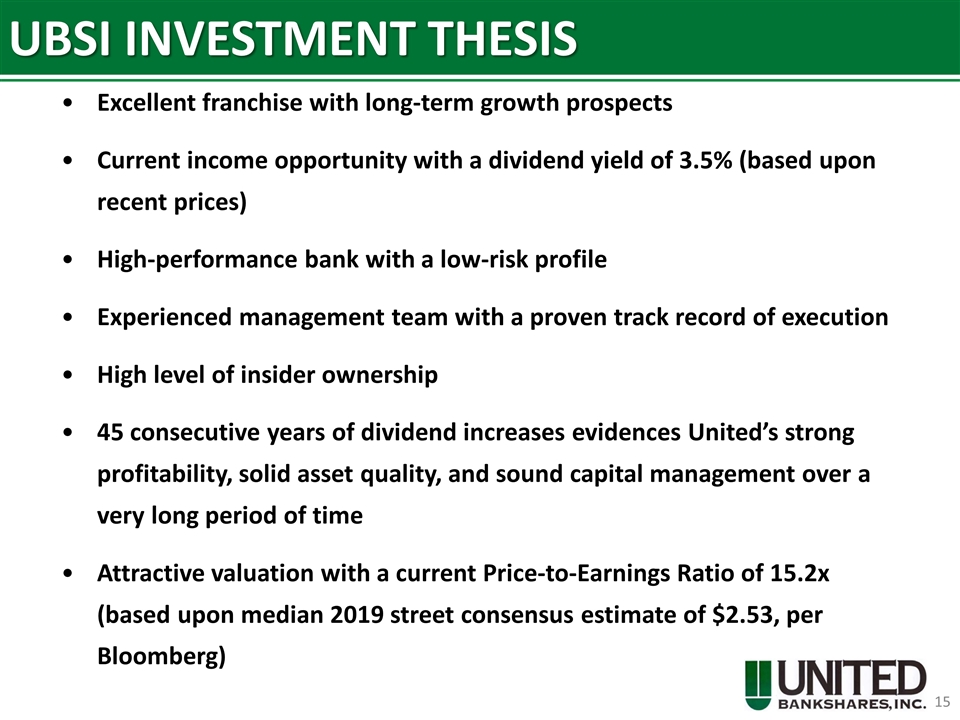
UBSI INVESTMENT THESIS Excellent franchise with long-term growth prospects Current income opportunity with a dividend yield of 3.5% (based upon recent prices) High-performance bank with a low-risk profile Experienced management team with a proven track record of execution High level of insider ownership 45 consecutive years of dividend increases evidences United’s strong profitability, solid asset quality, and sound capital management over a very long period of time Attractive valuation with a current Price-to-Earnings Ratio of 15.2x (based upon median 2019 street consensus estimate of $2.53, per Bloomberg)

THE CHALLENGE TO BE THE BEST NEVER ENDS www.ubsi-inc.com
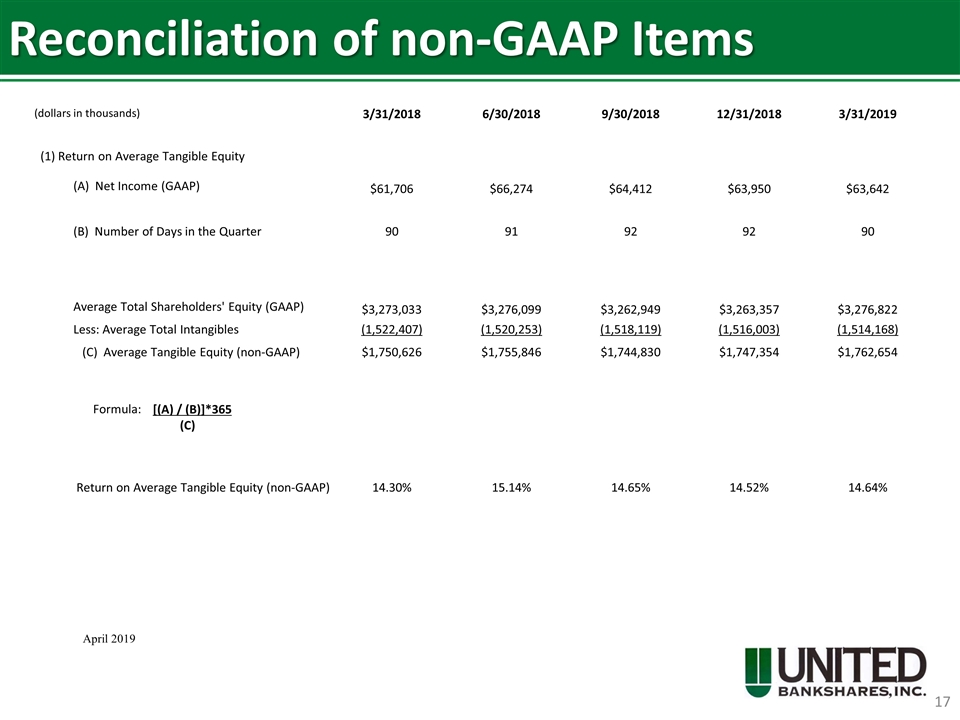
Reconciliation of non-GAAP Items April 2019 (dollars in thousands) 3/31/2018 6/30/2018 9/30/2018 12/31/2018 3/31/2019 (1) Return on Average Tangible Equity (A) Net Income (GAAP) $61,706 $66,274 $64,412 $63,950 $63,642 (B) Number of Days in the Quarter 90 91 92 92 90 Average Total Shareholders' Equity (GAAP) $3,273,033 $3,276,099 $3,262,949 $3,263,357 $3,276,822 Less: Average Total Intangibles (1,522,407) (1,520,253) (1,518,119) (1,516,003) (1,514,168) (C) Average Tangible Equity (non-GAAP) $1,750,626 $1,755,846 $1,744,830 $1,747,354 $1,762,654 Formula: [(A) / (B)]*365 (C) Return on Average Tangible Equity (non-GAAP) 14.30% 15.14% 14.65% 14.52% 14.64%

Reconciliation of non-GAAP Items (cont.) April 2019 (dollars in thousands) 12/31/2018 3/31/2019 (2) Tangible Equity to Tangible Assets Total Assets (GAAP) $ 19,250,498 $ 19,645,133 Less: Total Intangibles (GAAP) (1,514,961) (1,513,207) Tangible Assets (non-GAAP) $ 17,735,537 $ 18,131,926 Total Shareholders' Equity (GAAP) $ 3,251,624 $ 3,286,891 Less: Total Intangibles (GAAP) (1,514,961) (1,513,207) Tangible Equity (non-GAAP) $ 1,736,663 $ 1,773,684 Tangible Equity to Tangible Assets (non-GAAP) 9.8% 9.8% (3) Tangible Book Value Per Share: Total Shareholders' Equity (GAAP) $ 3,251,624 $ 3,286,891 Less: Total Intangibles (GAAP) (1,514,961) (1,513,207) Tangible Equity (non-GAAP) $ 1,736,663 $ 1,773,684 ÷ EOP Shares Outstanding (Net of Treasury Stock) 102,323,488 102,118,029 Tangible Book Value Per Share (non-GAAP) $16.97 $17.37


