United Bankshares, Inc. First Quarter 2020 Earnings Review April 30, 2020 Exhibit 99.2
Forward-Looking Statements Forward Looking Statements This presentation and statements made by United Bankshares, Inc. (“United”) and its management contain forward-looking statements within the meaning of Section 27A of the Securities Act of 1933 and Section 21E of the Securities Exchange Act of 1934. These forward-looking statements are intended to be covered by the safe harbor provisions for forward-looking statements contained in the Private Securities Litigation Reform Act of 1995. These forward-looking statements include, but are not limited to, statements about (i) the merger (the “Merger”) between Carolina Financial Corporation (“Carolina Financial”) and United; (ii) United’s and Carolina Financial’s plans, objectives, expectations and intentions and other statements contained in this press release that are not historical facts; (iii) the effect of the COVID-19 pandemic; and (iv) other statements identified by words such as “expects,” “anticipates,” “intends,” “plans,” “believes,” “seeks,” “estimates,” “targets,” “projects,” or words of similar meaning generally intended to identify forward-looking statements. These forward-looking statements are based upon the current beliefs and expectations managements of United and are inherently subject to significant business, economic and competitive uncertainties and contingencies, many of which are beyond the control of United. In addition, these forward-looking statements are subject to assumptions with respect to future business strategies and decisions that are subject to change. Actual results may differ materially from the anticipated results discussed in these forward-looking statements because of possible uncertainties. The following factors, among others, could cause actual results to differ materially from the anticipated results or other expectations expressed in the forward-looking statements: (1) the businesses of United and Carolina Financial may not be combined successfully, or such combination may take longer, be more difficult, time-consuming or costly to accomplish than expected; (2) the expected growth opportunities or cost savings from the Merger may not be fully realized or may take longer to realize than expected; (3) deposit attrition, operating costs, customer losses and business disruption following the Merger, including adverse effects on relationships with employees, may be greater than expected; (4) the impact of the COVID-19 pandemic, including the negative impacts and disruptions on United’s customers, the communities it serves and the domestic and global economy; (5) current and future economic and market conditions, including the effects of high unemployment rates, United States fiscal debt, budget and tax matters and any slowdown in global economic growth; (6) legislative or regulatory changes, including changes in accounting standards, that may adversely affect the businesses in which United and Carolina Financial are engaged; (7) the interest rate environment may further compress margins and adversely affect net interest income; (8) results may be adversely affected by continued diversification of assets and adverse changes to credit quality; (9) competition from other financial services companies in United's and Carolina Financial's markets could adversely affect operations; and (10) the economic slowdown could continue to adversely affect credit quality and loan originations. Additional factors, that could cause actual results to differ materially from those expressed in the forward-looking statements are discussed United’s reports (such as Annual Reports on Form 10-K, Quarterly Reports on Form 10-Q and Current Reports on Form 8-K) filed with the Securities and Exchange Commission and available on the SEC's Internet site (http://www.sec.gov). United cautions that the foregoing list of factors is not exclusive. All subsequent written and oral forward-looking statements concerning the proposed merger with Carolina Financial or other matters attributable to United or Carolina Financial or any person acting on their behalf are expressly qualified in their entirety by the cautionary statements above. United does not undertake any obligation to update any forward-looking statement to reflect circumstances or events that occur after the date the forward-looking statements are made.
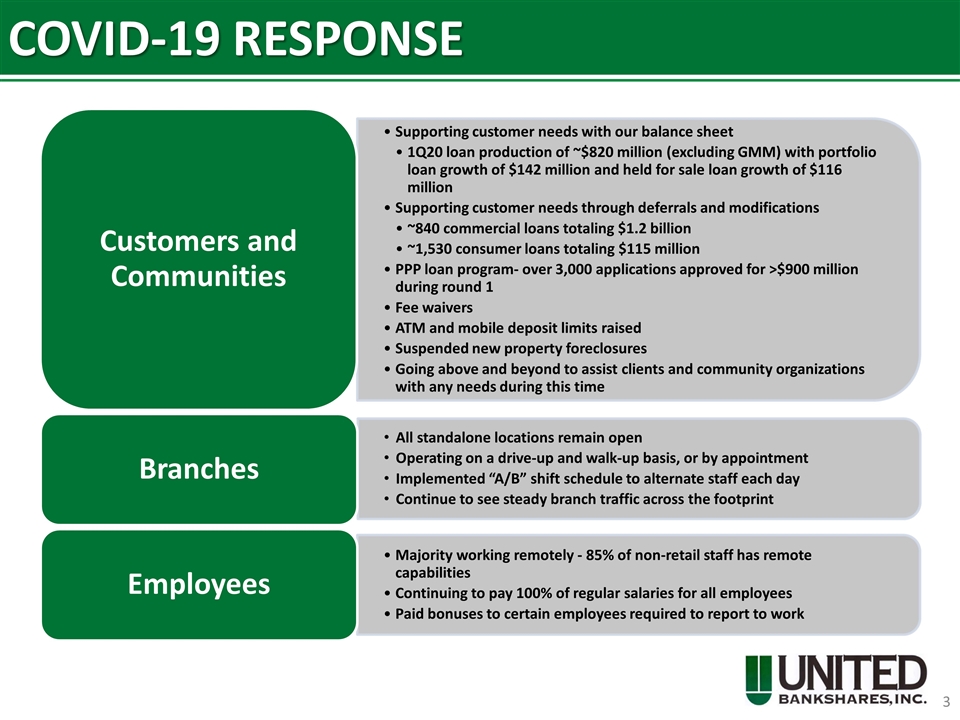
COVID-19 RESPONSE Branches Operating on a drive-up and walk-up basis, or by appointment Employees Majority working remotely - 85% of non-retail staff has remote capabilities Continuing to pay 100% of regular salaries for all employees All standalone locations remain open Paid bonuses to certain employees required to report to work Implemented “A/B” shift schedule to alternate staff each day Continue to see steady branch traffic across the footprint Customers and Communities Supporting customer needs with our balance sheet ~840 commercial loans totaling $1.2 billion ~1,530 consumer loans totaling $115 million Fee waivers ATM and mobile deposit limits raised Going above and beyond to assist clients and community organizations with any needs during this time PPP loan program- over 3,000 applications approved for >$900 million during round 1 1Q20 loan production of ~$820 million (excluding GMM) with portfolio loan growth of $142 million and held for sale loan growth of $116 million Supporting customer needs through deferrals and modifications Suspended new property foreclosures
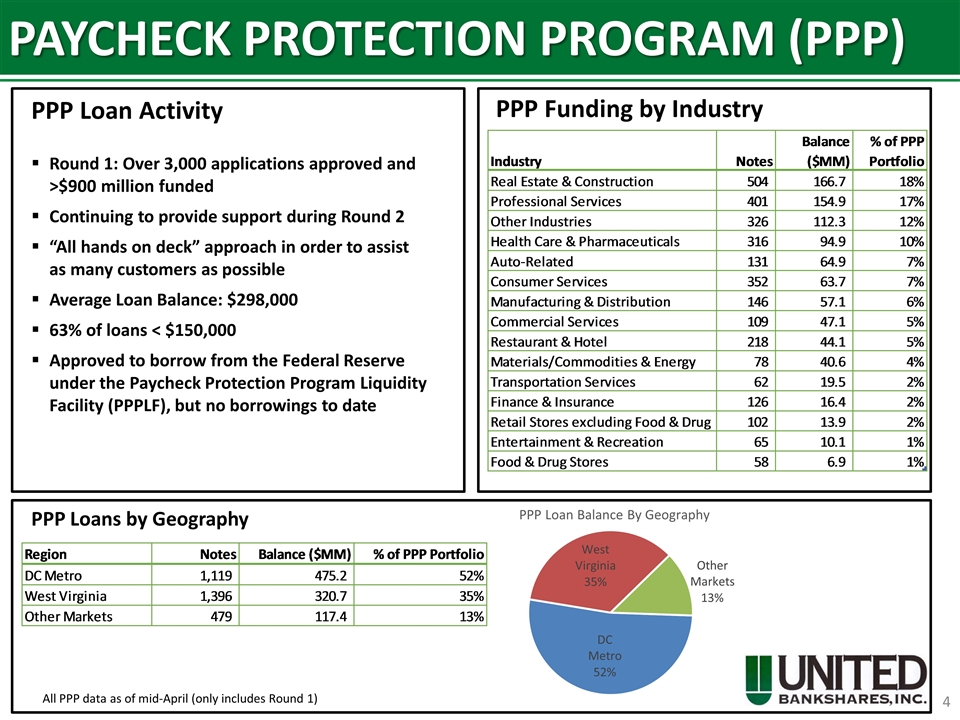
PAYCHECK PROTECTION PROGRAM (PPP) Round 1: Over 3,000 applications approved and >$900 million funded Continuing to provide support during Round 2 “All hands on deck” approach in order to assist as many customers as possible Average Loan Balance: $298,000 63% of loans < $150,000 Approved to borrow from the Federal Reserve under the Paycheck Protection Program Liquidity Facility (PPPLF), but no borrowings to date PPP Loan Activity PPP Loans by Geography PPP Funding by Industry All PPP data as of mid-April (only includes Round 1)
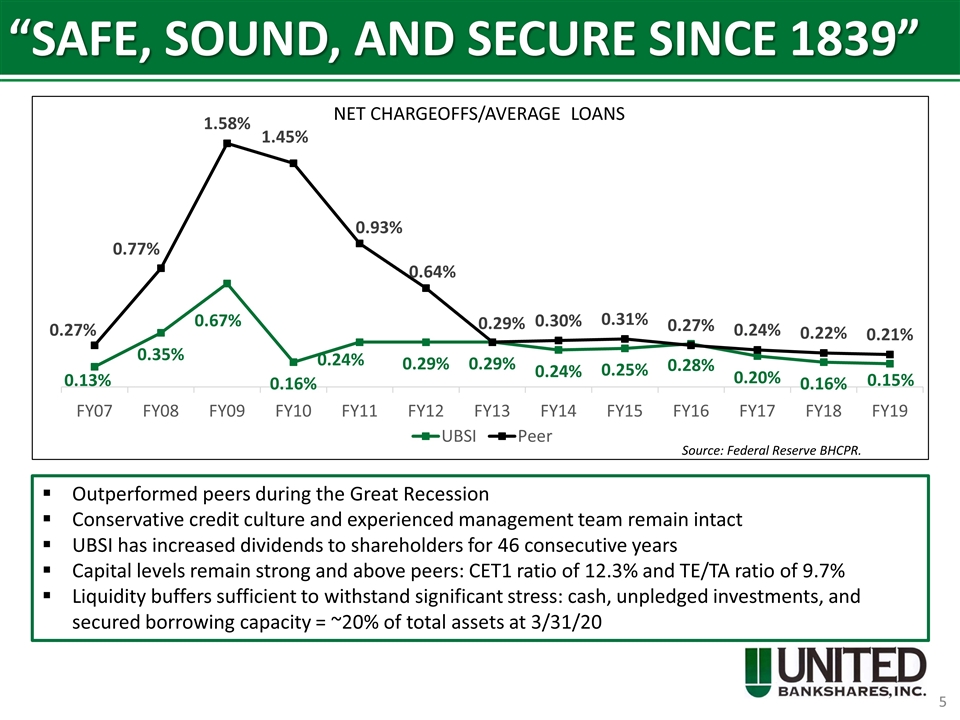
“SAFE, SOUND, AND SECURE SINCE 1839” Source: Federal Reserve BHCPR. NET CHARGEOFFS/AVERAGE LOANS Outperformed peers during the Great Recession Conservative credit culture and experienced management team remain intact UBSI has increased dividends to shareholders for 46 consecutive years Capital levels remain strong and above peers: CET1 ratio of 12.3% and TE/TA ratio of 9.7% Liquidity buffers sufficient to withstand significant stress: cash, unpledged investments, and secured borrowing capacity = ~20% of total assets at 3/31/20
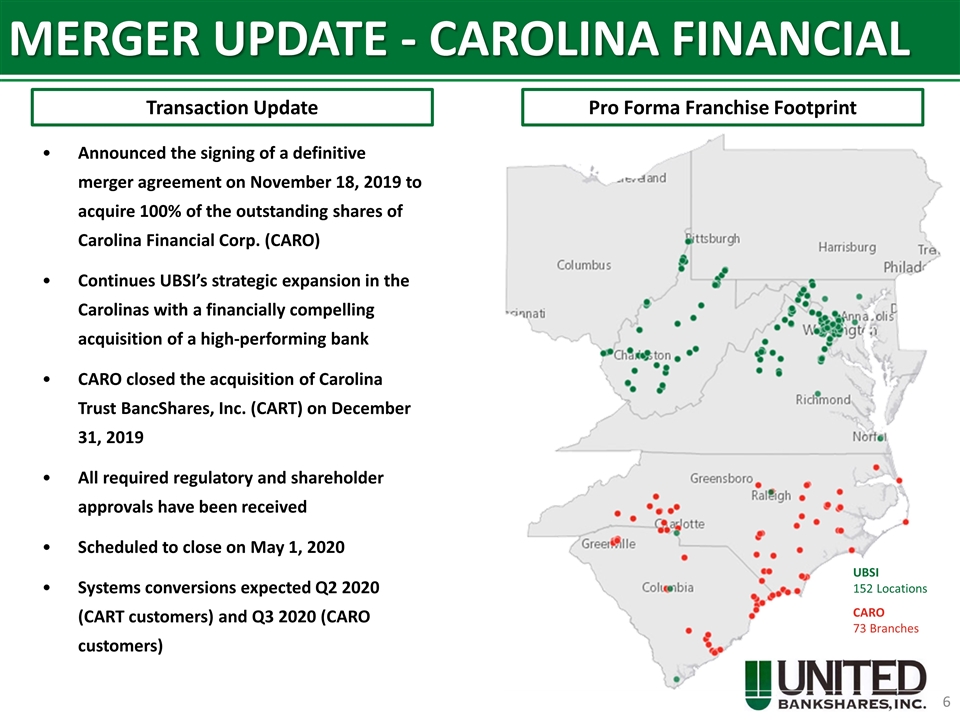
MERGER UPDATE - CAROLINA FINANCIAL Announced the signing of a definitive merger agreement on November 18, 2019 to acquire 100% of the outstanding shares of Carolina Financial Corp. (CARO) Continues UBSI’s strategic expansion in the Carolinas with a financially compelling acquisition of a high-performing bank CARO closed the acquisition of Carolina Trust BancShares, Inc. (CART) on December 31, 2019 All required regulatory and shareholder approvals have been received Scheduled to close on May 1, 2020 Systems conversions expected Q2 2020 (CART customers) and Q3 2020 (CARO customers) Pro Forma Franchise Footprint Transaction Update UBSI 152 Locations CARO 73 Branches
1Q20 HIGHLIGHTS Reacted swiftly to the COVID-19 pandemic, striving to execute our mission of excellence in service to our employees, our customers, our shareholders, and our communities Achieved Net Income of $40.2 million and Diluted Earnings Per Share of $0.40 Exceeded $20 billion in total assets Expect to close the merger with Carolina Financial Corporation on May 1, 2020 Generated Return on Average Assets of 0.82%, Return on Average Equity of 4.82%, and Return on Average Tangible Equity* of 8.77% Quarterly dividend of $0.35 per share equates to a yield of 4.8% (based upon recent prices) Strong expense control with an efficiency ratio of 56.7% Adopted CECL accounting standard effective 01/01/20 Capital position remains robust *Non GAAP measure. Refer to appendix.
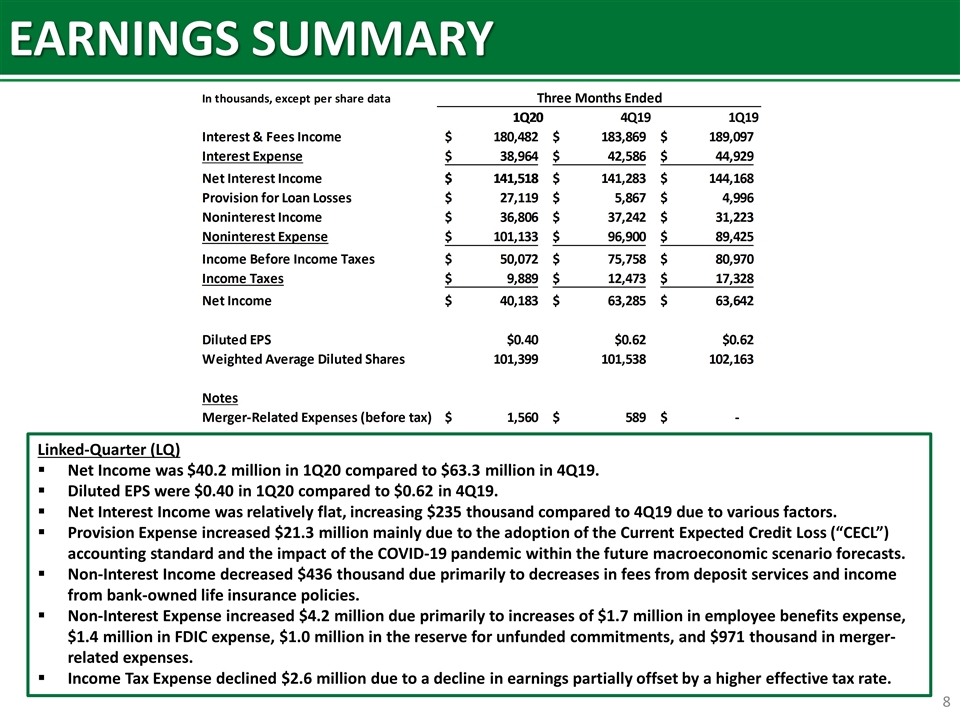
EARNINGS SUMMARY Linked-Quarter (LQ) Net Income was $40.2 million in 1Q20 compared to $63.3 million in 4Q19. Diluted EPS were $0.40 in 1Q20 compared to $0.62 in 4Q19. Net Interest Income was relatively flat, increasing $235 thousand compared to 4Q19 due to various factors. Provision Expense increased $21.3 million mainly due to the adoption of the Current Expected Credit Loss (“CECL”) accounting standard and the impact of the COVID-19 pandemic within the future macroeconomic scenario forecasts. Non-Interest Income decreased $436 thousand due primarily to decreases in fees from deposit services and income from bank-owned life insurance policies. Non-Interest Expense increased $4.2 million due primarily to increases of $1.7 million in employee benefits expense, $1.4 million in FDIC expense, $1.0 million in the reserve for unfunded commitments, and $971 thousand in merger-related expenses. Income Tax Expense declined $2.6 million due to a decline in earnings partially offset by a higher effective tax rate.
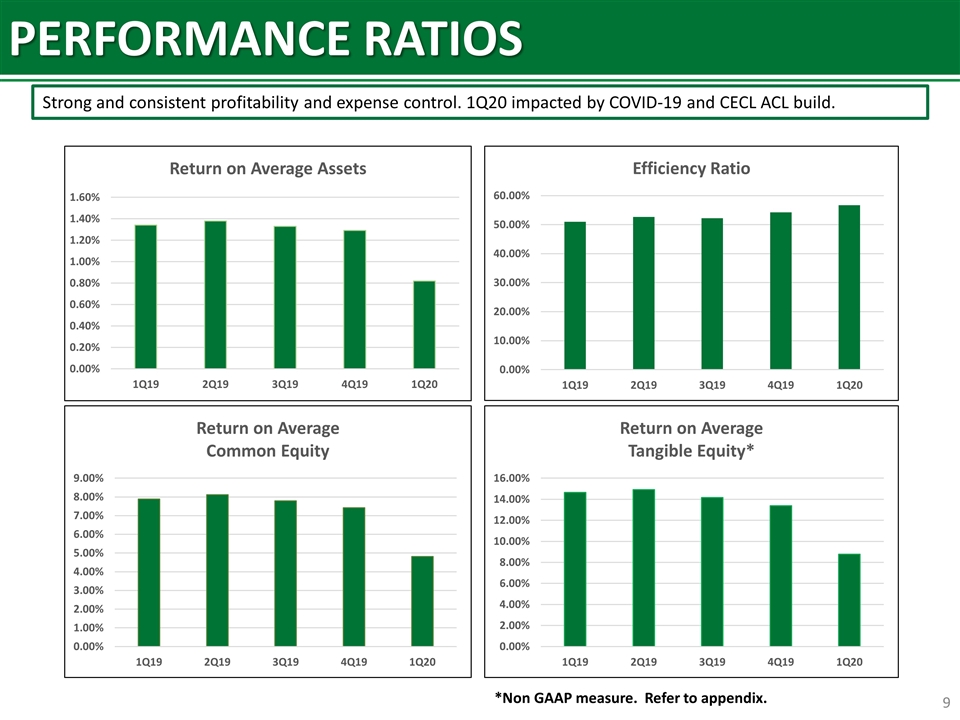
PERFORMANCE RATIOS Strong and consistent profitability and expense control. 1Q20 impacted by COVID-19 and CECL ACL build. *Non GAAP measure. Refer to appendix.
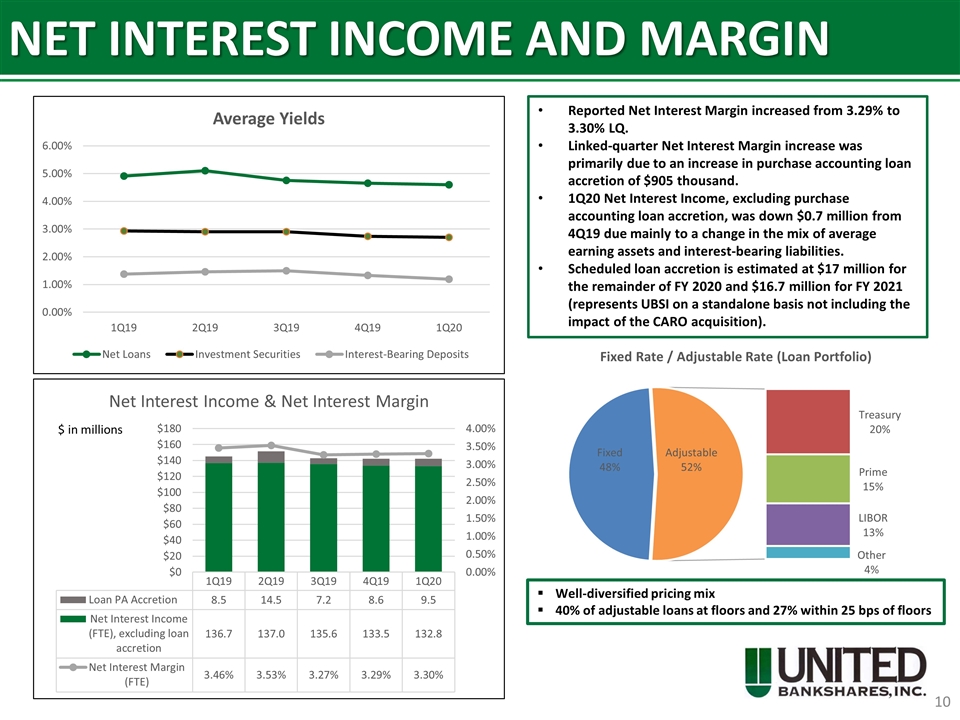
NET INTEREST INCOME AND MARGIN Reported Net Interest Margin increased from 3.29% to 3.30% LQ. Linked-quarter Net Interest Margin increase was primarily due to an increase in purchase accounting loan accretion of $905 thousand. 1Q20 Net Interest Income, excluding purchase accounting loan accretion, was down $0.7 million from 4Q19 due mainly to a change in the mix of average earning assets and interest-bearing liabilities. Scheduled loan accretion is estimated at $17 million for the remainder of FY 2020 and $16.7 million for FY 2021 (represents UBSI on a standalone basis not including the impact of the CARO acquisition). $ in millions Well-diversified pricing mix 40% of adjustable loans at floors and 27% within 25 bps of floors
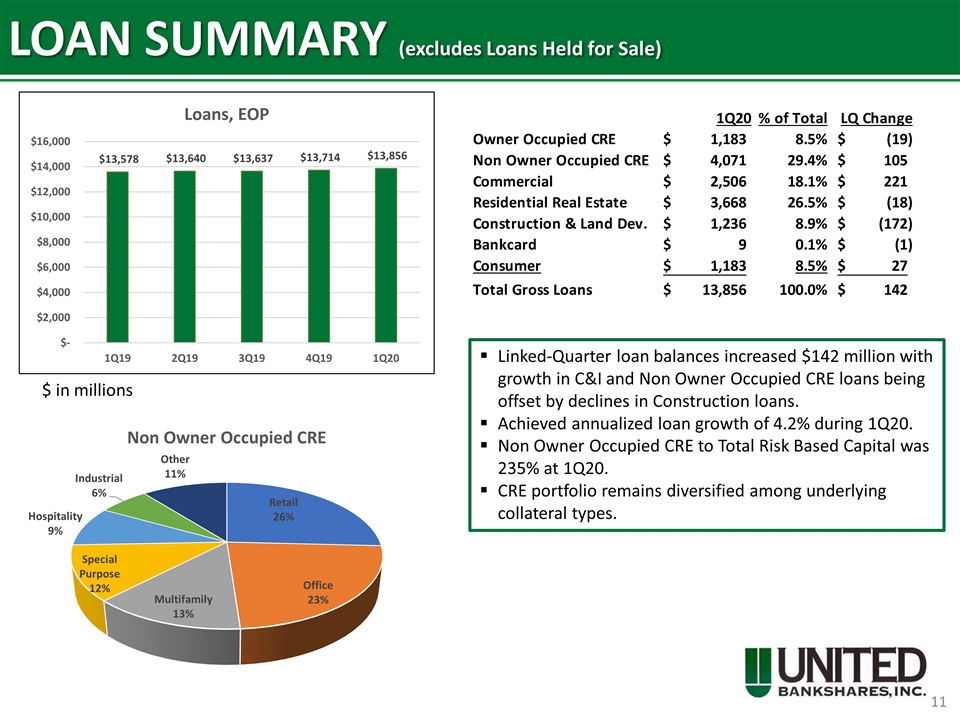
LOAN SUMMARY (excludes Loans Held for Sale) Linked-Quarter loan balances increased $142 million with growth in C&I and Non Owner Occupied CRE loans being offset by declines in Construction loans. Achieved annualized loan growth of 4.2% during 1Q20. Non Owner Occupied CRE to Total Risk Based Capital was 235% at 1Q20. CRE portfolio remains diversified among underlying collateral types. $ in millions
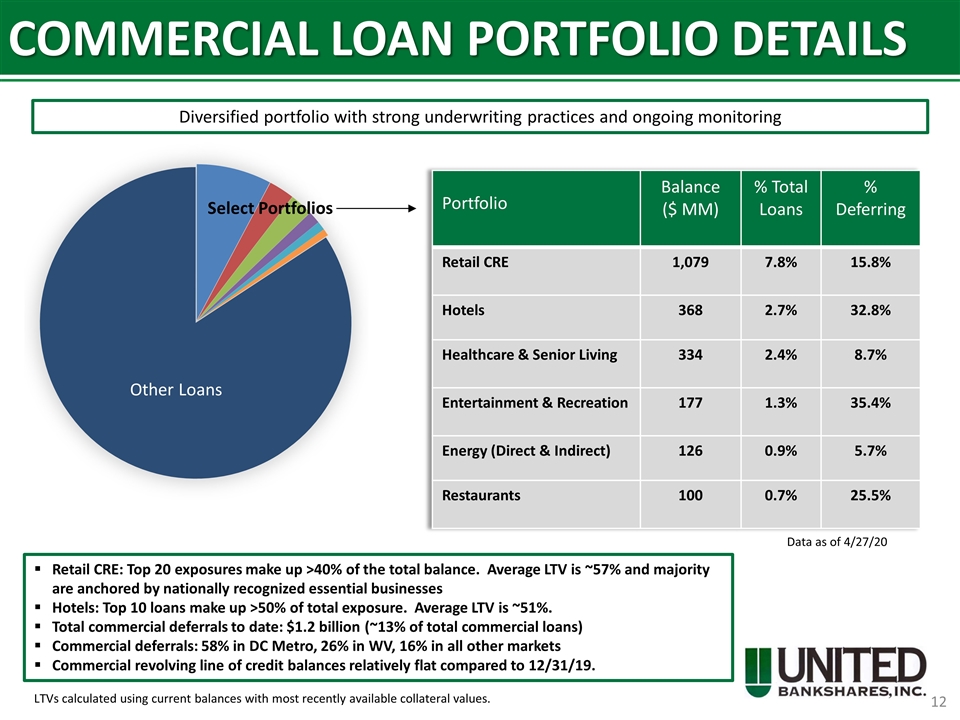
COMMERCIAL LOAN PORTFOLIO DETAILS Diversified portfolio with strong underwriting practices and ongoing monitoring Portfolio Balance ($ MM) % Total Loans % Deferring Retail CRE 1,079 7.8% 15.8% Hotels 368 2.7% 32.8% Healthcare & Senior Living 334 2.4% 8.7% Entertainment & Recreation 177 1.3% 35.4% Energy (Direct & Indirect) 126 0.9% 5.7% Restaurants 100 0.7% 25.5% Retail CRE: Top 20 exposures make up >40% of the total balance. Average LTV is ~57% and majority are anchored by nationally recognized essential businesses Hotels: Top 10 loans make up >50% of total exposure. Average LTV is ~51%. Total commercial deferrals to date: $1.2 billion (~13% of total commercial loans) Commercial deferrals: 58% in DC Metro, 26% in WV, 16% in all other markets Commercial revolving line of credit balances relatively flat compared to 12/31/19. Select Portfolios Data as of 4/27/20 LTVs calculated using current balances with most recently available collateral values.
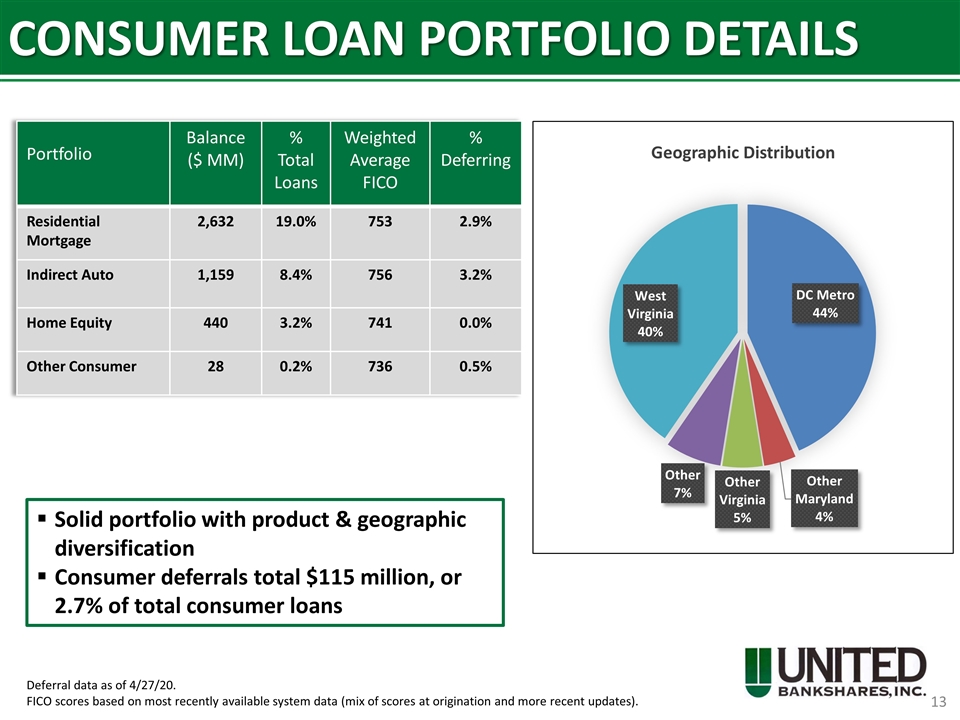
CONSUMER LOAN PORTFOLIO DETAILS Solid portfolio with product & geographic diversification Consumer deferrals total $115 million, or 2.7% of total consumer loans Portfolio Balance ($ MM) % Total Loans Weighted Average FICO % Deferring Residential Mortgage 2,632 19.0% 753 2.9% Indirect Auto 1,159 8.4% 756 3.2% Home Equity 440 3.2% 741 0.0% Other Consumer 28 0.2% 736 0.5% Deferral data as of 4/27/20. FICO scores based on most recently available system data (mix of scores at origination and more recent updates).
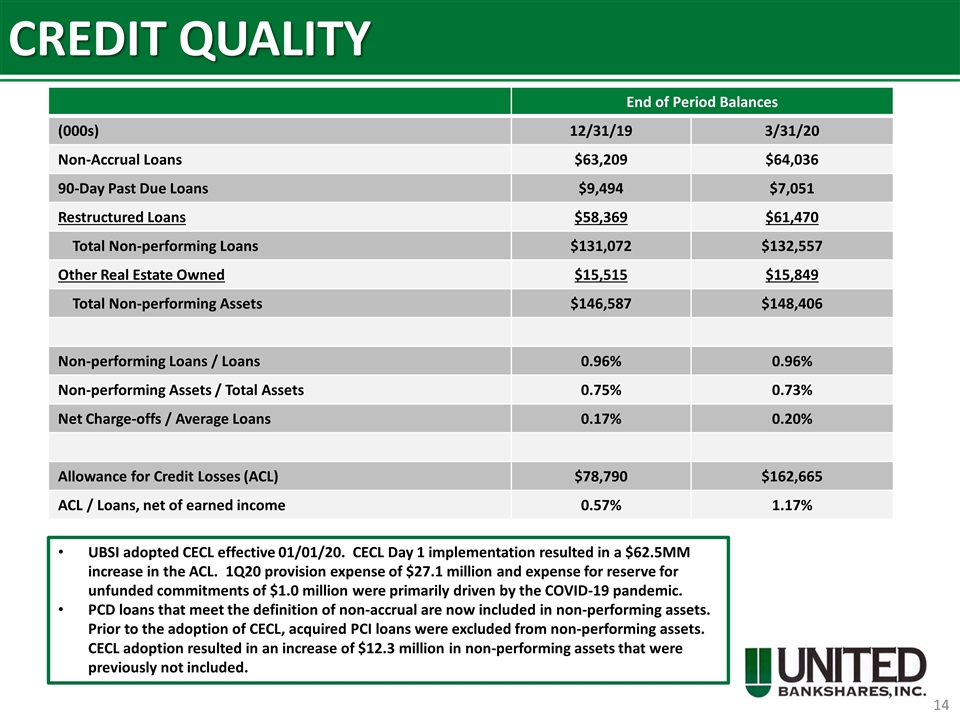
CREDIT QUALITY End of Period Balances (000s) 12/31/19 3/31/20 Non-Accrual Loans $63,209 $64,036 90-Day Past Due Loans $9,494 $7,051 Restructured Loans $58,369 $61,470 Total Non-performing Loans $131,072 $132,557 Other Real Estate Owned $15,515 $15,849 Total Non-performing Assets $146,587 $148,406 Non-performing Loans / Loans 0.96% 0.96% Non-performing Assets / Total Assets 0.75% 0.73% Net Charge-offs / Average Loans 0.17% 0.20% Allowance for Credit Losses (ACL) $78,790 $162,665 ACL / Loans, net of earned income 0.57% 1.17% UBSI adopted CECL effective 01/01/20. CECL Day 1 implementation resulted in a $62.5MM increase in the ACL. 1Q20 provision expense of $27.1 million and expense for reserve for unfunded commitments of $1.0 million were primarily driven by the COVID-19 pandemic. PCD loans that meet the definition of non-accrual are now included in non-performing assets. Prior to the adoption of CECL, acquired PCI loans were excluded from non-performing assets. CECL adoption resulted in an increase of $12.3 million in non-performing assets that were previously not included.

DEPOSIT SUMMARY Strong core deposit base with 35% of deposits in Non Interest Bearing accounts. LQ deposit increase of $162 million driven by growth in Non Interest Bearing accounts, while brokered deposits declined $63 million. Enviable deposit franchise with an attractive mix of both high growth MSA’s and stable, rural markets where United has a dominant market share position. #7 deposit market share position in the Washington D.C. MSA. #2 deposit market share position in the state of West Virginia. $ in millions
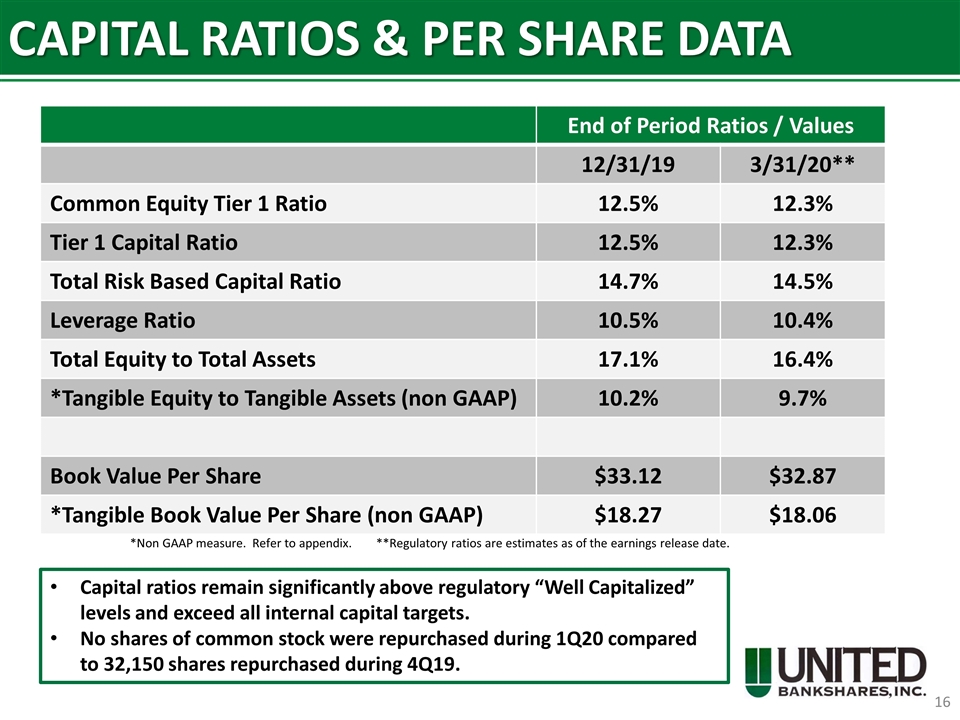
CAPITAL RATIOS & PER SHARE DATA End of Period Ratios / Values 12/31/19 3/31/20** Common Equity Tier 1 Ratio 12.5% 12.3% Tier 1 Capital Ratio 12.5% 12.3% Total Risk Based Capital Ratio 14.7% 14.5% Leverage Ratio 10.5% 10.4% Total Equity to Total Assets 17.1% 16.4% *Tangible Equity to Tangible Assets (non GAAP) 10.2% 9.7% Book Value Per Share $33.12 $32.87 *Tangible Book Value Per Share (non GAAP) $18.27 $18.06 Capital ratios remain significantly above regulatory “Well Capitalized” levels and exceed all internal capital targets. No shares of common stock were repurchased during 1Q20 compared to 32,150 shares repurchased during 4Q19. *Non GAAP measure. Refer to appendix. **Regulatory ratios are estimates as of the earnings release date.
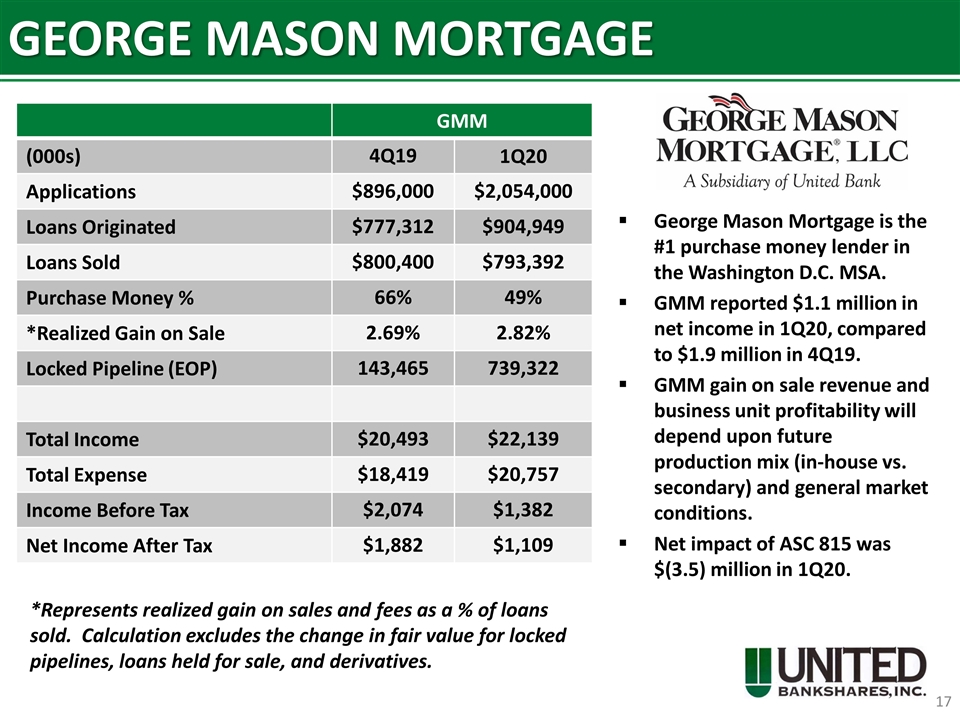
GEORGE MASON MORTGAGE George Mason Mortgage is the #1 purchase money lender in the Washington D.C. MSA. GMM reported $1.1 million in net income in 1Q20, compared to $1.9 million in 4Q19. GMM gain on sale revenue and business unit profitability will depend upon future production mix (in-house vs. secondary) and general market conditions. Net impact of ASC 815 was $(3.5) million in 1Q20. GMM (000s) 4Q19 1Q20 Applications $896,000 $2,054,000 Loans Originated $777,312 $904,949 Loans Sold $800,400 $793,392 Purchase Money % 66% 49% *Realized Gain on Sale 2.69% 2.82% Locked Pipeline (EOP) 143,465 739,322 Total Income $20,493 $22,139 Total Expense $18,419 $20,757 Income Before Tax $2,074 $1,382 Net Income After Tax $1,882 $1,109 *Represents realized gain on sales and fees as a % of loans sold. Calculation excludes the change in fair value for locked pipelines, loans held for sale, and derivatives.
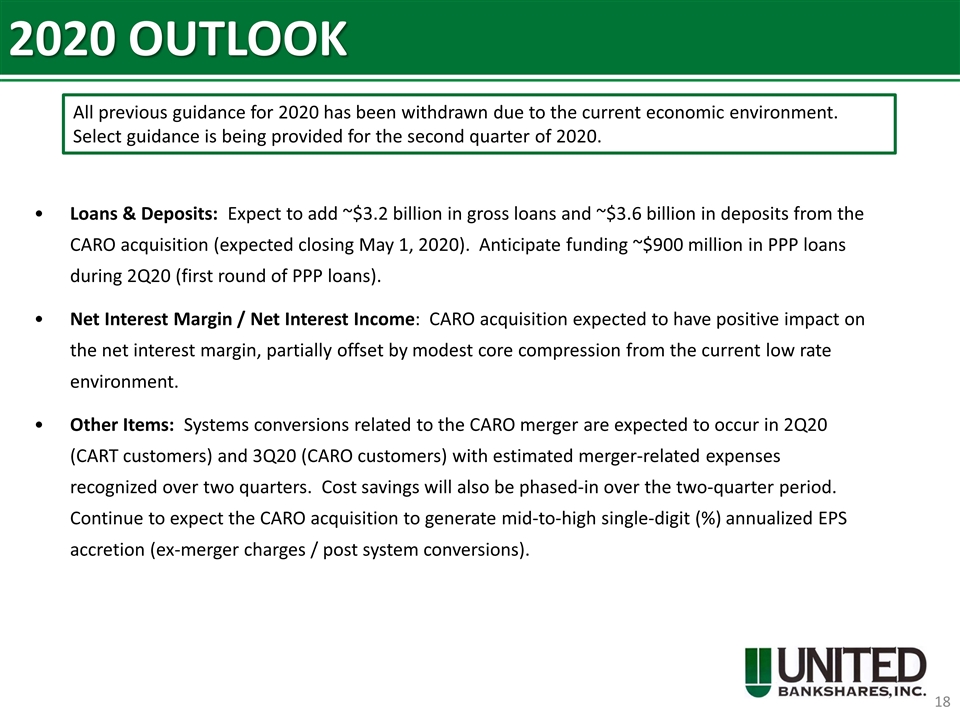
2020 OUTLOOK Loans & Deposits: Expect to add ~$3.2 billion in gross loans and ~$3.6 billion in deposits from the CARO acquisition (expected closing May 1, 2020). Anticipate funding ~$900 million in PPP loans during 2Q20 (first round of PPP loans). Net Interest Margin / Net Interest Income: CARO acquisition expected to have positive impact on the net interest margin, partially offset by modest core compression from the current low rate environment. Other Items: Systems conversions related to the CARO merger are expected to occur in 2Q20 (CART customers) and 3Q20 (CARO customers) with estimated merger-related expenses recognized over two quarters. Cost savings will also be phased-in over the two-quarter period. Continue to expect the CARO acquisition to generate mid-to-high single-digit (%) annualized EPS accretion (ex-merger charges / post system conversions). All previous guidance for 2020 has been withdrawn due to the current economic environment. Select guidance is being provided for the second quarter of 2020.
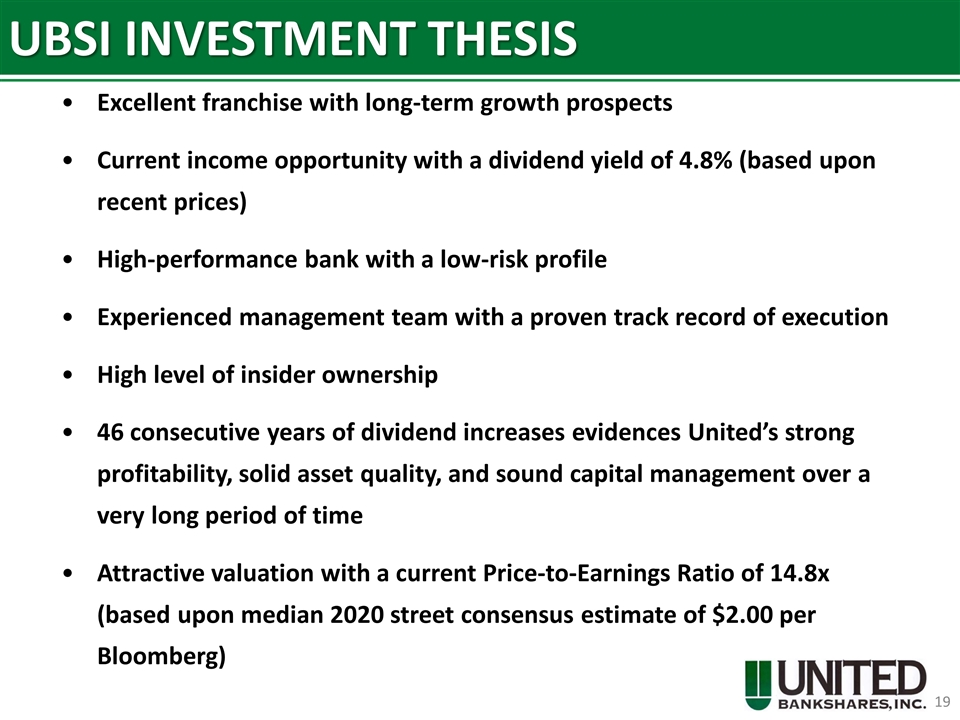
UBSI INVESTMENT THESIS Excellent franchise with long-term growth prospects Current income opportunity with a dividend yield of 4.8% (based upon recent prices) High-performance bank with a low-risk profile Experienced management team with a proven track record of execution High level of insider ownership 46 consecutive years of dividend increases evidences United’s strong profitability, solid asset quality, and sound capital management over a very long period of time Attractive valuation with a current Price-to-Earnings Ratio of 14.8x (based upon median 2020 street consensus estimate of $2.00 per Bloomberg)

THE CHALLENGE TO BE THE BEST NEVER ENDS www.ubsi-inc.com
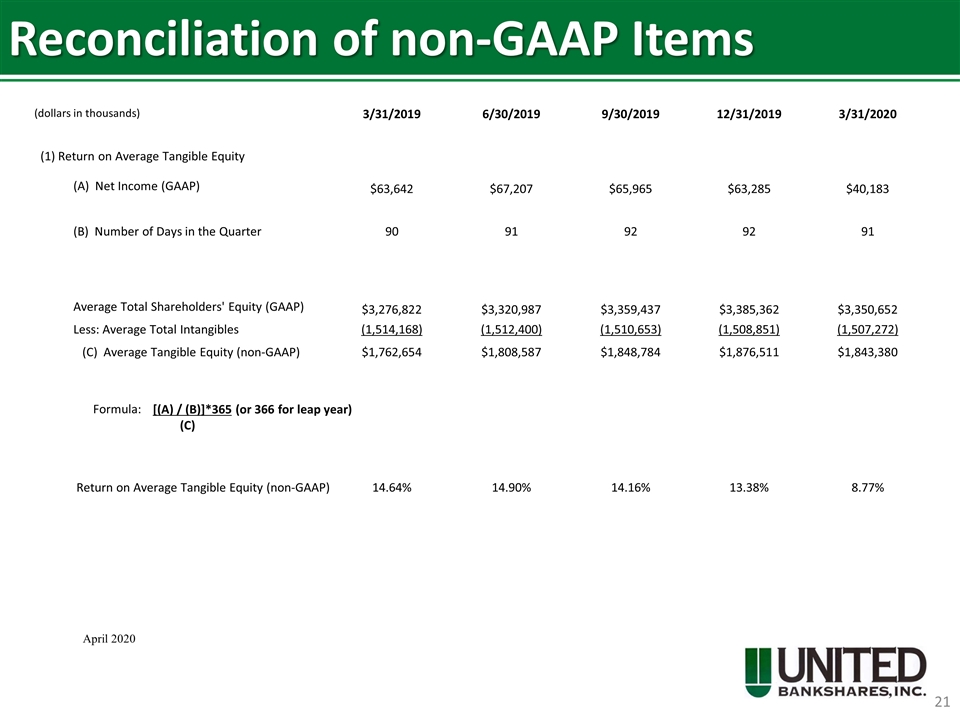
Reconciliation of non-GAAP Items April 2020 (dollars in thousands) 3/31/2019 6/30/2019 9/30/2019 12/31/2019 3/31/2020 (1) Return on Average Tangible Equity (A) Net Income (GAAP) $63,642 $67,207 $65,965 $63,285 $40,183 (B) Number of Days in the Quarter 90 91 92 92 91 Average Total Shareholders' Equity (GAAP) $3,276,822 $3,320,987 $3,359,437 $3,385,362 $3,350,652 Less: Average Total Intangibles (1,514,168) (1,512,400) (1,510,653) (1,508,851) (1,507,272) (C) Average Tangible Equity (non-GAAP) $1,762,654 $1,808,587 $1,848,784 $1,876,511 $1,843,380 Formula: [(A) / (B)]*365 (or 366 for leap year) (C) Return on Average Tangible Equity (non-GAAP) 14.64% 14.90% 14.16% 13.38% 8.77%
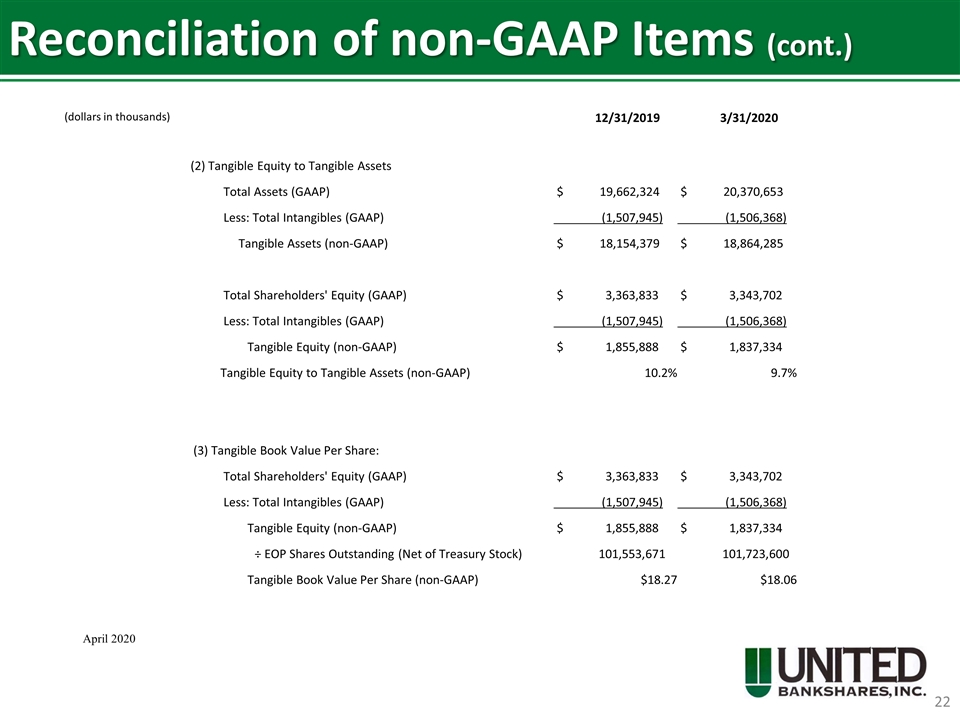
Reconciliation of non-GAAP Items (cont.) April 2020 (dollars in thousands) 12/31/2019 3/31/2020 (2) Tangible Equity to Tangible Assets Total Assets (GAAP) $ 19,662,324 $ 20,370,653 Less: Total Intangibles (GAAP) (1,507,945) (1,506,368) Tangible Assets (non-GAAP) $ 18,154,379 $ 18,864,285 Total Shareholders' Equity (GAAP) $ 3,363,833 $ 3,343,702 Less: Total Intangibles (GAAP) (1,507,945) (1,506,368) Tangible Equity (non-GAAP) $ 1,855,888 $ 1,837,334 Tangible Equity to Tangible Assets (non-GAAP) 10.2% 9.7% (3) Tangible Book Value Per Share: Total Shareholders' Equity (GAAP) $ 3,363,833 $ 3,343,702 Less: Total Intangibles (GAAP) (1,507,945) (1,506,368) Tangible Equity (non-GAAP) $ 1,855,888 $ 1,837,334 ÷ EOP Shares Outstanding (Net of Treasury Stock) 101,553,671 101,723,600 Tangible Book Value Per Share (non-GAAP) $18.27 $18.06


