UNITED STATES
SECURITIES AND EXCHANGE COMMISSION
Washington, D.C. 20549
FORM N-CSR
CERTIFIED SHAREHOLDER REPORT OF REGISTERED
MANAGEMENT INVESTMENT COMPANIES
Investment Company Act file number | 811-03870 |
|
Morgan Stanley U.S. Government Securities Trust |
(Exact name of registrant as specified in charter) |
|
522 Fifth Avenue, New York, New York | | 10036 |
(Address of principal executive offices) | | (Zip code) |
|
John H. Gernon 522 Fifth Avenue, New York, New York 10036 |
(Name and address of agent for service) |
|
Registrant’s telephone number, including area code: | 212-296-0289 | |
|
Date of fiscal year end: | December 31, | |
|
Date of reporting period: | December 31, 2018 | |
| | | | | | | | |
Item 1 - Report to Shareholders

INVESTMENT MANAGEMENT
Morgan Stanley U.S. Government Securities Trust
Annual Report
December 31, 2018
Beginning on January 1, 2021, as permitted by regulations adopted by the Securities and Exchange Commission ("SEC"), paper copies of the Fund's Annual and Semi-Annual Reports to Shareholders ("Shareholder Reports") will no longer be sent by mail, unless you specifically request paper copies of the Shareholder Reports from the Fund or from your financial intermediary, such as a broker-dealer or a bank. Instead, the Shareholder Reports will be made available on the Fund's website, https://www.morganstanley.com/im/shareholderreports and you will be notified by mail each time a Shareholder Report is posted and provided with a website link to access the Shareholder Report. If you already elected to receive Shareholder Reports electronically, you will not be affected by this change and you need not take any action. You may elect to receive Shareholder Reports and other communications from the Fund electronically anytime by contacting your financial intermediary or, if you are a direct investor, please follow the instructions on the envelope.
Beginning on January 1, 2019, you may elect to receive all future Shareholder Reports in paper free of charge. If you invest through a financial intermediary, you can contact your financial intermediary to request that you continue to receive paper copies of your Shareholder Reports. If you invest directly with the Fund, please follow the instructions on the envelope to let the Fund know you wish to continue receiving paper copies of your Shareholder Reports. Your election to receive Shareholder Reports in paper will apply to all funds held in your account if you invest through your financial intermediary or all funds held with the fund complex if you invest directly with a fund.

Morgan Stanley U.S. Government Securities Trust
Table of Contents
Welcome Shareholder | | | 3 | | |
Fund Report | | | 4 | | |
Performance Summary | | | 8 | | |
Expense Example | | | 10 | | |
Portfolio of Investments | | | 12 | | |
Statement of Assets and Liabilities | | | 20 | | |
Statement of Operations | | | 21 | | |
Statements of Changes in Net Assets | | | 22 | | |
Notes to Financial Statements | | | 23 | | |
Financial Highlights | | | 39 | | |
Report of Independent Registered Public Accounting Firm | | | 43 | | |
Privacy Notice | | | 44 | | |
| Trustee and Officer Information | | | 49 | | |
2
Welcome Shareholder,
We are pleased to provide this Annual report, in which you will learn how your investment in Morgan Stanley U.S. Government Securities Trust (the "Fund") performed during the latest twelve-month period. It includes an overview of the market conditions and discusses some of the factors that affected performance during the reporting period. In addition, the report contains financial statements and a list of portfolio holdings.
Morgan Stanley Investment Management is a client-centric, investor-led organization. Our global presence, intellectual capital, and breadth of products and services enable us to partner with investors to meet the evolving challenges of today's financial markets. We aim to deliver superior investment service and to empower our clients to make the informed decisions that help them reach their investment goals.
As always, we thank you for selecting Morgan Stanley Investment Management and look forward to working with you in the months and years ahead.
This material must be preceded or accompanied by a prospectus for the fund being offered.
Market forecasts provided in this report may not necessarily come to pass. There is no assurance that the Fund will achieve its investment objective. The Fund is subject to market risk, which is the possibility that market values of securities owned by the Fund will decline and, therefore, the value of the Fund's shares may be less than what you paid for them. Accordingly, you can lose money investing in this Fund. Please see the prospectus for more complete information on investment risks.
3
Fund Report (unaudited)
For the year ended December 31, 2018
Total Return for the 12 Months Ended December 31, 2018 | |
| Class A | | Class B | | Class L | | Class I | | Class C | | Bloomberg
Barclays U.S.
Government/
Mortgage
Index1 | |
Lipper
General U.S.
Government
Funds Index2 | |
| | –0.01 | % | | | 0.02 | % | | | –0.25 | % | | | 0.34 | % | | | –0.76 | % | | | 0.93 | % | | | 0.75 | % | |
The performance of Morgan Stanley U.S. Government Securities Trust's (the "Fund") five share classes varies because each has different expenses. The Fund's total returns assume the reinvestment of all distributions but do not reflect the deduction of any applicable sales charges. Such costs would lower performance. See Performance Summary for standardized performance and benchmark information.
Because Class B shares incurred lower expenses under the 12b-1 fee plan than did Class A shares for the 12 months ended December 31, 2018, the total operating expense ratio for Class B shares was lower and, as a result, the performance of Class B shares was higher than that of the Class A shares. There can be no assurance that this will continue to occur in the future as the maximum fees payable by Class B shares under the 12b-1 Plan are higher than those payable by Class A shares.
The Fund's Distributor has agreed to reduce the 12b-1 fee on Class B shares of the Fund to the extent it exceeds 0.24% of the average daily net assets of such shares on an annualized basis. This waiver will continue for at least one year from the date of the Fund's prospectus or until such time that the Fund's Board of
Trustees (the "Trustees") acts to discontinue all or a portion of such waiver when it deems that such action is appropriate.
Market Conditions
Over 2018, U.S. Treasury yields rose and the curve flattened. Short maturity yields were driven higher by the four Federal Reserve rate increases. Longer maturities lagged, primarily due to uncertainties about the outlook for global growth and inflation. Over the year, 10-year U.S. Treasury yields rose 28 basis points, ending the year at 2.68%.(i)
Equity and credit markets underperformed in 2018, with much of the damage occurring in the fourth quarter. In both the corporate and securitized sectors, higher quality bonds outperformed their lower quality counterparts. The highest quality sectors, such as agency mortgage-backed securities (MBS), taxable municipals and most securitized credit, had performance either similar to or only slightly below similar duration Treasuries.
Performance Analysis
All share classes of the Fund underperformed both the Bloomberg Barclays U.S. Government/Mortgage Index (the "Index") and the Lipper General U.S. Government Funds Index for the 12 months ended December 31, 2018, assuming no deduction of applicable sales charges.
(i) Source: Bloomberg L.P. Data as of December 31, 2018.
4
Much of the Fund's underperformance during the period stemmed from sector allocation. High quality U.S. taxable municipal bonds underperformed Treasuries as their spreads widened along with other credit sectors. Coupon and security selection led to relative underperformance in agency MBS. Non-agency mortgage-backed and asset-backed security holdings helped relative performed.
Interest rate risk management slightly helped relative returns. Our short position in swap spreads and our holdings in TIPS, or Treasury inflation-protected securities, both performed well. Our short duration position also helped as yields rose.
There is no guarantee that any sectors mentioned will continue to perform as discussed herein or that securities in such sectors will be held by the Fund in the future.
PORTFOLIO COMPOSITION as of 12/31/18 | |
Agency Fixed Rate Mortgages | | | 36.3 | % | |
Collateralized Mortgage Obligations —
Agency Collateral Series | | | 11.6 | | |
Municipal Bonds | | | 10.9 | | |
Mortgages — Other | | | 10.5 | | |
U.S. Agency Securities | | | 8.3 | | |
Short-Term Investments | | | 6.8 | | |
Asset-Backed Securities | | | 5.0 | | |
Agency Bond — Sovereign
(U.S. Government Guaranteed) | | | 4.6 | | |
U.S. Treasury Securities | | | 1.9 | | |
Commercial Mortgage-Backed Securities | | | 1.8 | | |
Agency Bonds — Consumer Discretionary
(U.S. Government Guaranteed) | | | 1.2 | | |
Agency Adjustable Rate Mortgages | | | 0.8 | | |
Agency Bond — Finance
(U.S. Government Guaranteed) | | | 0.3 | | |
+ Does not include open long futures contracts with a value of $28,973,921 and net unrealized appreciation of $537,494. Does not include open swap agreements with net unrealized depreciation of $42,462.
Subject to change daily. Provided for informational purposes only and should not be deemed as a recommendation to buy or sell the types of securities mentioned above. All percentages for portfolio composition are stated as a percentage of total investments.
Morgan Stanley is a full-service securities firm engaged in securities trading and brokerage activities, investment banking, research and analysis, financing and financial advisory services.
5
Investment Strategy
The Fund normally invests at least 80 percent of its net assets in a portfolio of U.S. government securities. This policy may be changed without shareholder approval; however, you would be notified upon 60 days' notice in writing of any changes. In making investment decisions, the Fund's "Adviser," Morgan Stanley Investment Management Inc., considers economic developments, interest rate trends and other factors. The U.S. government securities that the Fund may purchase include: U.S. Treasury bills, notes and bonds, all of which are direct obligations of the U.S. Government; securities (including mortgage-backed securities) issued by agencies and instrumentalities of the U.S. Government which are backed by the full faith and credit of the United States; securities (including mortgage-backed securities) issued by agencies and instrumentalities which are not backed by the full faith and credit of the United States, but whose issuing agency or instrumentality has the right to borrow, to meet its obligations, from the U.S. Treasury; securities issued by agencies and instrumentalities which are backed solely by the credit of the issuing agency or instrumentality; and securities guaranteed by the U.S. Government or its agencies and instrumentalities or securities supported by the U.S. Government in some other way, such as the discretionary authority of the U.S. Government to purchase certain obligations of the agency or instrumentality. The Fund's investments may include zero coupon securities, which are purchased at a discount and generally accrue interest, but make no payment until maturity.
For More Information About Portfolio Holdings
Each Morgan Stanley fund provides a complete schedule of portfolio holdings in its semiannual and annual reports within 60 days of the end of the fund's second and fourth fiscal quarters. The semiannual reports and the annual reports are filed electronically with the Securities and
Exchange Commission (SEC) on Form N-CSRS and Form N-CSR, respectively. Morgan Stanley also delivers the semiannual and annual reports to fund shareholders and makes these reports available on its public web site, www.morganstanley.com/im/shareholderreports. Each Morgan Stanley fund also files a complete schedule of portfolio holdings with the SEC for the fund's first and third fiscal quarters on Form N-Q. Morgan Stanley does not deliver the reports for the first and third fiscal quarters to shareholders, nor are the reports posted to the Morgan Stanley public web site. You may, however, obtain the Form N-Q filings (as well as the Form N-CSR and N-CSRS filings) by accessing the SEC's web site, http://www.sec.gov. You can also request copies of these materials, upon payment of a duplicating fee, by electronic request at the SEC's e-mail address (publicinfo@sec.gov).
Householding Notice
To reduce printing and mailing costs, the Fund attempts to eliminate duplicate mailings to the same address. The Fund delivers a single copy of certain shareholder documents, including shareholder reports, prospectuses and proxy materials, to investors with the same last name who reside at the same address. Your participation in this program will continue for an unlimited period of time unless you instruct us otherwise. You can request multiple copies of these documents by calling (800) 548-7786, 8:00 a.m. to 6:00 p.m., ET. Once our Customer Service Center has received your instructions, we will begin sending individual copies for each account within 30 days.
6
(This page has been left blank intentionally.)
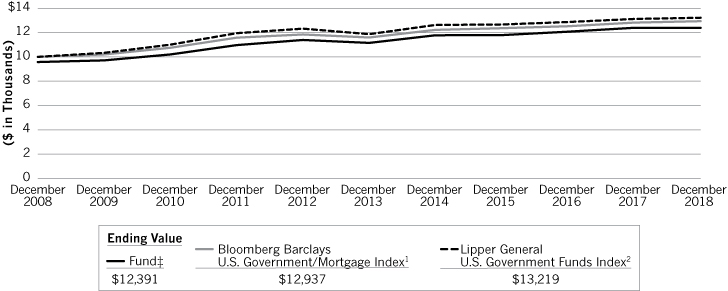
Performance Summary (unaudited)
Performance of $10,000 Investment—Class A
Over 10 Years
8
Performance Summary (unaudited) continued
Average Annual Total Returns—Period Ended December 31, 2018 | |
Symbol | | Class A Shares*
(since 07/28/97)
USGAX | | Class B Shares**
(since 06/29/84)
USGBX | | Class L Shares†
(since 07/28/97)
USGCX | | Class I Shares††
(since 07/28/97)
USGDX | | Class C Shares†††
(since 04/30/15)
MSGVX | |
1 Year
| | | –0.01
–4.214 | %3 | | | 0.02
–4.834 | %3 | | | –0.25
— | %3 | | | 0.34
— | %3 | | | –0.76
–1.734 | %3 | |
5 Years
| | | 2.133
1.254 | | | | 2.173
1.814 | | | | 1.863
— | | | | 2.463
— | | | | —
— | | |
10 Years
| | | 2.613
2.174 | | | | 2.643
2.644 | | | | 2.233
— | | | | 2.903
— | | | | —
— | | |
Since Inception
| | | 3.703
3.494 | | | | 5.383
5.384 | | | | 3.273
— | | | | 3.963
— | | | | 0.443
0.444 | | |
Performance data quoted represents past performance, which is no guarantee of future results and current performance may be lower or higher than the figures shown. For most recent month-end performance figures, please visit www.morganstanley.com/im/shareholderreports or speak with your Financial Advisor. Investment returns and principal value will fluctuate and fund shares, when redeemed, may be worth more or less than their original cost. The graph and table do not reflect the deduction of taxes that a shareholder would pay on fund distributions or the redemption of fund shares. Performance for Class A, Class B, Class L, Class I and Class C shares will vary due to differences in sales charges and expenses. See the Fund's current prospectus for complete details on fees and sale charges.
* The maximum front-end sales charge for Class A is 4.25%.
** The maximum contingent deferred sales charge (CDSC) for Class B is 5.0%. The CDSC declines to 0% after six years. For periods greater than eight years, returns do not reflect conversion to Class A shares eight years after the end of the calendar month in which shares were purchased. The conversion feature is currently suspended because the total annual operating expense ratio of Class B is currently lower than that of Class A. See "Conversion Feature" for Class B shares in "Share Class Arrangements" of the Prospectus for more information. Class B shares are closed to new investments.
† Class L has no sales charge. Class L shares are closed for new investments.
†† Class I has no sales charge.
††† The maximum contingent deferred sales charge for Class C is 1.0% for shares redeemed within one year of purchase.
(1) The Bloomberg Barclays U.S. Government/Mortgage Index includes Treasuries, government-related issues, and agency mortgage-backed pass-through securities issued by Ginnie Mae (GNMA), Fannie Mae (FNMA), and Freddie Mac (FHLMC). The Index is unmanaged and its returns do not include any sales charges or fees. Such costs would lower performance. It is not possible to invest directly in an index.
(2) The Lipper General U.S. Government Funds Index is an equally weighted performance index of the largest qualifying funds (based on net assets) in the Lipper General U.S. Government Funds classification. The Index, which is adjusted for capital gains distributions and income dividends, is unmanaged and should not be considered an investment. There are currently 10 funds represented in this Index. The Fund was in the Lipper General U.S. Government Funds classification as of the date of this report.
(3) Figure shown assumes reinvestment of all distributions and does not reflect the deduction of any sales charges.
(4) Figure shown assumes reinvestment of all distributions and the deduction of the maximum applicable sales charge. See the Fund's current prospectus for complete details on fees and sales charges.
† Ending value assuming a complete redemption on December 31, 2018.
9
Expense Example (unaudited)
As a shareholder of the Fund, you incur two types of costs: (1) transaction costs, including sales charges (loads) on purchase payments; and (2) ongoing costs, which may include advisory fees, administration fees, distribution and shareholder services (12b-1) fees, and other Fund expenses. This example is intended to help you understand your ongoing costs (in dollars) of investing in the Fund and to compare these costs with the ongoing costs of investing in other mutual funds.
This example is based on an investment of $1,000 invested at the beginning of the period and held for the entire period 07/01/18 – 12/31/18.
Actual Expenses
The first line of the table on the following page provides information about actual account values and actual expenses. You may use the information in this line, together with the amount you invested, to estimate the expenses that you paid over the period. Simply divide your account value by $1,000 (for example, an $8,600 account value divided by $1,000 = 8.6), then multiply the result by the number in the first line under the heading entitled "Expenses Paid During Period" to estimate the expenses you paid on your account during this period.
Hypothetical Example for Comparison Purposes
The second line of the table on the following page provides information about hypothetical expenses based on the Fund's actual expense ratio and an assumed rate of return of 5% per year before expenses, which is not the Fund's actual return. The hypothetical account values and expenses may not be used to estimate the actual ending account balance or expenses you paid for the period. You may use this information to compare the ongoing cost of investing in the Fund and other funds. To do so, compare this 5% hypothetical example with the 5% hypothetical examples that appear in the shareholder reports of the other funds.
Please note that the expenses shown in the table are meant to highlight your ongoing costs only and do not reflect any transactional costs, such as sales charges (loads). Therefore, the second line of the table is useful in comparing ongoing costs, and will not help you determine the relative total cost of owning different funds. In addition, if these transactional costs were included, your costs would have been higher.
10
Expense Example (unaudited) continued
| | | Beginning
Account Value | | Ending
Account Value | | Expenses Paid
During Period(1) | |
| | | 07/01/18 | | 12/31/18 | | 07/01/18 –
12/31/18 | |
Class A | |
Actual (1.08% return) | | $ | 1,000.00 | | | $ | 1,010.80 | | | $ | 4.41 | | |
Hypothetical (5% annual return before expenses) | | $ | 1,000.00 | | | $ | 1,020.82 | | | $ | 4.43 | | |
Class B | |
Actual (1.10% return) | | $ | 1,000.00 | | | $ | 1,011.00 | | | $ | 4.16 | | |
Hypothetical (5% annual return before expenses) | | $ | 1,000.00 | | | $ | 1,021.07 | | | $ | 4.18 | | |
Class L | |
Actual (0.95% return) | | $ | 1,000.00 | | | $ | 1,009.50 | | | $ | 5.52 | | |
Hypothetical (5% annual return before expenses) | | $ | 1,000.00 | | | $ | 1,019.71 | | | $ | 5.55 | | |
Class I | |
Actual (1.26% return) | | $ | 1,000.00 | | | $ | 1,012.60 | | | $ | 2.64 | | |
Hypothetical (5% annual return before expenses) | | $ | 1,000.00 | | | $ | 1,022.58 | | | $ | 2.65 | | |
Class C | |
Actual (0.69% return) | | $ | 1,000.00 | | | $ | 1,006.90 | | | $ | 8.14 | | |
Hypothetical (5% annual return before expenses) | | $ | 1,000.00 | | | $ | 1,017.09 | | | $ | 8.19 | | |
(1) Expenses are equal to the Fund's annualized expense ratios of 0.87%, 0.82%, 1.09%, 0.52% and 1.61% for Class A, Class B, Class L, Class I and Class C shares, respectively, multiplied by the average account value over the period and multiplied by 184/365 (to reflect the one-half year period). If the Fund had borne all of its expenses, the annualized expense ratios would have been 1.01%, 0.93%, 1.17%, 0.72% and 2.05% for Class A, Class B, Class L, Class I and Class C shares, respectively.
The Fund's Distributor has agreed to reduce the 12b-1 fee on Class B shares of the Fund to the extent it exceeds 0.24% of the average daily net assets of such shares on an annualized basis. This waiver will continue for at least one year from the date of the Fund's prospectus or until such time that the Fund's Board of Trustees acts to discontinue all or a portion of such waiver when it deems that such action is appropriate.
Because Class B shares incurred lower expenses under the 12b-1 fee Plan than did Class A shares for the year ended December 31, 2018, the total operating expense ratio for Class B shares was lower and, as a result, the performance of Class B shares was higher than that of the Class A shares. There can be no assurance that this will continue to occur in the future as the maximum fees payable by Class B shares under the 12b-1 Plan are higher than those payable by Class A shares.
11
Morgan Stanley U.S. Government Securities Trust
Portfolio of Investments n December 31, 2018
PRINCIPAL
AMOUNT
(000) | |
| | COUPON
RATE | | MATURITY
DATE | | VALUE | |
| | | Agency Adjustable Rate Mortgages (0.8%) | | | |
| | | Federal Home Loan Mortgage Corporation,
Conventional Pools: | | | |
$ | 1,743 | | | 12 Month USD LIBOR + 1.815% | | | 4.351 | % | | 06/01/43 | | $ | 1,812,443 | | |
| | 251 | | | 12 Month USD LIBOR + 1.727% | | | 4.517 | | | 11/01/36 | | | 262,803 | | |
| | 455 | | | 12 Month USD LIBOR + 1.905% | | | 4.736 | | | 10/01/36 | | | 479,872 | | |
| | 700 | | | Federal National Mortgage Association,
Conventional Pool:,
12 Month USD LIBOR + 1.57% | | | 2.16 | | | 05/01/44 | | | 722,033 | | |
| | | | | Total Agency Adjustable Rate Mortgages (Cost $3,294,091) | �� | | | | | | 3,277,151 | | |
| | | Agency Bonds - Consumer Discretionary (U.S. Government Guaranteed) (1.3%) | | | |
| | 2,864 | | | Amal Ltd. (Cayman Islands) | | | 3.465 | | | 08/21/21 | | | 2,892,308 | | |
| | 2,146 | | | Safina Ltd. (Cayman Islands) | | | 2.00 | | | 12/30/23 | | | 2,105,709 | | |
| | | | | Total Agency Bonds - Consumer Discretionary (U.S. Government Guaranteed)
(Cost $5,009,586) | | | | | | | 4,998,017 | | |
| | | Agency Bond - Finance (U.S. Government Guaranteed) (0.4%) | | | |
| | 1,481 | | | Washington Aircraft 1 Co., DAC
(Cost $1,480,518) | | | 2.637 | | | 09/15/26 | | | 1,472,874 | | |
| | | Agency Bonds - Sovereign (U.S. Government Guaranteed) (4.9%) | | | |
| | 14,175 | | | Israel Government AID Bond (Isreal) | | | 5.50 | | | 09/18/23 | | | 15,946,770 | | |
| | 3,203 | | | Petroleos Mexicanos (Mexico) | | | 2.46 | | | 12/15/25 | | | 3,171,028 | | |
| | | | | Total Agency Bonds - Sovereign (U.S. Government Guaranteed)
(Cost $18,779,408) | | | | | | | 19,117,798 | | |
| | | Agency Fixed Rate Mortgages (38.7%) | | | |
| | | Federal Home Loan Mortgage Corporation,
Gold Pools: | | | |
| | 4,464 | | | | | | | | 3.00 | | | 03/01/47 | | | 4,356,765 | | |
| | 9,633 | | | | | | | | 3.50 | | | 08/01/42 - 06/01/45 | | | 9,678,326 | | |
| | 5,536 | | | | | | | | 4.00 | | | 12/01/41 - 10/01/45 | | | 5,668,399 | | |
| | 874 | | | | | | | | 5.00 | | | 01/01/40 | | | 929,140 | | |
| | 1,047 | | | | | | | | 5.50 | | | 11/01/39 | | | 1,117,787 | | |
| | 166 | | | | | | | | 6.50 | | | 03/01/29 - 09/01/32 | | | 179,110 | | |
| | 277 | | | | | | | | 7.50 | | | 05/01/35 | | | 319,607 | | |
| | 177 | | | | | | | | 8.00 | | | 08/01/32 | | | 206,274 | | |
| | 180 | | | | | | | | 8.50 | | | 08/01/31 | | | 212,465 | | |
See Notes to Financial Statements
12
Morgan Stanley U.S. Government Securities Trust
Portfolio of Investments n December 31, 2018 continued
PRINCIPAL
AMOUNT
(000) | |
| | COUPON
RATE | | MATURITY
DATE | | VALUE | |
| | | | | January TBA: | | | | | | | | | | | |
$ | 2,320 | | | (a) | | | 4.00 | % | | 01/01/49 | | $ | 2,365,267 | | |
| | | Federal National Mortgage Association,
Conventional Pools: | | | |
| | 13,814 | | | | | | | | 3.00 | | | 05/01/30 - 06/01/47 | | | 13,528,734 | | |
| | 20,530 | | | | | | | | 3.50 | | | 12/01/42 - 01/01/48 | | | 20,625,781 | | |
| | 28,335 | | | | | | | | 4.00 | | | 11/01/41 - 09/01/48 | | | 29,022,036 | | |
| | 11,998 | | | | | | | | 4.50 | | | 01/01/25 - 09/01/48 | | | 12,518,518 | | |
| | 3,257 | | | | | | | | 5.00 | | | 05/01/35 - 02/01/41 | | | 3,464,482 | | |
| | 859 | | | | | | | | 5.118 | | | 03/01/38 | | | 910,125 | | |
| | 2,794 | | | | | | | | 5.50 | | | 03/01/35 - 10/01/35 | | | 3,006,257 | | |
| | 49 | | | | | | | | 6.50 | | | 06/01/29 - 02/01/33 | | | 53,115 | | |
| | 1 | | | | | | | | 7.00 | | | 05/01/31 | | | 1,027 | | |
| | 443 | | | | | | | | 7.50 | | | 08/01/37 | | | 516,730 | | |
| | 346 | | | | | | | | 8.00 | | | 04/01/33 | | | 405,419 | | |
| | 359 | | | | | | | | 8.50 | | | 10/01/32 | | | 430,760 | | |
| | | | | January TBA: | | | | | | | | | | | |
| | 4,870 | | | (a) | | | 3.00 | | | 01/01/34 | | | 4,858,301 | | |
| | 17,050 | | | (a) | | | 3.50 | | | 01/01/49 | | | 17,048,335 | | |
| | 1,170 | | | (a) | | | 4.50 | | | 01/01/49 | | | 1,211,704 | | |
| | | Government National Mortgage Association,
January TBA: | | | |
| | 2,380 | | | (a) | | | 3.50 | | | 01/20/49 | | | 2,394,875 | | |
| | | | | Various Pools: | | | | | | | | | | | |
| | 6,825 | | | | | | | | 3.50 | | | 08/20/45 - 07/20/46 | | | 6,876,110 | | |
| | 3,897 | | | | | | | | 4.00 | | | 11/20/42 - 07/15/44 | | | 4,023,854 | | |
| | 601 | | | | | | | | 5.00 | | | 01/20/40 | | | 632,500 | | |
| | 77 | | | | | | | | 5.125 | | | 11/20/37 | | | 79,957 | | |
| | 652 | | | | | | | | 5.25 | | | 04/20/36 - 09/20/39 | | | 692,280 | | |
| | 1,049 | | | | | | | | 5.375 | | | 02/20/36 - 08/20/40 | | | 1,109,393 | | |
| | 1,649 | | | | | | | | 6.00 | | | 02/15/28 - 09/20/34 | | | 1,782,367 | | |
| | 2 | | | | | | | | 6.50 | | | 04/15/19 | | | 2,106 | | |
| | 109 | | | | | | | | 7.00 | | | 03/20/26 - 07/20/29 | | | 123,737 | | |
| | 654 | | | | | | | | 8.00 | | | 11/15/19 - 08/15/31 | | | 673,757 | | |
| | 692 | | | | | | | | 8.50 | | | 07/15/30 | | | 754,361 | | |
| | 103 | | | | | | | | 9.00 | | | 09/15/19 - 02/15/25 | | | 106,472 | | |
| | 56 | | | | | | | | 9.50 | | | 02/15/19 - 12/15/20 | | | 63,011 | | |
| | 38 | | | | | | | | 10.00 | | | 08/15/18 - 11/15/20 | | | 39,009 | | |
| | | | | Total Agency Fixed Rate Mortgages (Cost $153,408,380) | | | | | | | 151,988,253 | | |
See Notes to Financial Statements
13
Morgan Stanley U.S. Government Securities Trust
Portfolio of Investments n December 31, 2018 continued
PRINCIPAL
AMOUNT
(000) | |
| | COUPON
RATE | | MATURITY
DATE | | VALUE | |
| | | Asset-Backed Securities (5.4%) | | | |
$ | 2,691 | | | American Homes 4 Rent Trust (b) | | | 3.732 | % | | 10/17/45 | | $ | 2,744,428 | | |
| | 6,665 | | | Ford Credit Auto Owner Trust (b) | | | 2.26 | | | 11/15/25 | | | 6,645,004 | | |
| | 1,494 | | | Invitation Homes Trust (b) | | | 3.455 | (c) | | 07/17/37 | | | 1,488,461 | | |
| | 1,300 | | | New Residential Mortgage Loan Trust (b) | | | 4.00 | (c) | | 08/27/57 | | | 1,309,619 | | |
| | 781 | | | North Carolina State Education Assistance
Authority,
3 Month USD LIBOR + 0.80% | | | 3.29 | (c) | | 07/25/25 | | | 784,682 | | |
| | 92 | | | Panhandle-Plains Higher Education
Authority, Inc.,
3 Month USD LIBOR + 0.95% | | | 3.747 | (c) | | 07/01/24 | | | 91,835 | | |
| | 1,918 | | | SBA Small Business Investment Cos. | | | 2.245 | | | 09/10/22 | | | 1,895,864 | | |
| | | | | United States Small Business Administration | | | | | | | | | | | |
| | 1,886 | | | | | | | | 2.42 | | | 06/01/32 | | | 1,858,209 | | |
| | 4,311 | | | | | | | | 2.67 | | | 04/01/32 | | | 4,329,508 | | |
| | | | | Total Asset-Backed Securities (Cost $21,158,551) | | | | | | | 21,147,610 | | |
| | | Collateralized Mortgage Obligations - Agency Collateral Series (12.3%) | | | |
| | | | | Federal Home Loan Mortgage Corporation | | | | | | | | | | | |
| | 3,265 | | | | | | | | 2.355 | | | 07/25/22 | | | 3,211,486 | | |
| | 10,125 | | | | | | | | 2.373 | | | 05/25/22 | | | 9,984,189 | | |
| | 4,700 | | | | | | | | 2.682 | | | 10/25/22 | | | 4,669,312 | | |
| | 5,595 | | | | | | | | 2.789 | | | 01/25/22 | | | 5,586,183 | | |
| | 4,000 | | | | | | | | 3.32 | (c) | | 02/25/23 | | | 4,061,683 | | |
| | 3,429 | | | | | | | | 3.527 | (c) | | 10/25/23 | | | 3,512,895 | | |
| | 5,063 | | | | | | | | 3.871 | | | 04/25/21 | | | 5,154,659 | | |
| | 2,760 | | | | | | | | 3.90 | (c) | | 08/25/28 | | | 2,884,586 | | |
| | | IO | | | |
| | 32,878 | | | | | | | | 0.327 | (c) | | 11/25/27 | | | 861,889 | | |
| | 20,470 | | | | | | | | 0.437 | (c) | | 08/25/27 | | | 654,629 | | |
| | | IO REMIC | | | |
| | 4,406 | | | 6.00% - 1 Month LIBOR | | | 3.545 | (c) | | 11/15/43 | | | 563,550 | | |
| | 3,112 | | | 6.05% - 1 Month LIBOR | | | 3.595 | (c) | | 04/15/39 | | | 187,539 | | |
| | | Federal National Mortgage Association | | | |
| | 3,708 | | | | | | | | 2.171 | (c) | | 09/25/19 | | | 3,685,276 | | |
| | 1,196 | | | | | | | | 3.763 | | | 06/25/21 | | | 1,218,045 | | |
| | | IO | | | |
| | 8,603 | | | 6.39% - 1 Month LIBOR | | | 3.884 | (c) | | 09/25/20 | | | 323,499 | | |
See Notes to Financial Statements
14
Morgan Stanley U.S. Government Securities Trust
Portfolio of Investments n December 31, 2018 continued
PRINCIPAL
AMOUNT
(000) | |
| | COUPON
RATE | | MATURITY
DATE | | VALUE | |
| | | IO REMIC | | | |
$ | 11,008 | | | | | | | | 3.50 | % | | 02/25/39 | | $ | 711,672 | | |
| | 7,121 | | | 6.55% - 1 Month LIBOR | | | 4.044 | (c) | | 08/25/41 | | | 955,972 | | |
| | | Government National Mortgage Association, | | | |
| | | IO | | | |
| | 3,467 | | | 6.10% - 1 Month LIBOR | | | 3.645 | (c) | | 07/16/33 | | | 76,914 | | |
| | 678 | | | | | | | | 5.00 | | | 02/16/41 | | | 161,133 | | |
| | | | | Total Collateralized Mortgage Obligations - Agency Collateral Series
(Cost $47,502,443) | | | | | | | 48,465,111 | | |
| | | Commercial Mortgage-Backed Securities (1.9%) | | | |
| | | | | Citigroup Commercial Mortgage Trust, | | | | | | | | | | | |
| | | IO | | | |
| | 5,743 | | | | | | | | 0.873 | (c) | | 11/10/48 | | | 233,111 | | |
| | 14,524 | | | | | | | | 0.941 | (c) | | 09/10/58 | | | 684,757 | | |
| | 8,678 | | | | | | | | 1.253 | (c) | | 11/10/46 | | | 370,661 | | |
| | 8,123 | | | COMM Mortgage Trust, IO | | | 1.163 | (c) | | 08/10/46 | | | 326,801 | | |
| | 24,330 | | | Commercial Mortgage Pass-Through
Certificates, IO | | | 0.653 | (c) | | 02/10/47 | | | 638,809 | | |
| | 600 | | | DBUBS Mortgage Trust (b) | | | 3.452 | | | 10/10/34 | | | 596,768 | | |
| | | GS Mortgage Securities Trust, | | | |
| | | IO | | | |
| | 9,582 | | | | | | | | 1.045 | (c) | | 11/10/46 | | | 405,713 | | |
| | 16,983 | | | | | | | | 1.065 | (c) | | 04/10/47 | | | 686,056 | | |
| | 15,682 | | | | | | | | 1.339 | (c) | | 10/10/48 | | | 1,035,604 | | |
| | 9,194 | | | JP Morgan Chase Commercial Mortgage
Securities Trust, IO | | | 0.798 | (c) | | 12/15/49 | | | 349,476 | | |
| | | JPMBB Commercial Mortgage Securities Trust, | | | |
| | | IO | | | |
| | 24,271 | | | | | | | | 0.80 | (c) | | 01/15/47 | | | 768,315 | | |
| | 5,625 | | | | | | | | 1.087 | (c) | | 11/15/45 | | | 242,099 | | |
| | | | | WFRBS Commercial Mortgage Trust, | | | | | | | | | | | |
| | | IO | | | |
| | 15,181 | | | | | | | | 0.447 | (c) | | 08/15/46 | | | 258,683 | | |
| | 12,127 | | | | | | | | 0.921 | (c) | | 03/15/46 | | | 362,957 | | |
| | 15,183 | | | | | | | | 1.126 | (c) | | 12/15/46 | | | 691,924 | | |
| | | | | Total Commercial Mortgage-Backed Securities (Cost $6,718,215) | | | | | | | 7,651,734 | | |
See Notes to Financial Statements
15
Morgan Stanley U.S. Government Securities Trust
Portfolio of Investments n December 31, 2018 continued
PRINCIPAL
AMOUNT
(000) | |
| | COUPON
RATE | | MATURITY
DATE | | VALUE | |
| | | Mortgages - Other (11.2%) | | | |
$ | 1,379 | | | Cascade Funding Mortgage Trust (b) | | | 4.00 | (c)% | | 10/25/68 | | $ | 1,386,615 | | |
| | 1,568 | | | CIM Trust (b) | | | 3.00 | (c) | | 04/25/57 | | | 1,559,694 | | |
| | | Federal Home Loan Mortgage Corporation | | | |
| | 4,510 | | | | | | | | 3.00 | | | 09/25/45 - 05/25/47 | | | 4,373,043 | | |
| | 6,045 | | | | | | | | 3.50 | | | 05/25/45 - 05/25/47 | | | 5,990,788 | | |
| | 708 | | | 1 Month USD LIBOR + 1.20% | | | 3.706 | (c) | | 10/25/29 | | | 711,670 | | |
| | 287 | | | | | | | | 4.00 | | | 05/25/45 | | | 287,883 | | |
| | 1,247 | | | 1 Month USD LIBOR + 1.85% | | | 4.356 | (c) | | 10/25/27 | | | 1,262,758 | | |
| | 532 | | | 1 Month USD LIBOR + 2.00% | | | 4.506 | (c) | | 12/25/28 | | | 537,055 | | |
| | 322 | | | 1 Month USD LIBOR + 2.20% | | | 4.706 | (c) | | 10/25/28 | | | 323,871 | | |
| | 976 | | | 1 Month USD LIBOR + 2.75% | | | 5.256 | (c) | | 09/25/28 | | | 990,937 | | |
| | 353 | | | 1 Month USD LIBOR + 2.80% | | | 5.306 | (c) | | 05/25/28 | | | 359,847 | | |
| | 873 | | | 1 Month USD LIBOR + 2.90% | | | 5.406 | (c) | | 07/25/28 | | | 888,711 | | |
| | | Federal National Mortgage Association | | | |
| | 1,266 | | | 1 Month USD LIBOR + 1.30% | | | 3.806 | (c) | | 04/25/29 - 05/25/29 | | | 1,270,476 | | |
| | 1,381 | | | Galton Funding Mortgage Trust (b) | | | 4.00 | (c) | | 11/25/57 | | | 1,392,236 | | |
| | | New Residential Mortgage Loan Trust | | | |
| | 2,855 | | | (b) | | | 3.75 | (c) | | 11/26/35 - 08/25/55 | | | 2,865,181 | | |
| | 1,890 | | | (b) | | | 4.00 | (c) | | 02/25/57 | | | 1,906,654 | | |
| | 686 | | | Paragon Mortgages No 12 PLC,
3 Month USD LIBOR + 0.22%
(United Kingdom) (b) | | | 2.836 | (c) | | 11/15/38 | | | 643,554 | | |
| | | Seasoned Credit Risk Transfer Trust | | | |
| | 7,923 | | | | | | | | 3.00 | | | 07/25/56 - 11/25/57 | | | 7,626,530 | | |
| | 5,677 | | | | | | | | 3.50 | | | 06/25/57 - 11/25/57 | | | 5,622,532 | | |
| | 3,889 | | | | | | | | 4.50 | | | 06/25/57 | | | 3,996,252 | | |
| | | | | Total Mortgages - Other (Cost $44,332,161) | | | | | | | 43,996,287 | | |
| | | Municipal Bonds (11.7%) | | | |
| | 3,615 | | | Bay Area Toll Authority | | | 6.263 | | | 04/01/49 | | | 4,907,399 | | |
| | 3,875 | | | City of New York, NY, Series G-1 | | | 5.968 | | | 03/01/36 | | | 4,762,026 | | |
| | 3,060 | | | City of San Francisco, CA, Public Utilities
Commission Water Revenue | | | 6.00 | | | 11/01/40 | | | 3,770,205 | | |
| | 5,980 | | | Los Angeles Unified School District | | | 5.75 | | | 07/01/34 | | | 7,097,991 | | |
| | 1,450 | | | Metropolitan Transportation Authority | | | 6.668 | | | 11/15/39 | | | 1,885,326 | | |
| | 6,245 | | | Missouri Highway & Transportation
Commission | | | 5.445 | | | 05/01/33 | | | 7,270,979 | | |
| | 1,759 | | | Municipal Electric Authority of Georgia, GA | | | 6.637 | | | 04/01/57 | | | 1,858,515 | | |
See Notes to Financial Statements
16
Morgan Stanley U.S. Government Securities Trust
Portfolio of Investments n December 31, 2018 continued
PRINCIPAL
AMOUNT
(000) | |
| | COUPON
RATE | | MATURITY
DATE | | VALUE | |
$ | 1,360 | | | New Jersey Transportation Trust Fund
Authority | | | 6.561 | % | | 12/15/40 | | $ | 1,659,321 | | |
| | 3,625 | | | New York City Transitional Finance
Authority Future Tax Secured
Revenue, NY, Transitional Finance
Authority Future Tax Secured Revenue | | | 5.267 | | | 05/01/27 | | | 4,052,558 | | |
| | 3,000 | | | New York State Dormitory Authority | | | 5.628 | | | 03/15/39 | | | 3,500,715 | | |
| | 2,575 | | | State of Oregon Department of
Transportation | | | 5.834 | | | 11/15/34 | | | 3,168,571 | | |
| | 1,580 | | | State of Washington | | | 5.481 | | | 08/01/39 | | | 1,881,410 | | |
| | | | | Total Municipal Bonds (Cost $38,975,336) | | | | | | | 45,815,016 | | |
| | | U.S. Agency Securities (8.8%) | | | |
| | 2,175 | | | Federal Home Loan Bank | | | 3.25 | | | 11/16/28 | | | 2,214,483 | | |
| | | Private Export Funding Corp. | | | |
| | 5,300 | | | | | | | | 1.45 | | | 08/15/19 | | | 5,259,730 | | |
| | 6,960 | | | | | | | | 4.30 | | | 12/15/21 | | | 7,274,738 | | |
| | | Tennessee Valley Authority | | | |
| | 6,935 | | | | | | | | 5.25 | | | 09/15/39 | | | 8,702,822 | | |
| | 8,085 | | | | | | | | 7.125 | | | 05/01/30 | | | 11,149,336 | | |
| | | | | Total U.S. Agency Securities (Cost $31,785,860) | | | | | | | 34,601,109 | | |
| | | U.S. Treasury Securities (2.0%) | | | |
| | 5,425 | | | U.S. Treasury Bond | | | 3.125 | | | 05/15/48 | | | 5,529,580 | | |
| | 2,500 | | | U.S. Treasury Note | | | 2.25 | | | 03/31/20 | | | 2,490,039 | | |
| | | | | Total U.S. Treasury Securities (Cost $7,706,093) | | | | | | | 8,019,619 | | |
| | | Short-Term Investments (7.2%) | | | |
| | | U.S. Treasury Securities (6.5%) | | | |
| | 2,370 | | | U.S. Treasury Bill (d)(e) | | | 2.38 | | | 03/21/19 | | | 2,358,003 | | |
| | 6,000 | | | U.S. Treasury Note | | | 1.00 | | | 06/30/19 | | | 5,955,351 | | |
| | 17,250 | | | U.S. Treasury Notes | | | 1.375 | | | 02/28/19 | | | 17,227,354 | | |
| | | | | | | | | | | | 25,540,708 | | |
See Notes to Financial Statements
17
Morgan Stanley U.S. Government Securities Trust
Portfolio of Investments n December 31, 2018 continued
NUMBER OF
SHARES (000) | |
| | | | | | VALUE | |
| | | Investment Company (0.7%) | |
| | 2,744 | | | Morgan Stanley Institutional Liquidity Funds - Government Portfolio - Institutional Class
(See Note 9) (Cost $2,744,155) | | | | | | | | | | $ | 2,744,155 | | |
| | | Total Short-Term Investments (Cost $28,282,474) | | | | | | | | | | | 28,284,863 | | |
| | | Total Investments (Cost $408,433,116) (f)(g) | | | | | 106.6 | % | | | 418,835,442 | | |
| | | Liabilities in Excess of Other Assets | | | | | (6.6 | ) | | | (25,822,024 | ) | |
| | | Net Assets | | | | | 100.0 | % | | $ | 393,013,418 | | |
AID Agency for International Development.
IO Interest Only.
LIBOR London Interbank Offered Rate.
REMIC Real Estate Mortgage Investment Conduit.
TBA To Be Announced.
(a) Security is subject to delayed delivery.
(b) 144A security - Certain conditions for public sale may exist. Unless otherwise noted, these securities are deemed to be liquid.
(c) Floating or Variable rate securities: The rates disclosed are as of December 31, 2018. For securities based on a published reference rate and spread, the reference rate and spread are indicated in the description in the Portfolio of Investments. Certain variable rate securities may not be based on a published reference rate and spread but are determined by the issuer or agent and are based on current market conditions. These securities do not indicate a reference rate and spread in their description in the Portfolio of Investments.
(d) Rate shown is the yield to maturity at December 31, 2018.
(e) All or a portion of the security was pledged to cover margin requirements for futures contracts and swap agreements.
(f) Securities are available for collateral in connection with securities purchased on a forward commitment basis, open futures contracts and swap agreements.
(g) At December 31, 2018, the aggregate cost for federal income tax purposes is $410,676,670. The aggregate gross unrealized appreciation is $14,816,860 and the aggregate gross unrealized depreciation is $6,163,056 resulting in net unrealized appreciation of $8,653,804.
See Notes to Financial Statements
18
Morgan Stanley U.S. Government Securities Trust
Portfolio of Investments n December 31, 2018 continued
Futures Contracts:
The Fund had the following futures contracts open at December 31, 2018:
| | | NUMBER OF
CONTRACTS | | EXPIRATION
DATE | | NOTIONAL
AMOUNT
(000) | | VALUE | | UNREALIZED
APPRECIATION
(DEPRECIATION) | |
Long: | |
U.S. Treasury 5 yr. Note | | | 153 | | | Mar-19 | | $ | 15,300 | | | $ | 17,547,187 | | | $ | 238,805 | | |
U.S. Treasury Ultra Bond | | | 34 | | | Mar-19 | | | 3,400 | | | | 5,462,313 | | | | 166,783 | | |
U.S. Treasury 30 yr. Bond | | | 28 | | | Mar-19 | | | 2,800 | | | | 4,088,000 | | | | 131,375 | | |
U.S. Treasury 10 yr. Ultra Long Bond | | | 3 | | | Mar-19 | | | 300 | | | | 390,234 | | | | 1,734 | | |
Short: | |
U.S. Treasury 2 yr. Note | | | 7 | | | Mar-19 | | | (1,400 | ) | | | (1,486,187 | ) | | | (1,203 | ) | |
| | | | | | | | | | | $ | 537,494 | | |
Interest Rate Swap Agreements:
The Fund had the following interest rate swap agreements open at December 31, 2018:
SWAP
COUNTERPARTY | | FLOATING
RATE
INDEX | | PAY/
RECEIVE
FLOATING
RATE | | FIXED
RATE | | PAYMENT
FREQUENCY
PAID/
RECEIVED | | MATURITY
DATE | | NOTIONAL
AMOUNT
(000) | | VALUE | | UPFRONT
PAYMENT
PAID | | UNREALIZED
APPRECIATION
(DEPRECIATION) | |
Morgan Stanley &
Co. LLC* | | 3 Month
LIBOR | | Receive | | | 2.26 | % | | Semi-Annual/
Quarterly | | 12/7/26 | | $ | 7,141 | | | $ | 211,055 | | | $ | — | | | $ | 211,503 | | |
Morgan Stanley &
Co. LLC* | | 3 Month
LIBOR | | Receive | | | 2.48 | | | Semi-Annual/
Quarterly | | 12/21/26 | | | 7,186 | | | | 96,850 | | | | — | | | | 97,345 | | |
Morgan Stanley &
Co. LLC* | | 3 Month
LIBOR | | Receive | | | 3.21 | | | Semi-Annual/
Quarterly | | 12/3/48 | | | 4,925 | | | | (351,749 | ) | | | — | | | | (351,310 | ) | |
| | | | | | | | | | | | | $ | 19,252 | | | $ | (43,844 | ) | | $ | — | | | $ | (42,462 | ) | |
* Cleared swap agreement, the broker is Morgan Stanley & Co. LLC.
LIBOR London Interbank Offered Rate.
Currency Abbreviation:
USD — United States Dollar
See Notes to Financial Statements
19
Morgan Stanley U.S. Government Securities Trust
Financial Statements
Statement of Assets and Liabilities December 31, 2018
Assets: | |
Investments in securities, at value (cost $405,688,961) | | $ | 416,091,287 | | |
Investment in affiliate, at value (cost $2,744,155) | | | 2,744,155 | | |
Total investments in securities, at value (cost $408,433,116) | | | 418,835,442 | | |
Cash | | | 84,452 | | |
| Receivable from Distributor | | | 341,538 | | |
Receivable for: | |
Interest | | | 2,152,224 | | |
Shares of beneficial interest sold | | | 1,038,333 | | |
Variation margin on open futures contracts | | | 72,036 | | |
Dividends from affiliate | | | 1,060 | | |
Prepaid expenses and other assets | | | 56,647 | | |
| Total Assets | | | 422,581,732 | | |
Liabilities: | |
Payable for: | |
Investments purchased | | | 27,607,131 | | |
Shares of beneficial interest redeemed | | | 1,201,891 | | |
Distribution fee | | | 196,441 | | |
| Transfer and sub transfer agent fees | | | 97,395 | | |
Advisory fee | | | 101,604 | | |
| Variation margin on open swap agreements | | | 65,682 | | |
Trustees' fees | | | 61,558 | | |
Dividends to shareholders | | | 55,804 | | |
Administration fee | | | 27,399 | | |
| Accrued expenses and other payables | | | 153,409 | | |
| Total Liabilities | | | 29,568,314 | | |
Net Assets | | $ | 393,013,418 | | |
Composition of Net Assets: | |
Paid-in-capital | | $ | 388,536,487 | | |
Total distributable earnings | | | 4,476,931 | | |
Net Assets | | $ | 393,013,418 | | |
Class A Shares: | |
Net Assets | | $ | 34,504,057 | | |
| Shares Outstanding (unlimited shares authorized, $0.01 par value) | | | 4,102,472 | | |
Net Asset Value Per Share | | $ | 8.41 | | |
Maximum Offering Price Per Share,
(net asset value plus 4.44% of net asset value) | | $ | 8.78 | | |
Class B Shares: | |
Net Assets | | $ | 281,598,785 | | |
| Shares Outstanding (unlimited shares authorized, $0.01 par value) | | | 33,485,848 | | |
Net Asset Value Per Share | | $ | 8.41 | | |
Class L Shares: | |
Net Assets | | $ | 7,411,405 | | |
| Shares Outstanding (unlimited shares authorized, $0.01 par value) | | | 874,390 | | |
Net Asset Value Per Share | | $ | 8.48 | | |
Class I Shares: | |
Net Assets | | $ | 67,486,751 | | |
| Shares Outstanding (unlimited shares authorized, $0.01 par value) | | | 8,021,290 | | |
Net Asset Value Per Share | | $ | 8.41 | | |
Class C Shares: | |
Net Assets | | $ | 2,012,420 | | |
| Shares Outstanding (unlimited shares authorized, $0.01 par value) | | | 237,389 | | |
Net Asset Value Per Share | | $ | 8.48 | | |
See Notes to Financial Statements
20
Morgan Stanley U.S. Government Securities Trust
Financial Statements continued
Statement of Operations For the year ended December 31, 2018
Net Investment Income:
Income | |
Interest | | $ | 15,893,612 | | |
Dividends from affiliate (Note 9) | | | 172,244 | | |
Total Income | | | 16,065,856 | | |
Expenses | |
Advisory fee (Note 4) | | | 1,741,692 | | |
Distribution fee (Class A shares) (Note 5) | | | 87,511 | | |
| Distribution fee (Class B shares) (Note 5) | | | 683,548 | | |
Distribution fee (Class L shares) (Note 5) | | | 41,617 | | |
Distribution fee (Class C shares) (Note 5) | | | 9,023 | | |
Administration fee (Note 4) | | | 331,751 | | |
Transfer agent fees and expenses (Class A shares) (Note 8) | | | 17,288 | | |
| Transfer agent fees and expenses (Class B shares) (Note 8) | | | 160,224 | | |
Transfer agent fees and expenses (Class L shares) (Note 8) | | | 4,382 | | |
Transfer agent fees and expenses (Class I shares) (Note 8) | | | 25,793 | | |
Transfer agent fees and expenses (Class C shares) (Note 8) | | | 2,164 | | |
Sub transfer agent fees and expenses (Class A shares) | | | 37,498 | | |
Sub transfer agent fees and expenses (Class B shares) | | | 128,206 | | |
Sub transfer agent fees and expenses (Class L shares) | | | 3,142 | | |
Sub transfer agent fees and expenses (Class I shares) | | | 44,031 | | |
Sub transfer agent fees and expenses (Class C shares) | | | 966 | | |
Professional fees | | | 159,814 | | |
Registration fees | | | 79,408 | | |
Shareholder reports and notices | | | 64,059 | | |
Custodian fees (Note 7) | | | 34,328 | | |
Trustees' fees and expenses | | | 14,119 | | |
Other | | | 134,738 | | |
Total Expenses | | | 3,805,302 | | |
Less: waiver of Advisory fees (Note 4) | | | (403,480 | ) | |
Less: reimbursement of class specific expenses (Class A shares) (Note 4) | | | (19,781 | ) | |
Less: reimbursement of class specific expenses (Class I shares) (Note 4) | | | (69,654 | ) | |
Less: reimbursement of class specific expenses (Class C shares) (Note 4) | | | (2,188 | ) | |
Less: rebate from Morgan Stanley affiliated cash sweep (Note 9) | | | (16,364 | ) | |
Net Expenses | | | 3,293,835 | | |
Net Investment Income | | | 12,772,021 | | |
Realized and Unrealized Gain (Loss):
Realized Gain (Loss) on: | |
Investments | | | (3,325,569 | ) | |
Futures contracts | | | (1,580,957 | ) | |
| Swap agreements | | | 1,086,479 | | |
| Net Realized Loss | | | (3,820,047 | ) | |
Change in Unrealized Appreciation (Depreciation) on: | |
Investments | | | (9,657,289 | ) | |
Futures contracts | | | 486,763 | | |
| Swap agreements | | | (177,485 | ) | |
| Net Change in Unrealized Appreciation (Depreciation) | | | (9,348,011 | ) | |
Net Loss | | | (13,168,058 | ) | |
Net Decrease | | $ | (396,037 | ) | |
See Notes to Financial Statements
21
Morgan Stanley U.S. Government Securities Trust
Financial Statements continued
Statements of Changes in Net Assets
| | | FOR THE YEAR
ENDED
DECEMBER 31, 2018 | | FOR THE YEAR
ENDED
DECEMBER 31, 2017 | |
Increase (Decrease) in Net Assets:
Operations: | |
Net investment income | | $ | 12,772,021 | | | $ | 13,785,578 | | |
| Net realized loss | | | (3,820,047 | ) | | | (5,610 | ) | |
| Net change in unrealized appreciation (depreciation) | | | (9,348,011 | ) | | | (723,877 | ) | |
Net Increase (Decrease) | | | (396,037 | ) | | | 13,056,091 | | |
Dividends to Shareholders from Net Investment Income: | |
Class A shares | | | (1,064,170 | ) | | | (1,124,884 | )* | |
Class B shares | | | (9,227,061 | ) | | | (9,911,823 | )* | |
Class L shares | | | (230,694 | ) | | | (270,434 | )* | |
Class I shares | | | (2,353,741 | ) | | | (2,421,556 | )* | |
Class C shares | | | (20,512 | ) | | | (16,434 | )* | |
Total Dividends and Distributions to Shareholders | | | (12,896,178 | ) | | | (13,745,131 | ) | |
Net decrease from transactions in shares of beneficial interest | | | (45,455,153 | ) | | | (60,054,410 | ) | |
Net Decrease | | | (58,747,368 | ) | | | (60,743,450 | ) | |
Net Assets: | |
Beginning of period | | | 451,760,786 | | | | 512,504,236 | | |
End of Period | | $ | 393,013,418 | | | $ | 451,760,786 | † | |
The following information was previously reported in the December 31, 2017 financial statements. The distribution information for the year ended December 31, 2017 presented on the Statements of Changes in Net Assets is presented for comparative purposes to the December 31, 2018 financial statements, which conform to the SEC Final Rule on Disclosure Update and Simplification which was effective November 5, 2018.
* Dividends and Distributions to Shareholders for the year ended December 31, 2017 were as follows:
Class A: | |
Net Investment Income | | $ | (1,124,884 | ) | |
Class B: | |
Net Investment Income | | $ | (9,911,823 | ) | |
Class L: | |
Net Investment Income | | $ | (270,434 | ) | |
Class I: | |
Net Investment Income | | $ | (2,421,556 | ) | |
Class C: | |
Net Investment Income | | $ | (16,434 | ) | |
† Accumulated Undistributed Net Investment Income for the year ended December 31, 2017 was 1,513,326.
See Notes to Financial Statements
22
Morgan Stanley U.S. Government Securities Trust
Notes to Financial Statements n December 31, 2018
1. Organization and Accounting Policies
Morgan Stanley U.S. Government Securities Trust (the "Fund") is registered under the Investment Company Act of 1940, as amended (the "Act"), as a diversified, open-end management investment company. The Fund applies investment company accounting and reporting guidance. The Fund's investment objective is to seek a high level of current income consistent with safety of principal. The Fund was organized as a Massachusetts business trust on September 29, 1983 and commenced operations on June 29, 1984. On July 28, 1997, the Fund converted to a multiple class share structure.
The Fund offers Class A shares, Class B shares, Class L shares, Class I shares and Class C shares. The five classes are substantially the same except that most Class A shares are subject to a sales charge imposed at the time of purchase and some Class A shares, most Class B shares and most Class C shares are subject to a contingent deferred sales charge imposed on shares redeemed within eighteen months, six years and one year, respectively. Class L shares and Class I shares are not subject to a sales charge. Additionally, Class A shares, Class B shares, Class L shares and Class C shares incur distribution expenses.
The Fund suspended offering Class B and Class L shares to all investors (February 25, 2013 and April 30, 2015, respectively). Class B and Class L shareholders of the Fund do not have the option of purchasing additional Class B or Class L shares. However, the existing Class B and Class L shareholders may invest through reinvestment of dividends and distributions.
The following is a summary of significant accounting policies:
In August 2018, the Financial Accounting Standards Board ("FASB") issued Accounting Standards Update ("ASU") 2018-13, Fair Value Measurement (Topic 820) — Disclosures Framework — Changes to Disclosure Requirements of Fair Value Measurement ("ASU 2018-13") which introduces new fair value disclosure requirements as well as eliminates and modifies certain existing fair value disclosure requirements. ASU 2018-13 would be effective for fiscal years beginning after December 15, 2019 and for interim periods within those fiscal years; however, management has elected to early adopt ASU 2018-13 effective with the current reporting period as permitted by the standard. The impact of the Fund's adoption was limited to changes in the Fund's financial statement disclosures regarding fair value, primarily those disclosures related to transfers between levels of the fair value hierarchy and disclosure of the range and weighted average used to develop significant unobservable inputs for Level 3 fair value measurements, when applicable.
A. Valuation of Investments — (1) Certain portfolio securities may be valued by an outside pricing service/vendor approved by the Fund's Board of Trustees (the "Trustees"). The pricing service/vendor
23
Morgan Stanley U.S. Government Securities Trust
Notes to Financial Statements n December 31, 2018 continued
may employ a pricing model that takes into account, among other things, bids, yield spreads and/or other market data and specific security characteristics. Alternatively, if a valuation is not available from an outside pricing service/vendor, and the security trades on an exchange, the security may be valued at its latest reported sale price (or at the exchange official closing price if such exchange reports an official closing price), prior to the time when assets are valued. If there are no sales on a given day and if there is no official exchange closing price for that day, the security is valued at the mean between the last reported bid and asked prices if such bid and asked prices are available in the relevant exchanges; (2) portfolio securities for which over-the-counter ("OTC") market quotations are readily available are valued at its latest reported sales price (or at the market official closing price if such market reports an official closing price), and if there was no trading in the security on a given day and if there is no official closing price from relevant markets for that day, the security is valued at the mean between the last reported bid and asked prices if such bid and asked prices are available on the relevant markets; (3) when market quotations are not readily available, including circumstances under which Morgan Stanley Investment Management Inc. (the "Adviser"), a wholly-owned subsidiary of Morgan Stanley, determines that the market quotations are not reflective of a security's market value, portfolio securities are valued at their fair value as determined in good faith under procedures established by and under the general supervision of the Trustees; (4) futures are valued at the settlement price on the exchange on which they trade or, if a settlement price is unavailable, at the last sale price on the exchange; (5) listed swaps are valued at the last reported sales price on the exchange on which they are listed (or at the exchange official closing price if such exchange reports an official closing price). If an official closing price or last reported sale price is unavailable, the listed swaps should be fair valued at the mean between its latest bid and ask prices. Unlisted swaps are valued at the mean between their latest bid and ask prices from a broker/dealer or valued by a pricing service/vendor; and (6) investments in mutual funds, including the Morgan Stanley Institutional Liquidity Funds, are valued at the net asset value ("NAV") as of the close of each business day.
The Trustees have responsibility for determining in good faith the fair value of the investments, and the Trustees may appoint others, such as the Fund's Adviser or a valuation committee, to assist the Trustees in determining fair value and to make the actual calculations pursuant to the fair valuation methodologies previously approved by the Trustees. Under procedures approved by the Trustees, the Fund's Adviser has formed a Valuation Committee whose members are approved by the Trustees. The Valuation Committee provides administration and oversight of the Fund's valuation policies and procedures, which are reviewed at least annually by the Trustees. These procedures allow the Fund to utilize independent pricing services, quotations from securities and financial instrument dealers and other market sources to determine fair value.
24
Morgan Stanley U.S. Government Securities Trust
Notes to Financial Statements n December 31, 2018 continued
B. Accounting for Investments — Security transactions are accounted for on the trade date (date the order to buy or sell is executed). Realized gains and losses on security transactions are determined by the identified cost method. Dividend income and other distributions are recorded on the ex-dividend date. Discounts are accreted and premiums are amortized over the life of the respective securities and are included in interest income. Interest income is accrued daily as earned.
C. Multiple Class Allocations — Investment income, realized and unrealized gain (loss) and non-class specific expenses are allocated daily based upon the proportion of net assets of each class. Class specific expenses are borne by the respective share classes and include Distribution, Transfer Agent and Sub Transfer Agent fees.
D. Dividends and Distributions to Shareholders — Dividends and distributions to shareholders are recorded on the ex-dividend date. Dividends from net investment income, if any, are declared daily and paid monthly. Net realized capital gains, if any, are distributed at least annually.
E. When-Issued/Delayed Delivery Securities — The Fund may purchase or sell when-issued and delayed delivery securities. Securities purchased on a when-issued or delayed delivery basis are purchased for delivery beyond the normal settlement date at a stated price, and no income accrues to the Fund on such securities prior to delivery date. Payment and delivery for when-issued and delayed delivery securities can take place a month or more after the date of the transaction. When the Fund enters into a purchase transaction on a when-issued or delayed delivery basis, securities are available for collateral in an amount at least equal in value to the Fund's commitments to purchase such securities. Purchasing securities on a when-issued or delayed delivery basis may involve a risk that the market price at the time of delivery may be lower than the agreed upon purchase price, in which case there could be an unrealized loss at the time of delivery. Purchasing investments on a when-issued or delayed delivery basis may be considered a form of leverage which may increase the impact that gains (losses) may have on the Fund.
F. Use of Estimates — The preparation of financial statements in accordance with generally accepted accounting principles in the United States ("GAAP") requires management to make estimates and assumptions that affect the reported amounts and disclosures. Actual results could differ from those estimates.
G. Indemnifications — The Fund enters into contracts that contain a variety of indemnifications. The Fund's maximum exposure under these arrangements is unknown. However, the Fund has not had prior claims or losses pursuant to these contracts and expects the risk of loss to be remote.
25
Morgan Stanley U.S. Government Securities Trust
Notes to Financial Statements n December 31, 2018 continued
2. Fair Valuation Measurements
FASB Accounting Standards CodificationTM ("ASC") 820, "Fair Value Measurement" ("ASC 820"), defines fair value as the value that the Fund would receive to sell an investment or pay to transfer a liability in a timely transaction with an independent buyer in the principal market, or in the absence of a principal market, the most advantageous market for the investment or liability. ASC 820 establishes a three-tier hierarchy to distinguish between (1) inputs that reflect the assumptions market participants would use in valuing an asset or liability developed based on market data obtained from sources independent of the reporting entity (observable inputs); and (2) inputs that reflect the reporting entity's own assumptions about the assumptions market participants would use in valuing an asset or liability developed based on the best information available in the circumstances (unobservable inputs) and to establish classification of fair value measurements for disclosure purposes. Various inputs are used in determining the value of the Fund's investments. The inputs are summarized in the three broad levels listed below:
• Level 1 — unadjusted quoted prices in active markets for identical investments
• Level 2 — other significant observable inputs (including quoted prices for similar investments, interest rates, prepayment speeds, credit risk, etc.)
• Level 3 — significant unobservable inputs including the Fund's own assumptions in determining the fair value of investments. Factors considered in making this determination may include, but are not limited to, information obtained by contacting the issuer, analysts, or the appropriate stock exchange (for exchange-traded securities), analysis of the issuer's financial statements or other available documents and, if necessary, available information concerning other securities in similar circumstances
The inputs or methodology used for valuing securities are not necessarily an indication of the risk associated with investing in those securities and the determination of the significance of a particular input to the fair value measurement in its entirety requires judgment and considers factors specific to each security.
26
Morgan Stanley U.S. Government Securities Trust
Notes to Financial Statements n December 31, 2018 continued
The following is a summary of the inputs used to value the Fund's investments as of December 31, 2018:
INVESTMENT TYPE | | LEVEL 1
UNADJUSTED
QUOTED
PRICES | | LEVEL 2
OTHER
SIGNIFICANT
OBSERVABLE
INPUTS | | LEVEL 3
SIGNIFICANT
UNOBSERVABLE
INPUTS | | TOTAL | |
Assets: | |
Fixed Income Securities | |
Agency Adjustable Rate Mortgages | | $ | — | | | $ | 3,277,151 | | | $ | — | | | $ | 3,277,151 | | |
Agency Bonds — Consumer Discretionary
(U.S. Government Guaranteed) | | | — | | | | 4,998,017 | | | | — | | | | 4,998,017 | | |
Agency Bond — Finance (U.S. Government
Guaranteed) | | | — | | | | 1,472,874 | | | | — | | | | 1,472,874 | | |
Agency Bonds — Sovereign
(U.S. Government Guaranteed) | | | — | | | | 19,117,798 | | | | — | | | | 19,117,798 | | |
Agency Fixed Rate Mortgages | | | — | | | | 151,988,253 | | | | — | | | | 151,988,253 | | |
Asset-Backed Securities | | | — | | | | 21,147,610 | | | | — | | | | 21,147,610 | | |
Collateralized Mortgage Obligations —
Agency Collateral Series | | | — | | | | 48,465,111 | | | | — | | | | 48,465,111 | | |
Commercial Mortgage-Backed Securities | | | — | | | | 7,651,734 | | | | — | | | | 7,651,734 | | |
Mortgages — Other | | | — | | | | 43,996,287 | | | | — | | | | 43,996,287 | | |
Municipal Bonds | | | — | | | | 45,815,016 | | | | — | | | | 45,815,016 | | |
U.S. Agency Securities | | | — | | | | 34,601,109 | | | | — | | | | 34,601,109 | | |
U.S. Treasury Securities | | | — | | | | 8,019,619 | | | | — | | | | 8,019,619 | | |
Total Fixed Income Securities | | | — | | | | 390,550,579 | | | | — | | | | 390,550,579 | | |
Short-Term Investments | |
U.S. Treasury Securities | | | — | | | | 25,540,708 | | | | — | | | | 25,540,708 | | |
Investment Company | | | 2,744,155 | | | | — | | | | — | | | | 2,744,155 | | |
Total Short-Term Investments | | | 2,744,155 | | | | 25,540,708 | | | | — | | | | 28,284,863 | | |
Futures Contracts | | | 538,697 | | | | — | | | | — | | | | 538,697 | | |
Interest Rate Swap Agreements | | | — | | | | 308,848 | | | | — | | | | 308,848 | | |
Total Assets | | | 3,282,852 | | | | 416,400,135 | | | | — | | | | 419,682,987 | | |
Liabilities: | |
Futures Contract | | | (1,203 | ) | | | — | | | | — | | | | (1,203 | ) | |
Interest Rate Swap Agreement | | | — | | | | (351,310 | ) | | | — | | | | (351,310 | ) | |
Total Liabilities | | | (1,203 | ) | | | (351,310 | ) | | | — | | | | (352,513 | ) | |
Total | | $ | 3,281,649 | | | $ | 416,048,825 | | | $ | — | | | $ | 419,330,474 | | |
Transfers between investment levels may occur as the markets fluctuate and/or the availability of data used in an investment's valuation changes.
27
Morgan Stanley U.S. Government Securities Trust
Notes to Financial Statements n December 31, 2018 continued
3. Derivatives
The Fund may, but it is not required to, use derivative instruments for a variety of purposes, including hedging, risk management, portfolio management or to earn income. Derivatives are financial instruments whose value is based, in part, on the value of an underlying asset, interest rate, index or financial instrument. Prevailing interest rates and volatility levels, among other things, also affect the value of derivative instruments. A derivative instrument often has risks similar to its underlying asset and may have additional risks, including imperfect correlation between the value of the derivative and the underlying asset, risks of default by the counterparty to certain transactions, magnification of losses incurred due to changes in the market value of the securities, instruments, indices or interest rates to which the derivative instrument relates, risks that the transactions may not be liquid and risks arising from margin requirements. The use of derivatives involves risks that are different from, and possibly greater than, the risks associated with other portfolio investments. Derivatives may involve the use of highly specialized instruments that require investment techniques and risk analyses different from those associated with other portfolio investments. All of the Fund's holdings, including derivative instruments, are marked-to-market each day with the change in value reflected in unrealized appreciation (depreciation). Upon disposition, a realized gain or loss is recognized.
Certain derivative transactions may give rise to a form of leverage. Leverage magnifies the potential for gain and risk of loss. Leverage associated with derivative transactions may cause the Fund to liquidate portfolio positions when it may not be advantageous to do so to satisfy its obligations or to meet earmarking or segregation requirements, pursuant to applicable Securities and Exchange Commission rules and regulations, or may cause the Fund to be more volatile than if the Fund had not been leveraged. Although the Adviser seeks to use derivatives to further the Fund's investment objectives, there is no assurance that the use of derivatives will achieve this result.
Following is a description of the derivative instruments and techniques that the Fund used during the period and their associated risks:
Futures — A futures contract is a standardized, exchange-traded agreement to buy or sell a specific quantity of an underlying asset, reference rate or index at a specific price at a specific future time. The value of a futures contract tends to increase and decrease in tandem with the value of the underlying instrument. Depending on the terms of the particular contract, futures contracts are settled through either physical delivery of the underlying instrument on the settlement date or by payment of a cash settlement amount on the settlement date. During the period the futures contract is open, payments are received from or made to the broker based upon changes in the value of the contract (the variation margin). A decision as to whether, when and how to use futures contracts involves the exercise of skill and judgment and even a well-conceived futures transaction may be unsuccessful because of market behavior or unexpected events. In addition to the derivatives risks discussed above, the prices of
28
Morgan Stanley U.S. Government Securities Trust
Notes to Financial Statements n December 31, 2018 continued
futures contracts can be highly volatile, using futures contracts can lower total return and the potential loss from futures contracts can exceed the Fund's initial investment in such contracts. No assurance can be given that a liquid market will exist for any particular futures contract at any particular time. There is also the risk of loss by the Fund of margin deposits in the event of bankruptcy of a broker with which the Fund has open positions in the futures contract.
Swaps — The Fund may enter into OTC swap contracts or cleared swap transactions. An OTC swap contract is an agreement between two parties pursuant to which the parties exchange payments at specified dates on the basis of a specified notional amount, with the payments calculated by reference to specified securities, indices, reference rates, currencies or other instruments. Typically swap agreements provide that when the period payment dates for both parties are the same, the payments are made on a net basis (i.e., the two payment streams are netted out, with only the net amount paid by one party to the other). The Fund's obligations or rights under a swap contract entered into on a net basis will generally be equal only to the net amount to be paid or received under the agreement, based on the relative values of the positions held by each party. Cleared swap transactions may help reduce counterparty credit risk. In a cleared swap, the Fund's ultimate counterparty is a clearinghouse rather than a swap dealer, bank or other financial institution. OTC swap agreements are not entered into or traded on exchanges and often there is no central clearing or guaranty function for OTC swaps. These OTC swaps are often subject to credit risk or the risk of default or non-performance by the counterparty. Both OTC and cleared swaps could result in losses if interest rates, foreign currency exchange rates or other factors are not correctly anticipated by the Fund or if the reference index, security or investments do not perform as expected. During the period swap agreements are open, payments are received from or made to the clearinghouse or counterparty based upon changes in the value of the contract (variation margin). The Dodd-Frank Wall Street Reform and Consumer Protection Act and related regulatory developments require the clearing and exchange-trading of certain standardized swap transactions. Mandatory exchange-trading and clearing is occurring on a phased-in basis.
When the Fund has an unrealized loss on a swap agreement, the Fund has instructed the custodian to pledge cash or liquid securities as collateral with a value approximately equal to the amount of the unrealized loss. Collateral pledges are monitored and subsequently adjusted if and when the swap valuations fluctuate. If applicable, cash collateral is included with "Due from (to) broker" in the Statement of Assets and Liabilities.
FASB ASC 815, "Derivatives and Hedging" ("ASC 815"), is intended to improve financial reporting about derivative instruments by requiring enhanced disclosures to enable investors to better understand how and why the Fund uses derivative instruments, how these derivative instruments are accounted for and their effects on the Fund's financial position and results of operations.
29
Morgan Stanley U.S. Government Securities Trust
Notes to Financial Statements n December 31, 2018 continued
The following table sets forth the fair value of the Fund's derivative contracts by primary risk exposure as of December 31, 2018:
PRIMARY RISK EXPOSURE | | ASSET DERIVATIVES
STATEMENT OF ASSETS
AND LIABILITIES LOCATION | | FAIR VALUE | | LIABILITY DERIVATIVES
STATEMENT OF ASSETS
AND LIABILITIES LOCATION | | FAIR VALUE | |
Interest Rate Risk
| | Variation margin on open
futures contracts | | $ | 538,697 | (a) | | Variation margin on open
futures contracts | | $ | (1,203 | )(a) | |
Interest Rate Risk
| | Variation margin on open
swap agreements | | | 308,848 | (a) | | Variation margin on open
swap agreements | | | (351,310 | )(a) | |
| | | | | $ | 847,545 | | | | | $ | (352,513 | ) | |
(a) Includes cumulative appreciation (depreciation) as reported in the Portfolio of Investments. Only current day's net variation margin is reported within the Statement of Assets and Liabilities.
The following tables set forth by primary risk exposure the Fund's realized gains (losses) and change in unrealized appreciation (depreciation) by type of derivative contract for the year ended December 31, 2018 in accordance with ASC 815:
AMOUNT OF REALIZED GAIN (LOSS) ON DERIVATIVES
PRIMARY RISK EXPOSURE | | FUTURES
CONTRACTS | | SWAP
AGREEMENTS | |
Interest Rate Risk | | $ | (1,580,957 | ) | | $ | 1,086,479 | | |
CHANGE IN UNREALIZED APPRECIATION (DEPRECIATION) ON DERIVATIVES
PRIMARY RISK EXPOSURE | | FUTURES
CONTRACTS | | SWAP
AGREEMENTS | |
Interest Rate Risk | | $ | 486,763 | | | $ | (177,485 | ) | |
For the year ended December 31, 2018, the average monthly amount outstanding for each derivative type is as follows:
Futures Contracts: | |
Average monthly notional value | | $ | 51,245,521 | | |
Swap Agreements: | |
Average monthly notional amount | | $ | 20,776,833 | | |
4. Advisory/Administration Agreements
Pursuant to an Investment Advisory Agreement with the Adviser, the Fund pays an advisory fee, accrued daily and paid monthly, by applying the following annual rates to the net assets of the Fund determined as of the close of each business day: 0.42% to the portion of the daily net assets not exceeding $1 billion; 0.395% to the portion of the daily net assets exceeding $1 billion but not exceeding $1.5 billion; 0.37% to
30
Morgan Stanley U.S. Government Securities Trust
Notes to Financial Statements n December 31, 2018 continued
the portion of the daily net assets exceeding $1.5 billion but not exceeding $2 billion; 0.345% to the portion of the daily net assets exceeding $2 billion but not exceeding $2.5 billion; 0.32% to the portion of the daily net assets exceeding $2.5 billion but not exceeding $5 billion; 0.295% to the portion of the daily net assets exceeding $5 billion but not exceeding $7.5 billion; 0.27% to the portion of the daily net assets exceeding $7.5 billion but not exceeding $10 billion; 0.245% to the portion of the daily net assets exceeding $10 billion but not exceeding $12.5 billion; and 0.22% to the portion of the daily net assets exceeding $12.5 billion. For the year ended December 31, 2018, the advisory fee rate (net of waivers/rebate) was equivalent to an annual effective rate of 0.32% of the Fund's average daily net assets.
The Adviser also serves as the Administrator to the Fund and provides administrative services pursuant to an Administration Agreement for an annual fee, accrued daily and paid monthly, of 0.08% of the Fund's average daily net assets.
Under a Sub-Administration Agreement between the Administrator and State Street Bank and Trust Company ("State Street"), State Street provides certain administrative services to the Fund. For such services, the Administrator pays State Street a portion of the fee the Administrator receives from the Fund.
The Adviser/Administrator has agreed to reduce its advisory fee, its administration fee and/or reimburse the Fund so that total annual operating expenses, excluding certain investment related expenses, taxes, interest and other extraordinary expenses (including litigation), will not exceed 0.87% for Class A, 0.86% for Class B, 1.12% for Class L, 0.52% for Class I and 1.62% for Class C shares. The fee waivers and/or expense reimbursements will continue for at least one year from the date of the Fund's prospectus or until such time that the Trustees act to discontinue all or a portion of such waivers and/or expense reimbursements when they deem such action is appropriate. For the year ended December 31, 2018, $403,480 of advisory fees were waived and $91,623 of other expenses were reimbursed by the Adviser pursuant to this arrangement.
5. Plan of Distribution
Shares of the Fund are distributed by Morgan Stanley Distribution, Inc. (the "Distributor"), an affiliate of the Adviser/Administrator. The Fund has adopted a Plan of Distribution (the "Plan") pursuant to Rule 12b-1 under the Act. The Plan provides that the Fund will pay the Distributor a fee which is accrued daily and paid monthly at the following annual rates: (i) Class A — up to 0.25% of the average daily net assets of Class A shares; (ii) Class B — up to 0.75% (0.65% on amounts over $10 billion) of the average daily net assets of Class B shares; (iii) Class L — up to 0.50% of the average daily net assets of Class L shares; and (iv) Class C — up to 1.00% of the average daily net assets of Class C shares.
31
Morgan Stanley U.S. Government Securities Trust
Notes to Financial Statements n December 31, 2018 continued
In the case of Class B shares, provided that the Plan continues in effect, any cumulative expenses incurred by the Distributor but not yet recovered may or may not be recovered through the payment of future distribution fees from the Fund pursuant to the Plan and contingent deferred sales charges paid by investors upon redemption of Class B shares. Although there is no legal obligation for the Fund to pay expenses incurred in excess of payments made to the Distributor under the Plan and the proceeds of contingent deferred sales charges paid by investors upon redemption of shares, if for any reason the Plan is terminated, the Trustees will consider at that time the manner in which to treat such expenses. The Distributor has advised the Fund that there were no excess expenses at December 31, 2018.
The Fund's Distributor has agreed to reduce the 12b-1 fee on Class B shares of the Fund to the extent it exceeds 0.24% of the average daily net assets of such shares on an annualized basis. This waiver will continue for at least one year from the date of the Fund's prospectus or until such time that the Trustees act to discontinue all or a portion of such waiver when they deem that such action is appropriate. For the year ended December 31, 2018, the distribution fee was accrued for Class B at an annual rate of 0.22%.
At December 31, 2018, included in the Statement of Assets and Liabilities is a receivable from the Fund's Distributor which represents payments due to be reimbursed to the Fund under the Plan. Because the Plan is what is referred to as a "reimbursement plan", the Distributor reimburses to the Fund any 12b-1 fees collected in excess of the actual distribution expenses incurred. This receivable represents this excess amount as of December 31, 2018.
In the case of Class A shares, Class L shares and Class C shares, expenses incurred pursuant to the Plan in any calendar year in excess of 0.25%, 0.50% and 1.00% of the average daily net assets of Class A shares, Class L shares and Class C shares, respectively, will not be reimbursed by the Fund through payments in any subsequent year, except that expenses representing a gross sales commission credited to Financial Intermediaries at the time of sale may be reimbursed in the subsequent calendar year. For the year ended December 31, 2018, the distribution fee was accrued for Class A shares, Class L shares and Class C shares at the annual rate of 0.25%, 0.50% and 1.00%, respectively.
The Distributor has informed the Fund that for the year ended December 31, 2018, it received contingent deferred sales charges from certain redemptions of the Fund's Class A shares and Class B shares of $500 and $36,895, respectively, and received $5,773 in front-end sales charges from sales of the Fund's Class A shares. The respective shareholders pay such charges, which are not an expense of the Fund.
32
Morgan Stanley U.S. Government Securities Trust
Notes to Financial Statements n December 31, 2018 continued
6. Shares of Beneficial Interest
Transactions in shares of beneficial interest were as follows:
| | | FOR THE YEAR
ENDED
DECEMBER 31, 2018 | | FOR THE YEAR
ENDED
DECEMBER 31, 2017 | |
| | | SHARES | | AMOUNT | | SHARES | | AMOUNT | |
CLASS A SHARES | |
Sold | | | 2,775,129 | | | $ | 23,017,285 | | | | 548,972 | | | $ | 4,778,414 | | |
Reinvestment of dividends | | | 123,350 | | | | 1,037,712 | | | | 126,636 | | | | 1,102,739 | | |
Redeemed | | | (3,231,019 | ) | | | (26,893,427 | ) | | | (1,121,208 | ) | | | (9,761,914 | ) | |
Net decrease — Class A | | | (332,540 | ) | | | (2,838,430 | ) | | | (445,600 | ) | | | (3,880,761 | ) | |
CLASS B SHARES | |
Exchanged | | | 27,459 | | | | 232,251 | | | | 54,064 | | | | 470,232 | | |
Reinvestment of dividends | | | 1,041,490 | | | | 8,760,695 | | | | 1,082,444 | | | | 9,422,157 | | |
Redeemed | | | (5,593,182 | ) | | | (47,044,034 | ) | | | (6,505,376 | ) | | | (56,590,592 | ) | |
Net decrease — Class B | | | (4,524,233 | ) | | | (38,051,088 | ) | | | (5,368,868 | ) | | | (46,698,203 | ) | |
CLASS L SHARES | |
Exchanged | | | 7 | | | | 62 | | | | 1,632 | | | | 14,260 | | |
Reinvestment of dividends | | | 26,717 | | | | 226,592 | | | | 30,215 | | | | 265,096 | | |
Redeemed | | | (266,274 | ) | | | (2,257,937 | ) | | | (289,893 | ) | | | (2,543,249 | ) | |
Net decrease — Class L | | | (239,550 | ) | | | (2,031,283 | ) | | | (258,046 | ) | | | (2,263,893 | ) | |
CLASS I SHARES | |
Sold | | | 504,022 | | | | 4,247,941 | | | | 274,963 | | | | 2,394,752 | | |
Reinvestment of dividends | | | 270,281 | | | | 2,274,164 | | | | 268,519 | | | | 2,338,494 | | |
Redeemed | | | (1,209,450 | ) | | | (10,184,882 | ) | | | (1,397,425 | ) | | | (12,157,433 | ) | |
Net decrease — Class I | | | (435,147 | ) | | | (3,662,777 | ) | | | (853,943 | ) | | | (7,424,187 | ) | |
CLASS C SHARES | |
Sold | | | 169,740 | | | | 1,428,945 | | | | 45,899 | | | | 402,586 | | |
Reinvestment of dividends | | | 2,385 | | | | 20,226 | | | | 1,776 | | | | 15,592 | | |
Redeemed | | | (37,952 | ) | | | (320,746 | ) | | | (23,417 | ) | | | (205,544 | ) | |
Net increase — Class C | | | 134,173 | | | | 1,128,425 | | | | 24,258 | | | | 212,634 | | |
Net decrease in Fund | | | (5,397,297 | ) | | $ | (45,455,153 | ) | | | (6,902,199 | ) | | $ | (60,054,410 | ) | |
7. Custodian Fees
State Street (the "Custodian") also serves as Custodian for the Fund in accordance with a Custodian Agreement. The Custodian holds cash, securities and other assets of the Fund as required by the Act. Custody fees are payable monthly based on assets held in custody, investment purchases and sales activity and account maintenance fees, plus reimbursement for certain out-of-pocket expenses.
33
Morgan Stanley U.S. Government Securities Trust
Notes to Financial Statements n December 31, 2018 continued
8. Dividend Disbursing and Transfer Agent
The Fund's dividend disbursing and transfer agent is DST Asset Manager Solutions, Inc. ("DST"). Pursuant to a Transfer Agency Agreement, the Fund pays DST a fee based on the number of classes, accounts and transactions relating to the Fund.
9. Security Transactions and Transactions with Affiliates
The cost of purchases and proceeds from sales of investment securities, excluding short-term investments, for the year ended December 31, 2018, aggregated $663,173,575 and $722,261,545, respectively. Included in the aforementioned are purchases and sales of U.S. Government securities of $657,811,085 and $698,803,045, respectively.
The Fund invests in the Institutional Class of the Morgan Stanley Institutional Liquidity Funds — Government Portfolio (the "Liquidity Funds"), an open-end management investment company managed by the Adviser. Advisory fees paid by the Fund are reduced by an amount equal to its pro-rata share of the advisory and administration fees paid by the Fund due to its investment in the Liquidity Funds. For the year ended December 31, 2018, advisory fees paid were reduced by $16,364 relating to the Fund's investment in the Liquidity Funds.
A summary of the Fund's transactions in shares of affiliated investments during the year ended December 31, 2018 is as follows:
AFFILIATED
INVESTMENT
COMPANY | | VALUE
DECEMBER 31,
2017 | | PURCHASES
AT COST | | PROCEEDS
FROM SALES | | DIVIDEND
INCOME | | REALIZED
GAIN (LOSS) | | CHANGE IN
UNREALIZED
APPRECIATION
(DEPRECIATION) | | VALUE
DECEMBER 31,
2018 | |
Liquidity Funds | | $ | 8,402,866 | | | $ | 134,438,286 | | | $ | 140,096,997 | | | $ | 172,244 | | | $ | — | | | $ | — | | | $ | 2,744,155 | | |
The Fund has an unfunded noncontributory defined benefit pension plan covering certain independent Trustees of the Fund who will have served as independent Trustees for at least five years at the time of retirement. Benefits under this plan are based on factors which include years of service and compensation. The Trustees voted to close the plan to new participants and eliminate the future benefits growth due to increases to compensation after July 31, 2003. At December 31, 2018, the Fund had an accrued pension liability of $61,558, which is reflected as "Trustees' fees" in the Statement of Assets and Liabilities.
34
Morgan Stanley U.S. Government Securities Trust
Notes to Financial Statements n December 31, 2018 continued
The Fund is permitted to purchase and sell securities ("cross-trade") from and to other Morgan Stanley funds as well as other funds and client accounts for which the Adviser or an affiliate of the Adviser serves as investment adviser, pursuant to procedures approved by the Trustees in compliance with Rule 17a-7 under the Act (the "Rule"). Each cross-trade is executed at the current market price in compliance with provisions of the Rule. For the year ended December 31, 2018, the Fund did not engage in any cross-trade transactions.
The Fund has an unfunded Deferred Compensation Plan (the "Compensation Plan"), which allows each independent Trustee to defer payment of all, or a portion, of the fees he or she receives for serving on the Board of Trustees. Each eligible Trustee generally may elect to have the deferred amounts credited with a return equal to the total return on one or more of the Morgan Stanley funds that are offered as investment options under the Compensation Plan. Appreciation/depreciation and distributions received from these investments are recorded with an offsetting increase/decrease in the deferred compensation obligation and do not affect the NAV of the Fund.
10. Federal Income Tax Status
It is the Fund's intention to continue to qualify as a regulated investment company and distribute all of its taxable and tax-exempt income. Accordingly, no provision for Federal income taxes is required in the financial statements.
The Fund may be subject to taxes imposed by countries in which it invests. Such taxes are generally based on income and/or capital gains earned or repatriated. Taxes are accrued based on net investment income, net realized gains and net unrealized appreciation as such income and/or gains are earned. Taxes may also be based on transactions in foreign currency and are accrued based on the value of investments denominated in such currency.
FASB ASC 740-10, "Income Taxes — Overall", sets forth a minimum threshold for financial statement recognition of the benefit of a tax position taken or expected to be taken in a tax return. Management has concluded there are no significant uncertain tax positions that would require recognition in the financial statements. If applicable, the Fund recognizes interest accrued related to unrecognized tax benefits in "Interest Expense" and penalties in "Other Expenses" in the Statement of Operations. The Fund files tax returns with the U.S. Internal Revenue Service, New York and various states. Each of the tax years in the four-year period ended December 31, 2018 remains subject to examination by taxing authorities.
35
Morgan Stanley U.S. Government Securities Trust
Notes to Financial Statements n December 31, 2018 continued
The tax character of distributions paid may differ from the character of distributions shown for U.S. GAAP purposes due to short-term capital gains being treated as ordinary income for tax purposes. The tax character of distributions paid during fiscal 2018 and 2017 was as follows:
| 2018 Distributions Paid From: | | 2017 Distributions Paid From: | |
Ordinary
Income | | Long-Term
Capital Gain | | Ordinary
Income | | Long-Term
Capital Gain | |
| $ | 12,896,178 | | | $ | — | | | $ | 13,745,131 | | | $ | — | | |
The amount and character of income and gains to be distributed are determined in accordance with income tax regulations which may differ from GAAP. These book/tax differences are either considered temporary or permanent in nature.
Temporary differences are attributable to differing book and tax treatments for the timing of the recognition of gains (losses) on certain investment transactions and the timing of the deductibility of certain expenses.
The Fund had no permanent differences causing reclassifications among the components of net assets for the year ended December 31, 2018.
At December 31, 2018, the components of distributable earnings for the Fund on a tax basis were as follows:
Undistributed
Ordinary
Income | | Undistributed
Long-Term
Capital Gain | |
| $ | 1,612,407 | | | $ | — | | |
At December 31, 2018, the Fund had available for federal income tax purposes unused short term and long term capital losses of $2,072,418 and $3,626,072, respectively, that do not have an expiration date.
To the extent that capital loss carryforwards are used to offset any future capital gains realized, no capital gains tax liability will be incurred by the Fund for gains realized and not distributed. To the extent that capital gains are offset, such gains will not be distributed to the shareholders.
11. Purposes of and Risks Relating to Certain Financial Instruments
The Fund may invest in mortgage securities, including securities issued by the Federal National Mortgage Association ("FNMA") and Federal Home Loan Mortgage Corporation ("FHLMC"). These are fixed income securities that derive their value from or represent interests in a pool of mortgages or mortgage securities. An unexpectedly high rate of defaults on the mortgages held by a mortgage pool
36
Morgan Stanley U.S. Government Securities Trust
Notes to Financial Statements n December 31, 2018 continued
may adversely affect the value of a mortgage-backed security and could result in losses to the Fund. The risk of such defaults is generally higher in the case of mortgage pools that include sub-prime mortgages. Sub-prime mortgages refer to loans made to borrowers with weakened credit histories or with a lower capacity to make timely payments on their mortgages. The securities held by the Fund are not backed by sub-prime mortgages.
Additionally, securities issued by FNMA and FHLMC are not backed by or entitled to the full faith and credit of the United States; rather, they are supported by the right of the issuer to borrow from the U.S. Department of the Treasury.
The Federal Housing Finance Agency ("FHFA") serves as conservator of FNMA and FHLMC and the U.S. Department of the Treasury has agreed to provide capital as needed to ensure FNMA and FHLMC continue to provide liquidity to the housing and mortgage markets.
12. Credit Facility
The Fund and other Morgan Stanley funds participated in a $150,000,000 committed, unsecured revolving line of credit facility (the "Facility") with State Street. This Facility is to be used for temporary emergency purposes or funding of shareholder redemption requests. The interest rate on borrowings is based on the federal funds rate or 1 month LIBOR rate plus a spread. The Facility also has a commitment fee of 0.25% per annum based on the unused portion of the Facility. During the year ended December 31, 2018, the Fund did not have any borrowings under the Facility.
13. Other
At December 31, 2018, the Fund had record owners of 10% or greater. Investment activities of these shareholders could have a material impact on the Fund. The aggregate percentage of such owners was 50.8%.
14. Accounting Pronouncement
In March 2017, FASB issued an Accounting Standard Update, ASU 2017-08, Receivables-Nonrefundable Fees and Other Costs (Subtopic 310-20), Premium Amortization on Purchased Callable Debt Securities ("ASU 2017-08") which amends the amortization period for certain purchased callable debt securities held at a premium, shortening such period to the earliest call date. ASU 2017-08 does not require any accounting change for debt securities held at a discount; the discount continues to be accreted to maturity. ASU 2017-08 is effective for fiscal years, and interim periods within those fiscal years, beginning after December 15, 2018. At this time, management is evaluating the implications of these changes on the financial statements.
37
Morgan Stanley U.S. Government Securities Trust
Financial Highlights
Selected ratios and per share data for a share of beneficial interest outstanding throughout each period:
| | | FOR THE YEAR ENDED DECEMBER 31, | |
| | | 2018 | | 2017 | | 2016(1) | | 2015 | | 2014 | |
Class A Shares | |
Selected Per Share Data: | |
Net asset value, beginning of period | | $ | 8.67 | | | $ | 8.68 | | | $ | 8.71 | | | $ | 8.90 | | | $ | 8.63 | | |
Income (loss) from investment operations: | |
Net investment income | | | 0.25 | | | | 0.24 | | | | 0.25 | | | | 0.22 | | | | 0.17 | | |
Net realized and unrealized gain (loss) | | | (0.26 | ) | | | (0.01 | ) | | | (0.04 | ) | | | (0.21 | ) | | | 0.31 | | |
Total income (loss) from investment operations | | | (0.01 | ) | | | 0.23 | | | | 0.21 | | | | 0.01 | | | | 0.48 | | |
Less dividends from net investment income | | | (0.25 | ) | | | (0.24 | ) | | | (0.24 | ) | | | (0.20 | ) | | | (0.21 | ) | |
Net asset value, end of period | | $ | 8.41 | | | $ | 8.67 | | | $ | 8.68 | | | $ | 8.71 | | | $ | 8.90 | | |
| Total Return(2) | | | (0.01 | )% | | | 2.66 | % | | | 2.40 | %(3) | | | 0.10 | % | | | 5.60 | % | |
Ratios to Average Net Assets: | |
Net expenses | | | 0.87 | %(4)(5) | | | 0.86 | %(4)(5) | | | 0.87 | %(4)(6) | | | 0.87 | %(4)(5) | | | 0.86 | %(4)(5) | |
Net investment income | | | 3.01 | %(4)(5) | | | 2.79 | %(4)(5) | | | 2.66 | %(4)(6) | | | 2.41 | %(4)(5) | | | 1.90 | %(4)(5) | |
Rebate from Morgan Stanley affiliate | | | 0.00 | %(7) | | | 0.01 | % | | | 0.00 | %(7) | | | 0.00 | %(7) | | | 0.01 | % | |
Supplemental Data: | |
Net assets, end of period, in thousands | | $ | 34,504 | | | $ | 38,438 | | | $ | 42,375 | | | $ | 49,715 | | | $ | 56,270 | | |
Portfolio turnover rate | | | 159 | % | | | 179 | % | | | 279 | % | | | 464 | % | | | 317 | % | |
(1) Reflects prior period Custodian out-of-pocket expenses that were reimbursed in September 2016. The amount of the reimbursement was immaterial on a per share basis and did not impact the total return of Class A shares
(2) Does not reflect the deduction of sales charge. Calculated based on the net asset value as of the last business day of the period.
(3) Performance was positively impacted by approximately 0.68% for Class A shares due to the receipt of proceeds from the settlements of class action suits involving the Fund's past holdings. There were one-time settlements, and as a result, the impact on the NAV and consequently the performance will not likely be repeated in the future. Had these settlements not occurred, the total return for Class A shares would have been approximately 1.72%.
(4) The ratios reflect the rebate of certain Fund expenses in connection with investments in a Morgan Stanley affiliate during the period. The effect of the rebate on the ratios is disclosed in the above table as "Rebate from Morgan Stanley affiliate."
(5) If the Fund had borne all of its expenses that were waived by the Adviser/Administrator, the annualized expense and net investment income ratios would have been as follows:
| PERIOD ENDED | | EXPENSE
RATIO | | NET INVESTMENT
INCOME RATIO | |
December 31, 2018 | | | 1.02 | % | | | 2.86 | % | |
December 31, 2017 | | | 1.08 | | | | 2.57 | | |
December 31, 2015 | | | 0.94 | | | | 2.34 | | |
December 31, 2014 | | | 0.99 | | | | 1.77 | | |
(6) If the Fund had not received the reimbursement from the Custodian and had borne all of its expenses that were waived by the Adviser/Administrator, the annualized expense and net investment income ratios would have been as follows:
| PERIOD ENDED | | EXPENSE
RATIO | | NET INVESTMENT
INCOME RATIO | |
December 31, 2016 | | | 1.19 | % | | | 2.34 | % | |
(7) Amount is less than 0.005%.
See Notes to Financial Statements
38
Morgan Stanley U.S. Government Securities Trust
Financial Highlights continued
| | | FOR THE YEAR ENDED DECEMBER 31, | |
| | | 2018 | | 2017 | | 2016(1) | | 2015 | | 2014 | |
Class B Shares | |
Selected Per Share Data: | |
Net asset value, beginning of period | | $ | 8.67 | | | $ | 8.68 | | | $ | 8.70 | | | $ | 8.90 | | | $ | 8.62 | | |
Income (loss) from investment operations: | |
Net investment income | | | 0.25 | | | | 0.24 | | | | 0.25 | | | | 0.22 | | | | 0.17 | | |
Net realized and unrealized gain (loss) | | | (0.26 | ) | | | (0.01 | ) | | | (0.03 | ) | | | (0.22 | ) | | | 0.32 | | |
Total income (loss) from investment operations | | | (0.01 | ) | | | 0.23 | | | | 0.22 | | | | 0.00 | (2) | | | 0.49 | | |
Less dividends from net investment income | | | (0.25 | ) | | | (0.24 | ) | | | (0.24 | ) | | | (0.20 | ) | | | (0.21 | ) | |
Net asset value, end of period | | $ | 8.41 | | | $ | 8.67 | | | $ | 8.68 | | | $ | 8.70 | | | $ | 8.90 | | |
| Total Return(3) | | | 0.02 | % | | | 2.68 | % | | | 2.54 | %(4) | | | 0.00 | %(5) | | | 5.73 | % | |
Ratios to Average Net Assets: | |
Net expenses | | | 0.84 | %(6)(7) | | | 0.85 | %(6)(7) | | | 0.86 | %(6)(8) | | | 0.83 | %(6)(7) | | | 0.85 | %(6)(7) | |
Net investment income | | | 3.04 | %(6)(7) | | | 2.80 | %(6)(7) | | | 2.66 | %(6)(8) | | | 2.46 | %(6)(7) | | | 1.91 | %(6)(7) | |
Rebate from Morgan Stanley affiliate | | | 0.00 | %(5) | | | 0.01 | % | | | 0.00 | %(5) | | | 0.00 | %(5) | | | 0.01 | % | |
Supplemental Data: | |
Net assets, end of period, in thousands | | $ | 281,599 | | | $ | 329,378 | | | $ | 376,574 | | | $ | 423,561 | | | $ | 498,350 | | |
Portfolio turnover rate | | | 159 | % | | | 179 | % | | | 279 | % | | | 464 | % | | | 317 | % | |
(1) Reflects prior period Custodian out-of-pocket expenses that were reimbursed in September 2016. The amount of the reimbursement was immaterial on a per share basis and did not impact the total return of Class B shares.
(2) Amount is less than $0.005 per share.
(3) Does not reflect the deduction of sales charge. Calculated based on the net asset value as of the last business day of the period.
(4) Performance was positively impacted by approximately 0.69% for Class B shares due to the receipt of proceeds from the settlements of class action suits involving the Fund's past holdings. There were one-time settlements, and as a result, the impact on the NAV and consequently the performance will not likely be repeated in the future. Had these settlements not occurred, the total return for Class B shares would have been approximately 1.85%.
(5) Amount is less than 0.005%.
(6) The ratios reflect the rebate of certain Fund expenses in connection with investments in a Morgan Stanley affiliate during the period. The effect of the rebate on the ratios is disclosed in the above table as "Rebate from Morgan Stanley affiliate."
(7) If the Fund had borne all of its expenses that were waived by the Adviser/Administrator, the annualized expense and net investment income ratios would have been as follows:
| PERIOD ENDED | | EXPENSE
RATIO | | NET INVESTMENT
INCOME RATIO | |
December 31, 2018 | | | 0.94 | % | | | 2.94 | % | |
December 31, 2017 | | | 0.97 | | | | 2.68 | | |
December 31, 2015 | | | 0.90 | | | | 2.39 | | |
December 31, 2014 | | | 0.96 | | | | 1.80 | | |
(8) If the Fund had not received the reimbursement from the Custodian and had borne all of its expenses that were waived by the Adviser/Administrator, the annualized expense and net investment income ratios would have been as follows:
| PERIOD ENDED | | EXPENSE
RATIO | | NET INVESTMENT
INCOME RATIO | |
December 31, 2016 | | | 0.95 | % | | | 2.57 | % | |
See Notes to Financial Statements
39
Morgan Stanley U.S. Government Securities Trust
Financial Highlights continued
| | | FOR THE YEAR ENDED DECEMBER 31, | |
| | | 2018 | | 2017 | | 2016(1) | | 2015 | | 2014 | |
Class L Shares | |
Selected Per Share Data: | |
Net asset value, beginning of period | | $ | 8.73 | | | $ | 8.75 | | | $ | 8.77 | | | $ | 8.97 | | | $ | 8.69 | | |
Income (loss) from investment operations: | |
Net investment income | | | 0.23 | | | | 0.22 | | | | 0.23 | | | | 0.20 | | | | 0.14 | | |
Net realized and unrealized gain (loss) | | | (0.25 | ) | | | (0.02 | ) | | | (0.03 | ) | | | (0.22 | ) | | | 0.32 | | |
Total income (loss) from investment operations | | | (0.02 | ) | | | 0.20 | | | | 0.20 | | | | (0.02 | ) | | | 0.46 | | |
Less dividends from net investment income | | | (0.23 | ) | | | (0.22 | ) | | | (0.22 | ) | | | (0.18 | ) | | | (0.18 | ) | |
Net asset value, end of period | | $ | 8.48 | | | $ | 8.73 | | | $ | 8.75 | | | $ | 8.77 | | | $ | 8.97 | | |
| Total Return(2) | | | (0.25 | )% | | | 2.38 | % | | | 2.24 | %(3) | | | (0.27 | )% | | | 5.30 | % | |
Ratios to Average Net Assets: | |
Net expenses | | | 1.10 | %(4)(5) | | | 1.11 | %(4)(5) | | | 1.12 | %(4)(6) | | | 1.14 | %(4)(5) | | | 1.21 | %(4) | |
Net investment income | | | 2.74 | %(4)(5) | | | 2.51 | %(4)(5) | | | 2.41 | %(4)(6) | | | 2.12 | %(4)(5) | | | 1.55 | %(4) | |
Rebate from Morgan Stanley affiliate | | | 0.00 | %(7) | | | 0.01 | % | | | 0.00 | %(7) | | | 0.00 | %(7) | | | 0.01 | % | |
Supplemental Data: | |
Net assets, end of period, in thousands | | $ | 7,411 | | | $ | 9,729 | | | $ | 12,004 | | | $ | 13,658 | | | $ | 16,334 | | |
Portfolio turnover rate | | | 159 | % | | | 179 | % | | | 279 | % | | | 464 | % | | | 317 | % | |
(1) Reflects prior period Custodian out-of-pocket expenses that were reimbursed in September 2016. The amount of the reimbursement was immaterial on a per share basis and did not impact the total return of Class L shares.
(2) Calculated based on the net asset value as of the last business day of the period.
(3) Performance was positively impacted by approximately 0.67% for Class L shares due to the receipt of proceeds from the settlements of class action suits involving the Fund's past holdings. These were one-time settlements, and as a result, the impact on the NAV and consequently the performance will not likely be repeated in the future. Had these settlements not occurred, the total return for Class L shares would have been approximately 1.57%.
(4) The ratios reflect the rebate of certain Fund expenses in connection with investments in a Morgan Stanley affiliate during the period. The effect of the rebate on the ratios is disclosed in the above table as "Rebate from Morgan Stanley affiliate."
(5) If the Fund had borne all of its expenses that were waived by the Adviser/Administrator, the annualized expense and net investment income ratios would have been as follows:
| PERIOD ENDED | | EXPENSE
RATIO | | NET INVESTMENT
INCOME RATIO | |
December 31, 2018 | | | 1.20 | % | | | 2.64 | % | |
December 31, 2017 | | | 1.24 | | | | 2.38 | | |
December 31, 2015 | | | 1.22 | | | | 2.04 | | |
(6) If the Fund had not received the reimbursement from the Custodian and had borne all of its expenses that were waived by the Adviser/Administrator, the annualized expense and net investment income ratios would have been as follows:
| PERIOD ENDED | | EXPENSE
RATIO | | NET INVESTMENT
INCOME RATIO | |
December 31, 2016 | | | 1.21 | % | | | 2.32 | % | |
(7) Amount is less than 0.005%.
See Notes to Financial Statements
40
Morgan Stanley U.S. Government Securities Trust
Financial Highlights continued
| | | FOR THE YEAR ENDED DECEMBER 31, | |
| | | 2018 | | 2017 | | 2016(1) | | 2015 | | 2014 | |
Class I Shares | |
Selected Per Share Data: | |
Net asset value, beginning of period | | $ | 8.67 | | | $ | 8.68 | | | $ | 8.71 | | | $ | 8.90 | | | $ | 8.63 | | |
Income (loss) from investment operations: | |
Net investment income | | | 0.28 | | | | 0.27 | | | | 0.28 | | | | 0.25 | | | | 0.19 | | |
Net realized and unrealized gain (loss) | | | (0.26 | ) | | | (0.01 | ) | | | (0.04 | ) | | | (0.21 | ) | | | 0.31 | | |
Total income from investment operations | | | 0.02 | | | | 0.26 | | | | 0.24 | | | | 0.04 | | | | 0.50 | | |
Less dividends from net investment income | | | (0.28 | ) | | | (0.27 | ) | | | (0.27 | ) | | | (0.23 | ) | | | (0.23 | ) | |
Net asset value, end of period | | $ | 8.41 | | | $ | 8.67 | | | $ | 8.68 | | | $ | 8.71 | | | $ | 8.90 | | |
| Total Return(2) | | | 0.34 | % | | | 2.90 | % | | | 2.88 | %(3) | | | 0.44 | % | | | 5.83 | % | |
Ratios to Average Net Assets: | |
Net expenses | | | 0.52 | %(4)(5) | | | 0.51 | %(4)(5) | | | 0.52 | %(4)(6) | | | 0.54 | %(4)(5) | | | 0.64 | %(4)(5) | |
Net investment income | | | 3.36 | %(4)(5) | | | 3.14 | %(4)(5) | | | 3.00 | %(4)(6) | | | 2.74 | %(4)(5) | | | 2.12 | %(4)(5) | |
Rebate from Morgan Stanley affiliate | | | 0.00 | %(7) | | | 0.01 | % | | | 0.00 | %(7) | | | 0.00 | %(7) | | | 0.01 | % | |
Supplemental Data: | |
Net assets, end of period, in thousands | | $ | 67,487 | | | $ | 73,314 | | | $ | 80,861 | | | $ | 87,824 | | | $ | 98,543 | | |
Portfolio turnover rate | | | 159 | % | | | 179 | % | | | 279 | % | | | 464 | % | | | 317 | % | |
(1) Reflects prior period Custodian out-of-pocket expenses that were reimbursed in September 2016. The amount of the reimbursement was immaterial on a per share basis and did not impact the total return of Class I shares.
(2) Calculated based on the net asset value as of the last business day of the period.
(3) Performance was positively impacted by approximately 0.69% for Class I shares due to the receipt of proceeds from the settlements of class action suits involving the Fund's past holdings. These were one-time settlements, and as a result, the impact on the NAV and consequently the performance will not likely be repeated in the future. Had these settlements not occurred, the total return for Class I shares would have been approximately 2.19%.
(4) The ratios reflect the rebate of certain Fund expenses in connection with investments in a Morgan Stanley affiliate during the period. The effect of the rebate on the ratios is disclosed in the above table as "Rebate from Morgan Stanley affiliate."
(5) If the Fund had borne all of its expenses that were waived by the Adviser/Administrator, the annualized expense and net investment income ratios would have been as follows:
| PERIOD ENDED | | EXPENSE
RATIO | | NET INVESTMENT
INCOME RATIO | |
December 31, 2018 | | | 0.72 | % | | | 3.16 | % | |
December 31, 2017 | | | 0.74 | | | | 2.91 | | |
December 31, 2015 | | | 0.71 | | | | 2.57 | | |
December 31, 2014 | | | 0.77 | | | | 1.99 | | |
(6) If the Fund had not received the reimbursement from the Custodian and had borne all of its expenses that were waived by the Adviser/Administrator, the annualized expense and net investment income ratios would have been as follows:
| PERIOD ENDED | | EXPENSE
RATIO | | NET INVESTMENT
INCOME RATIO | |
December 31, 2016 | | | 0.69 | % | | | 2.83 | % | |
(7) Amount is less than 0.005%.
See Notes to Financial Statements
41
Morgan Stanley U.S. Government Securities Trust
Financial Highlights continued
| | | FOR THE YEAR ENDED DECEMBER 31, | | PERIOD FROM
APRIL 30, 2015(2) | |
| | | | | TO | |
| | | 2018 | | 2017 | | 2016(1) | | DECEMBER 31, 2015 | |
Class C Shares | |
Selected Per Share Data: | |
Net asset value, beginning of period | | $ | 8.74 | | | $ | 8.75 | | | $ | 8.77 | | | $ | 8.97 | | |
Income (loss) from investment operations: | |
Net investment income | | | 0.19 | | | | 0.18 | | | | 0.17 | | | | 0.11 | | |
Net realized and unrealized loss | | | (0.26 | ) | | | (0.02 | ) | | | (0.02 | ) | | | (0.22 | ) | |
Total income (loss) from investment operations | | | (0.07 | ) | | | 0.16 | | | | 0.15 | | | | (0.11 | ) | |
Less dividends from net investment income | | | (0.19 | ) | | | (0.17 | ) | | | (0.17 | ) | | | (0.09 | ) | |
Net asset value, end of period | | $ | 8.48 | | | $ | 8.74 | | | $ | 8.75 | | | $ | 8.77 | | |
| Total Return(3) | | | (0.76 | )% | | | 1.87 | % | | | 1.60 | %(4) | | | (1.08 | )%(9) | |
Ratios to Average Net Assets: | |
Net expenses | | | 1.62 | %(5)(6) | | | 1.61 | %(5)(6) | | | 1.62 | %(5)(7) | | | 1.62 | %(5)(6)(10) | |
Net investment income | | | 2.24 | %(5)(6) | | | 2.00 | %(5)(6) | | | 1.90 | %(5)(7) | | | 1.53 | %(5)(6)(10) | |
Rebate from Morgan Stanley affiliate | | | 0.00 | %(8) | | | 0.01 | % | | | 0.00 | %(8) | | | 0.00 | %(8)(10) | |
Supplemental Data: | |
Net assets, end of period, in thousands | | $ | 2,012 | | | $ | 902 | | | $ | 691 | | | $ | 152 | | |
Portfolio turnover rate | | | 159 | % | | | 179 | % | | | 279 | % | | | 464 | % | |
(1) Reflects prior period Custodian out-of-pocket expenses that were reimbursed in September 2016. The amount of the reimbursement was immaterial on a per share basis and did not impact the total return of Class C shares.
(2) Commencement of Offering.
(3) Does not reflect the deduction of sales charge. Calculated based on the net asset value as of the last business day of the period.
(4) Performance was positively impacted by approximately 0.56% for Class C shares due to the receipt of proceeds from the settlements of class action suits involving the Fund's past holdings. These were one-time settlements, and as a result, the impact on the NAV and consequently the performance will not likely be repeated in the future. Had these settlements not occurred, the total return for Class C shares would have been approximately 1.04%.
(5) The ratios reflect the rebate of certain Fund expenses in connection with investments in a Morgan Stanley affiliate during the period. The effect of the rebate on the ratios is disclosed in the above table as "Rebate from Morgan Stanley affiliate."
(6) If the Fund had borne all of its expenses that were waived by the Adviser/Administrator, the annualized expense and net investment income (loss) ratios would have been as follows:
| PERIOD ENDED | | EXPENSE
RATIO | | NET INVESTMENT
INCOME (LOSS) RATIO | |
December 31, 2018 | | | 1.96 | % | | | 1.90 | % | |
December 31, 2017 | | | 1.96 | | | | 1.65 | | |
December 31, 2015 | | | 4.26 | | | | (1.11 | ) | |
(7) If the Fund had not received the reimbursement from the Custodian and had borne all of its expenses that were waived by the Adviser/Administrator, the annualized expense and net investment income ratios would have been as follows:
| PERIOD ENDED | | EXPENSE
RATIO | | NET INVESTMENT
INCOME RATIO | |
December 31, 2016 | | | 2.15 | % | | | 1.37 | % | |
(8) Amount is less than 0.005%.
(9) Not annualized.
(10) Annualized.
See Notes to Financial Statements
42
Morgan Stanley U.S. Government Securities Trust
Report of Independent Registered Public Accounting Firm
To the Shareholders and Board of Trustees of
Morgan Stanley U.S. Government Securities Trust
Opinion on the Financial Statements
We have audited the accompanying statement of assets and liabilities of Morgan Stanley U.S. Government Securities Trust (the "Fund"), including the portfolio of investments, as of December 31, 2018, and the related statement of operations for the year then ended, the statements of changes in net assets for each of the two years in the period then ended, the financial highlights for each of the five years in the period then ended and the related notes (collectively referred to as the "financial statements"). In our opinion, the financial statements present fairly, in all material respects, the financial position of Morgan Stanley U.S. Government Securities Trust at December 31, 2018, the results of its operations for the year then ended, the changes in its net assets for each of the two years in the period then ended and its financial highlights for each of the five years in the period then ended, in conformity with U.S. generally accepted accounting principles.
Basis for Opinion
These financial statements are the responsibility of the Fund's management. Our responsibility is to express an opinion on the Fund's financial statements based on our audits. We are a public accounting firm registered with the Public Company Accounting Oversight Board (United States) ("PCAOB") and are required to be independent with respect to the Fund in accordance with the U.S. federal securities law and the applicable rules and regulations of the Securities and Exchange Commission and the PCAOB.
We conducted our audits in accordance with the standards of the PCAOB. Those standards require that we plan and perform the audit to obtain reasonable assurance about whether the financial statements are free of material misstatement, whether due to error or fraud. The Fund is not required to have, nor were we engaged to perform, an audit of the Fund's internal control over financial reporting. As part of our audits, we are required to obtain an understanding of internal control over financial reporting, but not for the purpose of expressing an opinion on the effectiveness of the Fund's internal control over financial reporting. Accordingly, we express no such opinion.
Our audits included performing procedures to assess the risks of material misstatement of the financial statements, whether due to error or fraud, and performing procedures that respond to those risks. Such procedures included examining, on a test basis, evidence regarding the amounts and disclosures in the financial statements. Our procedures included confirmation of securities owned as of December 31, 2018 by correspondence with the custodian and others or by other appropriate auditing procedures where replies from others were not received. Our audits also included evaluating the accounting principles used and significant estimates made by management, as well as evaluating the overall presentation of the financial statements. We believe that our audits provide a reasonable basis for our opinion.

We have served as the auditor of one or more Morgan Stanley investment companies since 2000.
Boston, Massachusetts
February 26, 2019
43
Morgan Stanley U.S. Government Securities Trust
Privacy Notice (unaudited)
Morgan Stanley Investment Management Inc.
An Important Notice Concerning Our U.S. Privacy Policy
We are required by federal law to provide you with a copy of our privacy policy annually. This policy applies to current and former individual investors in funds managed or sponsored by Morgan Stanley Investment Management Inc. ("MSIM") as well as current and former individual clients of MSIM. This policy is not applicable to partnerships, corporations, trusts or other non-individual clients or investors. Please note that we may amend this policy at any time, and will inform you of any changes as required by law.
We Respect Your Privacy
We appreciate that you have provided us with your personal financial information. We strive to maintain the privacy of such information while we help you achieve your financial objectives. This Notice describes what non-public personal information we collect about you, why we collect it, when we may share it with others and how certain others may use it. It discusses the steps you may take to limit our sharing of certain information about you to affiliated companies in the Morgan Stanley family of companies ("other Morgan Stanley companies"). It also discloses how you may limit use of certain shared information for marketing purposes by other Morgan Stanley branded companies. Throughout this policy, we refer to the non-public information that personally identifies you or your accounts as "personal information.''
1. What Personal Information Do We Collect About You?
We obtain personal information from applications and other forms you submit to us, from your dealings with us, from consumer reporting agencies, from our Web sites and from third parties and other sources.
For example:
• We may collect information such as your name, address, e-mail address, telephone/fax numbers, assets, income and investment objectives through subscription documents, applications and other forms you submit to us.
• We may obtain information about account balances, your use of account(s) and the types of products and services you prefer to receive from us through your dealings and transactions with us and other sources.
• We may obtain information about your creditworthiness and credit history from consumer reporting agencies.
• We may collect background information from and through third-party vendors to verify representations you have made and to comply with various regulatory requirements.
44
Morgan Stanley U.S. Government Securities Trust
Privacy Notice (unaudited) continued
• If you interact with us through our public and private Web sites, we may collect information that you provide directly through online communications (such as an e-mail address). We may also collect information about your Internet service provider, your domain name, your computer's operating system and Web browser, your use of our Web sites and your product and service preferences, through the use of "cookies." Please consult the Terms of Use of these sites for more details.
2. When Do We Disclose Personal Information We Collect About You?
We may disclose personal information we collect about you to other Morgan Stanley companies and to non-affiliated third parties.
a. Information We Disclose to Other Morgan Stanley Companies. We may disclose personal information to other Morgan Stanley companies for a variety of reasons, including to manage your account(s) effectively, to service and process your transactions, to let you know about products and services offered by us and other Morgan Stanley companies, to manage our business, and as otherwise required or permitted by law. Offers for products and services from other Morgan Stanley companies are developed under conditions designed to safeguard your personal information.
b. Information We Disclose to Non-affiliated Third Parties. We do not disclose personal information that we collect about you to non-affiliated third parties except to those who provide marketing services on our behalf, to financial institutions with whom we have joint marketing agreements, and as otherwise required or permitted by law. For example, we may disclose personal information to non-affiliated third parties for servicing and processing transactions, to offer our own products and services, to protect against fraud, for institutional risk control, to respond to judicial process or to perform services on our behalf. When we share personal information with a non-affiliated third party, they are required to limit their use of personal information to the particular purpose for which it was shared and they are not allowed to share personal information with others except to fulfill that limited purpose or as may be permitted or required by law.
3. How Do We Protect The Security And Confidentiality Of Personal Information We Collect About You?
We maintain physical, electronic and procedural security measures to help safeguard the personal information we collect about you. We have internal policies governing the proper handling of client information. Third parties that provide support or marketing services on our behalf may also receive personal information, and we require them to adhere to confidentiality standards with respect to such information.
45
Morgan Stanley U.S. Government Securities Trust
Privacy Notice (unaudited) continued
4. How Can You Limit The Sharing Of Certain Types Of Personal Information With Other Morgan Stanley Companies?
We offer you choices as to whether we share with other Morgan Stanley companies the personal information that was collected to determine your eligibility for products and services you request ("eligibility information"). Eligibility information does not include your identification information or personal information pertaining to our transactions or experiences with you. Please note that, even if you direct us not to share eligibility information with other Morgan Stanley companies ("opt-out"), we may still share personal information, including eligibility information, with those companies in circumstances excluded from the opt-out under applicable law, such as to process transactions or to service your account.
5. How Can You Limit The Use Of Certain Types Of Personal Information By Other Morgan Stanley Companies For Marketing?
By following the opt-out instructions in Section 6 below, you may limit other Morgan Stanley branded companies from marketing their products or services to you based on personal information we disclose to them. This information may include, for example, your income and account history with us. Please note that, even if you choose to limit Other Morgan Stanley Companies from using personal information about you that we may share with them for marketing their products and services to you, Other Morgan Stanley Companies may use your personal information that they obtain from us to market to you in circumstances permitted by law, such as if the Other Morgan Stanley Company has its own relationship with you.
6. How Can You Send Us An Opt-Out Instruction?
If you wish to limit our sharing of eligibility information about you with other Morgan Stanley companies or other Morgan Stanley companies' use of personal information for marketing purposes, as described in this notice, you may do so by:
• Calling us at (800) 548-7786
Monday–Friday between 8a.m. and 6p.m.(EST)
• Writing to us at the following address:
DST Asset Manager Solutions, Inc.
c/o Privacy Coordinator
P.O. Box 219804
Kansas City, Missouri 64121
Your written request should include your name, address, telephone number and account number(s) to which the opt-out applies and whether you are opting out with respect to sharing of eligibility information (Section 4 above), or if information used for Marketing (Section 5 above) or both. Written opt-out requests should not be sent with any other correspondence. In order to process your request, we require that the request be provided by you directly and not through a third party.
46
Morgan Stanley U.S. Government Securities Trust
Privacy Notice (unaudited) continued
Your opt-out preference will remain in effect with respect to this policy (as it may be amended) until you notify us otherwise. If you have a joint account, your direction for us not to share this information with other Morgan Stanley companies and for those other Morgan Stanley companies not to use your personal information for marketing will be applied to all account holders on that account. Please understand that if you limit our sharing or our affiliated companies' use of personal information, you and any joint account holder(s) may not receive information about Morgan Stanley products and services, including products or services that could help you manage your financial resources and achieve your investment objectives.
7. What If An Affiliated Company Becomes A Non-Affiliated Third Party?
If, at any time in the future, an affiliated company becomes a non-affiliated third party, further disclosures of personal information made to the former affiliated company will be limited to those described in Section 2(b) above relating to non-affiliated third parties. If you elected under Section 6 to limit disclosures we make to affiliated companies, or use of personal information by affiliated companies, your election will not apply to use by any former affiliated company of your personal information in their possession once it becomes a non-affiliated third party.
Special Notice to Residents of Vermont
The following section supplements our policy with respect to our individual clients who have a Vermont address and supersedes anything to the contrary in the above policy with respect to those clients only.
The state of Vermont requires financial institutions to obtain your consent prior to sharing personal information that they collect about you with affiliated companies and non-affiliated third parties other than in certain limited circumstances. Except as permitted by law, we will not share personal information we collect about you with non-affiliated third parties or other Morgan Stanley companies unless you provide us with your written consent to share such information ("opt-in").
If you wish to receive offers for investment products and services offered by or through other Morgan Stanley companies, please notify us in writing at the following address:
DST Asset Manager Solutions, Inc.
c/o Privacy Coordinator
P.O. Box 219804
Kansas City, Missouri 64121
Your authorization should include your name, address, telephone number and account number(s) to which the opt-in applies and should not be sent with any other correspondence. In order to process your authorization, we require that the authorization be provided by you directly and not through a third party.
47
Morgan Stanley U.S. Government Securities Trust
Privacy Notice (unaudited) continued
Special Notice to Residents of California
The following section supplements our policy with respect to our individual clients who have a California address and supersedes anything to the contrary in the above policy with respect to those clients only.
In response to a California law, if your account has a California home address, your personal information will not be disclosed to non-affiliated third parties except as permitted by applicable California law, and we will limit sharing such information with our affiliates to comply with California privacy laws that apply to us.
48
Morgan Stanley U.S. Government Securities Trust
Trustee and Officer Information (unaudited)
Name, Age and Address of
Independent Trustee | | Position(s)
Held with
Registrant | | Length of
Time Served* | | Principal Occupation(s)
During Past 5 Years
and Other Relevant
Professional Experience | | Number of
Portfolios
in Fund
Complex
Overseen by
Independent
Trustee** | | Other Directorships
Held by Independent Trustee*** | |
Frank L. Bowman (74)
c/o Perkins Coie LLP
Counsel to the Independent Trustees
30 Rockefeller Plaza
New York, NY 10112 | | Trustee | | Since August 2006 | | President, Strategic Decisions, LLC (consulting) (since February 2009); Director or Trustee of various Morgan Stanley Funds (since August 2006); Chairperson of the Compliance and Insurance Committee (since October 2015); formerly, Chairperson of the Insurance Sub-Committee of the Compliance and Insurance Committee (2007-2015); served as President and Chief Executive Officer of the Nuclear Energy Institute (policy organization) (February 2005-November 2008); retired as Admiral, U.S. Navy after serving over 38 years on active duty including 8 years as Director of the Naval Nuclear Propulsion Program in the Department of the Navy and the U.S. Department of Energy (1996-2004); served as Chief of Naval Personnel (July 1994-September 1996) and on the Joint Staff as Director of Political Military Affairs (June 1992-July 1994); knighted as Honorary Knight Commander of the Most Excellent Order of the British Empire; awarded the Officier de l'Orde National du Mérite by the French Government; elected to the National Academy of Engineering (2009). | | | 82 | | | Director of BP p.l.c.; Director of Naval and Nuclear Technologies LLP; Director Emeritus of the Armed Services YMCA; Member of the National Security Advisory Council of the Center for U.S. Global Engagement and a member of the CNA Military Advisory Board; Trustee of Fairhaven United Methodist Church; Member of the Board of Advisors of the Dolphin Scholarship Foundation; and Director of other various non-profit organizations. | |
Kathleen A. Dennis (65)
c/o Perkins Coie LLP
Counsel to the Independent Trustees
30 Rockefeller Plaza
New York, NY 10112 | | Trustee | | Since August 2006 | | President, Cedarwood Associates (mutual fund and investment management consulting) (since July 2006); Chairperson of the Liquidity and Alternatives Sub-Committee of the Investment Committee (since October 2006) and Director or Trustee of various Morgan Stanley Funds (since August 2006); formerly, Senior Managing Director of Victory Capital Management (1993-2006). | | | 82 | | | Director of various non-profit organizations. | |
49
Morgan Stanley U.S. Government Securities Trust
Trustee and Officer Information (unaudited) continued
Name, Age and Address of
Independent Trustee | | Position(s)
Held with
Registrant | | Length of
Time Served* | | Principal Occupation(s)
During Past 5 Years
and Other Relevant
Professional Experience | | Number of
Portfolios
in Fund
Complex
Overseen by
Independent
Trustee** | | Other Directorships
Held by Independent Trustee*** | |
Nancy C. Everett (63)
c/o Perkins Coie LLP
Counsel to the Independent Trustees
30 Rockefeller Plaza
New York, NY 10112 | | Trustee | | Since January 2015 | | Chief Executive Officer, Virginia Commonwealth University Investment Company (since November 2015); Owner OBIR, LLC (institutional investment management consulting) (since June 2014); formerly, Managing Director, BlackRock, Inc. (February 2011-December 2013); and Chief Executive Officer, General Motors Asset Management (a/k/a Promark Global Advisors, Inc.) (June 2005-May 2010). | | | 83 | | | Formerly, Member of Virginia Commonwealth University School of Business Foundation (2005-2016); Member of Virginia Commonwealth University Board of Visitors (2013-2015); Member of Committee on Directors for Emerging Markets Growth Fund, Inc. (2007-2010); Chairperson of Performance Equity Management, LLC (2006-2010); and Chairperson, GMAM Absolute Return Strategies Fund, LLC (2006-2010). | |
Jakki L. Haussler (61)
c/o Perkins Coie LLP
Counsel to the Independent Trustees
30 Rockefeller Plaza
New York, NY 10112 | | Trustee | | Since January 2015 | | Chairman and Chief Executive Officer, Opus Capital Group (since January 1996); formerly, Director, Capvest Venture Fund, LP (May 2000-December 2011); Partner, Adena Ventures, LP (July 1999-December 2010); Director, The Victory Funds (February 2005-July 2008). | | | 83 | | | Director of Service Corporation International and Member, Audit Committee and Investment Committee; Director of Cincinnati Bell Inc. and Member, Audit Committee and Governance and Nominating Committee; Chairman of Northern Kentucky University Member Investment Committee; Member of Chase College of Law Transactional Law Practice Center Board of Advisors; Director of Best Transport; Director of Chase College of Law Board of Visitors; formerly, Member, University of Cincinnati Foundation Investment Committee; Member, Miami University Board of Visitors (2008-2011); Trustee of Victory Funds (2005-2008) and Chairman, Investment Committee (2007-2008) and Member, Service Provider Committee (2005-2008). | |
50
Morgan Stanley U.S. Government Securities Trust
Trustee and Officer Information (unaudited) continued
Name, Age and Address of
Independent Trustee | | Position(s)
Held with
Registrant | | Length of
Time Served* | | Principal Occupation(s)
During Past 5 Years
and Other Relevant
Professional Experience | | Number of
Portfolios
in Fund
Complex
Overseen by
Independent
Trustee** | | Other Directorships
Held by Independent Trustee*** | |
Dr. Manuel H. Johnson (69)
c/o Johnson Smick International, Inc.
220 I Street, NE — Suite 200
Washington, D.C. 20002 | | Trustee | | Since July 1991 | | Senior Partner, Johnson Smick International, Inc. (consulting firm); Chairperson of the Investment Committee (since October 2006) and Director or Trustee of various Morgan Stanley Funds (since July 1991); Co-Chairman and a founder of the Group of Seven Council (G7C) (international economic commission); formerly, Chairperson of the Audit Committee (July 1991-September 2006), Vice Chairman of the Board of Governors of the Federal Reserve System and Assistant Secretary of the U.S. Treasury. | | | 82 | | | Director of NVR, Inc. (home construction). | |
Joseph J. Kearns (76)
c/o Perkins Coie LLP
Counsel to the Independent Trustees
30 Rockefeller Plaza
New York, NY 10112 | | Trustee | | Since August 1994 | | Senior Adviser, Kearns & Associates LLC (investment consulting); Chairperson of the Audit Committee (since October 2006) and Director or Trustee of various Morgan Stanley Funds (since August 1994); formerly, Deputy Chairperson of the Audit Committee (July 2003-September 2006) and Chairperson of the Audit Committee of various Morgan Stanley Funds (since August 1994); CFO of the J. Paul Getty Trust. | | | 83 | | | Prior to August 10, 2016, Director of Electro Rent Corporation (equipment leasing); Prior to December 31, 2013, Director of The Ford Family Foundation. | |
51
Morgan Stanley U.S. Government Securities Trust
Trustee and Officer Information (unaudited) continued
Name, Age and Address of
Independent Trustee | | Position(s)
Held with
Registrant | | Length of
Time Served* | | Principal Occupation(s)
During Past 5 Years
and Other Relevant
Professional Experience | | Number of
Portfolios
in Fund
Complex
Overseen by
Independent
Trustee** | | Other Directorships
Held by Independent Trustee*** | |
Michael F. Klein (60)
c/o Perkins Coie LLP
Counsel to the Independent Trustees
30 Rockefeller Plaza
New York, NY 10112 | | Trustee | | Since August 2006 | | Managing Director, Aetos Alternatives Management, LP (since March 2000); Co-President, Aetos Alternatives Management, LP (since January 2004) and Co-Chief Executive Officer of Aetos Alternatives Management, LP (since August 2013); Chairperson of the Fixed Income Sub-Committee of the Investment Committee (since October 2006) and Director or Trustee of various Morgan Stanley Funds (since August 2006); formerly, Managing Director, Morgan Stanley & Co. Inc. and Morgan Stanley Dean Witter Investment Management and President, various Morgan Stanley Funds (June1998-March 2000); Principal, Morgan Stanley & Co. Inc. and Morgan Stanley Dean Witter Investment Management (August 1997-December 1999). | | | 82 | | | Director of certain investment funds managed or sponsored by Aetos Alternatives Management, LP; Director of Sanitized AG and Sanitized Marketing AG (specialty chemicals). | |
Patricia Maleski (58)
c/o Perkins Coie LLP
Counsel to the Independent Trustees
30 Rockefeller Plaza
New York, NY 10112 | | Trustee | | Since January 2017 | | Managing Director, JPMorgan Asset Management (2004-2016); Oversight and Control Head of Fiduciary and Conflicts of Interest Program (2015-2016); Chief Control Officer-Global Asset Management (2013-2015); President, JPMorgan Funds (2010-2013); Chief Administrative Officer (2004-2013); various other positions including Treasurer and Board Liaison (since 2001). | | | 83 | | | None. | |
52
Morgan Stanley U.S. Government Securities Trust
Trustee and Officer Information (unaudited) continued
Name, Age and Address of
Independent Trustee | | Position(s)
Held with
Registrant | | Length of
Time Served* | | Principal Occupation(s)
During Past 5 Years
and Other Relevant
Professional Experience | | Number of
Portfolios
in Fund
Complex
Overseen by
Independent
Trustee** | | Other Directorships
Held by Independent Trustee*** | |
Michael E. Nugent (82)
522 Fifth Avenue
New York, NY 10036 | | Chair of the Board and Trustee | | Chair of the Boards since July 2006 and Trustee since July 1991 | | Chair of the Boards of various Morgan Stanley Funds (since July 2006); Chairperson of the Closed-End Fund Committee (since June 2012) Governance Committee (since January 2019) and Director or Trustee of various Morgan Stanley Funds (since July 1991); formerly, Chairperson of the Insurance Committee (until July 2006); General Partner, Triumph Capital, L.P. (private investment partnership) (1988-2013). | | | 82 | | | None. | |
W. Allen Reed (71)
c/o Perkins Coie LLP
Counsel to the Independent Trustees
30 Rockefeller Plaza
New York, NY 10112 | | Trustee | | Since August 2006 | | Chairperson of the Equity Sub-Committee of the Investment Committee (since October 2006) and Director or Trustee of various Morgan Stanley Funds (since August 2006); formerly, President and CEO of General Motors Asset Management; Chairman and Chief Executive Officer of the GM Trust Bank and Corporate Vice President of General Motors Corporation (August 1994-December 2005). | | | 82 | | | Director of Legg Mason, Inc.; formerly, Director of the Auburn University Foundation (2010-2015). | |
Fergus Reid (86)****
c/o Joe Pietryka, Inc.
85 Charles Colman Blvd.
Pawling, NY 12564 | | Trustee | | Since June 1992 | | Chairman, Joe Pietryka, Inc.; Chairperson of the Governance Committee and Director or Trustee of various Morgan Stanley Funds (since June 1992). | | | 83 | | | Formerly, Trustee and Director of certain investment companies in the JP Morgan Fund Complex managed by JP Morgan Investment Management Inc. (1987-2012). | |
* This is the earliest date the Trustee began serving the Morgan Stanley Funds. Each Trustee serves an indefinite term, until his or her successor is elected.
** The Fund Complex includes (as of December 31, 2018) all open-end and closed-end funds (including all of their portfolios) advised by Morgan Stanley Investment Management Inc. (the "Adviser") and any funds that have an adviser that is an affiliated person of the Adviser (including, but not limited to, Morgan Stanley AIP GP LP).
*** This includes any directorships at public companies and registered investment companies held by the Trustee at any time during the past five years.
**** Effective date of retirement is December 31, 2018.
53
Morgan Stanley U.S. Government Securities Trust
Trustee and Officer Information (unaudited) continued
Name, Age and Address of
Executive Officer | | Position(s)
Held with
Registrant | | Length of
Time Served* | | Principal Occupation(s) During Past 5 Years | |
John H. Gernon (55)
522 Fifth Avenue
New York, NY 10036 | | President and Principal Executive Officer | | Since September 2013 | | President and Principal Executive Officer of the Equity and Fixed Income Funds and the Morgan Stanley AIP Funds (since September 2013) and the Liquidity Funds and various money market funds (since May 2014) in the Fund Complex; Managing Director of the Adviser; Head of Product (since 2006). | |
Timothy J. Knierim (59)
522 Fifth Avenue
New York, NY 10036 | | Chief Compliance Officer | | Since December 2016 | | Managing Director of the Adviser and various entities affiliated with the Adviser; Chief Compliance Officer of various Morgan Stanley Funds and the Adviser (since December 2016) and Chief Compliance Officer of Morgan Stanley AIP GP LP (since 2014). Formerly, Managing Director and Deputy Chief Compliance Officer of the Adviser (2014-2016); and formerly, Chief Compliance Officer of Prudential Investment Management, Inc. (2007-2014). | |
Francis J. Smith (53)
522 Fifth Avenue
New York, NY 10036 | | Treasurer and Principal Financial Officer | | Treasurer since July 2003 and Principal Financial Officer since September 2002 | | Managing Director of the Adviser and various entities affiliated with the Adviser; Treasurer (since July 2003) and Principal Financial Officer of various Morgan Stanley Funds (since September 2002). | |
Mary E. Mullin (51)
522 Fifth Avenue
New York, NY 10036 | | Secretary | | Since June 1999 | | Managing Director of the Adviser; Secretary of various Morgan Stanley Funds (since June 1999). | |
Michael J. Key (39)
522 Fifth Avenue
New York, NY 10036 | | Vice President | | Since June 2017 | | Vice President of the Equity and Fixed Income Funds, Liquidity Funds, various money market funds and the Morgan Stanley AIP Funds in the Fund Complex (since June 2017); Executive Director of the Adviser; Head of Product Development for Equity and Fixed Income Funds (since August 2013). | |
* This is the earliest date the officer began serving the Morgan Stanley Funds. Each officer serves a one-year term, until his or her successor is elected and qualifies.
54
Adviser and Administrator
Morgan Stanley Investment Management Inc.
522 Fifth Avenue
New York, New York 10036
Distributor
Morgan Stanley Distribution, Inc.
522 Fifth Avenue
New York, New York 10036
Dividend Disbursing and Transfer Agent
DST Asset Manager Solutions, Inc.
2000 Crown Colony Drive
Quincy, Massachusetts 02169
Custodian
State Street Bank and Trust Company
One Lincoln Street
Boston, Massachusetts 02111
Legal Counsel
Dechert LLP
1095 Avenue of the Americas
New York, New York 10036
Counsel to the Independent Trustees
Perkins Coie LLP
30 Rockefeller Plaza
New York, New York 10112
Independent Registered Public Accounting Firm
Ernst & Young LLP
200 Clarendon Street
Boston, Massachusetts 02116
This report is submitted for the general information of the shareholders of the Fund. For more detailed information about the Fund, its fees and expenses and other pertinent information, please read its Prospectus. The Fund's Statement of Additional Information contains additional information about the Fund, including its trustees. It is available, without charge, by calling (800) 548-7786.
This report is not authorized for distribution to prospective investors in the Fund unless preceded or accompanied by an effective Prospectus. Please read the Prospectus carefully before investing.
Morgan Stanley Distribution, Inc., member FINRA.
© 2019 Morgan Stanley

USGANN
2405458 EXP. 02.29.20
Item 2. Code of Ethics.
(a) The registrant has adopted a code of ethics (the “Code of Ethics”) that applies to its principal executive officer, principal financial officer, principal accounting officer or controller, or persons performing similar functions, regardless of whether these individuals are employed by the registrant or a third party.
(b) No information need be disclosed pursuant to this paragraph.
(c) Not applicable.
(d) Not applicable.
(e) Not applicable.
(f)
(1) The registrant’s Code of Ethics is attached hereto as Exhibit 12 A.
(2) Not applicable.
(3) Not applicable.
Item 3. Audit Committee Financial Expert.
The registrant’s Board of Trustees has determined that Joseph J. Kearns, an “independent” Trustee, is an “audit committee financial expert” serving on its audit committee. Under applicable securities laws, a person who is determined to be an audit committee financial expert will not be deemed an “expert” for any purpose, including without limitation for the purposes of Section 11 of the Securities Act of 1933, as a result of being designated or identified as an audit committee financial expert. The designation or identification of a person as an audit committee financial expert does not impose on such person any duties, obligations, or liabilities that are greater than the duties, obligations, and liabilities imposed on such person as a member of the audit committee and Board of Trustees in the absence of such designation or identification.
Item 4. Principal Accountant Fees and Services.
(a)(b)(c)(d) and (g). Based on fees billed for the periods shown:
2018
| | Registrant | | Covered Entities(1) | |
Audit Fees | | $ | 62,078 | | N/A | |
| | | | | |
Non-Audit Fees | | | | | |
Audit-Related Fees | | $ | — | (2) | $ | — | (2) |
Tax Fees | | $ | 4,613 | (3) | $ | 8,773,935 | (4) |
All Other Fees | | $ | — | | $ | 18,115 | (5) |
Total Non-Audit Fees | | $ | 4,613 | | $ | 8,792,050 | |
| | | | | |
Total | | $ | 66,691 | | $ | 8,792,050 | |
2017
| | Registrant | | Covered Entities(1) | |
Audit Fees | | $ | 60,564 | | N/A | |
| | | | | |
Non-Audit Fees | | | | | |
Audit-Related Fees | | $ | — | (2) | $ | — | (2) |
Tax Fees | | $ | 4,500 | (3) | $ | 11,474,825 | (4) |
All Other Fees | | $ | — | | $ | 136,088 | (5) |
Total Non-Audit Fees | | $ | 4,500 | | $ | 11,610,913 | |
| | | | | |
Total | | $ | 65,064 | | $ | 11,610,913 | |
N/A- Not applicable, as not required by Item 4.
(1) Covered Entities include the Adviser (excluding sub-advisors) and any entity controlling, controlled by or under common control with the Adviser that provides ongoing services to the Registrant.
(2) Audit-Related Fees represent assurance and related services provided that are reasonably related to the performance of the audit of the financial statements of the Covered Entities’ and funds advised by the Adviser or its affiliates, specifically data verification and agreed-upon procedures related to asset securitizations and agreed-upon procedures engagements.
(3) Tax Fees represent tax compliance, tax planning and tax advice services provided in connection with the preparation and review of the Registrant’s tax returns.
(4) Tax Fees represent tax compliance, tax planning and tax advice services provided in connection with the review of Covered Entities’ tax returns.
(5) All other fees represent project management for future business applications and improving business and operational processes.
(e)(1) The audit committee’s pre-approval policies and procedures are as follows:
APPENDIX A
AUDIT COMMITTEE
AUDIT AND NON-AUDIT SERVICES
PRE-APPROVAL POLICY AND PROCEDURES
OF THE
MORGAN STANLEY FUNDS
AS ADOPTED AND AMENDED JULY 23, 2004 AND JUNE 15 AND 16, 2016(3)
1. Statement of Principles
The Audit Committee of the Board is required to review and, in its sole discretion, pre-approve all Covered Services to be provided by the Independent Auditors to the Fund and Covered Entities in order to assure that services performed by the Independent Auditors do not impair the auditor’s independence from the Fund.
The SEC has issued rules specifying the types of services that an independent auditor may not provide to its audit client, as well as the audit committee’s administration of the engagement of the independent auditor. The SEC’s rules establish two different approaches to pre-approving services, which the SEC considers to be equally valid. Proposed services either: may be pre-approved without consideration of specific case-by-case services by the Audit Committee (“general pre-approval”); or require the specific pre-approval of the Audit Committee or its delegate (“specific pre-approval”). The Audit Committee believes that the combination of these two approaches in this Policy will result in an effective and efficient procedure to pre-approve services performed by the Independent Auditors. As set forth in this Policy, unless a type of service has received general pre-approval, it will require specific pre-approval by the Audit Committee (or by any member of the Audit Committee to which pre-approval authority has been delegated) if it is to be provided by the Independent Auditors. Any proposed services exceeding pre-approved cost levels or budgeted amounts will also require specific pre-approval by the Audit Committee.
The appendices to this Policy describe the Audit, Audit-related, Tax and All Other services that have the general pre-approval of the Audit Committee. The term of any general pre-approval is 12 months from the date of pre-approval, unless the Audit Committee considers and provides a different period and states otherwise. The Audit Committee will annually review and pre-approve the services that may be provided by the Independent Auditors without obtaining specific pre-approval from the Audit Committee. The Audit Committee will add to or subtract from the list of general pre-approved services from time to time, based on subsequent determinations.
The purpose of this Policy is to set forth the policy and procedures by which the Audit Committee intends to fulfill its responsibilities. It does not delegate the Audit Committee’s responsibilities to pre-approve services performed by the Independent Auditors to management.
The Fund’s Independent Auditors have reviewed this Policy and believes that implementation of the Policy will not adversely affect the Independent Auditors’ independence.
(3) This Audit Committee Audit and Non-Audit Services Pre-Approval Policy and Procedures (the “Policy”), adopted as of the date above, supersedes and replaces all prior versions that may have been adopted from time to time.
2. Delegation
As provided in the Act and the SEC’s rules, the Audit Committee may delegate either type of pre-approval authority to one or more of its members. The member to whom such authority is delegated must report, for informational purposes only, any pre-approval decisions to the Audit Committee at its next scheduled meeting.
3. Audit Services
The annual Audit services engagement terms and fees are subject to the specific pre-approval of the Audit Committee. Audit services include the annual financial statement audit and other procedures required to be performed by the Independent Auditors to be able to form an opinion on the Fund’s financial statements. These other procedures include information systems and procedural reviews and testing performed in order to understand and place reliance on the systems of internal control, and consultations relating to the audit. The Audit Committee will approve, if necessary, any changes in terms, conditions and fees resulting from changes in audit scope, Fund structure or other items.
In addition to the annual Audit services engagement approved by the Audit Committee, the Audit Committee may grant general pre-approval to other Audit services, which are those services that only the Independent Auditors reasonably can provide. Other Audit services may include statutory audits and services associated with SEC registration statements (on Forms N-1A, N-2, N-3, N-4, etc.), periodic reports and other documents filed with the SEC or other documents issued in connection with securities offerings.
The Audit Committee has pre-approved the Audit services in Appendix B.1. All other Audit services not listed in Appendix B.1 must be specifically pre-approved by the Audit Committee (or by any member of the Audit Committee to which pre-approval has been delegated).
4. Audit-related Services
Audit-related services are assurance and related services that are reasonably related to the performance of the audit or review of the Fund’s financial statements and, to the extent they are Covered Services, the Covered Entities or that are traditionally performed by the Independent Auditors. Because the Audit Committee believes that the provision of Audit-related services does not impair the independence of the auditor and is consistent with the SEC’s rules on auditor independence, the Audit Committee may grant general pre-approval to Audit-related services. Audit-related services include, among others, accounting consultations related to accounting, financial reporting or disclosure matters not classified as “Audit services”; assistance with understanding and implementing new accounting and financial reporting guidance from rulemaking authorities; agreed-upon or expanded audit procedures related to accounting and/or billing records required to respond to or comply with financial, accounting or regulatory reporting matters; and assistance with internal control reporting requirements under Forms N-CEN and/or N-CSR.
The Audit Committee has pre-approved the Audit-related services in Appendix B.2. All other Audit-related services not listed in Appendix B.2 must be specifically pre-approved by the Audit Committee (or by any member of the Audit Committee to which pre-approval has been delegated).
5. Tax Services
The Audit Committee believes that the Independent Auditors can provide Tax services to the Fund and, to the extent they are Covered Services, the Covered Entities, such as tax compliance, tax planning and tax advice without impairing the auditor’s independence, and the SEC has stated that the Independent Auditors may provide such services.
Pursuant to the preceding paragraph, the Audit Committee has pre-approved the Tax Services in Appendix B.3. All Tax services in Appendix B.3 must be specifically pre-approved by the Audit Committee (or by any member of the Audit Committee to which pre-approval has been delegated).
6. All Other Services
The Audit Committee believes, based on the SEC’s rules prohibiting the Independent Auditors from providing specific non-audit services, that other types of non-audit services are permitted. Accordingly, the Audit Committee believes it may grant general pre-approval to those permissible non-audit services classified as All Other services that it believes are routine and recurring services, would not impair the independence of the auditor and are consistent with the SEC’s rules on auditor independence.
The Audit Committee has pre-approved the All Other services in Appendix B.4. Permissible All Other services not listed in Appendix B.4 must be specifically pre-approved by the Audit Committee (or by any member of the Audit Committee to which pre-approval has been delegated).
7. Pre-Approval Fee Levels or Budgeted Amounts
Pre-approval fee levels or budgeted amounts for all services to be provided by the Independent Auditors will be established annually by the Audit Committee. Any proposed services exceeding these levels or amounts will require specific pre-approval by the Audit Committee. The Audit Committee is mindful of the overall relationship of fees for audit and non-audit services in determining whether to pre-approve any such services.
8. Procedures
All requests or applications for services to be provided by the Independent Auditors that do not require specific approval by the Audit Committee will be submitted to the Fund’s Principal Financial and Accounting Officer and must include a detailed description of the services to be rendered. The Fund’s Principal Financial and Accounting Officer will determine whether such services are included within the list of services that have received the general pre-approval of the Audit Committee. The Audit Committee will be informed on a timely basis of any such services rendered by the Independent Auditors. Requests or applications to provide services that require specific approval by the Audit Committee or Chairman of the Audit Committee will be submitted to the Audit Committee by the Fund’s Principal Financial and
Accounting Officer, who, after consultation with the Independent Auditors, will discuss whether the request or application is consistent with the SEC’s rules on auditor independence.
The Audit Committee has designated the Fund’s Principal Financial and Accounting Officer to monitor the performance of all services provided by the Independent Auditors and to determine whether such services are in compliance with this Policy. The Fund’s Principal Financial and Accounting Officer will report to the Audit Committee on a periodic basis on the results of its monitoring. Both the Fund’s Principal Financial and Accounting Officer and management will immediately report to the chairman of the Audit Committee any breach of this Policy that comes to the attention of the Fund’s Principal Financial and Accounting Officer or any member of management.
9. Additional Requirements
The Audit Committee has determined to take additional measures on an annual basis to meet its responsibility to oversee the work of the Independent Auditors and to assure the auditor’s independence from the Fund, such as reviewing a formal written statement from the Independent Auditors delineating all relationships between the Independent Auditors and the Fund, consistent with the PCAOB’s Ethics and Independence Rule 3526, and discussing with the Independent Auditors its methods and procedures for ensuring independence.
10. Covered Entities
Covered Entities include the Fund’s investment adviser(s) and any entity controlling, controlled by or under common control with the Fund’s investment adviser(s) that provides ongoing services to the Fund(s). Beginning with non-audit service contracts entered into on or after May 6, 2003, the Fund’s audit committee must pre-approve non-audit services provided not only to the Fund but also to the Covered Entities if the engagements relate directly to the operations and financial reporting of the Fund. This list of Covered Entities would include:
Morgan Stanley Funds
Morgan Stanley & Co. LLC
Morgan Stanley Investment Management Inc.
Morgan Stanley Investment Management Limited
Morgan Stanley Investment Management Private Limited
Morgan Stanley Asset & Investment Trust Management Co., Limited
Morgan Stanley Investment Management Company
Morgan Stanley Services Company, Inc.
Morgan Stanley Distribution, Inc.
Morgan Stanley AIP GP LP
Morgan Stanley Alternative Investment Partners LP
Morgan Stanley Smith Barney LLC
Morgan Stanley Capital Management LLC
Morgan Stanley Asia Limited
(e)(2) Beginning with non-audit service contracts entered into on or after May 6, 2003, the audit committee also is required to pre-approve services to Covered Entities to the extent that the services are determined to have a direct impact on the operations or financial reporting of the
Registrant. 100% of such services were pre-approved by the audit committee pursuant to the Audit Committee’s pre-approval policies and procedures (attached hereto).
(f) Not applicable.
(g) See table above.
(h) The audit committee of the Board of Trustees has considered whether the provision of services other than audit services performed by the auditors to the Registrant and Covered Entities is compatible with maintaining the auditors’ independence in performing audit services.
Item 5. Audit Committee of Listed Registrants.
(a) The registrant has a separately-designated standing audit committee established in accordance with Section 3(a)(58)(A) of the Exchange Act whose members are:
Joseph J. Kearns, Jakki L. Haussler, Michael F. Klein and W. Allen Reed.
(b) Not applicable.
Item 6. Schedule of Investments
(a) Refer to Item 1.
(b) Not applicable.
Item 7. Disclosure of Proxy Voting Policies and Procedures for Closed-End Management Investment Companies.
Applicable only to reports filed by closed-end funds.
Item 8. Portfolio Managers of Closed-End Management Investment Companies
Applicable only to reports filed by closed-end funds.
Item 9. Closed-End Fund Repurchases
Applicable only to reports filed by closed-end funds.
Item 10. Submission of Matters to a Vote of Security Holders
Not applicable.
Item 11. Controls and Procedures
(a) The registrant’s principal executive officer and principal financial officer have concluded that the registrant’s disclosure controls and procedures are sufficient to ensure that information required to be disclosed by the registrant in this Form N-CSR was recorded, processed, summarized and reported within the time periods specified in the Securities and Exchange Commission’s rules and forms, based upon such officers’ evaluation of these controls and procedures as of a date within 90 days of the filing date of the report.
(b) There were no changes in the registrant’s internal control over financial reporting that occurred during the second fiscal quarter of the period covered by this report that has materially affected, or is reasonably likely to materially affect, the registrant’s internal control over financial reporting.
Item 12. Exhibits
(a) The Code of Ethics for Principal Executive and Senior Financial Officers is attached hereto.
(b) A separate certification for each principal executive officer and principal financial officer of the registrant are attached hereto as part of EX-99.CERT.
SIGNATURES
Pursuant to the requirements of the Securities Exchange Act of 1934 and the Investment Company Act of 1940, the registrant has duly caused this report to be signed on its behalf by the undersigned, thereunto duly authorized.
Morgan Stanley U.S. Government Securities Trust
/s/ John H. Gernon | |
John H. Gernon |
Principal Executive Officer |
February 19, 2019 |
Pursuant to the requirements of the Securities Exchange Act of 1934 and the Investment Company Act of 1940, this report has been signed by the following persons on behalf of the registrant and in the capacities and on the dates indicated.
/s/ John H. Gernon | |
John H. Gernon |
Principal Executive Officer |
February 19, 2019 |
/s/ Francis Smith | |
Francis Smith |
Principal Financial Officer |
February 19, 2019 |