Exhibit 99.2
www.thorindustries.comInvestor Presentation Investor PresentationNovember 28, 2016 November 28, 2016
THO FORWARD LOOKING FORWARD LOOKING STATEMENTS STATEMENTS This presentation includes certain statements that are“forward looking” statements within the meaning of the U.S. Private Securities Litigation Reform Act of 1995,Section27AoftheSecuritiesActof1933,asamended,andSection21EoftheSecuritiesExchangeActof1934,asamended.Theseforwardlookingstatementsaremadebasedonmanagement’scurrentexpectationsandbeliefsregardingfutureandanticipateddevelopmentsandtheireffectsuponThorIndustries, Inc.,and inherently involve uncertain ties and risks. These forward looking statements are not a guarantee of future performance. We cannot assure you that actual results will not differ from our expectations. Factors which could cause materially different results include,among others,raw material and commodity price fluctuations,material or chassis supply restrictions,legislative and regulatory developments,the impact of rising interest rates on our operating results,the costs of compliance with increased governmental regulation,legal and compliance issues including those that may arise in conjunction with recent transactions,the potential impact of increased tax burdens on our dealers and retail consumers, lower consumer confidence and the level of discretionary consumer spending,interest rate fluctuations and the potential economic impact of rising interest rates,restrictive lending practices, management changes,the success of new product introductions,the pace of obtaining and producing at new production facilities,the pace of acquisitions,the potential loss of existing customers of acquisitions,the integration of new acquisitions,our ability to retain key management personnel of acquired companies,the loss or reduction of sales to key dealers,the availability of delivery personnel,asset impairment charges,cost structure changes,competition,the impact of potential losses under repurchase agreements,the potential impact of the strengthening U.S. dollar on international demand,general economic,market and political conditions and the other risks and uncertainties discussed more fully in ITEM1A of our Annual Report on Form 10-K for the year ended July 31,2016 and Part II,Item 1A of our quarterly report on Form 10-Q for the period ending October 31,2016. We disclaim any obligation or under taking to disseminate any updates or revisions to any forward looking statements contained in this presentation or to reflect any change in our expectations after the date of this presentation or any change in events,conditions or circumstances on which any statement is based,except as required by law.
THO TABLE OF CONTENTS TABLE OF CONTENTS First Quarter 2017 Update –Page 4 Thor Basics: An Introduction to the Company –Page 16 Appendix 1: Investor Q&A –Page 31 Appendix 2: Financial and Market Data –Page 52
First Quarter 2017 Update
FIRST QUARTER KEY FIRST QUARTER KEY MESSAGES MESSAGES Jayco integration has been smooth with significant contributions to consolidated financial results We see no signs of a slowdown in the industry and expect continued favorable growth over the coming year We are judiciously expanding capacity to meet strong demand We continue to execute on a strategic plan which focuses on strong performance and long-term results
THO A RECORD START TO THE A RECORD START TO THE YEAR YEAR Record revenues and earnings for the first quarter of fiscal 2017 Revenues grew 65.8% to $1.71 billion from $1.03 billion in the first quarter of fiscal 2016 ..Towable revenues grew 62.6% to $1.21 billion ..Motorized revenues grew 83.8% to $461.5 million ..Jayco added $467.1 million to revenues in the quarter Markets remain strong with backlogs doubling to $2.11 billion Gross profit up 55.5% to $236.8 million from $152.2 million, although gross margins were modestly impacted by Jayco Net income grew 55.9% to $78.7 million, or $1.49 per diluted share from $50.5 million, or $0.96 per diluted share a year ago Consumers and dealers remain positive, supporting the outlook for continued growth in fiscal 2017

THO A RECORD START TO THE A RECORD START TO THE YEAR YEAR Bob Martin –Thor President & CEO: “Fiscal 2017 began like fiscal 2016 ended, with continued robust performance throughout the Company. The strong revenue and earnings growth reflects the ongoing enthusiastic reception of our product offerings by dealers and consumers alike, as well as our ability to effectively manage our growth and integrate acquisitions successfully. Starting with our Dealer Open House in September, our new products have been incredibly well received, with strong year-over- year sales and backlog growth. With continued dealer optimism and steady economic conditions, we believe 2017 will be one of the strongest years for wholesale shipments for the industry since the 1970s. The Jayco integration has gone very smoothly, as illustrated by their meaningful contribution to our revenues and gross profit. We also made good progress on expanding capacity in a disciplined way to meet the strong demand for our products. New facilities or production lines at Dutchmen, Heartland, Highland Ridge, Jayco and Thor Motor Coach ramped up during the first quarter and we are evaluating additional projects to increase capacity where necessary. The need to meet such strong demand is a true testament to our entire team and the great network of dealers, who are important partners in our success.”
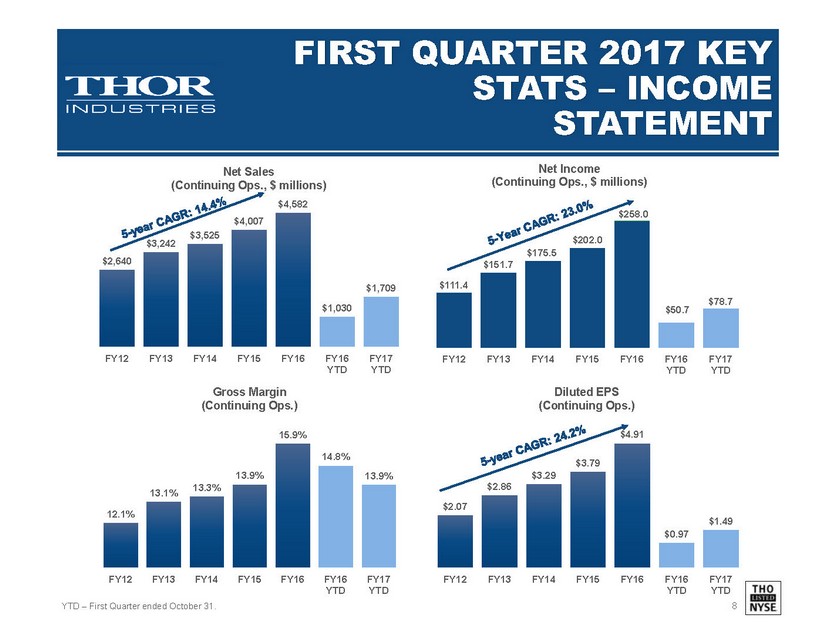
THO FIRST QUARTER 2017 KEY FIRST QUARTER 2017 KEY STATS STATS – –INCOME INCOME STATEMENT STATEMENT $2,640 $3,242 $3,525 $4,007 $4,582 $1,030 $1,709 FY12 FY13 FY14 FY15 FY16 FY16YTD FY17YTD Net Sales (ContinuingOps., $ millions) 5 - year CAGR: 14.4% $2.07 $2.86 $3.29 $3.79 $4.91 $0.97 $1.49 FY12 FY13 FY14 FY15 FY16 FY16YTD FY17YTD Diluted EPS (ContinuingOps.) 5 - year CAGR: 24.2% $111.4 $151.7 $175.5 $202.0 $258.0 $50.7 $78.7 FY12 FY13 FY14 FY15 FY16 FY16YTD FY17YTD Net Income (Continuing Ops., $ millions) 5 - Year CAGR: 23.0% 12.1% 13.1% 13.3% 13.9% 15.9% 14.8% 13.9% FY12 FY13 FY14 FY15 FY16 FY16YTD FY17YTD Gross Margin (ContinuingOps.) YTD –First Quarter ended October 31.
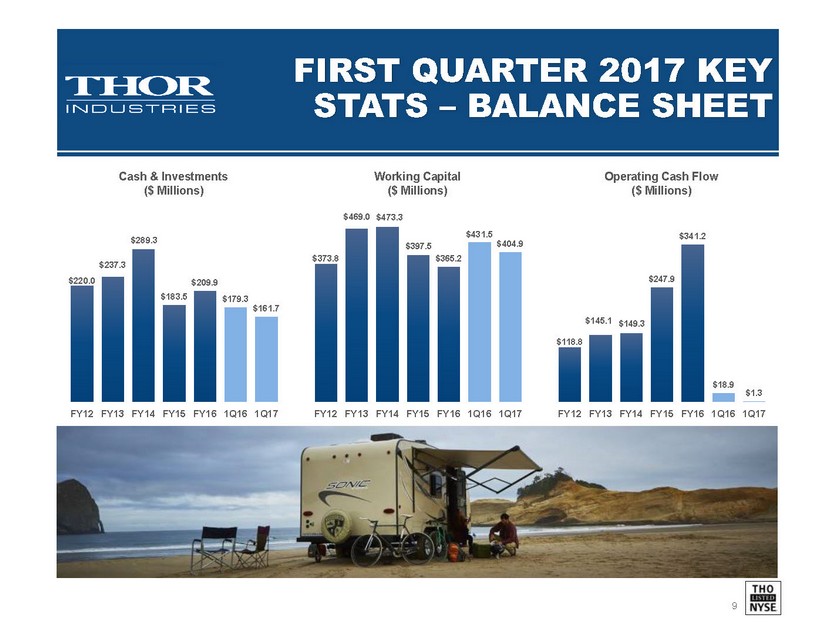
THO FIRST QUARTER 2017 KEY FIRST QUARTER 2017 KEY STATS STATS – –BALANCE SHEET BALANCE SHEET $220.0 $237.3 $289.3 $183.5 $209.9 $179.3 $161.7 FY12 FY13 FY14 FY15 FY16 1Q16 1Q17 Cash & Investments ($ Millions) $373.8 $469.0 $473.3 $397.5 $365.2 $431.5 $404.9 FY12 FY13 FY14 FY15 FY16 1Q16 1Q17 Working Capital ($ Millions) $118.8 $145.1 $149.3 $247.9 $341.2 $18.9 $1.3 FY12 FY13 FY14 FY15 FY16 1Q16 1Q17 Operating Cash Flow ($ Millions)
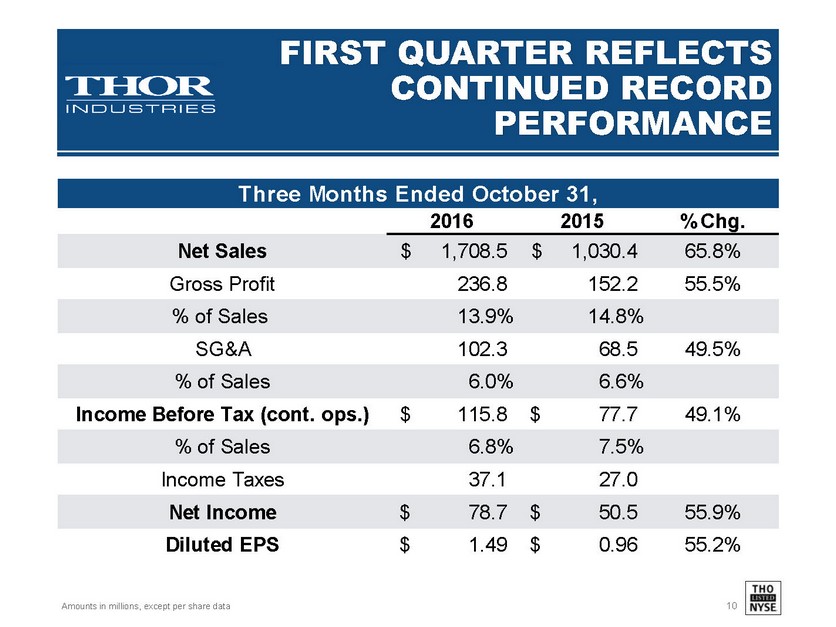
THO FIRST QUARTER REFLECTS FIRST QUARTER REFLECTS CONTINUED RECORD CONTINUED RECORD PERFORMANCE PERFORMANCE Amounts in millions, except per share data 20162015% Chg. Net Sales 1,708.5$ 1,030.4$ 65.8% Gross Profit236.8 152.2 55.5% % of Sales 13.9%14.8% SG&A102.3 68.5 49.5% % of Sales6.0%6.6% Income Before Tax (cont. ops.)115.8$ 77.7$ 49.1% % of Sales6.8%7.5% Income Taxes37.1 27.0 Net Income78.7$ 50.5$ 55.9% Diluted EPS1.49$ 0.96$ 55.2% Three Months Ended October 31,
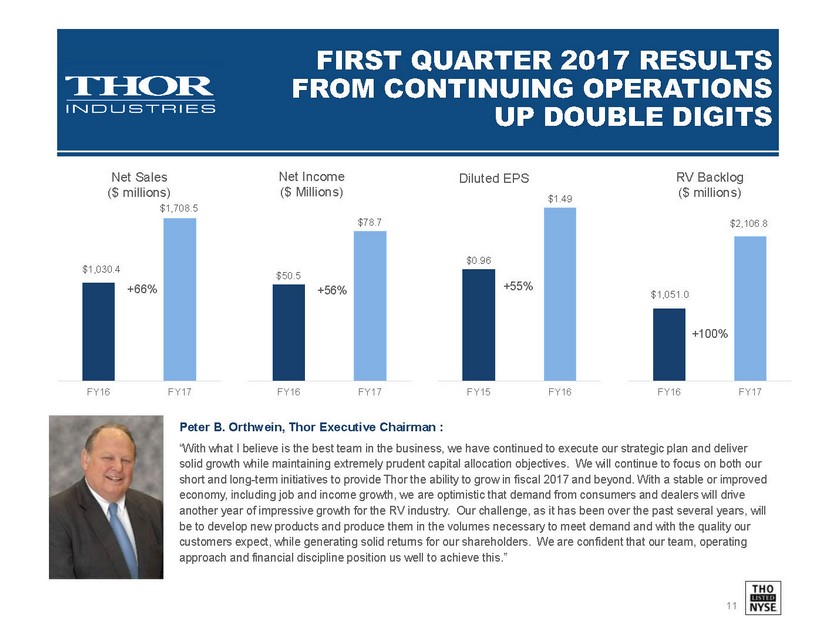
THO FIRST QUARTER 2017 RESULTS FIRST QUARTER 2017 RESULTS FROM CONTINUING OPERATIONS FROM CONTINUING OPERATIONS UP DOUBLE DIGITS UP DOUBLE DIGITS Peter B. Orthwein, Thor Executive Chairman : “With what I believe is the best team in the business, we have continued to execute our strategic plan and deliver solid growth while maintaining extremely prudent capital allocation objectives. We will continue to focus on both our short and long-term initiatives to provide Thor the ability to grow in fiscal 2017 and beyond. With a stable or improved economy, including job and income growth, we are optimistic that demand from consumers and dealers will drive another year of impressive growth for the RV industry. Our challenge, as it has been over the past several years, will be to develop new products and produce them in the volumes necessary to meet demand and with the quality our customers expect, while generating solid returns for our shareholders. We are confident that our team, operating approach and financial discipline position us well to achieve this.” $1,030.4 $1,708.5 FY16 FY17 Net Sales ($ millions) +66% $50.5 $78.7 FY16 FY17 Net Income ($ Millions) +56% $0.96 $1.49 FY15 FY16 Diluted EPS +55% $1,051.0 $2,106.8 FY16 FY17 RV Backlog ($ millions) +100%
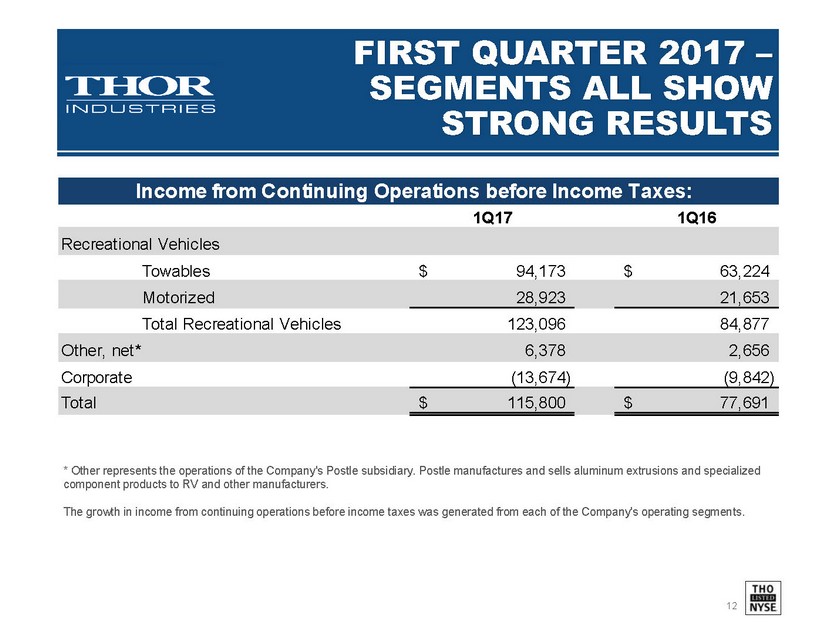
THO FIRST QUARTER 2017 FIRST QUARTER 2017 – – SEGMENTS ALL SHOW SEGMENTS ALL SHOW STRONG RESULTS STRONG RESULTS 1Q171Q16Recreational Vehicles Towables94,173$ 63,224$ Motorized 28,92321,653Total Recreational Vehicles123,09684,877Other, net*6,3782,656Corporate(13,674) (9,842) Total 115,800$ 77,691$ Income from Continuing Operations before Income Taxes: * Other represents the operations of the Company's Postlesubsidiary. Postle manufactures and sells aluminum extrusions and specialized component products to RV and other manufacturers. The growth in income from continuing operations before income taxes was generated from each of the Company's operating segments.

THO INVESTING IN THE INVESTING IN THE FUTURE FUTURE $10,063 $24,305 $30,406 $42,283 $51,976 $15,922 $26,164 $0 $10,000 $20,000 $30,000 $40,000 $50,000 $60,000 FY12 FY13 FY14 FY15 FY16 FY16YTD FY17YTD Thousands Capital Expenditures $99,562 $170 $10,718 $86,092 $194,486 $557,651 $0 $100,000 $200,000 $300,000 $400,000 $500,000 $600,000 FY11 FY12 FY13 FY14 FY15 FY16 Thousands Business Acquisitions Colleen Zuhl –Thor Senior Vice President & CFO: “As a result of the strong operating performance during the quarter, coupled with the timing of sales near the end of the quarter, we saw an increase in working capital –primarily accounts receivable which turn very quickly. We also invested over $26 million on capital projects and reduced the balance on our revolving credit facility by $20 million. At October 31st, we held $161.7 million of cash and $340.0 million was outstanding under the debt agreement with $157.8 million of availability under the revolver. As we look to the remainder of the fiscal year, we see continued strong demand for our products resulting in the need for additional production capacity. We intend to be prudent in investing our cash to ensure we have the ability to meet demand while also further reducing our debt.”
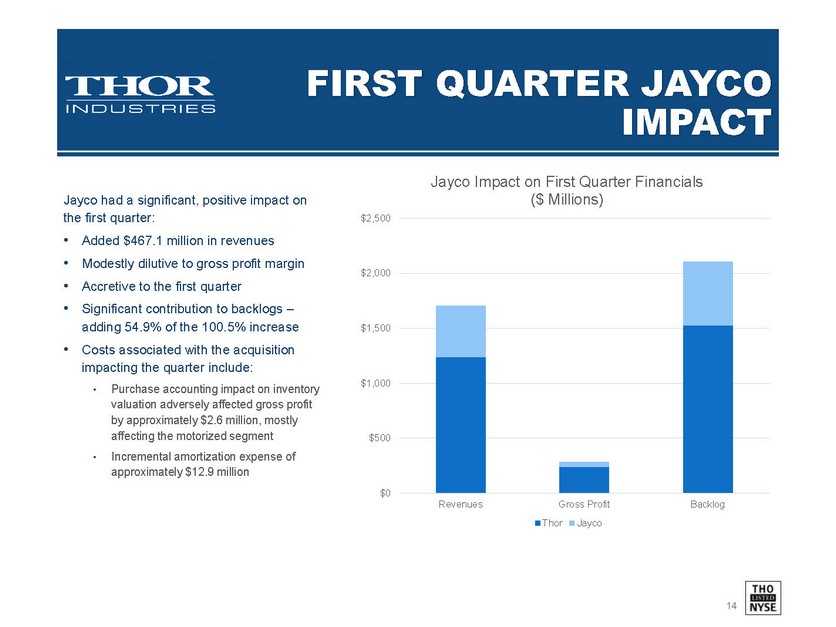
THO FIRST QUARTER JAYCO FIRST QUARTER JAYCO IMPACT IMPACT $0 $500 $1,000 $1,500 $2,000 $2,500 Revenues Gross Profit Backlog Jayco Impact on First Quarter Financials ($ Millions) Thor Jayco Jayco had a significant, positive impact on the first quarter: •Added $467.1 million in revenues •Modestly dilutive to gross profit margin •Accretive to the first quarter •Significant contribution to backlogs – adding 54.9% of the 100.5% increase •Costs associated with the acquisition impacting the quarter include: •Purchase accounting impact on inventory valuation adversely affected gross profit by approximately $2.6 million, mostly affecting the motorized segment •Incremental amortization expense of approximately $12.9 million
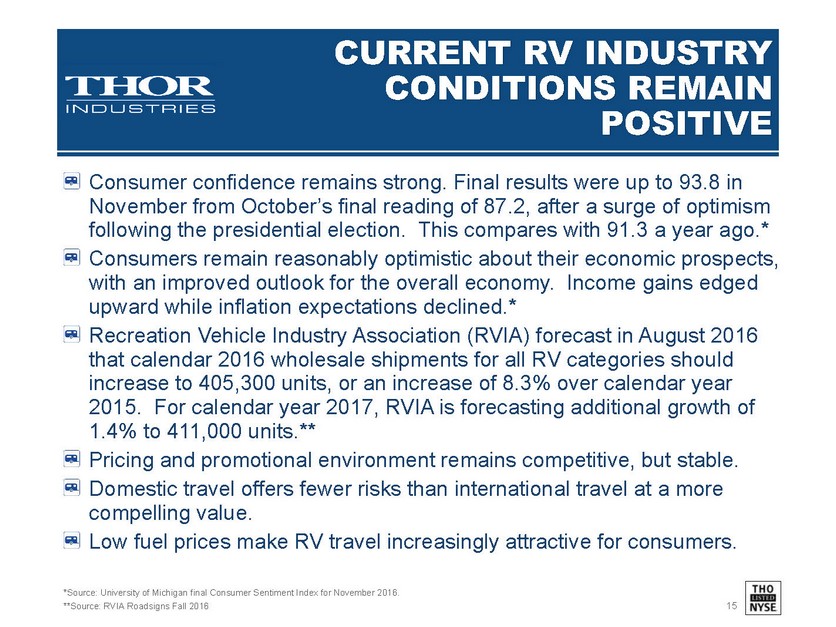
THO CURRENT RV INDUSTRY CURRENT RV INDUSTRY CONDITIONS REMAIN CONDITIONS REMAIN POSITIVE POSITIVE Consumer confidence remains strong. Final results were up to 93.8 in November from October’s final reading of 87.2, after a surge of optimism following the presidential election. This compares with 91.3 a year ago.* Consumers remain reasonably optimistic about their economic prospects, with an improved outlook for the overall economy. Income gains edged upward while inflation expectations declined.* Recreation Vehicle Industry Association (RVIA) forecast in August 2016 that calendar 2016 wholesale shipments for all RV categories should increase to 405,300 units, or an increase of 8.3% over calendar year 2015. For calendar year 2017, RVIA is forecasting additional growth of 1.4% to 411,000 units.** Pricing and promotional environment remains competitive, but stable. Domestic travel offers fewer risks than international travel at a more compelling value. Low fuel prices make RV travel increasingly attractive for consumers. *Source: University of Michigan final Consumer Sentiment Index for November 2016. **Source: RVIA Roadsigns Fall 2016
THO Thor Basics: An Introduction Thor Basics: An Introduction to the Company to the Company
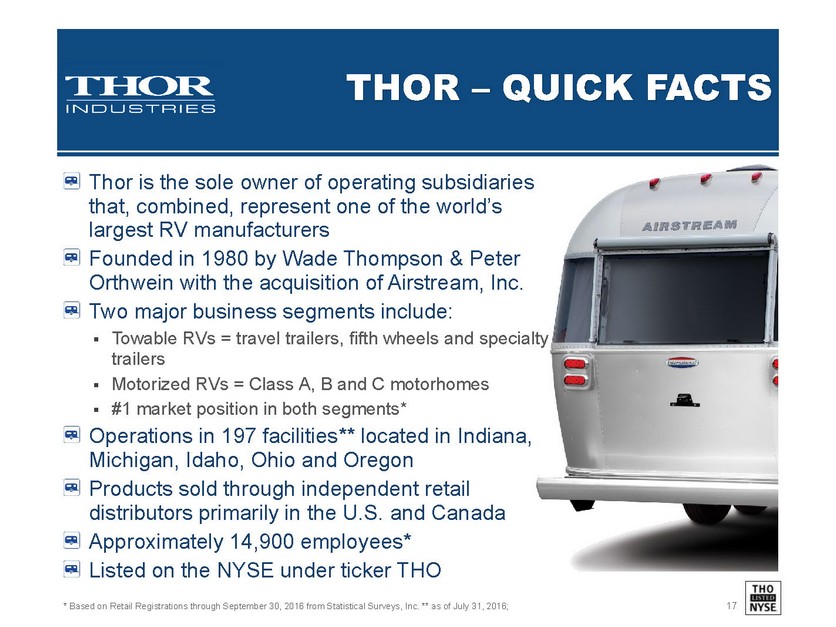
THO /Volumes/Clients/Thor Industries/Art/Photography/New Silos/USE THESE/Airstream.1.26.png THOR THOR – –QUICK FACTS QUICK FACTS Thor is the sole owner of operating subsidiaries that, combined, represent one of the world’s largest RV manufacturers Founded in 1980 by Wade Thompson & Peter Orthwein with the acquisition of Airstream, Inc. Two major business segments include: ..Towable RVs = travel trailers, fifth wheels and specialty trailers ..Motorized RVs = Class A, B and C motorhomes ..#1 market position in both segments* Operations in 197 facilities** located in Indiana, Michigan, Idaho, Ohio and Oregon Products sold through independent retail distributors primarily in the U.S. and Canada Approximately 14,900 employees* Listed on the NYSE under ticker THO * Based on Retail Registrations through September 30, 2016 from Statistical Surveys, Inc. ** as of July 31, 2016;
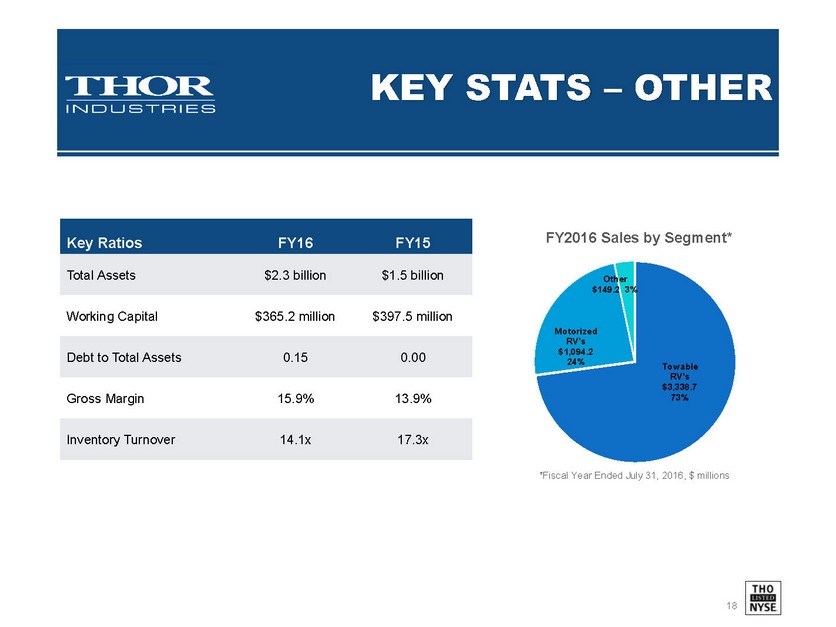
THO KEY STATS KEY STATS – –OTHER OTHER Key Ratios FY16 FY15 Total Assets $2.3 billion $1.5 billion Working Capital $365.2million $397.5 million Debtto Total Assets 0.15 0.00 Gross Margin 15.9% 13.9% InventoryTurnover 14.1x 17.3x Towable RV's$3,338.7 73% Motorized RV's$1,094.2 24% Other$149.2 3% FY2016 Sales by Segment* *Fiscal Year Ended July 31, 2016, $ millions
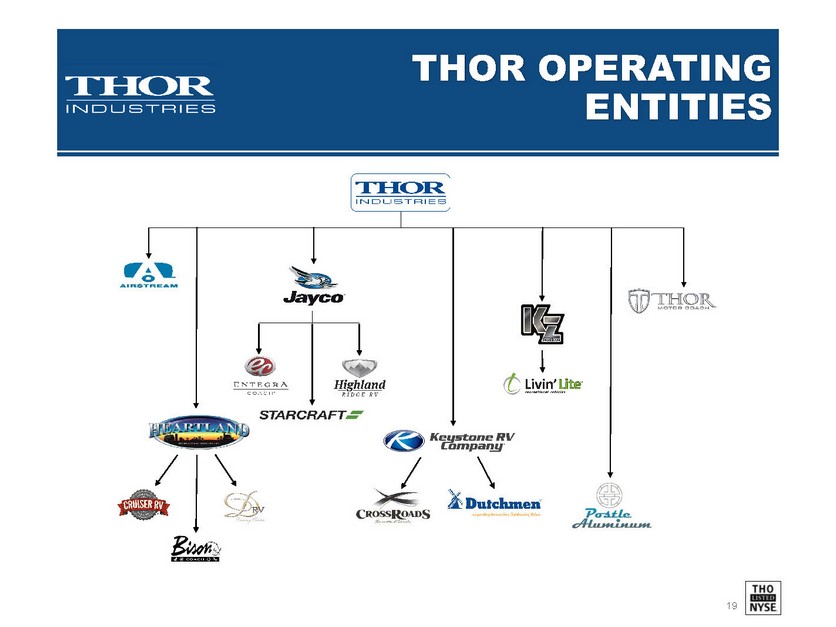
THO THOR OPERATING THOR OPERATING ENTITIES ENTITIES Airstream heartlandlogo_nobkgd Keystone-RV-Logo_nobkgd TMClogo_nobkgd CrossRoads Logo w Crossing Roads KZRV_Logo rec-logo-bison GrayRed-CRV-LOGO High Res DRV_Logo_Embossed Postle Aluminum Dutchmen_Logo_horizontal-2-color Jayco Logo - 3D COLOR Entegra Coach Color Highland Ridge Vertical Starcraft Logo COLOR New Livin Lite
THO THOR OVERVIEW THOR OVERVIEW What started as one RV company has grown into a family of subsidiaries that together make up one of the world’s largest RV manufacturers. Thor Industries is more than just strength in numbers; it’s strength in quality. Whether organically or through acquisition, we’ve grown through being selective, through finding those who pioneer, who deliver on their promises, and who make the best products and provide the best experiences. We choose the best.
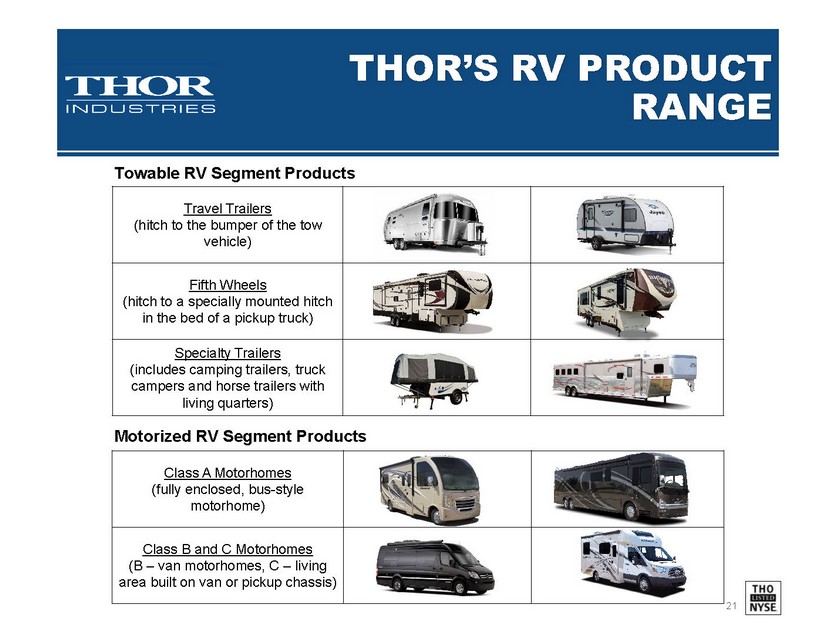
THO THOR’S RV PRODUCT THOR’S RV PRODUCT RANGE RANGE Travel Trailers (hitch to the bumper of the tow vehicle) Fifth Wheels (hitch to a speciallymounted hitch in the bed of a pickup truck) Specialty Trailers (includescamping trailers, truck campers and horse trailers with living quarters) Towable RV Segment Products Class A Motorhomes (fully enclosed, bus-style motorhome) Class B and C Motorhomes (B –van motorhomes, C –living area built on van or pickup chassis) Vegas RUV : Class A Motorhomes Motorized RV Segment Products
THOR We strive to provide RV consumers with superior products and services through innovative solutions which enhance the enjoyment of the RV lifestyle Our decentralized operating structure and independent operating subsidiaries foster an entrepreneurial spirit and an unending focus on the needs of the users of our products We make decisions based on the long-term success of our Company We focus primarily on assembly, not manufacturing –to be flexible and maintain profitability in a cyclical industry Strong balance sheet –we focus on strong cash flow, return on invested capital and leverage only when it makes sense Excellent relationships with dealers, lenders and consumers due to our financial strength enabling us to provide warranty and honor repurchase agreements WHAT MAKES WHAT MAKES THOR THORDIFFERENT DIFFERENT *Source: Statistical Surveys, Inc. U.S. and Canada through September 2016.
CORPORATE INTEGRITY CORPORATE INTEGRITY No golden parachutes No ‘pro forma’ earnings. We report net income, not adjusted earnings to cover up performance Consistent focus on shareholder value Simple compensation philosophy: ..Mainly cash compensation based on pre-tax income –a true pay-for- performance philosophy ..Restricted stock units also awarded based on performance to provide broader, long-term focus on overall Company results
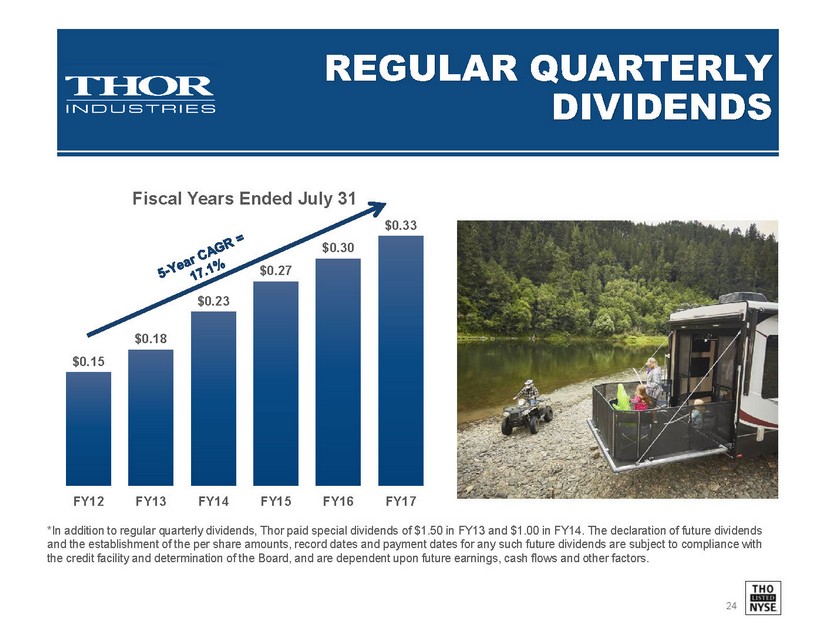
THO REGULAR QUARTERLY REGULAR QUARTERLY DIVIDENDS DIVIDENDS $0.15 $0.18 $0.23 $0.27 $0.30 $0.33 FY12 FY13 FY14 FY15 FY16 FY17 Fiscal Years Ended July 31 5 - Year CAGR = 17.1% *In addition to regular quarterly dividends, Thor paid special dividends of $1.50 in FY13 and $1.00 in FY14. The declaration of future dividends and the establishment of the per share amounts, record dates and payment dates for any such future dividends are subject to compliance with the credit facility and determination of the Board, and are dependent upon future earnings, cash flows and other factors.
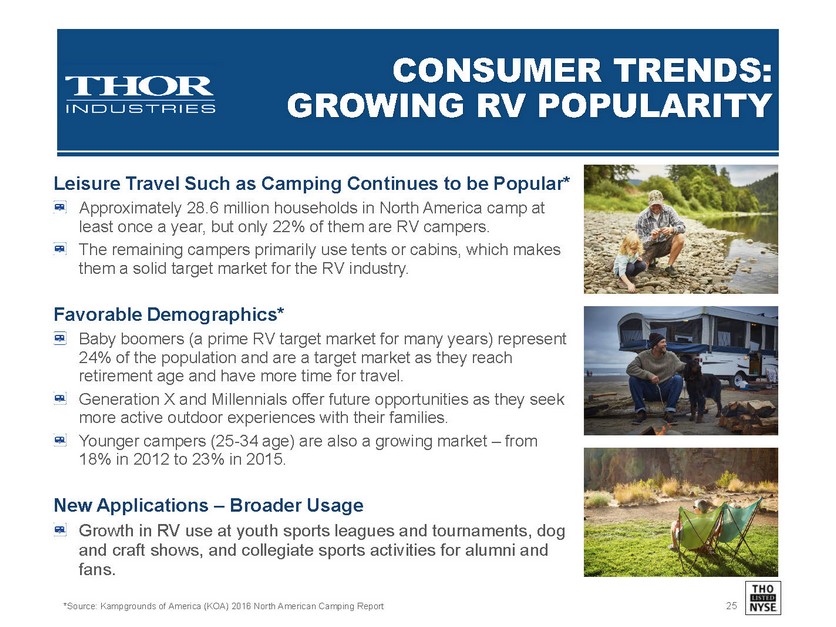
THO CONSUMER TRENDS: CONSUMER TRENDS: GROWING RV POPULARITY GROWING RV POPULARITY Leisure Travel Such as Camping Continues to be Popular* Approximately 28.6 million households in North America camp at least once a year, but only 22% of them are RV campers. The remaining campers primarily use tents or cabins, which makes them a solid target market for the RV industry. Favorable Demographics* Baby boomers (a prime RV target market for many years) represent 24% of the population and are a target market as they reach retirement age and have more time for travel. Generation X and Millennials offer future opportunities as they seek more active outdoor experiences with their families. Younger campers (25-34 age) are also a growing market –from 18% in 2012 to 23% in 2015. New Applications –Broader Usage Growth in RV use at youth sports leagues and tournaments, dog and craft shows, and collegiate sports activities for alumni and fans. *Source: Kampgrounds of America (KOA) 2016 North American Camping Report
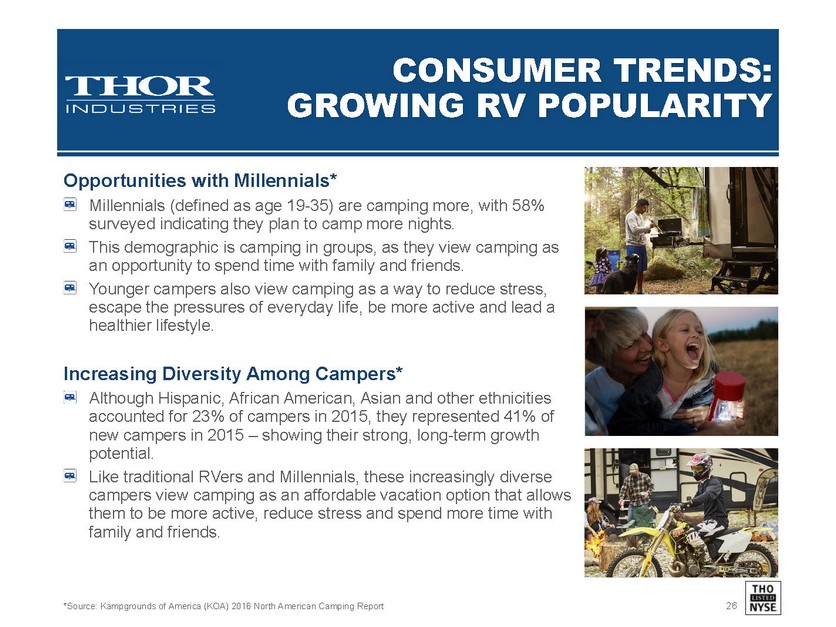
THO CONSUMER TRENDS: CONSUMER TRENDS: GROWING RV POPULARITY GROWING RV POPULARITY Opportunities with Millennials* Millennials (defined as age 19-35) are camping more, with 58% surveyed indicating they plan to camp more nights. This demographic is camping in groups, as they view camping as an opportunity to spend time with family and friends. Younger campers also view camping as a way to reduce stress, escape the pressures of everyday life, be more active and lead a healthier lifestyle. Increasing Diversity Among Campers* Although Hispanic, African American, Asian and other ethnicities accounted for 23% of campers in 2015, they represented 41% of new campers in 2015 –showing their strong, long-term growth potential. Like traditional RVers and Millennials, these increasingly diverse campers view camping as an affordable vacation option that allows them to be more active, reduce stress and spend more time with family and friends. *Source: Kampgrounds of America (KOA) 2016 North American Camping Report
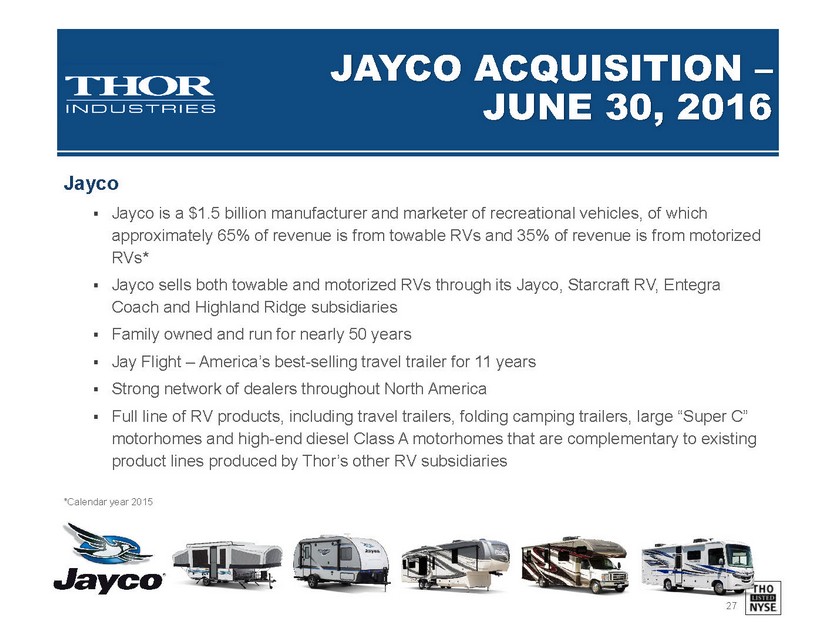
THO JAYCO ACQUISITION JAYCO ACQUISITION – – JUNE 30, 2016 JUNE 30, 2016 Jayco ..Jayco is a $1.5 billion manufacturer and marketer of recreational vehicles, of which approximately 65% of revenue is from towable RVs and 35% of revenue is from motorized RVs* ..Jayco sells both towable and motorized RVs through its Jayco, Starcraft RV, Entegra Coach and Highland Ridge subsidiaries ..Family owned and run for nearly 50 years ..Jay Flight –America’s best-selling travel trailer for 11 years ..Strong network of dealers throughout North America ..Full line of RV products, including travel trailers, folding camping trailers, large “Super C” motorhomes and high-end diesel Class A motorhomes that are complementary to existing product lines produced by Thor’s other RV subsidiaries *Calendar year 2015
THO JAYCO JAYCO – – STRATEGIC R STRATEGIC RATIONALE ATIONALE STRATEGIC FIT: Jayco has a strong cultural fit with Thor, including an entrepreneurial spirit, a focus on dealers and customers and a commitment to high quality products and innovation ACQUISITION FIT:Jayco meets Thor’s criteria of acquiring successful businesses with a desire to further their growth, paired with a strong management team that will remain in place to direct and achieve those growth goals with the support of Thor INDEPENDENCE:Under Thor’s successful decentralized model, Jayco will continue to operate independently, competing against outside RV manufacturers as well as other Thor subsidiaries LEADERSHIP:Existing experienced management team will remain with Jayco and continue to lead with a focus on growth and competition in the market
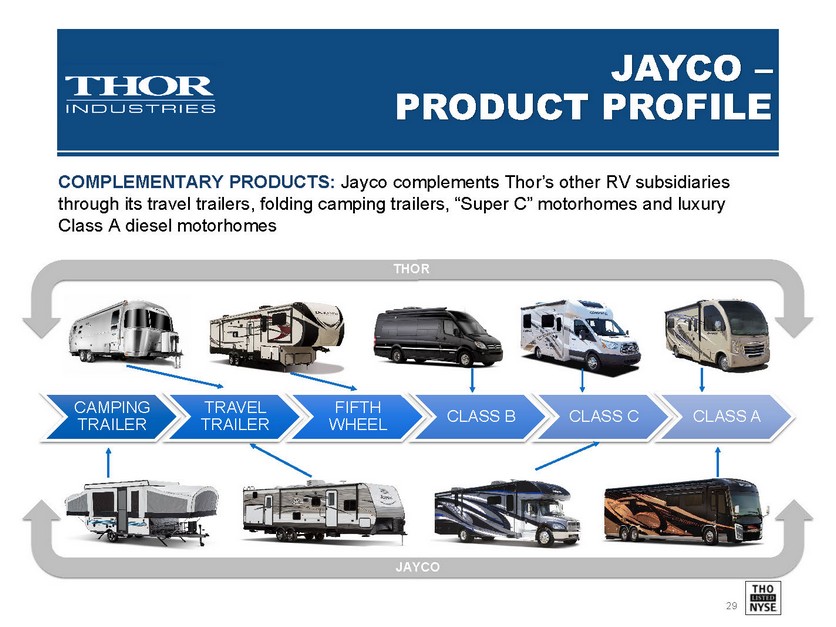
THO Vegas RUV : Class A Motorhomes COMPLEMENTARY PRODUCTS: Jayco complements Thor’s other RV subsidiaries through its travel trailers, folding camping trailers, “Super C” motorhomes and luxury Class A diesel motorhomes JAYCO JAYCO – – PRODUCT PRODUCT P PROFILE ROFILE CAMPING TRAILER TRAVEL TRAILER FIFTH WHEEL CLASS B CLASS C CLASS A THOR JAYCO
THO THOR FUNDAMENTALS THOR FUNDAMENTALS Profitable every year since our founding in 1980 ..36 years of continuous profitability We are primarily assemblers, not manufacturers Variable cost structure provides flexibility in cyclical industry An industry leader in innovation, product quality and customer service Strong market share in all main RV product categories ..Travel Trailers ..Fifth Wheels ..Motorhomes Solid balance sheet ..Consistent history of returning cash to shareholders Strong consumer, dealer and lender relationships Experienced management team ..Strong industry operators ..Track record of delivering value from acquisitions
THO Appendix 1: Appendix 1: Investor Investor Q&A
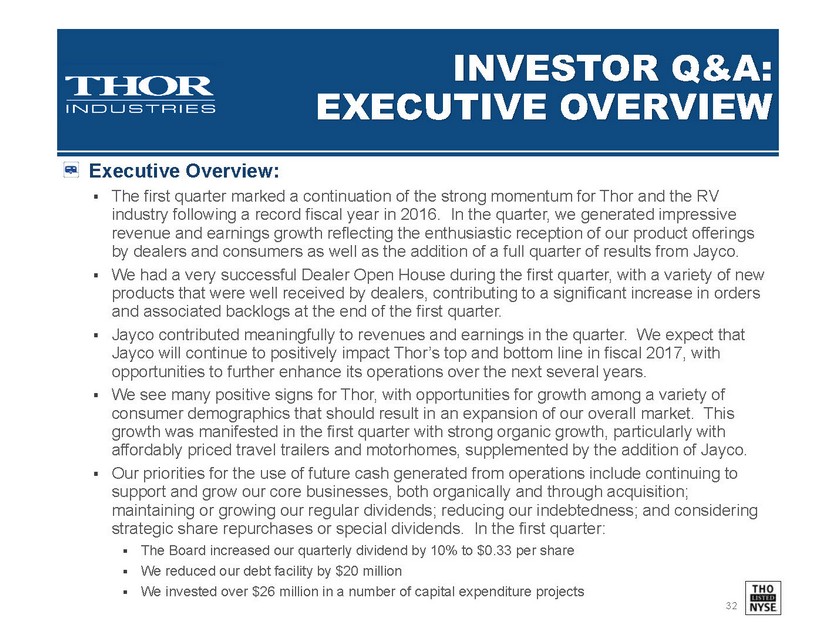
THOR INVESTOR Q&A: EXECUTIVE OVERVIEW EXECUTIVE OVERVIEW Executive Overview: ..The first quarter marked a continuation of the strong momentum for Thor and the RV industry following a record fiscal year in 2016. In the quarter, we generated impressive revenue and earnings growth reflecting the enthusiastic reception of our product offerings by dealers and consumers as well as the addition of a full quarter of results from Jayco. ..We had a very successful Dealer Open House during the first quarter, with a variety of new products that were well received by dealers, contributing to a significant increase in orders and associated backlogs at the end of the first quarter. ..Jayco contributed meaningfully to revenues and earnings in the quarter. We expect that Jayco will continue to positively impact Thor’s top and bottom line in fiscal 2017, with opportunities to further enhance its operations over the next several years. ..We see many positive signs for Thor, with opportunities for growth among a variety of consumer demographics that should result in an expansion of our overall market. This growth was manifested in the first quarter with strong organic growth, particularly with affordably priced travel trailers and motorhomes, supplemented by the addition of Jayco. ..Our priorities for the use of future cash generated from operations include continuing to support and grow our core businesses, both organically and through acquisition; maintaining or growing our regular dividends; reducing our indebtedness; and considering strategic share repurchases or special dividends. In the first quarter: ..The Board increased our quarterly dividend by 10% to $0.33 per share ..We reduced our debt facility by $20 million ..We invested over $26 million in a number of capital expenditure projects
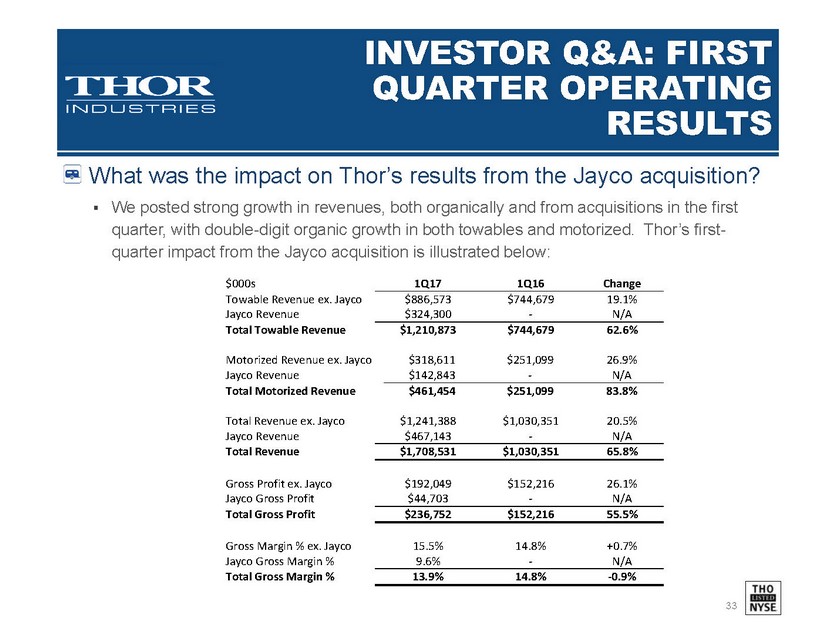
INVESTOR Q&A: FIRST FIRST QUARTER QUARTER OPERATING OPERATING RESULTS RESULTS What was the impact on Thor’s results from the Jayco acquisition? ..We posted strong growth in revenues, both organically and from acquisitions in the first quarter, with double-digit organic growth in both towables and motorized. Thor’s first- quarter impact from the Jayco acquisition is illustrated below: $000s 1Q17 1Q16 Change Towable Revenue ex. Jayco $886,573 $744,679 19.1% Jayco Revenue $324,300 - N/A Total Towable Revenue $1,210,873 $744,679 62.6% Motorized Revenue ex. Jayco $318,611 $251,099 26.9% Jayco Revenue $142,843 - N/A Total Motorized Revenue $461,454 $251,099 83.8% Total Revenue ex. Jayco $1,241,388 $1,030,351 20.5% Jayco Revenue $467,143 - N/A Total Revenue $1,708,531 $1,030,351 65.8% Gross Profit ex. Jayco $192,049 $152,216 26.1% Jayco Gross Profit $44,703 - N/A Total Gross Profit $236,752 $152,216 55.5% Gross Margin % ex. Jayco 15.5% 14.8% +0.7% Jayco Gross Margin % 9.6% - N/A Total Gross Margin % 13.9% 14.8% -0.9%
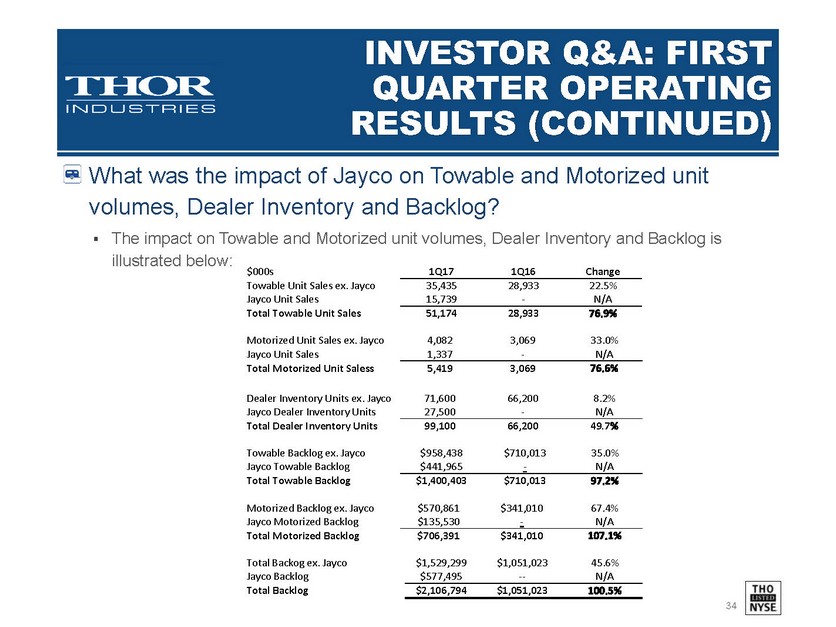
INVESTOR Q&A: FIRST FIRST QUARTER QUARTER OPERATING OPERATING RESULTS (CONTINUED) RESULTS (CONTINUED) What was the impact of Jayco on Towable and Motorized unit volumes, Dealer Inventory and Backlog? ..The impact on Towable and Motorized unit volumes, Dealer Inventory and Backlog is illustrated below: $000s 1Q17 1Q16 Change Towable Unit Sales ex. Jayco 35,435 28,933 22.5% Jayco Unit Sales 15,739 - N/A Total Towable Unit Sales 51,174 28,933 76.9% Motorized Unit Sales ex. Jayco 4,082 3,069 33.0% Jayco Unit Sales 1,337 - N/A Total Motorized Unit Saless 5,419 3,069 76.6% Dealer Inventory Units ex. Jayco 71,600 66,200 8.2% Jayco Dealer Inventory Units 27,500 - N/A Total Dealer Inventory Units 99,100 66,200 49.7% Towable Backlog ex. Jayco $958,438 $710,013 35.0% Jayco Towable Backlog $441,965 - N/A Total Towable Backlog $1,400,403 $710,013 97.2% Motorized Backlog ex. Jayco $570,861 $341,010 67.4% Jayco Motorized Backlog $135,530 - N/A Total Motorized Backlog $706,391 $341,010 107.1% Total Backog ex. Jayco $1,529,299 $1,051,023 45.6% Jayco Backlog $577,495 -- N/A Total Backlog $2,106,794 $1,051,023 100.5%
INVESTOR Q&A: FIRST FIRST QUARTER OPERATING QUARTER OPERATING RESULTS (CONTINUED) RESULTS (CONTINUED) What specific actions are you taking to improve Jayco’s gross margins? ..All of our subsidiaries are focused on continuous improvements in their operations, and Jayco’s management team shares that focus and drive. Over the near term, we expect to generate cost synergies in certain back-office functions, such as legal, insurance and employee benefits that will reduce costs. Over the longer term, Thor will act as a business and strategy resource to Jayco’s management team and will provide assistance in its mission to attain continuous improvement in all aspects of its operations. As a consequence, we expect Jayco’s cost structure to steadily improve. Our subsidiaries operate with great autonomy. Jayco’s management team recently implemented a restructuring of the Company that is designed to create greater leverage of talent and generate increased efficiencies throughout the various aspects of its operations. We expect that this will have a positive impact on its gross margins as management implements their plan Thor continues to report very strong sales and earnings growth, what is driving this performance? How does Thor’s performance compare to industry growth over the same period? ..Thor’s strong growth in the first quarter was driven by the addition of a full quarter of results from Jayco as well as strong acceptance of its towable and motorized products by consumers and dealers. With the recent release of industry data for October, our 22.5% organic growth in towable unit sales for the quarter was generally in line with industry growth while our 33.0% organic growth in motorized unit sales for the quarter materially surpassed industry growth.
INVESTOR Q&A: FIRST FIRST QUARTER OPERATING QUARTER OPERATING RESULTS (CONTINUED) RESULTS (CONTINUED) Backlog is up significantly, even absent the increase from the Jayco products. What’s driving the increase and do you have the capacity to fulfill demand? ..Backlogs have been driven up as a result of the positive reception by dealers and consumers to the products we have introduced over the past year, particularly the more affordably priced travel trailers and motorhomes, and industry growth. ..In alignment with our strategic plan, management has constantly focused on matching our capacity with the growing demand in our industry in a prudent manner that appreciates the realities of our industry. This process has resulted in a number of initiatives, including organic process improvements, realignment of existing facilities and acquisitions, all designed to increase our capacity. As we look ahead, we see continued growth in the demand for our products. Accordingly, for fiscal 2017, we have a number of planned production expansion projects both in process and anticipated. The process of evaluating our future production needs based on demand for our products is an ongoing one, and management will stay true to our strategic plan as it endeavors to best position Thor to seize the opportunities presented by the demand for our products and our growing market.
INVESTOR Q&A: FIRST FIRST QUARTER OPERATING QUARTER OPERATING RESULTS (CONTINUED) RESULTS (CONTINUED) What was the nature and amount of expenses recognized in the first quarter that were directly related to the Jayco acquisition? ..In the first quarter of fiscal 2017, we incurred purchase accounting adjustments related to the Jayco acquisition that reduced gross profit by approximately $2.6 million, of which $2.2 million was related to the motorized segment and $0.4 million was related to the towable segment. In addition, amortization in the first quarter relating to the Jayco acquisition was $12.9 million, which included $8.3 million associated with the remaining acquired backlog, as well as $4.6 million in amortization of dealer network and tradenames.
THOR INVESTOR Q&A: BALANCE SHEET AND CASH FLOW What payments did you make on the debt facility and what was the average interest rate for borrowings during the quarter? How much availability existed at October 31, 2016 under the line? ..During the quarter we paid the debt facility down by $20 million, which resulted in a remaining debt balance of $340 million as of October 31, 2016. Interest on borrowings under the credit facility is variable. During the first quarter of fiscal 2017, the weighted-average interest rate on borrowings was 2.11%. As of October 31, 2016, available and unused credit under the revolver was $157.8 million. What drove the decrease in cash flow from operating activities in the first quarter? ..Cash flow from operating activities decreased in the first three months of fiscal 2017 compared to the prior-year period due to the increases in net income and non-cash expenses being largely offset by changes in working capital, including a larger than usual seasonal increase in accounts receivable and a modest increase in inventory as well as reductions in accounts payable and accrued liabilities. As a result, cash provided by operations decreased from $18.9 million in the first quarter of fiscal 2016 to $1.3 million in fiscal 2017.
THOR INVESTOR Q&A: BALANCE SHEET AND CASH FLOW (CONTINUED) What drove the significant increase in Accounts Receivable in the first quarter? ..The $86.4 million increase in accounts receivable was driven by the significant increase in sales during the quarter as well as the timing of sales near the end of the quarter. What are your priorities for future cash utilization? ..Our priorities haven’t changed. We strive to maintain adequate cash balances to ensure we have sufficient resources to respond to opportunities and changing business conditions within the RV industry. We will use current and future available cash generated from operations to support and grow our core businesses, both organically and through acquisitions, maintain and grow our regular dividends over time, and reduce indebtedness. Strategic share repurchases or special dividends as determined by the Board of Directors will also continue to be considered. ..In addition to the reduction in indebtedness of $20 million during the quarter, we also increased our quarterly dividend from $0.30 per share to $0.33 per share and invested over $26 million in capital projects in support of our core businesses.
THOR INVESTOR Q&A: MARKET CONDITIONS Are you seeing any signs of slowing in the market? ..No, at this point we are seeing continued strong demand in the market as new consumers continue to pursue the RV lifestyle. This is confirmed by the strong growth we’ve seen in our backlogs as well as the continued growth in retail sales through the first nine months of the year. Describe the current competitive environment, is there much discounting going on? ..The RV industry is always competitive, as our subsidiaries and our outside competitors continue to drive the industry forward with new and better products for dealers and consumers. However, given the industry-wide capacity limitations on certain products, most notably towable RVs, we have seen less traditional discounting pressure overall in the market than we did several years ago.
THOR INVESTOR Q&A: MARKET CONDITIONS (CONTINUED) What is the nature of the current Dealer and Consumer credit environment? ..The wholesale lending environment remains healthy, with normal credit line utilization and continued discipline among lenders concerning curtailments. Consumer credit is available and lending standards also appear healthy. What is the health and status of the dealer body? ..We maintain close relationships with our dealers, and the current health of the dealer base is generally very strong. Overall, dealers have reacted favorably to our new products, our efforts to increase capacity as well as our recent acquisition of Jayco, supporting the strong, cooperative connections we have with our dealers.
THOR INVESTOR Q&A: MARKET CONDITIONS (CONTINUED) What is the long-term outlook for industry growth? ..Currently the RVIA is forecasting 8.3% unit growth for the industry in calendar 2016, with an additional 1.4% growth in industry unit volumes in calendar 2017. Given current industry shipment trends through September, which indicate industry growth of 13.8% through the first nine months of 2016, RVIA will likely be updating their forecasts. What has been the impact of younger consumers coming into the RV market? Are there any studies or statistics that you can point to that show the potential impact of Millennials on the RV industry? ..According to RVIA, the 35-54 age demographic has been the fastest growing age group in the industry for the past 10 years. In addition, we have heard ample anecdotal evidence of younger consumers entering the industry from our extensive dealer base. Over the past two years, we have received consistent feedback from dealers that younger families have been coming into the industry and buying more affordably priced travel trailers and motorhomes.
THOR INVESTOR Q&A: MARKET CONDITIONS (CONTINUED) What is the current state of the Canadian RV market? ..The Canadian market remains challenging as the weakness in the value of the Canadian dollar relative to the U.S. dollar continues. Since we sell our products to Canadian dealers priced in U.S. dollars, this creates an upward pressure on prices in the local currency which has an adverse impact on demand. For calendar year 2015, total Canadian retail registrations as reported by Statistical Surveys, Inc. fell 12.9% from calendar 2014. Through September 2016, total Canadian retail registrations as reported by Statistical Surveys, Inc., continued to fall, with towables decreasing 13.8% and motorized registrations decreasing 8.5% -resulting in a total decrease of 13.5%.
THOR INVESTOR Q&A: MARKET CONDITIONS (CONTINUED) How does consolidation within the dealer base impact Thor? ..Consolidation within the dealer base, as well as expansion of dealers with new locations, can be a positive for Thor as dealers value partnering with strong manufacturers like Thor on their long-term growth initiatives. Consolidation may also present some challenges to us as larger dealers generally account for higher sales volume and thus may exercise more pricing power within the overall marketplace. This pricing power is balanced to a certain extent by our ability to provide the larger unit volumes on a timely basis. Our industry is defined by competition for dealers and, with or without dealer consolidation, that competition will continue. What is the current status of the labor market in Northern Indiana? ..Labor markets remain tight and competitive in Northern Indiana, but labor costs have generally been stable over the past year.
THOR INVESTOR Q&A: MARKET CONDITIONS (CONTINUED) How do used RVs impact the demand and pricing for new products? ..Robust demand for used RV inventory enhances trade-in values, which is necessary to support the new RV market where many consumers choose to purchase new units every 3-5 years. In recent years, availability of used RV inventory has been limited while new products at the entry level have been priced competitively, leading consumers to buy new products. We do recognize that as an alternative to new RVs, low prices on used products may prompt consumers to buy used instead of new. Overall, we view a healthy used RV market as a positive impact on the overall RV industry.
THOR INVESTOR Q&A: OUTLOOK What is your outlook for the remainder of fiscal year 2017? ..Currently, we see continued growth in our industry as consumers remain fairly optimistic about future economic conditions and we continue to see new consumers entering the RV market. With the addition of Jayco for the full year, we expect a strong contribution to sales and earnings from Jayco’s operations. As a result, we continue to expect double-digit growth in revenues and improvements in earnings throughout fiscal 2017. With record sales for the quarter and a positive future outlook, are you operating at full capacity? What actions are you taking to increase capacity and minimize capacity constraints? ..For certain product categories, we are very near our capacity, which is why we have been adding capacity over the past few years. Our approach to adding capacity is dynamic, as we seek to address production needs in a variety of ways, from enhancing production processes to increase the capacity of existing production facilities, to adding additional production lines or realigning existing production facilities, to building new production facilities. In each case, we strive to balance the need to meet the demand in the market for our products with the need to invest our capital wisely. During the quarter, we added facilities or production lines at Dutchmen, Heartland, Highland Ridge, Jayco, and Thor Motor Coach, and we are evaluating additional projects to increase capacity over the remainder of fiscal 2017.
THOR INVESTOR Q&A: OUTLOOK (CONTINUED) What is the current status of your efforts to meet the demand for RVs in the West Coast markets? ..Demand for product on the West Coast remains strong, and we see additional opportunities for growth in the West Coast markets, particularly in California and the Pacific Northwest. Currently, we have production facilities in Pendleton, Oregon, Nampa, Idaho and Twin Falls, Idaho and have announced plans to increase capacity at Heartland’s Nampa, Idaho facility, with the second production line expected to begin operation during the second quarter of fiscal 2017. We will continue to evaluate demand and capacity availability at our West Coast production facilities to determine the best long-term solutions for our dealers and consumers on the West Coast. When looking to add capacity, what metrics do you look at to determine if it’s a wise investment? ..Unlike other, more capital intensive industries, RV production facilities are typically smaller, between 70,000 and 90,000 square feet, with an average cost in the range of $3 million to $6 million. With this modest investment, we review a number of return metrics, with a focus on achieving a rapid payback on the investment which enhances return on invested capital. In addition, we typically build plants with a degree of flexibility so we can shift production to a variety of products depending on demand fundamentals. This flexibility further enhances the investment profile of new production facilities.
THOR INVESTOR Q&A: OUTLOOK (CONTINUED) With all your current capacity additions, do you expect the startup of production to have an adverse impact on margins? ..Although we usually experience costs associated with the startup of production in new or expanded facilities, it is important to understand that the impact of such costs depends on the relative size of the expansion and the complexity of the production involved. Generally, the startup of new or expanded towable facilities happens more quickly than the startup of motorized facilities, with lower initial costs. Over the past year, we have expanded a number of plants and started up new plants and their impact on our margins was not material.
THOR INVESTOR Q&A: OUTLOOK (CONTINUED) Thor has continued to grow revenues since the recession. Has Thor reached its peak? ..We do not believe either Thor or the RV Industry has reached a peak. RVIA continues to forecast strong growth in industry wholesale shipments for calendar 2016 of more than 8%, with even higher totals forecast for calendar 2017. We see many positive indicators to continued growth for both the RV industry as a whole and Thor specifically. Among the factors driving our optimism for continued growth: ..Demographic trends, including: ..younger consumers entering the market sooner than prior generations ..an increase in the number of people entering the age brackets that historically have accounting for the bulk of retail sales ..increasing diversity among campers ..Changes in how consumers desire to spend their free time -with a much stronger desire to spend time with their friends and families enjoying the wide-array of destinations available throughout North America, tailgating, or attending other activity based events ..Forecasted economic stability –relatively low inflation, interest rates and fuel prices along with continued job and wage growth and strong, steady consumer confidence rates are expected to continue to fuel demand for RVs ..Thor’s financial strength –we have a strong balance sheet to fund organic growth, a history of solid cash flow, availability under our credit facility and a track record of being successful, opportunistic acquirers. We believe Thor will continue to capitalize on opportunities to grow in a strategically sound way
THOR INVESTOR Q&A: OUTLOOK (CONTINUED) Given this is the longest expansion in the RV industry in history, what gives you confidence that it will continue? ..Unlike many of the expansions we’ve experienced over the past two decades, the current expansion has been driven largely by newer consumers entering the RV lifestyle with a trend toward more affordably priced segments of the market, including travel trailers, Gas Class A and Class C motorhomes. We view such a shift in the market to be more sustainable over the long term. What are your views on RV industry consolidation? ..Consolidation in our industry does not threaten the competitive environment as years of consolidation have evidenced. In fact, it tends to benefit the industry by heightening the competitive landscape and broadens the customer base by driving innovation and attracting more individuals to the RV lifestyle, all to the benefit of the retail customers. Therefore, even with more consolidation, we are confident that the competitive environment that drives innovation and improved product offerings throughout our industry will continue. In addition, we have seen a number of new or returning entrants to the RV manufacturer base since the recession as well.
THOR INVESTOR Q&A: OUTLOOK (CONTINUED) What is your strategic plan for future acquisitions? Given that there are fewer RV manufacturers as potential targets, are you targeting other adjacent industries? Suppliers? ..We will continue to evaluate acquisitions as we have done in the past. We will continue to be an opportunistic acquirer, and as potential acquisitions arise, we will evaluate them based on their strategic fit within Thor.
THOR Appendix 2: Financial and Market Data
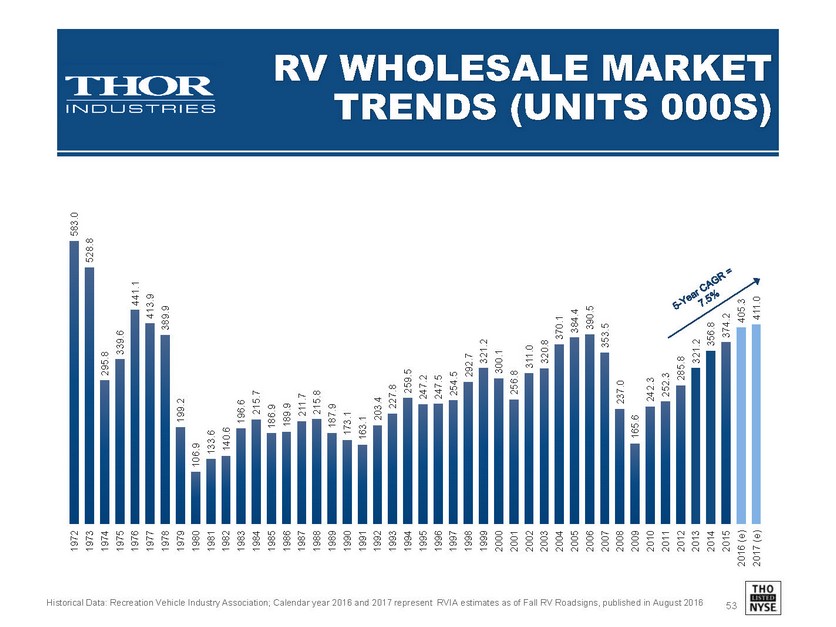
THOR RV WHOLESALE MARKET TRENDS (UNITS 000S) 583.0 528.8 295.8 339.6 441.1 413.9 389.9 199.2 106.9 133.6 140.6 196.6 215.7 186.9 189.9 211.7 215.8 187.9 173.1 163.1 203.4 227.8 259.5 247.2 247.5 254.5 292.7 321.2 300.1 256.8 311.0 320.8 370.1 384.4 390.5 353.5 237.0 165.6 242.3 252.3 285.8 321.2 356.8 374.2 405.3 411.0 1972 1973 1974 1975 1976 1977 1978 1979 1980 1981 1982 1983 1984 1985 1986 1987 1988 1989 1990 1991 1992 1993 1994 1995 1996 1997 1998 1999 2000 2001 2002 2003 2004 2005 2006 2007 2008 2009 2010 2011 2012 2013 2014 2015 2016 (e) 2017 (e) 5 - Year CAGR = 7.5% Historical Data: Recreation Vehicle Industry Association; Calendar year 2016 and 2017 represent RVIA estimates as of Fall RV Roadsigns, published in August 2016
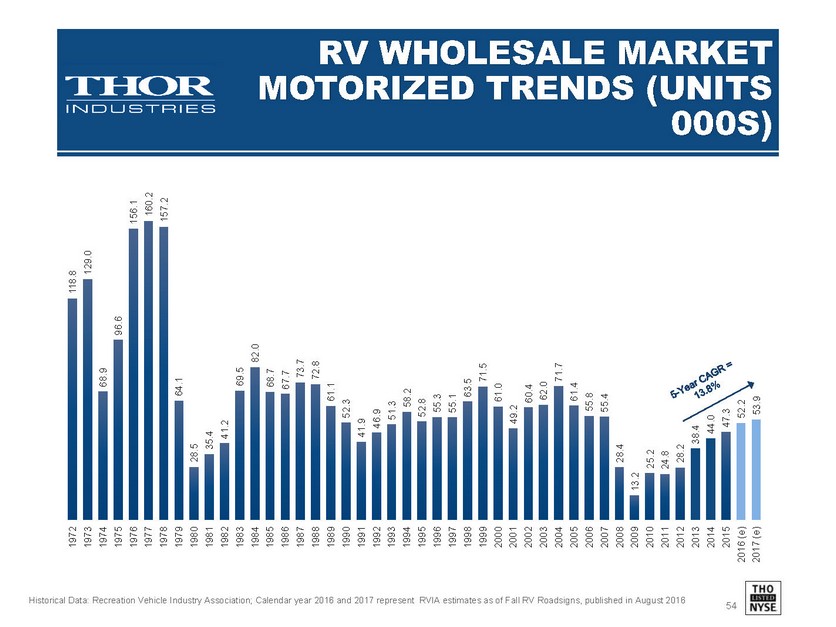
THOR RV WHOLESALE MARKET MOTORIZED TRENDS (UNITS 000S) 118.8 129.0 68.9 96.6 156.1 160.2 157.2 64.1 28.5 35.4 41.2 69.5 82.0 68.7 67.7 73.7 72.8 61.1 52.3 41.9 46.9 51.3 58.2 52.8 55.3 55.1 63.5 71.5 61.0 49.2 60.4 62.0 71.7 61.4 55.8 55.4 28.4 13.2 25.2 24.8 28.2 38.4 44.0 47.3 52.2 53.9 1972 1973 1974 1975 1976 1977 1978 1979 1980 1981 1982 1983 1984 1985 1986 1987 1988 1989 1990 1991 1992 1993 1994 1995 1996 1997 1998 1999 2000 2001 2002 2003 2004 2005 2006 2007 2008 2009 2010 2011 2012 2013 2014 2015 2016 (e) 2017 (e) 5 - Year CAGR = 13.8% Historical Data: Recreation Vehicle Industry Association; Calendar year 2016 and 2017 represent RVIA estimates as of Fall RV Roadsigns, published in August 2016
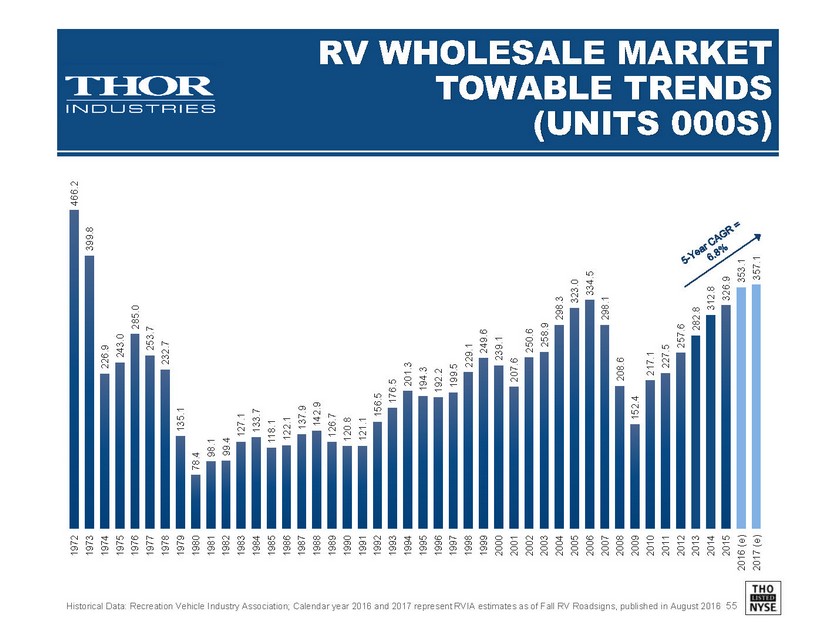
THOR RV WHOLESALE MARKET TOWABLE TRENDS (UNITS 000S) (UNITS 000S) 466.2 399.8 226.9 243.0 285.0 253.7 232.7 135.1 78.4 98.1 99.4 127.1 133.7 118.1 122.1 137.9 142.9 126.7 120.8 121.1 156.5 176.5 201.3 194.3 192.2 199.5 229.1 249.6 239.1 207.6 250.6 258.9 298.3 323.0 334.5 298.1 208.6 152.4 217.1 227.5 257.6 282.8 312.8 326.9 353.1 357.1 1972 1973 1974 1975 1976 1977 1978 1979 1980 1981 1982 1983 1984 1985 1986 1987 1988 1989 1990 1991 1992 1993 1994 1995 1996 1997 1998 1999 2000 2001 2002 2003 2004 2005 2006 2007 2008 2009 2010 2011 2012 2013 2014 2015 2016 (e) 2017 (e) 5 - Year CAGR = 6.8% Historical Data: Recreation Vehicle Industry Association;Calendar year 2016 and 2017 represent RVIA estimates as of Fall RV Roadsigns, published in August 2016
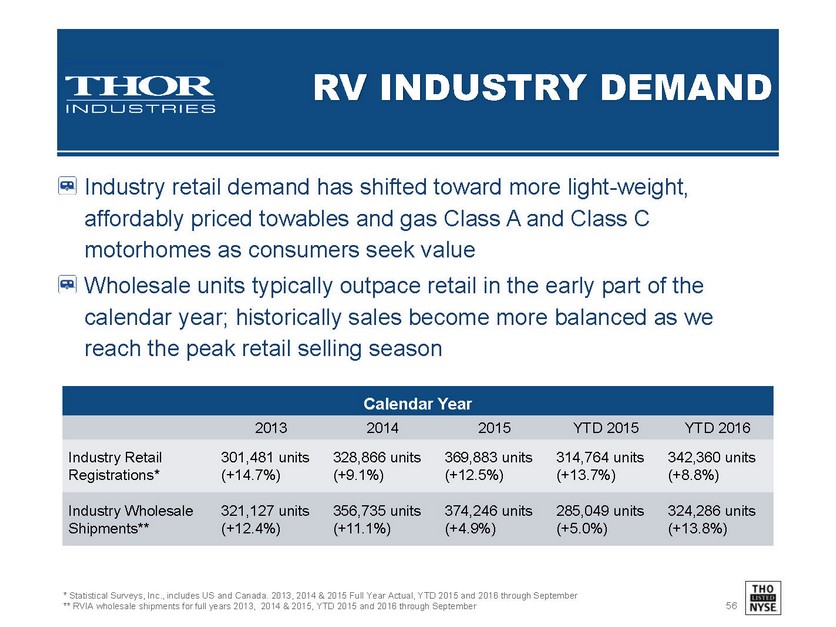
THOR RV INDUSTRY DEMAND Industry retail demand has shifted toward more light-weight, affordably priced towables and gas Class A and Class C motorhomes as consumers seek value Wholesale units typically outpace retail in the early part of the calendar year; historically sales become more balanced as we reach the peak retail selling season Calendar Year 2013 2014 2015 YTD 2015 YTD 2016 IndustryRetail Registrations* 301,481 units (+14.7%) 328,866 units (+9.1%) 369,883 units (+12.5%) 314,764 units (+13.7%) 342,360 units (+8.8%) Industry Wholesale Shipments** 321,127 units (+12.4%) 356,735 units (+11.1%) 374,246 units (+4.9%) 285,049 units (+5.0%) 324,286 units (+13.8%) * Statistical Surveys, Inc., includes US and Canada. 2013, 2014 & 2015 Full Year Actual, YTD 2015 and 2016 through September ** RVIA wholesale shipments for full years 2013, 2014 & 2015, YTD 2015 and 2016 through September
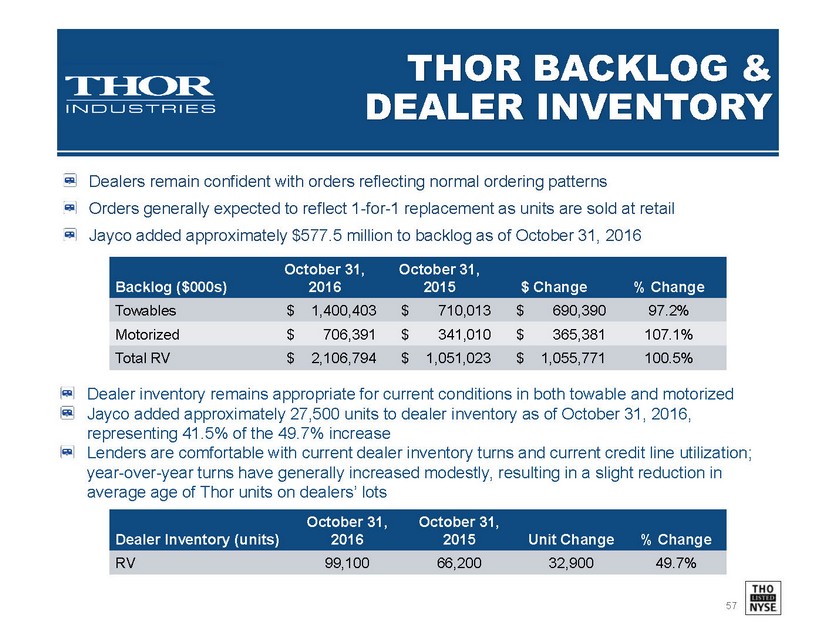
THOR BACKLOG & DEALER INVENTORY Dealers remain confident with orders reflecting normal ordering patterns Orders generally expected to reflect 1-for-1 replacement as units are sold at retail Jayco added approximately $577.5 million to backlog as of October 31, 2016 Backlog ($000s) October 31, 2016 October31, 2015 $ Change % Change Towables $ 1,400,403 $ 710,013 $ 690,390 97.2% Motorized $ 706,391 $ 341,010 $ 365,381 107.1% Total RV $ 2,106,794 $ 1,051,023 $ 1,055,771 100.5% Dealer inventory remains appropriate for current conditions in both towable and motorized Jayco added approximately 27,500 units to dealer inventory as of October 31, 2016, representing 41.5% of the 49.7% increase Lenders are comfortable with current dealer inventory turns and current credit line utilization; year-over-year turns have generally increased modestly, resulting in a slight reduction in average age of Thor units on dealers’ lots Dealer Inventory (units) October31, 2016 October 31, 2015 Unit Change % Change RV 99,100 66,200 32,900 49.7%
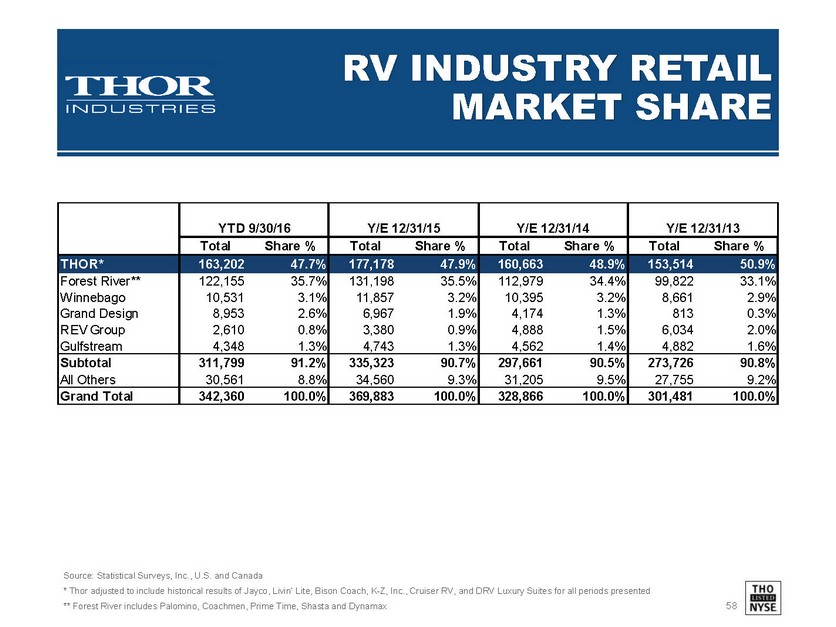
THOR RV INDUSTRY RETAIL MARKET SHARE TotalShare %TotalShare %TotalShare %TotalShare % THOR*163,202 47.7%177,178 47.9%160,663 48.9%153,514 50.9% Forest River**122,155 35.7%131,198 35.5%112,979 34.4%99,822 33.1% Winnebago10,531 3.1%11,857 3.2%10,395 3.2%8,661 2.9% Grand Design8,953 2.6%6,967 1.9%4,174 1.3%813 0.3% REV Group2,610 0.8%3,380 0.9%4,888 1.5%6,034 2.0% Gulfstream4,348 1.3%4,743 1.3%4,562 1.4%4,882 1.6% Subtotal311,799 91.2%335,323 90.7%297,661 90.5%273,726 90.8% All Others30,561 8.8%34,560 9.3%31,205 9.5%27,755 9.2% Grand Total342,360 100.0%369,883 100.0%328,866 100.0%301,481 100.0% Y/E 12/31/15Y/E 12/31/14Y/E 12/31/13YTD 9/30/16 Source: Statistical Surveys, Inc., U.S. and Canada * Thor adjusted to include historical results of Jayco, Livin’ Lite, Bison Coach, K-Z, Inc., Cruiser RV, and DRV Luxury Suites for all periods presented ** Forest River includes Palomino, Coachmen, Prime Time, Shasta and Dynamax
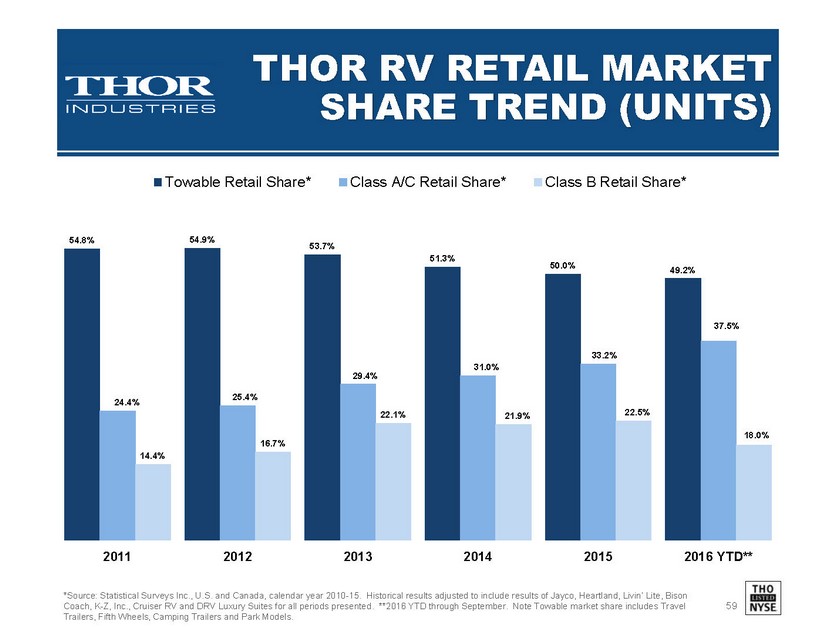
THOR RV RETAIL MARKET TREND (UNITS) 54.8% 54.9% 53.7% 51.3% 50.0% 49.2% 24.4% 25.4% 29.4% 31.0% 33.2% 37.5% 14.4% 16.7% 22.1% 21.9% 22.5% 18.0% 2011 2012 2013 2014 2015 2016 YTD** Towable Retail Share* Class A/C Retail Share* Class B Retail Share* *Source: Statistical Surveys Inc., U.S. and Canada, calendar year 2010-15. Historical results adjusted to include results of Jayco, Heartland, Livin’ Lite, Bison Coach, K-Z, Inc., Cruiser RV and DRV Luxury Suites for all periods presented. **2016 YTD through September. Note Towable market share includes Travel Trailers, Fifth Wheels, Camping Trailers and Park Models.
THOR www.thorindustries.com