Exhibit 99.2

www.thorindustries.com THOR INDUSTRIES THIRD QUARTER OF FISCAL 2022 FINANCIAL RESULTS
FORWARD - LOOKING STATEMENTS This presentation includes certain statements that are “forward - looking” statements within the meaning of the U . S . Private Securities Litigation Reform Act of 1995 , Section 27 A of the Securities Act of 1933 , as amended, and Section 21 E of the Securities Exchange Act of 1934 , as amended . These forward - looking statements are made based on management’s current expectations and beliefs regarding future and anticipated developments and their effects upon THOR, and inherently involve uncertainties and risks . These forward - looking statements are not a guarantee of future performance . We cannot assure you that actual results will not differ materially from our expectations . Factors which could cause materially different results include, among others : the impact of inflation on the cost of our products as well as on general consumer demand ; the effect of raw material and commodity price fluctuations, and/or raw material, commodity or chassis supply constraints ; the impact of war, military conflict, terrorism and/or cyber - attacks, including state - sponsored attacks ; the impact of sudden or significant adverse changes in the cost and/or availability of energy or fuel, including those caused by geopolitical events, on our costs of operation, on raw material prices, on our independent dealers or on retail customers ; the dependence on a small group of suppliers for certain components used in production, including chassis ; interest rate fluctuations and their potential impact on the general economy and, specifically, on our profitability and on our independent dealers and consumers ; the extent and impact from the continuation of the COVID - 19 pandemic, along with the responses to contain the spread of the virus, or its variants, by various governmental entities or other actors, which may have negative effects on retail customer demand, our independent dealers, our supply chain, our labor force, our production or other aspects of our business ; the ability to ramp production up or down quickly in response to rapid changes in demand while also managing costs and market share ; the level and magnitude of warranty and recall claims incurred ; the ability of our suppliers to financially support any defects in their products ; legislative, regulatory and tax law and/or policy developments including their potential impact on our independent dealers, retail customers or on our suppliers ; the costs of compliance with governmental regulation ; the impact of an adverse outcome or conclusion related to current or future litigation or regulatory investigations ; public perception of and the costs related to environmental, social and governance matters ; legal and compliance issues including those that may arise in conjunction with recently completed transactions ; lower consumer confidence and the level of discretionary consumer spending ; the impact of exchange rate fluctuations ; restrictive lending practices which could negatively impact our independent dealers and/or retail consumers ; management changes ; the success of new and existing products and services ; the ability to maintain strong brands and develop innovative products that meet consumer demands ; the ability to efficiently utilize existing production facilities ; changes in consumer preferences ; the risks associated with acquisitions, including : the pace and successful closing of an acquisition, the integration and financial impact thereof, the level of achievement of anticipated operating synergies from acquisitions, the potential for unknown or understated liabilities related to acquisitions, the potential loss of existing customers of acquisitions and our ability to retain key management personnel of acquired companies ; a shortage of necessary personnel for production and increasing labor costs to attract production personnel in times of high demand ; the loss or reduction of sales to key independent dealers ; disruption of the delivery of units to independent dealers ; increasing costs for freight and transportation ; asset impairment charges ; competition ; the impact of potential losses under repurchase agreements ; the potential impact of the strength of the U . S . dollar on international demand for products priced in U . S . dollars ; general economic, market and political conditions in the various countries in which our products are produced and/or sold ; the impact of changing emissions and other related climate change regulations in the various jurisdictions in which our products are produced, used and/or sold ; changes to our investment and capital allocation strategies or other facets of our strategic plan ; and changes in market liquidity conditions, credit ratings and other factors that may impact our access to future funding and the cost of debt . These and other risks and uncertainties are discussed more fully in our Quarterly Report on Form 10 - Q for the quarter ended April 30 , 2022 and in Item 1 A of our Annual Report on Form 10 - K for the year ended July 31 , 2021 . We disclaim any obligation or undertaking to disseminate any updates or revisions to any forward - looking statements contained in this presentation or to reflect any change in our expectations after the date hereof or any change in events, conditions or circumstances on which any statement is based, except as required by law . 2
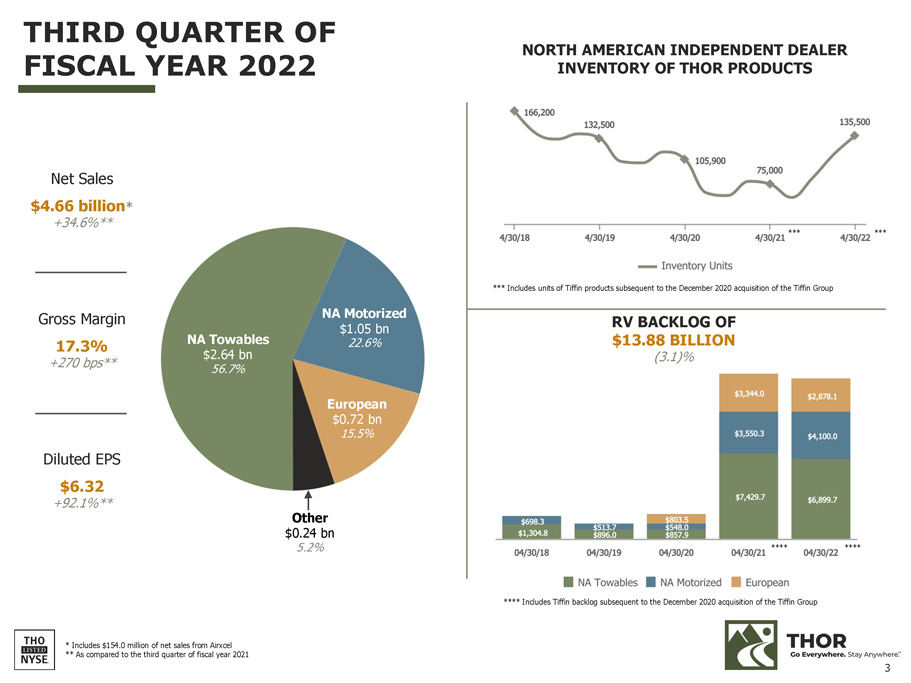
European $0.72 bn 15.5% NA Motorized $1.05 bn 22.6% NA Towables $2.64 bn 56.7% Other $0.24 bn 5.2% NORTH AMERICAN INDEPENDENT DEALER INVENTORY OF THOR PRODUCTS RV BACKLOG OF $13.88 BILLION (3.1)% * Includes $154.0 million of net sales from Airxcel ** As compared to the third quarter of fiscal year 2021 THIRD QUARTER OF FISCAL YEAR 2022 Gross Margin 17.3% +270 bps** Diluted EPS $6.32 +92.1%** Net Sales $4.66 billion * +34.6%** *** Includes units of Tiffin products subsequent to the December 2020 acquisition of the Tiffin Group 3 **** Includes Tiffin backlog subsequent to the December 2020 acquisition of the Tiffin Group *** *** **** ****
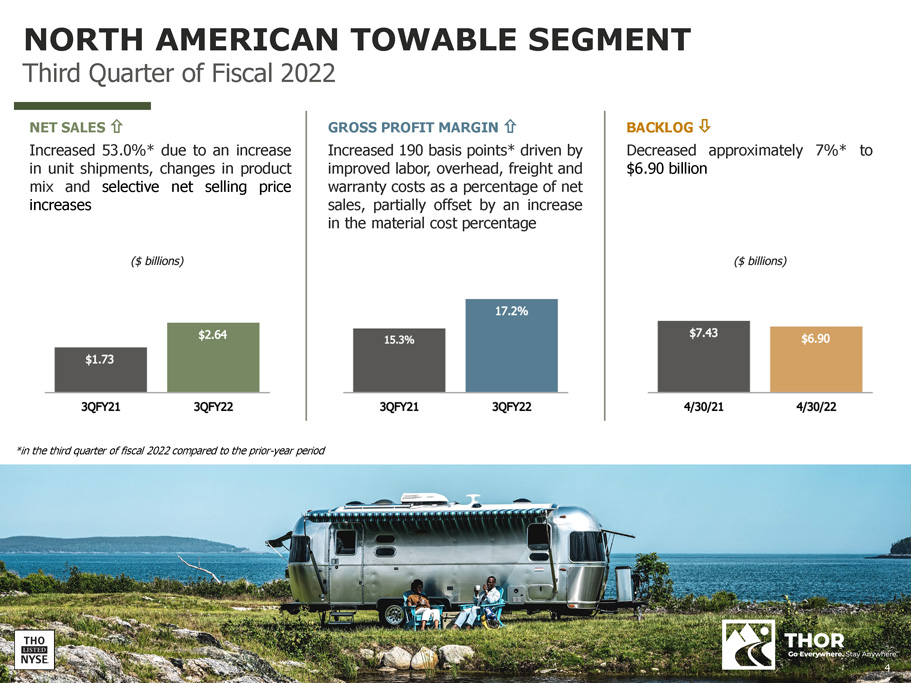
NET SALES Increased 53 . 0 % * due to an increase in unit shipments, changes in product mix and selective net selling price increases GROSS PROFIT MARGIN Increased 190 basis points* driven by improved labor, overhead, freight and warranty costs as a percentage of net sales, partially offset by an increase in the material cost percentage BACKLOG Decreased approximately $6.90 billion 7%* to NORTH AMERICAN TOWABLE SEGMENT Third Quarter of Fiscal 2022 *in the third quarter of fiscal 2022 compared to the prior - year period 4
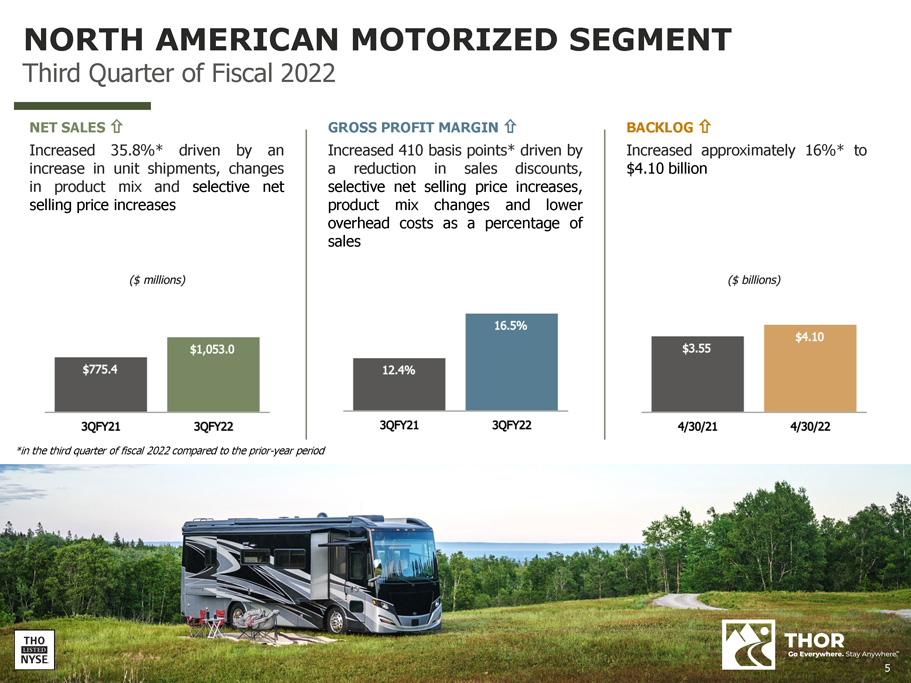
NET SALES Increased 35.8%* driven by an increase in unit shipments, changes in product mix and selective net selling price increases GROSS PROFIT MARGIN Increased 410 basis points* driven by a reduction in sales discounts, selective net selling price increases, product mix changes and lower overhead costs as a percentage of sales BACKLOG Increased approximately 16%* to $4.10 billion NORTH AMERICAN MOTORIZED SEGMENT Third Quarter of Fiscal 2022 *in the third quarter of fiscal 2022 compared to the prior - year period 5

NET SALES Decreased 19 . 0 % * driven by a 12 . 5 % decrease in unit shipments and a decrease in foreign exchange rates Net sales decreased 12 . 2 % on a constant - currency basis GROSS PROFIT MARGIN Increased by 40 basis points* due to improved labor and warranty costs, partially offset by higher overhead costs as a percentage of sales BACKLOG THOR’s European RV backlog decreased approximately 14 % * to $ 2 . 88 billion primarily due to a decrease in foreign exchange rates EUROPEAN SEGMENT Third Quarter of Fiscal 2022 *in the third quarter of fiscal 2022 compared to the prior - year period 6

APPENDIX
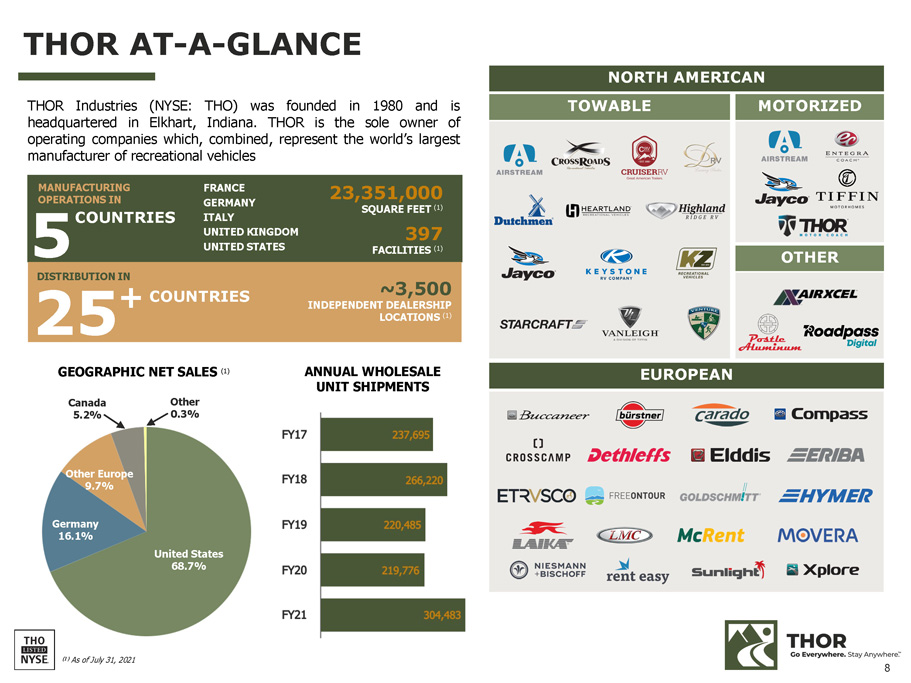
THOR AT - A - GLANCE 5 COUNTRIES 25 + COUNTRIES MANUFACTURING OPERATIONS IN DISTRIBUTION IN (1) As of July 31, 2021 GEOGRAPHIC NET SALES (1) THOR Industries (NYSE : THO) was founded in 1980 and is headquartered in Elkhart, Indiana . THOR is the sole owner of operating companies which, combined, represent the world’s largest manufacturer of recreational vehicles Other Europe 9.7% Germany 16.1% United States 68.7% Canada 5.2% Other 0.3% ANNUAL WHOLESALE UNIT SHIPMENTS FRANCE GERMANY ITALY UNITED KINGDOM UNITED STATES 23,351,000 SQUARE FEET (1) 397 FACILITIES (1) ~3,500 INDEPENDEN T DEALERSHIP LOCATIONS (1) TOWABLE EUROPEAN MOTORIZED OTHER NORTH AMERICAN 8
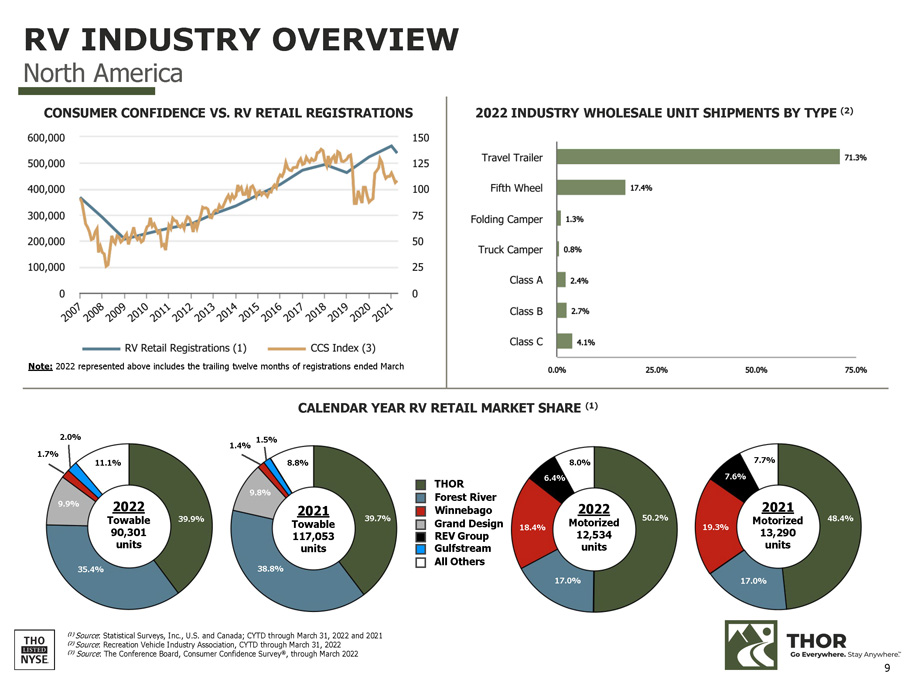
RV INDUSTRY OVERVIEW North America (1) Source : Statistical Surveys, Inc., U.S. and Canada; CYTD through March 31, 2022 and 2021 (2) Source : Recreation Vehicle Industry Association, CYTD through March 31, 2022 (3) Source : The Conference Board, Consumer Confidence Survey ® , through March 2022 2022 INDUSTRY WHOLESALE UNIT SHIPMENTS BY TYPE (2) CONSUMER CONFIDENCE VS. RV RETAIL REGISTRATIONS CALENDAR YEAR RV RETAIL MARKET SHARE (1) THOR Forest River Winnebago Grand Design REV Group Gulfstream All Others 2022 Towable 90,301 units 2022 Motorized 12,534 units 2021 Motorized 13,290 units 2021 Towable 117,053 units 50.2% 39.9% 48.4% 39.7% 35.4% 17.0% 9.9% 1.7% 11.1% 2.0% 18.4% 6.4% 8.0% 8.8% 9.8% 38.8% 1.5% 1.4% 7.7% 17.0% 19.3% 7.6% Note: 2022 represented above includes the trailing twelve months of registrations ended March 9
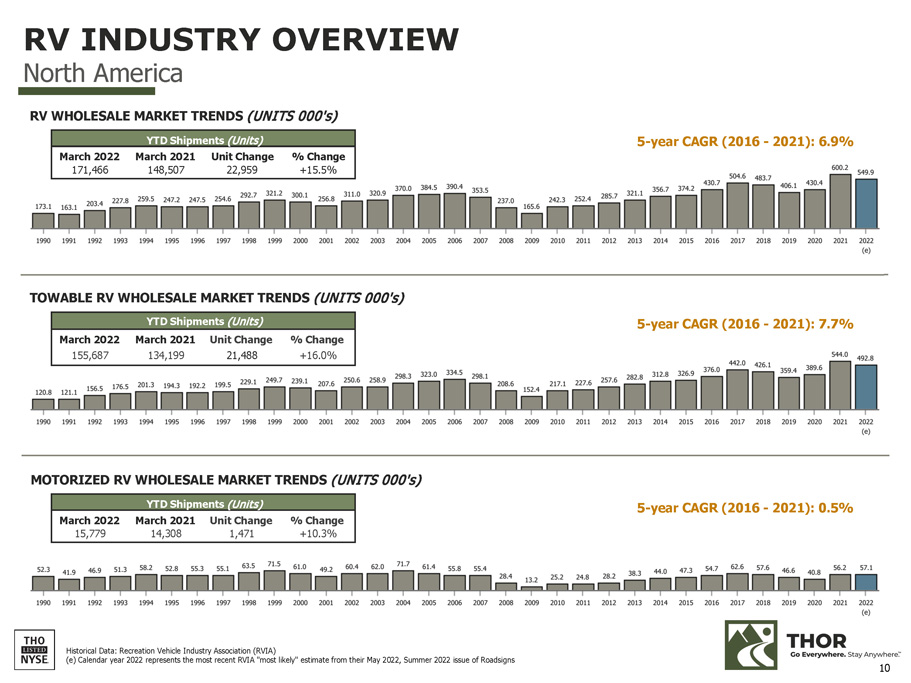
TOWABLE RV WHOLESALE MARKET TRENDS (UNITS 000's) YTD Shipments (Units) March 2022 March 2021 Unit Change % Change 171,466 148,507 22,959 +15.5% YTD Shipments (Units) March 2022 March 2021 Unit Change % Change 155,687 134,199 21,488 +16.0% YTD Shipments (Units) March 2022 March 2021 Unit Change % Change 15,779 14,308 1,471 +10.3% Historical Data: Recreation Vehicle Industry Association (RVIA) (e) Calendar year 2022 represents the most recent RVIA "most likely" estimate from their May 2022, Summer 2022 issue of Roadsigns 5 - year CAGR (2016 - 2021): 6.9% 5 - year CAGR (2016 - 2021): 7.7% 5 - year CAGR (2016 - 2021): 0.5% RV INDUSTRY OVERVIEW North America RV WHOLESALE MARKET TRENDS (UNITS 000's) 10 MOTORIZED RV WHOLESALE MARKET TRENDS (UNITS 000's)
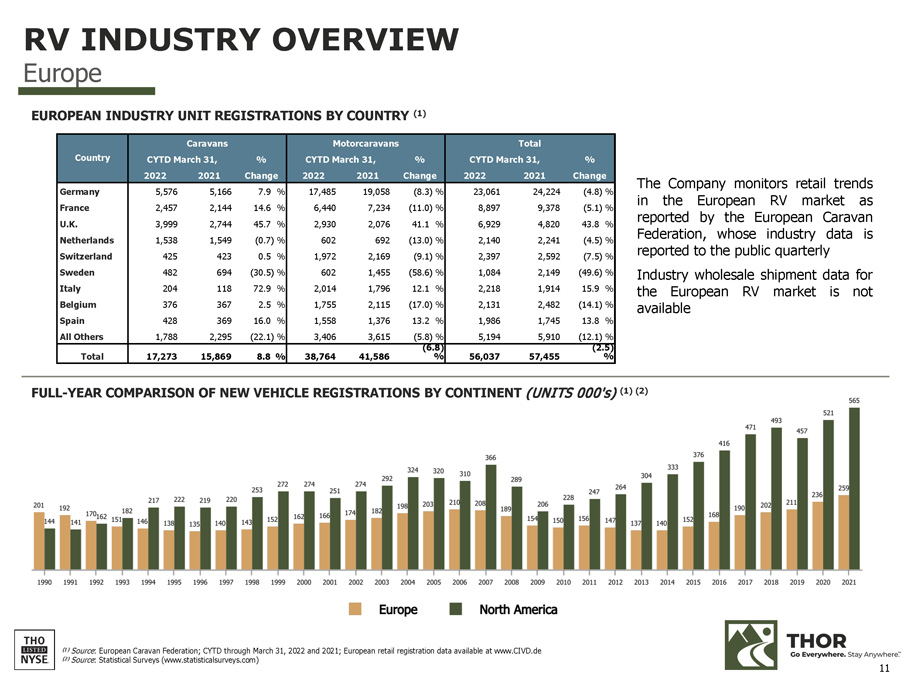
(1) Source : European Caravan Federation; CYTD through March 31, 2022 and 2021; European retail registration data available at www.CIVD.de (2) Source : Statistical Surveys (www.statisticalsurveys.com) Country Caravans Motorcaravans Total CYTD March 31, % CYTD March 31, % CYTD March 31, % 2022 2021 Change 2022 2021 Change 2022 2021 Change Germany 5,576 5,166 7.9 % 17,485 19,058 (8.3) % 23,061 24,224 (4.8) % France 2,457 2,144 14.6 % 6,440 7,234 (11.0) % 8,897 9,378 (5.1) % U.K. 3,999 2,744 45.7 % 2,930 2,076 41.1 % 6,929 4,820 43.8 % Netherlands 1,538 1,549 (0.7) % 602 692 (13.0) % 2,140 2,241 (4.5) % Switzerland 425 423 0.5 % 1,972 2,169 (9.1) % 2,397 2,592 (7.5) % Sweden 482 694 (30.5) % 602 1,455 (58.6) % 1,084 2,149 (49.6) % Italy 204 118 72.9 % 2,014 1,796 12.1 % 2,218 1,914 15.9 % Belgium 376 367 2.5 % 1,755 2,115 (17.0) % 2,131 2,482 (14.1) % Spain 428 369 16.0 % 1,558 1,376 13.2 % 1,986 1,745 13.8 % All Others 1,788 2,295 (22.1) % 3,406 3,615 (5.8) % 5,194 5,910 (12.1) % Total 17,273 15,869 8.8 % 38,764 41,586 (6.8) % 56,037 57,455 (2.5) % EUROPEAN INDUSTRY UNIT REGISTRATIONS BY COUNTRY (1) The Company monitors retail trends in the European RV market as reported by the European Caravan Federation, whose industry data is reported to the public quarterly Industry wholesale shipment data for the European RV market is not available FULL - YEAR COMPARISON OF NEW VEHICLE REGISTRATIONS BY CONTINENT (UNITS 000's) (1) (2) RV INDUSTRY OVERVIEW Europe 11
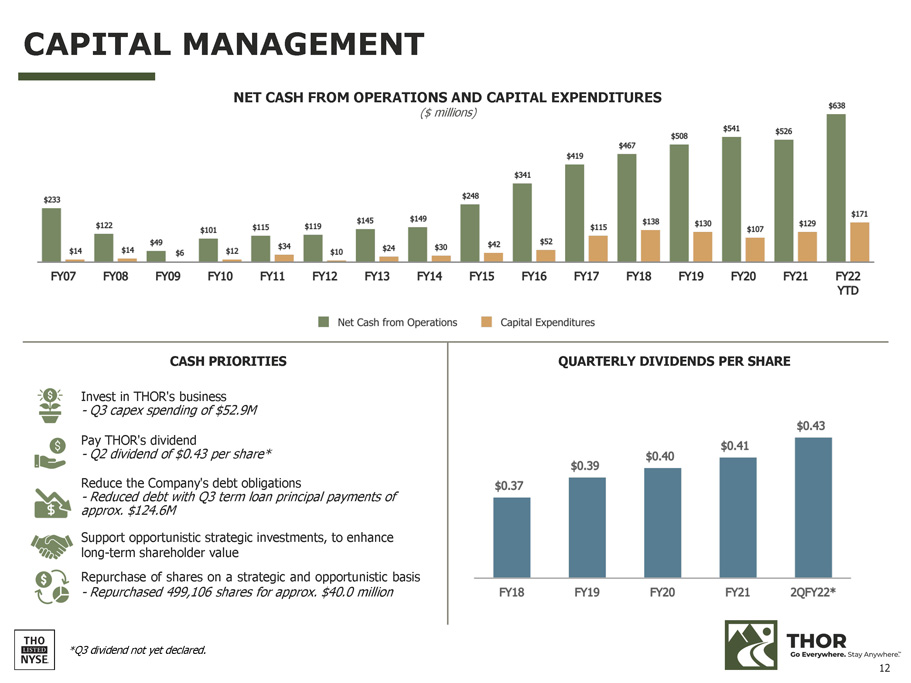
CAPITAL MANAGEMENT CASH PRIORITIES Invest in THOR's business - Q3 capex spending of $52.9M Pay THOR's dividend - Q2 dividend of $0.43 per share* Reduce the Company's debt obligations - Reduced debt with Q3 term loan principal payments of approx. $124.6M Support opportunistic strategic investments, to enhance long - term shareholder value Repurchase of shares on a strategic and opportunistic basis - Repurchased 499,106 shares for approx. $40.0 million NET CASH FROM OPERATIONS AND CAPITAL EXPENDITURES ($ millions) QUARTERLY DIVIDENDS PER SHARE *Q3 dividend not yet declared. 12

www.thorindustries.com INVESTOR RELATIONS CONTACTS Mark Trinske Vice President of Investor Relations mtrinske@thorindustries.com (574) 970 - 7912 Michael Cieslak, CFA Investor Relations Manager mcieslak@thorindustries.com (574) 294 - 7724