Investor Presentation for 8-K/A filed April 18, 2019 Exhibit 99.6
Forward Looking Statements This presentation includes certain statements that are “forward looking” statements within the meaning of the U.S. Private Securities Litigation Reform Act of 1995, Section 27A of the Securities Act of 1933, as amended, and Section 21E of the Securities Exchange Act of 1934, as amended. These forward looking statements are made based on management’s current expectations and beliefs regarding future and anticipated developments and their effects upon Thor, and inherently involve uncertainties and risks. These forward looking statements are not a guarantee of future performance. We cannot assure you that actual results will not differ materially from our expectations. Factors which could cause materially different results include, among others, raw material and commodity price fluctuations; raw material, commodity or chassis supply restrictions; the impact of tariffs on material or other input costs; the level and magnitude of warranty claims incurred; legislative, regulatory and tax law and/or policy developments including their potential impact on our dealers and their retail customers or on our suppliers; the costs of compliance with governmental regulation; legal and compliance issues including those that may arise in conjunction with recently completed or announced transactions; lower consumer confidence and the level of discretionary consumer spending; interest rate fluctuations; the potential impact of interest rate fluctuations on the general economy and specifically on our dealers and consumers; restrictive lending practices; management changes; the success of new and existing products and services; consumer preferences; the ability to efficiently utilize production facilities; the pace of acquisitions and the successful closing, integration and financial impact thereof; the potential loss of existing customers of acquisitions; our ability to retain key management personnel of acquired companies; a shortage of necessary personnel for production; the loss or reduction of sales to key dealers; disruption of the delivery of units to dealers; increasing costs for freight and transportation; asset impairment charges; cost structure changes; competition; the impact of potential losses under repurchase agreements; the potential impact of the strength of the U.S. dollar on international demand for products priced in U.S. dollars; general economic, market and political conditions; and changes to investment and capital allocation strategies or other facets of our strategic plan. Additional risks and uncertainties surrounding the acquisition of Erwin Hymer Group SE (the "Erwin Hymer Group") include risks regarding the potential benefits of the acquisition and the anticipated operating synergies, the integration of the business, changes in Euro-U.S. dollar exchange rates that could impact the mark-to-market value of outstanding derivative instruments, the impact of exchange rate fluctuations and unknown or understated liabilities related to the acquisition and Erwin Hymer Group's business. These and other risks and uncertainties are discussed more fully in Item 1A of our Annual Report on Form 10-K for the year ended July 31, 2018 and Part II, Item 1A of our quarterly report on Form 10-Q for the period ended January 31, 2019. We disclaim any obligation or undertaking to disseminate any updates or revisions to any forward looking statements contained in this presentation or to reflect any change in our expectations after the date hereof or any change in events, conditions or circumstances on which any statement is based, except as required by law.

Acquisition of EHG
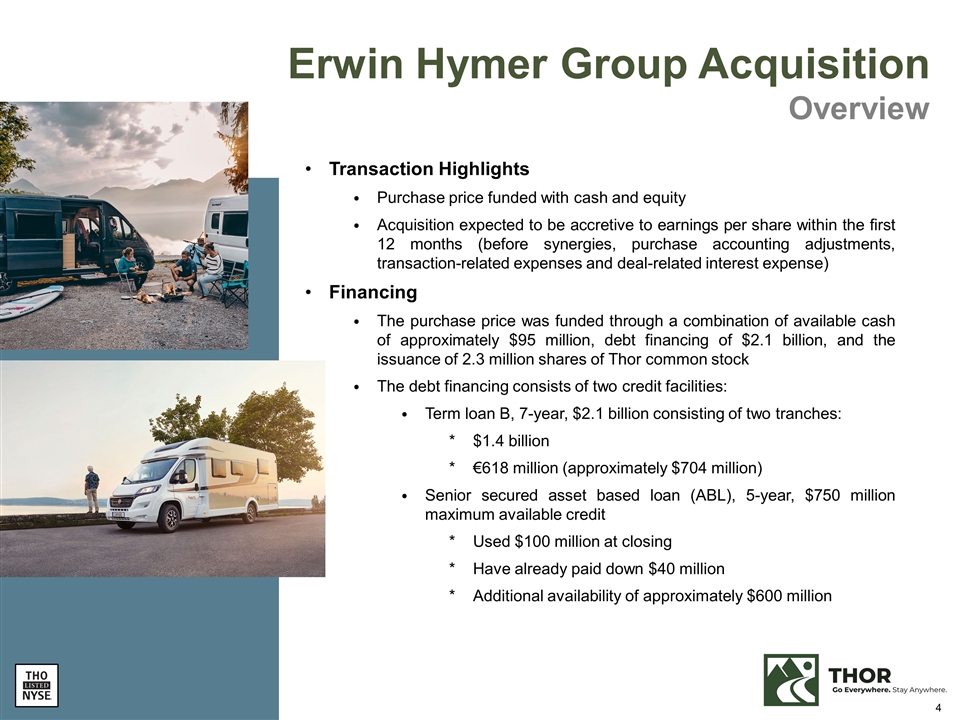
Erwin Hymer Group Acquisition Overview Transaction Highlights Purchase price funded with cash and equity Acquisition expected to be accretive to earnings per share within the first 12 months (before synergies, purchase accounting adjustments, transaction-related expenses and deal-related interest expense) Financing The purchase price was funded through a combination of available cash of approximately $95 million, debt financing of $2.1 billion, and the issuance of 2.3 million shares of Thor common stock The debt financing consists of two credit facilities: Term loan B, 7-year, $2.1 billion consisting of two tranches: $1.4 billion €618 million (approximately $704 million) Senior secured asset based loan (ABL), 5-year, $750 million maximum available credit Used $100 million at closing Have already paid down $40 million Additional availability of approximately $600 million
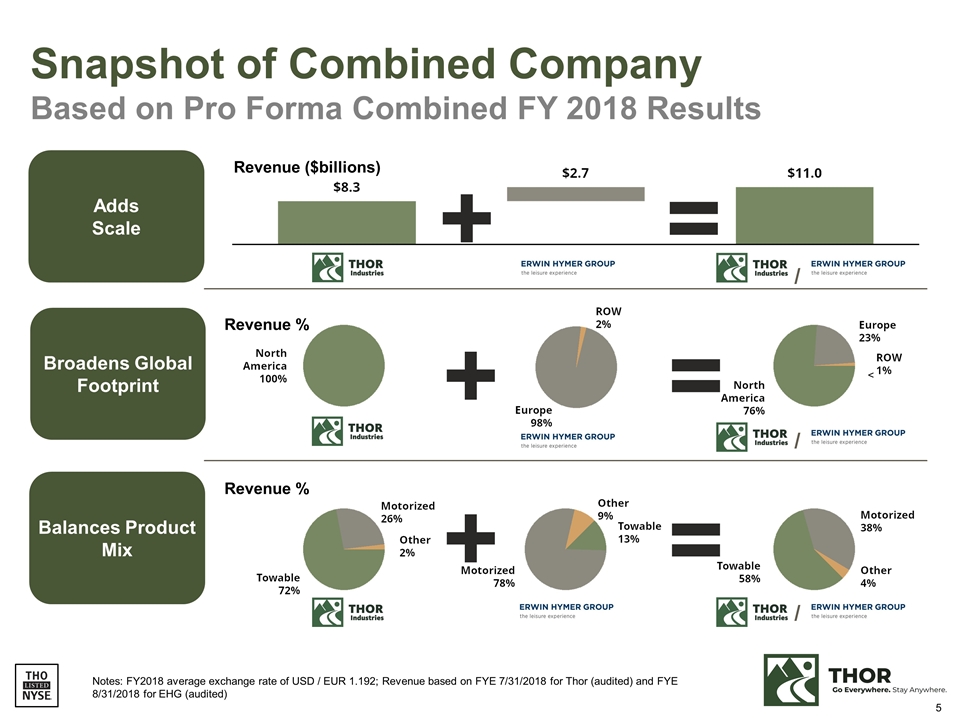
Snapshot of Combined Company Based on Pro Forma Combined FY 2018 Results Adds Scale Balances Product Mix Broadens Global Footprint + + + = = = Revenue ($billions) Revenue % Revenue % / / / Notes: FY2018 average exchange rate of USD / EUR 1.192; Revenue based on FYE 7/31/2018 for Thor (audited) and FYE 8/31/2018 for EHG (audited) <
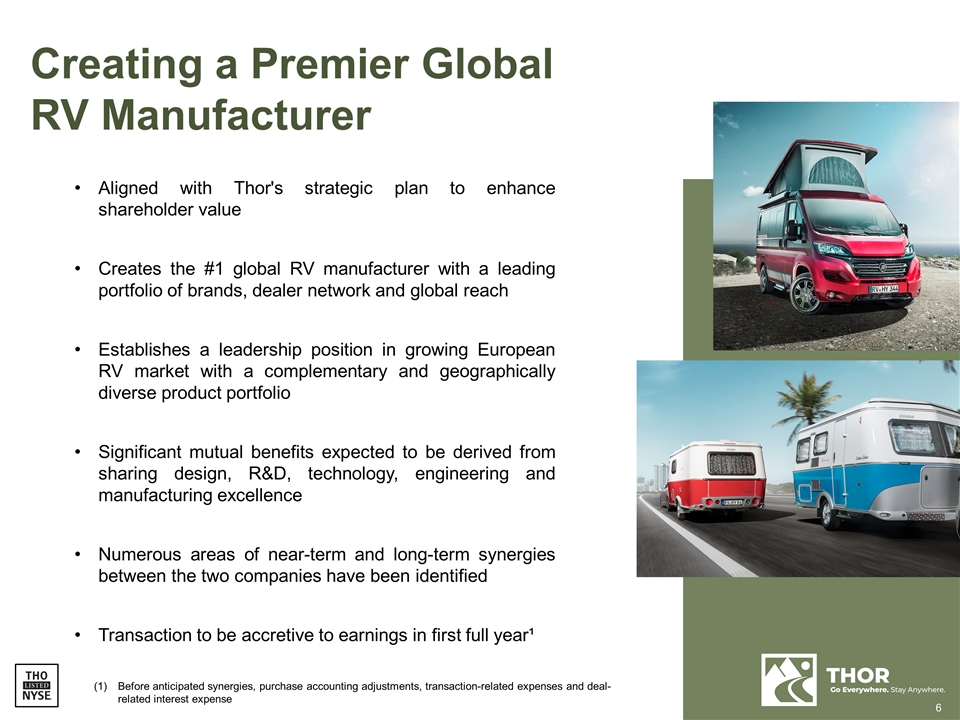
Creating a Premier Global RV Manufacturer Aligned with Thor's strategic plan to enhance shareholder value Creates the #1 global RV manufacturer with a leading portfolio of brands, dealer network and global reach Establishes a leadership position in growing European RV market with a complementary and geographically diverse product portfolio Significant mutual benefits expected to be derived from sharing design, R&D, technology, engineering and manufacturing excellence Numerous areas of near-term and long-term synergies between the two companies have been identified Transaction to be accretive to earnings in first full year¹ Before anticipated synergies, purchase accounting adjustments, transaction-related expenses and deal-related interest expense
Synergies Expected to Create Meaningful Additional Value Engineering and Design R&D and Technology Marketing Human Resources Strategies Dealer Network / Dealer Development Aftermarket Support Strategies Sharing of Best Practices Overall Spending Leverage Procurement Strategies / Direct Sourcing of Certain Components Production Methodologies Working Capital Management Global Talent Development Access to New Markets / Cross-Marketing Opportunities Technology Advances / Product and Operational Development Leveraging Manufacturing and Financial Management Expertise Thor and EHG to Mutually Benefit from
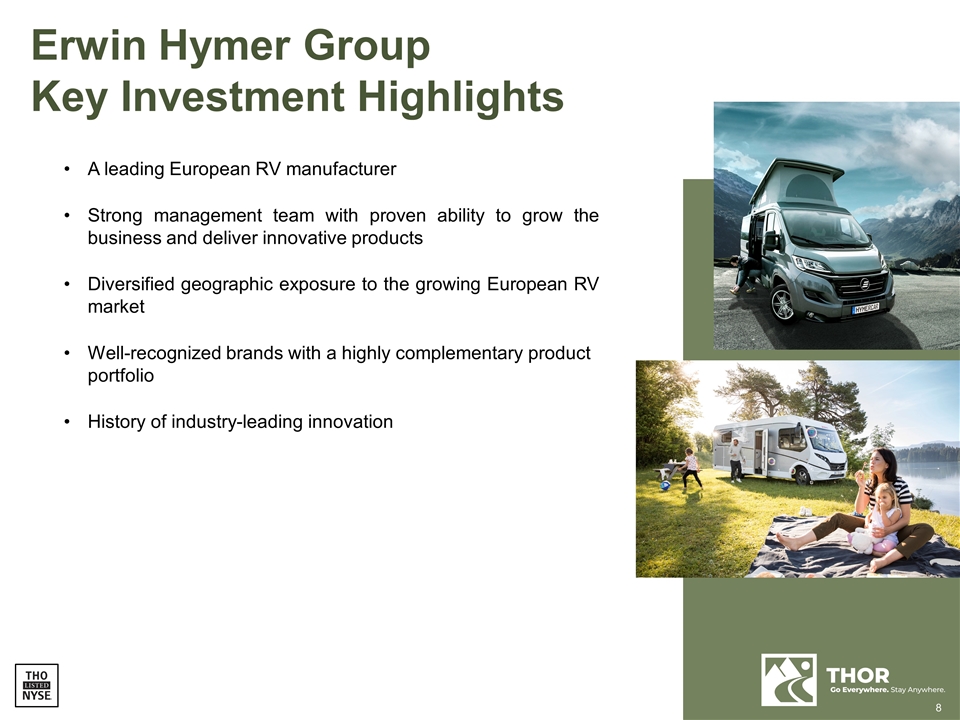
A leading European RV manufacturer Strong management team with proven ability to grow the business and deliver innovative products Diversified geographic exposure to the growing European RV market Well-recognized brands with a highly complementary product portfolio History of industry-leading innovation Erwin Hymer Group Key Investment Highlights

Pro Forma Combined Financial Information
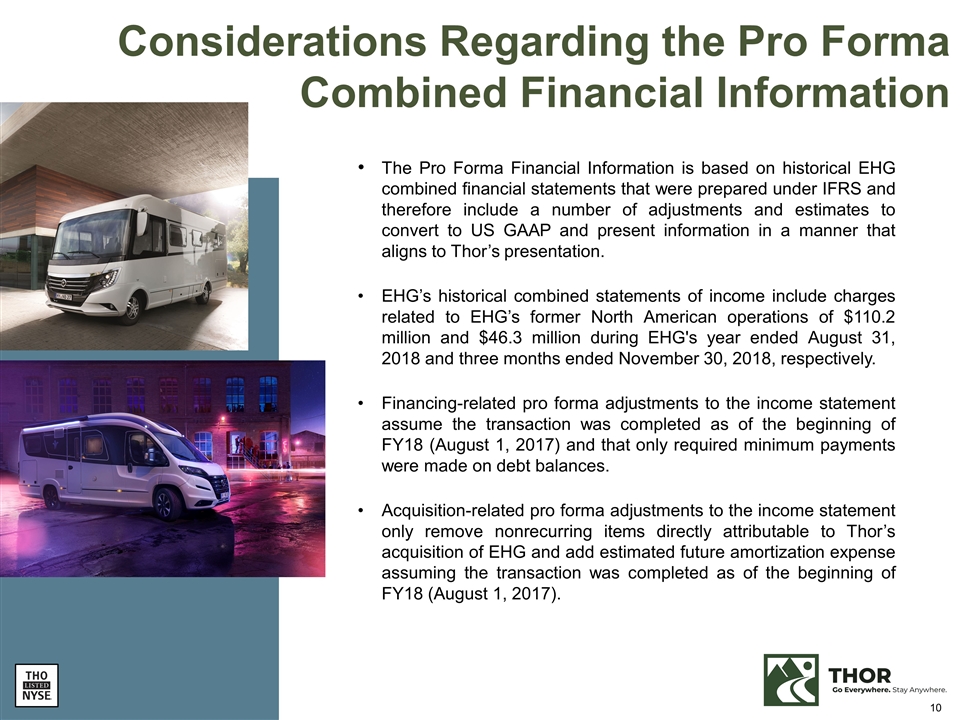
Considerations Regarding the Pro Forma Combined Financial Information The Pro Forma Financial Information is based on historical EHG combined financial statements that were prepared under IFRS and therefore include a number of adjustments and estimates to convert to US GAAP and present information in a manner that aligns to Thor’s presentation. EHG’s historical combined statements of income include charges related to EHG’s former North American operations of $110.2 million and $46.3 million during EHG's year ended August 31, 2018 and three months ended November 30, 2018, respectively. Financing-related pro forma adjustments to the income statement assume the transaction was completed as of the beginning of FY18 (August 1, 2017) and that only required minimum payments were made on debt balances. Acquisition-related pro forma adjustments to the income statement only remove nonrecurring items directly attributable to Thor’s acquisition of EHG and add estimated future amortization expense assuming the transaction was completed as of the beginning of FY18 (August 1, 2017).
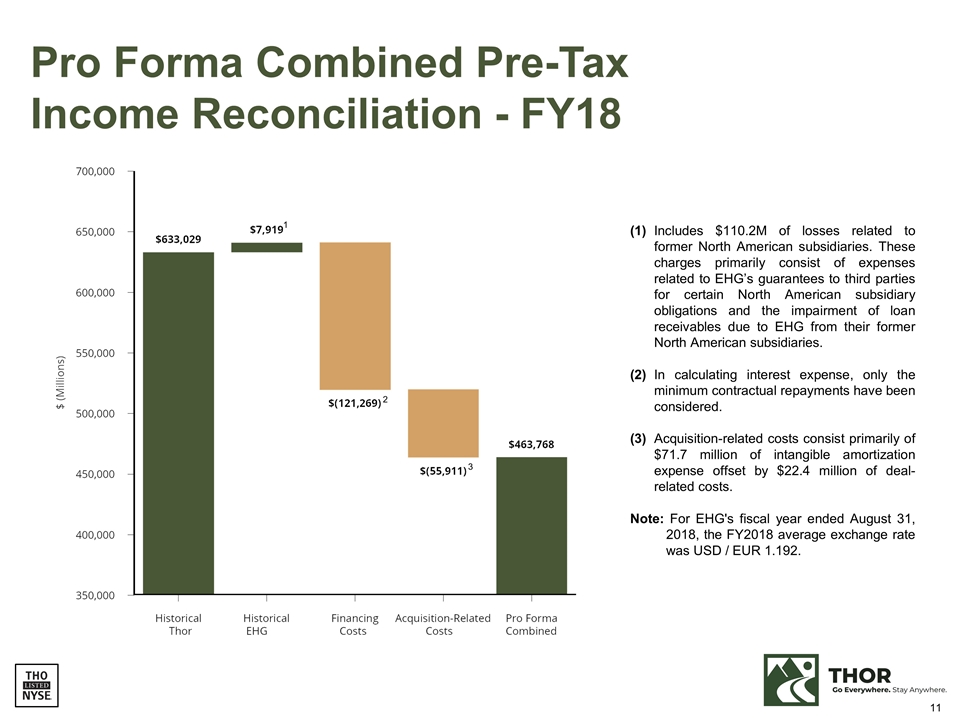
Pro Forma Combined Pre-Tax Income Reconciliation - FY18 (1)Includes $110.2M of losses related to former North American subsidiaries. These charges primarily consist of expenses related to EHG’s guarantees to third parties for certain North American subsidiary obligations and the impairment of loan receivables due to EHG from their former North American subsidiaries. (2)In calculating interest expense, only the minimum contractual repayments have been considered. (3) Acquisition-related costs consist primarily of $71.7 million of intangible amortization expense offset by $22.4 million of deal-related costs. Note: For EHG's fiscal year ended August 31, 2018, the FY2018 average exchange rate was USD / EUR 1.192. 1 2 3
European RV Industry Overview
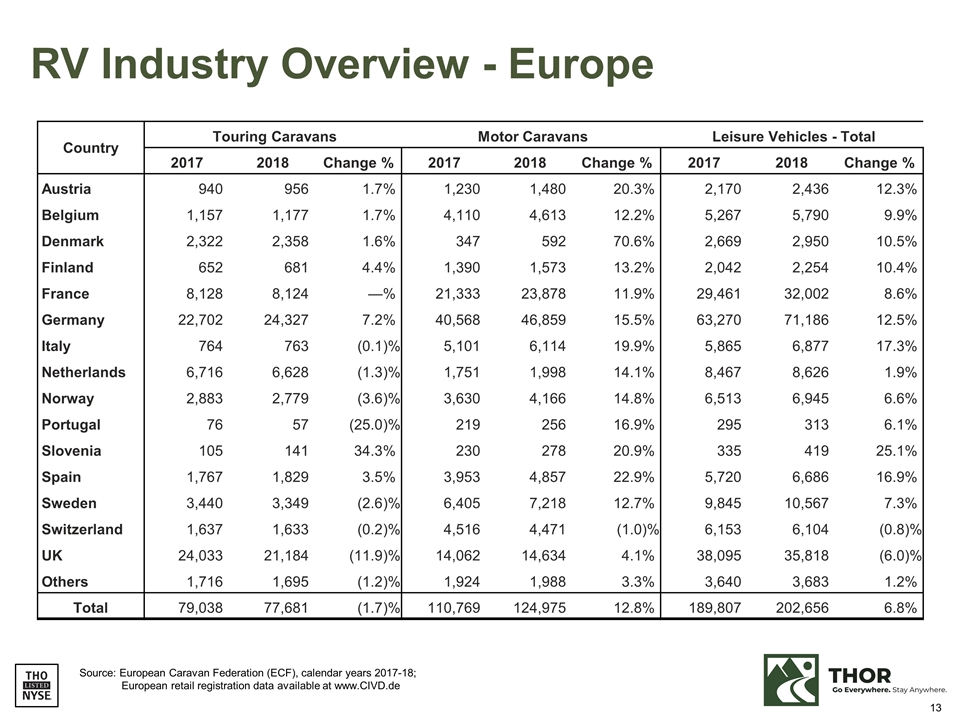
RV Industry Overview - Europe Source: European Caravan Federation (ECF), calendar years 2017-18; European retail registration data available at www.CIVD.de Country Touring Caravans Motor Caravans Leisure Vehicles - Total 2017 2018 Change % 2017 2018 Change % 2017 2018 Change % Austria 940 956 1.7 % 1,230 1,480 20.3 % 2,170 2,436 12.3 % Belgium 1,157 1,177 1.7 % 4,110 4,613 12.2 % 5,267 5,790 9.9 % Denmark 2,322 2,358 1.6 % 347 592 70.6 % 2,669 2,950 10.5 % Finland 652 681 4.4 % 1,390 1,573 13.2 % 2,042 2,254 10.4 % France 8,128 8,124 — % 21,333 23,878 11.9 % 29,461 32,002 8.6 % Germany 22,702 24,327 7.2 % 40,568 46,859 15.5 % 63,270 71,186 12.5 % Italy 764 763 (0.1 )% 5,101 6,114 19.9 % 5,865 6,877 17.3 % Netherlands 6,716 6,628 (1.3 )% 1,751 1,998 14.1 % 8,467 8,626 1.9 % Norway 2,883 2,779 (3.6 )% 3,630 4,166 14.8 % 6,513 6,945 6.6 % Portugal 76 57 (25.0 )% 219 256 16.9 % 295 313 6.1 % Slovenia 105 141 34.3 % 230 278 20.9 % 335 419 25.1 % Spain 1,767 1,829 3.5 % 3,953 4,857 22.9 % 5,720 6,686 16.9 % Sweden 3,440 3,349 (2.6 )% 6,405 7,218 12.7 % 9,845 10,567 7.3 % Switzerland 1,637 1,633 (0.2 )% 4,516 4,471 (1.0 )% 6,153 6,104 (0.8 )% UK 24,033 21,184 (11.9 )% 14,062 14,634 4.1 % 38,095 35,818 (6.0 )% Others 1,716 1,695 (1.2 )% 1,924 1,988 3.3 % 3,640 3,683 1.2 % Total 79,038 77,681 (1.7 )% 110,769 124,975 12.8 % 189,807 202,656 6.8 %
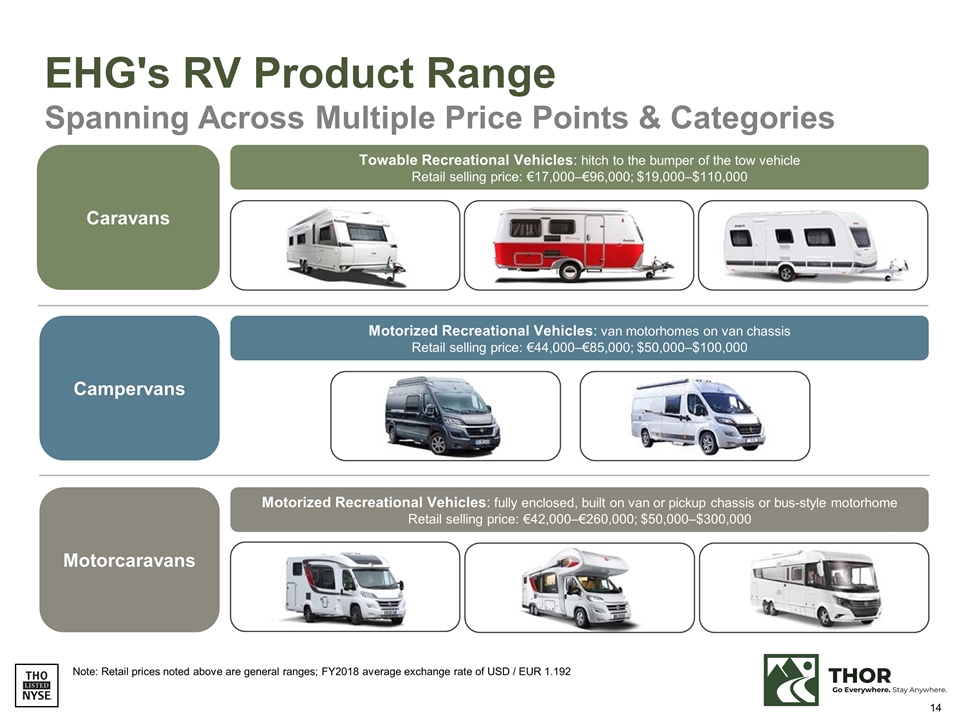
Motorized Recreational Vehicles: van motorhomes on van chassis Retail selling price: €44,000–€85,000; $50,000–$100,000 EHG's RV Product Range Spanning Across Multiple Price Points & Categories Caravans Towable Recreational Vehicles: hitch to the bumper of the tow vehicle Retail selling price: €17,000–€96,000; $19,000–$110,000 Campervans Motorized Recreational Vehicles: fully enclosed, built on van or pickup chassis or bus-style motorhome Retail selling price: €42,000–€260,000; $50,000–$300,000 Motorcaravans Note: Retail prices noted above are general ranges; FY2018 average exchange rate of USD / EUR 1.192
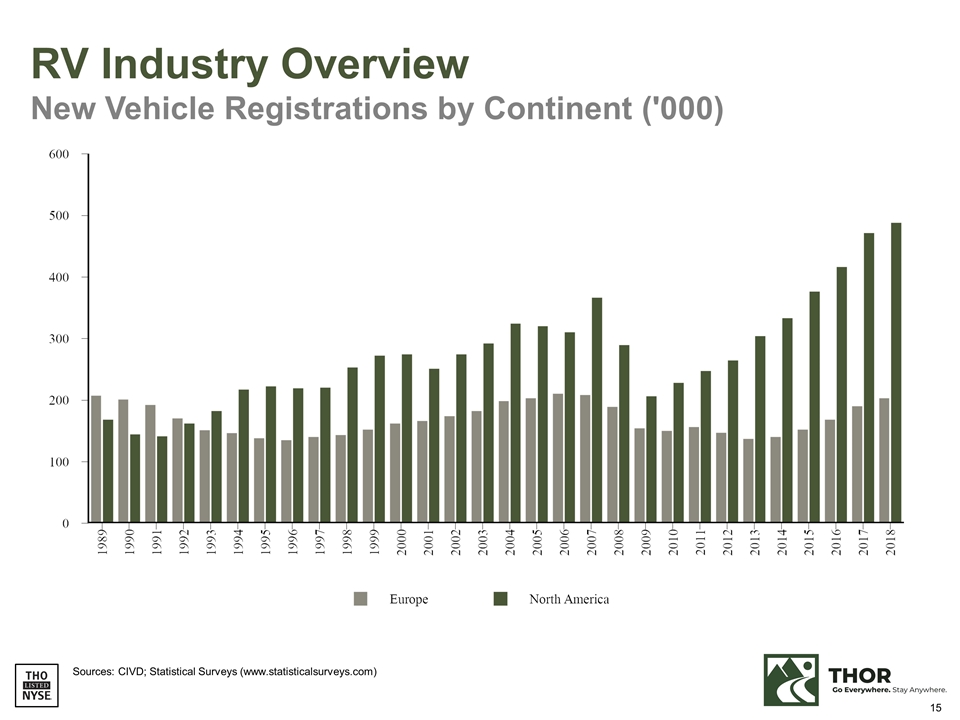
RV Industry Overview New Vehicle Registrations by Continent ('000) Sources: CIVD; Statistical Surveys (www.statisticalsurveys.com)


