EXHIBIT 99.3
To Form 8-K dated October 25, 2012
Seacoast Banking Corporation of Florida
Third Quarter 2012
Cautionary Notice Regarding Forward-Looking Statements
This information contains “forward-looking statements” within the meaning of Section 27A of the Securities Act of 1933 and Section 21E of the Securities Exchange Act of 1934, including, without limitation,statements about future financial and operating results, ability to realized deferred tax assets, cost savings, enhanced revenues, economic and seasonal conditions in our markets, and improvements to reported earnings that may be realized from cost controls and for integration of banks that we have acquired, as well as statements with respect to Seacoast’s objectives, expectations and intentions and other statements that are not historical facts. Actual results may differ from those set forth in the forward-looking statements.
Forward-looking statements include statements with respect to our beliefs, plans, objectives, goals, expectations, anticipations, estimates and intentions, and involve known and unknown risks, uncertainties and other factors, which may be beyond our control, and which may cause the actual results, performance or achievements of Seacoast to be materially different from future results, performance or achievements expressed or implied by such forward-looking statements. You should not expect us to update any forward-looking statements.
You can identify these forward-looking statements through our use of words such as “may,” “will,” “anticipate,” “assume,” “should,” “support”, “indicate,” “would,” “believe,” “contemplate,” “expect,” “estimate,” “continue,” “further”, “point to,” “project,” “could,” “intend” or other similar words and expressions of the future. These forward-looking statements may not be realized due to a variety of factors, including, without limitation: the effects of future economic and market conditions, including seasonality; governmental monetary and fiscal policies, as well as legislative, tax and regulatory changes; changes in accounting policies, rules and practices; the risks of changes in interest rates on the level and composition of deposits, loan demand, liquidity and the values of loan collateral, securities, and interest sensitive assets and liabilities; interest rate risks, sensitivities and the shape of the yield curve; the effects of competition from other commercial banks, thrifts, mortgage banking firms, consumer finance companies, credit unions, securities brokerage firms, insurance companies, money market and other mutual funds and other financial institutions operating in our market areas and elsewhere, including institutions operating regionally, nationally and internationally, together with such competitors offering banking products and services by mail, telephone, computer and the Internet; and the failure of assumptions underlying the establishment of reserves for possible loan losses. The risks of mergers and acquisitions, include, without limitation: unexpected transaction costs, including the costs of integrating operations;the risks that the businesses will not be integrated successfully or that such integration may be more difficult, time-consuming or costly than expected; the potential failure to fully or timely realize expected revenues and revenue synergies, including as the result of revenues following the merger being lower than expected; the risk of deposit and customer attrition; any changes in deposit mix; unexpected operating and other costs, which may differ or change from expectations; the risks of customer and employee loss and business disruption, including, without limitation, as the result of difficulties in maintaining relationships with employees; increased competitive pressures and solicitations of customers by competitors; as well as the difficulties and risks inherent with entering new markets.
All written or oral forward-looking statements attributable to us are expressly qualified in their entirety by this cautionary notice, including, without limitation, those risks and uncertainties described in our annual report on Form 10-K for the year ended December 31, 2010 under “Special Cautionary Notice Regarding Forward-Looking Statements” and “Risk Factors”, and otherwise in our SEC reports and filings. Such reports are available upon request from the Company, or from the Securities and Exchange Commission, including through the SEC’s Internet website athttp://www.sec.gov.
Highlights
| • | Stable 3Q net interest margin |
| • | Residential mortgage production was strong supporting both loan and noninterest income growth |
| • | Noninterest income in the third quarter continued to increase, up 20.7% compared to prior year |
| • | Core operating expenses managed lower |
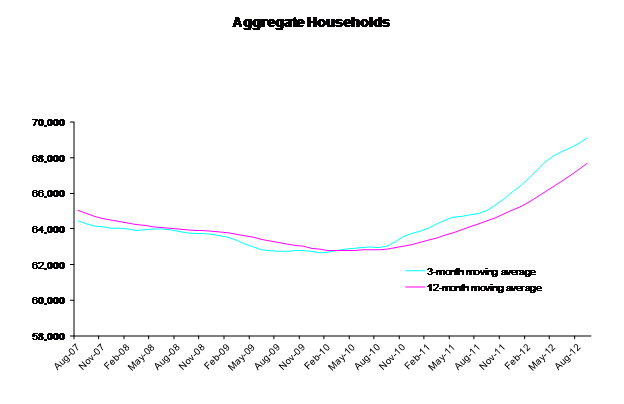
| • | Organic growth in households continued to increase this quarter resulting in 2,604 new household relationships up 256 or 11% compared to third quarter 2011 |
| • | Noninterest bearing demand deposit organic growth was $84.9 million or 26% year over year |
| • | Other real estate owned declined by 63% year over year |
| • | Nonperforming assets declined $2.4 million to $53.3 million during the quarter |
| • | Solid capital position with estimated tangible common equity (TCE) ratio of 7.6% when DTA valuation allowance of $45.2 million is recaptured. |
| • | Distinctive value proposition has continued to grow the franchise and improve long term profitability and shareholder value |
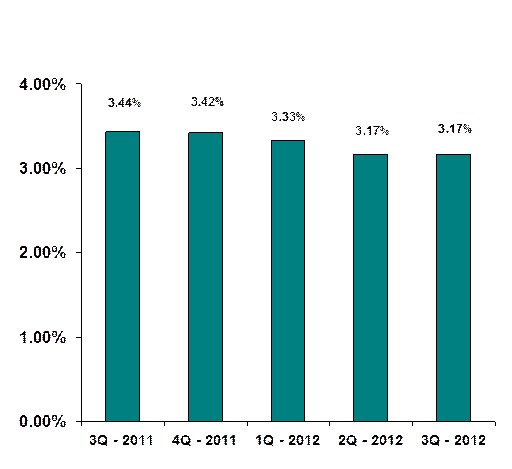
Net Interest Margin
Opportunities:
| • | Reduction of deposit costs |
| • | Nonperforming asset resolution |
Threats:
Noninterest Income (excluding securities gains)
Growth in deposit accounts and mortgage banking leads to improved fee growth
| $ in thousands | | Q-3-2012 | | Q-2-2012 | | Q-1-2012 | | Q-4-2011 | | Q-3-2011 |
| Total Noninterest Income (excluding securities gains) | | $ | 5,679 | | | $ | 5,219 | | | $ | 4,937 | | | $ | 4,883 | | | $ | 4,706 | |
| | | | | | | | | | | | | | | | | | | | | |
| Highlights include: | | | | | | | | | | | | | | | | | | | | |
| Service Charges | | $ | 1,620 | | | $ | 1,487 | | | $ | 1,461 | | | $ | 1,599 | | | $ | 1,675 | |
| Trust Income | | | 550 | | | | 564 | | | | 573 | | | | 530 | | | | 541 | |
| Mortgage Banking | | | 1,155 | | | | 902 | �� | | | 623 | | | | 680 | | | | 556 | |
| Brokerage | | | 247 | | | | 298 | | | | 234 | | | | 258 | | | | 321 | |
| Marine | | | 279 | | | | 244 | | | | 330 | | | | 333 | | | | 229 | |
| Interchange Income | | | 1,119 | | | | 1,154 | | | | 1,071 | | | | 953 | | | | 969 | |
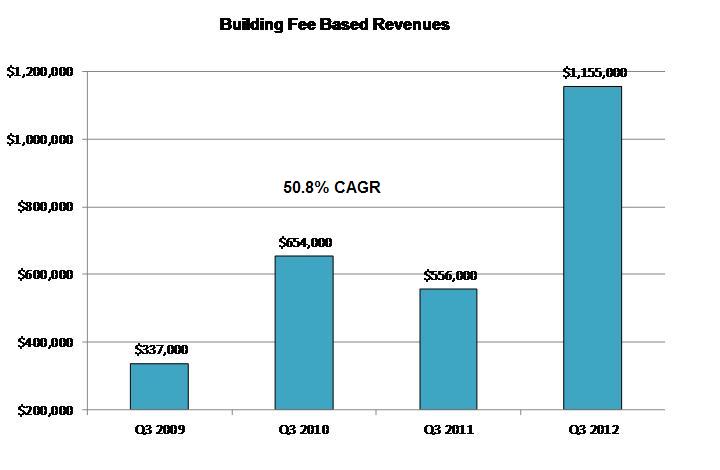
Mortgage Banking Gains
Our focus on building production capacity is paying off
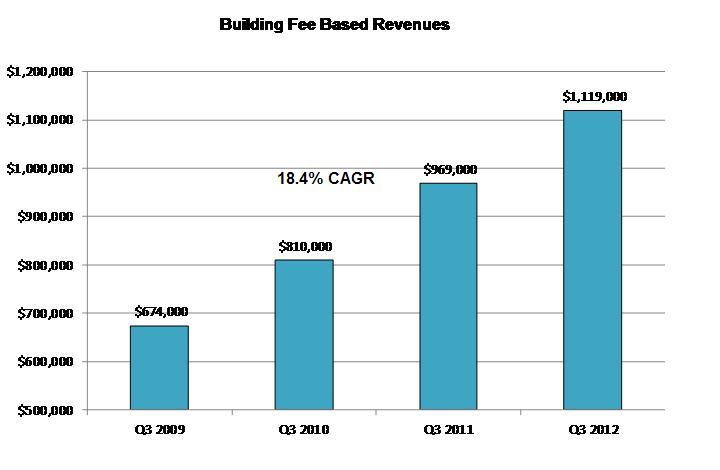
Interchange Income
Our focus on building franchise households is paying off
Noninterest Expense
Core Operating Expense managed lower
| (Dollars in thousands) | | Q-3-2012 | | Q-2-2012 | | Q-1-2012 | | Q-4-2011 | | Q-3-2011 |
| Noninterest Expense: | | | | | | | | | | |
| | | | | | | | | | | |
| Salary and wages | | $ | 7,442 | | | $ | 7,435 | | | $ | 7,055 | | | $ | 7,301 | | | $ | 6,902 | |
| Employee benefits | | | 1,924 | | | | 1,916 | | | | 2,010 | | | | 1,447 | | | | 1,391 | |
| Outsourced data processing costs | | | 1,923 | | | | 1,834 | | | | 1,721 | | | | 1,677 | | | | 1,685 | |
| Telephone/data lines | | | 299 | | | | 297 | | | | 289 | | | | 285 | | | | 286 | |
| Occupancy Expense | | | 1,876 | | | | 1,943 | | | | 1,882 | | | | 1,795 | | | | 1,967 | |
| Furniture and equipment expense | | | 556 | | | | 607 | | | | 495 | | | | 525 | | | | 555 | |
| Marketing expense | | | 785 | | | | 677 | | | | 926 | | | | 947 | | | | 551 | |
| Legal and professional fees | | | 1,122 | | | | 1,637 | | | | 1,776 | | | | 1,299 | | | | 1,496 | |
| FDIC assessments | | | 695 | | | | 707 | | | | 706 | | | | 679 | | | | 687 | |
| Amortization of intangibles | | | 196 | | | | 196 | | | | 201 | | | | 212 | | | | 211 | |
| Other | | | 2,018 | | | | 2,314 | | | | 2,163 | | | | 2,264 | | | | 1,947 | |
| Total Core Operating Expense | | | 18,836 | | | | 19,563 | | | | 19,224 | | | | 18,431 | | | | 17,678 | |
| | | | | | | | | | | | | | | | | | | | | |
| Severance and organizational changes | | | 839 | | | | 0 | | | | 0 | | | | 0 | | | | 0 | |
| Branch consolidation | | | 232 | | | | 0 | | | | 0 | | | | 0 | | | | 0 | |
| Recovery of prior legal fees | | | (500 | ) | | | 0 | | | | 0 | | | | 0 | | | | 0 | |
| Net loss on OREO | | | 561 | | | | 790 | | | | 1,959 | | | | 1,254 | | | | 906 | |
| Asset dispositions expense | | | 364 | | | | 368 | | | | 527 | | | | 275 | | | | 479 | |
| Total | | $ | 20,332 | | | $ | 20,721 | | | $ | 21,710 | | | $ | 19,960 | | | $ | 19,063 | |
| | | | | | | | | | | | | | | | | | | | | |
| Core operating expense to average assets | | | 3.59 | % | | | 3.67 | % | | | 3.62 | % | | | 3.54 | % | | | 3.43 | % |
Positive Household Growth
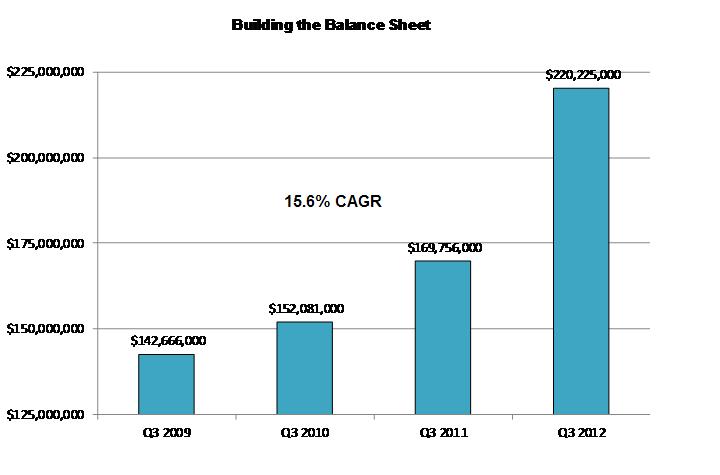
Core Ending Deposit Growth
Favorable core growth rate
| | | ($ in thousands) |
| | | 3Q-2012 | | 4Q-2011 | | 3Q-2011 | | Year
Over Year |
| | | | | | | | | |
| Demand deposits (noninterest bearing) | | $ | 409,145 | | | $ | 328,356 | | | $ | 324,256 | | | | 26.2 | % |
| Savings deposits | | | 926,960 | | | | 922,361 | | | | 847,515 | | | | 9.4 | % |
| Total Demand and Savings | | $ | 1,336,105 | | | $ | 1,250,717 | | | $ | 1,171,771 | | | | 14.0 | % |
| | | | | | | | | | | | | | | | | |
| Other time certificates | | | 192,297 | | | | 244,886 | | | | 257,486 | | | | -25.3 | % |
| Brokered time certificates | | | 8,429 | | | | 4,558 | | | | 5,252 | | | | 60.5 | % |
| Time certificates of $100,000 or more | | | 142,635 | | | | 218,580 | | | | 226,765 | | | | -37.1 | % |
| Total Time Deposits | | $ | 343,361 | | | $ | 468,024 | | | $ | 489,503 | | | | -29.9 | % |
| | | | | | | | | | | | | | | | | |
| Total Deposits | | $ | 1,679,466 | | | $ | 1,718,741 | | | $ | 1,661,274 | | | | 1.1 | % |
Core Ending Deposit Growth
Favorable Mix Shift
| | | 3Q-2012 Mix | | 4Q-2011 Mix | | 3Q-2011 Mix |
| | | | | | | |
| Demand deposits (noninterest bearing) | | | 24.4 | % | | | 19.1 | % | | | 19.5 | % |
| Savings deposits | | | 55.2 | % | | | 53.7 | % | | | 51.0 | % |
| Total Demand and Savings | | | 79.6 | % | | | 72.8 | % | | | 70.5 | % |
| | | | | | | | | | | | | |
| Other time certificates | | | 11.4 | % | | | 14.2 | % | | | 15.5 | % |
| Brokered time certificates | | | 0.5 | % | | | 0.3 | % | | | 0.3 | % |
| Time certificates of $100,000 or more | | | 8.5 | % | | | 121.7 | % | | | 13.7 | % |
| Total Time Deposits | | | 20.4 | % | | | 27.2 | % | | | 29.5 | % |
Demand Deposits – Personal

Demand Deposits – Business
Credit Analysis
| | | ($ in thousands) |
| | | 3Q-2012 | | 2Q-2012 | | 1Q-2012 | | 4Q-2011 | | 3Q-2011 |
| | | | | | | | | | | |
| Net charge-offs | | $ | 2,416 | | | $ | 6,275 | | | $ | 3,415 | | | $ | 3,268 | | | $ | 2,830 | |
| Net charge-offs to average loans | | | 0.79 | % | | | 2.05 | % | | | 1.13 | % | | | 1.07 | % | | | 0.94 | % |
| | | | | | | | | | | | | | | | | | | | | |
| Loan loss provision | | $ | 900 | | | $ | 6,455 | | | $ | 2,305 | | | $ | 432 | | | | - | |
| Allowance to loans at end of period | | | 1.92 | % | | | 2.02 | % | | | 2.01 | % | | | 2.12 | % | | | 2.35 | % |
| Coverage ratio – NPLs | | | 52.01 | % | | | 50.81 | % | | | 58.62 | % | | | 89.62 | % | | | 87.05 | % |
Capital Ratios
| | | 3Q-2012
Estimate | | 2Q-2012
Actual | | 1Q-2012
Actual | | 4Q-2011
Actual |
| | | | | | | | | |
| Tier 1 Capital Ratio | | | 17.41 | % | | | 17.17 | % | | | 17.36 | % | | | 17.51 | % |
| Total Risk Based Capital Ratio | | | 18.67 | % | | | 18.43 | % | | | 18.62 | % | | | 18.77 | % |
| YTD Average Equity to YTD Average Assets | | | 7.84 | % | | | 7.87 | % | | | 7.85 | % | | | 8.01 | % |
| Tangible Equity to Tangible Assets | | | 7.96 | % | | | 7.78 | % | | | 7.79 | % | | | 7.86 | % |
| Tangible Common Equity to Tangible Assets | | | 5.63 | % | | | 5.49 | % | | | 5.58 | % | | | 5.63 | % |
| Tangible Common Equity to Risk Weighted Assets | | | 9.63 | % | | | 9.52 | % | | | 9.90 | % | | | 9.81 | % |
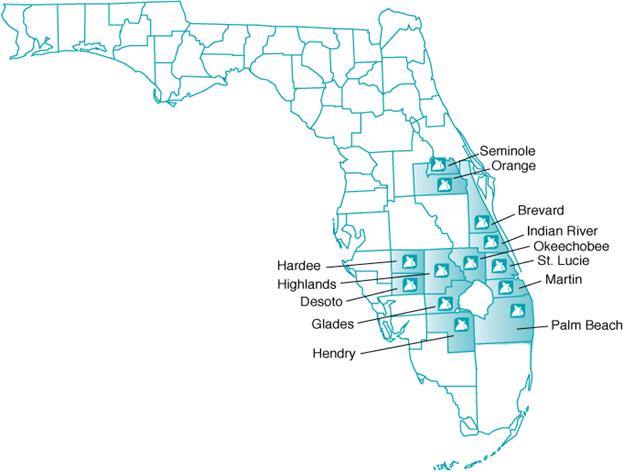
Service Area