Exhibit 99.1
Contact: (email) Chuck.Shaffer@SeacoastBank.com (phone) 772.221.7003 (web) www.SeacoastBanking.com Investor Presentation Q4 - 2017
This press release contains "forward - looking statements" within the meaning, and protections, of Section 27 A of the Securities Act of 1933 and Section 21 E of the Securities Exchange Act of 1934 , including, without limitation, statements about future financial and operating results, cost savings, enhanced revenues, economic and seasonal conditions in our markets, and improvements to reported earnings that may be realized from cost controls, tax law changes, and for integration of banks that we have acquired, or expect to acquire, as well as statements with respect to Seacoast's objectives, strategic plans, including Vision 2020 , expectations and intentions and other statements that are not historical facts . Actual results may differ from those set forth in the forward - looking statements . Forward - looking statements include statements with respect to our beliefs, plans, objectives, goals, expectations, anticipations, estimates and intentions, and involve known and unknown risks, uncertainties and other factors, which may be beyond our control, and which may cause the actual results, performance or achievements of Seacoast to be materially different from future results, performance or achievements expressed or implied by such forward - looking statements . You should not expect us to update any forward - looking statements . You can identify these forward - looking statements through our use of words such as “may,” “will,” “anticipate,” “assume,” “should,” “support”, “indicate,” “would,” “believe,” “contemplate,” “expect,” “estimate,” “continue,” “further”, “point to,” “project,” “could,” “intend” or other similar words and expressions of the future . These forward - looking statements may not be realized due to a variety of factors, including, without limitation : the effects of future economic and market conditions, including seasonality ; governmental monetary and fiscal policies, as well as legislative, tax and regulatory changes ; changes in accounting policies, rules and practices ; the risks of changes in interest rates on the level and composition of deposits, loan demand, liquidity and the values of loan collateral, securities, and interest sensitive assets and liabilities ; interest rate risks, sensitivities and the shape of the yield curve ; the effects of competition from other commercial banks, thrifts, mortgage banking firms, consumer finance companies, credit unions, securities brokerage firms, insurance companies, money market and other mutual funds and other financial institutions operating in our market areas and elsewhere, including institutions operating regionally, nationally and internationally, together with such competitors offering banking products and services by mail, telephone, computer and the Internet ; and the failure of assumptions underlying the establishment of reserves for possible loan losses . The risks of mergers and acquisitions, include, without limitation : unexpected transaction costs, including the costs of integrating operations ; the risks that the businesses will not be integrated successfully or that such integration may be more difficult, time - consuming or costly than expected ; the potential failure to fully or timely realize expected revenues and revenue synergies, including as the result of revenues following the merger being lower than expected ; the risk of deposit and customer attrition ; any changes in deposit mix ; unexpected operating and other costs, which may differ or change from expectations ; the risks of customer and employee loss and business disruption, including, without limitation, as the result of difficulties in maintaining relationships with employees ; increased competitive pressures and solicitations of customers by competitors ; as well as the difficulties and risks inherent with entering new markets . All written or oral forward - looking statements attributable to us are expressly qualified in their entirety by this cautionary notice, including, without limitation, those risks and uncertainties described in our annual report on Form 10 - K for the year ended December 31 , 2016 under “Special Cautionary Notice Regarding Forward - Looking Statements” and “Risk Factors”, and otherwise in our SEC reports and filings . Such reports are available upon request from the Company, or from the Securities and Exchange Commission, including through the SEC’s Internet website at http : //www . sec . gov . Cautionary Notice Regarding Forward - Looking Statements 2
Agenda 3 ABOUT SEACOAST BANK 1 COMPANY PERFORMANCE 2 SEACOAST’S DIFFERENTIATED STRATEGY 3 OUTLOOK 4
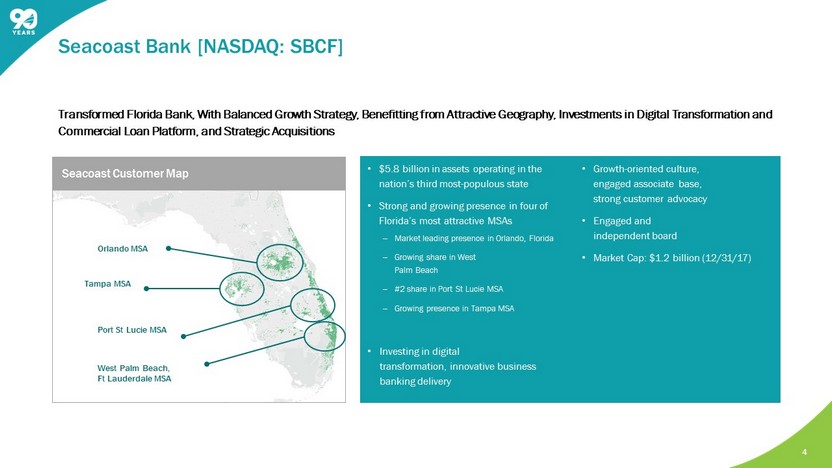
• $5.8 billion in assets operating in the nation’s third most - populous state • Strong and growing presence in four of Florida’s most attractive MSAs ‒ Market leading presence in Orlando, Florida ‒ Growing share in West Palm Beach ‒ #2 share in Port St Lucie MSA ‒ Growing presence in Tampa MSA • Investing in digital transformation, innovative business banking delivery • Growth - oriented culture, engaged associate base, strong customer advocacy • Engaged and independent board • Market Cap: $1.2 billion (12/31/17 ) Transformed Florida Bank , With Balanced Growth Strategy, Benefitting from Attractive Geography, Investments in Digital Transformation and Commercial Loan Platform, and Strategic Acquisitions 4 Seacoast Bank [NASDAQ: SBCF] Orlando MSA West Palm Beach, Ft Lauderdale MSA Port St Lucie MSA Tampa MSA Seacoast Customer Map
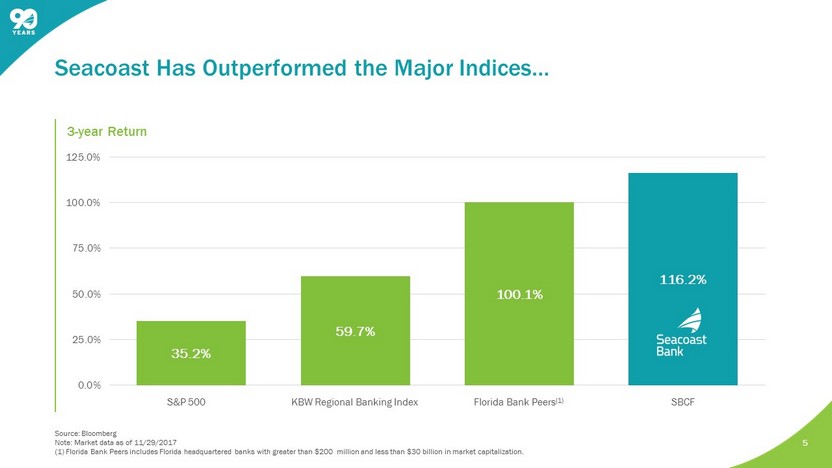
Florida Bank Peers (1) 5 Seacoast Has Outperformed the Major Indices… S&P 500 SBC F KBW Regional Banking Index Source: Bloomberg Note: Market data as of 11/29/2017 (1) Florida Bank Peers includes Florida headquartered banks with greater than $200 m illion and less than $30 billion in market capitalization. 3 - year Return 35.2% 59.7% 100.1% 116.2% 0.0% 25.0% 50.0% 75.0% 100.0% 125.0%
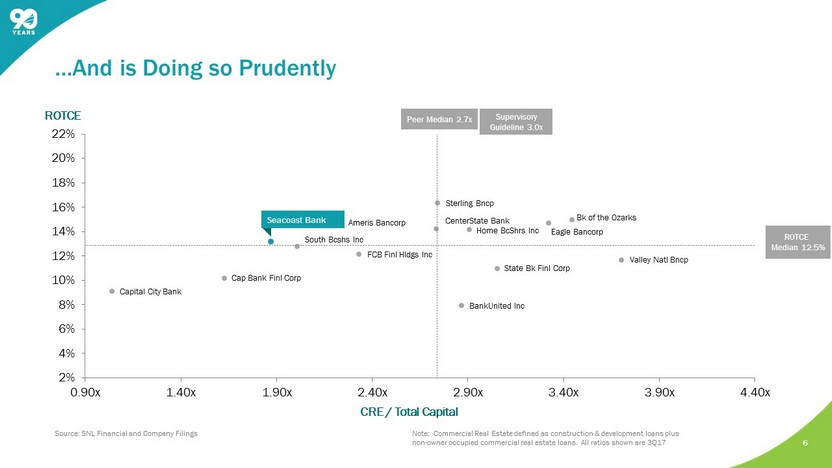
6 …And is Doing so Prudently Source: SNL Financial and Company Filings Note: Commercial Real Estate defined as construction & development loans plus non - owner occupied commercial real estate loans. All ratios shown are 3 Q17 ROTCE Median 12.5% FCB Finl Hldgs Inc CenterState Bank Cap Bank Finl Corp State Bk Finl Corp BankUnited Inc Capital City Bank Home BcShrs Inc South Bcshs Inc Sterling Bncp Ameris Bancorp Eagle Bancorp Valley Natl Bncp Bk of the Ozarks 2% 4% 6% 8% 10% 12% 14% 16% 18% 20% 22% 0.90x 1.40x 1.90x 2.40x 2.90x 3.40x 3.90x 4.40x CRE / Total Capital ROTCE Seacoast Bank Peer Median 2.7x Supervisory Guideline 3.0x
Agenda 7 ABOUT SEACOAST BANK 1 COMPANY PERFORMANCE 2 SEACOAST’S DIFFERENTIATED STRATEGY 3 OUTLOOK 4
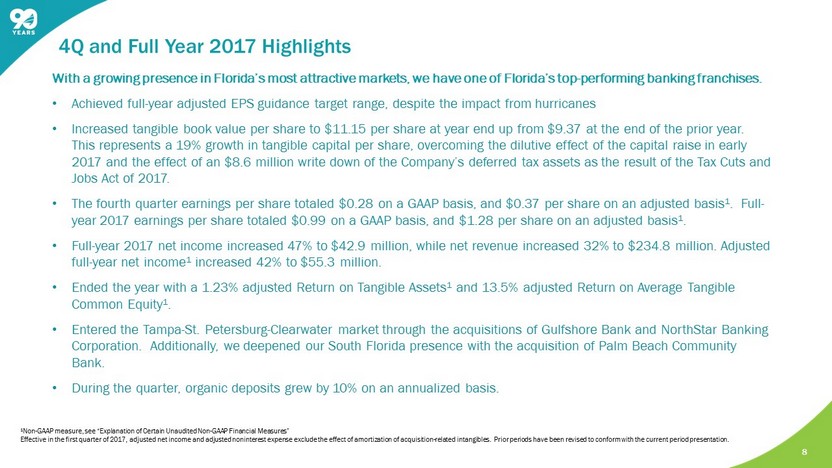
8 4Q and Full Year 2017 Highlights With a growing presence in Florida’s most attractive markets, we have one of Florida’s top - performing banking franchises. • Achieved full - year adjusted EPS guidance target range, despite the impact from hurricanes • Increased tangible book value per share to $11.15 per share at year end up from $9.37 at the end of the prior year. This represents a 19% growth in tangible capital per share, overcoming the dilutive effect of the capital raise in early 2017 and the effect of an $8.6 million write down of the Company’s deferred tax assets as the result of the Tax Cuts and Jobs Act of 2017. • The fourth quarter earnings per share totaled $ 0.28 on a GAAP basis, and $0.37 per share on an adjusted basis 1 . Full - year 2017 earnings per share totaled $0.99 on a GAAP basis, and $1.28 per share on an adjusted basis 1 . • Full - year 2017 net income increased 47% to $42.9 million, while net revenue increased 32% to $234.8 million . Adjusted full - year net income 1 increased 42% to $55.3 million. • Ended the year with a 1.23% adjusted Return on Tangible Assets 1 and 13.5% adjusted Return on Average Tangible Common Equity 1 . • E ntered the Tampa - St. Petersburg - Clearwater market through the acquisitions of Gulfshore Bank and NorthStar Banking Corporation. Additionally, we deepened our South Florida presence with the acquisition of Palm Beach Community Bank. • During the quarter, organic deposits grew by 10% on an annualized basis. 1 Non - GAAP measure, see “Explanation of Certain Unaudited Non - GAAP Financial Measures” Effective in the first quarter of 2017, adjusted net income and adjusted noninterest expense exclude the effect of amortizati on of acquisition - related intangibles. Prior periods have been revised to conform with the current period presentation.
9 Notable Items Affecting Fourth Quarter 2017 Results Tax Cuts and Jobs Act of 2017 • An estimated $8.6 million of additional income tax expense was recorded to write down the Company’s net deferred tax assets as a result of the Tax Cuts and Jobs Act of 2017. The Company’s effective tax rate will decline in 2018 from 35.1% to 23.1%. Hurricane Impacts • The Company’s results in both the third and fourth quarter were impacted by the fall season hurricanes as a result of waived service charges, recovery expenses, a charge - off related to a single Caribbean exporter, and business disruption. Sale of Visa Class B Shares • A $15.2 million gain on sale of shares of Visa Class B was recorded in the fourth quarter. These shares were purchased in early 2017. Merger and acquisition related charges • During the fourth quarter, the company recorded $6.8 million in merger related charges associated with change in control payments, legal and investment banking fees and contract termination expenses associated with the purchase of NorthStar Banking Corporation and Palm Beach Community Bank.
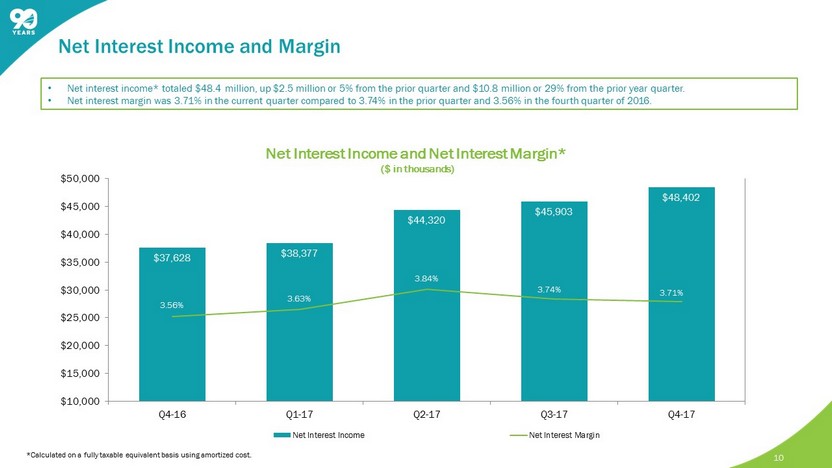
10 Net Interest Income and Net Interest Margin* ($ in thousands) • Net interest income* totaled $48.4 million, up $2.5 million or 5% from the prior quarter and $10.8 million or 29% from the prior year quarter. • Net interest margin was 3.71% in the current quarter compared to 3.74% in the prior quarter and 3.56% in the fourth quarter of 2016. *Calculated on a fully taxable equivalent basis using amortized cost. Net Interest Income and Margin $37,628 $38,377 $44,320 $45,903 $48,402 3.56% 3.63% 3.84% 3.74% 3.71% $10,000 $15,000 $20,000 $25,000 $30,000 $35,000 $40,000 $45,000 $50,000 Q4-16 Q1-17 Q2-17 Q3-17 Q4-17 Net Interest Income Net Interest Margin
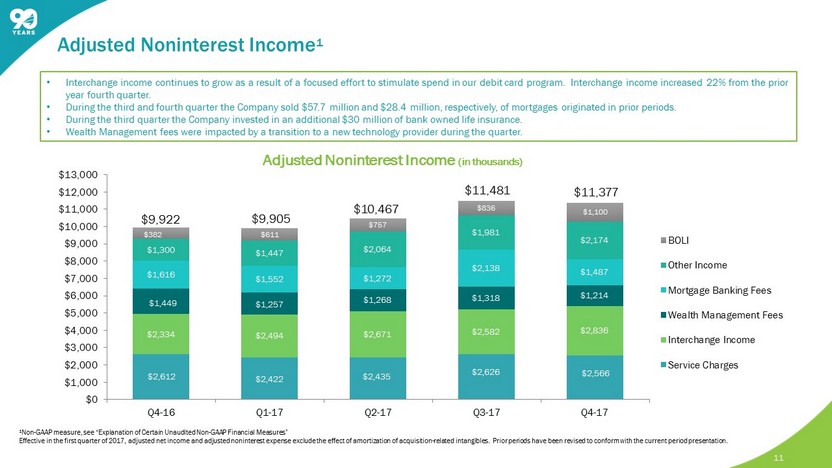
11 $2,612 $2,422 $2,435 $2,626 $2,566 $2,334 $2,494 $2,671 $2,582 $2,836 $1,449 $1,257 $1,268 $1,318 $1,214 $1,616 $1,552 $1,272 $2,138 $1,487 $1,300 $1,447 $2,064 $1,981 $2,174 $611 $757 $836 $1,100 $0 $1,000 $2,000 $3,000 $4,000 $5,000 $6,000 $7,000 $8,000 $9,000 $10,000 $11,000 $12,000 $13,000 Q4-16 Q1-17 Q2-17 Q3-17 Q4-17 BOLI Other Income Mortgage Banking Fees Wealth Management Fees Interchange Income Service Charges $836 Adjusted Noninterest Income (in thousands) $9,922 • Interchange income continues to grow as a result of a focused effort to stimulate spend in our debit card program. Interchan ge income increased 22% from the prior year fourth quarter. • During the third and fourth quarter the Company sold $ 57.7 million and $28.4 million, respectively, of mortgages originated in prior periods. • During the third quarter the Company invested in an additional $30 million of bank owned life insurance. • Wealth Management fees were impacted by a transition to a new technology provider during the quarter. $9,905 $10,467 $11,481 $11,377 $ 382 Adjusted Noninterest Income 1 1 Non - GAAP measure, see “Explanation of Certain Unaudited Non - GAAP Financial Measures” Effective in the first quarter of 2017, adjusted net income and adjusted noninterest expense exclude the effect of amortizati on of acquisition - related intangibles. Prior periods have been revised to conform with the current period presentation.
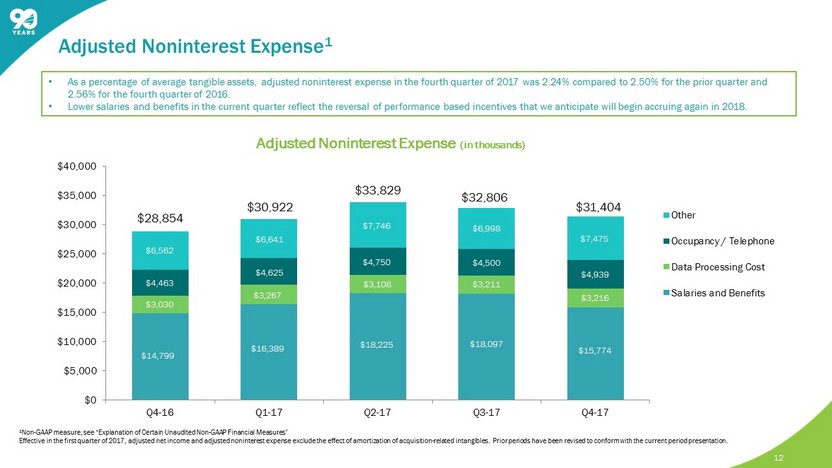
12 $14,799 $16,389 $18,225 $18,097 $15,774 $3,030 $3,267 $3,108 $3,211 $3,216 $4,463 $4,625 $4,750 $4,500 $4,939 $6,562 $6,641 $7,746 $6,998 $7,475 $0 $5,000 $10,000 $15,000 $20,000 $25,000 $30,000 $35,000 $40,000 Q4-16 Q1-17 Q2-17 Q3-17 Q4-17 Other Occupancy / Telephone Data Processing Cost Salaries and Benefits Adjusted Noninterest Expense (in thousands) $31,404 $28,854 $30,922 $33,829 $32,806 • As a percentage of average tangible assets, adjusted noninterest expense in the fourth quarter of 2017 was 2.24% compared to 2.50% for the prior quarter and 2.56 % for the fourth quarter of 2016. • Lower salaries and benefits in the current quarter reflect the reversal of performance based incentives that we anticipate wi ll begin accruing again in 2018. 1 Non - GAAP measure, see “Explanation of Certain Unaudited Non - GAAP Financial Measures” Effective in the first quarter of 2017, adjusted net income and adjusted noninterest expense exclude the effect of amortizati on of acquisition - related intangibles. Prior periods have been revised to conform with the current period presentation. Adjusted Noninterest Expense 1
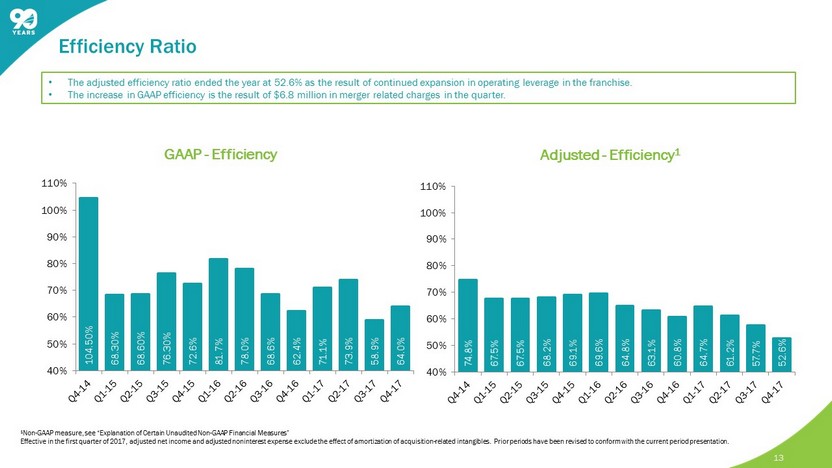
13 104.50% 68.30% 68.60% 76.30% 72.6% 81.7% 78.0% 68.6% 62.4% 71.1% 73.9% 58.9% 64.0% 40% 50% 60% 70% 80% 90% 100% 110% GAAP - Efficiency 74.8% 67.5% 67.5% 68.2% 69.1% 69.6% 64.8% 63.1% 60.8% 64.7% 61.2% 57.7% 52.6% 40% 50% 60% 70% 80% 90% 100% 110% Adjusted - Efficiency 1 1 Non - GAAP measure, see “Explanation of Certain Unaudited Non - GAAP Financial Measures” Effective in the first quarter of 2017, adjusted net income and adjusted noninterest expense exclude the effect of amortizati on of acquisition - related intangibles. Prior periods have been revised to conform with the current period presentation. • The adjusted efficiency ratio ended the year at 52.6% as the result of continued expansion in operating leverage in the franc his e. • The increase in GAAP efficiency is the result of $6.8 million in merger related charges in the quarter. Efficiency Ratio
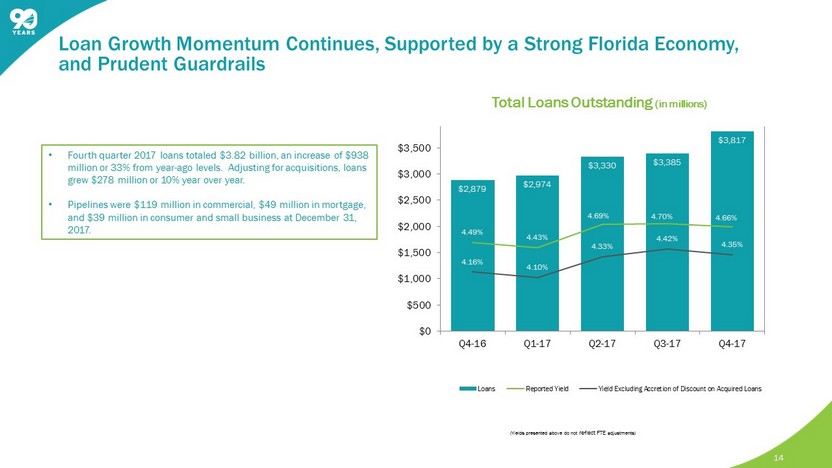
14 Total Loans Outstanding (in millions) • Fourth quarter 2017 loans totaled $3.82 billion, an increase of $938 million or 33% from year - ago levels. Adjusting for acquisitions, loans grew $278 million or 10% year over year. • Pipelines were $119 million in commercial, $49 million in mortgage, and $39 million in consumer and small business at December 31, 2017. $2,879 $2,974 $3,330 $3,385 $3,817 4.49% 4.43% 4.69% 4.70% 4.66% 4.16% 4.10% 4.33% 4.42% 4.35% $0 $500 $1,000 $1,500 $2,000 $2,500 $3,000 $3,500 Q4-16 Q1-17 Q2-17 Q3-17 Q4-17 Loans Reported Yield Yield Excluding Accretion of Discount on Acquired Loans Loan Growth Momentum Continues, Supported by a Strong Florida Economy, and Prudent Guardrails (Yields presented above do not reflect FTE adjustments)
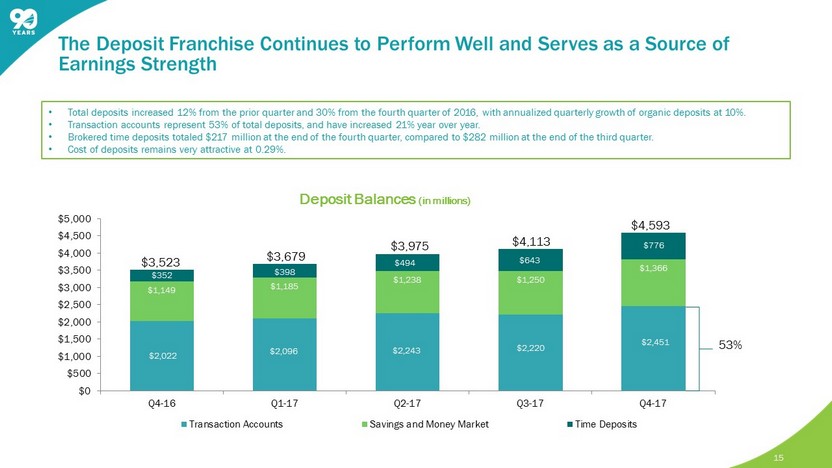
15 • Total deposits increased 12% from the prior quarter and 30% from the fourth quarter of 2016, with annualized quarterly growth of organic deposits at 10%. • Transaction accounts represent 53% of total deposits, and have increased 21% year over year. • Brokered time deposits totaled $217 million at the end of the fourth quarter, compared to $282 million at the end of the third quarter. • Cost of deposits remains very attractive at 0.29%. $2,022 $2,096 $2,243 $2,220 $2,451 $1,149 $1,185 $1,238 $1,250 $1,366 $352 $398 $494 $643 $776 $0 $500 $1,000 $1,500 $2,000 $2,500 $3,000 $3,500 $4,000 $4,500 $5,000 Q4-16 Q1-17 Q2-17 Q3-17 Q4-17 Transaction Accounts Savings and Money Market Time Deposits Deposit Balances (in millions) $4,593 $3,523 $3,679 $3,975 53% $4,113 The Deposit Franchise Continues to Perform Well and Serves as a Source of Earnings Strength
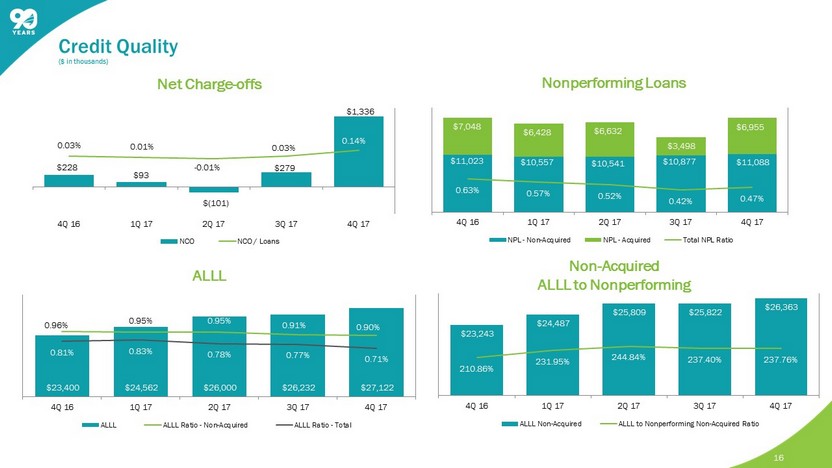
16 Net Charge - offs Nonperforming Loans ALLL $23,400 $24,562 $26,000 $26,232 $27,122 0.96% 0.95% 0.95% 0.91% 0.90% 0.81% 0.83% 0.78% 0.77% 0.71% 4Q 16 1Q 17 2Q 17 3Q 17 4Q 17 ALLL ALLL Ratio - Non-Acquired ALLL Ratio - Total Non - Acquired ALLL to Nonperforming $228 $93 $(101) $279 $1,336 0.03% 0.01% - 0.01% 0.03% 0.14% 4Q 16 1Q 17 2Q 17 3Q 17 4Q 17 NCO NCO / Loans $11,023 $10,557 $10,541 $10,877 $11,088 $7,048 $6,428 $6,632 $3,498 $6,955 0.63% 0.57% 0.52% 0.42% 0.47% 4Q 16 1Q 17 2Q 17 3Q 17 4Q 17 NPL - Non-Acquired NPL - Acquired Total NPL Ratio Credit Quality ($ in thousands) $23,243 $24,487 $25,809 $25,822 $26,363 210.86% 231.95% 244.84% 237.40% 237.76% 4Q 16 1Q 17 2Q 17 3Q 17 4Q 17 ALLL Non-Acquired ALLL to Nonperforming Non-Acquired Ratio
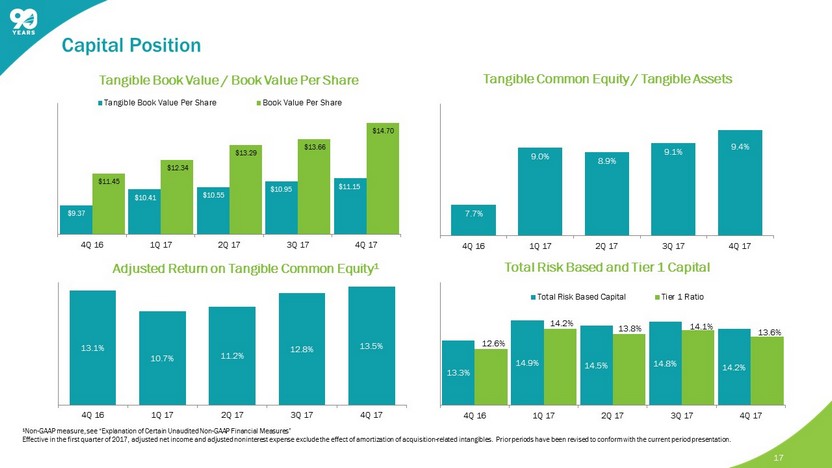
Capital Position 17 Tangible Book Value / Book Value Per Share $9.37 $10.41 $10.55 $10.95 $11.15 $11.45 $12.34 $13.29 $13.66 $14.70 4Q 16 1Q 17 2Q 17 3Q 17 4Q 17 Tangible Book Value Per Share Book Value Per Share 13.1% 10.7% 11.2% 12.8% 13.5% 4Q 16 1Q 17 2Q 17 3Q 17 4Q 17 Adjusted Return on Tangible Common Equity 1 13.3% 14.9% 14.5% 14.8% 14.2% 12.6% 14.2% 13.8% 14.1% 13.6% 4Q 16 1Q 17 2Q 17 3Q 17 4Q 17 Total Risk Based Capital Tier 1 Ratio Total Risk Based and Tier 1 Capital Tangible Common Equity / Tangible Assets 7.7% 9.0% 8.9% 9.1% 9.4% 4Q 16 1Q 17 2Q 17 3Q 17 4Q 17 1 Non - GAAP measure, see “Explanation of Certain Unaudited Non - GAAP Financial Measures” Effective in the first quarter of 2017, adjusted net income and adjusted noninterest expense exclude the effect of amortizati on of acquisition - related intangibles. Prior periods have been revised to conform with the current period presentation.
Agenda 18 ABOUT SEACOAST BANK 1 COMPANY PERFORMANCE 2 SEACOAST’S DIFFERENTIATED STRATEGY 3 OUTLOOK 4
19 Experienced Board & Management Team Comprehensive Customer Servicing Model Track Record of Value - Creating Acquisitions Expanding Analytical & Digital Capabilities Well - Positioned to Benefit From Florida Market Focused on Controls Seacoast’s Differentiated Strategy
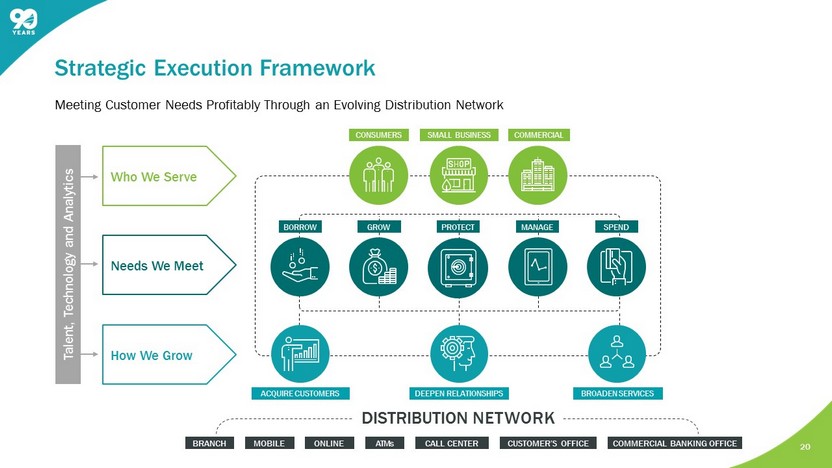
DISTRIBUTION NETWORK 20 Meeting Customer Needs Profitably Through an Evolving Distribution Network Strategic Execution Framework BRANCH COMMERCIAL BANKING OFFICE MOBILE ONLINE ATMs CALL CENTER CUSTOMER’S OFFICE Talent, Technology and Analytics ACQUIRE CUSTOMERS DEEPEN RELATIONSHIPS BROADEN SERVICES Who We Serve Needs We Meet How We Grow COMMERCIAL SMALL BUSINESS CONSUMERS BORROW GROW PROTECT MANAGE SPEND
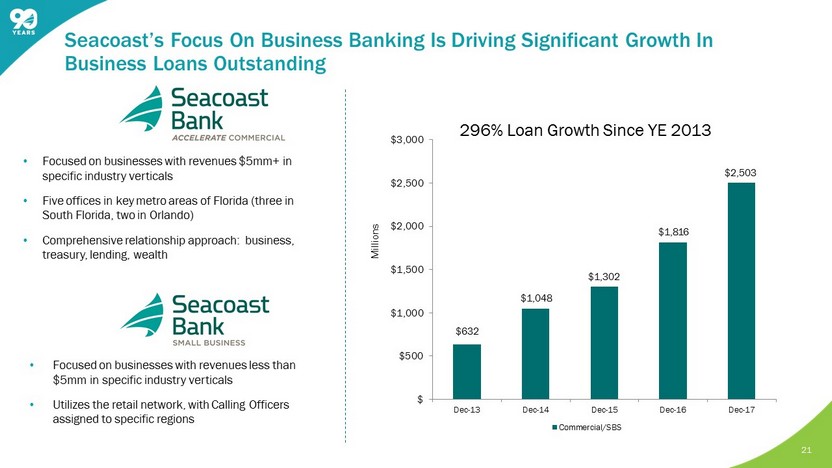
Seacoast’s Focus On Business Banking Is Driving Significant Growth In Business Loans Outstanding • Focused on businesses with revenues $5mm+ in specific industry verticals • Five offices in key metro areas of Florida (three in South Florida, two in Orlando) • Comprehensive relationship approach: business, treasury, lending, wealth 21 Investor Presentation • Focused on businesses with revenues less than $5mm in specific industry verticals • Utilizes the retail network, with Calling Officers assigned to specific regions 296% Loan Growth S ince YE 2013 M illions $632 $1,048 $1,302 $1,816 $2,503 $ $500 $1,000 $1,500 $2,000 $2,500 $3,000 Dec-13 Dec-14 Dec-15 Dec-16 Dec-17 Commercial/SBS
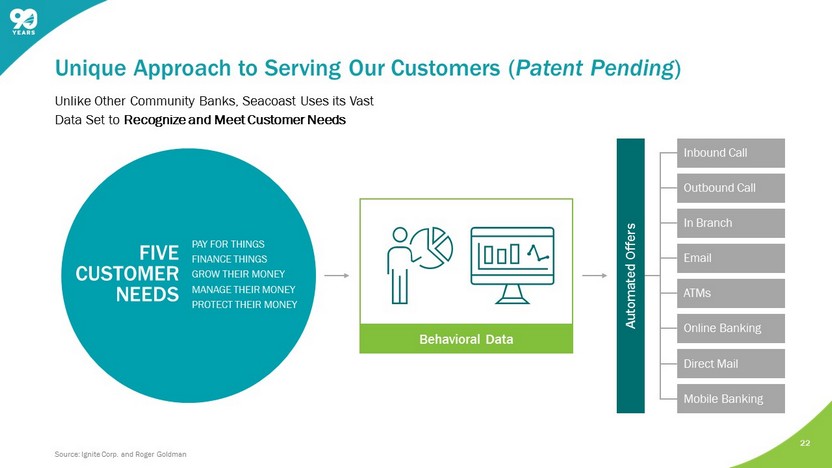
Unlike Other Community Banks, Seacoast Uses its Vast Data Set to Recognize and Meet Customer Needs Automated Offers Inbound Call Outbound Call In Branch Email ATMs Online Banking Direct Mail Mobile Banking 22 Unique Approach to Serving Our Customers ( Patent Pending ) Behavioral Data FIVE CUSTOMER NEEDS PAY FOR THINGS FINANCE THINGS GROW THEIR MONEY MANAGE THEIR MONEY PROTECT THEIR MONEY Source: Ignite Corp. and Roger Goldman
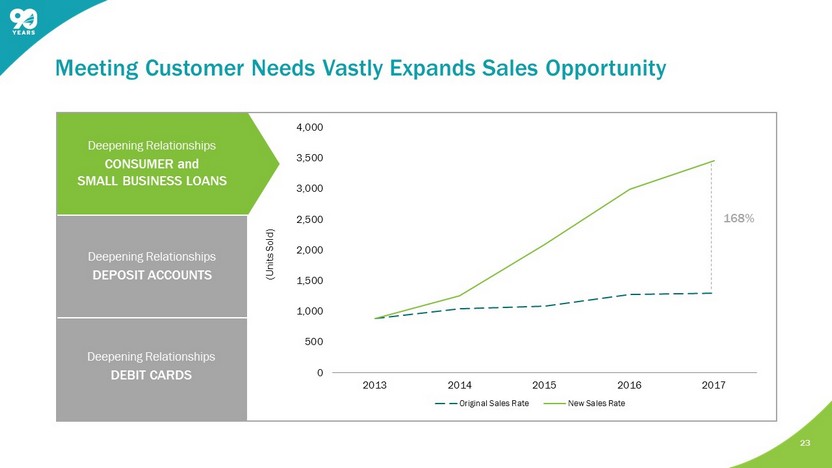
23 Meeting Customer Needs Vastly Expands Sales Opportunity Deepening Relationships CONSUMER and SMALL BUSINESS LOANS Deepening Relationships DEPOSIT ACCOUNTS Deepening Relationships DEBIT CARDS (Units Sold) 0 500 1,000 1,500 2,000 2,500 3,000 3,500 4,000 2013 2014 2015 2016 2017 Original Sales Rate New Sales Rate 168%
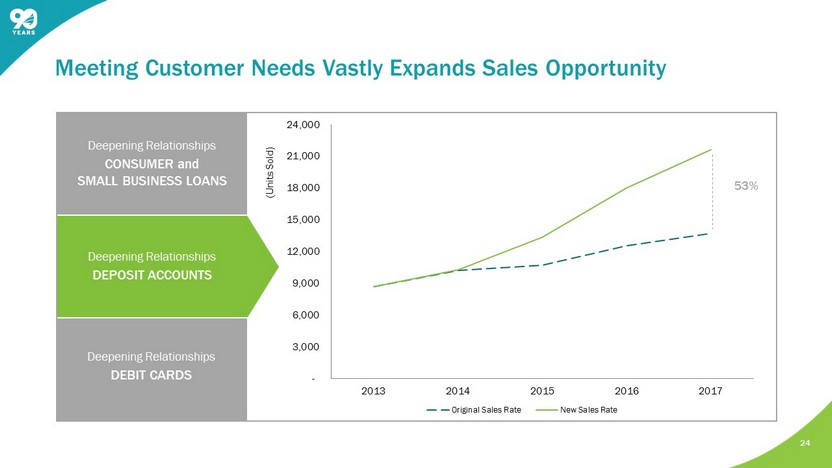
24 Meeting Customer Needs Vastly Expands Sales Opportunity Deepening Relationships CONSUMER and SMALL BUSINESS LOANS Deepening Relationships DEPOSIT ACCOUNTS Deepening Relationships DEBIT CARDS (Units Sold) - 3,000 6,000 9,000 12,000 15,000 18,000 21,000 24,000 2013 2014 2015 2016 2017 Original Sales Rate New Sales Rate 53%
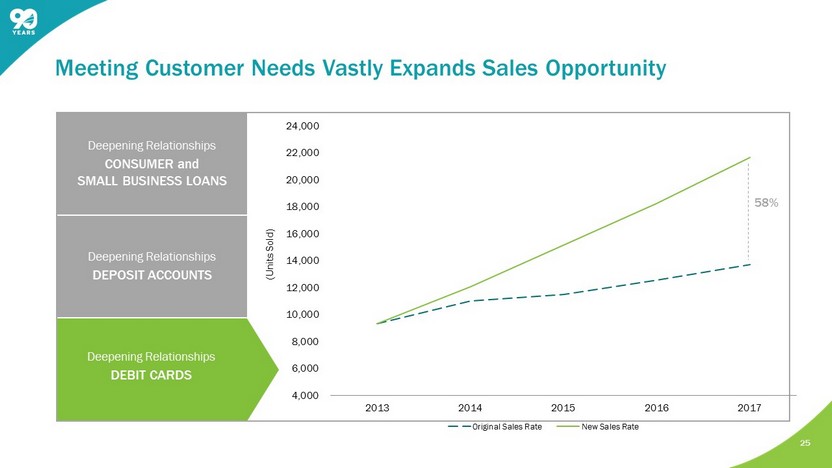
25 Meeting Customer Needs Vastly Expands Sales Opportunity Deepening Relationships CONSUMER and SMALL BUSINESS LOANS Deepening Relationships DEPOSIT ACCOUNTS Deepening Relationships DEBIT CARDS (Units Sold) 4,000 6,000 8,000 10,000 12,000 14,000 16,000 18,000 20,000 22,000 24,000 2013 2014 2015 2016 2017 Original Sales Rate New Sales Rate 58%
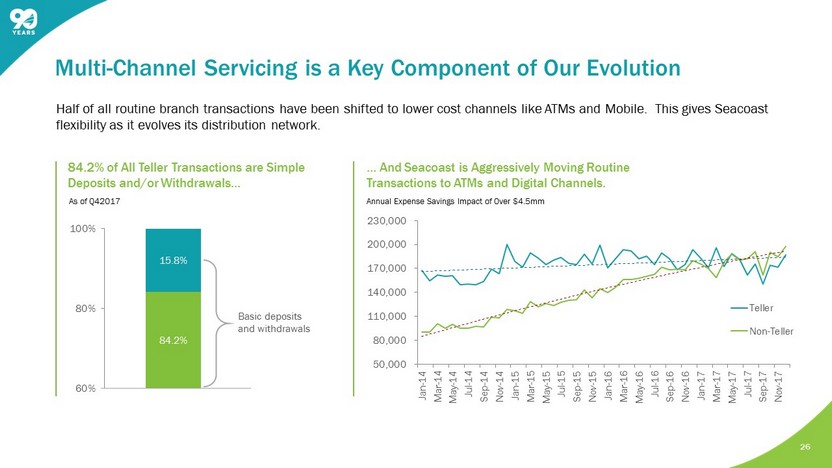
26 Half of all routine branch transactions have been shifted to lower cost channels like ATMs and Mobile. This gives Seacoast flexibility as it evolves its distribution network. Multi - Channel Servicing is a Key Component of Our Evolution … And Seacoast is Aggressively Moving Routine Transactions to ATMs and Digital Channels. Annual Expense Savings Impact of Over $4.5mm 84.2% 15.8% 60% 80% 100% Basic deposits and withdrawals 84.2% of All Teller Transactions are Simple Deposits and/or Withdrawals… 50,000 80,000 110,000 140,000 170,000 200,000 230,000 Jan-14 Mar-14 May-14 Jul-14 Sep-14 Nov-14 Jan-15 Mar-15 May-15 Jul-15 Sep-15 Nov-15 Jan-16 Mar-16 May-16 Jul-16 Sep-16 Nov-16 Jan-17 Mar-17 May-17 Jul-17 Sep-17 Nov-17 Teller Non-Teller As of Q42017
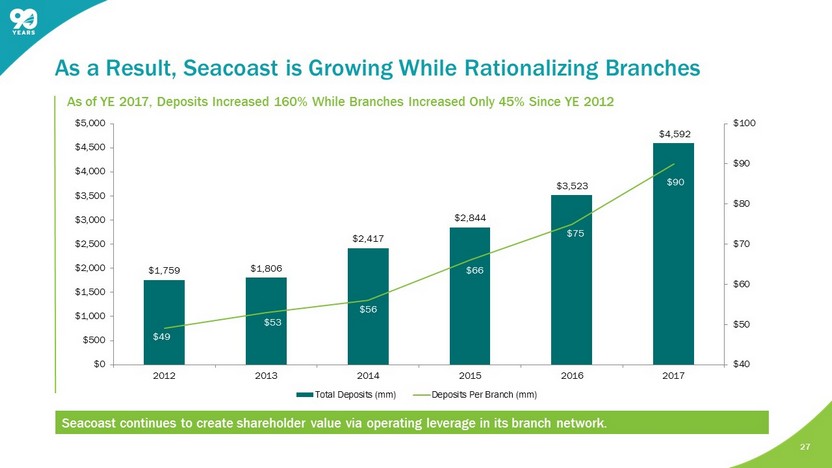
As a Result, Seacoast is Growing While Rationalizing Branches Seacoast continues to create shareholder value via operating leverage in its branch network. As of YE 2017, Deposits Increased 160% While Branches Increased Only 45% S ince YE 2012 27 $1,759 $1,806 $2,417 $2,844 $3,523 $4,592 $49 $53 $56 $66 $75 $90 $40 $50 $60 $70 $80 $90 $100 $0 $500 $1,000 $1,500 $2,000 $2,500 $3,000 $3,500 $4,000 $4,500 $5,000 2012 2013 2014 2015 2016 2017 Total Deposits (mm) Deposits Per Branch (mm)

28 Experienced Board & Management Team Comprehensive Customer Servicing Model Track Record of Value - Creating Acquisitions Expanding Analytical & Digital Capabilities Well - Positioned to Benefit From Florida Market Focused on Controls Seacoast’s Differentiated Strategy
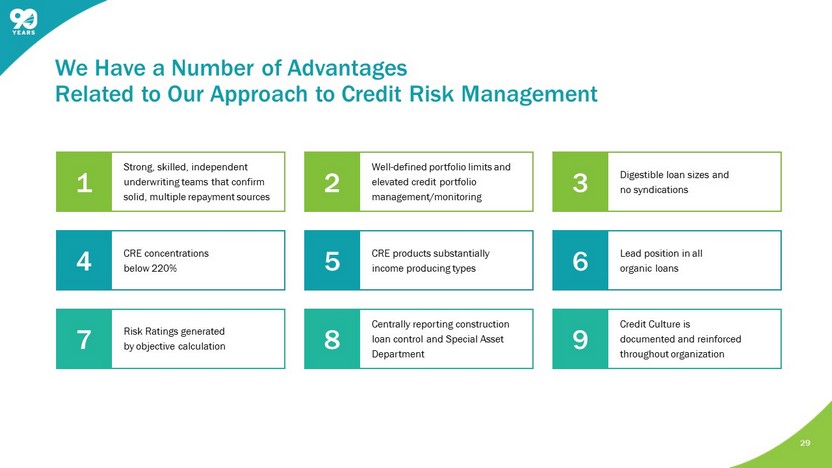
29 We Have a Number of Advantages Related to Our Approach to Credit Risk Management 1 Strong, skilled, independent underwriting teams that confirm solid, multiple repayment sources 2 Well - defined portfolio limits and elevated credit portfolio management/monitoring 3 Digestible loan sizes and no syndications 4 CRE concentrations below 220% 5 CRE products substantially income producing types 6 Lead position in all organic loans 7 Risk Ratings generated by objective calculation 8 Centrally reporting construction loan control and Special Asset Department 9 Credit Culture is documented and reinforced throughout organization
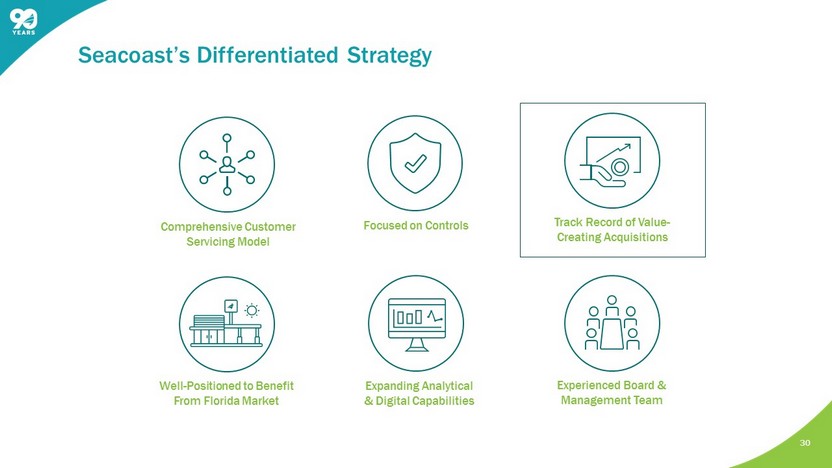
30 Experienced Board & Management Team Comprehensive Customer Servicing Model Track Record of Value - Creating Acquisitions Expanding Analytical & Digital Capabilities Well - Positioned to Benefit From Florida Market Focused on Controls Seacoast’s Differentiated Strategy
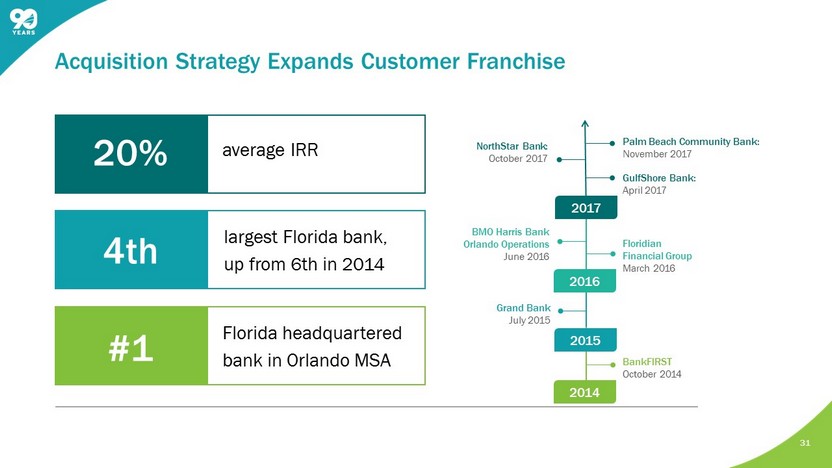
31 Acquisition Strategy Expands Customer Franchise GulfShore Bank: April 2017 BMO Harris Bank Orlando Operations June 2016 Floridian Financial Group March 2016 Grand Bank July 2015 BankFIRST October 2014 2014 2015 2016 2017 20% a verage IRR 4th largest Florida bank, up from 6th in 2014 #1 Florida headquartered bank in Orlando MSA NorthStar Bank: October 2017 Palm Beach Community Bank: November 2017
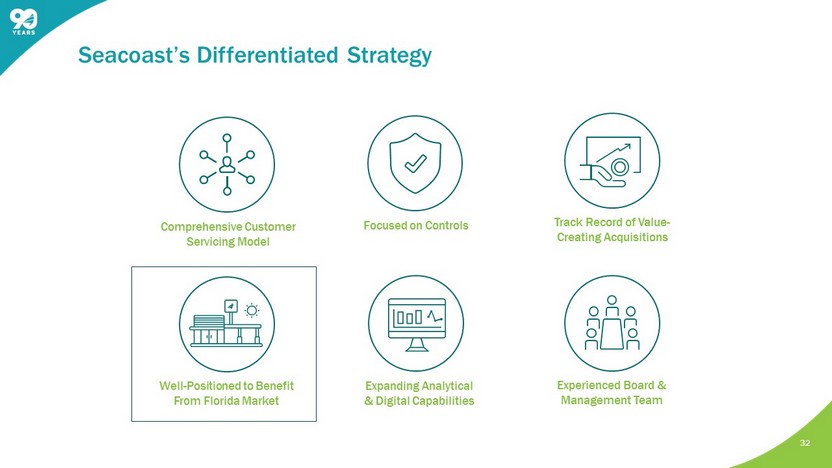
32 Experienced Board & Management Team Comprehensive Customer Servicing Model Track Record of Value - Creating Acquisitions Expanding Analytical & Digital Capabilities Well - Positioned to Benefit From Florida Market Focused on Controls Seacoast’s Differentiated Strategy
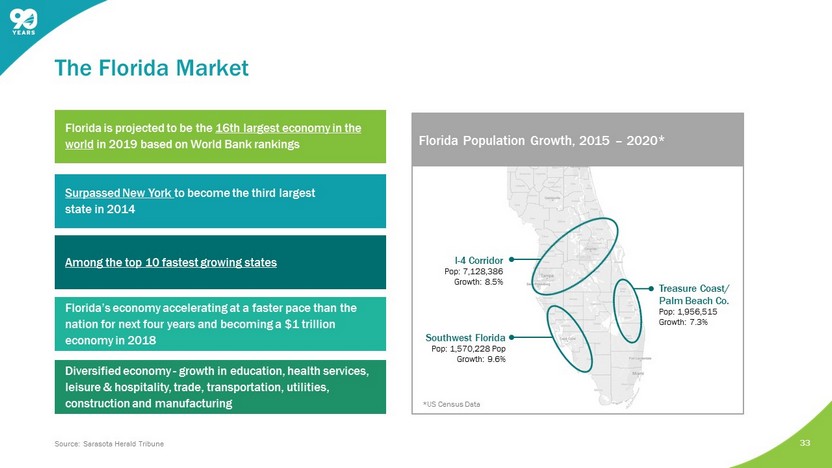
Southwest Florida Pop: 1,570,228 Pop Growth: 9.6% Treasure Coast/ Palm Beach Co. Pop: 1,956,515 Growth: 7.3% I - 4 Corridor Pop: 7,128,386 Growth: 8.5% *US Census Data Among the top 10 fastest growing states Surpassed New York to become the third largest state in 2014 Florida’s economy accelerating at a faster pace than the nation for next four years and becoming a $1 trillion economy in 2018 Florida is projected to be the 16th largest economy in the world in 2019 based on World Bank rankings Diversified economy - growth in education, health services, leisure & hospitality, trade, transportation, utilities, construction and manufacturing Florida Population Growth, 2015 – 2020* 33 The Florida Market Source: Sarasota Herald Tribune
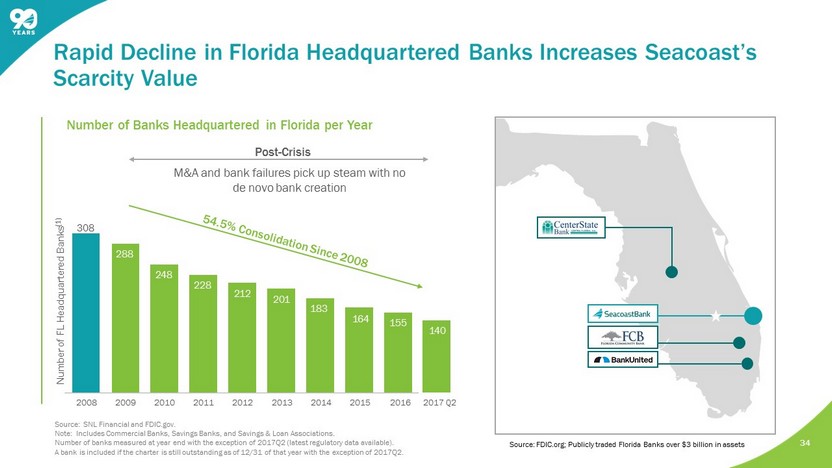
34 Number of Banks Headquartered in Florida per Year Rapid Decline in Florida Headquartered Banks Increases Seacoast’s Scarcity Value Post - Crisis M&A and bank failures pick up steam with no de novo bank creation Source: SNL Financial and FDIC.gov. Note: Includes Commercial Banks, Savings Banks, and Savings & Loan Associations. Number of banks measured at year end with the exception of 2017Q2 (latest regulatory data available). A bank is included if the charter is still outstanding as of 12/31 of that year with the exception of 2017Q2. Source: FDIC.org; Publicly traded Florida Banks over $3 billion in assets Number of FL Headquartered Banks (1) 308 2008 2009 2010 2011 2012 2013 2014 2015 2016 288 248 228 212 201 183 164 155 2017 Q2 140

35 Experienced Board & Management Team Comprehensive Customer Servicing Model Track Record of Value - Creating Acquisitions Expanding Analytical & Digital Capabilities Well - Positioned to Benefit From Florida Market Focused on Controls Seacoast’s Differentiated Strategy
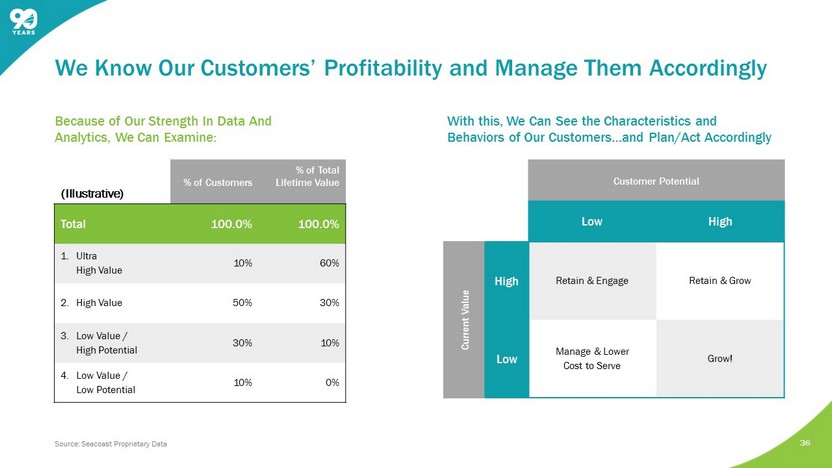
36 Because of Our Strength In Data And Analytics, We Can Examine: We Know Our Customers’ Profitability and Manage Them Accordingly Customer Potential Low High Current Value High Retain & Engage Retain & Grow Low Manage & Lower Cost to Serve Grow! With this, We Can See the Characteristics and Behaviors of Our Customers…and Plan/Act Accordingly (Illustrative) % of Customers % of Total Lifetime Value Total 100.0% 100.0% 1. Ultra High Value 10% 60% 2. High Value 50% 30% 3. Low Value / High Potential 30% 10% 4. Low Value / Low Potential 10% 0% Source: Seacoast Proprietary Data
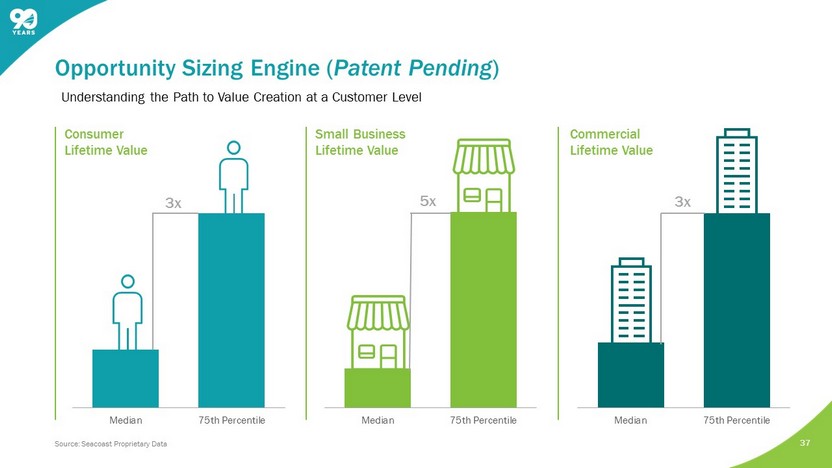
Median 75th Percentile 37 Opportunity Sizing Engine ( Patent Pending ) Consumer Lifetime Value Small Business Lifetime Value 3x Median 75th Percentile 5x Median 75th Percentile 3x Commercial Lifetime Value Source: Seacoast Proprietary Data Understanding the Path to Value Creation at a Customer Level
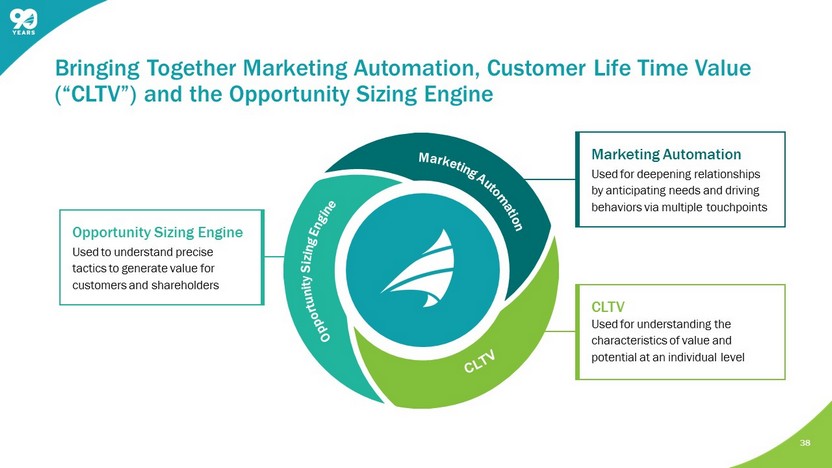
Opportunity Sizing Engine Used to understand precise tactics to generate value for customers and shareholders 38 Bringing Together Marketing Automation, Customer Life Time Value (“CLTV”) and the Opportunity Sizing Engine CLTV Used for understanding the characteristics of value and potential at an individual level Marketing Automation Used for deepening relationships by anticipating needs and driving behaviors via multiple touchpoints

39 Experienced Board & Management Team Comprehensive Customer Servicing Model Track Record of Value - Creating Acquisitions Expanding Analytical & Digital Capabilities Well - Positioned to Benefit From Florida Market Focused on Controls Seacoast’s Differentiated Strategy
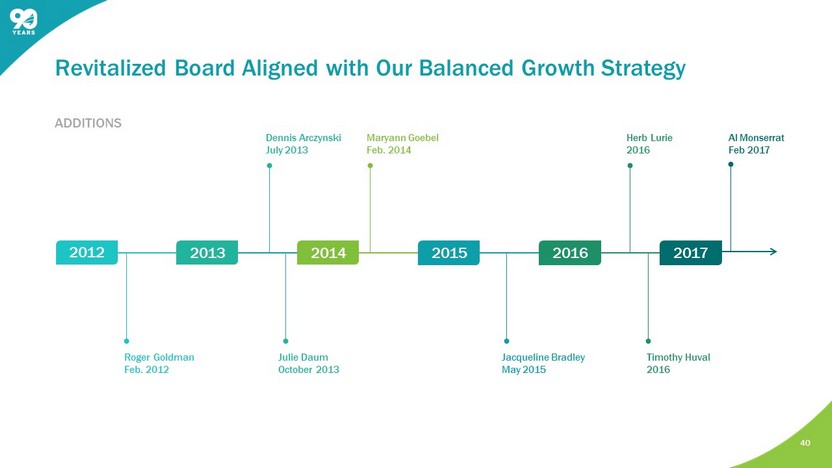
40 Revitalized Board Aligned with Our Balanced Growth Strategy ADDITIONS Herb Lurie 2016 Jacqueline Bradley May 2015 Maryann Goebel Feb. 2014 Roger Goldman Feb. 2012 Julie Daum October 2013 Dennis Arczynski July 2013 Timothy Huval 2016 2012 2013 2014 2015 2016 2017 Al Monserrat Feb 201 7
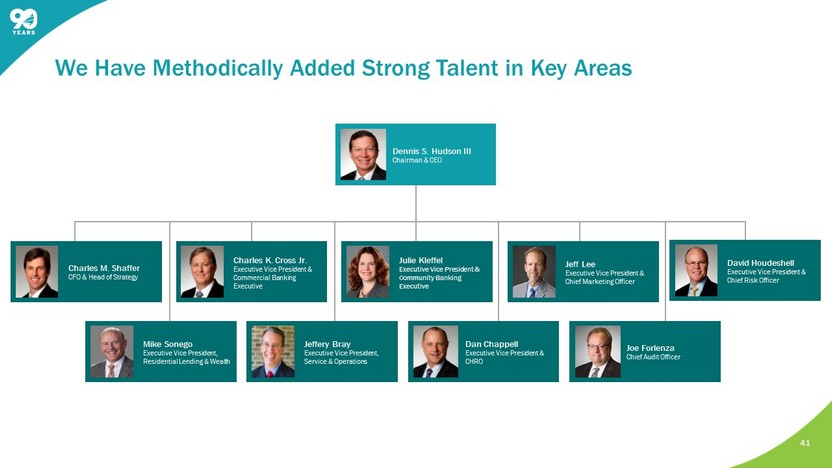
41 We Have Methodically Added Strong Talent in Key Areas Dennis S. Hudson III Chairman & CEO Charles M. Shaffer CFO & Head of Strategy Charles K. Cross Jr. Executive Vice President & Commercial Banking Executive Julie Kleffel Executive Vice President & Community Banking Executive Joe Forlenza Chief Audit Officer Mike Sonego Executive Vice President, Residential Lending & Wealth David Houdeshell Executive Vice President & Chief Risk Officer Jeff Lee Executive Vice President & Chief Marketing Officer Dan Chappell Executive Vice President & CHRO Jeffery Bray Executive Vice President, Service & Operations
Agenda 42 ABOUT SEACOAST BANK 1 COMPANY PERFORMANCE 2 SEACOAST’S DIFFERENTIATED STRATEGY 3 OUTLOOK 4
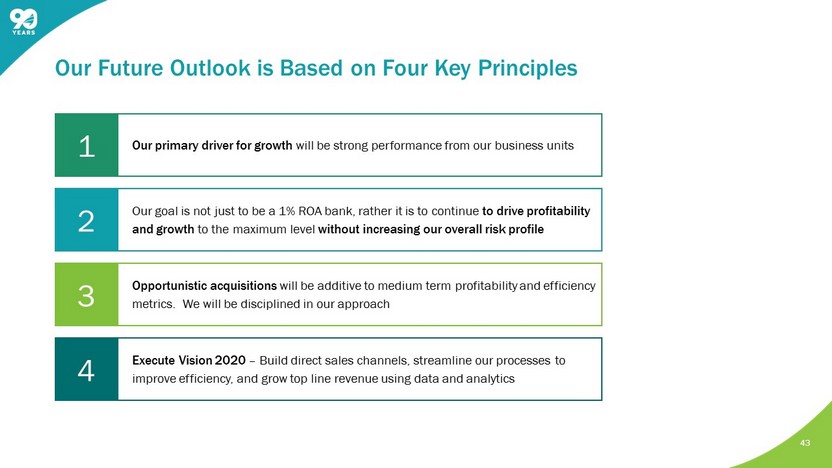
43 Our Future Outlook is Based on Four Key Principles 1 Our primary driver for growth will be strong performance from our business units 2 Our goal is not just to be a 1 % ROA bank, rather it is to continue to drive profitability and growth to the maximum level without increasing our overall risk profile 3 Opportunistic acquisitions will be additive to medium term profitability and efficiency metrics. We will be disciplined in our approach 4 Execute Vision 2020 – Build direct sales channels, streamline our processes to improve efficiency, and grow top line revenue using data and analytics
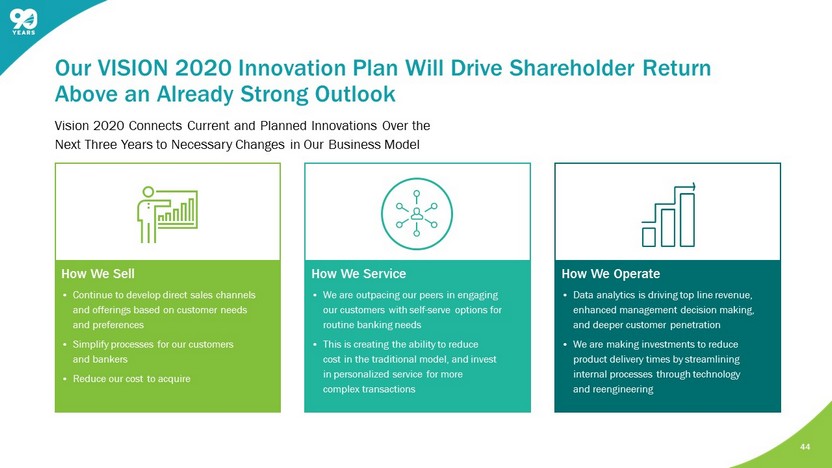
How We Sell • Continue to develop direct sales channels and offerings based on customer needs and preferences • Simplify processes for our customers and bankers • Reduce our cost to acquire How We Service • We are outpacing our peers in engaging our customers with self - serve options for routine banking needs • This is creating the ability to reduce cost in the traditional model, and invest in personalized service for more complex transactions How We Operate • Data analytics is driving top line revenue, enhanced management decision making, and deeper customer penetration • We are making investments to reduce product delivery times by streamlining internal processes through technology and reengineering Vision 2020 Connects Current and Planned Innovations Over the Next Three Years to Necessary Changes in Our Business Model 44 Our VISION 2020 Innovation Plan Will Drive Shareholder Return Above an Already Strong Outlook
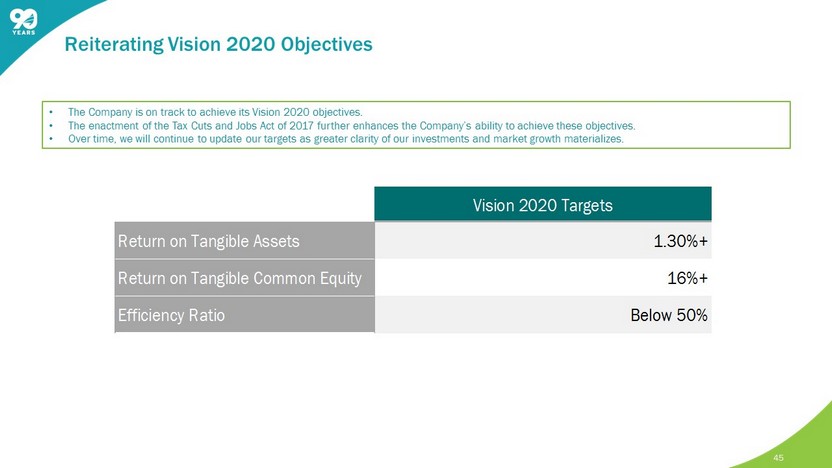
Reiterating Vision 2020 Objectives 45 • The Company is on track to achieve its Vision 2020 objectives. • The enactment of the Tax Cuts and Jobs Act of 2017 further enhances the Company’s ability to achieve these objectives. • Over time, we will continue to update our targets as greater clarity of our investments and market growth materializes. Vision 2020 Targets Return on Tangible Assets 1.30%+ Return on Tangible Common Equity 16%+ Efficiency Ratio Below 50%

Charles M. Shaffer Executive Vice President Chief Financial Officer (772) 221 - 7003 Chuck.Shaffer@seacoastbank.com INVESTOR RELATIONS www.SeacoastBanking.com NASDAQ: SBCF Contact Details: Seacoast Banking Corporation of Florida 46

47
This presentation contains financial information determined by methods other than Generally Accepted Accounting Principles (“GAAP”) . The financial highlights provide reconciliations between GAAP net income and adjusted net income, GAAP income and adjusted pretax, preprovision income . Management uses these non - GAAP financial measures in its analysis of the Company’s performance and believes these presentations provide useful supplemental information, and a clearer understanding of the Company’s performance . The Company believes the non - GAAP measures enhance investors’ understanding of the Company’s business and performance and if not provided would be requested by the investor community . These measures are also useful in understanding performance trends and facilitate comparisons with the performance of other financial institutions . The limitations associated with operating measures are the risk that persons might disagree as to the appropriateness of items comprising these measures and that different companies might calculate these measures differently . The Company provides reconciliations between GAAP and these non - GAAP measures . These disclosures should not be considered an alternative to GAAP . Explanation of Certain Unaudited Non - GAAP Financial Measures 48
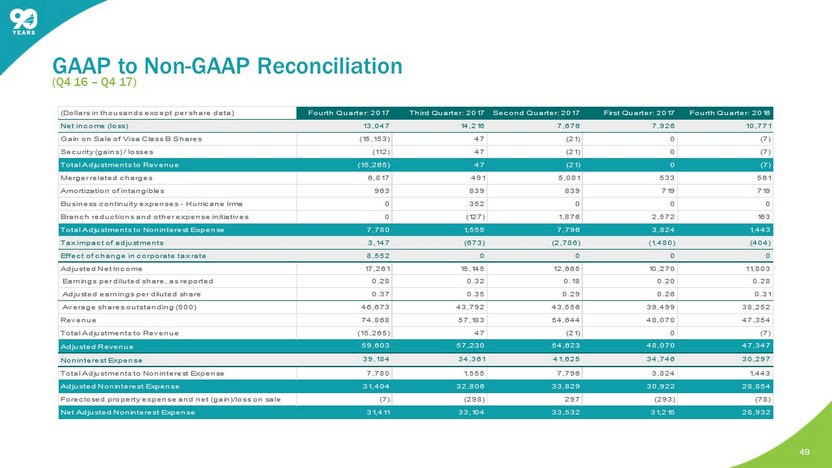
( Q4 16 – Q4 17) GAAP to Non - GAAP Reconciliation 49 (Dollars in thousands except per share data) Fourth Quarter: 2017 Third Quarter: 2017Second Quarter: 2017 First Quarter: 2017 Fourth Quarter: 2016 Net income (loss) 13,047 14,216 7,676 7,926 10,771 Gain on Sale of Visa Class B Shares (15,153) 47 (21) 0 (7) Security (gains) / losses (112) 47 (21) 0 (7) Total Adjustments to Revenue (15,265) 47 (21) 0 (7) Merger related charges 6,817 491 5,081 533 561 Amortization of intangibles 963 839 839 719 719 Business continuity expenses - Hurricane Irma 0 352 0 0 0 Branch reductions and other expense initiatives 0 (127) 1,876 2,572 163 Total Adjustments to Noninterest Expense 7,780 1,555 7,796 3,824 1,443 Tax impact of adjustments 3,147 (673) (2,786) (1,480) (404) Effect of change in corporate tax rate 8,552 0 0 0 0 Adjusted Net Income 17,261 15,145 12,665 10,270 11,803 Earnings per diluted share, as reported 0.28 0.32 0.18 0.20 0.28 Adjusted earnings per diluted share 0.37 0.35 0.29 0.26 0.31 Average shares outstanding (000) 46,673 43,792 43,556 39,499 38,252 Revenue 74,868 57,183 54,644 48,070 47,354 Total Adjustments to Revenue (15,265) 47 (21) 0 (7) Adjusted Revenue 59,603 57,230 54,623 48,070 47,347 Noninterest Expense 39,184 34,361 41,625 34,746 30,297 Total Adjustments to Noninterest Expense 7,780 1,555 7,796 3,824 1,443 Adjusted Noninterest Expense 31,404 32,806 33,829 30,922 28,854 Foreclosed property expense and net (gain)/loss on sale (7) (298) 297 (293) (78) Net Adjusted Noninterest Expense 31,411 33,104 33,532 31,215 28,932
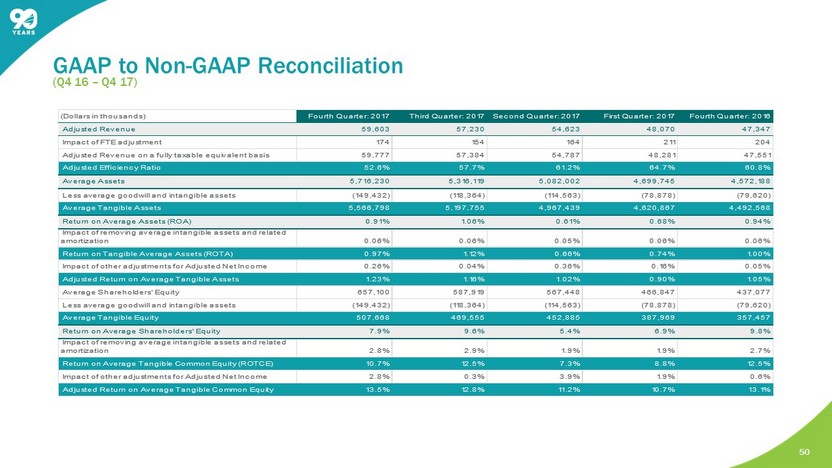
GAAP to Non - GAAP Reconciliation ( Q4 16 – Q4 17) 50 (Dollars in thousands) Fourth Quarter: 2017 Third Quarter: 2017Second Quarter: 2017 First Quarter: 2017 Fourth Quarter: 2016 Adjusted Revenue 59,603 57,230 54,623 48,070 47,347 Impact of FTE adjustment 174 154 164 211 204 Adjusted Revenue on a fully taxable equivalent basis 59,777 57,384 54,787 48,281 47,551 Adjusted Efficiency Ratio 52.6% 57.7% 61.2% 64.7% 60.8% Average Assets 5,716,230 5,316,119 5,082,002 4,699,745 4,572,188 Less average goodwill and intangible assets (149,432) (118,364) (114,563) (78,878) (79,620) Average Tangible Assets 5,566,798 5,197,755 4,967,439 4,620,867 4,492,568 Return on Average Assets (ROA) 0.91% 1.06% 0.61% 0.68% 0.94% Impact of removing average intangible assets and related amortization 0.06% 0.06% 0.05% 0.06% 0.06% Return on Tangible Average Assets (ROTA) 0.97% 1.12% 0.66% 0.74% 1.00% Impact of other adjustments for Adjusted Net Income 0.26% 0.04% 0.36% 0.16% 0.05% Adjusted Return on Average Tangible Assets 1.23% 1.16% 1.02% 0.90% 1.05% Average Shareholders' Equity 657,100 587,919 567,448 466,847 437,077 Less average goodwill and intangible assets (149,432) (118,364) (114,563) (78,878) (79,620) Average Tangible Equity 507,668 469,555 452,885 387,969 357,457 Return on Average Shareholders' Equity 7.9% 9.6% 5.4% 6.9% 9.8% Impact of removing average intangible assets and related amortization 2.8% 2.9% 1.9% 1.9% 2.7% Return on Average Tangible Common Equity (ROTCE) 10.7% 12.5% 7.3% 8.8% 12.5% Impact of other adjustments for Adjusted Net Income 2.8% 0.3% 3.9% 1.9% 0.6% Adjusted Return on Average Tangible Common Equity 13.5% 12.8% 11.2% 10.7% 13.1%