Exhibit 99.1
FIRST QUARTER 2019 Investor Presentation F IRST QUARTER 2019 RESULTS
2 FIRST QUARTER 2019 This press release contains “forward - looking statements” within the meaning, and protections, of Section 27 A of the Securities Act of 1933 and Section 21 E of the Securities Exchange Act of 1934 , including, without limitation, statements about future financial and operating results, cost savings, enhanced revenues, economic and seasonal conditions in our markets, and improvements to reported earnings that may be realized from cost controls, tax law changes, and for integration of banks that we have acquired, or expect to acquire, as well as statements with respect to Seacoast's objectives, strategic plans, including Vision 2020 , expectations and intentions and other statements that are not historical facts . Actual results may differ from those set forth in the forward - looking statements . Forward - looking statements include statements with respect to our beliefs, plans, objectives, goals, expectations, anticipations, assumptions, estimates and intentions about future performance, and involve known and unknown risks, uncertainties and other factors, which may be beyond our control, and which may cause the actual results, performance or achievements of Seacoast to be materially different from future results, performance or achievements expressed or implied by such forward - looking statements . You should not expect us to update any forward - looking statements . All statements other than statements of historical fact could be forward - looking statements . You can identify these forward - looking statements through our use of words such as “may”, “will”, “anticipate”, “assume”, “should”, “support”, “indicate”, “would”, “believe”, “contemplate”, “expect”, “estimate”, “continue”, “further”, “plan”, “point to”, “project”, “could”, “intend”, “target” or other similar words and expressions of the future . These forward - looking statements may not be realized due to a variety of factors, including, without limitation : the effects of future economic and market conditions, including seasonality ; governmental monetary and fiscal policies, including interest rate policies of the Board of Governors of the Federal Reserve, as well as legislative, tax and regulatory changes ; changes in accounting policies, rules and practices ; the risks of changes in interest rates on the level and composition of deposits, loan demand, liquidity and the values of loan collateral, securities, and interest sensitive assets and liabilities ; interest rate risks, sensitivities and the shape of the yield curve ; changes in borrower credit risks and payment behaviors ; changes in the availability and cost of credit and capital in the financial markets ; changes in the prices, values and sales volumes of residential and commercial real estate ; our ability to comply with any regulatory requirements ; the effects of problems encountered by other financial institutions that adversely affect us or the banking industry ; our concentration in commercial real estate loans ; the failure of assumptions and estimates, as well as differences in, and changes to, economic, market and credit conditions ; the impact on the valuation of our investments due to market volatility or counterparty payment risk ; statutory and regulatory dividends restrictions ; increases in regulatory capital requirements for banking organizations generally ; the risks of mergers, acquisitions and divestitures, including our ability to continue to identify acquisition targets and successfully acquire desirable financial institutions ; changes in technology or products that may be more difficult, costly, or less effective than anticipated ; our ability to identify and address increased cybersecurity risks ; inability of our risk management framework to manage risks associated with our business ; dependence on key suppliers or vendors to obtain equipment or services for our business on acceptable terms ; reduction in or the termination of our ability to use the mobile - based platform that is critical to our business growth strategy ; the effects of war or other conflicts, acts of terrorism, natural disasters or other catastrophic events that may affect general economic conditions ; unexpected outcomes of, and the costs associated with, existing or new litigation involving us ; our ability to maintain adequate internal controls over financial reporting ; potential claims, damages, penalties, fines and reputational damage resulting from pending or future litigation, regulatory proceedings and enforcement actions ; the risks that our deferred tax assets could be reduced if estimates of future taxable income from our operations and tax planning strategies are less than currently estimated and sales of our capital stock could trigger a reduction in the amount of net operating loss carryforwards that we may be able to utilize for income tax purposes ; the effects of competition from other commercial banks, thrifts, mortgage banking firms, consumer finance companies, credit unions, securities brokerage firms, insurance companies, money market and other mutual funds and other financial institutions operating in our market areas and elsewhere, including institutions operating regionally, nationally and internationally, together with such competitors offering banking products and services by mail, telephone, computer and the Internet ; and the failure of assumptions underlying the establishment of reserves for possible loan losses . All written or oral forward - looking statements attributable to us are expressly qualified in their entirety by this cautionary notice, including, without limitation, those risks and uncertainties described in our annual report on Form 10 - K for the year ended December 31 , 2018 under “Special Cautionary Notice Regarding Forward - Looking Statements” and “Risk Factors”, and otherwise in our SEC reports and filings . Such reports are available upon request from the Company, or from the Securities and Exchange Commission, including through the SEC’s Internet website at www . sec . gov . Cautionary Notice Regarding Forward - Looking Statements
3 FIRST QUARTER 2019 3 ABOUT SEACOAST BANK 1 COMPANY PERFORMANCE 2 SEACOAST’S DIFFERENTIATED STRATEGY 3 OUTLOOK 4 Agenda
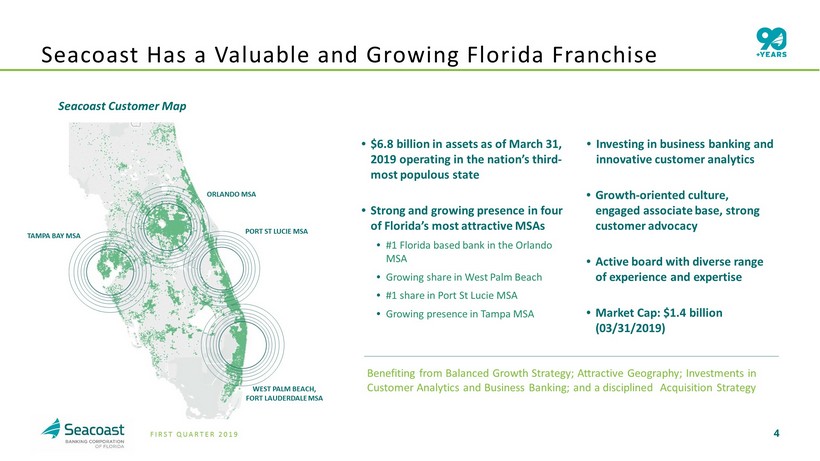
4 FIRST QUARTER 2019 Benefiting from Balanced Growth Strategy; Attractive Geography; Investments in Customer Analytics and Business Banking; and a disciplined Acquisition Strategy Seacoast Has a Valuable and Growing Florida Franchise • $ 6.8 billion in assets as of March 31 , 2019 operating in the nation’s third - most populous state • Strong and growing presence in four of Florida’s most attractive MSAs • #1 Florida based bank in the Orlando MSA • Growing share in West Palm Beach • # 1 share in Port St Lucie MSA • Growing presence in Tampa MSA • Investing in business banking and innovative customer analytics • Growth - oriented culture, engaged associate base, strong customer advocacy • Active board with diverse range of experience and expertise • Market Cap: $ 1. 4 billion ( 03/31/2019) TAMPA BAY MSA WEST PALM BEACH, FORT LAUDERDALE MSA PORT ST LUCIE MSA ORLANDO MSA Seacoast Customer Map
5 FIRST QUARTER 2019 Agenda 5 ABOUT SEACOAST BANK 1 COMPANY PERFORMANCE 2 SEACOAST’S DIFFERENTIATED STRATEGY 3 OUTLOOK 4
6 FIRST QUARTER 2019 First Quarter Highlights WITH A GROWING PRESENCE IN FLORIDA'S MOST ATTRACTIVE MARKETS, SEACOAST IS ONE OF FLORIDA'S TOP - PERFORMING BANKING FRANCHISES • Earnings per share totaled $ 0 . 44 on a GAAP basis and $ 0 . 47 on an adjusted basis 1 • On a GAAP basis, ended the quarter at 1 . 48 % Return on Tangible Assets (ROTA), 14 . 9 % Return on Average Tangible Common Equity, and 56 . 6 % efficiency ratio . On an adjusted basis, first quarter results were 1 . 50 % adjusted ROTA 1 , 15 . 1 % adjusted ROTCE 1 , and 55 . 8 % adjusted efficiency ratio 1 • Net interest margin increased to 4 . 02 % , up 2 basis points fr o m the prior quarter . Removing accretion on acquired loans, the net interest margin expanded 3 basis points • Total deposits grew 16 % on an annualized basis when removing the favorable impact from additional brokered deposits acquired during the quarter totaling $ 147 million and customer sweep balances transferred to interest bearing deposits totaling $ 76 million • Noninterest bearing demand deposits grew 27 % on an annualized basis • Hired 10 business bankers, augmenting the 10 business bankers we hired in Q 4 , expanding distribution in the fast growing markets of Fort Lauderdale and Tampa 1 Non - GAAP measure, see “Explanation of Certain Unaudited Non - GAAP Financial Measures”
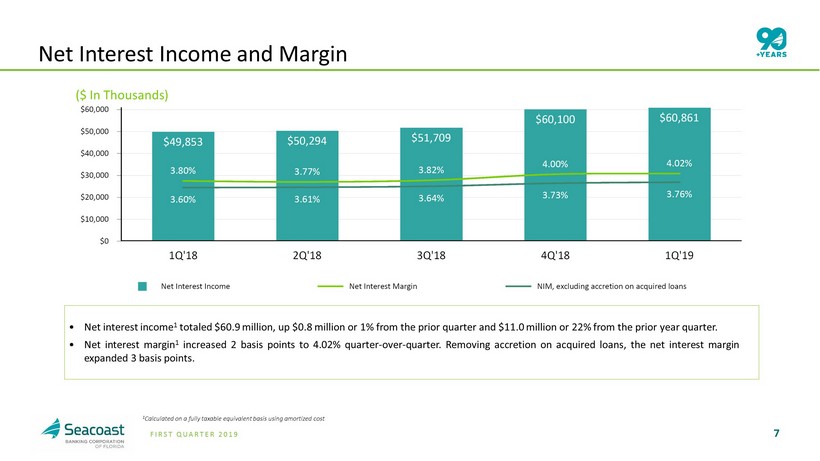
7 FIRST QUARTER 2019 Net Interest Income and Margin • Net interest income 1 totaled $ 60 . 9 million, up $ 0 . 8 million or 1 % from the prior quarter and $ 11 . 0 million or 22 % from the prior year quarter . • Net interest margin 1 increased 2 basis points to 4 . 02 % quarter - over - quarter . Removing accretion on acquired loans, the net interest margin expanded 3 basis points . 1 Calculated on a fully taxable equivalent basis using amortized cost ($ In Thousands)
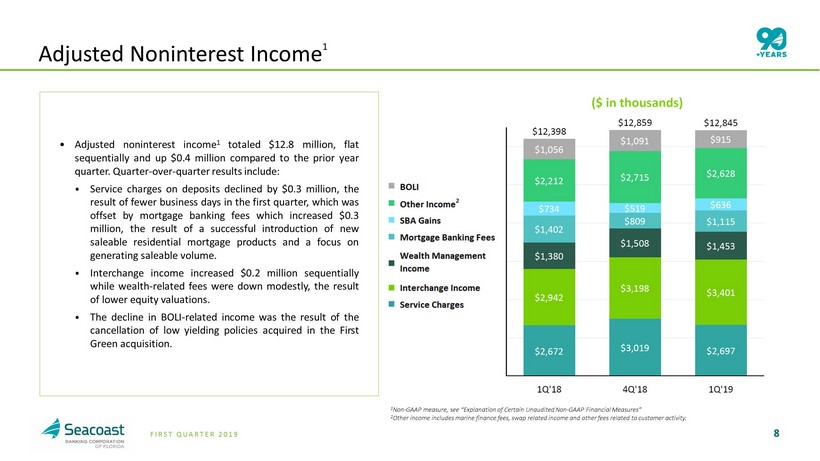
8 FIRST QUARTER 2019 Adjusted Noninterest Income 1 • Adjusted noninterest income 1 totaled $ 12 . 8 million, flat sequentially and up $ 0 . 4 million compared to the prior year quarter . Quarter - over - quarter results include : ⦁ Service charges on deposits declined by $ 0 . 3 million, the result of fewer business days in the first quarter, which was offset by mortgage banking fees which increased $ 0 . 3 million, the result of a successful introduction of new saleable residential mortgage products and a focus on generating saleable volume . ⦁ Interchange income increased $ 0 . 2 million sequentially while wealth - related fees were down modestly, the result of lower equity valuations . ⦁ The decline in BOLI - related income was the result of the cancellation of low yielding policies acquired in the First Green acquisition . 1 Non - GAAP measure, see “Explanation of Certain Unaudited Non - GAAP Financial Measures” 2 Other income includes marine finance fees, swap related income and other fees related to customer activity.
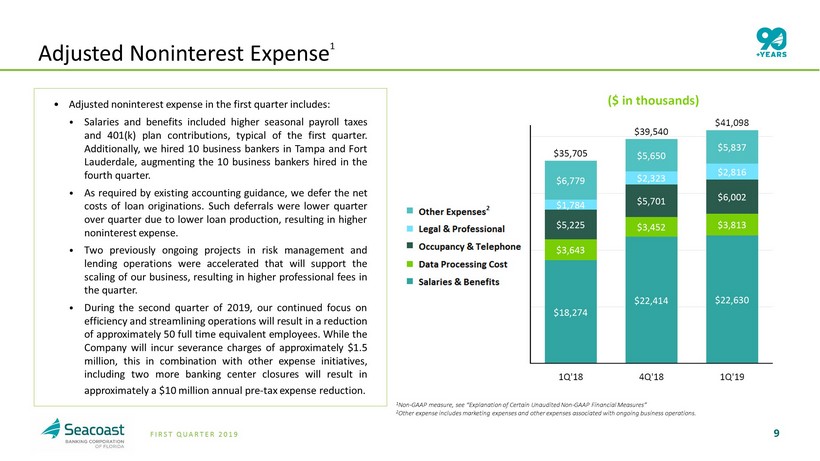
9 FIRST QUARTER 2019 Adjusted Noninterest Expense 1 • Adjusted noninterest expense in the first quarter includes : ⦁ Salaries and benefits included higher seasonal payroll taxes and 401 (k) plan contributions, typical of the first quarter . Additionally, we hired 10 business bankers in Tampa and Fort Lauderdale, augmenting the 10 business bankers hired in the fourth quarter . ⦁ As required by existing accounting guidance, we defer the net costs of loan originations . Such deferrals were lower quarter over quarter due to lower loan production, resulting in higher noninterest expense . ⦁ Two previously ongoing projects in risk management and lending operations were accelerated that will support the scaling of our business, resulting in higher professional fees in the quarter . ⦁ During the second quarter of 2019 , our continued focus on efficiency and streamlining operations will result in a reduction of approximately 50 full time equivalent employees . While the Company will incur severance charges of approximately $ 1 . 5 million , this in combination with other expense initiatives, including two more banking center closures will result in approximately a $ 10 million annual pre - tax expense reduction . 1 Non - GAAP measure, see “Explanation of Certain Unaudited Non - GAAP Financial Measures” 2 Other expense includes marketing expenses and other expenses associated with ongoing business operations.
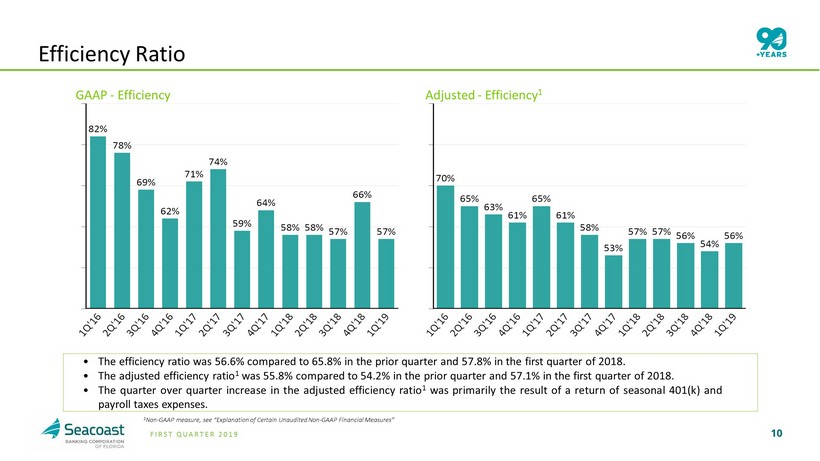
10 FIRST QUARTER 2019 Efficiency Ratio • The efficiency ratio was 56 . 6 % compared to 65 . 8 % in the prior quarter and 57 . 8 % in the first quarter of 2018 . • The adjusted efficiency ratio 1 was 55 . 8 % compared to 54 . 2 % in the prior quarter and 57 . 1 % in the first quarter of 2018 . • The quarter over quarter increase in the adjusted efficiency ratio 1 was primarily the result of a return of seasonal 401 (k) and payroll taxes expenses . 1 Non - GAAP measure, see “Explanation of Certain Unaudited Non - GAAP Financial Measures” GAAP - Efficiency Adjusted - Efficiency 1
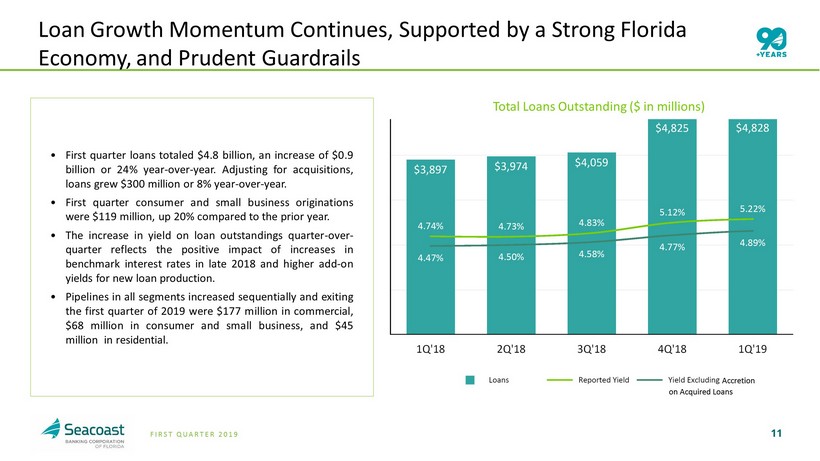
11 FIRST QUARTER 2019 Loan Growth Momentum Continues, Supported by a Strong Florida Economy, and Prudent Guardrails • First quarter loans totaled $ 4 . 8 billion, an increase of $ 0 . 9 billion or 24 % year - over - year . Adjusting for acquisitions, loans grew $ 300 million or 8 % year - over - year . • First quarter consumer and small business originations were $ 119 million, up 20 % compared to the prior year . • The increase in yield on loan outstandings quarter - over - quarter reflects the positive impact of increases in benchmark interest rates in late 2018 and higher add - on yields for new loan production . • Pipelines in all segments increased sequentially and exiting the first quarter of 2019 were $ 177 million in commercial, $ 68 million in consumer and small business, and $ 45 million in residential . Total Loans Outstanding ($ in millions) Accretion on Acquired Loans
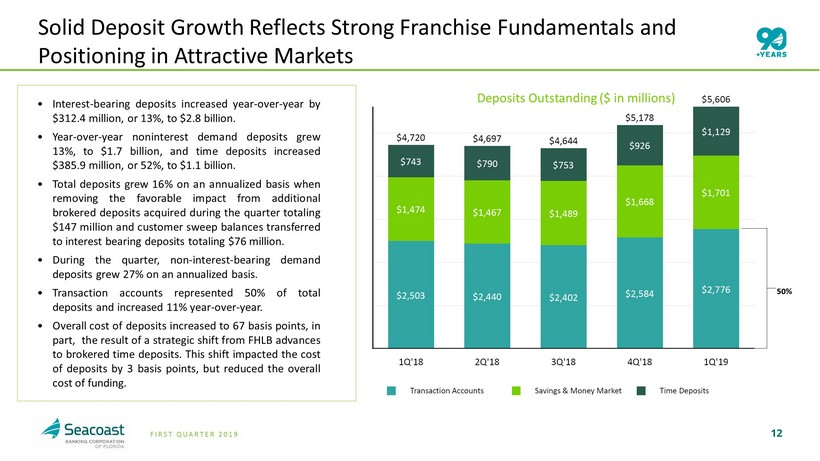
12 FIRST QUARTER 2019 Solid Deposit Growth Reflects Strong Franchise Fundamentals and Positioning in Attractive Markets • Interest - bearing deposits increased year - over - year by $ 312 . 4 million, or 13 % , to $ 2 . 8 billion . • Year - over - year noninterest demand deposits grew 13 % , to $ 1 . 7 billion, and time deposits increased $ 385 . 9 million, or 52 % , to $ 1 . 1 billion . • Total deposits grew 16 % on an annualized basis when removing the favorable impact from additional brokered deposits acquired during the quarter totaling $ 147 million and customer sweep balances transferred to interest bearing deposits totaling $ 76 million . • During the quarter, non - interest - bearing demand deposits grew 27 % on an annualized basis . • Transaction accounts represented 50 % of total deposits and increased 11 % year - over - year . • Overall cost of deposits increased to 67 basis points, in part, the result of a strategic shift from FHLB advances to brokered time deposits . This shift impacted the cost of deposits by 3 basis points, but reduced the overall cost of funding . 50% Deposits Outstanding ($ in millions)
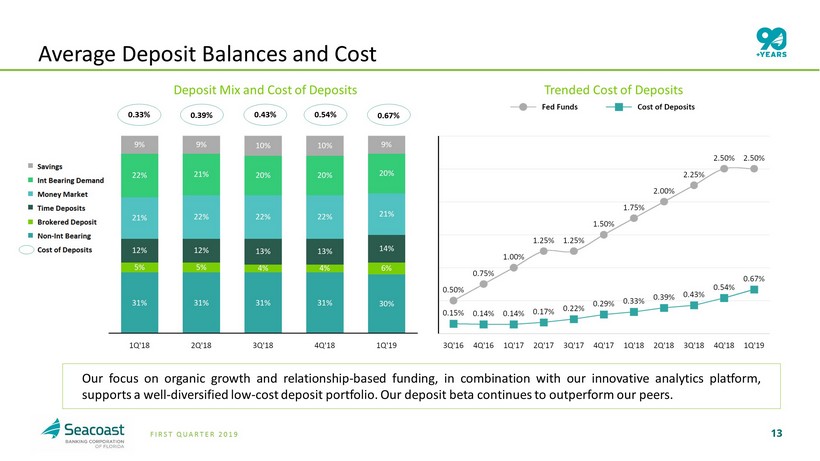
13 FIRST QUARTER 2019 Average Deposit Balances and Cost Our focus on organic growth and relationship - based funding, in combination with our innovative analytics platform, supports a well - diversified low - cost deposit portfolio . Our deposit beta continues to outperform our peers . 0.33% 0.39% 0.43% 0.54% 0.67% Deposit Mix and Cost of Deposits Trended Cost of Deposits
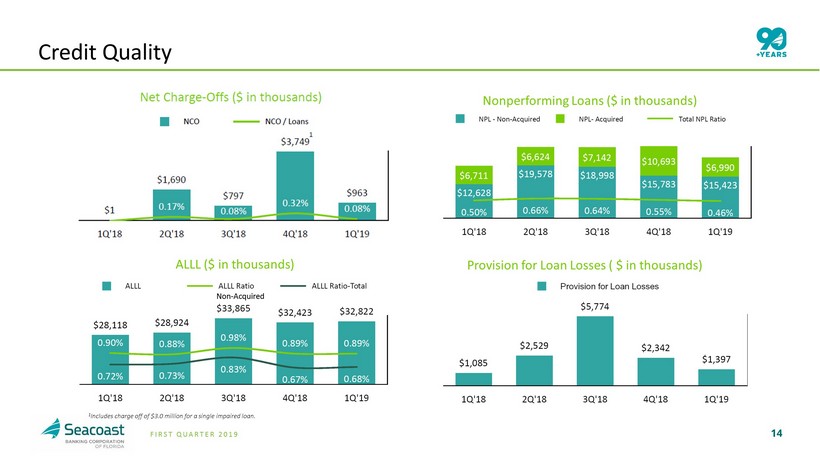
14 FIRST QUARTER 2019 Credit Quality Non - Acquired 1 1 Includes charge off of $3.0 million for a single impaired loan. Net Charge - Offs ($ in thousands) Nonperforming Loans ($ in thousands) Provision for Loan Losses ( $ in thousands) ALLL ($ in thousands)
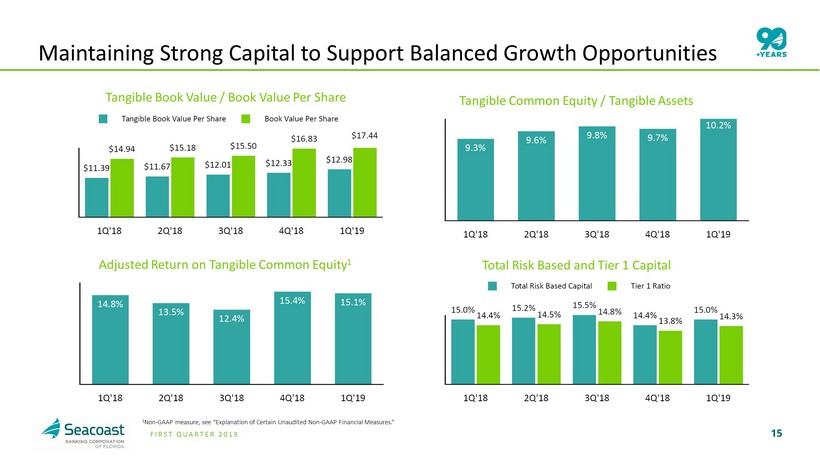
15 FIRST QUARTER 2019 Maintaining Strong Capital to Support Balanced Growth Opportunities 1 Non - GAAP measure, see “Explanation of Certain Unaudited Non - GAAP Financial Measures.” Tangible Book Value / Book Value Per Share Tangible Common Equity / Tangible Assets Total Risk Based and Tier 1 Capital Adjusted Return on Tangible Common Equity 1
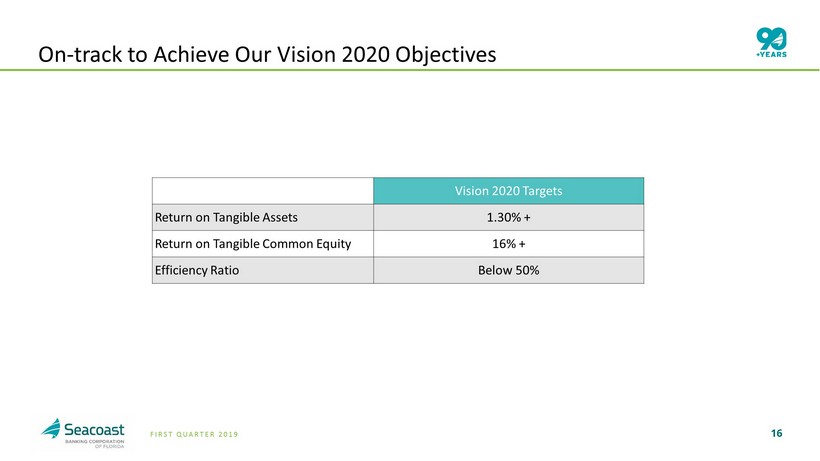
16 FIRST QUARTER 2019 On - track to Achieve Our Vision 2020 Objectives Vision 2020 Targets Return on Tangible Assets 1.30% + Return on Tangible Common Equity 16% + Efficiency Ratio Below 50%
17 FIRST QUARTER 2019 17 ABOUT SEACOAST BANK 1 COMPANY PERFORMANCE 2 SEACOAST’S DIFFERENTIATED STRATEGY 3 OUTLOOK 4 Agenda
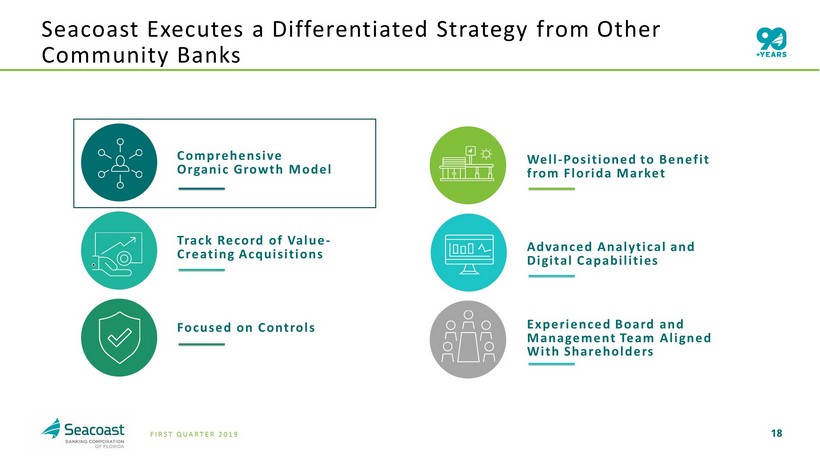
18 FIRST QUARTER 2019 Experienced Board and Management Team Aligned With Shareholders Well - Positioned to Benefit from Florida Market Advanced Analytical and Digital Capabilities Focused on Controls Comprehensive Organic Growth Model Track Record of Value - Creating Acquisitions Seacoast Executes a Differentiated Strategy from Other Community Banks
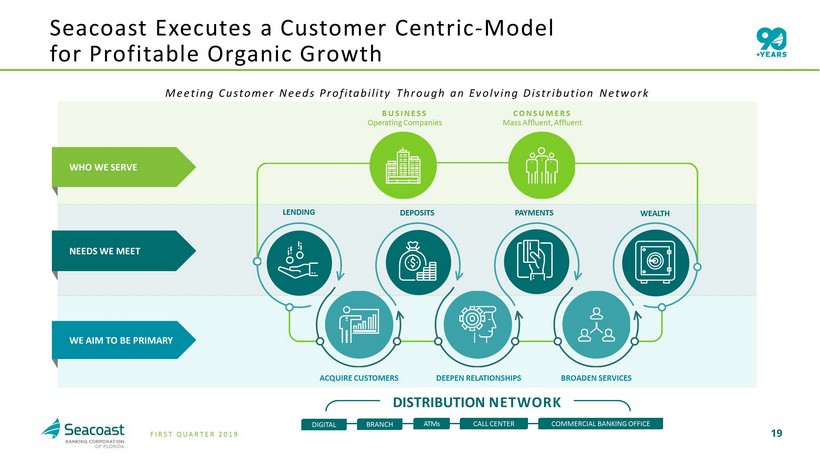
19 FIRST QUARTER 2019 ACQUIRE CUSTOMERS DEEPEN RELATIONSHIPS BROADEN SERVICES WHO WE SERVE NEEDS WE MEET WE AIM TO BE PRIMARY BUSINESS Operating Companies CONSUMERS Mass Affluent, Affluent LENDING DEPOSITS WEALTH PAYMENTS DISTRIBUTION NETWORK BRANCH COMMERCIAL BANKING OFFICE DIGITAL ATMs CALL CENTER ACQUIRE CUSTOMERS DEEPEN RELATIONSHIPS BROADEN SERVICES Meeting Customer Needs Profitability Through an Evolving Distribution Network Seacoast Executes a Customer Centric - Model for Profitable Organic Growth
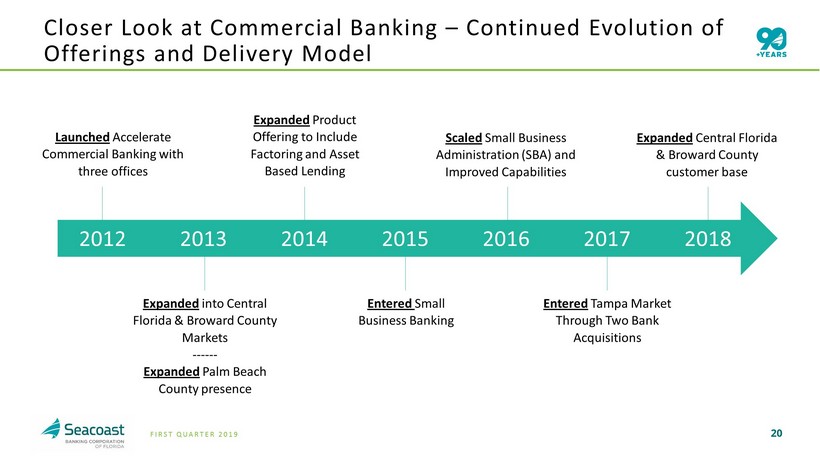
20 FIRST QUARTER 2019 Closer Look at Commercial Banking – Continued Evolution of Offerings and Delivery Model Expanded Product Offering to Include Factoring and Asset Based Lending Launched Accelerate Commercial Banking with three offices Entered Small Business Banking Expanded into Central Florida & Broward County Markets ------ Expanded Palm Beach County presence Entered Tampa Market Through Two Bank Acquisitions Scaled Small Business Administration (SBA) and Improved Capabilities 2012 2013 2014 2015 2016 2017 2018 Expanded Central Florida & Broward County customer base
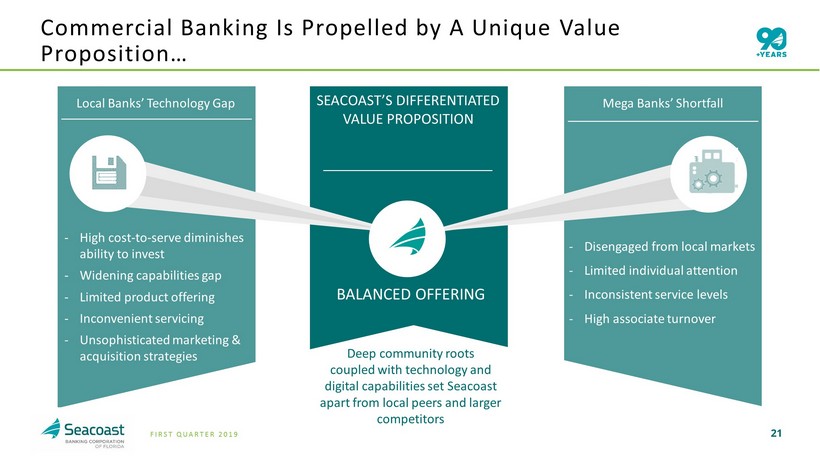
21 FIRST QUARTER 2019 Commercial Banking Is Propelled by A Unique Value Proposition… Local Banks’ Technology Gap SEACOAST’S DIFFERENTIATED VALUE PROPOSITION Mega Banks’ Shortfall - High cost - to - serve diminishes ability to invest - Widening capabilities gap - Limited product offering - Inconvenient servicing - Unsophisticated marketing & acquisition strategies BALANCED OFFERING Deep community r oots c oupled with technology and digital capabilities set Seacoast apart from local peers and larger competitors - Disengaged from local markets - Limited individual attention - Inconsistent service levels - High associate turnover
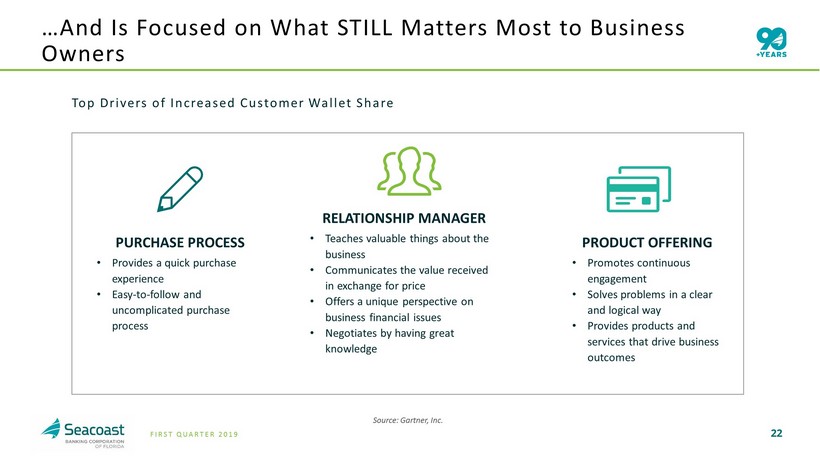
22 FIRST QUARTER 2019 PURCHASE PROCESS • Provides a quick purchase experience • E asy - to - follow and uncomplicated purchase process RELATIONSHIP MANAGER • Teaches valuable things about the business • Communicates the value received in exchange for price • Offers a unique perspective on business financial issues • Negotiates by having great knowledge PRODUCT OFFERING • Promotes continuous engagement • Solves problems in a clear and logical way • Provides products and services that drive business outcomes Top Drivers of Increased Customer Wallet Share …And Is Focused on What STILL Matters M ost to Business Owners Source: Gartner, Inc.
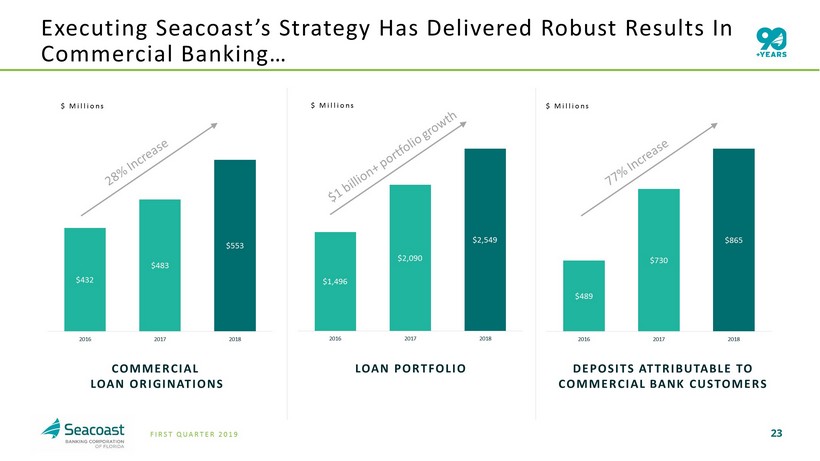
23 FIRST QUARTER 2019 DEPOSITS ATTRIBUTABLE TO COMMERCIAL BANK CUSTOMERS COMMERCIAL LOAN ORIGINATIONS $432 $483 $553 2016 2017 2018 $ Millions Executing Seacoast’s Strategy H as Delivered Robust Results In Commercial Banking… $489 $730 $865 2016 2017 2018 $ Millions LOAN PORTFOLIO $1,496 $2,090 $2,549 2016 2017 2018 $ Millions
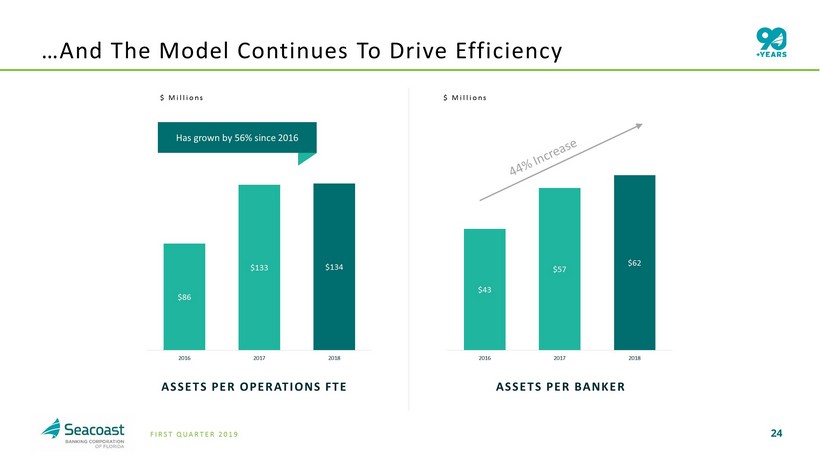
24 FIRST QUARTER 2019 ASSETS PER BANKER $ Millions …And The Model Continues To Drive Efficiency $43 $57 $62 2016 2017 2018 $ Millions ASSETS PER OPERATIONS FTE Has grown by 56% since 2016 $86 $133 $134 2016 2017 2018
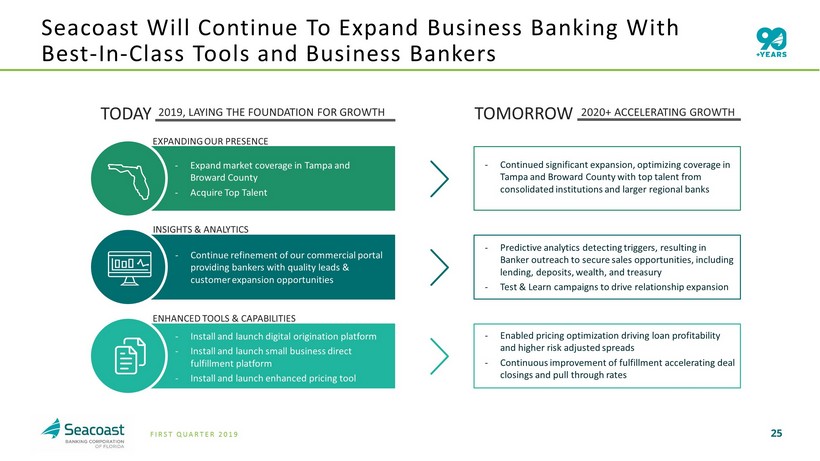
25 FIRST QUARTER 2019 Seacoast Will Continue To Expand Business Banking With Best - In - Class Tools and Business Bankers TODAY TOMORROW - Continue refinement of our c ommercial portal providing b ankers with quality l eads & customer e xpansion o pportunities - Install and launch digital origination platform - Install and launch small business direct fulfillment platform - Install and launch enhanced pricing tool - Expand market coverage in Tampa and Broward County - Acquire Top Talent - Predictive analytics detecting triggers, resulting in Banker outreach to secure sales opportunities, including lending, deposits, wealth, and treasury - Test & Learn campaigns to drive relationship expansion - Continued significant expansion, optimizing coverage in Tampa and Broward County with top talent from consolidated institutions and larger regional banks - Enabled pricing optimization driving loan profitability and higher risk adjusted spreads - Continuous improvement of fulfillment accelerating deal closings and pull through rates INSIGHTS & ANALYTICS 2019, LAYING THE FOUNDATION FOR GROWTH 2020+ ACCELERATING GROWTH ENHANCED TOOLS & CAPABILITIES EXPANDING OUR PRESENCE
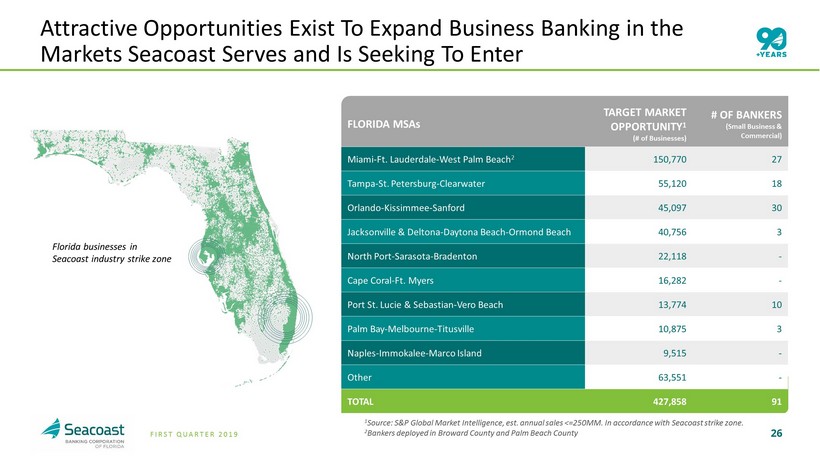
26 FIRST QUARTER 2019 FLORIDA MSAs TARGET MARKET OPPORTUNITY 1 (# of Businesses) # OF BANKERS (Small Business & Commercial ) Miami - Ft. Lauderdale - West Palm Beach 2 150,770 27 Tampa - St. Petersburg - Clearwater 55,120 18 Orlando - Kissimmee - Sanford 45,097 30 Jacksonville & Deltona - Daytona Beach - Ormond Beach 40,756 3 North Port - Sarasota - Bradenton 22,118 - Cape Coral - Ft. Myers 16,282 - Port St. Lucie & Sebastian - Vero Beach 13,774 10 Palm Bay - Melbourne - Titusville 10,875 3 Naples - Immokalee - Marco Island 9,515 - Other 63,551 - TOTAL 427,858 91 26 Attractive Opportunities Exist To Expand Business Banking in the Markets Seacoast Serves and Is Seeking To Enter 1 Source : S&P Global Market Intelligence, est. annual sales <= 250MM. In accordance with Seacoast strike zone. 2 Bankers deployed in Broward County and Palm Beach County Florida businesses in Seacoast industry strike zone
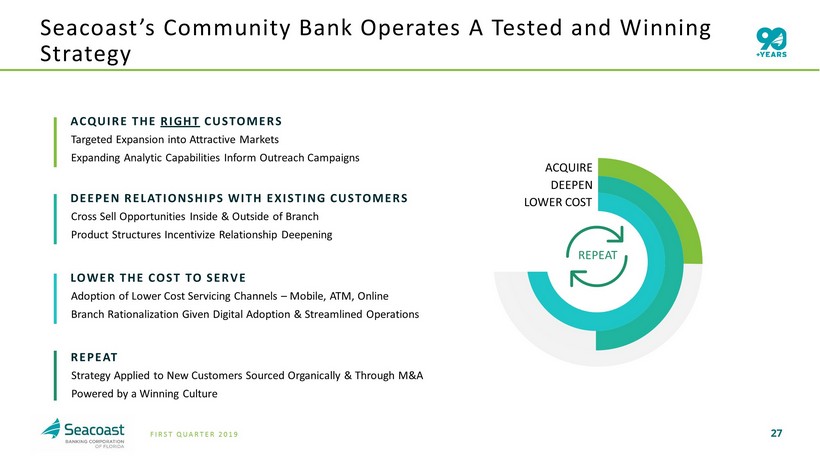
27 FIRST QUARTER 2019 LOWER THE COST TO SERVE Adoption of Lower Cost Servicing Channels – Mobile, ATM, Online Branch Rationalization Given Digital Adoption & Streamlined Operations DEEPEN RELATIONSHIPS WITH EXISTING CUSTOMERS Cross Sell Opportunities Inside & Outside of Branch Product Structures Incentivize Relationship Deepening ACQUIRE THE RIGHT CUSTOMERS Targeted Expansion into Attractive Markets Expanding Analytic Capabilities Inform Outreach Campaigns Seacoast’s Community Bank Operates A Tested and Winning Strategy REPEAT Strategy Applied to New C ustomers S ourced O rganically & Through M&A Powered by a Winning C ulture ACQUIRE DEEPEN LOWER COST REPEAT
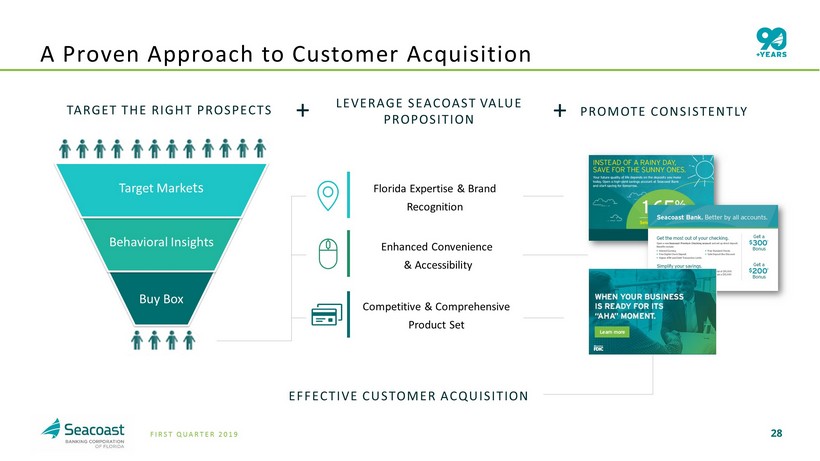
28 FIRST QUARTER 2019 LEVERAGE SEACOAST VALUE PROPOSITION TARGET THE RIGHT PROSPECTS Target Marke ts Buy Box Behavioral Insights Florida Expertise & Brand Recognition Competitive & Comprehensive Product Set PROMOTE CONSISTENTLY + + Enhanced Convenience & Accessibility EFFECTIVE CUSTOMER ACQUISITION A Proven Approach to Customer Acquisition
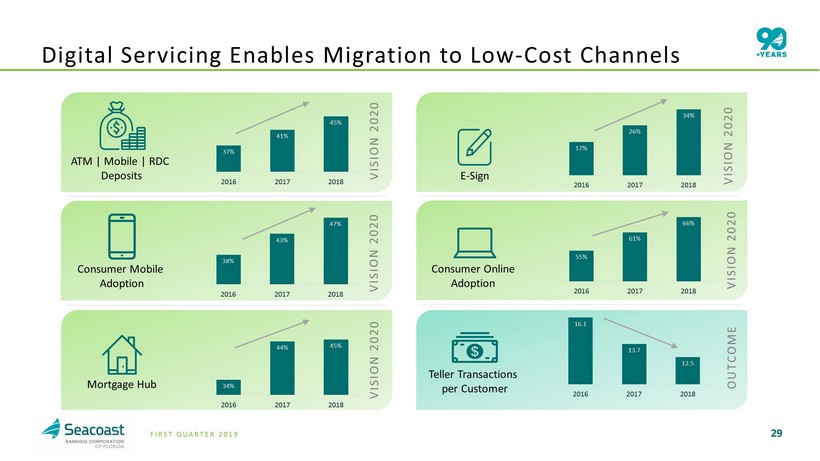
29 FIRST QUARTER 2019 VISION 2020 VISION 2020 Digital Servicing Enables Migration to Low - Cost Channels Consumer Mobile Adoption 37% 41% 45% 2016 2017 2018 ATM | Mobile | RDC Deposits Teller Transactions per Customer 16.1 13.7 12.5 2016 2017 2018 38% 43% 47% 2016 2017 2018 E - Sign 34% 44% 45% 2016 2017 2018 Mortgage Hub Consumer Online Adoption 17% 26% 34% 2016 2017 2018 55% 61% 66% 2016 2017 2018 VISION 2020 VISION 2020 VISION 2020 OUTCOME
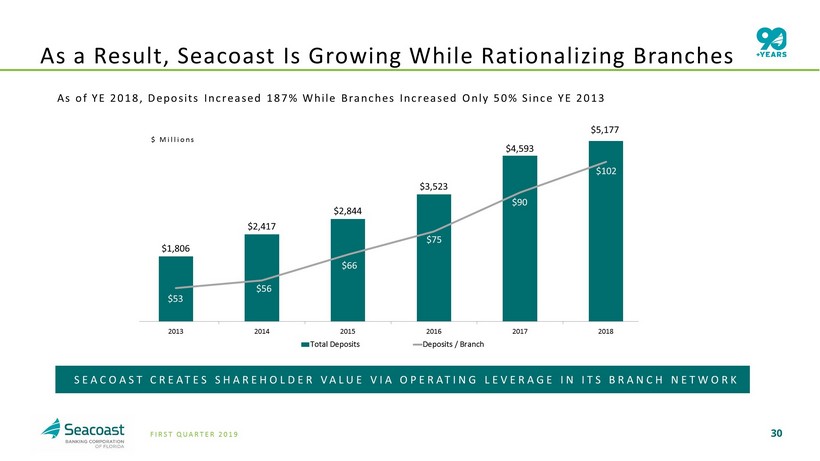
30 FIRST QUARTER 2019 As of YE 2018, Deposits Increased 187% While Branches Increased Only 50% Since YE 2013 As a Result, Seacoast Is Growing While Rationalizing Branches $1,806 $2,417 $2,844 $3,523 $4,593 $53 $56 $66 $75 $90 $102 $40 $50 $60 $70 $80 $90 $100 $110 $0 $500 $1,000 $1,500 $2,000 $2,500 $3,000 $3,500 $4,000 $4,500 $5,000 2013 2014 2015 2016 2017 2018 Total Deposits Deposits / Branch $ Millions $5,177 SEACOAST CREATES SHAREHOLDER VALUE VIA OPERATING LEVERAGE IN ITS BRANCH NETWORK
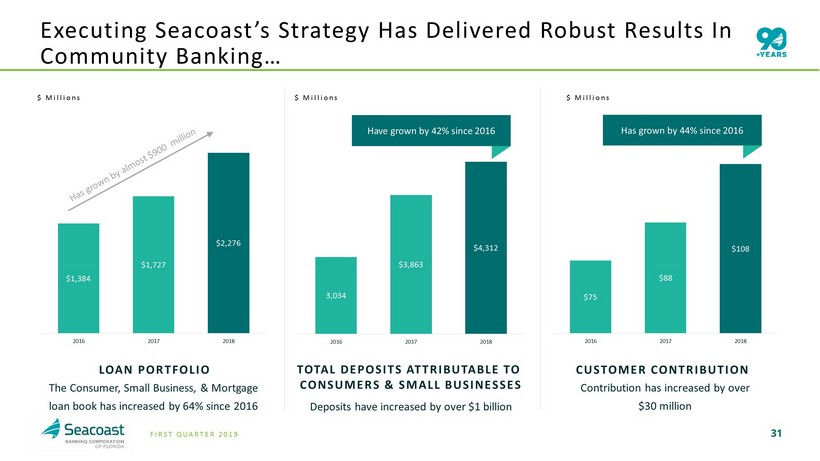
31 FIRST QUARTER 2019 LOAN PORTFOLIO The Consumer, Small Business, & Mortgage loan book has increased by 64% since 2016 CUSTOMER CONTRIBUTION Contribution has increased by over $30 million $75 $88 $108 2016 2017 2018 $ Millions $1,384 $1,727 $2,276 2016 2017 2018 TOTAL DEPOSITS ATTRIBUTABLE TO CONSUMERS & SMALL BUSINESSES Deposits have increased by over $1 billion 3,034 $3,863 $4,312 2016 2017 2018 $ Millions $ Millions Has grown by 44% since 2016 Have grown by 42% since 2016 Executing Seacoast’s Strategy H as Delivered Robust Results In Community Banking…
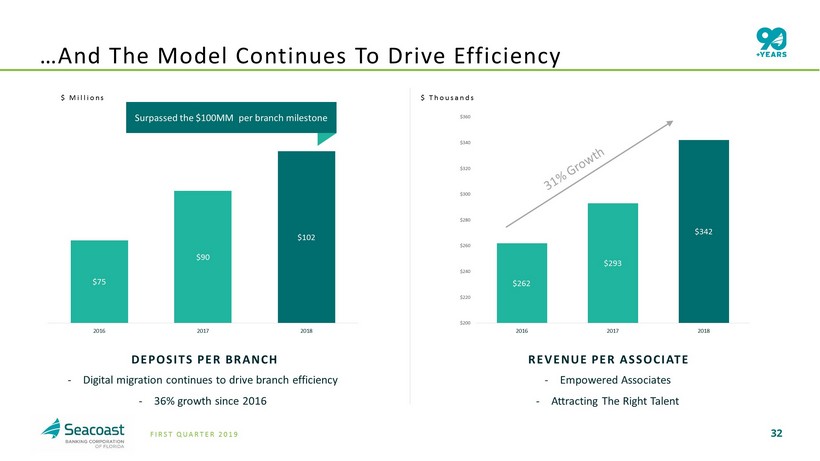
32 FIRST QUARTER 2019 REVENUE PER ASSOCIATE - Empowered Associates - Attracting The Right Talent DEPOSITS PER BRANCH - Digital migration continues to drive branch efficiency - 36% growth since 2016 $75 $90 $102 2016 2017 2018 $ Millions $262 $293 $342 $200 $220 $240 $260 $280 $300 $320 $340 $360 2016 2017 2018 $ Thousands Surpassed the $100MM per branch milestone …And The Model Continues To Drive Efficiency
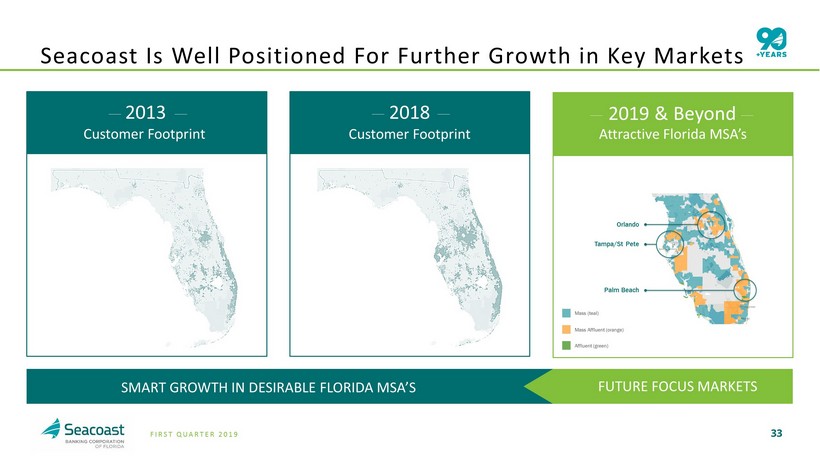
33 FIRST QUARTER 2019 Seacoast Is Well Positioned For Further Growth in Key Markets 2013 Customer Footprint 2018 Customer Footprint Orlando Tampa/St Pete Palm Beach 2019 & Beyond Mass (teal) Mass Affluent (orange) Affluent (green) Attractive Florida MSA’s SMART GROWTH IN DESIRABLE FLORIDA MSA’S FUTURE FOCUS MARKETS
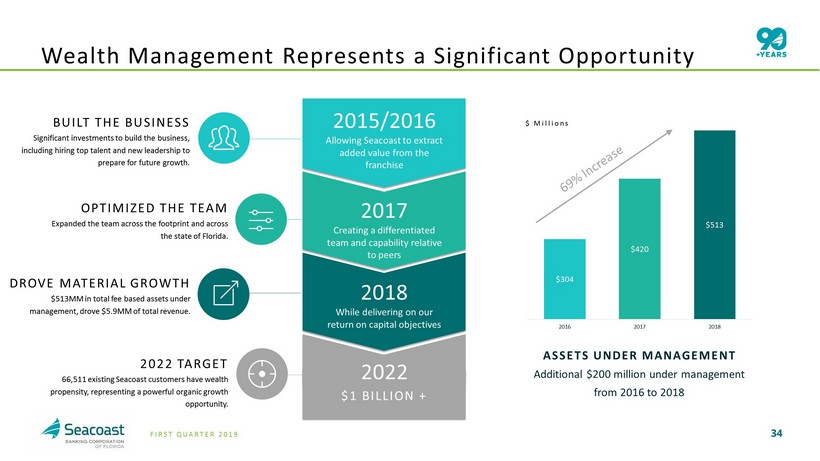
34 FIRST QUARTER 2019 $ Millions OPTIMIZED THE TEAM Expanded the team across the footprint and across the state of Florida. Wealth Management Represents a Significant Opportunity DROVE MATERIAL GROWTH $513MM in total fee based assets under management, drove $5.9MM of total revenue. BUILT THE BUSINESS Significant investments to build the business, including hiring top talent and new leadership to prepare for future growth. ASSETS UNDER MANAGEMENT Additional $200 m illion under management from 2016 to 2018 $304 $420 $513 2016 2017 2018 2015/2016 Allowing Seacoast to extract added value from the franchise 2017 Creating a differentiated team and capability relative to peers 2018 While delivering on our return o n capital objectives $1 BILLION + 2022 2022 TARGET 66,511 existing Seacoast customers have wealth propensity, representing a powerful organic growth opportunity.
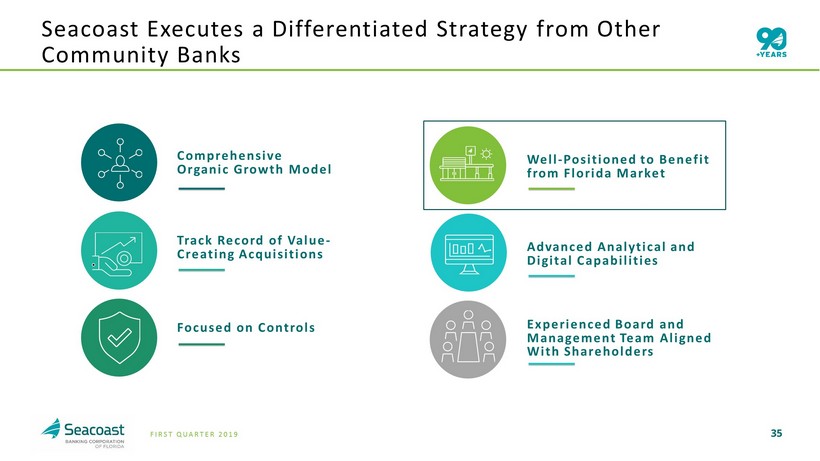
35 FIRST QUARTER 2019 Experienced Board and Management Team Aligned With Shareholders Well - Positioned to Benefit from Florida Market Advanced Analytical and Digital Capabilities Focused on Controls Comprehensive Organic Growth Model Track Record of Value - Creating Acquisitions Seacoast Executes a Differentiated Strategy from Other Community Banks
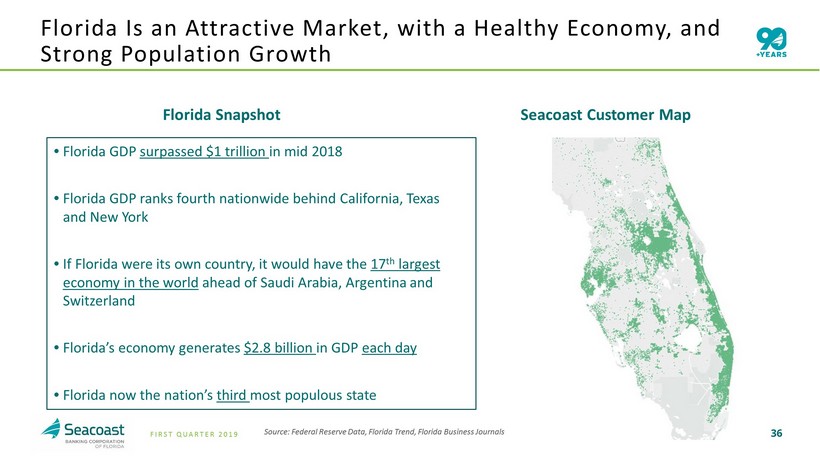
36 FIRST QUARTER 2019 Florida Is an Attractive Market, with a Healthy Economy, a nd Strong Population Growth Seacoast Customer Map Source: Federal Reserve Data, Florida Trend, Florida Business Journals • Florida GDP surpassed $1 trillion in mid 2018 • Florida GDP ranks fourth nationwide behind California, Texas and New York • If Florida were its own country, it would have the 17 th largest economy in the world ahead of Saudi Arabia, Argentina and Switzerland • Florida’s economy generates $2.8 billion in GDP each day • Florida now the nation’s third most populous state Florida Snapshot
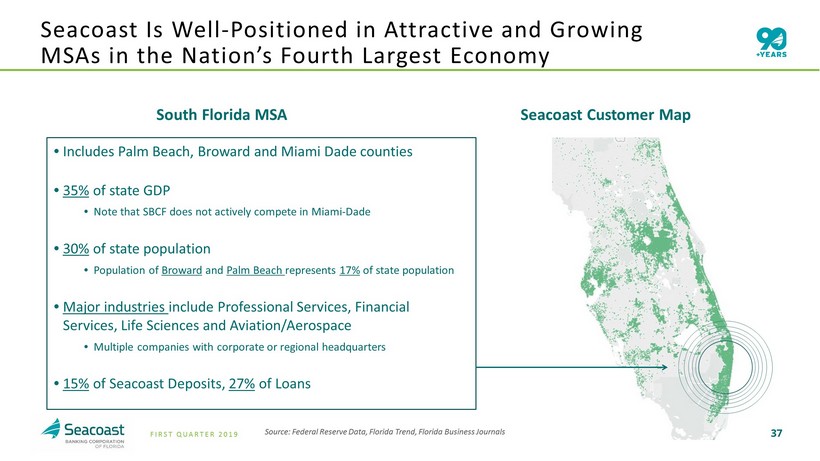
37 FIRST QUARTER 2019 Seacoast Customer Map • Includes Palm Beach, Broward and Miami Dade counties • 35% of state GDP • Note that SBCF does not actively compete in Miami - Dade • 30% of state population • Population of Broward and Palm Beach represents 17% of state population • Major industries include Professional Services, Financial Services, Life Sciences and Aviation/Aerospace • Multiple companies with corporate or regional headquarters • 15% of Seacoast Deposits, 27% of Loans South Florida MSA Seacoast Is Well - Positioned in Attractive and Growing MSAs in t he Nation’s Fourth Largest Economy Source: Federal Reserve Data, Florida Trend, Florida Business Journals
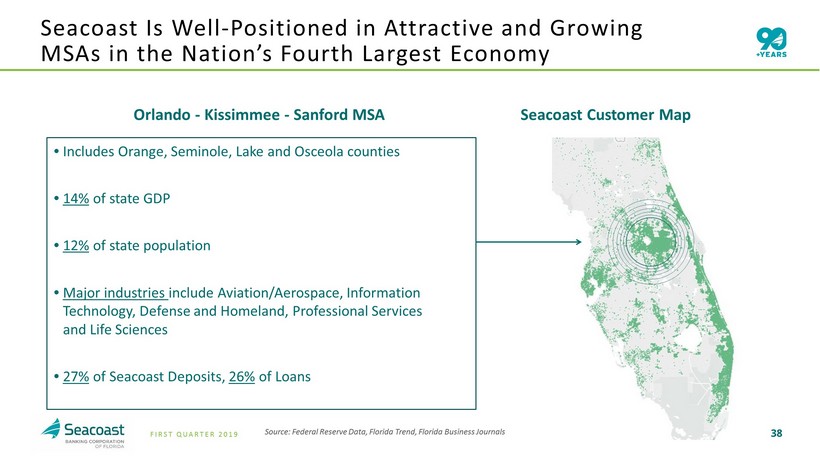
38 FIRST QUARTER 2019 Seacoast Customer Map • Includes Orange, Seminole, Lake and Osceola counties • 14% of state GDP • 12% of state population • Major industries include Aviation/Aerospace, Information Technology, Defense and Homeland, Professional Services and Life Sciences • 27% of Seacoast Deposits, 26% of Loans Orlando - Kissimmee - Sanford MSA Source: Federal Reserve Data, Florida Trend, Florida Business Journals Seacoast Is Well - Positioned in Attractive and Growing MSAs in t he Nation’s Fourth Largest Economy
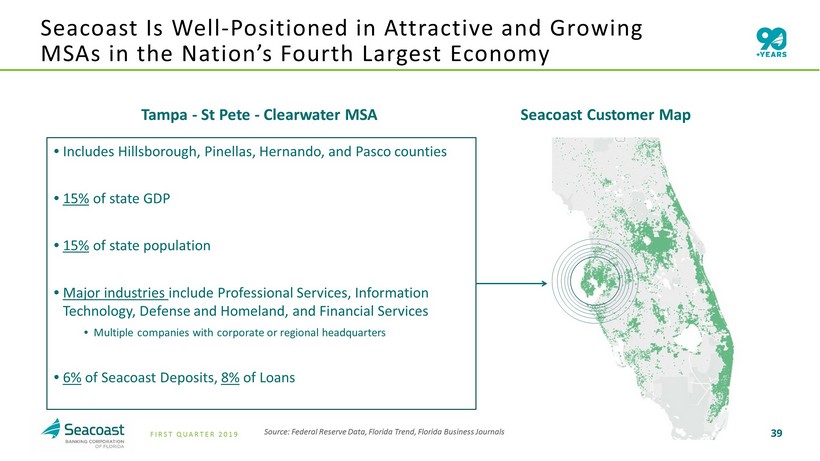
39 FIRST QUARTER 2019 Seacoast Customer Map • Includes Hillsborough, Pinellas, Hernando, and Pasco counties • 15% of state GDP • 15% of state population • Major industries include Professional Services, Information Technology, Defense and Homeland, and Financial Services • Multiple companies with corporate or regional headquarters • 6% of Seacoast Deposits, 8% of Loans Tampa - St Pete - Clearwater MSA Source: Federal Reserve Data, Florida Trend, Florida Business Journals Seacoast Is Well - Positioned in Attractive and Growing MSAs in t he Nation’s Fourth Largest Economy
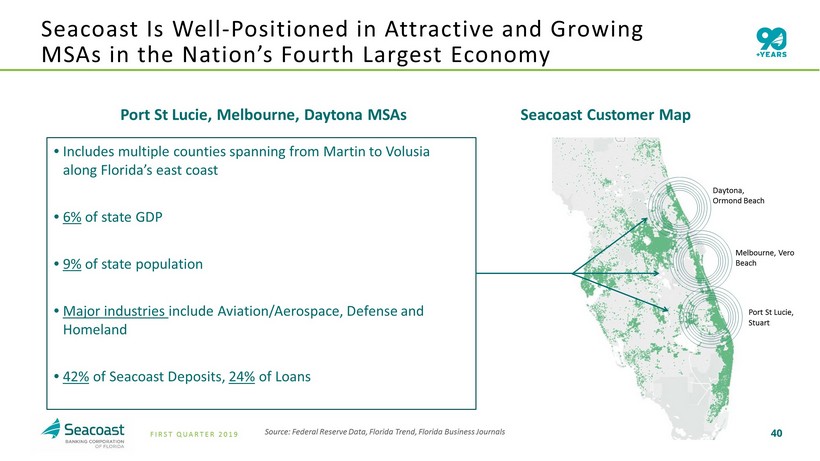
40 FIRST QUARTER 2019 Seacoast Customer Map • Includes multiple counties spanning from Martin to Volusia along Florida’s east coast • 6 % of state GDP • 9 % of state population • Major industries include Aviation/Aerospace, Defense and Homeland • 42% of Seacoast Deposits, 24% of Loans Port St Lucie, Melbourne, Daytona MSAs Port St Lucie, Stuart Melbourne, Vero Beach Daytona, Ormond Beach Source: Federal Reserve Data, Florida Trend, Florida Business Journals Seacoast Is Well - Positioned in Attractive and Growing MSAs in t he Nation’s Fourth Largest Economy
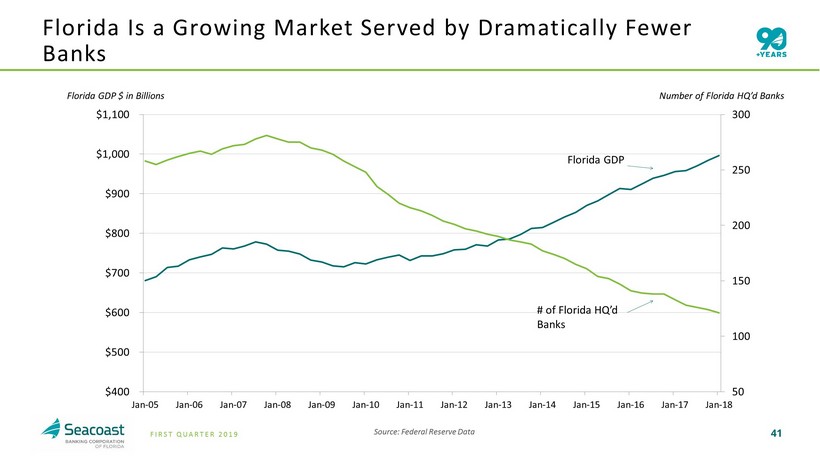
41 FIRST QUARTER 2019 Florida Is a Growing Market Served by Dramatically Fewer Banks 50 100 150 200 250 300 $400 $500 $600 $700 $800 $900 $1,000 $1,100 Jan-05 Jan-06 Jan-07 Jan-08 Jan-09 Jan-10 Jan-11 Jan-12 Jan-13 Jan-14 Jan-15 Jan-16 Jan-17 Jan-18 Florida GDP $ in Billions Number of Florida HQ’d Banks Florida GDP # of Florida HQ’d Banks Source: Federal Reserve Data
42 FIRST QUARTER 2019 Experienced Board and Management Team Aligned With Shareholders Well - Positioned to Benefit from Florida Market Advanced Analytical and Digital Capabilities Focused on Controls Comprehensive Organic Growth Model Track Record of Value - Creating Acquisitions Seacoast Executes a Differentiated Strategy from Other Community Banks
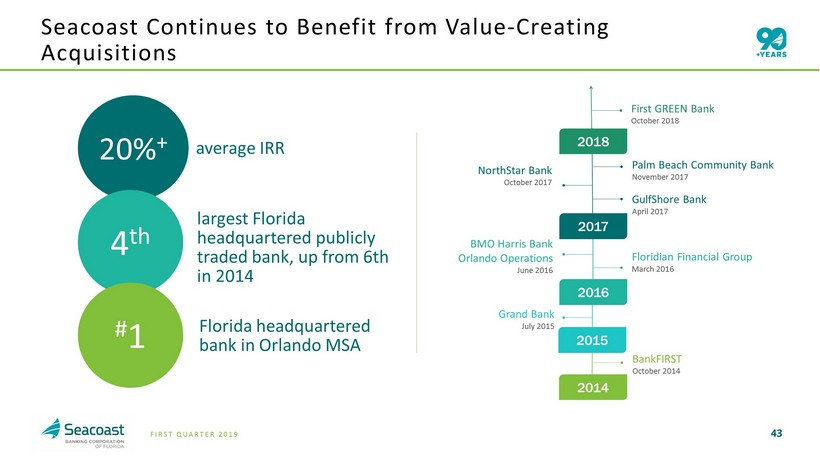
43 FIRST QUARTER 2019 20% average IRR largest Florida headquartered publicly traded bank , up from 6th in 2014 #1 Seacoast Continues to Benefit from Value - Creating Acquisitions GulfShore Bank April 2017 BMO Harris Bank Orlando Operations June 2016 Floridian Financial Group March 2016 Grand Bank July 2015 BankFIRST October 2014 2014 2015 2016 2017 NorthStar Bank October 2017 Palm Beach Community Bank November 2017 First GREEN Bank October 2018 2018 20% + 4 th # 1 Florida headquartered bank in Orlando MSA
44 FIRST QUARTER 2019 Experienced Board and Management Team Aligned With Shareholders Well - Positioned to Benefit from Florida Market Advanced Analytical and Digital Capabilities Focused on Controls Comprehensive Organic Growth Model Track Record of Value - Creating Acquisitions Seacoast Executes a Differentiated Strategy from Other Community Banks
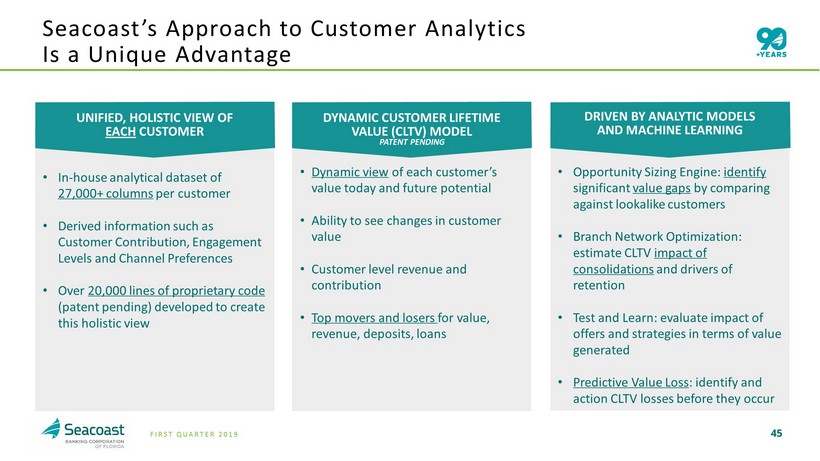
45 FIRST QUARTER 2019 Seacoast’s Approach to Customer Analytics Is a Unique Advantage UNIFIED, HOLISTIC VIEW OF EACH CUSTOMER • In - house analytical dataset of 27,000+ columns per customer • Derived information such as Customer Contribution, Engagement Levels and Channel Preferences • Over 20,000 lines of proprietary code (patent pending) developed to create this holistic view DYNAMIC CUSTOMER LIFETIME VALUE (CLTV) MODEL PATENT PENDING • Dynamic view of each customer’s value today and future potential • Ability to see changes in customer value • Customer level revenue and contribution • Top movers and losers for value, revenue, deposits, loans DRIVEN BY ANALYTIC MODELS AND MACHINE LEARNING • Opportunity Sizing Engine: identify significant value gaps by comparing against lookalike customers • Branch Network Optimization: estimate CLTV impact of consolidations and drivers of retention • Test and Learn: evaluate impact of offers and strategies in terms of value generated • Predictive Value Loss : identify and action CLTV losses before they occur
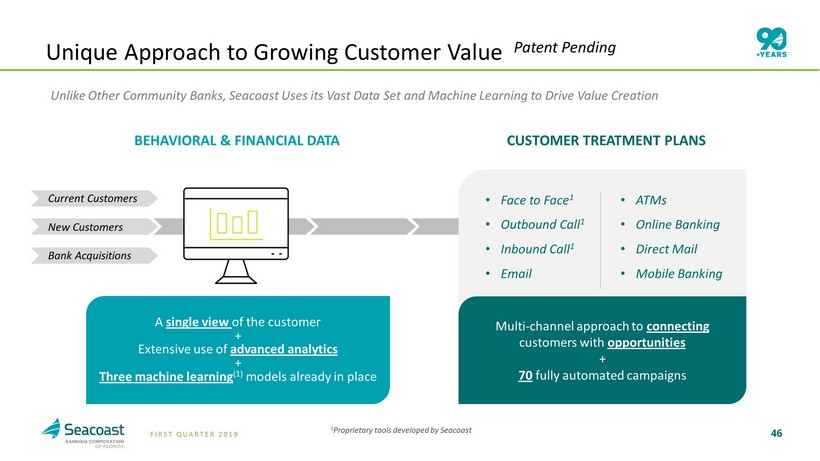
46 FIRST QUARTER 2019 v XXXXXXX 46 Unique Approach to Growing Customer Value Patent Pending Unlike Other Community Banks, Seacoast Uses its Vast Data Set and Machine Learning to Drive Value Creation A single view of the customer + Extensive use of advanced analytics + Three machine learning (1) models already in place BEHAVIORAL & FINANCIAL DATA Current Customers New Customers Bank Acquisitions • Face to Face 1 • Outbound Call 1 • Inbound Call 1 • Email • ATMs • Online Banking • Direct Mail • Mobile Banking Multi - channel approach to connecting customers with opportunities + 70 fully automated campaigns CUSTOMER TREATMENT PLANS 1 Proprietary tools developed by Seacoast
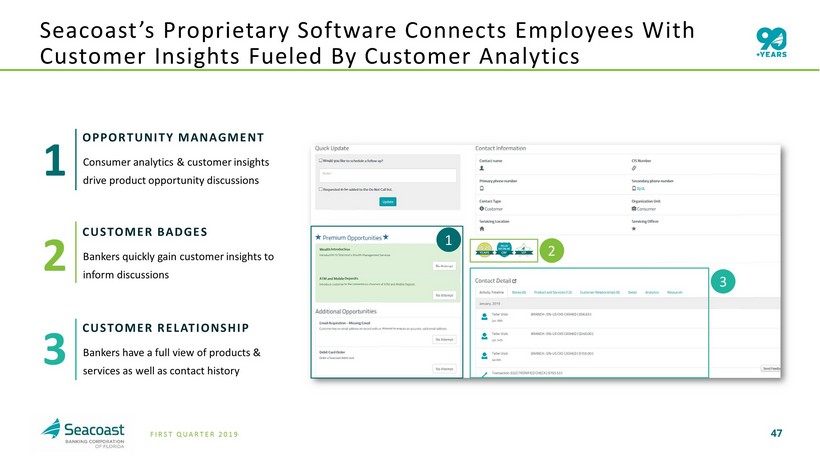
47 FIRST QUARTER 2019 Seacoast’s Proprietary Software Connects Employees With Customer Insights Fueled By Customer Analytics CUSTOMER RELATIONSHIP Bankers have a full view of products & services as well as contact history OPPORTUNITY MANAGMENT Consumer analytics & customer insights drive product opportunity discussions CUSTOMER BADGES Bankers quickly gain customer insights to inform discussions 2 3 1 2 1 3
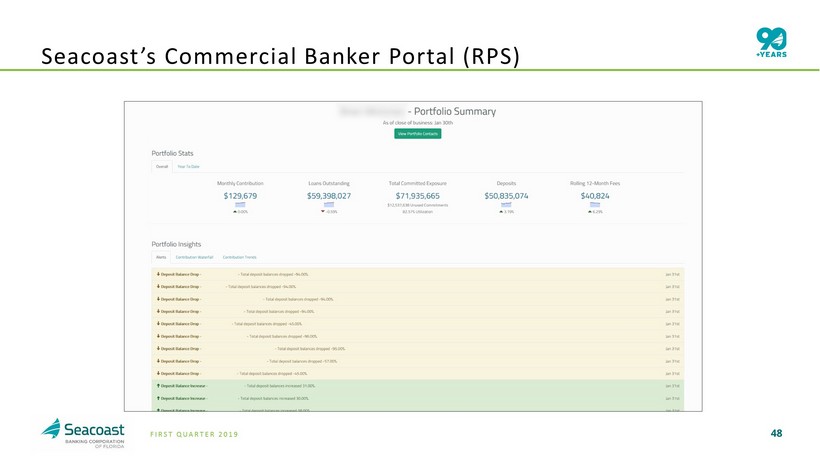
48 FIRST QUARTER 2019 Seacoast’s Commercial Banker Portal (RPS)
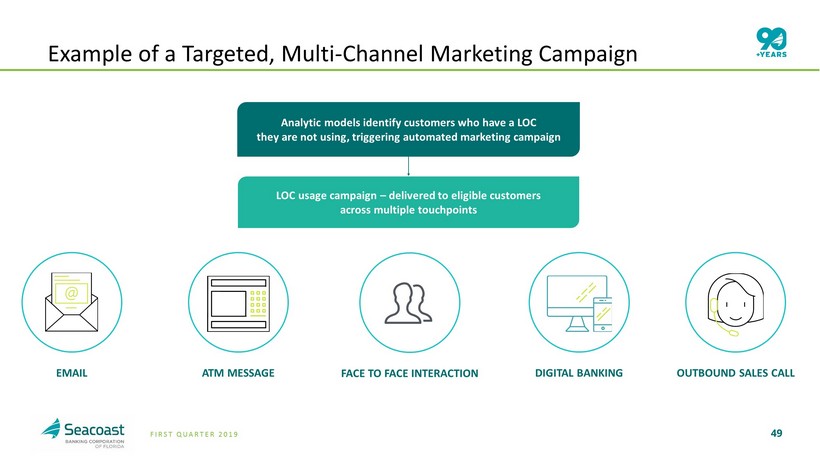
49 FIRST QUARTER 2019 Example of a Targeted, Multi - Channel Marketing Campaign LOC usage campaign – delivered to eligible customers across multiple touchpoints Analytic models identify customers who have a LOC they are not using, triggering automated marketing campaign EMAIL ATM MESSAGE DIGITAL BANKING OUTBOUND SALES CALL FACE TO FACE INTERACTION
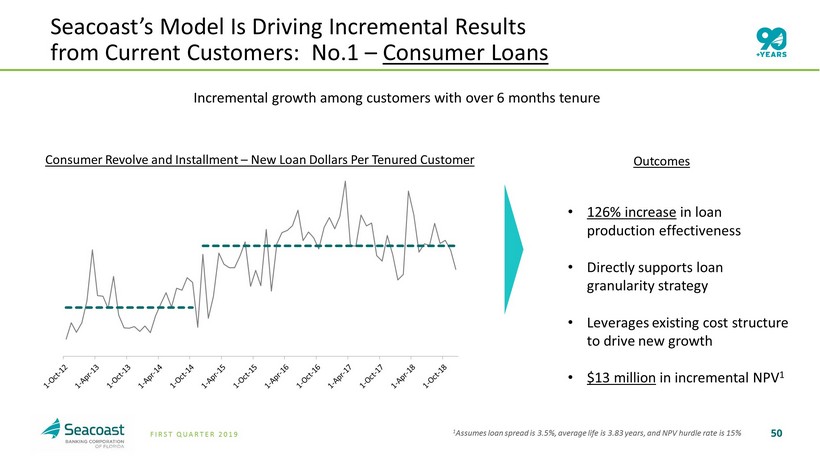
50 FIRST QUARTER 2019 XXXXXXX 50 Seacoast’s Model Is Driving Incremental Results from Current Customers: No.1 – Consumer Loans Incremental growth among customers with over 6 months tenure 1 Assumes loan spread is 3.5%, average life is 3.83 years, and NPV hurdle rate is 15% • 126% increase in loan production effectiveness • Directly supports loan granularity strategy • Leverages existing cost structure to drive new growth • $13 million in incremental NPV 1 Outcomes Consumer Revolve and Installment – New Loan Dollars Per Tenured Customer
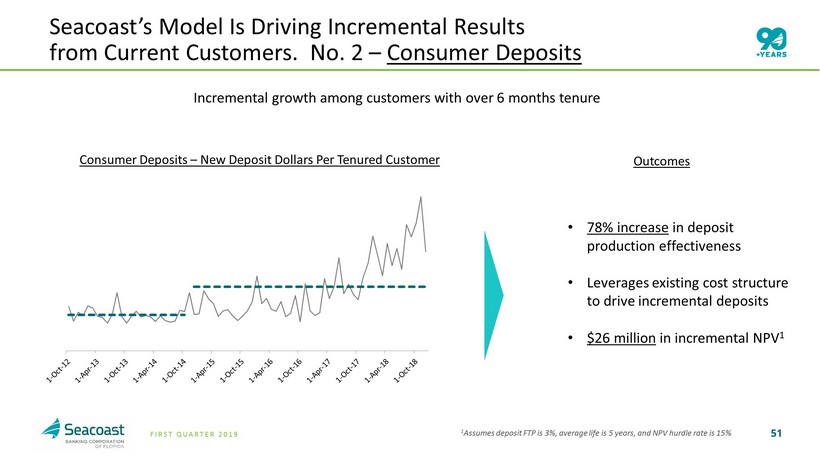
51 FIRST QUARTER 2019 XXXXXXX 51 Seacoast’s Model Is Driving Incremental Results from Current Customers. No. 2 – Consumer Deposits • 78% increase in deposit production effectiveness • Leverages existing cost structure to drive incremental deposits • $26 million in incremental NPV 1 Incremental growth among customers with over 6 months tenure Consumer Deposits – New Deposit Dollars Per Tenured Customer Outcomes 1 Assumes deposit FTP is 3%, average life is 5 years, and NPV hurdle rate is 15%
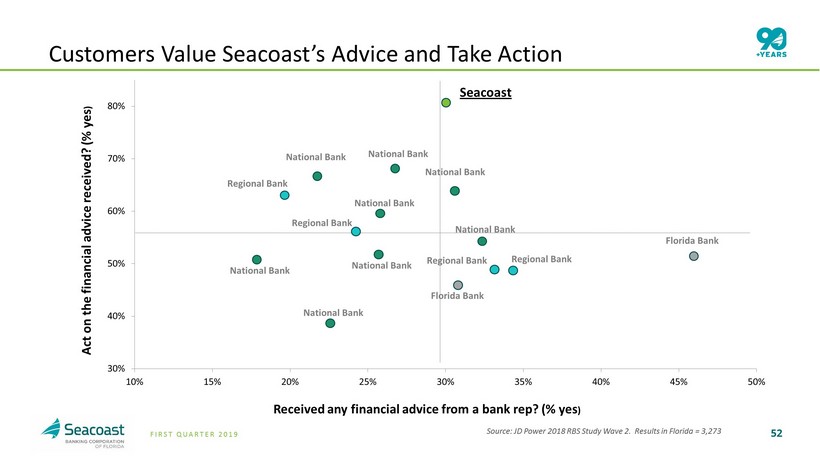
52 FIRST QUARTER 2019 52 Customers Value Seacoast’s Advice and Take Action 30% 40% 50% 60% 70% 80% 10% 15% 20% 25% 30% 35% 40% 45% 50% Act on the financial advice received? (% yes ) Received any financial advice from a bank rep? (% yes ) Seacoast National Bank Regional Bank National Bank National Bank National Bank Regional Bank National Bank National Bank National Bank National Bank Regional Bank Regional Bank Florida Bank Florida Bank Source: JD Power 2018 RBS Study Wave 2. Results in Florida = 3,273
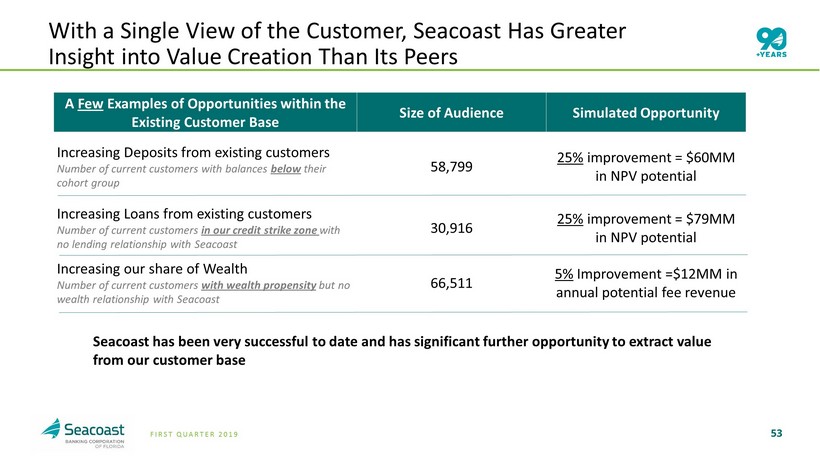
53 FIRST QUARTER 2019 53 With a Single View of the Customer, Seacoast Has Greater Insight into Value Creation Than Its Peers A Few Examples of Opportunities within the Existing Customer Base Size of Audience Simulated Opportunity Increasing Deposits from existing customers Number of current customers with balances below their cohort group 58,799 25% improvement = $60MM in NPV potential Increasing Loans from existing customers Number of current customers in our credit strike zone with no lending relationship with Seacoast 30,916 25% improvement = $79MM in NPV potential Increasing our share of Wealth Number of current customers with wealth propensity but no wealth relationship with Seacoast 66,511 5% Improvement =$12MM in annual potential fee revenue Seacoast has been very successful to date and has significant further opportunity to extract value from our customer base
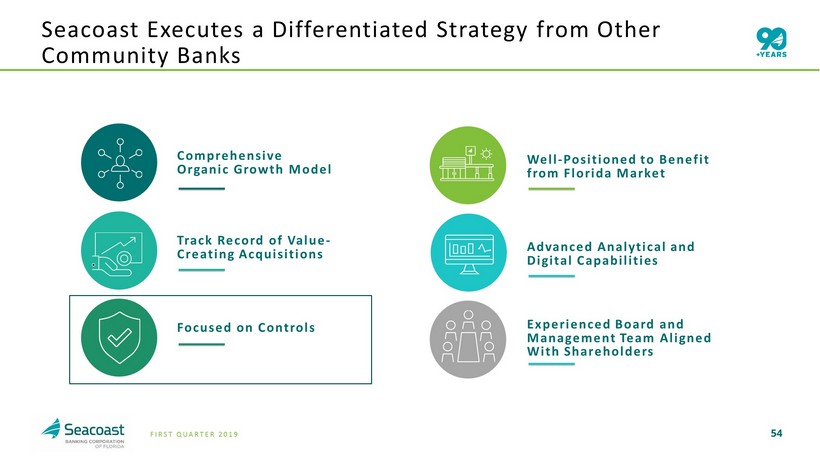
54 FIRST QUARTER 2019 Experienced Board and Management Team Aligned With Shareholders Well - Positioned to Benefit from Florida Market Advanced Analytical and Digital Capabilities Focused on Controls Comprehensive Organic Growth Model Track Record of Value - Creating Acquisitions Seacoast Executes a Differentiated Strategy from Other Community Banks
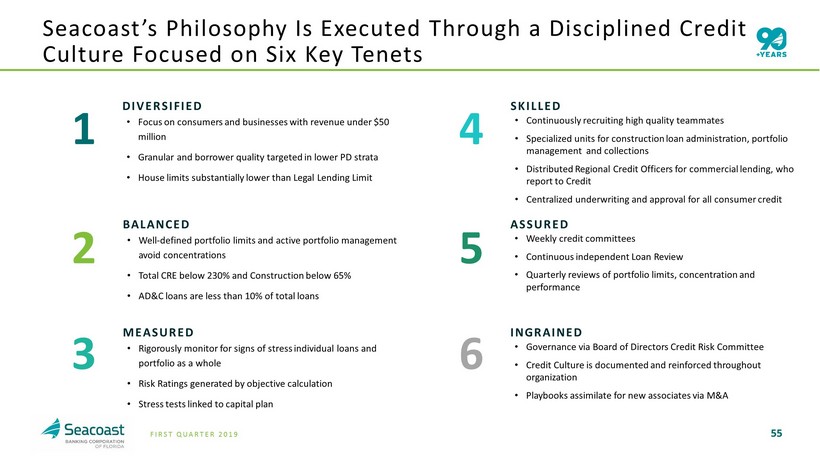
55 FIRST QUARTER 2019 INGRAINED DIVERSIFIED • Focus on consumers and businesses with revenue under $50 million • Granular and borrower quality targeted in lower PD strata • House limits substantially lower than Legal Lending Limit ASSURED 5 6 4 MEASURED SKILLED • Continuously recruiting high quality teammates • Specialized units for construction loan administration, portfolio management and collections • Distributed Regional Credit Officers for commercial lending, who report to Credit • Centralized underwriting and approval for all consumer credit BALANCED • Well - defined portfolio limits and active portfolio management avoid concentrations • Total CRE below 230% and Construction below 65% • AD&C loans are less than 10 % of total loans 2 3 1 Seacoast’s Philosophy Is Executed Through a Disciplined Credit Culture Focused on Six Key Tenets • Rigorously monitor for signs of stress individual loans and portfolio as a whole • Risk Ratings generated by objective calculation • Stress tests linked to capital plan • Governance via Board of Directors Credit Risk Committee • Credit Culture is documented and reinforced throughout organization • Playbooks assimilate for new associates via M&A • Weekly credit committees • Continuous independent Loan Review • Quarterly reviews of portfolio limits, concentration and performance
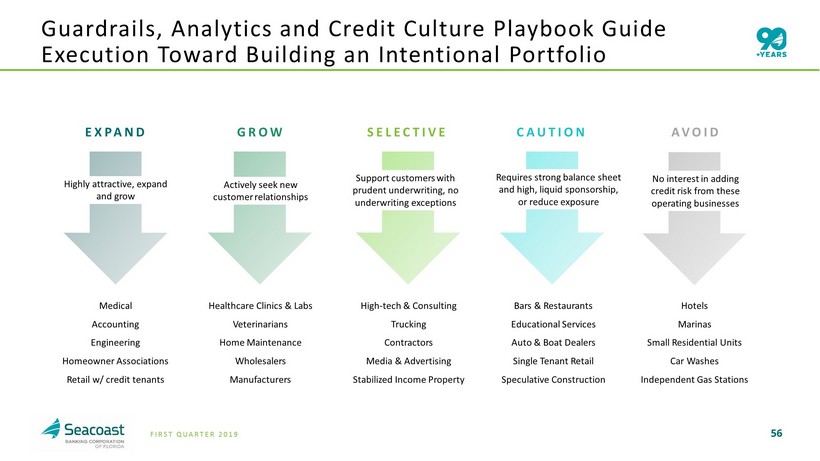
56 FIRST QUARTER 2019 EXPAND GROW SELECTIVE CAUTION AVOID Guardrails , Analytics and Credit Culture Playbook Guide E xecution T oward B uilding an Intentional P ortfolio Medical Accounting Engineering Homeowner Associations Retail w/ credit tenants Healthcare Clinics & Labs Veterinarians Home Maintenance Wholesalers Manufacturers High - tech & Consulting Trucking Contractors Media & Advertising Stabilized Income Property Bars & Restaurants Educational Services Auto & Boat Dealers Single Tenant Retail Speculative Construction Hotels Marinas Small Residential Units Car Washes Independent Gas Stations Highly attractive, expand and grow Actively seek new customer relationships Support customers with prudent underwriting, no underwriting exceptions Requires strong balance sheet and high, liquid sponsorship, or reduce exposure No interest in adding credit risk from these operating businesses
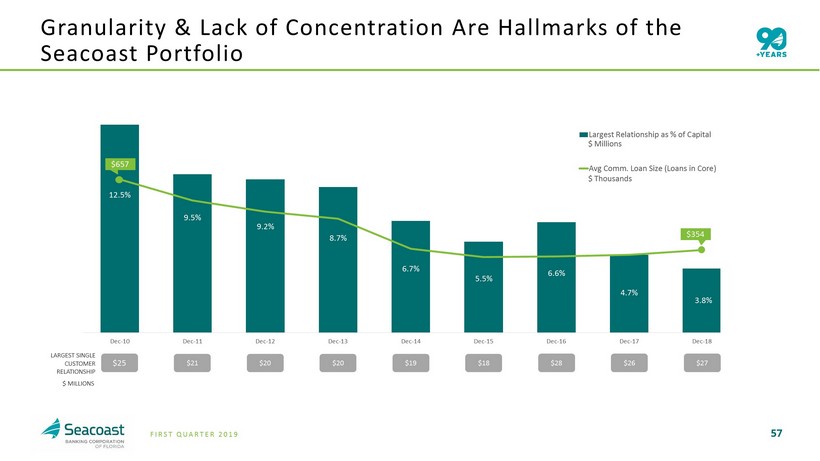
57 FIRST QUARTER 2019 12.5% 9.5% 9.2% 8.7% 6.7% 5.5% 6.6% 4.7% 3.8% $- $500 $1,000 0% 2% 4% 6% 8% 10% 12% 14% Dec-10 Dec-11 Dec-12 Dec-13 Dec-14 Dec-15 Dec-16 Dec-17 Dec-18 Largest Relationship as % of Capital Avg Comm. Loan Size (Loans in Core) Granularity & Lack of Concentration Are Hallmarks of the Seacoast Portfolio $657 $354 $ Millions $ Thousands LARGEST SINGLE CUSTOMER RELATIONSHIP $ 25 $ 21 $ 20 $ 20 $19 $18 $ 28 $ 26 $ 27 $ MILLIONS
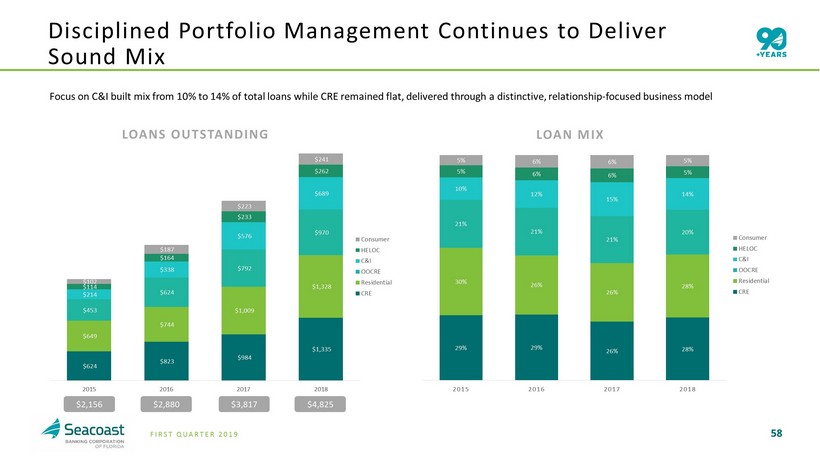
58 FIRST QUARTER 2019 Disciplined Portfolio Management Continues to Deliver Sound Mix 58 $ 2,156 $ 2,880 $ 4,825 $ 3,817 29% 29% 26% 28% 30% 26% 26% 28% 21% 21% 21% 20% 10% 12% 15% 14% 5% 6% 6% 5% 5% 6% 6% 5% 2015 2016 2017 2018 Consumer HELOC C&I OOCRE Residential CRE Focus on C&I built mix from 10% to 14% of total loans while CRE remained flat, delivered through a distinctive, relationship - focused business model LOANS OUTSTANDING LOAN MIX $624 $823 $984 $1,335 $649 $744 $1,009 $1,328 $453 $624 $792 $970 $214 $338 $576 $689 $114 $164 $233 $262 $102 $187 $223 $241 2015 2016 2017 2018 Consumer HELOC C&I OOCRE Residential CRE
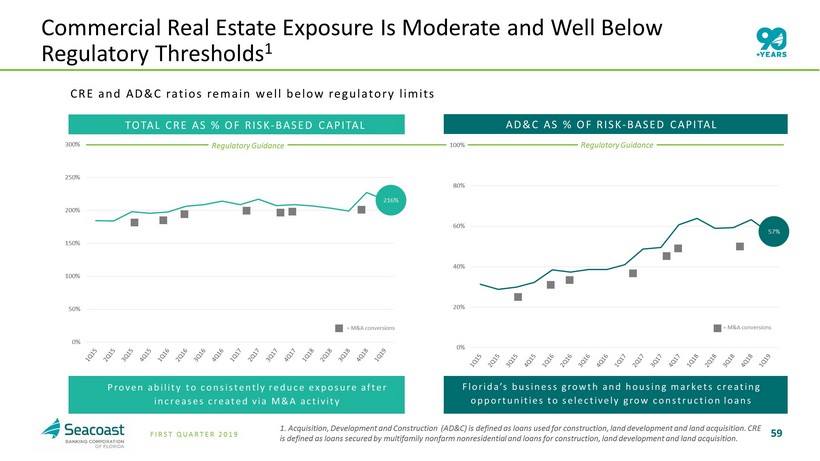
59 FIRST QUARTER 2019 DOWNLOADS CRE and AD&C ratios remain well below regulatory limit s Commercial Real Estate Exposure Is Moderate and Well Below Regulatory Thresholds 1 1. Acquisition, Development and Construction (AD&C) is defined as loans used for construction, land development and land acquisition. CRE is defined as loans secured by multifamily nonfarm nonresidential and loans for construction, land development and land acqui sit ion. Proven ability to consistently reduce exposure after increases created via M&A activity TOTAL CRE AS % OF RISK - BASED CAPITAL AD&C AS % OF RISK - BASED CAPITAL Florida’s business growth and housing markets creating opportunities to selectively grow construction loans 0% 50% 100% 150% 200% 250% 300% 0% 20% 40% 60% 80% 100% Regulatory Guidance 100% Regulatory Guidance = M&A conversions = M&A conversions 216% 57%
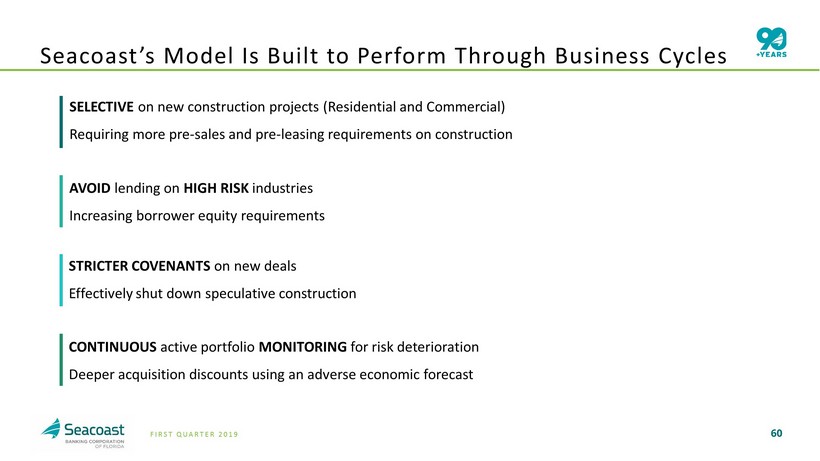
60 FIRST QUARTER 2019 SELECTIVE on new construction projects (Residential and Commercial ) Requiring more pre - sales and pre - leasing requirements on construction Seacoast’s Model Is Built to P erform Through Business Cycles AVOID lending on HIGH RISK industries Increasing borrower equity requirements STRICTER COVENANTS on new deals Effectively shut down speculative construction CONTINUOUS active portfolio MONITORING for risk deterioration Deeper acquisition discounts using an adverse economic forecast
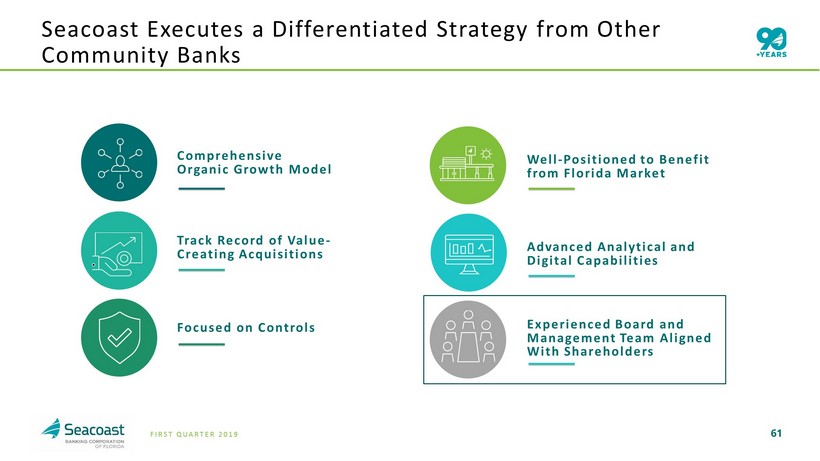
61 FIRST QUARTER 2019 Experienced Board and Management Team Aligned With Shareholders Well - Positioned to Benefit from Florida Market Advanced Analytical and Digital Capabilities Focused on Controls Comprehensive Organic Growth Model Track Record of Value - Creating Acquisitions Seacoast Executes a Differentiated Strategy from Other Community Banks
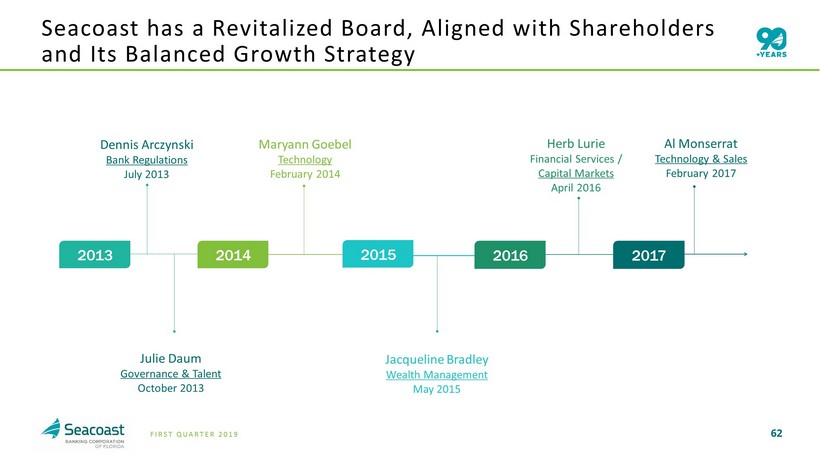
62 FIRST QUARTER 2019 Jacqueline Bradley May 2015 2013 2014 2017 2016 Dennis Arczynski Bank Regulations July 2013 Julie Daum Governance & Talent October 2013 Maryann Goebel Technology February 2014 Jacqueline Bradley Wealth Management May 2015 Herb Lurie Financial Services / Capital Markets April 2016 Al Monserrat Technology & Sales February 2017 2015 Seacoast has a Revitalized Board, Aligned with Shareholders and Its Balanced Growth Strategy
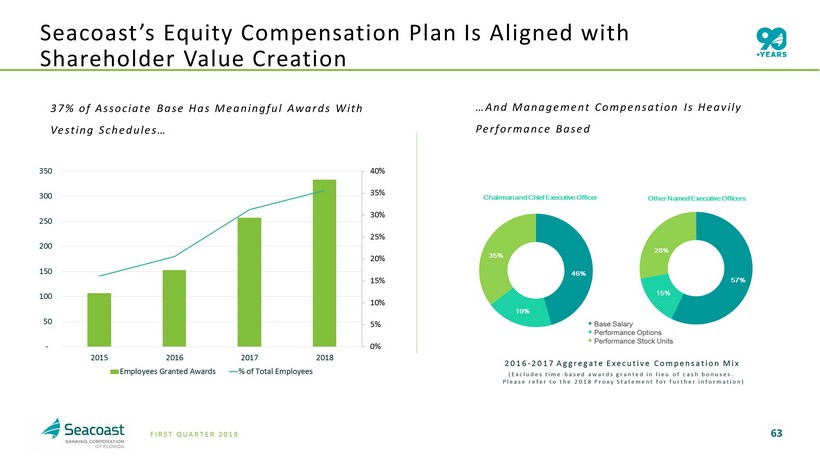
63 FIRST QUARTER 2019 Seacoast’s Equity Compensation Plan Is Aligned with Shareholder Value Creation 0% 5% 10% 15% 20% 25% 30% 35% 40% - 50 100 150 200 250 300 350 2015 2016 2017 2018 Employees Granted Awards % of Total Employees 37% of Associate B ase H as Meaningful A wards W ith Vesting Schedules… 2016 - 2017 Aggregate Executive Compensation Mix (Excludes time - based awards granted in lieu of cash bonuses. Please refer to the 2018 Proxy Statement for further information) …And Management Compensation Is Heavily Performance Based
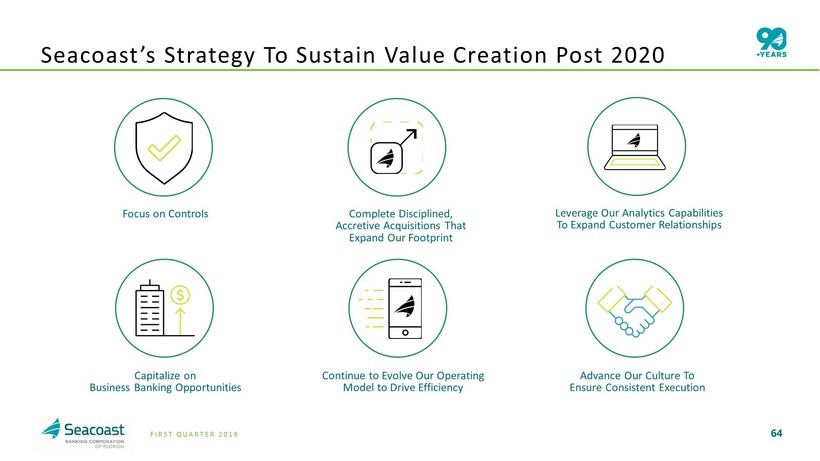
64 FIRST QUARTER 2019 Advance Our Culture To Ensure Consistent Execution Capitalize on Business Banking Opportunities Continue to Evolve Our Operating Model to Drive Efficiency Leverage Our Analytics Capabilities To Expand Customer Relationships Complete Disciplined, Accretive Acquisitions That Expand Our Footprint Focus on Controls Seacoast’s Strategy To Sustain Value Creation Post 2020
65 FIRST QUARTER 2019 Agenda 65 ABOUT SEACOAST BANK 1 COMPANY PERFORMANCE 2 SEACOAST’S DIFFERENTIATED STRATEGY 3 OUTLOOK 4
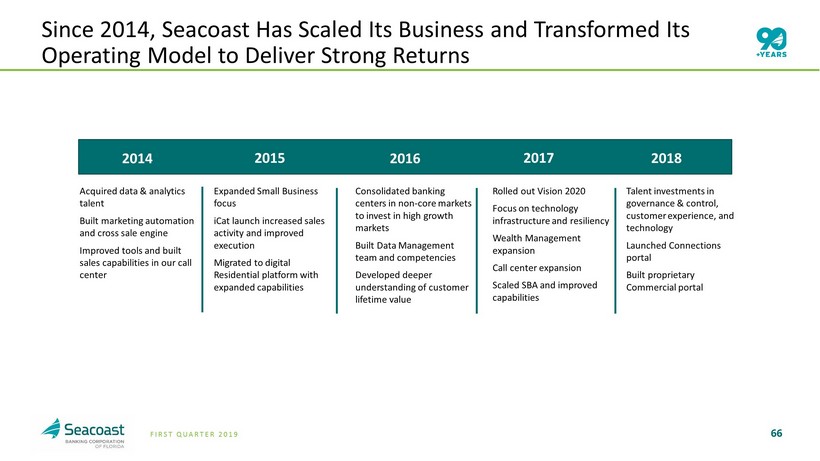
66 FIRST QUARTER 2019 2014 2015 2016 2018 2017 Acquired data & analytics talent Built marketing automation and cross sale engine Improved tools and built sales capabilities in our call center Expanded Small Business focus iCat launch increased sales activity and improved execution Migrated to digital Residential platform with expanded capabilities Talent investments in governance & control, customer experience, and technology Launched Connections portal Built proprietary Commercial portal Rolled out Vision 2020 Focus on technology infrastructure and resiliency Wealth Management expansion Call center expansion Scaled SBA and improved capabilities Consolidated banking centers in non - core markets to invest in high growth markets Built Data Management team and competencies Developed deeper understanding of customer lifetime value $3.1B assets $456MM mkt cap 81.3% efficiency $4.7B assets $839MM mkt cap 64.7% efficiency $3.5B assets $515MM mkt cap 68.5% efficiency $5.8B assets $1.2B mkt cap 58.9% efficiency $6.8B assets $ 1.3 mkt cap 54.8% efficiency Since 2014, Seacoast Has Scaled Its Business and Transformed Its Operating Model to Deliver Strong Returns 2014 2015 2016 2018 2017
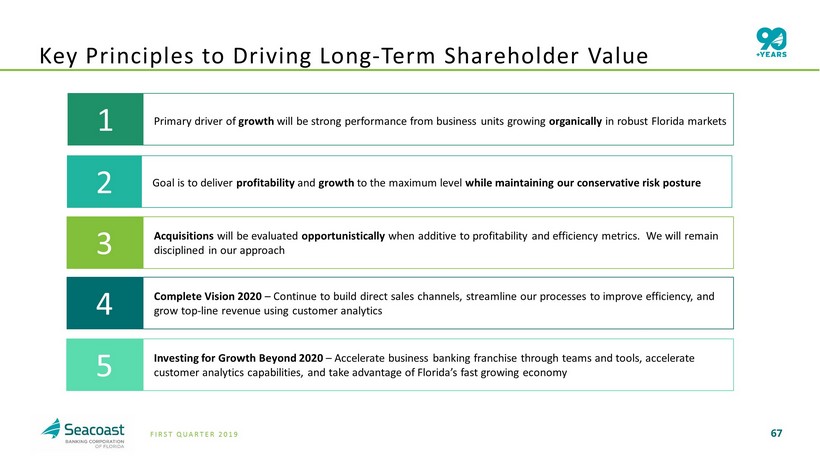
67 FIRST QUARTER 2019 67 1 Primary driver of growth will be strong performance from business units growing organically in robust Florida markets 2 Goal is to deliver profitability and growth to the maximum level while maintaining our conservative risk posture 3 Acquisitions will be evaluated opportunistically when additive to profitability and efficiency metrics. We will remain disciplined in our approach 4 Complete Vision 2020 – Continue to build direct sales channels, streamline our processes to improve efficiency, and grow top - line revenue using customer analytics 5 Investing for Growth Beyond 2020 – Accelerate business banking franchise through teams and tools, accelerate customer analytics capabilities, and take advantage of Florida’s fast growing economy Key Principles to Driving Long - Term Shareholder Value

68 FIRST QUARTER 2019 How We Sell • Continue to develop direct sales channels and offerings based on customer needs and preferences • Simplify processes for our customers and bankers • Reduce our cost to acquire relationships How We Service • We are outpacing our peers in engaging our customers with self - serve options for routine banking needs • This is creating the ability to reduce cost in the traditional model, and invest in personalized service for more complex transactions How We Operate • Data analytics is driving top line revenue, enhanced management decision making, and deeper customer penetration • We are making investments to reduce product delivery times by streamlining internal processes through technology and reengineering 68 Seacoast Is On Track T o Achieve Vision 2020 Goals Launched in 2017, Vision 2020 Connects Current and Planned Innovations with Necessary Changes in Our Business How We Scale and Evolve our Culture • O ur culture is a competitive advantage that differentiates us from the competition • Culture doesn’t happen on its own, we will be deliberate in our efforts to scale, evolve and sustain a culture of empowered, engaged and customer obsessed teammates ROTA | 1.30%+ Vision 2020 Goals ROTCE | 16%+ Efficiency Ratio | Below 50
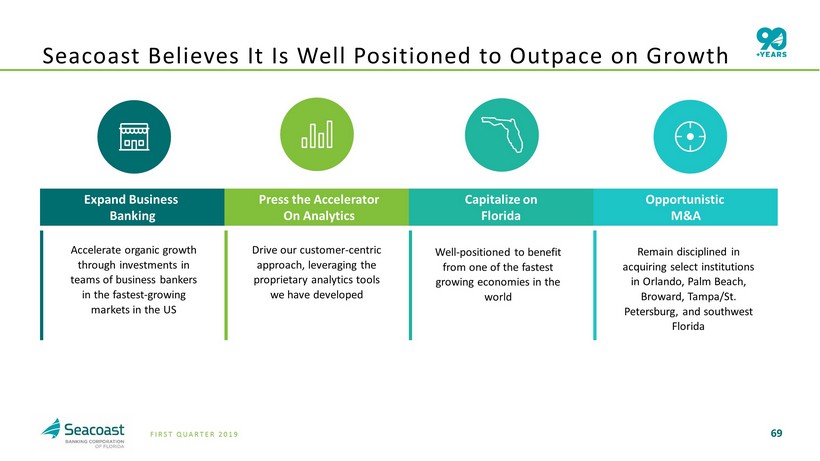
69 FIRST QUARTER 2019 Drive our customer - centric approach, leveraging the proprietary analytics tools we have developed Press the Accelerator On Analytics Remain disciplined in acquiring select institutions in Orlando, Palm Beach, Broward, Tampa/St. Petersburg, and southwest Florida Expand Business Banking Accelerate organic growth through investments in teams of business bankers in the fastest - growing markets in the US Seacoast Believes It Is Well Positioned to Outpace on Growth Capitalize on Florida Well - positioned to benefit from one of the fastest growing economies in the world Opportunistic M&A
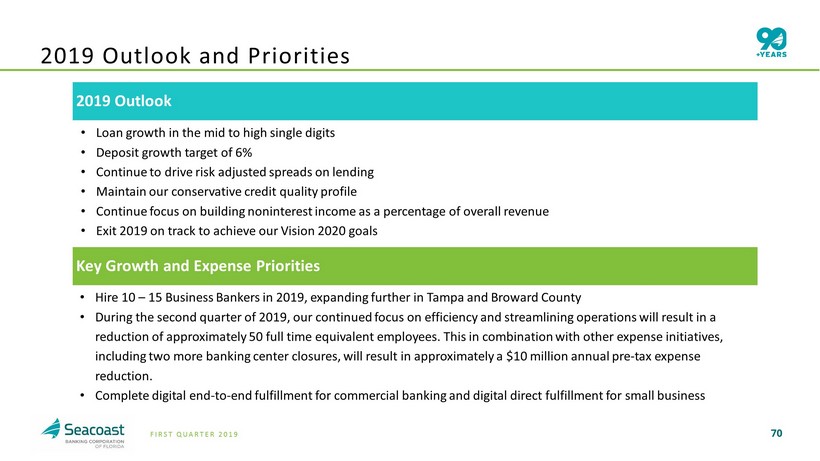
70 FIRST QUARTER 2019 2019 Outlook • Loan growth in the mid to high single digits • Deposit growth target of 6 % • Continue to drive risk adjusted spreads on lending • Maintain our conservative credit quality profile • Continue focus on building noninterest income as a percentage of overall revenue • Exit 2019 on track to achieve our Vision 2020 goals 2019 Outlook and Priorities Key Growth and Expense Priorities • Hire 10 – 15 Business Bankers in 2019, expanding further in Tampa and Broward County • During the second quarter of 2019, our continued focus on efficiency and streamlining operations will result in a reduction of approximately 50 full time equivalent employees. This in combination with other expense initiatives, including two more banking center closures, will result in approximately a $10 million annual pre - tax expense reduction. • Complete digital end - to - end fulfillment for commercial banking and digital direct fulfillment for small business
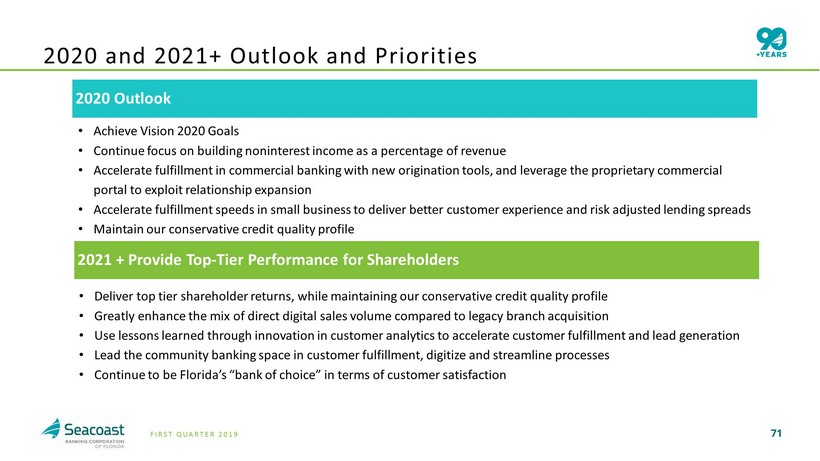
71 FIRST QUARTER 2019 2020 Outlook • Achieve Vision 2020 Goals • Continue focus on building noninterest income as a percentage of revenue • Accelerate fulfillment in commercial banking with new origination tools, and leverage the proprietary commercial portal to exploit relationship expansion • Accelerate fulfillment speeds in small business to deliver better customer experience and risk adjusted lending spreads • Maintain our conservative credit quality profile 2020 and 2021+ Outlook and Priorities 2021 + Provide Top - Tier Performance for Shareholders • Deliver top tier shareholder returns, while maintaining our conservative credit quality profile • Greatly enhance the mix of direct digital sales volume compared to legacy branch acquisition • Use lessons learned through innovation in customer analytics to accelerate customer fulfillment and lead generation • Lead the community banking space in customer fulfillment, digitize and streamline processes • Continue to be Florida’s “bank of choice” in terms of customer satisfaction
72 FIRST QUARTER 2019 Charles M. Shaffer Executive Vice President Chief Financial Officer (772) 221 - 7003 Chuck.Shaffer@seacoastbank.com INVESTOR RELATIONS www.SeacoastBanking.com NASDAQ: SBCF Contact Details: Seacoast Banking Corporation of Florida 72
73 FIRST QUARTER 2019 Explanation of Certain Unaudited Non - GAAP Financial Measures This presentation contains financial information determined by methods other than Generally Accepted Accounting Principles (“GAAP”) . The financial highlights provide reconciliations between GAAP net income and adjusted net income, GAAP income and adjusted pretax, preprovision income . Management uses these non - GAAP financial measures in its analysis of the Company’s performance and believes these presentations provide useful supplemental information, and a clearer understanding of the Company’s performance . The Company believes the non - GAAP measures enhance investors’ understanding of the Company’s business and performance and if not provided would be requested by the investor community . These measures are also useful in understanding performance trends and facilitate comparisons with the performance of other financial institutions . The limitations associated with operating measures are the risk that persons might disagree as to the appropriateness of items comprising these measures and that different companies might calculate these measures differently . The Company provides reconciliations between GAAP and these non - GAAP measures . These disclosures should not be considered an alternative to GAAP . 17
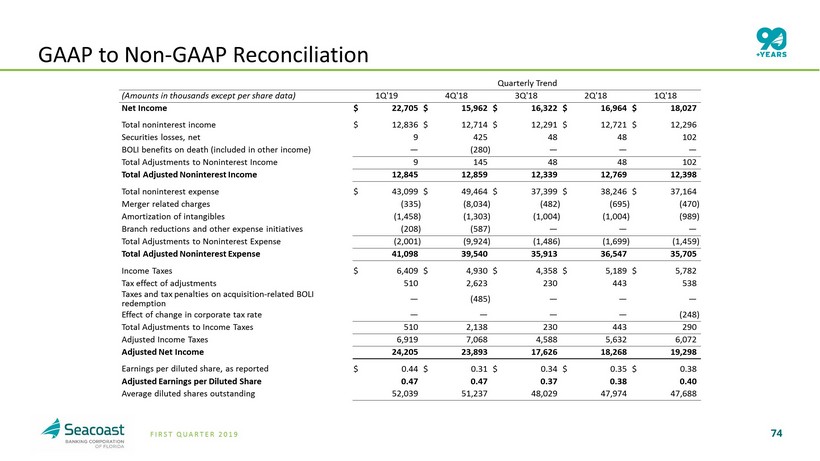
74 FIRST QUARTER 2019 GAAP to Non - GAAP Reconciliation Quarterly Trend (Amounts in thousands except per share data) 1Q'19 4Q'18 3Q'18 2Q'18 1Q'18 Net Income $ 22,705 $ 15,962 $ 16,322 $ 16,964 $ 18,027 Total noninterest income $ 12,836 $ 12,714 $ 12,291 $ 12,721 $ 12,296 Securities losses, net 9 425 48 48 102 BOLI benefits on death (included in other income) — (280 ) — — — Total Adjustments to Noninterest Income 9 145 48 48 102 Total Adjusted Noninterest Income 12,845 12,859 12,339 12,769 12,398 Total noninterest expense $ 43,099 $ 49,464 $ 37,399 $ 38,246 $ 37,164 Merger related charges (335 ) (8,034 ) (482 ) (695 ) (470 ) Amortization of intangibles (1,458 ) (1,303 ) (1,004 ) (1,004 ) (989 ) Branch reductions and other expense initiatives (208 ) (587 ) — — — Total Adjustments to Noninterest Expense (2,001 ) (9,924 ) (1,486 ) (1,699 ) (1,459 ) Total Adjusted Noninterest Expense 41,098 39,540 35,913 36,547 35,705 Income Taxes $ 6,409 $ 4,930 $ 4,358 $ 5,189 $ 5,782 Tax effect of adjustments 510 2,623 230 443 538 Taxes and tax penalties on acquisition - related BOLI redemption — (485 ) — — — Effect of change in corporate tax rate — — — — (248 ) Total Adjustments to Income Taxes 510 2,138 230 443 290 Adjusted Income Taxes 6,919 7,068 4,588 5,632 6,072 Adjusted Net Income 24,205 23,893 17,626 18,268 19,298 Earnings per diluted share, as reported $ 0.44 $ 0.31 $ 0.34 $ 0.35 $ 0.38 Adjusted Earnings per Diluted Share 0.47 0.47 0.37 0.38 0.40 Average diluted shares outstanding 52,039 51,237 48,029 47,974 47,688
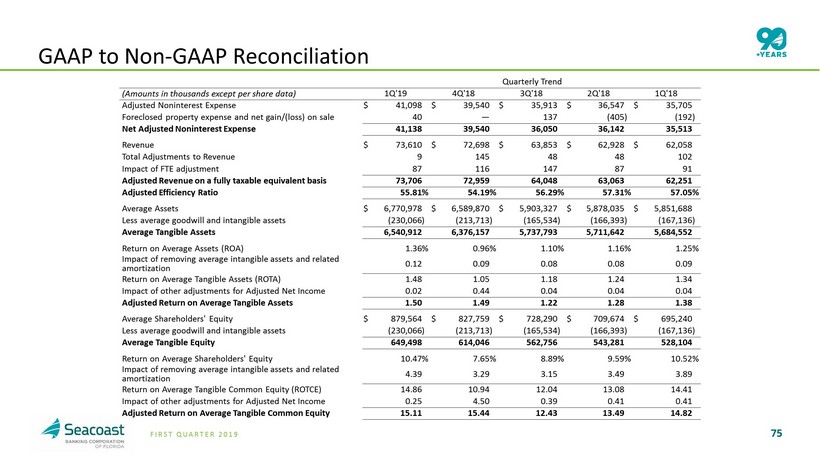
75 FIRST QUARTER 2019 GAAP to Non - GAAP Reconciliation Quarterly Trend (Amounts in thousands except per share data) 1Q'19 4Q'18 3Q'18 2Q'18 1Q'18 Adjusted Noninterest Expense $ 41,098 $ 39,540 $ 35,913 $ 36,547 $ 35,705 Foreclosed property expense and net gain/(loss) on sale 40 — 137 (405 ) (192 ) Net Adjusted Noninterest Expense 41,138 39,540 36,050 36,142 35,513 Revenue $ 73,610 $ 72,698 $ 63,853 $ 62,928 $ 62,058 Total Adjustments to Revenue 9 145 48 48 102 Impact of FTE adjustment 87 116 147 87 91 Adjusted Revenue on a fully taxable equivalent basis 73,706 72,959 64,048 63,063 62,251 Adjusted Efficiency Ratio 55.81 % 54.19 % 56.29 % 57.31 % 57.05 % Average Assets $ 6,770,978 $ 6,589,870 $ 5,903,327 $ 5,878,035 $ 5,851,688 Less average goodwill and intangible assets (230,066 ) (213,713 ) (165,534 ) (166,393 ) (167,136 ) Average Tangible Assets 6,540,912 6,376,157 5,737,793 5,711,642 5,684,552 Return on Average Assets (ROA) 1.36 % 0.96 % 1.10 % 1.16 % 1.25 % Impact of removing average intangible assets and related amortization 0.12 0.09 0.08 0.08 0.09 Return on Average Tangible Assets (ROTA) 1.48 1.05 1.18 1.24 1.34 Impact of other adjustments for Adjusted Net Income 0.02 0.44 0.04 0.04 0.04 Adjusted Return on Average Tangible Assets 1.50 1.49 1.22 1.28 1.38 Average Shareholders' Equity $ 879,564 $ 827,759 $ 728,290 $ 709,674 $ 695,240 Less average goodwill and intangible assets (230,066 ) (213,713 ) (165,534 ) (166,393 ) (167,136 ) Average Tangible Equity 649,498 614,046 562,756 543,281 528,104 Return on Average Shareholders' Equity 10.47 % 7.65 % 8.89 % 9.59 % 10.52 % Impact of removing average intangible assets and related amortization 4.39 3.29 3.15 3.49 3.89 Return on Average Tangible Common Equity (ROTCE) 14.86 10.94 12.04 13.08 14.41 Impact of other adjustments for Adjusted Net Income 0.25 4.50 0.39 0.41 0.41 Adjusted Return on Average Tangible Common Equity 15.11 15.44 12.43 13.49 14.82