Exhibit 99.2

Earnings Presentation SECOND QUARTER 2019 RESULTS Contact: (email) Chuck.Shaffer@SeacoastBank.com (phone) 772.221.7003 (web) www.SeacoastBanking.com

2 SECOND QUARTER 2019 EARNINGS PRESENTATION Cautionary Notice Regarding Forward - Looking Statements This press release contains “forward - looking statements” within the meaning, and protections, of Section 27 A of the Securities Act of 1933 and Section 21 E of the Securities Exchange Act of 1934 , including, without limitation, statements about future financial and operating results, cost savings, enhanced revenues, economic and seasonal conditions in our markets, and improvements to reported earnings that may be realized from cost controls, tax law changes, and for integration of banks that we have acquired, or expect to acquire, as well as statements with respect to Seacoast's objectives, strategic plans, including Vision 2020 , expectations and intentions and other statements that are not historical facts . Actual results may differ from those set forth in the forward - looking statements . Forward - looking statements include statements with respect to our beliefs, plans, objectives, goals, expectations, anticipations, assumptions, estimates and intentions about future performance, and involve known and unknown risks, uncertainties and other factors, which may be beyond our control, and which may cause the actual results, performance or achievements of Seacoast to be materially different from future results, performance or achievements expressed or implied by such forward - looking statements . You should not expect us to update any forward - looking statements . All statements other than statements of historical fact could be forward - looking statements . You can identify these forward - looking statements through our use of words such as “may”, “will”, “anticipate”, “assume”, “should”, “support”, “indicate”, “would”, “believe”, “contemplate”, “expect”, “estimate”, “continue”, “further”, “plan”, “point to”, “project”, “could”, “intend”, “target” or other similar words and expressions of the future . These forward - looking statements may not be realized due to a variety of factors, including, without limitation : the effects of future economic and market conditions, including seasonality ; governmental monetary and fiscal policies, including interest rate policies of the Board of Governors of the Federal Reserve, as well as legislative, tax and regulatory changes ; changes in accounting policies, rules and practices ; the risks of changes in interest rates on the level and composition of deposits, loan demand, liquidity and the values of loan collateral, securities, and interest sensitive assets and liabilities ; interest rate risks, sensitivities and the shape of the yield curve ; uncertainty related to the impact of LIBOR calculations on securities and loans ; changes in borrower credit risks and payment behaviors ; changes in the availability and cost of credit and capital in the financial markets ; changes in the prices, values and sales volumes of residential and commercial real estate ; our ability to comply with any regulatory requirements ; the effects of problems encountered by other financial institutions that adversely affect us or the banking industry ; our concentration in commercial real estate loans ; the failure of assumptions and estimates, as well as differences in, and changes to, economic, market and credit conditions ; the impact on the valuation of our investments due to market volatility or counterparty payment risk ; statutory and regulatory dividend restrictions ; increases in regulatory capital requirements for banking organizations generally ; the risks of mergers, acquisitions and divestitures, including our ability to continue to identify acquisition targets and successfully acquire desirable financial institutions ; changes in technology or products that may be more difficult, costly, or less effective than anticipated ; our ability to identify and address increased cybersecurity risks ; inability of our risk management framework to manage risks associated with our business ; dependence on key suppliers or vendors to obtain equipment or services for our business on acceptable terms ; reduction in or the termination of our ability to use the mobile - based platform that is critical to our business growth strategy ; the effects of war or other conflicts, acts of terrorism, natural disasters or other catastrophic events that may affect general economic conditions ; unexpected outcomes of, and the costs associated with, existing or new litigation involving us ; our ability to maintain adequate internal controls over financial reporting ; potential claims, damages, penalties, fines and reputational damage resulting from pending or future litigation, regulatory proceedings and enforcement actions ; the risks that our deferred tax assets could be reduced if estimates of future taxable income from our operations and tax planning strategies are less than currently estimated and sales of our capital stock could trigger a reduction in the amount of net operating loss carryforwards that we may be able to utilize for income tax purposes ; the effects of competition from other commercial banks, thrifts, mortgage banking firms, consumer finance companies, credit unions, securities brokerage firms, insurance companies, money market and other mutual funds and other financial institutions operating in our market areas and elsewhere, including institutions operating regionally, nationally and internationally, together with such competitors offering banking products and services by mail, telephone, computer and the Internet ; and the failure of assumptions underlying the establishment of reserves for possible loan losses . All written or oral forward - looking statements attributable to us are expressly qualified in their entirety by this cautionary notice, including, without limitation, those risks and uncertainties described in our annual report on Form 10 - K for the year ended December 31 , 2018 under “Special Cautionary Notice Regarding Forward - Looking Statements” and “Risk Factors”, and otherwise in our SEC reports and filings . Such reports are available upon request from the Company, or from the Securities and Exchange Commission, including through the SEC’s Internet website at www . sec . gov .
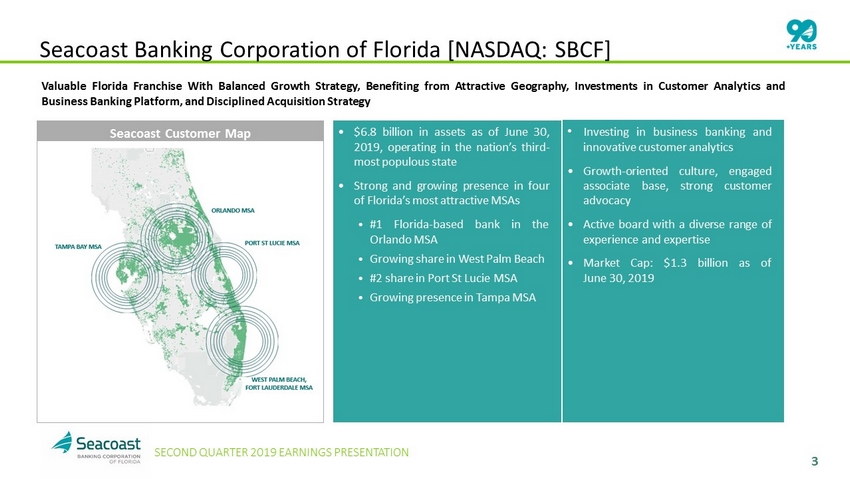
3 SECOND QUARTER 2019 EARNINGS PRESENTATION Seacoast Banking Corporation of Florida [NASDAQ: SBCF] Valuable Florida Franchise With Balanced Growth Strategy, Benefiting from Attractive Geography, Investments in Customer Analytics and Business Banking Platform, and Disciplined Acquisition Strategy • $ 6 . 8 billion in assets as of June 30 , 2019 , operating in the nation’s third - most populous state • Strong and growing presence in four of Florida’s most attractive MSAs ⦁ # 1 Florida - based bank in the Orlando MSA ⦁ Growing share in West Palm Beach ⦁ # 2 share in Port St Lucie MSA ⦁ Growing presence in Tampa MSA Seacoast Customer Map • Investing in business banking and innovative customer analytics • Growth - oriented culture, engaged associate base, strong customer advocacy • Active board with a diverse range of experience and expertise • Market Cap : $ 1 . 3 billion as of June 30 , 2019

4 SECOND QUARTER 2019 EARNINGS PRESENTATION Second Quarter Highlights • Earnings per diluted share totaled $ 0 . 45 on a GAAP basis and $ 0 . 50 on an adjusted basis 1 • On a GAAP basis, ended the quarter at 1 . 50 % Return on Tangible Assets (ROTA) and 14 . 3 % Return on Average Tangible Common Equity (ROTCE) . On an adjusted basis, second quarter results were 1 . 59 % adjusted ROTA 1 and 15 . 2 % adjusted ROTCE 1 • The efficiency ratio improved to 53 . 5 % compared to 56 . 6 % in the prior quarter and 58 . 4 % in the second quarter of 2018 . The adjusted efficiency ratio 1 improved to 51 . 4 % compared to 55 . 8 % in the prior quarter and 57 . 3 % in the second quarter of 2018 • New loan originations of $ 407 million compared to $ 310 million in the prior quarter, resulting in net loan growth of 5 % on an annualized basis, overcoming a $ 59 million increase in early loan payoffs, when compared to the prior quarter • Noninterest income to total revenue (excluding securities losses) improved to 19 % , from 17 % in the prior quarter, primarily the result of strong performance in mortgage banking and wealth management • On a GAAP basis, noninterest expense declined $ 2 . 1 million, sequentially, and adjusted noninterest expense 1 declined $ 3 . 1 million, the result of our continued focus on streamlining operations • Year to date adjusted revenues 1 increased 18 % compared to the prior year while adjusted noninterest expense 1 increased 10 % , generating 8 % operating leverage 1 Non - GAAP measure, see “Explanation of Certain Unaudited Non - GAAP Financial Measures" for more information and a reconciliation to GAAP

5 SECOND QUARTER 2019 EARNINGS PRESENTATION Net Interest Income and Margin • Net interest income 1 totaled $ 60 . 2 million, down $ 0 . 6 million or 1 % from the prior quarter and up $ 9 . 9 million or 20 % from the second quarter of 2018 . • Net interest margin 1 decreased 8 basis points to 3 . 94 % quarter - over - quarter . Removing accretion on acquired loans, the net interest margin decreased 9 basis points . 1 Calculated on a fully taxable equivalent basis using amortized cost ($ In Thousands)
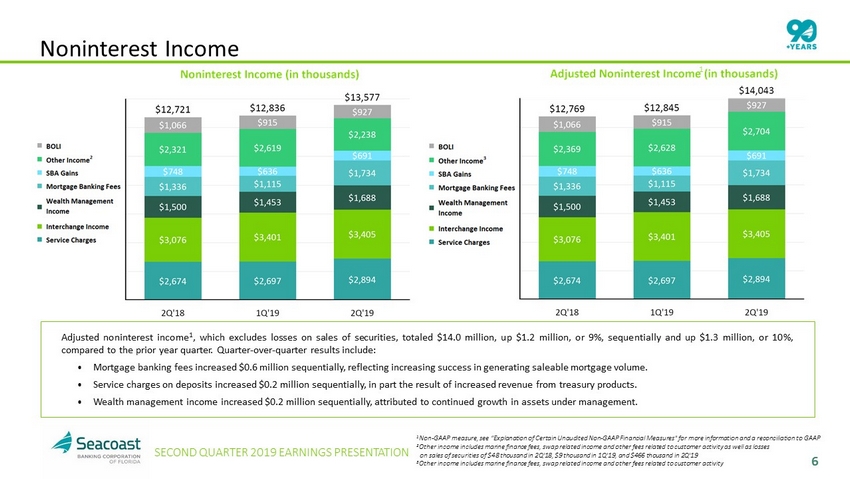
6 SECOND QUARTER 2019 EARNINGS PRESENTATION Noninterest Income Adjusted noninterest income 1 , which excludes losses on sales of securities, totaled $ 14 . 0 million, up $ 1 . 2 million, or 9 % , sequentially and up $ 1 . 3 million, or 10 % , compared to the prior year quarter . Quarter - over - quarter results include : ⦁ Mortgage banking fees increased $ 0 . 6 million sequentially, reflecting increasing success in generating saleable mortgage volume . ⦁ Service charges on deposits increased $ 0 . 2 million sequentially, in part the result of increased revenue from treasury products . ⦁ Wealth management income increased $ 0 . 2 million sequentially, attributed to continued growth in assets under management . 1 Non - GAAP measure, see “Explanation of Certain Unaudited Non - GAAP Financial Measures" for more information and a reconciliation t o GAAP 2 Other income includes marine finance fees, swap related income and other fees related to customer activity as well as losses on sales of securities of $48 thousand in 2Q'18, $9 thousand in 1Q'19, and $466 thousand in 2Q'19 3 Other income includes marine finance fees, swap related income and other fees related to customer activity 1
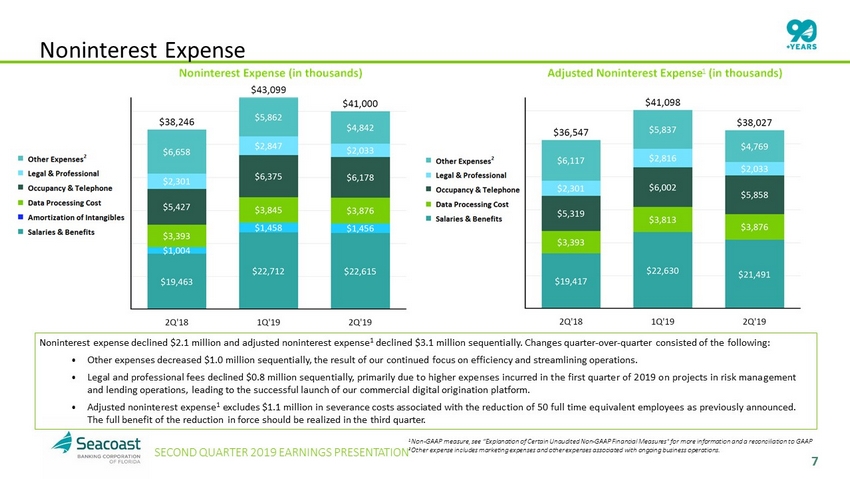
7 SECOND QUARTER 2019 EARNINGS PRESENTATION Noninterest Expense Noninterest expense declined $ 2 . 1 million and adjusted noninterest expense 1 declined $ 3 . 1 million sequentially . Changes quarter - over - quarter consisted of the following : ⦁ Other expenses decreased $ 1 . 0 million sequentially, the result of our continued focus on efficiency and streamlining operations . ⦁ Legal and professional fees declined $ 0 . 8 million sequentially, primarily due to higher expenses incurred in the first quarter of 2019 on projects in risk management and lending operations, leading to the successful launch of our commercial digital origination platform . ⦁ Adjusted noninterest expense 1 excludes $ 1 . 1 million in severance costs associated with the reduction of 50 full time equivalent employees as previously announced . The full benefit of the reduction in force should be realized in the third quarter . 1 Non - GAAP measure, see “Explanation of Certain Unaudited Non - GAAP Financial Measures" for more information and a reconciliation t o GAAP 2 Other expense includes marketing expenses and other expenses associated with ongoing business operations. 1
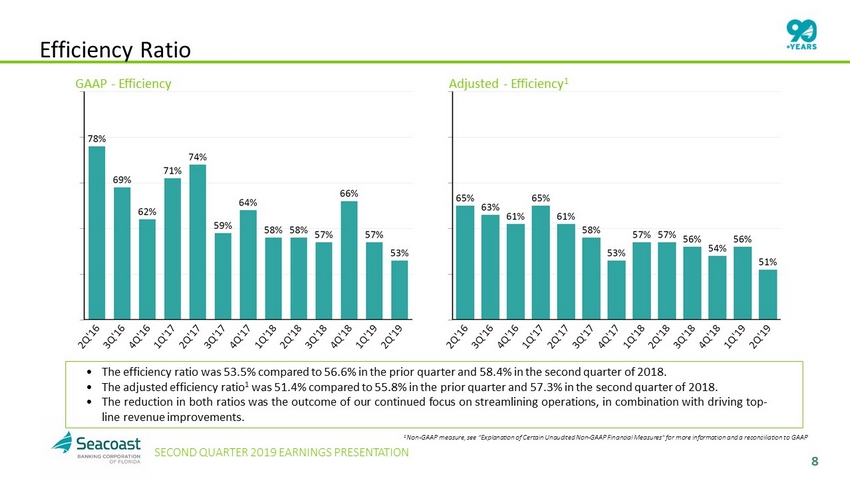
8 SECOND QUARTER 2019 EARNINGS PRESENTATION Efficiency Ratio • The efficiency ratio was 53 . 5 % compared to 56 . 6 % in the prior quarter and 58 . 4 % in the second quarter of 2018 . • The adjusted efficiency ratio 1 was 51 . 4 % compared to 55 . 8 % in the prior quarter and 57 . 3 % in the second quarter of 2018 . • The reduction in both ratios was the outcome of our continued focus on streamlining operations, in combination with driving top - line revenue improvements . 1 Non - GAAP measure, see “Explanation of Certain Unaudited Non - GAAP Financial Measures" for more information and a reconciliation t o GAAP GAAP - Efficiency Adjusted - Efficiency 1
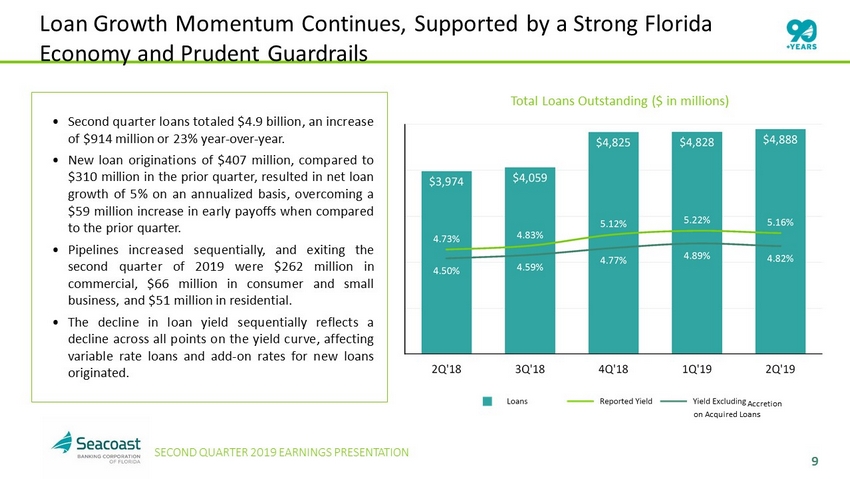
9 SECOND QUARTER 2019 EARNINGS PRESENTATION Loan Growth Momentum Continues, Supported by a Strong Florida Economy and Prudent Guardrails • Second quarter loans totaled $ 4 . 9 billion, an increase of $ 914 million or 23 % year - over - year . • New loan originations of $ 407 million, compared to $ 310 million in the prior quarter, resulted in net loan growth of 5 % on an annualized basis, overcoming a $ 59 million increase in early payoffs when compared to the prior quarter . • Pipelines increased sequentially, and exiting the second quarter of 2019 were $ 262 million in commercial, $ 66 million in consumer and small business, and $ 51 million in residential . • The decline in loan yield sequentially reflects a decline across all points on the yield curve, affecting variable rate loans and add - on rates for new loans originated . Total Loans Outstanding ($ in millions) Accretion on Acquired Loans
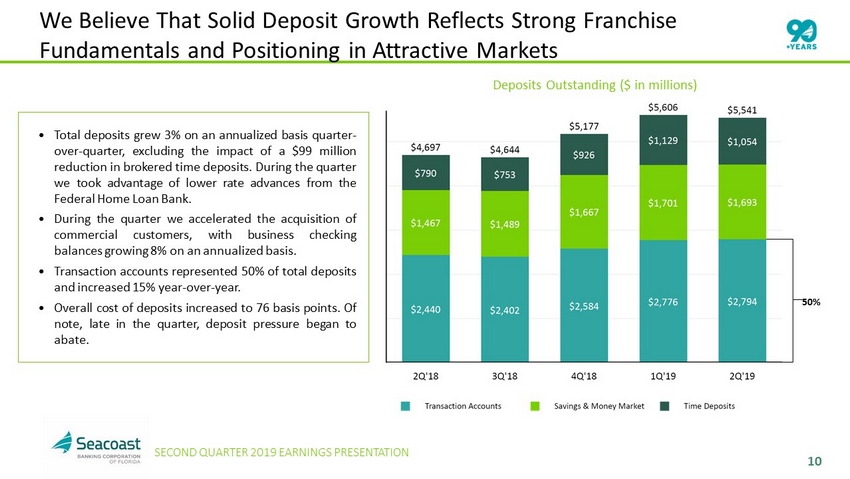
10 SECOND QUARTER 2019 EARNINGS PRESENTATION We Believe That Solid Deposit Growth Reflects Strong Franchise Fundamentals and Positioning in Attractive Markets • Total deposits grew 3 % on an annualized basis quarter - over - quarter, excluding the impact of a $ 99 million reduction in brokered time deposits . During the quarter we took advantage of lower rate advances from the Federal Home Loan Bank . • During the quarter we accelerated the acquisition of commercial customers, with business checking balances growing 8 % on an annualized basis . • Transaction accounts represented 50 % of total deposits and increased 15 % year - over - year . • Overall cost of deposits increased to 76 basis points . Of note, late in the quarter, deposit pressure began to abate . 50% Deposits Outstanding ($ in millions)
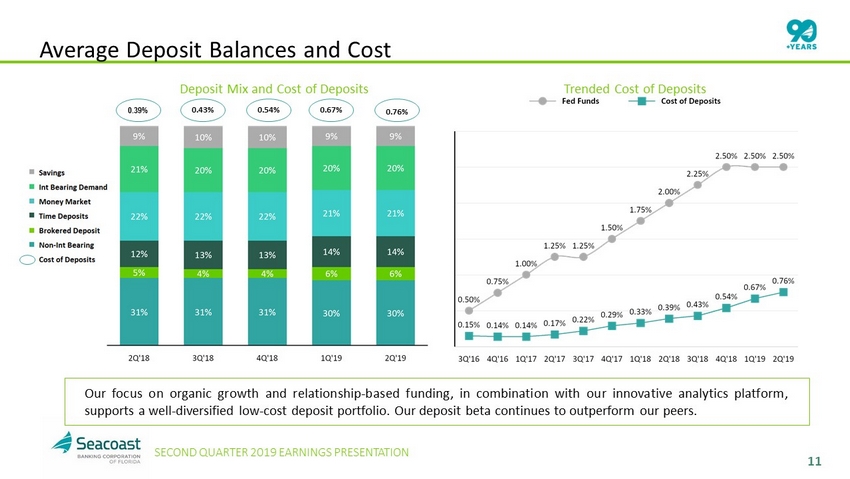
11 SECOND QUARTER 2019 EARNINGS PRESENTATION Average Deposit Balances and Cost Our focus on organic growth and relationship - based funding, in combination with our innovative analytics platform, supports a well - diversified low - cost deposit portfolio . Our deposit beta continues to outperform our peers . 0.39% 0.43% 0.54% 0.67% 0.76% Deposit Mix and Cost of Deposits Trended Cost of Deposits
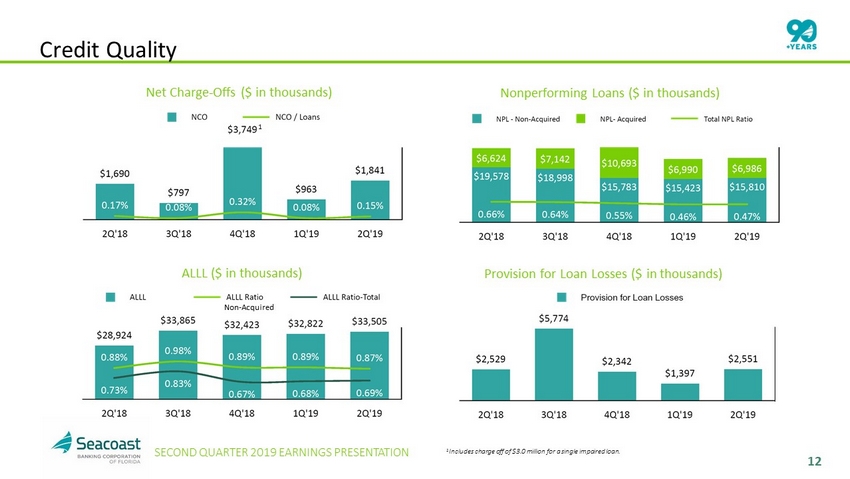
12 SECOND QUARTER 2019 EARNINGS PRESENTATION Credit Quality Non - Acquired 1 1 Includes charge off of $3.0 million for a single impaired loan. Net Charge - Offs ($ in thousands) Nonperforming Loans ($ in thousands) Provision for Loan Losses ($ in thousands) ALLL ($ in thousands)
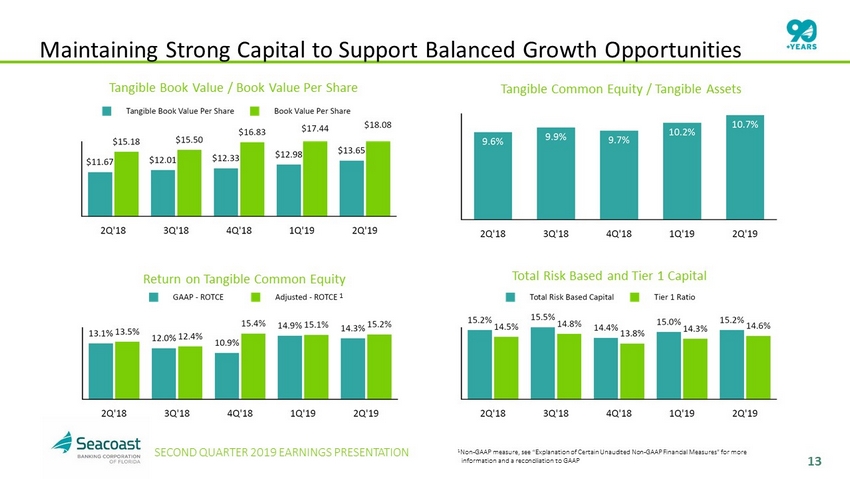
13 SECOND QUARTER 2019 EARNINGS PRESENTATION Maintaining Strong Capital to Support Balanced Growth Opportunities 1 Non - GAAP measure, see “Explanation of Certain Unaudited Non - GAAP Financial Measures" for more information and a reconciliation to GAAP Tangible Book Value / Book Value Per Share Tangible Common Equity / Tangible Assets Total Risk Based and Tier 1 Capital Return on Tangible Common Equity 1

14 SECOND QUARTER 2019 EARNINGS PRESENTATION We Remain Confident in our Ability to Achieve Our Vision 2020 Targets Vision 2020 Targets Return on Tangible Assets 1.30% + Return on Tangible Common Equity 16% + Efficiency Ratio Below 50%
15 SECOND QUARTER 2019 EARNINGS PRESENTATION Contact Details: Seacoast Banking Corporation of Florida Charles M. Shaffer Executive Vice President Chief Operating Officer and Chief Financial Officer (772) 221 - 7003 INVESTOR RELATIONS NASDAQ: SBCF

16 SECOND QUARTER 2019 EARNINGS PRESENTATION Explanation of Certain Unaudited Non - GAAP Financial Measures This presentation contains financial information determined by methods other than Generally Accepted Accounting Principles (“GAAP”) . The financial highlights provide reconciliations between GAAP net income and adjusted net income, GAAP income and adjusted pretax, preprovision income . Management uses these non - GAAP financial measures in its analysis of the Company’s performance and believes these presentations provide useful supplemental information, and a clearer understanding of the Company’s performance . The Company believes the non - GAAP measures enhance investors’ understanding of the Company’s business and performance and if not provided would be requested by the investor community . These measures are also useful in understanding performance trends and facilitate comparisons with the performance of other financial institutions . The limitations associated with operating measures are the risk that persons might disagree as to the appropriateness of items comprising these measures and that different companies might define or calculate these measures differently . The Company provides reconciliations between GAAP and these non - GAAP measures . These disclosures should not be considered an alternative to GAAP .
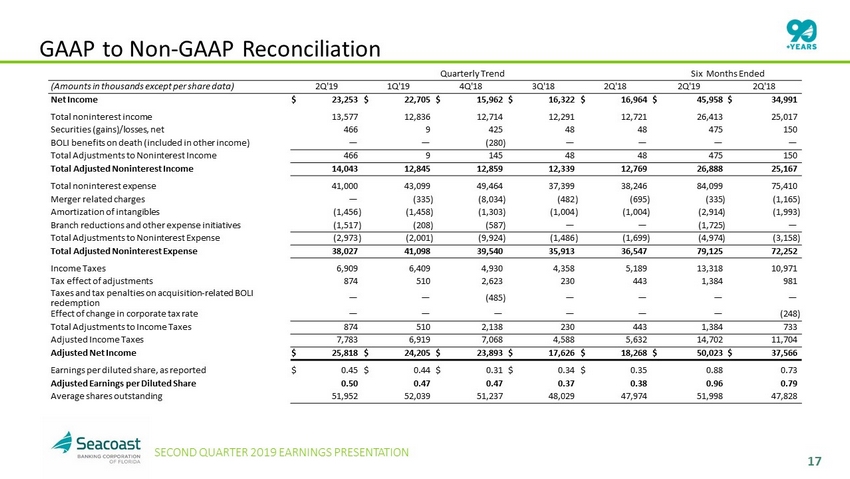
17 SECOND QUARTER 2019 EARNINGS PRESENTATION GAAP to Non - GAAP Reconciliation Quarterly Trend Six Months Ended (Amounts in thousands except per share data) 2Q'19 1Q'19 4Q'18 3Q'18 2Q'18 2Q'19 2Q'18 Net Income $ 23,253 $ 22,705 $ 15,962 $ 16,322 $ 16,964 $ 45,958 $ 34,991 Total noninterest income 13,577 12,836 12,714 12,291 12,721 26,413 25,017 Securities (gains)/losses, net 466 9 425 48 48 475 150 BOLI benefits on death (included in other income) — — (280 ) — — — — Total Adjustments to Noninterest Income 466 9 145 48 48 475 150 Total Adjusted Noninterest Income 14,043 12,845 12,859 12,339 12,769 26,888 25,167 Total noninterest expense 41,000 43,099 49,464 37,399 38,246 84,099 75,410 Merger related charges — (335 ) (8,034 ) (482 ) (695 ) (335 ) (1,165 ) Amortization of intangibles (1,456 ) (1,458 ) (1,303 ) (1,004 ) (1,004 ) (2,914 ) (1,993 ) Branch reductions and other expense initiatives (1,517 ) (208 ) (587 ) — — (1,725 ) — Total Adjustments to Noninterest Expense (2,973 ) (2,001 ) (9,924 ) (1,486 ) (1,699 ) (4,974 ) (3,158 ) Total Adjusted Noninterest Expense 38,027 41,098 39,540 35,913 36,547 79,125 72,252 Income Taxes 6,909 6,409 4,930 4,358 5,189 13,318 10,971 Tax effect of adjustments 874 510 2,623 230 443 1,384 981 Taxes and tax penalties on acquisition - related BOLI redemption — — (485 ) — — — — Effect of change in corporate tax rate — — — — — — (248 ) Total Adjustments to Income Taxes 874 510 2,138 230 443 1,384 733 Adjusted Income Taxes 7,783 6,919 7,068 4,588 5,632 14,702 11,704 Adjusted Net Income $ 25,818 $ 24,205 $ 23,893 $ 17,626 $ 18,268 $ 50,023 $ 37,566 Earnings per diluted share, as reported $ 0.45 $ 0.44 $ 0.31 $ 0.34 $ 0.35 0.88 0.73 Adjusted Earnings per Diluted Share 0.50 0.47 0.47 0.37 0.38 0.96 0.79 Average shares outstanding 51,952 52,039 51,237 48,029 47,974 51,998 47,828
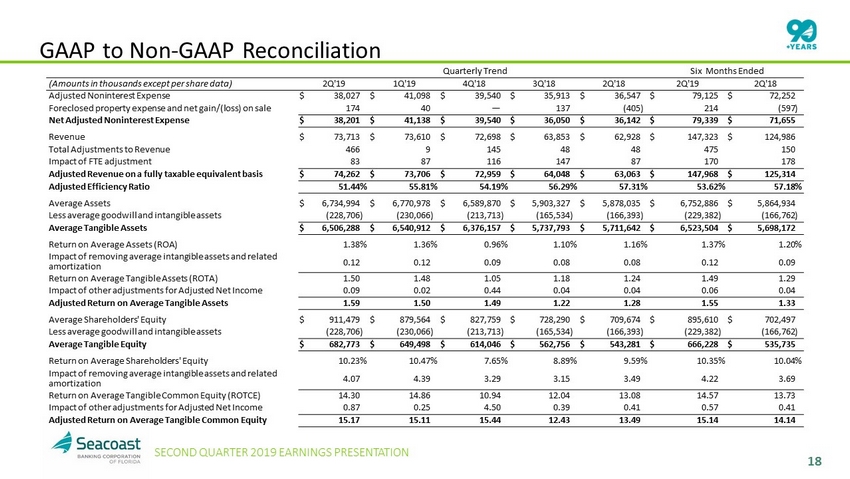
18 SECOND QUARTER 2019 EARNINGS PRESENTATION GAAP to Non - GAAP Reconciliation Quarterly Trend Six Months Ended (Amounts in thousands except per share data) 2Q'19 1Q'19 4Q'18 3Q'18 2Q'18 2Q'19 2Q'18 Adjusted Noninterest Expense $ 38,027 $ 41,098 $ 39,540 $ 35,913 $ 36,547 $ 79,125 $ 72,252 Foreclosed property expense and net gain/(loss) on sale 174 40 — 137 (405 ) 214 (597 ) Net Adjusted Noninterest Expense $ 38,201 $ 41,138 $ 39,540 $ 36,050 $ 36,142 $ 79,339 $ 71,655 Revenue $ 73,713 $ 73,610 $ 72,698 $ 63,853 $ 62,928 $ 147,323 $ 124,986 Total Adjustments to Revenue 466 9 145 48 48 475 150 Impact of FTE adjustment 83 87 116 147 87 170 178 Adjusted Revenue on a fully taxable equivalent basis $ 74,262 $ 73,706 $ 72,959 $ 64,048 $ 63,063 $ 147,968 $ 125,314 Adjusted Efficiency Ratio 51.44 % 55.81 % 54.19 % 56.29 % 57.31 % 53.62 % 57.18 % Average Assets $ 6,734,994 $ 6,770,978 $ 6,589,870 $ 5,903,327 $ 5,878,035 $ 6,752,886 $ 5,864,934 Less average goodwill and intangible assets (228,706 ) (230,066 ) (213,713 ) (165,534 ) (166,393 ) (229,382 ) (166,762 ) Average Tangible Assets $ 6,506,288 $ 6,540,912 $ 6,376,157 $ 5,737,793 $ 5,711,642 $ 6,523,504 $ 5,698,172 Return on Average Assets (ROA) 1.38 % 1.36 % 0.96 % 1.10 % 1.16 % 1.37 % 1.20 % Impact of removing average intangible assets and related amortization 0.12 0.12 0.09 0.08 0.08 0.12 0.09 Return on Average Tangible Assets (ROTA) 1.50 1.48 1.05 1.18 1.24 1.49 1.29 Impact of other adjustments for Adjusted Net Income 0.09 0.02 0.44 0.04 0.04 0.06 0.04 Adjusted Return on Average Tangible Assets 1.59 1.50 1.49 1.22 1.28 1.55 1.33 Average Shareholders' Equity $ 911,479 $ 879,564 $ 827,759 $ 728,290 $ 709,674 $ 895,610 $ 702,497 Less average goodwill and intangible assets (228,706 ) (230,066 ) (213,713 ) (165,534 ) (166,393 ) (229,382 ) (166,762 ) Average Tangible Equity $ 682,773 $ 649,498 $ 614,046 $ 562,756 $ 543,281 $ 666,228 $ 535,735 Return on Average Shareholders' Equity 10.23 % 10.47 % 7.65 % 8.89 % 9.59 % 10.35 % 10.04 % Impact of removing average intangible assets and related amortization 4.07 4.39 3.29 3.15 3.49 4.22 3.69 Return on Average Tangible Common Equity (ROTCE) 14.30 14.86 10.94 12.04 13.08 14.57 13.73 Impact of other adjustments for Adjusted Net Income 0.87 0.25 4.50 0.39 0.41 0.57 0.41 Adjusted Return on Average Tangible Common Equity 15.17 15.11 15.44 12.43 13.49 15.14 14.14
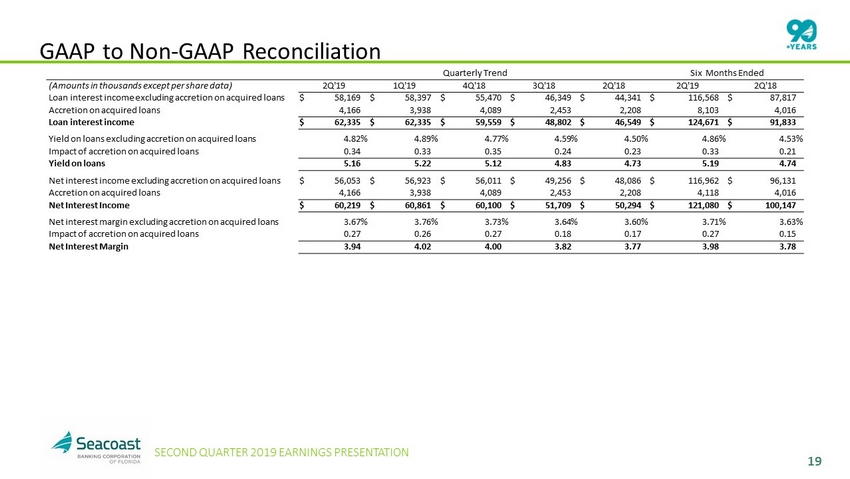
19 SECOND QUARTER 2019 EARNINGS PRESENTATION GAAP to Non - GAAP Reconciliation Quarterly Trend Six Months Ended (Amounts in thousands except per share data) 2Q'19 1Q'19 4Q'18 3Q'18 2Q'18 2Q'19 2Q'18 Loan interest income excluding accretion on acquired loans $ 58,169 $ 58,397 $ 55,470 $ 46,349 $ 44,341 $ 116,568 $ 87,817 Accretion on acquired loans 4,166 3,938 4,089 2,453 2,208 8,103 4,016 Loan interest income $ 62,335 $ 62,335 $ 59,559 $ 48,802 $ 46,549 $ 124,671 $ 91,833 Yield on loans excluding accretion on acquired loans 4.82 % 4.89 % 4.77 % 4.59 % 4.50 % 4.86 % 4.53 % Impact of accretion on acquired loans 0.34 0.33 0.35 0.24 0.23 0.33 0.21 Yield on loans 5.16 5.22 5.12 4.83 4.73 5.19 4.74 Net interest income excluding accretion on acquired loans $ 56,053 $ 56,923 $ 56,011 $ 49,256 $ 48,086 $ 116,962 $ 96,131 Accretion on acquired loans 4,166 3,938 4,089 2,453 2,208 4,118 4,016 Net Interest Income $ 60,219 $ 60,861 $ 60,100 $ 51,709 $ 50,294 $ 121,080 $ 100,147 Net interest margin excluding accretion on acquired loans 3.67 % 3.76 % 3.73 % 3.64 % 3.60 % 3.71 % 3.63 % Impact of accretion on acquired loans 0.27 0.26 0.27 0.18 0.17 0.27 0.15 Net Interest Margin 3.94 4.02 4.00 3.82 3.77 3.98 3.78