Exhibit 99.3
Investor Presentation Q3 - 2016 Contact : (email) Steve.Fowle@SeacoastBank.com (phone) 772.463.8977 (web) www.Sea coa stBanking.com
This presentation contains “forward - looking statements” within the meaning of Section 27 A of the Securities Act of 1933 and Section 21 E of the Securities Exchange Act of 1934 , including, without limitation, statements about future financial and operating results, ability to realized deferred tax assets, cost savings, enhanced revenues, economic and seasonal conditions in our markets, and improvements to reported earnings that may be realized from cost controls and for integration of banks that we have acquired, as well as statements with respect to Seacoast’s objectives, expectations and intentions and other statements that are not historical facts . Actual results may differ from those set forth in the forward - looking statements . Forward - looking statements include statements with respect to our beliefs, plans, objectives, goals, expectations, anticipations, estimates and intentions, and involve known and unknown risks, uncertainties and other factors, which may be beyond our control, and which may cause the actual results, performance or achievements of Seacoast to be materially different from future results, performance or achievements expressed or implied by such forward - looking statements . You should not expect us to update any forward - looking statements . You can identify these forward - looking statements through our use of words such as “may,” “will,” “anticipate,” “assume,” “should,” “support”, “indicate,” “would,” “believe,” “contemplate,” “expect,” “estimate,” “continue,” “further”, “point to,” “project,” “could,” “intend” or other similar words and expressions of the future . These forward - looking statements may not be realized due to a variety of factors, including, without limitation : the effects of future economic and market conditions, including seasonality ; governmental monetary and fiscal policies, as well as legislative, tax and regulatory changes ; changes in accounting policies, rules and practices ; the risks of changes in interest rates on the level and composition of deposits, loan demand, liquidity and the values of loan collateral, securities, and interest sensitive assets and liabilities ; interest rate risks, sensitivities and the shape of the yield curve ; the effects of competition from other commercial banks, thrifts, mortgage banking firms, consumer finance companies, credit unions, securities brokerage firms, insurance companies, money market and other mutual funds and other financial institutions operating in our market areas and elsewhere, including institutions operating regionally, nationally and internationally, together with such competitors offering banking products and services by mail, telephone, computer and the Internet ; and the failure of assumptions underlying the establishment of reserves for possible loan losses . The risks of mergers and acquisitions, include, without limitation : unexpected transaction costs, including the costs of integrating operations ; the risks that the businesses will not be integrated successfully or that such integration may be more difficult, time - consuming or costly than expected ; the potential failure to fully or timely realize expected revenues and revenue synergies, including as the result of revenues following the merger being lower than expected ; the risk of deposit and customer attrition ; any changes in deposit mix ; unexpected operating and other costs, which may differ or change from expectations ; the risks of customer and employee loss and business disruption, including, without limitation, as the result of difficulties in maintaining relationships with employees ; increased competitive pressures and solicitations of customers by competitors ; as well as the difficulties and risks inherent with entering new markets . All written or oral forward - looking statements attributable to us are expressly qualified in their entirety by this cautionary notice, including, without limitation, those risks and uncertainties described in our annual report on Form 10 - K for the year ended December 31 , 2015 under “Special Cautionary Notice Regarding Forward - Looking Statements” and “Risk Factors”, and otherwise in our SEC reports and filings . Such reports are available upon request from the Company, or from the Securities and Exchange Commission, including through the SEC’s Internet website at http : //www . sec . gov . 2 Investor Presentation Cautionary Notice Regarding Forward - Looking Statements
Agenda • About Seacoast Bank • Seacoast’s Investment Thesis – Successfully Executing a Differentiated Strategy for Balanced Growth • 2016 Outlook • Company Performance • Appendix Investor Presentation 3
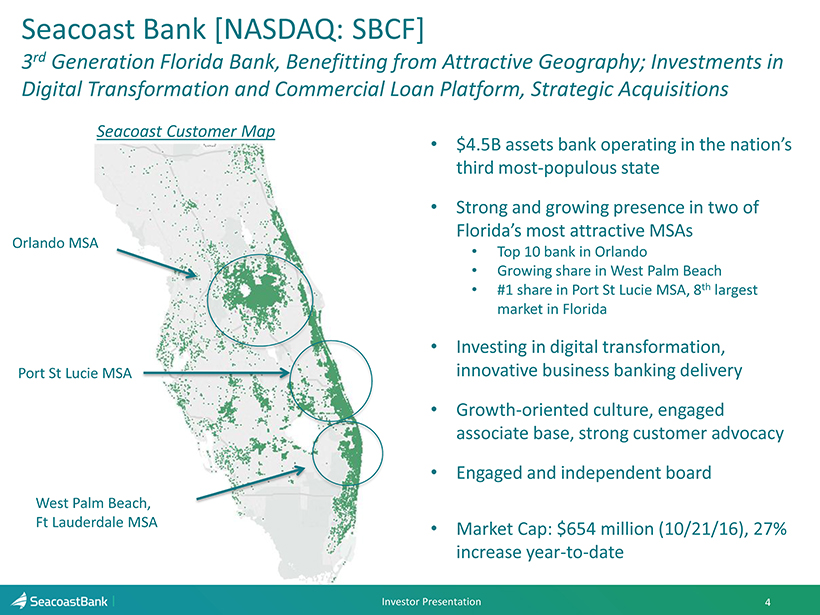
Agenda • $4.5B assets bank operating in the nation’s third most - populous state • Strong and growing presence in two of Florida’s most attractive MSAs • Top 10 bank in Orlando • Growing share in West Palm Beach • #1 share in Port St Lucie MSA, 8 th largest market in Florida • Investing in digital transformation, innovative business banking delivery • Growth - oriented culture, engaged associate base, strong customer advocacy • Engaged and independent board • Market Cap : $654 million (10/21/16), 2 7 % increase year - to - date Seacoast Bank [NASDAQ: SBCF ] 3 rd Generation Florida Bank , Benefitting from Attractive Geography; Investments in Digital Transformation and Commercial Loan Platform, Strategic Acquisitions 4 Orlando MSA West Palm Beach, Ft Lauderdale MSA Investor Presentation Seacoast Customer Map Port St Lucie MSA
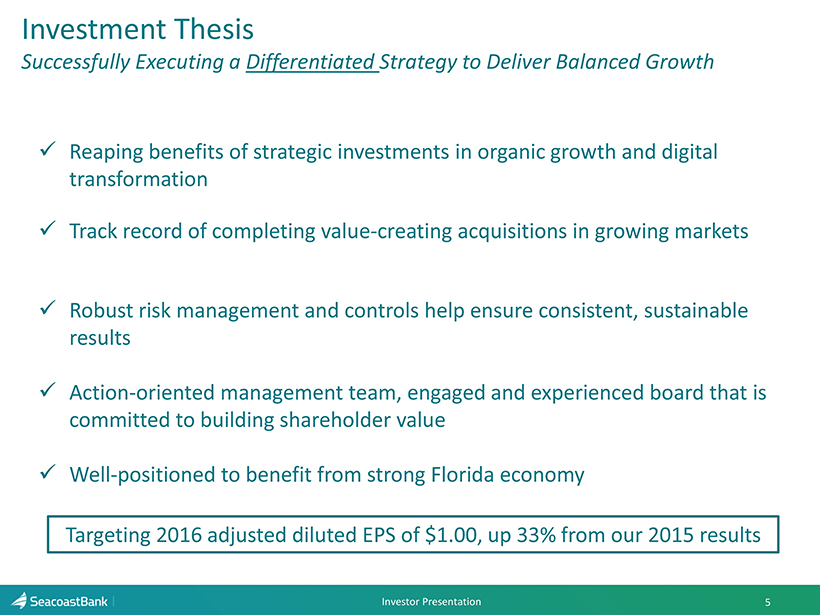
Agenda Investment Thesis Successfully Executing a Differentiated Strategy to Deliver Balanced Growth 5 Investor Presentation x Reaping benefits of strategic investments in organic growth and digital transformation x Track record of completing val ue - creating acquisitions in growing markets x Robust risk management and controls help ensure consistent , sustainable results x Action - oriented management team, engaged and experienced board that is committed to building shareholder value x Well - positioned to benefit from strong Florida economy Targeting 2016 adjusted diluted EPS of $1.00, up 33% from our 2015 results
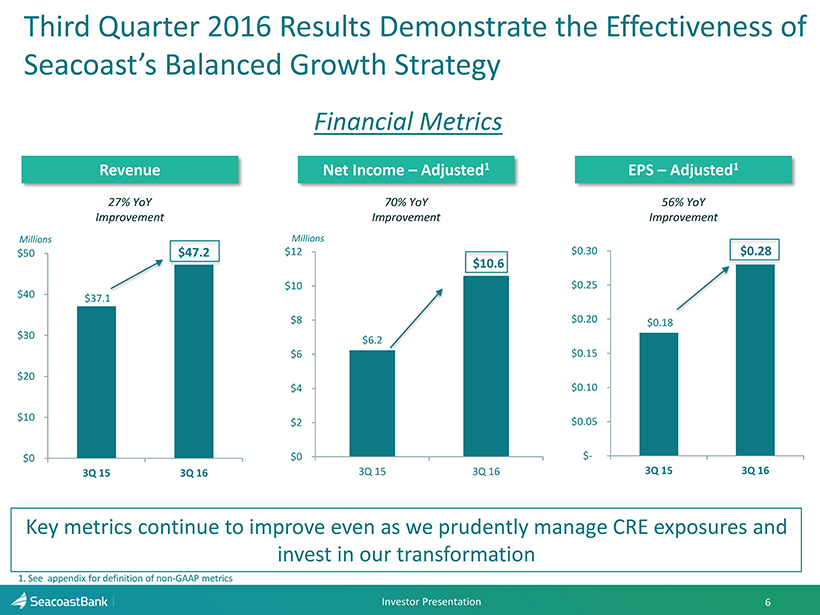
$6.2 $10.6 $0 $2 $4 $6 $8 $10 $12 3Q 15 3Q 16 Third Quarter 2016 Results Demonstrate the Effectiveness of Seacoast’s Balanced Growth Strategy 6 Investor Presentation 1. See appendix for definition of non - GAAP metrics Key metrics continue to improve even as we prudently manage CRE exposures and invest in our transformation Revenue Millions $37.1 $47.2 $0 $10 $20 $30 $40 $50 3Q 15 3Q 16 Net Income – Adjusted 1 Millions EPS – Adjusted 1 $0.18 $0.28 $- $0.05 $0.10 $0.15 $0.20 $0.25 $0.30 3Q 15 3Q 16 Financial Metrics 27% YoY Improvement 70% YoY Improvement 56% YoY Improvement
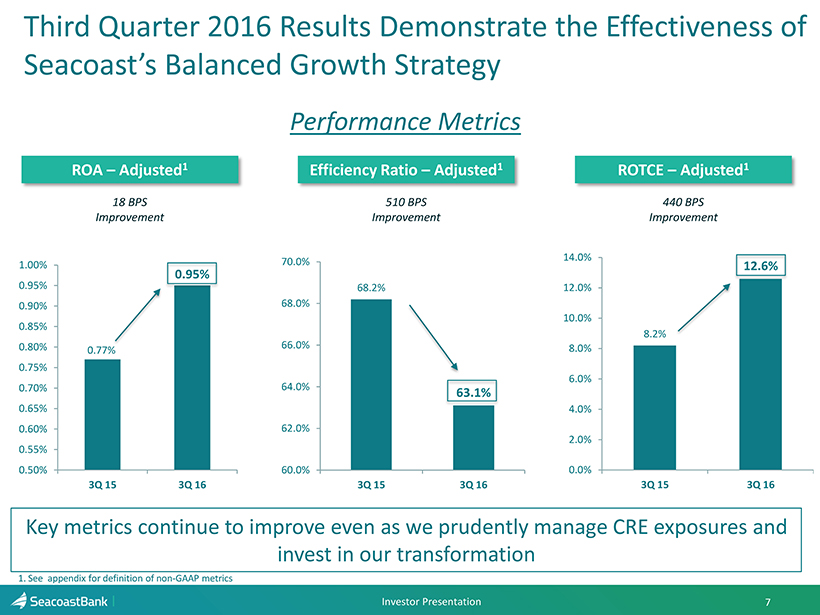
8.2% 12.6% 0.0% 2.0% 4.0% 6.0% 8.0% 10.0% 12.0% 14.0% 3Q 15 3Q 16 68.2% 63.1% 60.0% 62.0% 64.0% 66.0% 68.0% 70.0% 3Q 15 3Q 16 0.77% 0.95% 0.50% 0.55% 0.60% 0.65% 0.70% 0.75% 0.80% 0.85% 0.90% 0.95% 1.00% 3Q 15 3Q 16 Third Quarter 2016 Results Demonstrate the Effectiveness of Seacoast’s Balanced Growth Strategy 7 Investor Presentation 1. See appendix for definition of non - GAAP metrics Key metrics continue to improve even as we prudently manage CRE exposures and invest in our transformation ROA – Adjusted 1 Efficiency Ratio – Adjusted 1 ROTCE – Adjusted 1 Performance Metrics 18 BPS Improvement 510 BPS Improvement 440 BPS Improvement
Agenda • About Seacoast Bank • Seacoast’s Investment Thesis – Successfully Executing a Differentiated Strategy for Balanced Growth • 2016 Outlook • Company Performance • Appendix Investor Presentation 8
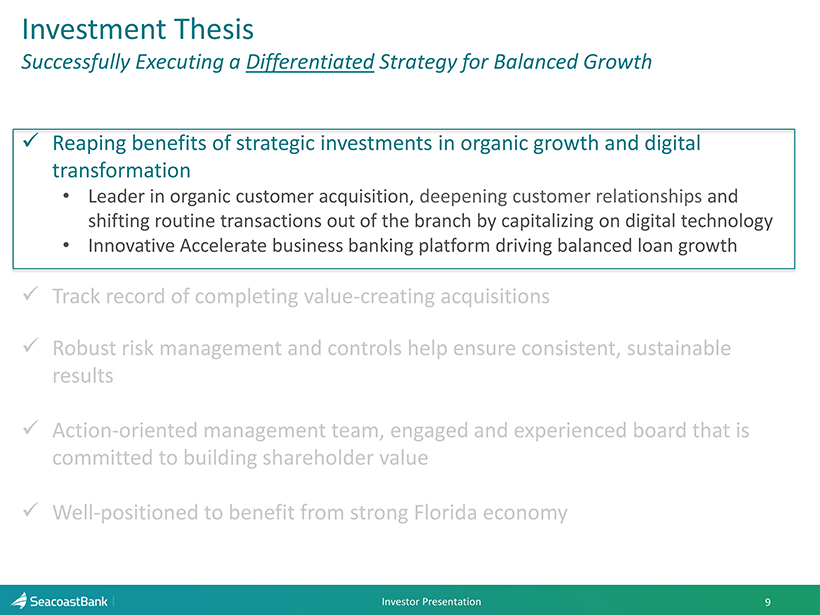
Agenda Investment Thesis Successfully Executing a Differentiated Strategy for Balanced Growth 9 Investor Presentation x Reaping benefits of strategic investments in organic growth and digital transformation • Leader in organic customer acquisition, deepening customer relationships and shifting routine transactions out of the branch by capitalizing on digital technology • Innovative Accelerate business banking platform driving balanced loan growth x Track record of completing value - creating acquisitions x Robust risk management and controls help ensure consistent, sustainable results x Action - oriented management team, engaged and experienced board that is committed to building shareholder value x Well - positioned to benefit from strong Florida economy
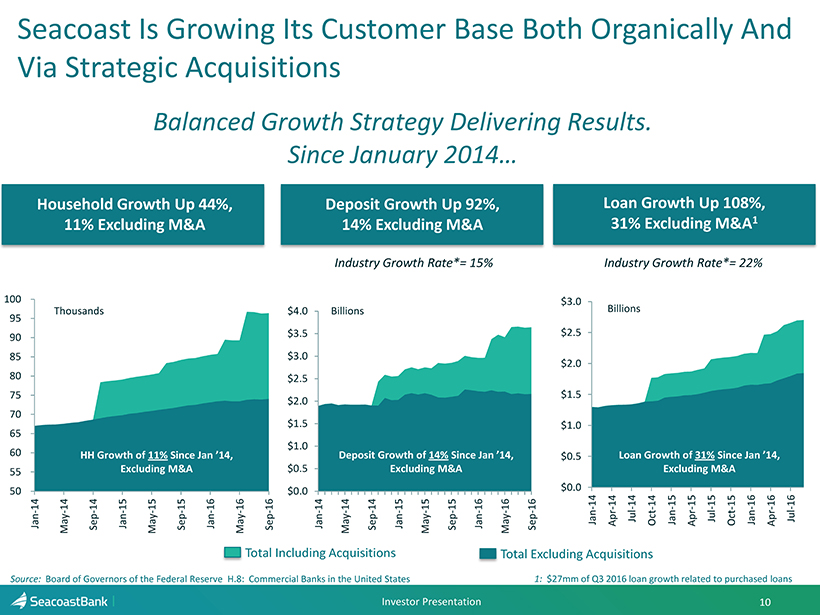
$0.0 $0.5 $1.0 $1.5 $2.0 $2.5 $3.0 Jan-14 Apr-14 Jul-14 Oct-14 Jan-15 Apr-15 Jul-15 Oct-15 Jan-16 Apr-16 Jul-16 $0.0 $0.5 $1.0 $1.5 $2.0 $2.5 $3.0 $3.5 $4.0 Jan-14 May-14 Sep-14 Jan-15 May-15 Sep-15 Jan-16 May-16 Sep-16 50 55 60 65 70 75 80 85 90 95 100 Jan-14 May-14 Sep-14 Jan-15 May-15 Sep-15 Jan-16 May-16 Sep-16 Seacoast Is Growing Its Customer Base Both Organically And Via Strategic Acquisitions 10 Investor Presentation Household Growth Up 44%, 11% Excluding M&A Billions HH Growth of 11% Since Jan ’14, Excluding M&A Deposit Growth Up 92%, 14% Excluding M&A Loan Growth Up 108%, 31% Excluding M&A 1 Thousands Balanced Growth Strategy Delivering Results. Since January 2014… Billions Loan Growth of 31% Since Jan ’14, Excluding M&A Deposit Growth of 1 4 % Since Jan ’14, Excluding M&A Industry Growth Rate*= 15% Industry Growth Rate*= 22% Source: Board of Governors of the Federal Reserve H.8: Commercial Banks in the United States Total Including Acquisitions Total Excluding Acquisitions 1: $27mm of Q3 2016 loan growth related to purchased loans
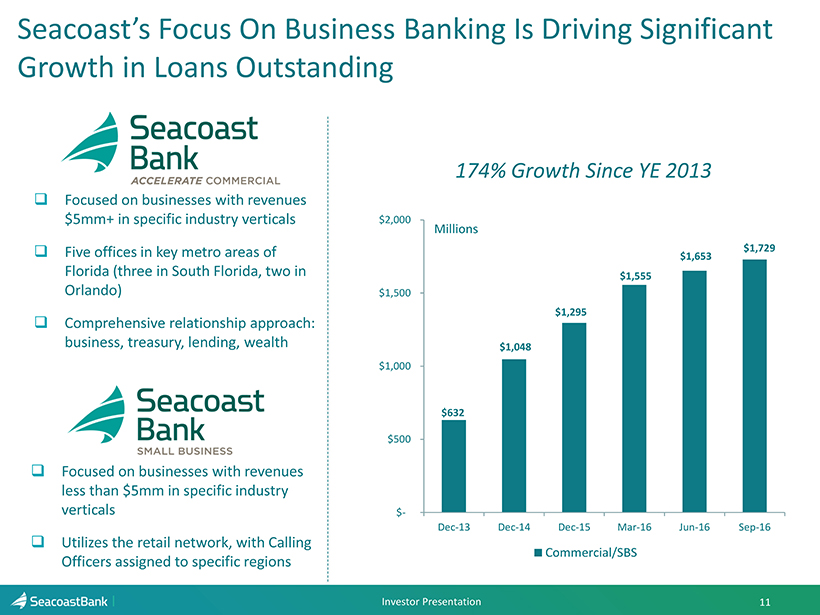
□ Focused on businesses with revenues $5mm+ in specific industry verticals □ Five offices in key metro areas of Florida (three in South Florida, two in Orlando) □ Comprehensive relationship approach: business, treasury, lending, wealth Seacoast’s Focus On Business B anking Is Driving Significant Growth in Loans Outstanding 11 Investor Presentation □ Focused on businesses with revenues less than $5mm in specific industry verticals □ Utilizes the retail network, with Calling Officers assigned to specific regions M illions 174% G rowth S ince YE 2013 $632 $1,048 $1,295 $1,555 $1,653 $1,729 $- $500 $1,000 $1,500 $2,000 Dec-13 Dec-14 Dec-15 Mar-16 Jun-16 Sep-16 Commercial/SBS
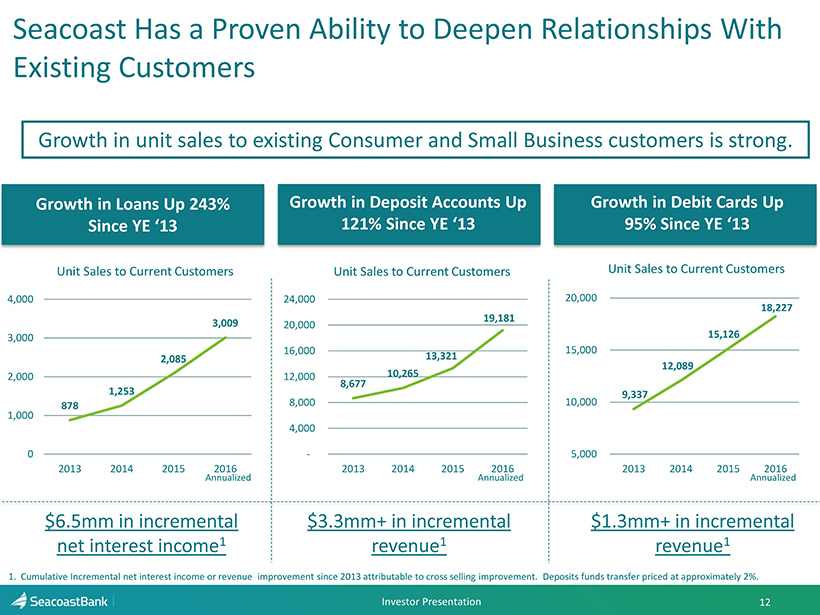
Seacoast Has a Proven Ability to Deepen Relationships With Existing Customers 12 Investor Presentation Growth in Loans Up 243% Since YE ‘13 Growth in Deposit Accounts Up 121% Since YE ‘13 Growth in Debit Cards Up 95% Since YE ‘13 $6.5mm in incremental net interest income 1 $3.3mm+ in incremental revenue 1 $1.3mm+ in incremental revenue 1 Growth in unit sales to existing Consumer and Small Business customers is strong. 1. Cumulative Incremental net interest income or revenue improvement since 2013 attributable to cross selling improvement. D eposits funds transfer priced at approximately 2%. Unit Sales to Current Customers Annualized Annualized Annualized Unit Sales to Current Customers Unit Sales to Current Customers 878 1,253 2,085 3,009 0 1,000 2,000 3,000 4,000 2013 2014 2015 2016 8,677 10,265 13,321 19,181 - 4,000 8,000 12,000 16,000 20,000 24,000 2013 2014 2015 2016 9,337 12,089 15,126 18,227 5,000 10,000 15,000 20,000 2013 2014 2015 2016
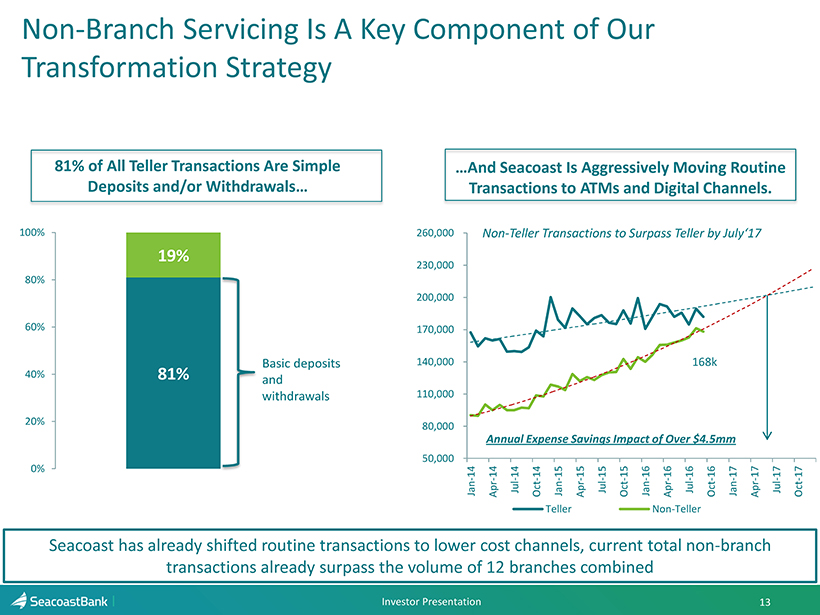
50,000 80,000 110,000 140,000 170,000 200,000 230,000 260,000 Jan-14 Apr-14 Jul-14 Oct-14 Jan-15 Apr-15 Jul-15 Oct-15 Jan-16 Apr-16 Jul-16 Oct-16 Jan-17 Apr-17 Jul-17 Oct-17 Teller Non-Teller Non - Branch Servicing Is A Key Component of Our Transformation Strategy 13 Investor Presentation 81% 19% 0% 20% 40% 60% 80% 100% Basic deposits and withdrawals 81% of All Teller Transactions Are Simple Deposits and/or Withdrawals… …And Seacoast Is Aggressively Moving Routine Transactions to ATMs and Digital Channels. Seacoast has already shifted routine transactions to lower cost channels, current total non - branch transactions already surpass the volume of 12 branches combined Non - Teller Transactions to Surpass Teller by July‘17 168k Annual Expense Savings Impact of Over $4.5mm
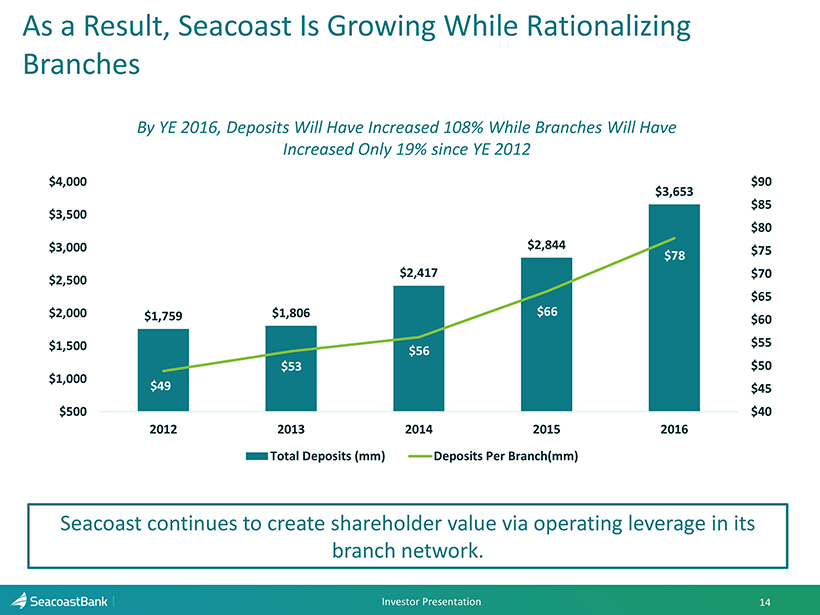
$1,759 $1,806 $2,417 $2,844 $3,653 $49 $53 $56 $66 $78 $40 $45 $50 $55 $60 $65 $70 $75 $80 $85 $90 $500 $1,000 $1,500 $2,000 $2,500 $3,000 $3,500 $4,000 2012 2013 2014 2015 2016 Total Deposits (mm) Deposits Per Branch(mm) As a Result, Seacoast Is Growing While Rationalizing Branches Seacoast continues to create shareholder value via operating leverage in its branch network. By YE 2016, Deposits Will Have Increased 108% While Branches Will Have Increased Only 19% since YE 2012 Investor Presentation 14
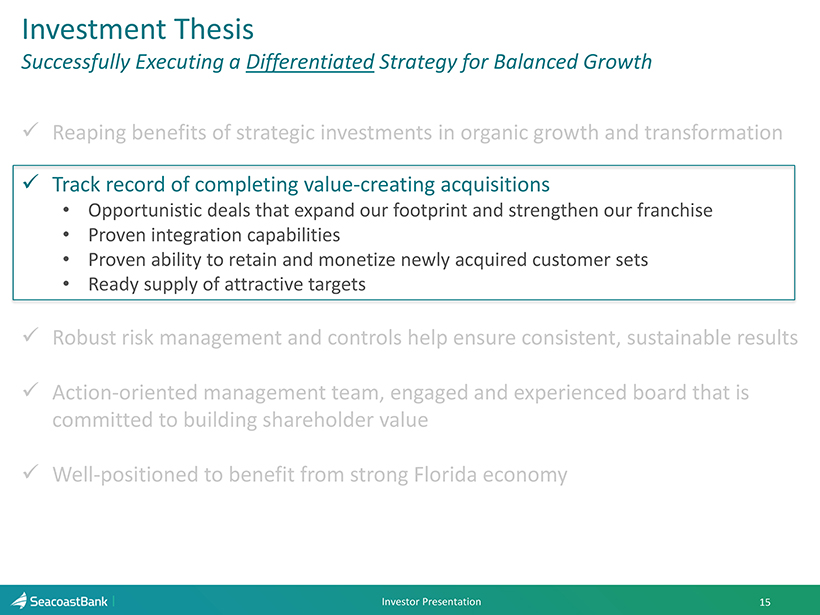
Agenda Investment Thesis Successfully Executing a Differentiated Strategy for Balanced Growth 15 Investor Presentation x Reaping benefits of strategic investments in organic growth and transformation x Track record of completing value - creating acquisitions • Opportunistic deals that expand our footprint and strengthen our franchise • Proven integration capabilities • Proven ability to retain and monetize newly acquired customer sets • Ready supply of attractive targets x Robust risk management and controls help ensure consistent, sustainable results x Action - oriented management team, engaged and experienced board that is committed to building shareholder value x Well - positioned to benefit from strong Florida economy
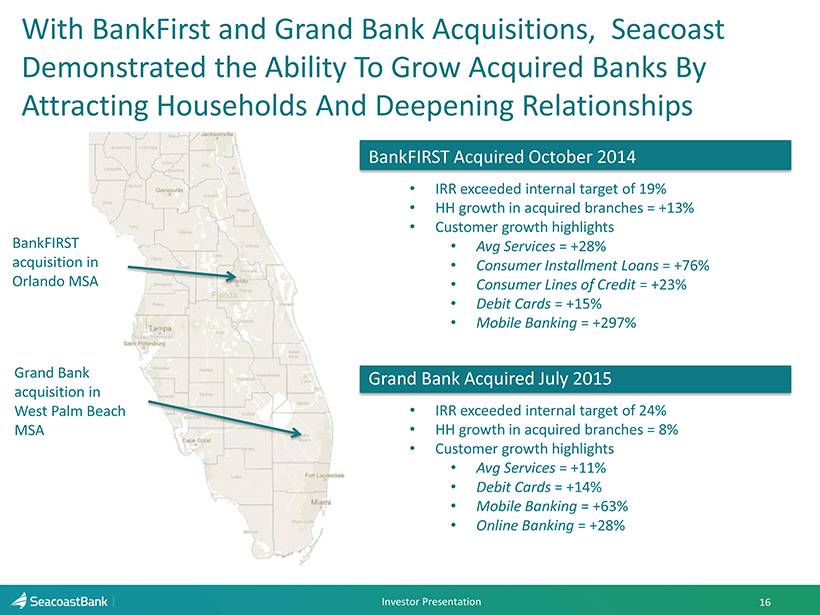
BankFIRST Acquired October 2014 • IRR exceeded internal target of 19% • HH growth in acquired branches = +13% • Customer growth highlights • Avg Services = +28% • Consumer Installment Loans = +76% • Consumer Lines of Credit = +23% • Debit Cards = +15% • Mobile Banking = +297% Grand Bank Acquired July 2015 • IRR exceeded internal target of 24% • HH growth in acquired branches = 8 % • Customer growth highlights • Avg Services = +11% • Debit Cards = +14% • Mobile Banking = +63% • Online Banking = +28% Agenda With BankFirst and Grand Bank Acquisitions, Seacoast Demonstrated the Ability To Grow Acquired Banks By Attracting Households And Deepening Relationships 16 BankFIRST acquisition in Orlando MSA Grand Bank acquisition in West Palm Beach MSA Investor Presentation
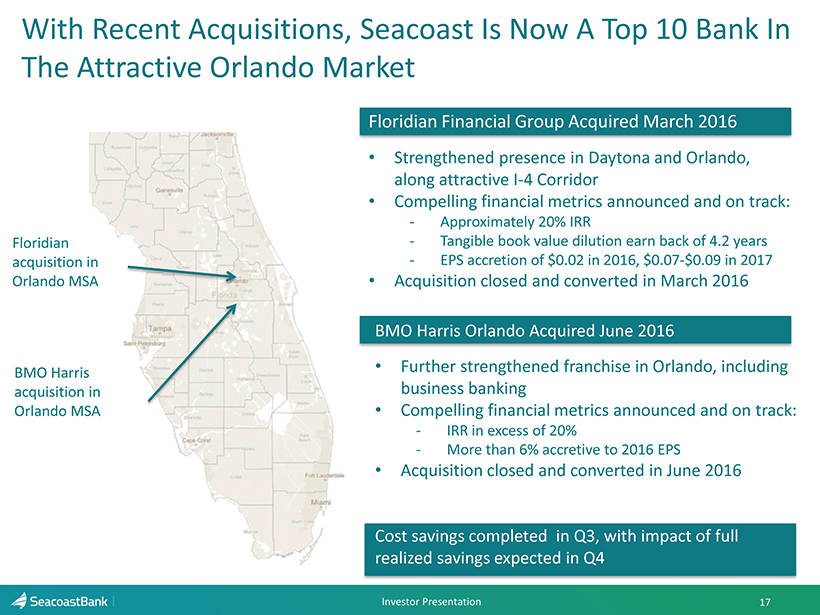
BMO Harris Orlando Acquired June 2016 • Further strengthened franchise in Orlando, including business banking • Compelling f inancial m etrics announced and on t rack: - IRR in excess of 20% - More than 6% accretive to 2016 EPS • Acquisition closed and converted in June 2016 Cost savings completed in Q3, with impact of full realized savings expected in Q4 Floridian Financial Group Acquired March 2016 • Strengthened presence in Daytona and Orlando, along attractive I - 4 Corridor • Compelling f inancial m etrics a nnounced and on t rack: - Approximately 20% IRR - Tangible book value dilution earn back of 4.2 years - EPS accretion of $ 0.02 in 2016, $0.07 - $0.09 in 2017 • Acquisition closed and converted in March 2016 Agenda With Recent Acquisitions, Seacoast Is Now A Top 10 Bank In The Attractive Orlando Market 17 Floridian acquisition in Orlando MSA BMO Harris acquisition in Orlando MSA Investor Presentation
Agenda Investment Thesis Successfully Executing a Differentiated Strategy for Balanced Growth 18 Investor Presentation x Reaping benefits of strategic investments in organic growth and transformation x Track record of completing value - creating acquisitions x Robust risk management and controls help ensure consistent, sustainable results • Intentional focus on C&I rather than solely on CRE – granular, balanced portfolio x Action - oriented management team, engaged and experienced board that is committed to building shareholder value x Well - positioned to benefit from strong Florida economy
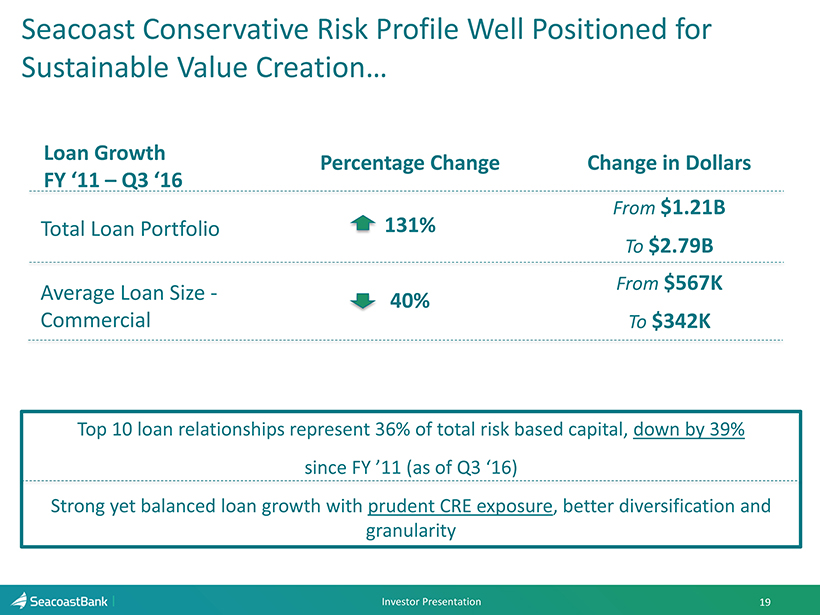
Seacoast Conservative Risk Profile Well Positioned for Sustainable Value Creation… 19 Investor Presentation 40% 131% From $1.21B To $2.79B Average Loan Size - Commercial Total Loan Portfolio Percentage Change Change in Dollars Loan Growth FY ‘11 – Q3 ‘16 From $567K To $ 342K Top 10 loan relationships represent 36% of total risk based capital, down by 39% since FY ’11 (as of Q3 ‘16) Strong yet balanced loan growth with prudent CRE exposure , better diversification and granularity
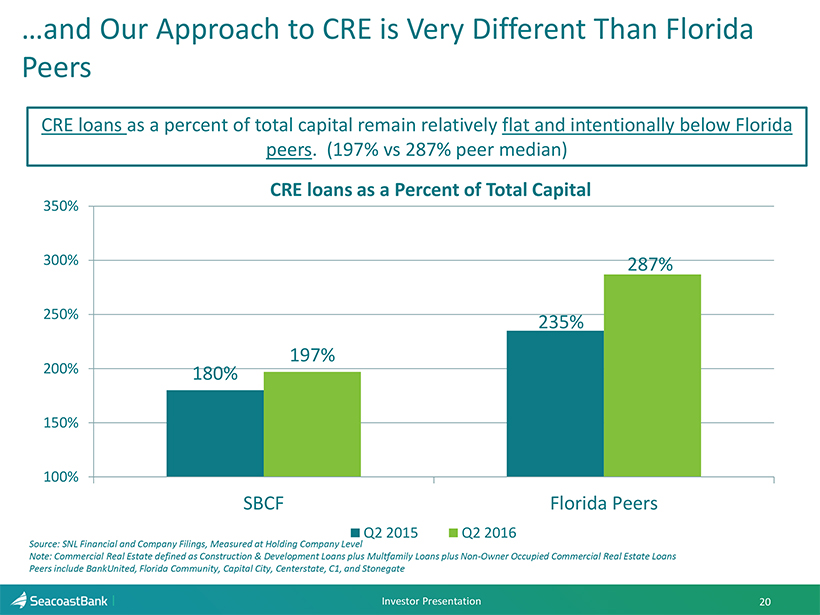
…and Our A pproach to CRE is Very D ifferent T han Florida P eers 20 Investor Presentation CRE loans as a percent of total capital remain relatively flat and intentionally below Florida peers . (197% vs 287% peer median) 180% 235% 197% 287% 100% 150% 200% 250% 300% 350% SBCF Florida Peers Q2 2015 Q2 2016 CRE loans as a Percent of T otal C apital Source : SNL Financial and Company Filings, Measured at Holding Company Level Note: Commercial Real Estate defined as Construction & Development Loans plus Multfamily Loans plus Non - Owner Occupied Commercial Real Estate Loans Peers include BankUnited , Florida Community, Capital City, Centerstate , C1, and Stonegate
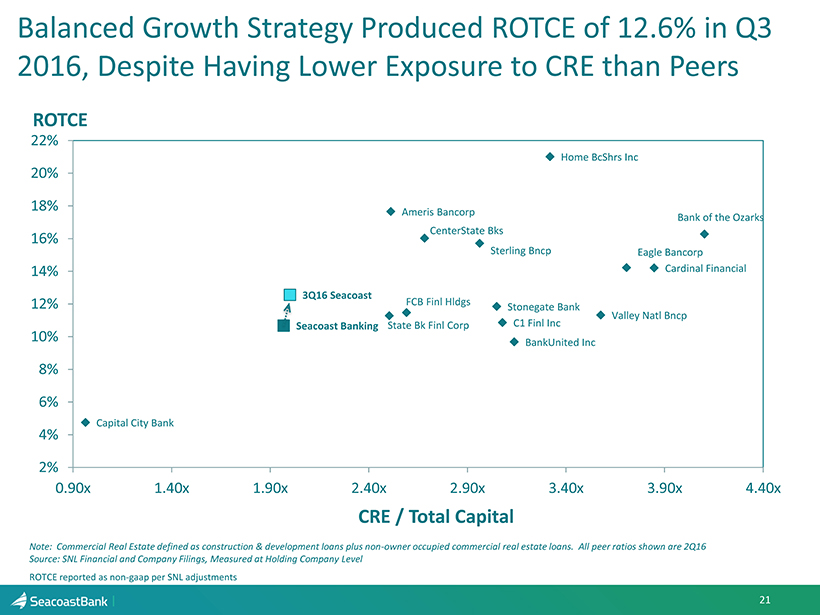
FCB Finl Hldgs CenterState Bks Stonegate Bank State Bk Finl Corp BankUnited Inc Capital City Bank Home BcShrs Inc Cardinal Financial Sterling Bncp Ameris Bancorp Eagle Bancorp Valley Natl Bncp Bank of the Ozarks C1 Finl Inc Seacoast Banking 3Q16 Seacoast 2% 4% 6% 8% 10% 12% 14% 16% 18% 20% 22% 0.90x 1.40x 1.90x 2.40x 2.90x 3.40x 3.90x 4.40x CRE / Total Capital ROTCE 21 Balanced Growth Strategy Produced ROTCE of 12.6% in Q3 2016, Despite H aving L ower E xposure to CRE than Peers Note: Commercial Real Estate defined as construction & development loans plus non - owner occupied commercial real estate loans. All peer ratios shown are 2Q16 Source: SNL Financial and Company Filings, Measured at Holding Company Level ROTCE reported as non - gaap per SNL adjustments
Agenda Investment Thesis Successfully Executing a Differentiated Strategy for Balanced Growth 22 Investor Presentation x Reaping benefits of strategic investments in organic growth and transformation x Track record of completing value - creating acquisitions x Robust risk management and controls help ensure consistent , sustainable results x Action - oriented management team, engaged and experienced board that is committed to building shareholder value x Well - positioned to benefit from strong Florida economy
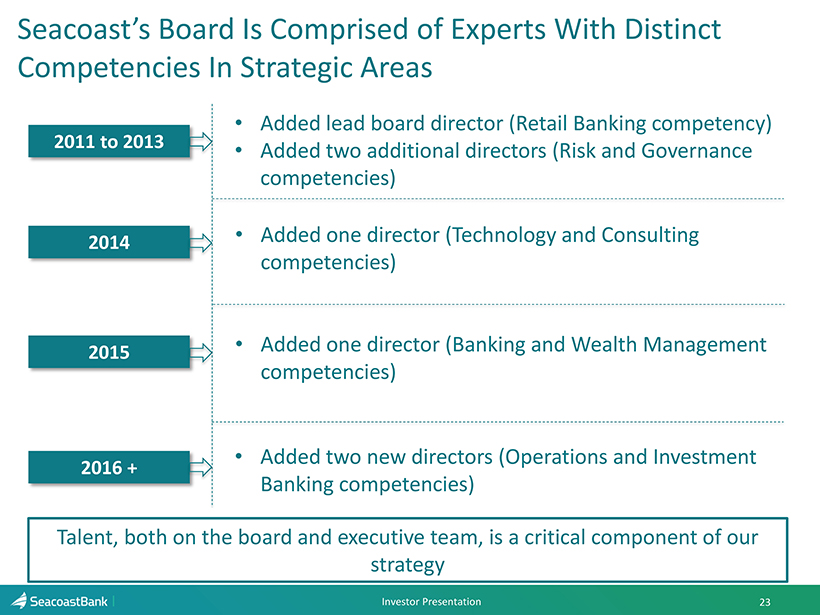
Seacoast’s Board Is Comprised of Experts With Distinct Competencies In Strategic Areas 23 Investor Presentation 2011 to 2013 • Added lead board director (Retail Banking competency) • Added two additional directors (Risk and Governance competencies) • Added one director (Technology and Consulting competencies) • Added one director (Banking and W ealth M anagement competencies) 2014 2015 2016 + • Added two new directors (Operations and Investment Banking competencies) Talent, both on the board and executive team, is a critical component of our strategy
Agenda Investment Thesis Successfully Executing a Differentiated Model in Community Banking 24 Investor Presentation x Reaping benefits of strategic investments in organic growth and transformation x Track record of completing value - creating acquisitions x Robust risk management and controls help ensure consistent, sustainable results x Action - oriented management team, engaged and experienced board that is committed to building shareholder value x Well - positioned to benefit from strong Florida economy
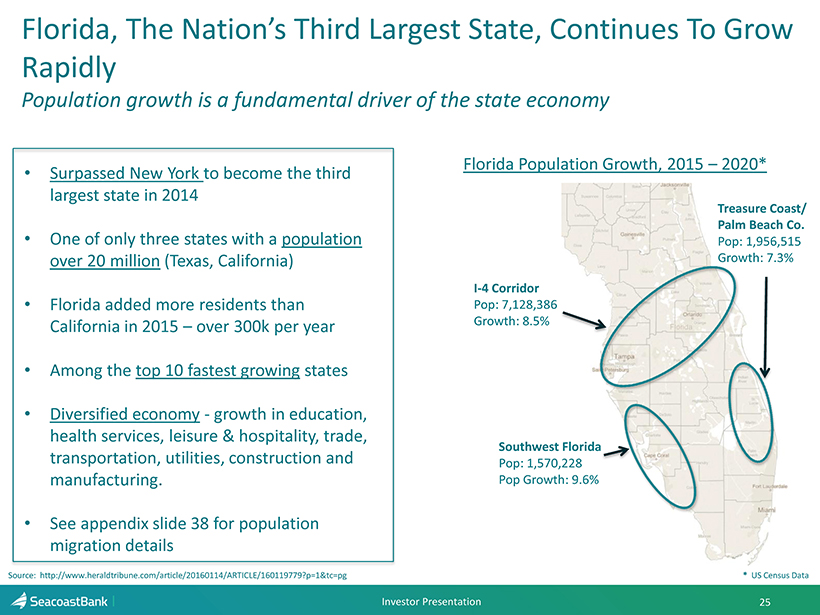
Agenda Florida, The Nation’s Third Largest State, Continues To Grow Rapidly Population growth is a fundamental driver of the state economy 25 Investor Presentation • Surpassed New York to become the third largest state in 2014 • One of only three states with a population over 20 million (Texas, California) • Florida added more residents than California in 2015 – over 300k per year • Among the top 10 fastest growing states • Diversified economy - growth in education, health services, leisure & hospitality, trade , transportation, utilities , construction and manufacturing . • See appendix slide 38 for population migration details Source: http ://www.heraldtribune.com/article/20160114/ARTICLE/160119779?p=1&tc=pg Southwest Florida Pop: 1,570,228 Pop Growth : 9.6 % Treasure Coast/ Palm Beach Co. Pop: 1,956,515 Growth : 7.3 % I - 4 Corridor Pop: 7,128,386 Growth: 8.5% Florida Population Growth, 2015 – 2020* * US Census Data
Agenda • About Seacoast Bank • Seacoast’s Investment Thesis – Successfully Executing a Differentiated Strategy for Balanced Growth • 2016 Outlook • Company Performance • Appendix Investor Presentation 26
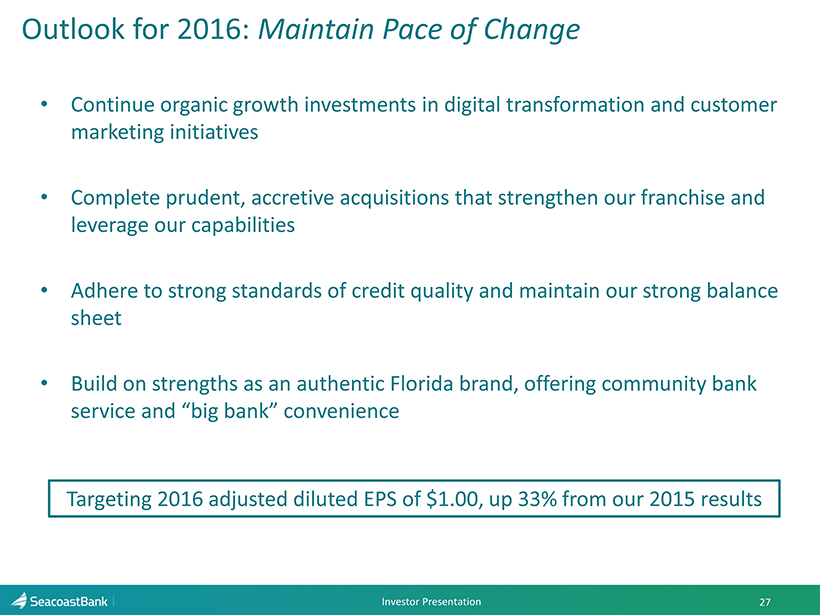
Outlook for 2016: Maintain Pace of Change • Continue organic growth investments in digital transformation and customer marketing initiatives • Complete prudent, accretive acquisitions that strengthen our franchise and leverage our capabilities • Adhere to strong standards of credit quality and maintain our strong balance sheet • Build on strengths as an authentic Florida brand, offering community bank service and “big bank” convenience 27 Investor Presentation Targeting 2016 adjusted diluted EPS of $1.00, up 33% from our 2015 results
Agenda • About Seacoast Bank • Seacoast’s Investment Thesis – Successfully Executing a Differentiated Strategy for Balanced Growth • 2016 Outlook • Company Performance • Appendix Investor Presentation 28

29 Financial Highlights Growth Highlights Q3 2016 Financial and Growth Highlights • Revenues, excluding security gains, increased $10.1 million, or 27% year over year to $47.2 million and increased $3.6 million, or 8% (not annualized), from the prior quarter. • Consumer, small business, and mortgage loan production all hit record levels in the third quarter. • Loans grew $670 million or 32% from one year ago. Adjusting for acquisitions, loan growth was $330 million or 16%. Compared to the prior quarter, loans increased at a 23% annualized growth rate, adding $153 million sequentially. • Debit card spend reached a record high, up 20% from 2015 levels, as organic households grew 3.5% above third quarter 2015 levels. • Net interest income increased $8.4 million or 29% year over year and $3.0 million or 9% above second quarter levels. • Net interest margin increased six basis points ( 0.06%) linked quarter to 3.69%. • Adjusted fully diluted earnings per share 1 rose to $0.28, an increase of 56% year - over - year and 22% from the second quarter 2016. • Adjusted return on assets 1 was 0.95%, an 11 basis point improvement over second quarter 2016. • Adjusted return on tangible common equity 1 gained 195 basis points, reaching 12.56% during the third quarter. (1) Non - GAAP measure, excludes merger related charges, branch closure expenses, and other adjustments (See Appendix for reconciliation to GAA P) Investor Presentation
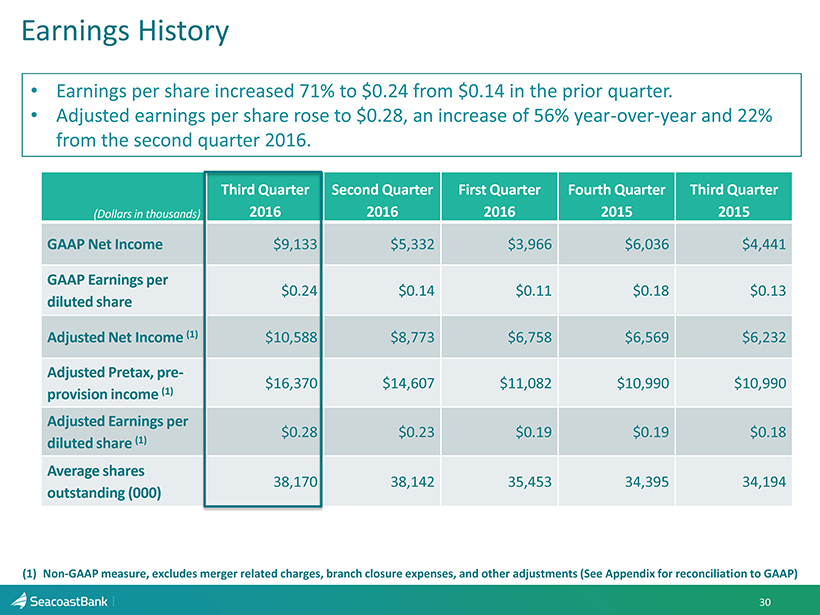
Earnings History 30 (1) Non - GAAP measure, excludes merger related charges, branch closure expenses, and other adjustments (See Appendix for reconciliati on to GAAP) • Earnings per share increased 71% to $0.24 from $0.14 in the prior quarter. • Adjusted earnings per share rose to $0.28, an increase of 56% year - over - year and 22% from the second quarter 2016. (Dollars in thousands) Third Quarter 2016 Second Quarter 2016 First Quarter 2016 Fourth Quarter 2015 Third Quarter 2015 GAAP Net Income $9,133 $5,332 $3,966 $6,036 $4,441 GAAP Earnings per diluted share $0.24 $0.14 $0.11 $0.18 $0.13 Adjusted Net Income (1) $10,588 $8,773 $6,758 $6,569 $6,232 Adjusted Pretax, pre - provision income (1) $16,370 $14,607 $11,082 $10,990 $10,990 Adjusted Earnings per diluted share (1) $0.28 $0.23 $0.19 $0.19 $0.18 Average shares outstanding (000) 38,170 38,142 35,453 34,395 34,194
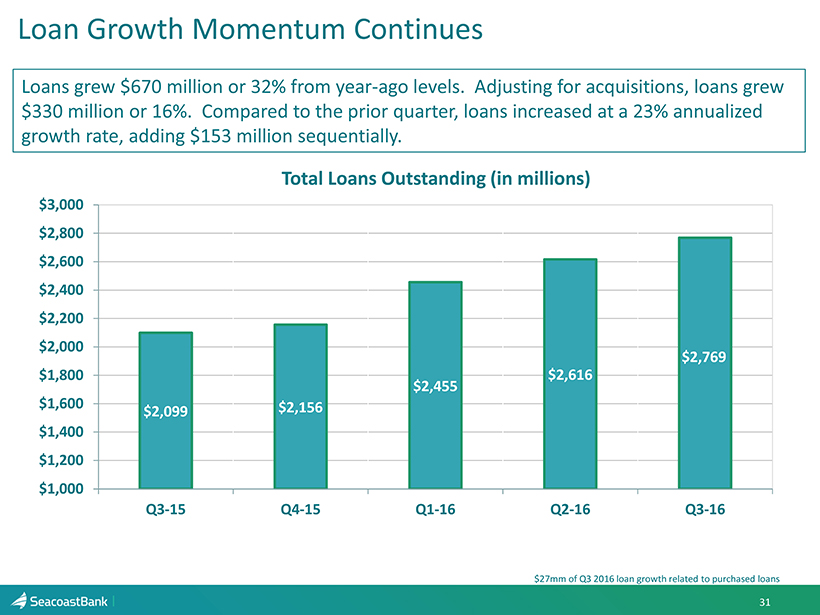
Loan Growth Momentum Continues 31 $2,099 $2,156 $2,455 $2,616 $2,769 $1,000 $1,200 $1,400 $1,600 $1,800 $2,000 $2,200 $2,400 $2,600 $2,800 $3,000 Q3-15 Q4-15 Q1-16 Q2-16 Q3-16 Total Loans Outstanding (in millions) Loans grew $ 670 million or 32% from year - ago levels. Adjusting for acquisitions, loans grew $330 million or 16%. Compared to the prior quarter, loans increased at a 23% annualized growth rate, adding $ 153 million sequentially . $27mm of Q3 2016 loan growth related to purchased loans
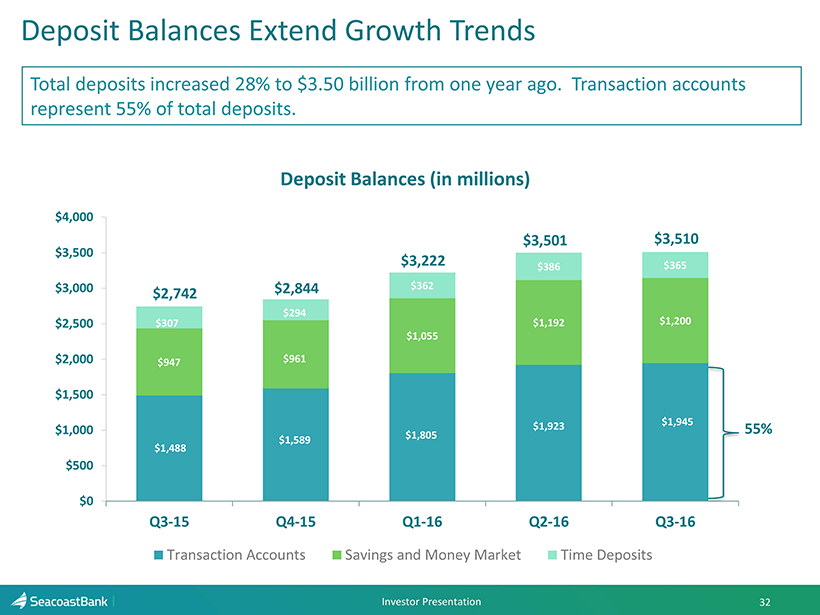
Deposit Balances Extend Growth Trends 32 Total deposits increased 28% to $3.50 billion from one year ago. Transaction accounts represent 55% of total deposits. $1,488 $1,589 $1,805 $1,923 $1,945 $947 $961 $1,055 $1,192 $1,200 $307 $294 $362 $386 $365 $0 $500 $1,000 $1,500 $2,000 $2,500 $3,000 $3,500 $4,000 Q3-15 Q4-15 Q1-16 Q2-16 Q3-16 Transaction Accounts Savings and Money Market Time Deposits Deposit Balances (in millions) $3,510 $2,742 $2,844 $3,222 55% $3,501 Investor Presentation

Net Interest Income and Margin 33 $29,130 $29,216 $30,349 $34,801 $37,735 3.75% 3.67% 3.68% 3.63% 3.69% 3.00% 3.20% 3.40% 3.60% 3.80% 4.00% 4.20% $0 $5,000 $10,000 $15,000 $20,000 $25,000 $30,000 $35,000 $40,000 Q3-15 Q4-15 Q1-16 Q2-16 Q3-16 Net Interest Income and Net Interest Margin* ($ in thousands) • Net interest margin for the quarter increased six basis points year over year to 3.69%, versus 3.63% in Q2 2016. • Net interest income for the quarter totaled $ 37.7 million, up $3.0 million or a 9% increase from the prior quarter. *Calculated on a fully taxable equivalent basis using amortized cost. Investor Presentation
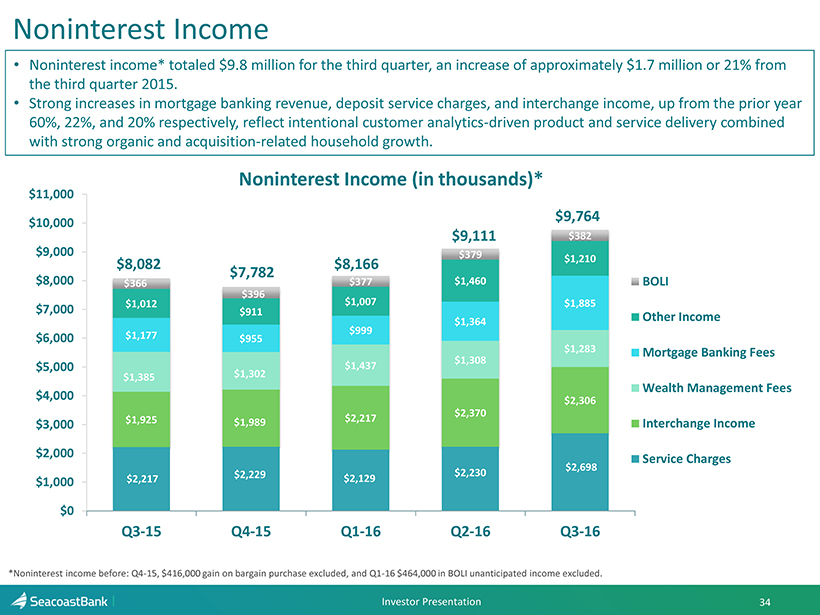
Noninterest Income 34 $2,217 $2,229 $2,129 $2,230 $2,698 $1,925 $1,989 $2,217 $2,370 $2,306 $1,385 $1,302 $1,437 $1,308 $1,283 $1,177 $955 $999 $1,364 $1,885 $1,012 $911 $1,007 $1,460 $1,210 $396 $377 $379 $382 $0 $1,000 $2,000 $3,000 $4,000 $5,000 $6,000 $7,000 $8,000 $9,000 $10,000 $11,000 Q3-15 Q4-15 Q1-16 Q2-16 Q3-16 BOLI Other Income Mortgage Banking Fees Wealth Management Fees Interchange Income Service Charges Noninterest Income (in thousands)* $8,082 *Noninterest income before: Q4 - 15, $416,000 gain on bargain purchase excluded, and Q1 - 16 $464,000 in BOLI unanticipated income e xcluded. • Noninterest income* totaled $9.8 million for the third quarter , an increase of approximately $1.7 million or 21% from the third quarter 2015. • Strong increases in mortgage banking revenue, deposit service charges, and interchange income, up from the prior year 60%, 22%, and 20% respectively, reflect intentional customer analytics - driven product and service delivery combined with strong organic and acquisition - related household growth. $7,782 $8,166 $9,111 $9,764 Investor Presentation $366
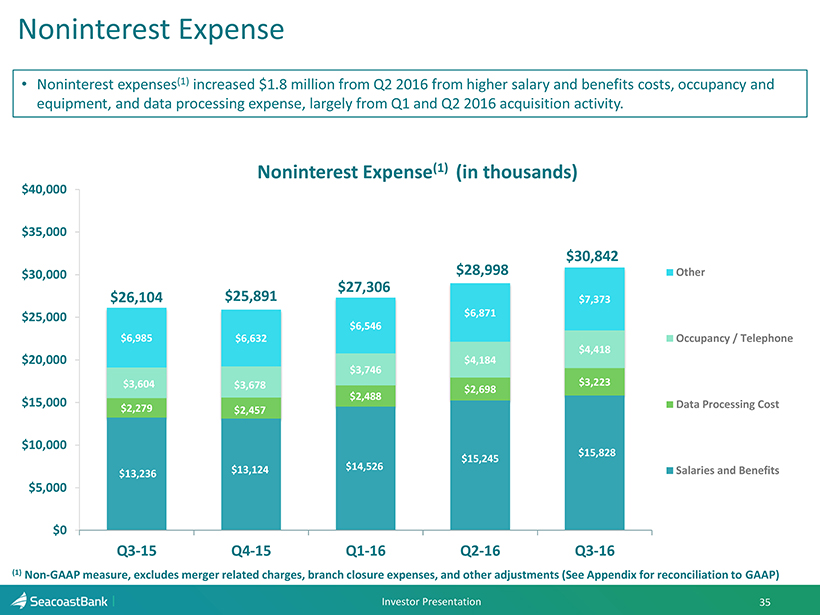
Noninterest Expense 35 $13,236 $13,124 $14,526 $15,245 $15,828 $2,279 $2,457 $2,488 $2,698 $3,223 $3,604 $3,678 $3,746 $4,184 $4,418 $6,985 $6,632 $6,546 $6,871 $7,373 $0 $5,000 $10,000 $15,000 $20,000 $25,000 $30,000 $35,000 $40,000 Q3-15 Q4-15 Q1-16 Q2-16 Q3-16 Other Occupancy / Telephone Data Processing Cost Salaries and Benefits Noninterest Expense (1) (in thousands) $30,842 $26,104 • Noninterest expenses (1) increased $1.8 million from Q2 2016 from higher salary and benefits costs, occupancy and equipment, and data processing expense, largely from Q1 and Q2 2016 acquisition activity. $25,891 $27,306 (1) Non - GAAP measure, excludes merger related charges, branch closure expenses, and other adjustments (See Appendix for reconciliation to GAA P) $28,998 Investor Presentation
Contact Details : Seacoast Banking Corporation of Florida [ NASDAQ: SBCF] 36 Investor Presentation Steve Fowle, CFO (email) Steve.Fowle@SeacoastBank.com (phone) 772.463.8977 Investor Relations www.SeacoastBanking.com
Agenda • About Seacoast Bank • Seacoast’s Investment Thesis – Successfully Executing a Differentiated Strategy for Balanced Growth • 2016 Outlook • Company Performance • Appendix Investor Presentation 37
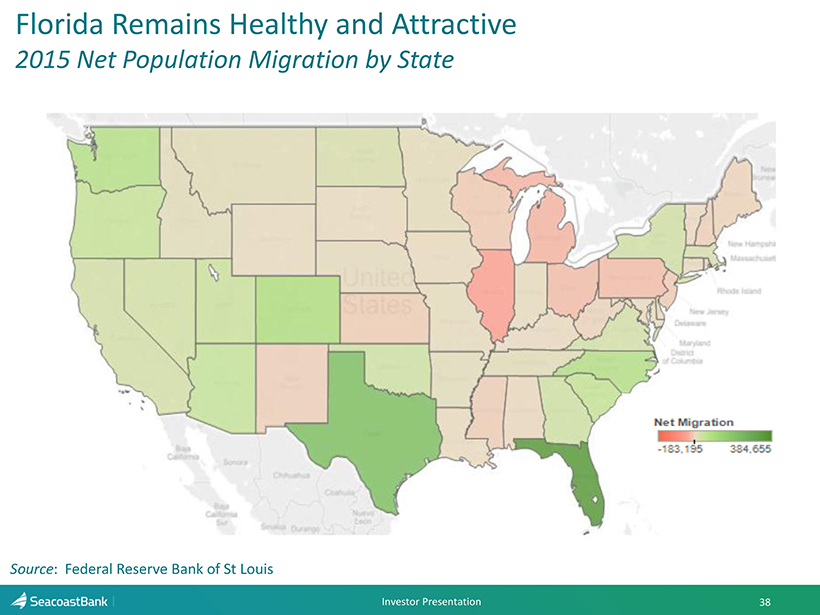
Agenda Florida Remains Healthy and Attractive 2015 Net Population Migration by State Investor Presentation 38 Source : Federal Reserve Bank of St Louis
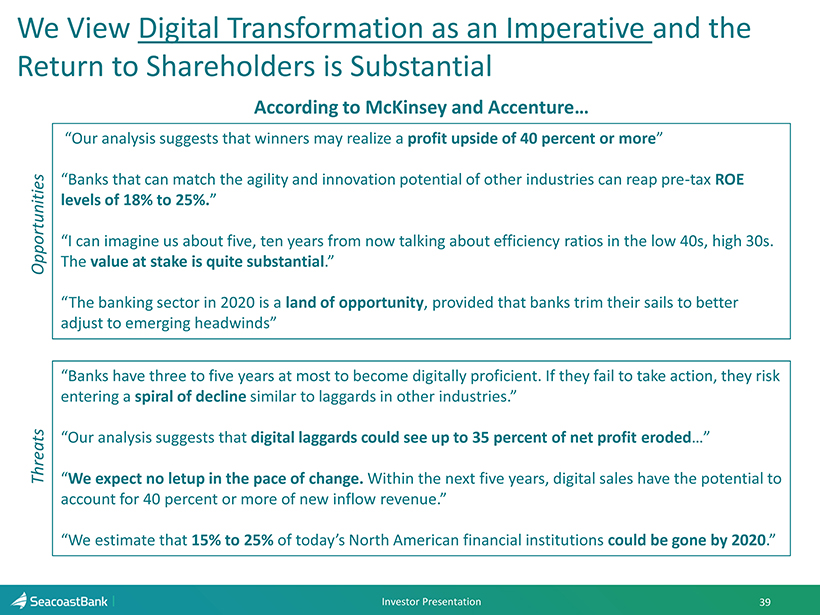
“Our analysis suggests that winners may realize a profit upside of 40 percent or more ” “Banks that can match the agility and innovation potential of other industries can reap pre - tax ROE levels of 18% to 25%. ” “ I can imagine us about five, ten years from now talking about efficiency ratios in the low 40s, high 30s. The value at stake is quite substantial .” “The banking sector in 2020 is a land of opportunity , provided that banks trim their sails to better adjust to emerging headwinds” “Banks have three to five years at most to become digitally proficient. If they fail to take action, they risk entering a spiral of decline similar to laggards in other industries.” “Our analysis suggests that digital laggards could see up to 35 percent of net profit eroded …” “ We expect no letup in the pace of change. Within the next five years, digital sales have the potential to account for 40 percent or more of new inflow revenue.” “We estimate that 15% to 25% of today’s North American financial institutions could be gone by 2020 .” We View Digital T ransformation as an Imperative and the Return to Shareholders is Substantial Opportunities Threats According to McKinsey and Accenture… Investor Presentation 39
Digital Technology Has Leveled The Playing Field Digital Defined • Customer Servicing Capabilities to Lower Servicing Costs – E.G. Mobile banking, mobile check deposit, online banking, online applications/forms – Table stakes as “convenience” has been fundamentally redefined – Implication - Customers choosing lower cost channels for service – good for customer and bank • Marketing and Analytics Software to Drive Sales Growth – Marketing software to automate campaigns , drives sales through call center, website, branch – Analytics software to diagnose customer segments and drive greater share of wallet – Lead generation software to help prospect for new customers – Implication – Banks can now drive additional sales • Operating Reality – Data sprawl not an issue with smaller banks – data set readily available through core provider – Software costs have plummeted in recent years…now very accessible for smaller banks – Implication – Small banks can now compete in ways previously unimagined…and drive results today. 40 Investor Presentation Digital Capabilities and Software Enable Smaller Banks To Compete In Ways Previously Unimagined. Seacoast Is Reaping Tangible Results.
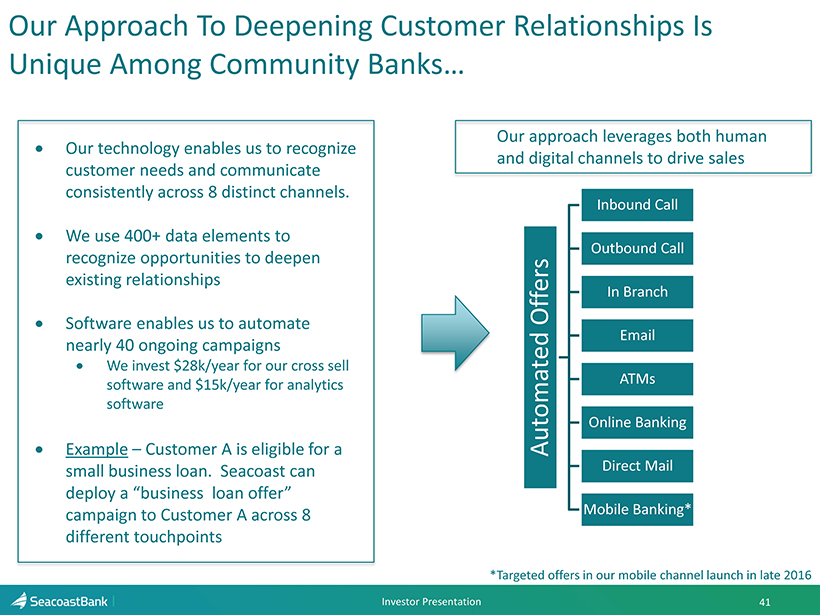
Our Approach To Deepening Customer Relationships Is Unique Among Community Banks… Automated Offers Inbound Call Outbound Call In Branch Email ATMs Online Banking Direct Mail Mobile Banking* Our technology enables us to recognize customer needs and communicate consistently across 8 distinct channels. We use 400+ data elements to recognize opportunities to deepen existing relationships Software enables us to automate nearly 40 ongoing campaigns We invest $28k/year for our cross sell software and $15k/year for a nalytics software Example – Customer A is eligible for a small business loan. Seacoast can deploy a “business loan offer” campaign to Customer A across 8 different touchpoints *Targeted offers in our mobile channel launch in late 2016 Investor Presentation 41 Our approach leverages both human and digital channels to drive sales
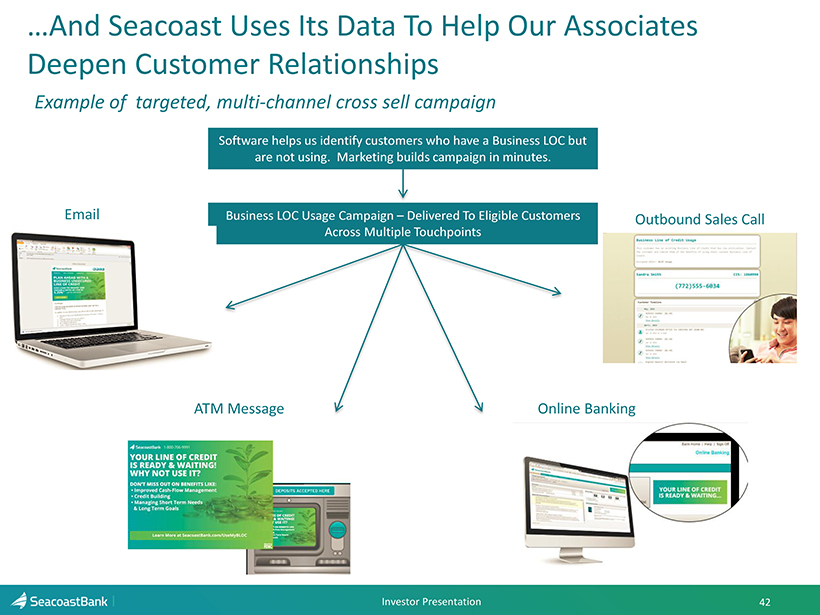
…And Seacoast Uses Its Data To Help Our Associates Deepen Customer Relationships Business LOC Usage Campaign – Delivered To Eligible Customers Across Multiple Touchpoints Email ATM Message Online Banking Outbound Sales Call Investor Presentation 42 Software helps us identify customers who have a Business LOC but are not using. Marketing builds campaign in minutes. Example of targeted, multi - channel cross sell campaign
Explanation of Certain Unaudited Non - GAAP Financial M easures This presentation contains financial information determined by methods other than Generally Accepted Accounting Principles (“GAAP”) . The financial highlights provide reconciliations between GAAP net income and adjusted net income, GAAP income and adjusted pretax, preprovision income . Management uses these non - GAAP financial measures in its analysis of the Company’s performance and believes these presentations provide useful supplemental information, and a clearer understanding of the Company’s performance . The Company believes the non - GAAP measures enhance investors’ understanding of the Company’s business and performance and if not provided would be requested by the investor community . These measures are also useful in understanding performance trends and facilitate comparisons with the performance of other financial institutions . The limitations associated with operating measures are the risk that persons might disagree as to the appropriateness of items comprising these measures and that different companies might calculate these measures differently . The Company provides reconciliations between GAAP and these non - GAAP measures . These disclosures should not be considered an alternative to GAAP . 43 Investor Presentation
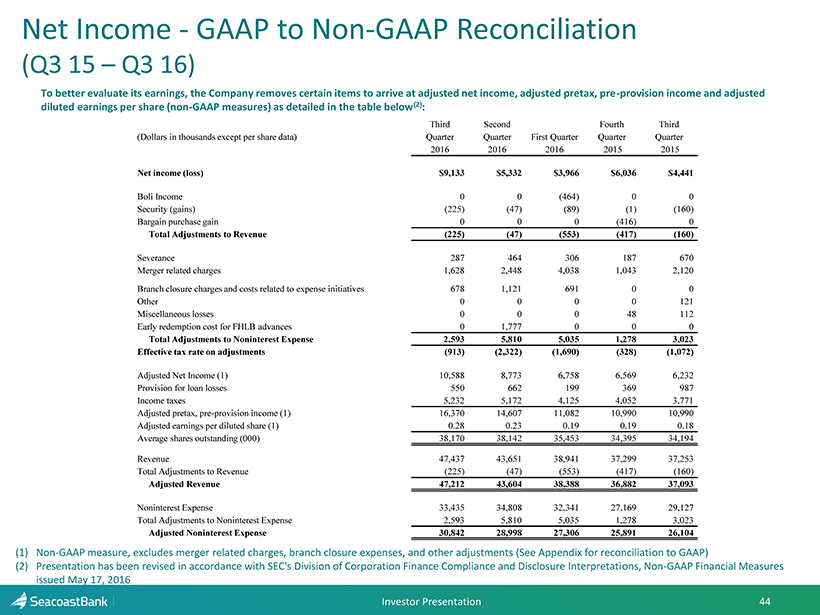
Net Income - GAAP to Non - GAAP Reconciliation (Q3 15 – Q3 16) To better evaluate its earnings, the Company removes certain items to arrive at adjusted net income, adjusted pretax, pre - provis ion income and adjusted diluted earnings per share (non - GAAP measures) as detailed in the table below (2 ) : (1) Non - GAAP measure, excludes merger related charges, branch closure expenses, and other adjustments (See Appendix for reconciliati on to GAAP) (2) Presentation has been revised in accordance with SEC's Division of Corporation Finance Compliance and Disclosure Interpretati ons , Non - GAAP Financial Measures issued May 17, 2016 44 (Dollars in thousands except per share data) Third Quarter Second Quarter First Quarter Fourth Quarter Third Quarter 2016 2016 2016 2015 2015 Net income (loss) $9,133 $5,332 $3,966 $6,036 $4,441 Boli Income 0 0 (464) 0 0 Security (gains) (225) (47) (89) (1) (160) Bargain purchase gain 0 0 0 (416) 0 Total Adjustments to Revenue (225) (47) (553) (417) (160) Severance 287 464 306 187 670 Merger related charges 1,628 2,448 4,038 1,043 2,120 Branch closure charges and costs related to expense initiatives 678 1,121 691 0 0 Other 0 0 0 0 121 Miscellaneous losses 0 0 0 48 112 Early redemption cost for FHLB advances 0 1,777 0 0 0 Total Adjustments to Noninterest Expense 2,593 5,810 5,035 1,278 3,023 Effective tax rate on adjustments (913) (2,322) (1,690) (328) (1,072) Adjusted Net Income (1) 10,588 8,773 6,758 6,569 6,232 Provision for loan losses 550 662 199 369 987 Income taxes 5,232 5,172 4,125 4,052 3,771 Adjusted pretax, pre - provision income (1) 16,370 14,607 11,082 10,990 10,990 Adjusted earnings per diluted share (1) 0.28 0.23 0.19 0.19 0.18 Average shares outstanding (000) 38,170 38,142 35,453 34,395 34,194 Revenue 47,437 43,651 38,941 37,299 37,253 Total Adjustments to Revenue (225) (47) (553) (417) (160) Adjusted Revenue 47,212 43,604 38,388 36,882 37,093 Noninterest Expense 33,435 34,808 32,341 27,169 29,127 Total Adjustments to Noninterest Expense 2,593 5,810 5,035 1,278 3,023 Adjusted Noninterest Expense 30,842 28,998 27,306 25,891 26,104 Investor Presentation
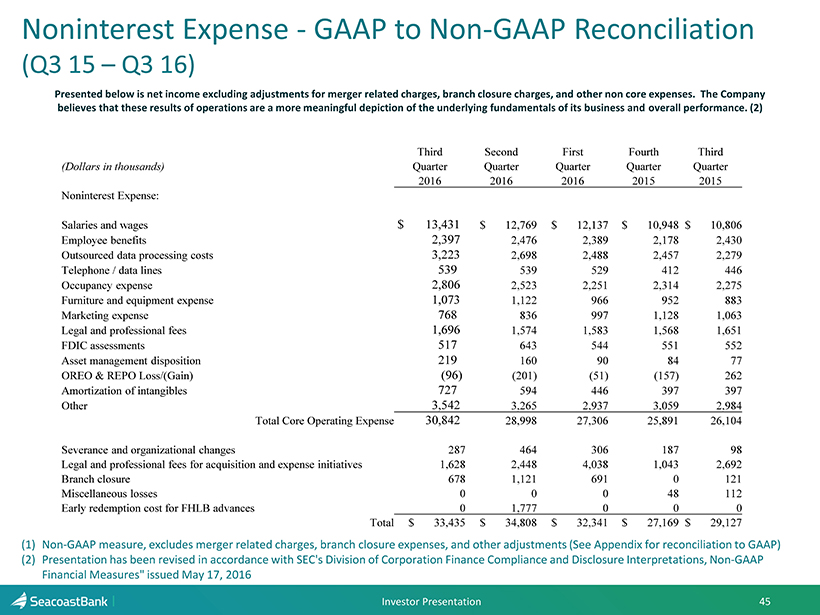
Noninterest Expense - GAAP to Non - GAAP Reconciliation (Q3 15 – Q3 16) Presented below is net income excluding adjustments for merger related charges, branch closure charges, and other non core expenses. The Company believes that these results of operations are a more meaningful depiction of the underlying fundamentals of its business and ove rall performance . (2) (1) Non - GAAP measure, excludes merger related charges, branch closure expenses, and other adjustments (See Appendix for reconciliati on to GAAP) (2) Presentation has been revised in accordance with SEC's Division of Corporation Finance Compliance and Disclosure Interpretati ons , Non - GAAP Financial Measures" issued May 17, 2016 45 Third Second First Fourth Third (Dollars in thousands) Quarter Quarter Quarter Quarter Quarter 2016 2016 2016 2015 2015 Noninterest Expense: Salaries and wages $ 13,431 $ 12,769 $ 12,137 $ 10,948 $ 10,806 Employee benefits 2,397 2,476 2,389 2,178 2,430 Outsourced data processing costs 3,223 2,698 2,488 2,457 2,279 Telephone / data lines 539 539 529 412 446 Occupancy expense 2,806 2,523 2,251 2,314 2,275 Furniture and equipment expense 1,073 1,122 966 952 883 Marketing expense 768 836 997 1,128 1,063 Legal and professional fees 1,696 1,574 1,583 1,568 1,651 FDIC assessments 517 643 544 551 552 Asset management disposition 219 160 90 84 77 OREO & REPO Loss/(Gain) (96) (201) (51) (157) 262 Amortization of intangibles 727 594 446 397 397 Other 3,542 3,265 2,937 3,059 2,984 Total Core Operating Expense 30,842 28,998 27,306 25,891 26,104 Severance and organizational changes 287 464 306 187 98 Legal and professional fees for acquisition and expense initiatives 1,628 2,448 4,038 1,043 2,692 Branch closure 678 1,121 691 0 121 Miscellaneous losses 0 0 0 48 112 Early redemption cost for FHLB advances 0 1,777 0 0 0 Total $ 33,435 $ 34,808 $ 32,341 $ 27,169 $ 29,127 Investor Presentation