BBI Investor Presentation
June 2006

Agenda
1.
Overview of NorthWestern Energy
2.
Operations
Transmission
Distribution
Supply
3.
Regulatory Environment
4.
Financial Summary
5.
Growth Opportunities
6.
Summary
7.
Appendix 1 – Detailed Financials
2
Regulated Operations
NorthWestern Energy
One of the largest providers of electricity and natural gas
in the Upper Midwest and Northwest, serving
approximately 628,500 customers in Montana, South
Dakota and Nebraska
Electric Operations
Montana
Transmits and distributes electricity to 316,000
customers
Revenue by customer class(1): 38.4%
residential, 49.2% commercial, 8.1% industrial
and 4.3% other
Approximately 7,000 miles (11,265 km) of
transmission lines and 20,300 miles (32,480 km)
of distribution lines
South Dakota
Generates, transmits and distributes electricity
to 59,000 customers
Revenue by customer class(1): 41.6%
residential, 56.5% commercial/industrial and
1.9% other
Approximately 3,200 miles (5,150 km) of T&D
lines
Owns 310 net MW of power generation
Gas Operations
Montana
170,000 customers (residential and
commercial)
3,700 miles (5,955 km) of underground
distribution pipelines
2,000 miles (3,218 km) of transmission
pipelines
16.2 Bcf of gas storage
South Dakota/Nebraska
83,500 customers (residential and
commercial)
2,100 miles (3,380 km) of distribution gas
mains
Business Overview
Unregulated Operations
Electric - Primarily consists of a lease of
30% of Colstrip Unit 4, a 740 MW coal-fired
plant in Montana
Gas - Gas supply and distribution services
to high volume customers in SD/NE
(1) Data as percent of total electric rate schedule revenue for 2005A.
3
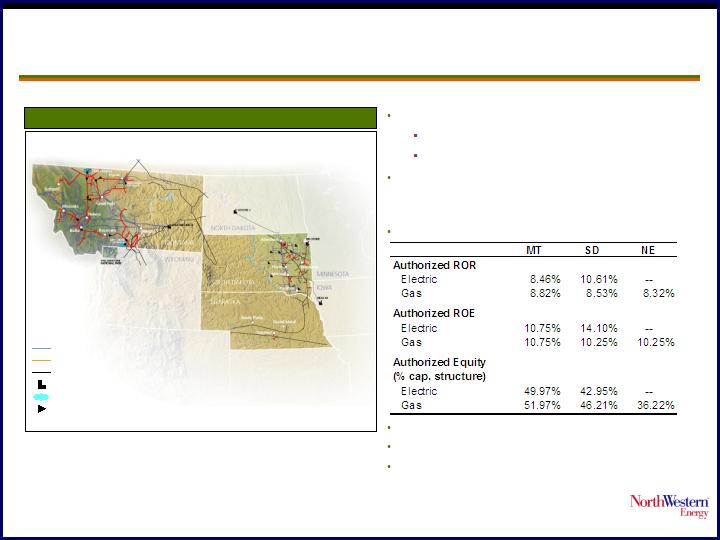
NorthWestern Energy Today
Utility Service Territory
Electric transmission lines
Natural gas distribution lines
Supplier-owned electric or natural gas lines
Electric generating plant
Natural gas storage fields
Natural gas compressor stations
(1) As of 3/31/06.
(2) Book capitalization calculated as short-term debt plus long-term debt plus
shareholders’ equity.
628,500 customers
NWEC electric: 375,000
NWEC gas: 253,500
Approximately 123,000 square miles
(319,800 sq. km) of service territory in South
Dakota, Montana and Nebraska
Allowed Returns:
Total Assets: (1) $2,259 MM
Total Capitalization: (1)(2) $1,445 MM
Total Employees: (1) 1,353
4
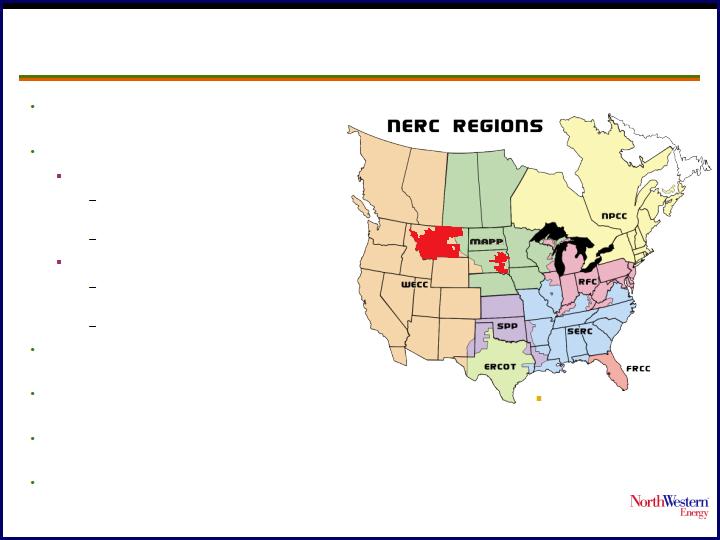
Electric Transmission
Approx. 123,000 square miles
(319,800 sq. km) service territory
Electric transmission operations
Montana
6,940 circuit miles (11,105 km)
of high voltage transmission
53 substations
South Dakota
1,293 circuit miles (2,070 km)
of high voltage transmission
41 substations
Operates in two reliability councils –
WECC and MAPP
Operates in both vertically integrated
(SD) and unbundled markets (MT)
System Dispatch (SOCC) operates gas
and electric for all three states
Montana control area serves more
than 3,000 MW of generation
NorthWestern Service Area
5
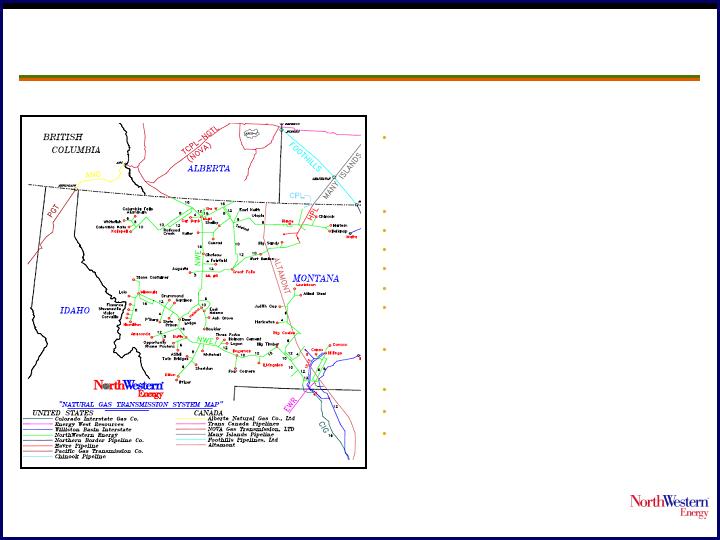
Natural Gas Transmission and Storage
Storage:
Cobb and Dry Creek – 16.2 Bcf of
working gas
System Connections:
TransCanada (NOVA)
Havre Pipeline
Colorado Interstate Gas (CIG)
Williston Basin Interstate Gas (WBI)
Energy West
Encana (gathering system)
System configured to allow
bidirectional transportation
Peak day deliverability: 300 mmcf
42,000 installed HP compression
More than 2,000 miles (3,218 km)
of pipe
2”-20” diameter
6
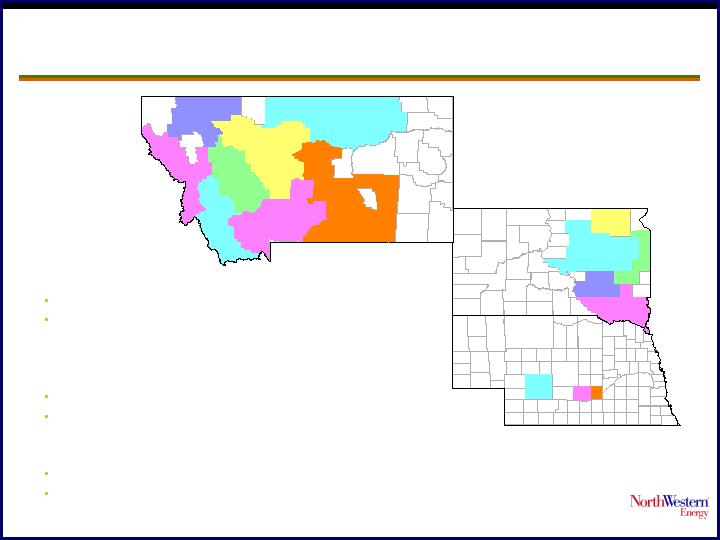
Electric and Natural Gas Distribution
Operations Overview
Electric System
22,500 miles (36,210 km) of distribution lines
375,000 customers, 299 communities in Montana,
eastern South Dakota and Yellowstone National
Park in Wyoming
Natural Gas System
7,300 miles (11,748 km) of distribution pipelines
253,500 customers, 172 communities in Montana,
South Dakota and Nebraska
Employees
630 Internal
Contract additional 200 FTE
Kearny
Grand
Island
Brookings
Huron
Mitchell
Yankton
Butte
Division
Bozeman Division
Billings Division
Helena
Division
Missoula
Division
Great Falls Division
Kalispell District
Havre District
Aberdeen
North
Platte
7
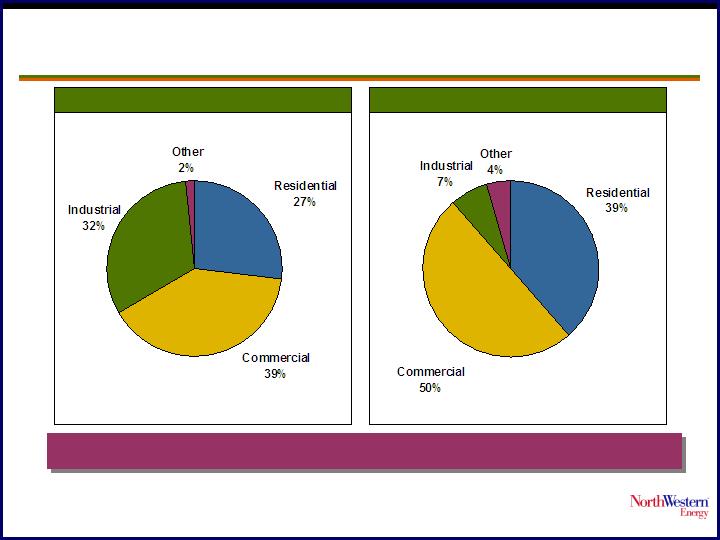
Electric Customer Profile
2005A Volume (MWh)(1)
2005A Revenue ($MM)(1)
(1) Excludes SD wholesale revenue and loads.
(2) Other includes regulatory amortization of $3.8 million. Total regulated electric revenue for 2005A was $631.7 million, comprised of $574.2
million retail rate schedule revenue, $9.8 million SD wholesale rate schedule revenue, $40.2 million of transmission revenue and $7.5 million
of miscellaneous revenue.
Total MWh = 9,598,360
Rate Schedule Revenue(2) = $574.2 MM
(2)
The 10 largest customers in the regulated electric segment are based in MT and represent about 6% of total
rate schedule revenues. The largest customer represents less than 1% of the total rate schedule revenues.
8
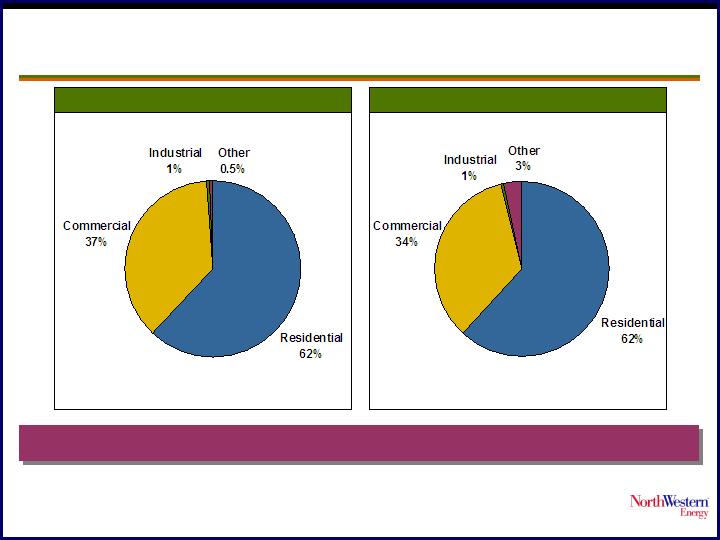
Gas Customer Profile
2005A Volume (MMbtu)(1)
2005A Revenue ($MM)(1)
(1) Excludes non-retail regulated revenues and sales to other utilities.
(2) Other includes $9.4 million of regulatory amortization and $0.4 million of propane revenues. Total regulated gas revenue for 2005A was
$366.0 million, comprised of $323.6 million rate schedule revenue, $20.2 million of wholesale revenue, $17.8 million of transportation revenue
and $4.4 million of miscellaneous revenue.
Total MMbtu = 29,107,170
Rate Schedule Revenue(2) = $323.6 MM
(2)
The 10 largest customers in the regulated gas segment are mainly concentrated in Montana and represent less than
5% of total rate schedule revenues. The largest customer represents about 1.5% of the rate schedule revenues.
9

Regulatory Environment

Regulatory Jurisdictions
Federal Energy Regulatory
Commission
(FERC)
Transmission
Wholesale Generation
Montana Public Service Commission
(MPSC)
Electric and Natural Gas Distribution
Default Supply
South Dakota Public Utility
Commission (SDPUC)
Electric and Natural Gas Distribution
Retail Electric and Gas Sales
Nebraska Public Service Commission
(NPSC)
Natural Gas Distribution
Retail Gas Sales
11
Regulated Return Detail
Note: 2005 return figures have not been normalized for weather or Commission ratemaking adjustments. SD and NE 2005 gas figures have been adjusted
to remove $5.4 million and $0.4 million liability reserve increases associated to manufactured gas plants, respectively.
(1) Test year of last rate case.
($ in millions)
Montana
South Dakota
Nebraska
Electric
Gas
Electric
Gas
Gas
Total
Rate Base
$692.6
$258.3
$165.7
$42.8
$26.5
$1,185.9
Return on Rate Base
Authorized Return on Rate Base
8.46%
8.82%
10.61%
8.53%
8.32%
8.84%
2005 Earned Return on Rate Base
6.76%
7.49%
12.38%
0.88%
3.71%
7.43%
Return on Equity
Authorized Return on Equity
10.75%
10.75%
14.10%
10.25%
10.25%
11.14%
2005 Earned Return on Equity
6.30%
8.50%
17.77%
(8.49%)
(6.58%)
7.50%
Authorized Capital Structure
(1)
Debt
42.17%
40.17%
57.05%
53.79%
59.08%
Trust Preferred
7.86%
7.86%
0.00%
0.00%
4.70%
Equity (Preferred & Common)
49.97%
51.97%
42.95%
46.21%
36.22%
Total
100.00%
100.00%
100.00%
100.00%
100.00%
Other:
Cost Trackers for
Energy Supply and
Property Taxes
Cost Trackers for Energy Supply
12
Financial Highlights
Source: Company reports and SEC filings.
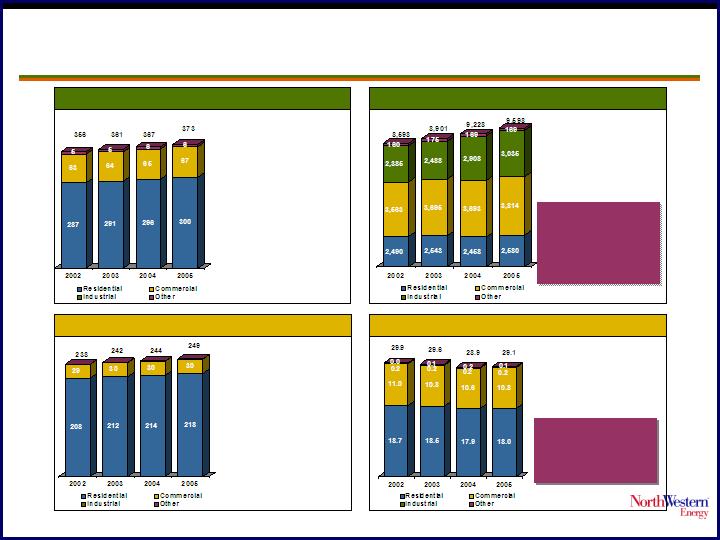
Customer & Volume Statistics
Electric Customers (000)
Electric Volume in MWh (000)
Natural Gas Customers (000)
Gas Volume in Therms Sales (MM MMBtu)
CAGR
’02 to ’05 = 1.6%
CAGR
’02 to ’05 = 3.7%
CAGR
’02 to ’05 = 1.6%
CAGR
’02 to ’05 = -1.0%
Gas customer
growth but offset
by conservation
and warm weather
Electric customer
and volume
growth has been
strong over the
last 3 yrs
14
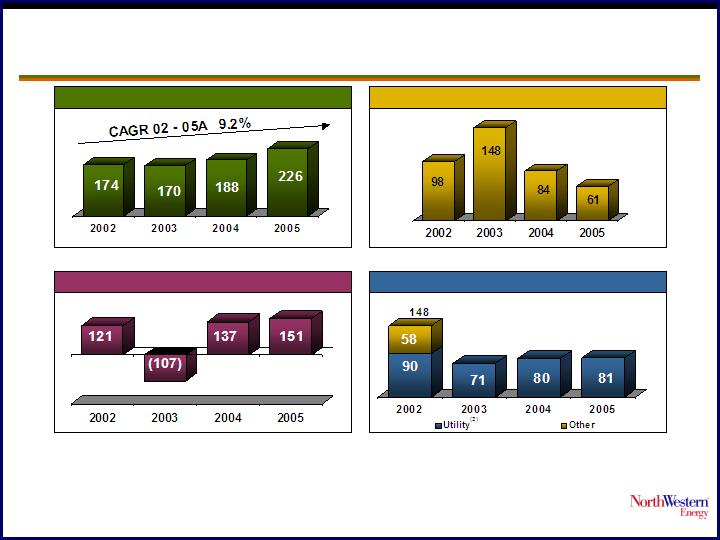
Source: Company reports and SEC filings.
Note: Full year 2004 results show combined results for NWEC’s predecessor company from January 1, 2004 to October 31, 2004 and for
NWEC from November 1, 2004 to December 31, 2004.
(1) Before reorganization expenses and impairment charge.
(2) Excludes cash used in acquisitions.
(3) 2002 other capital expenditures include $10 million related to Montana’s utility acquisition stipulation, $20 million related to the buyout
of the automatic meter reading lease and $28 million related to MFM.
(4) Cash flow from continuing operations (excludes change in restricted cash).
Financial Highlights
EBITDA(1)
Interest Expense
Cash Flow from Operations(4)
Capital Expenditures(2)
($ in millions)
($ in millions)
($ in millions)
($ in millions)
15
Strengthened Balance Sheet
S & P
Moody's
Fitch
Outlook
Negative
Positive
Stable
Sr. Secured
BBB-
Ba1
BBB
Sr. Unsec'd
BB-
Ba2
BBB-
Corporate Rating
BB+
Debt Ratings
($ in millions)
Debt Ratings
BBB-
Except our revolver, all long term debt
is fixed rate. The revolver balance as of
3/31/06 was $35 million, representing
approx. 5% of the total LT debt. A 1%
increase in LIBOR would increase
interest expense < $400k annually.
16
12/31/2004
12/31/2005
3/31/2006
Cash
17.1
2.7
12.0
Restricted Cash
21.4
25.2
26.2
Receivables
141.4
160.9
134.9
Inventories
37.1
40.9
31.7
Other Current Assets
169.3
83.8
55.3
PP&E and Other Assets
2,062.7
2,086.9
2,099.3
Total Assets
2,448.9
2,400.4
2,359.4
Payables
85.1
99.4
59.3
Short Term Debt
73.4
156.5
156.9
Other Current Liabilities
183.7
168.8
185.0
Long Term Debt
763.6
586.5
537.0
Other Liabilities
633.8
651.7
670.3
Shareholders' Equity
709.3
737.5
750.9
Total Liab. And Equity
2,448.9
2,400.4
2,359.4
Capitalization:
Short Term Debt
73.4
156.5
156.9
Long Term Debt
763.6
586.5
537.0
Shareholders Equity
709.3
737.5
750.9
Total Capitalization
1,546.3
1,480.5
1,444.8
Debt/Total Capitalization
54.1%
50.2%
48.0%
Selected Balance Sheet Data

Growth Opportunities
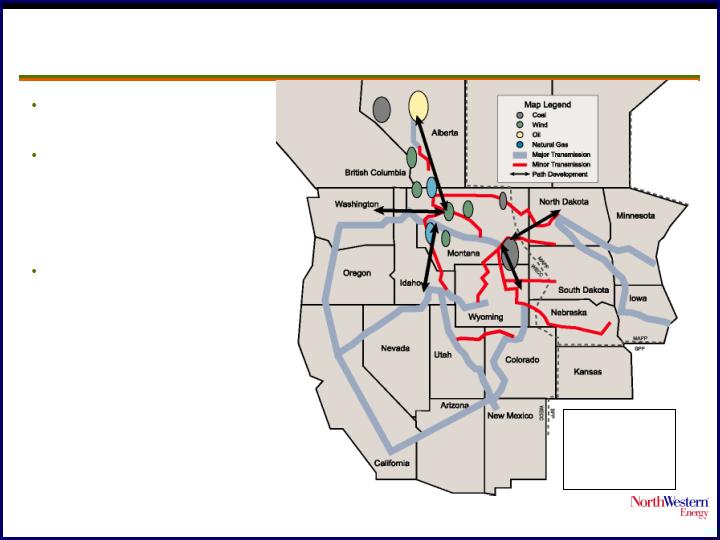
Transmission Investment
Take advantage of our
strategic location
Pursue opportunities
to expand electric and
gas transmission
infrastructure to meet
increased needs
Transmission paths
out of Montana are all
constrained for entities
seeking firm
transmission rights
Path Ratings:
MT-SE 600 MW
MT-E 200 MW
MT-SW 337 MW
MT-W 2,200 MW
18

Northwestern Energy Summary
Attractive
Transmission &
Distribution
Business
Regulated electric and gas businesses contribute 85% of the Company’s gross margin
Regional location of cold winters and hot summers contributes to stability of cash flows
No energy marketing and trading activities; exited all non-energy related businesses
Strong, Predictable
Earnings
Increasing Free
Cash Flow
Significant Earnings
Upside Potential
Restructuring
Effort Effectively
Completed
Strong
Management
Increasing cash flows support ability to grow dividends and growth opportunities
Improving capital structure provides increased financial flexibility
Investment in FERC regulated transmission projects allow growth in rate base and earnings
Potential opportunity to achieve further operating and interest cost reductions
Regional consolidation
Deliver natural gas to ethanol plants
Reduced debt and achieved targeted debt-to-capital ratio
Improved regulatory relationships
Sales of non-core operations and remaining asset sales completed
Core management team has a long track record in successfully operating regulated utility
businesses
Successfully executed financial restructuring
Premier regional T&D utility with stable customer growth
Attractive mix of electric and natural gas customers
Strong competitive position that results from low production and purchased-power costs
Diversified customer base that is not dependent on any one customer or industry
19
Appendix A
Detailed Financials
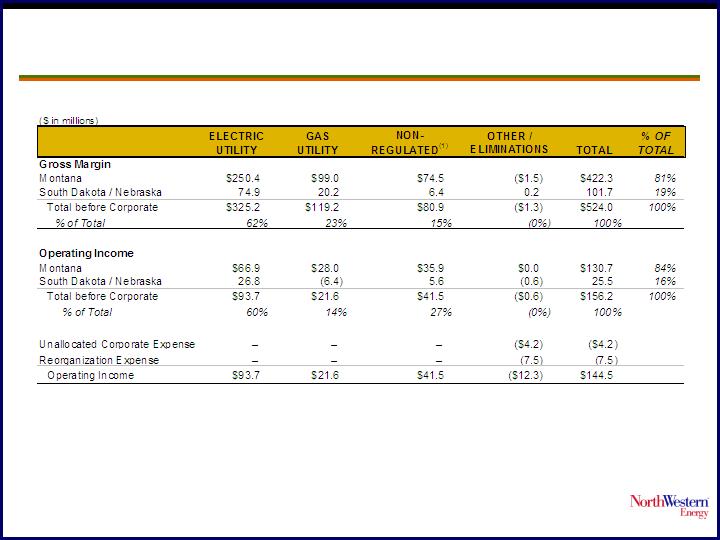
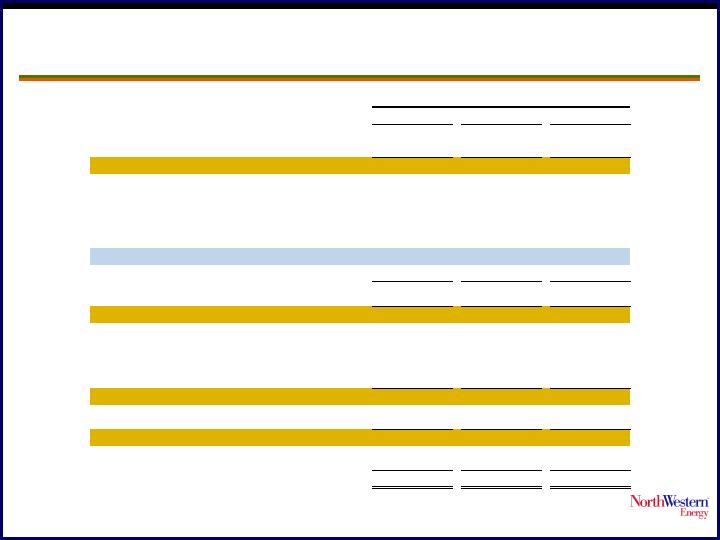
2005 Segment Financials
Source: Company reports.
(1) Includes unregulated gas and electric operations.
21
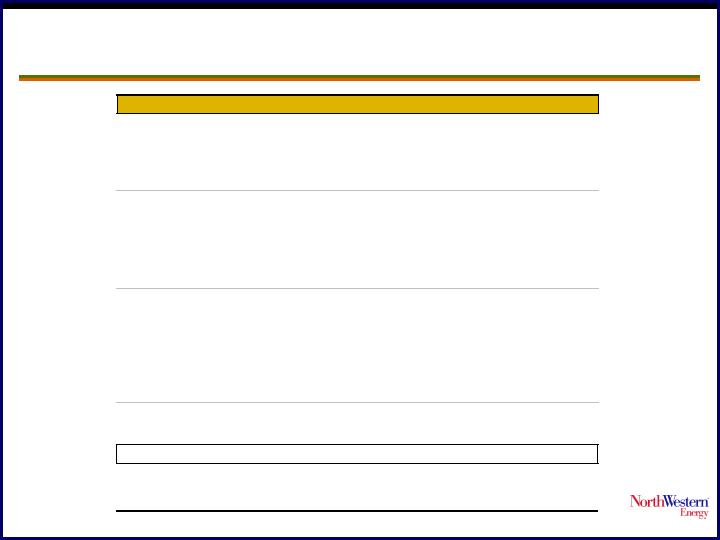
P&L Summary – 2005
* Results for 2004 combine both the predecessor and successor companies.
(000's)
2005
2004 *
B(W)
Operating Revenues
1,165,750
1,038,989
126,761
Cost of Sales
641,755
563,829
(77,926)
Gross Margin
523,995
475,160
48,835
Operating Expenses
Operating, general & administrative
225,514
221,740
(3,774)
Property and other taxes
72,087
65,135
(6,952)
Depreciation
74,413
72,848
(1,565)
Reorganization Items
7,529
(532,626)
(540,155)
Impairment on Assets held for sale
10,000
10,000
Total Operating Expenses
379,543
(162,903)
(542,446)
Operating Income
144,452
638,063
(493,611)
Interest Expense
(61,295)
(83,843)
22,548
Gain (Loss) on Debt Extinguishment
(548)
(21,310)
20,762
Investment Income and Other
17,448
3,160
14,288
Income (Loss) from Cont. Ops. Before Taxes
100,057
536,070
(436,013)
Benefit (Provision) for Income Taxes
(38,510)
6,299
(44,809)
Income (Loss) from Continuing Operations
61,547
542,369
(480,822)
Discontinued Ops., Net of Taxes
(2,080)
2,064
(4,144)
Net Income (Loss)
59,467
544,433
(484,966)
Year Ended December 31
22
Cash Flow Summary
23
($ in millions)
2005A
2004A
Net Income from Continuing Operations
$61.5
$542.4
Deferred Taxes
40.7
(3.9)
COD Income and Other Noncash Items
74.3
(450.3)
Working Capital
(26.0)
48.9
Cash Flow from Operations
$150.5
$137.1
Restricted Cash
(3.9)
9.3
Capital Expenditures
(80.9)
(80.1)
Asset Sale Proceeds
7.5
15.5
Other, net
4.7
0.2
Cash Flow from Investing
($72.5)
($55.2)
Debt Issuance Costs
(2.3)
(16.2)
Common Dividends
(35.6)
0.0
Treasury Stock
(5.6)
0.0
Debt Increase / (Decrease), net
(94.3)
(82.7)
Other, net
2.5
9.1
Cash Flow from Financing
($135.3)
($89.8)
Discontinued Operations
42.9
9.8
Increase / (Decrease) in Cash
($14.4)
$1.9
Beginning Cash
$17.1
$15.2
Ending Cash
2.7
17.1