- NWE Dashboard
- Financials
- Filings
-
Holdings
- Transcripts
- ETFs
-
Insider
- Institutional
- Shorts
-
8-K Filing
NorthWestern (NWE) 8-KRegulation FD Disclosure
Filed: 9 Oct 07, 12:00am

Morgan Stanley
Electric Utilities Corporate Access Day
October 9, 2007

forward-looking statement…
During the course of this presentation, there will be forward-
looking statements within the meaning of the “safe harbor”
provisions of the Private Securities Litigation Reform Act of
1995. Forward-looking statements often address our expected
future business and financial performance, and often contain
words such as “expects,” “anticipates,” “intends,” “plans,”
“believes,” “seeks,” or “will.”
These statements are based upon our current expectations and
speak only as of the date hereof. Our actual future business and
financial performance may differ materially and adversely from
those expressed in any forward-looking statementsAlthough our
expectations and beliefs are based on reasonable assumptions,
actual results may differ materially. The factors that may affect
our results are listed in certain of our press releases and
disclosed in the Company’s public filings with the SEC.
2

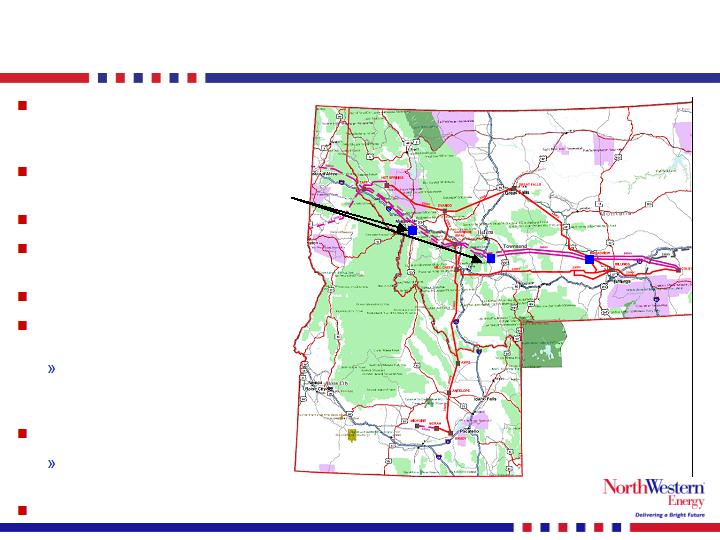
who we are…
Electric transmission lines
Natural gas distribution lines
Supplier-owned electric or natural gas lines
Electric generating plant
Natural gas storage fields
Natural gas compressor stations
(1) As of 6/30/07.
(2)
Book capitalization calculated as short-term debt plus long-
term debt plus shareholders’ equity.
640,000 customers
382,000 electric
258,000 natural gas
Approximately 123,000 square miles
of service territory in Montana,
Nebraska and South Dakota
Total Generation
MT – 222 MW – unregulated
SD – 310 MW - regulated
Total Assets: (1)$2,353 MM
Total Capitalization: (1)(2)$1,448 MM
Total Employees: (1) 1,350
3

business overview…
Regulated Operations
One of the largest providers of electricity and natural gas in the Upper Midwest and Northwest,
serving approximately 640,000 customers in Montana, South Dakota and Nebraska
Electric Operations
Montana
322,000 customers (transmission/distribution)
Revenue by customer class(1):
35% residential, 51% comm./ind., 14% other
Approximately 7,000 miles of transmission
lines and 20,700 miles of distribution lines
South Dakota
59,700 customers (integrated utility)
Revenue by customer class(1):
37% residential, 51% comm./ind.,
12% other
Approximately 3,200 miles of T&D lines
Owns 310 net MW of power generation
Gas Operations
Montana
174,000 customers (residential/commercial)
3,800 miles of underground distribution
pipelines
2,000 miles of intrastate transmission
pipelines
16.3 Bcf of gas storage
South Dakota/Nebraska
83,900 customers (residential/commercial)
2,200 miles of distribution gas mains
Unregulated Operations
Electric —222 MW - Primarily consists of a equity participation of 30% of Colstrip Unit 4,
a 740 MW coal-fired plant in Montana (portion leased/portion owned)
(1) Data as percent of total electric rate schedule revenue for 2006.
4

senior leadership…
Michael J. Hanson, President & Chief Executive Officer
Board member since May 2005
26 years utility experience
Brian B. Bird, VP & Chief Financial Officer
21 years financial management experience; 10 years energy experience
Thomas J. Knapp, VP, General Counsel and Corporate Secretary
30 years legal experience; 16 years regulatory experience
Patrick R. Corcoran, VP–Regulatory & Government Affairs
28 years regulatory experience
David G. Gates, VP–Wholesale Operations
29 years utility experience
Curtis T. Pohl, VP–Retail Operations
21 years utility experience
Bobbi L. Schroeppel, VP–Customer Care & Communications
14 years utility experience
Gregory G. A. Trandem, VP–Administrative Services
31 years utility experience
25 years utility experience on average.
5

NorthWestern’s future…
Operationally strong
Above average reliability
Award winning customer service
Financially strong
Stable earnings and cash flow profile
Approximately a 50/50 debt to total capitalization ratio
Credit metrics support Baa2/BBB unsecured credit
ratings
Utilize excess cash flow and debt capacity to
invest in the business
Organic growth in existing service territories
Gas transmission (natural gas pipes to Ethanol plants)
Electric generation opportunities (MT Legislation HB 25)
Transmission opportunities (Colstrip 500 kV upgrade and
MSTI)
6

contribution of segments - 2006…
Gross Revenue (MM) - 2006
Gross Margin (MM) - 2006
$662
$359
83
77
$329
$119
$66
$6
Note: Revenue and Gross Margin exclude $48 million and $1 million of intercompany eliminations, respectively. Revenue and Gross
Margin reported in NorthWestern’s 10-K filing of $1.1 billion and $519 million incorporate the effect of such eliminations.
Total $1.1 billion
Total $519 million
7

2007 first half financial results…
Unaudited (Dollars in 000's)
2007
2006
B(W)
Operating Revenues
626,173
593,668
32,505
Cost of Sales
360,534
337,398
(23,136)
Gross Margin
265,639
256,270
9,369
Operating Expenses
Operating, general & administrative
121,125
129,972
8,847
Property and other taxes
41,252
38,178
(3,074)
Depreciation
40,687
37,580
(3,107)
Total Operating Expenses
203,064
205,730
2,666
Operating Income
62,575
50,540
12,035
Interest Expense
(27,747)
(29,058)
1,311
Other Income
737
8,417
(7,680)
Income (Loss) from Cont. Ops. Before Taxes
35,565
29,899
5,666
Benefit (Provision) for Income Taxes
(13,989)
(11,738)
(2,251)
Income (Loss) from Continuing Operations
21,576
18,161
3,415
Discontinued Ops., Net of Taxes
-
418
(418)
Net Income (Loss)
21,576
18,579
2,997
Six Months Ended June 30,
CONSOLIDATED INCOME STATEMENT
8

2007 first half operating income - segment…
9
Y-T-D - June 2007
(in 000's)
Electric
Nat Gas
Electric
Nat Gas
Other
Total
Revenues
349,073
220,221
36,879
32,786
(12,786)
626,173
Cost of sales
(180,679)
(152,134)
(8,441)
(31,173)
11,893
(360,534)
Gross Margin
168,394
68,087
28,438
1,613
(893)
265,639
O,A & G expense
(65,339)
(34,148)
(15,904)
(713)
(5,021)
(121,125)
Property taxes
(28,644)
(10,940)
(1,635)
(26)
(7)
(41,252)
Depreciation
(30,658)
(8,057)
(1,370)
(86)
(516)
(40,687)
Operating income/(loss)
43,753
14,942
9,529
788
(6,437)
62,575
Y-T-D - June 2006
(in 000's)
Electric
Nat Gas
Electric
Nat Gas
Other
Total
Revenues
319,108
217,710
38,510
50,629
(32,289)
593,668
Cost of sales
(160,626)
(154,743)
(6,420)
(47,056)
31,447
(337,398)
Gross Margin
158,482
62,967
32,090
3,573
(842)
256,270
O,A & G expense
(66,043)
(32,555)
(20,456)
(822)
(10,096)
(129,972)
Property taxes
(26,732)
(9,586)
(1,800)
(45)
(15)
(38,178)
Depreciation
(28,963)
(7,302)
(705)
(201)
(409)
(37,580)
Operating income/(loss)
36,744
13,524
9,129
2,505
(11,362)
50,540
Regulated
Unregulated
Regulated
Unregulated

2007 first half results…
Variance Analysis: First Half Year 2007 versus First Half Year 2006
First half 2007 increased earnings from prior yearwere primarily due to higher margins, lower operating
expenses and lower interest expense. Decreased other income and higher income taxes partially offset
these increases.
Margin increases from prior yeardriven by:
Increased volumes driven by customer growth (regulated electric) and colder weather (regulated gas)
Loss recorded in 2006 as a result of stipulation with MCC (regulated electric)
Offset partially by lower market prices and higher coal cost (unregulated electric), and renegotiated
supply & services contract (unregulated gas)
Operating and Admin expense decreased from prior yeardriven by:
Lower transaction related costs pursuant to the proposed BBI acquisition
Reduced lease expense for Colstrip Unit 4 generating facility
Offset partially by: i) increased MT property tax expense over prior year due to higher valuation
assessment in MT service territory, ii) increased depreciation due to higher plant and property in
service and iii) increased expense related to restricted stock awards granted in 2006
Interest expense decreased from prior yeardue to refinancing transactions completed in 2006, partially
offset by interest on debt assumed related to the purchase of owner participant interest in a portion of the
Colstrip Unit 4 generating facility in 2007
Other income down from prior yeardue to gains recognized during 2006 related to an interest rate swap
and the sale of a partnership interest in oil and gas properties
Increase in income taxes from prior yeardue mainly to higher pre-tax income
10

historical growth – regulated electric…
Customers (000)
Volume (MWh 000)
(1)
2002 data is pro forma for full year results of Montana operations.
Actual revenues reported in 10-K included Montana results from February through December of 2002.
Volume growth rates have exceeded customer growth rates over the last few years.
(1)
11

historical growth – regulated natural gas…
Therms Sales (MM MMBtu)
(1) 2002 data is pro forma for full year results of Montana operations.
Actual revenues reported in 10-K included Montana results from February through December of 2002.
(1)
Gas volumes have decreased over the last few years as homes become more efficient.
Customers (000)
12

financial highlights…
Source: Company reports and SEC filings.
Note: Full year 2004 results show combined results for NWEC’s predecessor company from January 1, 2004 to
October 31, 2004 and for NWEC from November 1, 2004 to December 31, 2004.
(1)
Red – Relates to capital expenditures for system
(2)
Blue - Relates to investments in ethanol related pipelines
(3)
Light Red - Relates to the buy out of the Mellon lease at Colstrip Unit 4
(4)
Dark green – High end of guidance
Total Capital Expenditures (1) (2) (3)
Cash Flow from Operations (4)
($ in millions)
($ in millions)
13

Colstrip unit 4…
Coal-fired mine mouth unit constructed in 1985
778 MW (nameplate) and 740 MW (capability)
Operated by PPL Montana
Unit has wet scrubbers for particulate and sulfur dioxide removal
NWEC has a 30% undivided economic participation in Unit 4
(222 MW capability)
Supported by adequate mine mouth coal supply through the
term of the lease in 2018
NWEC's share of Colstrip 4 output has the current off take
relationships
Sale of 97 MW to Puget through 2010
Unit contingent contract
Ave price of approximately $56/MWh
Sale of 90 MW to Montana regulated electric customers until 2018
Ave price of $35.80/MWh
Sale of 35 MW on a merchant basis
Includes two offsetting (buy/sell) contracts with a net cost of
$7.66/MWh expiring in 2010
110 MW’s (netted vs. revenues)
Bankruptcy hold over
14

2007 forecasted results…
Guidance for 2007 EPS ranges from $1.45 - $1.60 share
Assumptions:
Interim rates
FERC – started June 1, 2007 (2007 impact of $3.1 million)
SDPUC and NPSC starting by Dec. 1, 2007 (2007 impact of $.3
million)
MT interim rate request of $30.4 million (annual) pending
Financial impact of interim rates on 2007 would be pro rata
and contingent on a MPSC decision
If interim rates granted in Q4 (high end of range)
No interim rates in Q4 (low end of range)
Average shares outstanding for 2007 35.6 million shares
Basic shares will be higher as a result of warrant exercises
Depends on the number of warrants exercised by Nov 1, 2007
Normal weather for the last three months of 2007
15

value drivers…
Near Term
Rate case review
Up to $57 million in revenue relief
Colstrip Unit 4 impacts
90 MW default supply contact starting 7-1-07
Bought out the Mellon lease
Intermediate Term
Continued organic growth
Customer and volume growth
Increasing rate base
Natural Gas pipeline growth – Serves the ethanol industry
Potential Generation in MT - Effect of HB 25
Colstrip Unit 4
DB buyback of 110 MW’s with net loss of $7.66/MWH expires in 2010
Puget contract expires in 2010 – 97 MW’s goes to mkt pricing
Colstrip Unit 4 cash rent relief in 2011
Long Term
Upgrade the jointly owned Colstrip 500kV transmission line
Mountain States Transmission Intertie (MSTI)
16

rate case filings…
Montana
Last case was in 2000 (test year 1999); requesting revenue increase of
approximately $41.9 million annually
FERC
Requesting revenue increase of approximately $8.6 million annually
South Dakota
Last natural gas rate case was in 1998 (test year 1997); requesting revenue
increase of approximately $3.7 million annually
Nebraska
Last natural gas rate case was in 2000 (test year 1999); requesting revenue
increase of approximately $2.8 million annually
Total revenue requests are approximately $57 million annually.
(All ’06 test years)
17

earnings potential of rate case filings…
Net earnings potential of rate base after rate requests
(A)
(B)
(A * B)
Currently
Requested
Requested
Requested
Rate Base
Authorized
Requested
Requested
Filed Debt
Capital Adj.
Capital Adj.
Requested
Net Income
in millions
ROE
ROE
Equity/Cap
Costs
Debt %
Equity %
ROR
in millions
+
=
MT Electric
667.4
$
10.75%
12.00%
51.46%
5.76%
2.80%
6.18%
8.98%
41.3
$
MT Natural Gas
264.5
$
10.75%
11.75%
51.46%
5.76%
2.80%
6.05%
8.85%
16.0
$
SD Natural Gas
53.2
$
10.25%
11.25%
51.46%
6.60%
3.20%
5.79%
8.99%
3.1
$
NE Natural Gas
25.6
$
10.25%
11.25%
51.46%
6.60%
3.20%
5.78%
8.98%
1.5
$
SD Electric
165.7
$
Total
1,176.4
$
18

timetable on rate cases…
Montana
Nov 9, 2007 – Intervenor pre-
filed testimony due
Dec 14, 2007 – Company
rebuttal to pre-filed testimony
Jan 25, 2008 – Final day of
pre-hearing memorandum
Jan 30, 2008 – Hearing begins
Feb 29, 2008 – Company
initial post hearing brief due
Mar 14, 2008 – Intervenor post
hearing brief due
Mar 21, 2008 – Company post
hearing reply due
Apr 30, 2008 – target date for
Final Order from MPSC
South Dakota
Oct 19 – Staff and intervenor
pre-filed testimony due
Nov 1 - Company rebuttal
testimony due
Nov 7 & 8, 2007 – Hearing in
Pierre, SD
Nov 28, 2007 – Target date for
Final Order from SDPUC
FERC
October 2007 –Interim rates in
effect June 1, 2007 at 100% of
the requested revenue increase
(subject to rebate).
Nov 30, 2007 – Estimated date
of settlement with FERC. Date
not a firm deadline.
If no settlement occurs - judge
determines if a hearing is
required.
Nebraska
Oct 1, 2007 –Cities hire
consultant to negotiate directly
with the three cities
Oct 14, 2007 – Original
estimated date of completing the
negotiation with the cities
Nov 14, 2007 – Modified
estimated date of completing
negotiations with the cities
Dec 1, 2007 – Interim rates
expected to be in place
Dec 15, 2007 – NPSC gets 30
days to review the settlement and
issue Final Order
19

Colstrip unit 4 impacts…
Near Term Impacts at Colstrip Unit 4:
Sale of 90 MW to Montana regulated electric
customers until 2018
Ave price of $35.80/MWh
Will reduce margins by approximately $5.9 million in 2008
($15/MWh * 90MW * 180 days * 24 hrs)
Purchased the Mellon lease for 79 MW in 2007
Net increase to pre-tax income of approximately ($3.2 for
full yr vs. $1.9 benefit in 2007) $1.3 million in 2008
Net estimated impact on 2008 compared to 2007
Approximate reductionof pre-tax incomeof $4.6 million
A reduction of $2.7 million in net incomeor $.07/share
20

intermediate term drivers…
Intermediate Term
Continued organic growth
Customer growth – 1.6% annually
Load growth in electric segment – 3.2% annually
Significant capital expenditure growth since 2005
Increasing regulated rate base
Natural Gas pipeline – Serves the growing ethanol industry
Growth in the South Dakota and Nebraska jurisdictions
Potential for capital deployment of approximately $40 million in the
next 3 years
EBITDA tends to be approximately 15% annually of the capital
expended
Potential Generation development in MT
Effect of House Bill 25 – 2007 Montana legislative session
Colstrip Unit 4
DB sale and buyback of 110 MW’s with net loss of $7.66/MWh expires
in 2010
Puget contract expires in 2010 – 97 MW’s goes to mkt pricing
Colstrip Unit 4 cash rent relief in 2011
Cash rent reduces by $11.5 million annually
GAAP rent expense remains $14.2 million annually
21

potential for generation development…
2007 Montana Legislature passed House Bill 25:
Allows ownership of rate base generation
Prior legislation didn’t allow generation in rate base
Opportunity to provide new supply options to
NorthWestern’s customers
Reduce reliance on PPL’s generation to default supply
Approximately 65% of NorthWestern’s MT default supply is contracted
with PPL
Would assist Company with ancillary service
requirements for its control area
Provides for project approval by PSC priorto
construction
Company is considering a 100 – 150 MW gas fired
generation facility for peaking/intermediate purposes
22
next steps on generation development…
Activity Timing Cumulative Cost
Economic analysis of gas fired facility Dec. 2007
Feasibility study April 2008
Begin application process June 2008
Submit application for approval with MPSC July 2008
MPSC pre-approval April 2009
“go/no go” decision April 2009 $1 million
Proceed with detailed engineering design Sept. 2008
Reserve major equipment July 2008 $12-$15 million
Construction �� April 2009
Start up and commercial operation July 2010 $100 - 125 million
23

long term drivers…
Transmission Development
Western Electricity Coordinating Council estimates 30,000 MW
of additional capacity is needed in next decade for the West
Proposed 3,000 MW’s of new generation in Montana looking for
markets
Recently 350 MW’s added in Montana
Hardin plant (coal)
Judith Gap project (wind)
Transmission network is constrained
NorthWestern planned transmission expansion
Upgrade Colstrip 500kV transmission line
500 MW increased capacity on west path from Montana
Expected cost of total project is approximately $250 million
Provides better reliability
Mountain States Transmission Intertie line
(MSTI)
Up to 1,500 MW increased capacity on southwest path from
Montana
Expected to be a $800 - $850 million capital project
24

NWE strategically located for transmission
Located between generation and customers
25
Planned western transmission projects…
Projects Route Cost
Mountain States Intertie W. Mt to Mid-Idaho (500 kV) $800-$850 million
Frontier Line 500 kV DC WY to CA $3 - $5 billion
TransWest Express 500 kV $2 - $5 billion
SouthWest Intertie Project* Idaho to Las Vegas 500 kV (500 mi.) $750M - $1.5B
Developer: LS Power
TransCanada/Northern Lts 500 kV DC – Canada to Las Vegas $1.2 - $1.8 billion
Eastern Nevada Intertie So. Nevada to Eli Center (500 kV DC) $515 million
* Would link NorthWestern’s MSTI project in Idaho to Las Vegas
26
Colstrip 500 kV upgrade…
“Traditional” pathway to
West Coast and California
markets
New substations near
Townsend and Missoula, MT
Upgrade to existing stations
No new line construction
necessary
Capacity increase: 500-700 MW
Working with other Colstrip
transmission owners
NWEC’s ownership share of
upgrade project is assumed
to be 50%
Capital cost: $250 Million
NWEC’s share dependant on
other owners participation
Assumed ROE: 10.13%
27
next steps on Colstrip 500 kV upgrade…
Activity Timing Cumulative Cost
WECC planning & path rating analysis during 2008
Agreement with BPA on rates Oct. 2008
Transmission Agreements in place Oct. 2008
Initial WECC approval Sept. 2008
“Go/no go” decision Oct. 2008 $1-2 million
Various engineering studies approved June 2009
Finish substation design July 2009
Land acquisition for sub station sites to end 2009 $20-30 million
Construction 2009-2010
Transmission upgrade in service Jan. 2011 $100-125 million
Assumes 50% ownership in the project. The costs represent NorthWestern’s pro rata portion of the
capital invested.
28
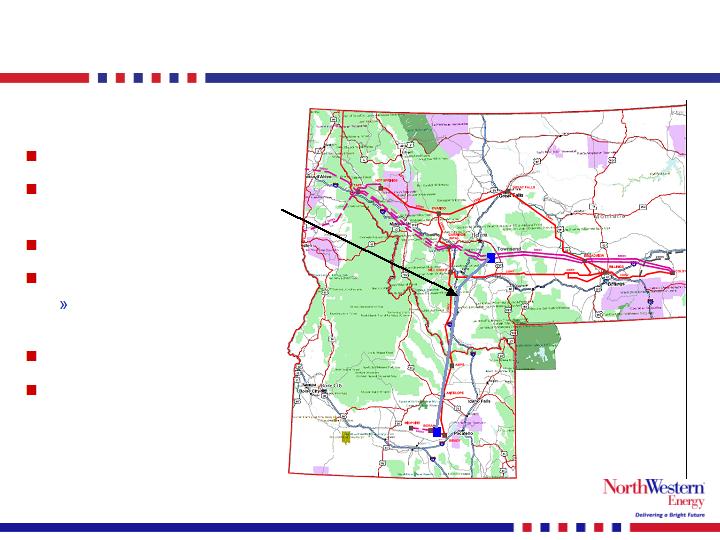
Mountain States Transmission Intertie Line…
500 kV AC Line
Southwestern Montana
to Southeastern Idaho
Length: Approx. 400 miles
Capacity: 1,500 MW
Deposits from subscribers
of approx. 1,050 MW
Capital Cost: $800 million
Assumed ROE of 13%:
ROE range on recent
FERC-regulated projects
of 9%-13.5%
29
next steps on MSTI…
Activity Timing Cumulative Cost
Conclude process of participant interest Oct. 2007
Gain support of state & federal agencies Feb. 2008
File Major Facility Siting Act Application in MT Mar. 2008
Complete project siting, permitting, and EIS Nov. 2009
Commercial contracts in place Dec. 2009
“Go/no go” decision Dec. 2009 $3-$5 million
Obtain land and right of ways June 2010 $60-$75 million
Construction 2010-2012 $715-$730 million
Test/Energize the completed Tx line Jan. 2013 $800-850 million
30
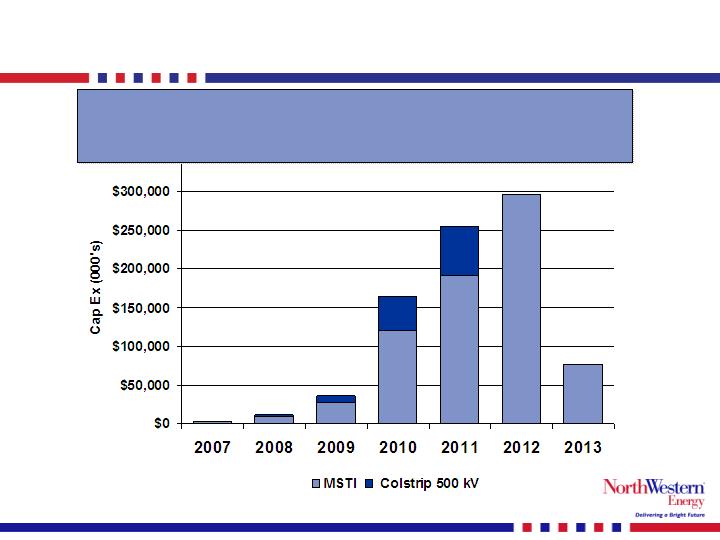
transmission growth projects capital spending…
More than $900 million of identified transmission growth
projects
(includes Colstrip 500KV upgrade at 50% ownership of new project)
31
financial objectives…
Investment grade capital structure
Currently investment grade on secured debt
Striving to achieve investment grade on unsecured debt / corporate
rating
S&P recently revised its outlook on NWEC corp. rating to positive
Long-term dividend payout of 60–70%
Quarterly dividend increase to $.33/share for September 30, 2007
Grow earnings per share
Utilize excess cash flow and debt capacity to invest in the business
Invest in organic growth in existing service territories
Invest in gas transmission (natural gas pipes to Ethanol plants)
Invest in electric generation opportunities
Invest in transmission opportunities (500 kV upgrade and MSTI)
Obtain analyst coverage
Attract analyst coverage that did not exist during sale process
32
investment highlights…
Attractive Transmission and Distribution Business
Strong, Predictable Earnings
Increasing Gross Margin, Earnings and
Free Cash Flow (Increased Dividend in Q3 ‘07)
Significant Investment Potential
Experienced Management
33