EEI Financial Conference
November 6, 2007

forward-looking statement…
During the course of this presentation, there will be forward-
looking statements within the meaning of the “safe harbor”
provisions of the Private Securities Litigation Reform Act of
1995. Forward-looking statements often address our expected
future business and financial performance, and often contain
words such as “expects,” “anticipates,” “intends,” “plans,”
“believes,” “seeks,” or “will.”
These statements are based upon our current expectations and
speak only as of the date hereof. Our actual future business and
financial performance may differ materially and adversely from
those expressed in any forward-looking statements. Although our
expectations and beliefs are based on reasonable assumptions,
actual results may differ materially. The factors that may affect
our results are listed in certain of our press releases and disclosed
in the Company’s public filings with the SEC.
2

NorthWestern today…
Company moving forward as a stand alone
company
Regulated electric and natural gas business
Strong financial profile
Poised for growth
3
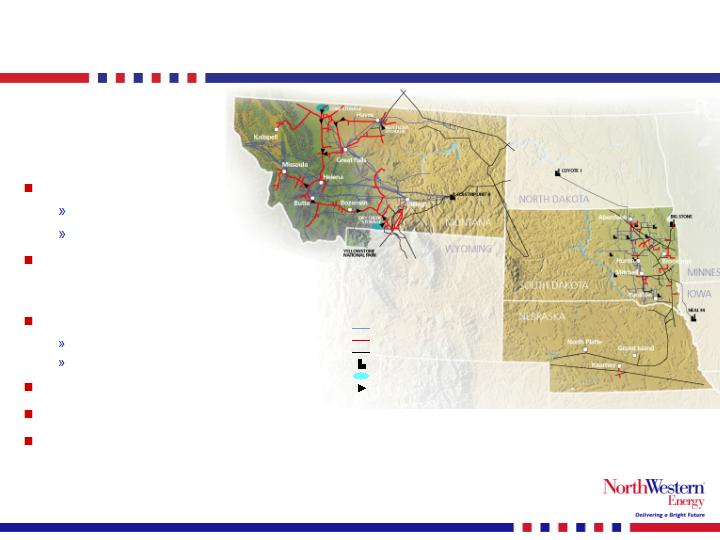
who we are…
Electric transmission lines
Natural gas distribution lines
Supplier-owned electric or natural gas lines
Electric generating plant
Natural gas storage fields
Natural gas compressor stations
(1) As of 9/30/07.
(2)
Book capitalization calculated as short-term debt plus long-
term debt plus shareholders’ equity.
640,000 customers
382,000 electric
258,000 natural gas
Approximately 123,000 square miles
of service territory in Montana,
Nebraska and South Dakota
Total Generation (all base load coal)
MT – 222 MW – unregulated
SD – 310 MW – regulated
Total Assets: (1) $2,386 MM
Total Capitalization: (1)(2) $1,445 MM
Total Employees: (1) 1,350
4
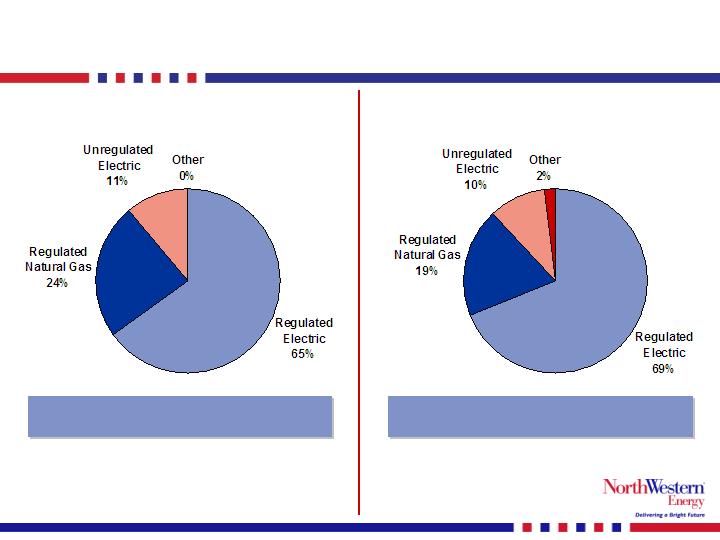
contribution of segments…
$662
$359
83
77
$119
*EBITDA = Op. Inc. + Depr
(trailing twelve months)
Gross Margin Contribution
EBITDA* Contribution
Approximately 90% of gross margin is
provided by the regulated businesses.
Approximately 90% of EBITDA is provided
by the regulated businesses.
5
poised for significant growth…
Strong balance sheet
Experienced management team to execute plan
Average 25 years of utility experience
Earnings and cash flow growth from existing businesses
Existing regulated and unregulated businesses provide
stable predictable earnings
Continued customer and load growth
Capital investments continue to increase
Only small rate increases to customers
(5%-7% of total bill or $4-$7/month-varies by jurisdiction)
Approximately $1 billion of growth capex opportunities
over the next 6 years
All state and FERC regulated projects
$1.2 billion rate base as of December 31, 2006
(88% growth potential)
6
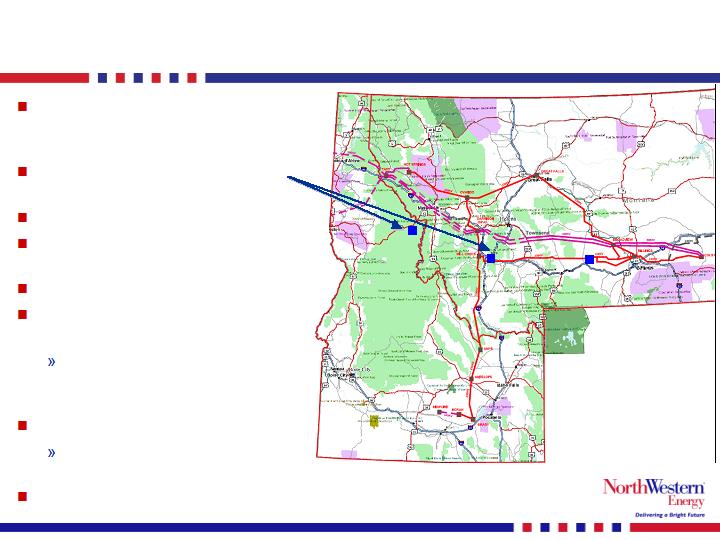
growth opportunities…
Existing Business
Service territory
Customer growth –
1.6% annually
Load growth in electric segment –
3.2% annually
Capital investments have
increased an average of
$4.2 million per year since 2004
Natural gas pipelines – serve the
growing ethanol industry
Potential for capital deployment
of approximately $40 million in
the next 3 years
Equity investment protected by
letters of credit
Growth Opportunities
Transmission development
Upgrade Colstrip 500kV
transmission line
Mountain States Transmission
Intertie line (MSTI)
Potential generation development
in Montana
Effect of House Bill 25 –
2007 Montana legislative session
7

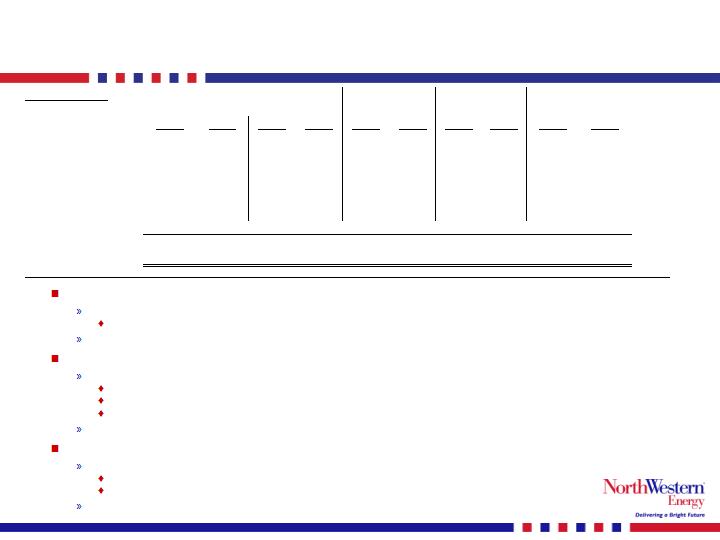
earnings/cashflow drivers – rate cases…
Montana
Requested revenue increase of approximately $41.9 million
annually
Last case was in 2000 (test year 1999)
Represents only a 6.6% increase of total bill to electric
consumers
a 3.9% increase in total bill to gas customers ($4-$5/month in
each case)
Target date of commission decision = late April 2008
FERC
Requested revenue increase of approximately $8.6 million
annually
Currently collecting the rate increase
Target date of commission decision = Spring 2008
South Dakota
Requested revenue increase of approximately $3.7 million annually
Last natural gas rate case was in 1998 (test year 1997)
Represents only a 5.7% increase in in total bill (about $7/month)
Target date of commission decision = late 2007
Nebraska
Requested revenue increase of approximately $2.8mm annually
Last natural gas rate case was in 2000 (test year 1999)
Represents only a 5.5% increase of total bill (about $6.50/month)
Target settlement date of with cities = late 2007
Rev Request = $57M
(Tax effected) X 60%
Net income on rate increases
up to $33.2M
***DISCLAIMER*** – not intended to be a prediction of the outcome.
Intended to be an estimation of value up to the requested increases.
(A)
(B)
(C)
(D)
(A*B*D)
(A*B*C)
in millions
in millions
Rate Base
Requested
Requested
Earned
'06 Earned
Requested
in millions
Cap structure
ROE
ROE
Income
Income
MT Electric
667.4
$
51.46%
12.00%
6.72%
23.1
$
41.2
$
MT Natural Gas
264.5
$
51.46%
11.75%
7.66%
10.4
$
16.0
$
SD Natural Gas
53.2
$
51.46%
11.25%
-1.58%
(0.4)
$
3.1
$
NE Natural Gas
25.6
$
51.46%
11.25%
2.70%
0.4
$
1.5
$
FERC
244.6
$
51.46%
12.00%
8.16%
10.3
$
15.1
$
43.7
$
76.9
$
8
Colstrip 500 kV upgrade…
“Traditional” pathway to
West Coast and California
markets
New substations near
Townsend and Missoula, MT
Upgrade to existing stations
No new line construction
necessary
Capacity increase: 500-700 MW
Working with other Colstrip
transmission owners
NWEC’s ownership share of
upgrade project is assumed
to be 50%
Capital cost: $250 Million
NWEC’s share dependant on
other owners participation
Assumed ROE: 10%-11%
9
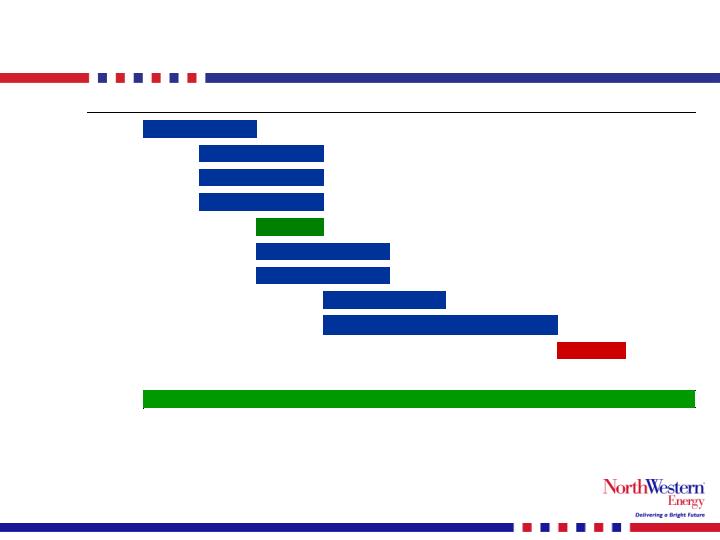
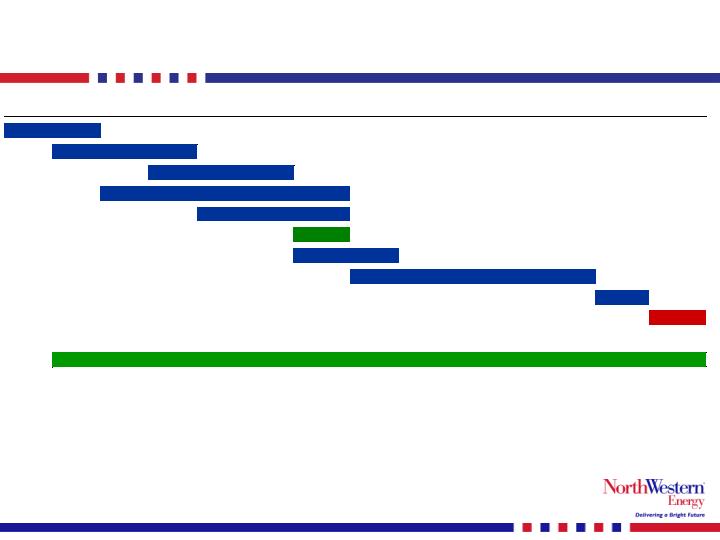
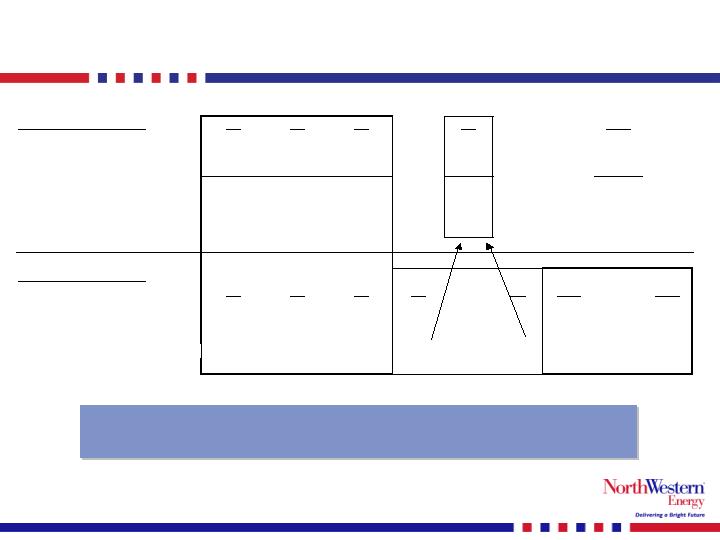
next steps on Colstrip 500 kV upgrade…
Assumes 50% ownership in the project.
The costs represent NorthWestern’s pro rata portion of the capital invested.
Go/No Go
Operation
Cumulative Dollars Spent:
$1-2M
$20-30M
$100-125M
2011
2007
2008
2009
2010
Substation design
WECC planning
Land acquisition
Construction
Engineering studies
Rates with BPA
Tx agreements
WECC approval
10
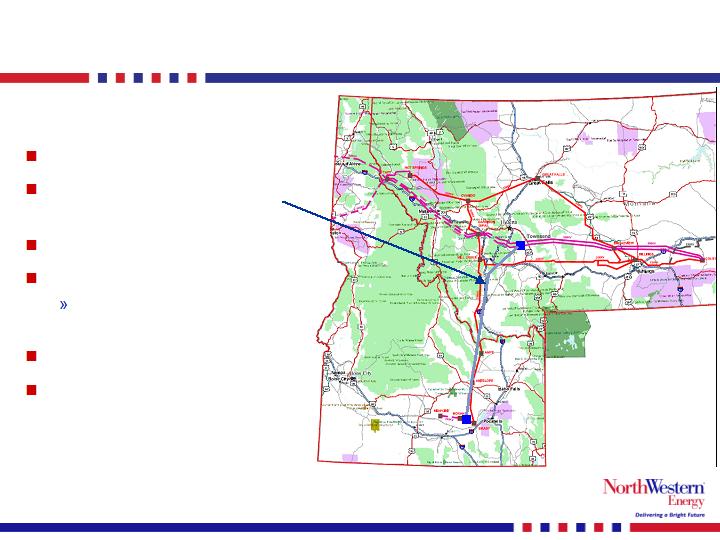
Mountain States Transmission Intertie Line…
500 kV AC Line
Southwestern Montana
to Southeastern Idaho
Length: approx. 400 miles
Capacity: 1,500 MW
Deposits from subscribers
of approx. 1,050 MW
Capital Cost: $800 million
Assumed ROE 10%-13%
11
MSTI timeline…
Go/No Go
Test
Operation
Cumulative Dollars Spent:
$3-5M
$200M
$500M
$800M
2011
2012
2013
Open Season
2007
2008
2009
2010
Rights of Way
Construction
Support of Agencies
Major facility Siting
Contracts
EIS
12
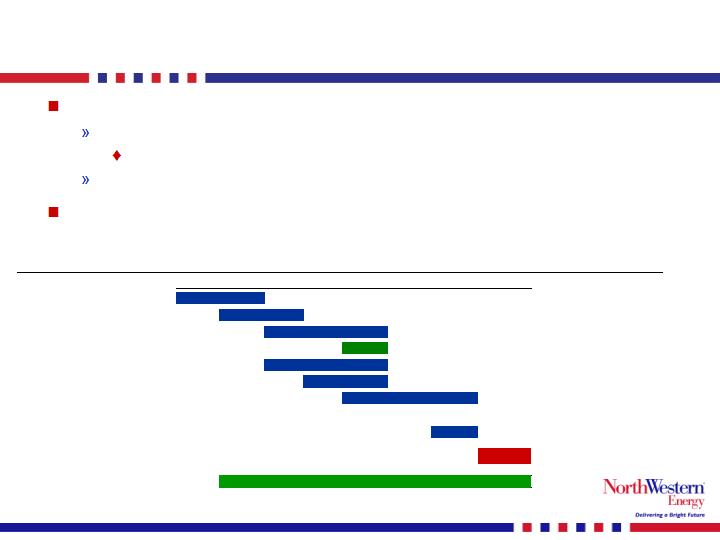
potential for generation development…
2007 Montana Legislature passed House Bill 25:
Allows ownership of rate base generation
Prior legislation didn’t allow generation in rate base
Provides for project approval by PSC prior to construction
NorthWestern is considering a 100-150 MW gas fired
generation facility for wind firming and high demand periods
Go/No Go
Testing
Operation
Cumulative Dollars Spent:
$1-2M
$12-$15M
$100-$125M
Economic analysis
2007
2008
2009
2010
Construction
Reserve equip.
Feasibility study
MPSC review process
Major engineering design
13
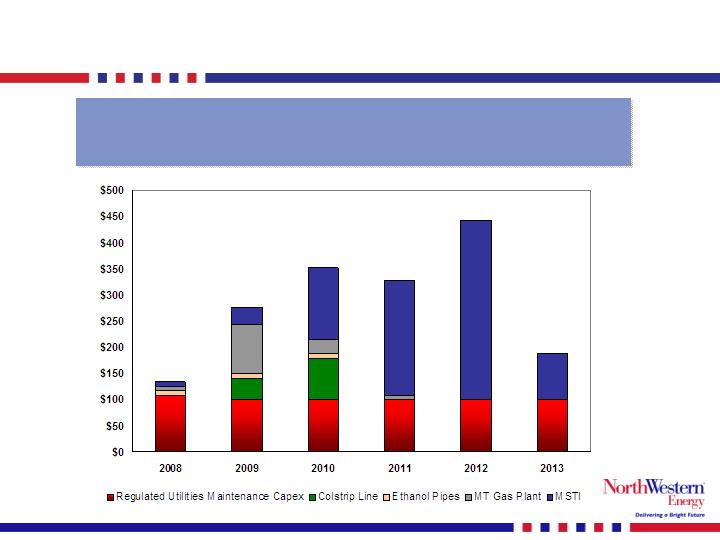
cap ex spending – next few years…
Includes more than $1 billion of potential generation
and transmission growth projects
(includes Colstrip 500KV upgrade at 50% ownership of new project)
Approximately $1.6 billion in
capital expenditures to 2013
14
value of growth potential…
Possible earnings capacity of future opportunities
Significant financial opportunity long term
(in millions)
Annual Earnings
Opportunity
On-line
MSTI transmission line
$800 million times 50% equity ratio times estimated ROE of 11%
$44.0
Jan 2013
Colstrip 500 kV transmission upgrade
$120 million times 50% equity ratio times estimated ROE of 10%
$6.0
Jan 2011
Montana Nat Gas generator
$110 million times 50% equity ratio times estimated ROE of 10%
$5.5
July 2010
Ethanol pipelines - SD/NE
$20 million times 50% equity ratio times estimated ROE of 10%
$1.0
Thru 2009
***Disclaimer*** – not intended to be guidance or a prediction of share price.
Intended to be an estimation of intrinsic value drivers of possible outcomes.
15

other value drivers…
(in millions)
NPV of
contribution
per share
GE Lease:
2011-2018 decrease of lease $11.5M/yr
$50.9
$1.30
Accretion of owner participant purchase
$15.1
$0.39
DB contract expires 12/31/2010
$15.8
$0.40
Puget contract expires 12/31/2010
$9.0
$0.23
Potential Value of NOL
NPV of NOL (net of FIN 48 reserve)
$67.5
$1.73
Other value drivers
$158.3
$4.05
All discounted at 8.46%
***Disclaimer*** – not intended to be guidance or a prediction of share price.
Intended to be an estimation of intrinsic value drivers of possible outcomes.
16

investment highlights…
Attractive Transmission and Distribution Business
Strong, Predictable Growth in Earnings
Significant Investment Potential in
Transmission and New Generation
Experienced Team Committed to
Shareholder Value
17

exhibits…
Select Financial Data
18
y-t-d 9/30/07 financial results…
Gross margin:
Driven by customer growth and warmer summer
weather
OA&G:
Lower BBI transaction costs and lease expense
2006 insurance recovery of $9.3 million
Interest expense:
Increase due to CU4 buyout and Ammundson
verdict
Taxes:
Portions of BBI expenses were not deductible
until process terminated
Gross margin:
Driven by cust. growth and favorable weather
Higher cost of sales in 2006 on $4.1 million
stipulation with MCC
OA&G:
Lower BBI transaction costs and lease expense
Offset by 2006 insurance recovery of $9.3 million
Other:
Prior year included gain on interest rate
swap of $3.8 million
Prior year included sale of oil/gas
partnership of $2.3 million
19
3Q '07
3Q '06
3Q '07
3Q '06
Gross Margin
126.8
$
123.7
$
392.5
$
380.0
$
Operating, general & admin
(93.6)
(90.2)
(296.7)
(296.0)
Operating income
33.2
33.5
95.8
84.0
Interest expense
(14.6)
(13.8)
(42.4)
(42.8)
Other income/(expense)
0.9
(0.4)
1.6
8.0
Income taxes
(6.3)
(7.9)
(20.3)
(19.7)
Disco Ops
0.4
Net Income
13.2
$
11.4
$
34.8
$
30.0
$
y-t-d
3Q '07
y-t-d 9/30/07 operating income by segment…
Regulated electric:
Improvement was due primarily to increased margins
driven by customer growth and warmer summer weather
Partially offset by higher property taxes and depreciation expense
Regulated gas:
Improvement driven by gross margin increase
primarily due to customer growth
increased transportation and storage revenue and
transferring assets from unreg gas
Partially offset by higher property taxes and depreciation expense
Unregulated electric:
Gross margin decrease
primarily due to lower contracted prices and increased coal costs
offset by increased volumes
Partially offset by lower operating costs due to lease buyout
20
Nine Month Results:
3Q '07
3Q '06
3Q '07
3Q '06
3Q '07
3Q '06
3Q '07
3Q '06
3Q '07
3Q '06
Gross Margin
260,563
$
244,923
$
88,886
$
82,132
$
42,008
$
49,138
$
1,024
$
3,800
$
392,481
$
379,993
$
Operating, general & admin
96,770
96,300
47,490
45,373
23,695
31,286
5,656
9,425
173,611
182,384
Property and other taxes
43,040
40,171
16,098
14,351
2,470
2,538
37
86
61,645
57,146
Depreciation
45,955
43,464
12,168
10,946
2,423
1,148
866
875
61,412
56,433
Operating income
74,798
$
64,988
$
13,130
$
11,462
$
13,420
$
14,166
$
(5,535)
$
(6,586)
$
95,813
$
84,030
$
Regulated
Unregulated
Total
Electric
Gas
Electric
Other
expected rest of 2007…
Company expects 4Q ’07 earnings to approximate 4Q ‘06
(excluding the impact of the Ammondson verdict on ’06 results)
21
Actual
2006 Quarterly Results:
Q1
Q2
Q3
Q4
2006
Net income
21,025
(2,446)
11,398
7,923
37,900
Ammondson verdict
11,400
11,400
Net income (
adjusted for Ammondson}
21,025
(2,446)
11,398
19,323
49,300
EPS
0.59
$
(0.07)
$
0.32
$
0.22
$
1.07
$
EPS
(adjusted for Ammondson)
0.59
$
(0.07)
$
0.32
$
0.54
$
Estimated
Estimated
2007 Quarterly Results:
Low end
High end
Low end
High end
Q1
Q2
Q3
Q4
Q4
2007
2007
Net income
19,142
2,434
13,177
18,897
21,047
53,650
55,800
EPS
0.54
$
0.07
$
0.36
$
0.51
$
0.58
$
1.45
$
1.55
$
Shares
35,720
35,998
36,471
37,000
36,000
37,000
36,000
ACTUAL RESULTS