
Investor Update
April 8, 2008

forward-looking statement …
During the course of this presentation, there will be forward-
looking statements within the meaning of the “safe harbor”
provisions of the Private Securities Litigation Reform Act of
1995. Forward-looking statements often address our expected
future business and financial performance, and often contain
words such as “expects,” “anticipates,” “intends,” “plans,”
“believes,” “seeks,” or “will.”
The information in this presentation is based upon our current
expectations as of the date hereof. Our actual future business
and financial performance may differ materially and adversely
from those expressed in any forward-looking statements. We
undertake no obligation to revise or publicly update our forward-
looking statements or this presentation for any reason. Although
our expectations and beliefs are based on reasonable
assumptions, actual results may differ materially. The factors that
may affect our results are listed in certain of our press releases
and disclosed in the Company’s public filings with the SEC.
2

who we are …
Electric transmission lines
Natural gas distribution lines
Supplier-owned electric or natural gas lines
Electric generating plant
Natural gas storage fields
Natural gas compressor stations
(1) As of 12/31/07
(2)
Book capitalization calculated as total debt, excluding capital leases, plus shareholders’ equity.
650,000 customers
388,000 electric
262,000 natural gas
Approximately 123,000 square miles
of service territory in Montana,
Nebraska and South Dakota
Total Generation (mostly base load coal)
MT – 222 MW – unregulated
SD – 312 MW – regulated
Total Assets: (1) $2,547 MM
Total Capitalization: (1)(2) $1,629 MM
Total Employees: (1) 1,350
3
business overview …
Regulated Operations (89% of Gross Margins)
One of the largest providers of electricity and natural gas in the Upper Midwest and Northwest,
serving approximately 650,000 customers in Montana, South Dakota and Nebraska
Electric Operations (65%)
Montana
328,000 customers (transmission/distribution)
Approximately 7,000 miles of transmission
lines and 21,000 miles of distribution lines
South Dakota
60,100 customers (integrated utility)
Approximately 3,200 miles of T&D lines
Owns 312 net MW of power generation
Gas Operations (24%)
Montana
177,000 customers (residential/commercial)
3,900 miles of distribution pipelines
2,000 miles of intrastate transmission
pipelines
16.2 Bcf of gas storage
South Dakota/Nebraska
84,500 customers (residential/commercial)
2,200 miles of distribution pipelines
Unregulated Operations (11%)
Electric — 222 MW - Primarily consists of an equity participation in 30% of Colstrip Unit 4,
a 740 MW coal-fired power plant in Montana
Source: NorthWestern Corporation 10-K.
4
NorthWestern’s future …
Operationally strong
Cost competitive
Above-average reliability
Award-winning customer service
Financially strong
Stable earnings and cash flow profile
Approximately a 50/50 debt to total capitalization ratio
Secured credit ratings of A-(MT) BBB+(SD) / BBB / Baa3
Unsecured credit ratings of investment grade from 2 of 3 agencies
Utilize excess cash flow and debt capacity to invest in the
business
Organic growth in existing service territories
Gas transmission (natural gas pipes to ethanol plants)
Electric generation opportunities (MT Legislation HB 25)
Transmission opportunities (Colstrip 500 kV upgrade and MSTI)
5

2007 full year results …
Unaudited (Dollars in 000's)
2007
2006
Variance
Operating Revenues
1,200,060
1,132,653
67,407
Cost of Sales
668,405
613,582
54,823
Gross Margin
531,655
519,071
12,584
Operating Expenses
Operating, general & administrative
221,566
240,215
(18,649)
Property and other taxes
87,581
74,187
13,394
Depreciation
82,415
75,305
7,110
Ammondson verdict
-
19,000
(19,000)
Total Operating Expenses
391,562
408,707
(17,145)
Operating Income
140,093
110,364
29,729
Interest Expense
(56,942)
(56,016)
(926)
Investment Income and Other
2,428
9,065
(6,637)
Income (Loss) from Cont. Ops. Before Taxes
85,579
63,413
22,166
Benefit (Provision) for Income Taxes
(32,388)
(25,931)
(6,457)
Income (Loss) from Continuing Operations
53,191
37,482
15,709
Discontinued Ops., Net of Taxes
-
418
(418)
Net Income (Loss)
53,191
37,900
15,291
Year Ended December 31,
6

segment information …
7
Unaudited (Dollars in 000's)
YTD December 31, 2007
ELECTRIC
UTILITY
GAS UTILITY
UNREGULATED
ELECTRIC
OTHER /
ELIMINATIONS
TOTAL
% OF TOTAL
Gross Margin
Montana
273,185
103,973
56,152
(207)
433,103
81%
South Dakota / Nebraska
73,791
23,653
-
1,108
98,552
19%
Total
346,976
127,626
56,152
901
531,655
100%
% of Total
65%
24%
11%
0%
100%
Operating Income
Montana
59,973
21,953
20,407
341
102,674
69%
South Dakota / Nebraska
30,719
14,114
-
297
45,130
31%
Total before Corporate
90,692
36,067
20,407
638
147,804
100%
% of Total
61%
24%
14%
0%
100%
Unallocated Corporate Expense
(7,711)
(7,711)
Operating Income
90,692
36,067
20,407
(7,073)
140,093
strong balance sheet …
Debt Ratings
(Dollars in 000's)
December 31,
2007
2006
Cash
12,773
1,930
Restricted Cash
14,482
15,836
Accounts Receivable, Net
143,482
149,793
Inventories
63,586
60,543
Other Current Assets
44,031
40,372
Goodwill
355,128
435,076
PP&E and Other Non-current Assets
1,913,898
1,692,387
Total Assets
2,547,380
$
2,395,937
$
Payables
91,588
78,739
Other Current Liabilities
209,245
192,504
Short & Long Term Capital Leases
40,391
42,462
Short & Long Term Debt
805,977
704,655
Other Non-current Liabilities
577,155
634,806
Shareholders' Equity
823,024
742,771
Total Liabilities and Equity
2,547,380
$
2,395,937
$
Short & Long Term Debt / Total Capitalization
49.5%
48.7%
8

2008 guidance bridge from 2007 results …
2008 = 2007 plus rate increases in MT, SD, NE
Estimates by the three sell side firms covering NWEC average $1.74/fully diluted share for 2008.
2008 Guidance
Reported 2007 - EPS fully diluted
1.44
$
Mid-point
Guidance for 2008 - diluted
1.60
$
1.75
$
1.68
$
Yr over yr increase
0.24
$
per share
9
Bridge to 2008:
Pre-tax
After-tax
shares o/s
Rates - MT (net of 21 MW and non-earning rate base)
0.18
$
12.1
$
7.3
$
39.5
Rates - SD
0.05
$
3.1
$
1.9
$
39.5
Rates - NE
0.02
$
1.5
$
0.9
$
39.5
Anticipated yr over yr changes
0.25
$
per share
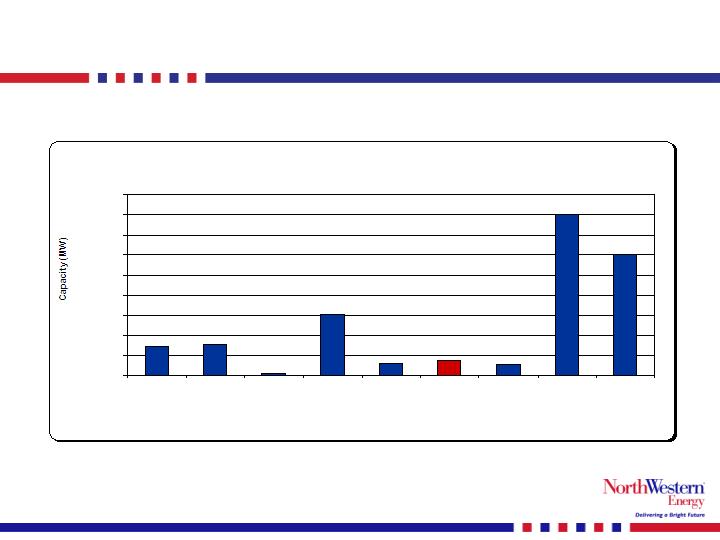
Montana proposed generation landscape …
Potential Generation Development in Montana
722
770
52
1,526
300
375
268
4,012
3,000
-
500
1,000
1,500
2,000
2,500
3,000
3,500
4,000
4,500
Coal
Gas
Hydro
Wind
MATL
In-Service
Signed
LGIA
Total
MT
Existing
Generation
10

growth project developments …
Mill Creek Generation Plant
Site selected at Mill Creek, near Anaconda, MT
Design phase
Filing expected by end of 2Q ‘08
Construction to begin upon approval
Estimated to be on-line at beginning of 2011
Approximately 120 MW of regulating capacity
Approximately $150 million project
Expandable project
Colstrip 500 KV Upgrade
NorthWestern currently assumes it will be only partner
New proposed generation mix is strong but changing
May effect the timing and the configuration of the project
Cost estimate = $200M - $250M
Estimated to be on-line beginning of 2013
11

growth project developments cont’d …
MSTI
Permitting for 500 KV line
Will scale this project to committed long term contracts
230KV, 270 mile line to move 430 MWs; cost = $250M - $300M
345KV, 370 mile line to move 800 MWs; cost = $650M - $700M
500KV, 400 mile line to move 1,500 MWs; cost = $750M - $900M
Reservations currently at 639 MW’s
Considering a strategic partner for development expertise and
equity capital
12
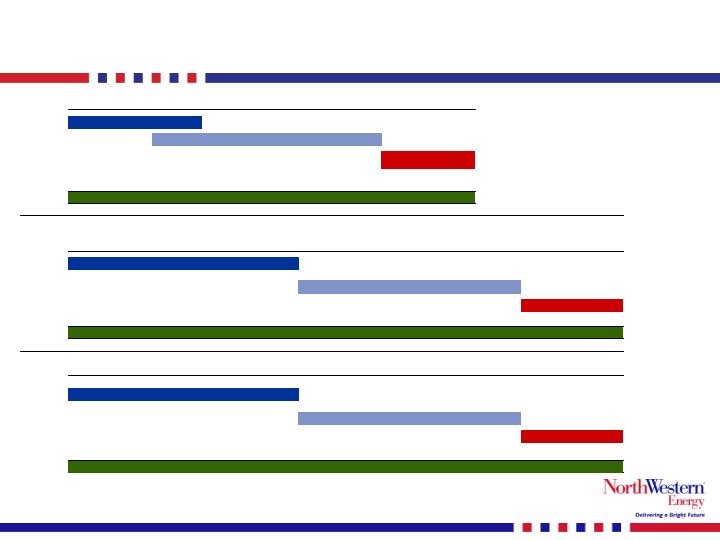
growth project timing …
Mill Creek Generation Plant
Cumulative Dollars Spent:
$4M-$5M
$100M
$150 M
Colstrip 500 KV upgrade
Cumulative Dollars Spent:
$1M-$2M
$100M
$200M-$250M
MSTI
Cumulative Dollars Spent:
$10M-$12M
$40M-$50M
$200M
$400M
$750M - $900M
Planning & Technical Studies
Construction
Planning & Technical Studies
Operation
2012
2013
Operation
Construction
Operation
2011
2011
2011
Construction
2008
2009
2010
2012
2013
2008
2009
2010
Planning
2008
2009
2010
13

growth project potential …
Timing
MSTI transmission line
500 KV scenario
37.5
$
to
45.0
$
750.0
$
to
900.0
$
Jan 2013
345 KV scenario
32.5
$
to
35.0
$
650.0
$
to
700.0
$
Jan 2013
230 KV scenario
12.5
$
to
15.0
$
250.0
$
to
300.0
$
Jan 2013
Colstrip 500 kV transmission upgrade
10.0
$
to
12.5
$
200.0
$
to
250.0
$
Jan 2013
Mill Creek Generator
Located by Anaconda, MT
6.3
$
to
7.5
$
125.0
$
to
150.0
$
Jan 2011
* For illustrative purposes = Cost of project times 50% equity ratio times estimated ROE of 10%
Cost of Project
Annual Earnings
Opportunity *
(in millions)
14

CU4 strategic alternatives update …
Credit Suisse engaged in January to help NorthWestern
evaluate strategic alternatives
Possible sale of NorthWestern’s 30% interest in CU4
Confidential Information Memorandum in market
Bids anticipated in early April 2008
Other considerations
Evaluate possible transfer to rate base
Analyze a long-term index sale to NorthWestern’s regulated
customers
Compare economics of current operations to the
alternatives considered
Timing
Decide which alternative to pursue in 2Q ’08
Execute on alternative pursued in 3Q ‘08
15

why Northwestern?
Value
Dividend yield of 5.15%
Cash taxes lower than book taxes prior to 2011
Currently trading at approximately 15x projected ’08
earnings
Strong balance sheet/credit ratings
Opportunity for Growth
Possibility of rate base growth in excess of $1 billion
Potential additional annual earnings of approximately
$50 million
16

summary …
Attractive
Transmission &
Distribution Business
Regulated electric and gas contribute 90% of gross
margins
Cost-based operating structure approved by regulatory
commissions
Increasing cash flows support growth opportunities
Stable and Predictable
Cash Flow
Strong Balance Sheet
Current Value with
Potential for Growth
Conservative capital structure provides increased
flexibility
Improving credit ratings
Dividend yield of 5.15%
Trading at low multiple of ’08 earnings
Identified projects providing opportunity for rate
base/earnings growth
Regional T&D utility with stable customer growth
Attractive mix of electric and natural gas customers
Reliable and cost competitive operations
17