Annual Meeting
of Stockholders
New York Marriott Downtown Hotel
May 21, 2008

forward-looking statement…
During the course of this presentation, there will be forward-
looking statements within the meaning of the “safe harbor”
provisions of the Private Securities Litigation Reform Act of
1995. Forward-looking statements often address our expected
future business and financial performance, and often contain
words such as “expects,” “anticipates,” “intends,” “plans,”
“believes,” “seeks,” or “will.”
The information in this presentation is based upon our current
expectations as of the date hereof. Our actual future business and
financial performance may differ materially and adversely from
those expressed in any forward-looking statements. We undertake
no obligation to revise or publicly update our forward-looking
statements or this presentation for any reason. Although our
expectations and beliefs are based on reasonable assumptions,
actual results may differ materially. The factors that may affect our
results are listed in certain of our press releases and disclosed in
the Company’s public filings with the SEC.
2

stated objectives upon emergence…
Focus on core transmission and distribution
business
Resolve outstanding bankruptcy litigation
Asset sales of unregulated businesses
Attain investment grade rating
Develop strategy to redeploy excess free
cash flow
.
3
then – and now…
*Evaluating strategic alternatives on our ownership in Colstrip Unit 4.
(in thousands except otherwise indicated)
At emergence
Currently
Operations
# Unregulated Businesses (units)
4
1 *
# Of Customers
617.2
649.6
Annual Volumes
Electric (thousands of megawatt hours)
9,228
9,952
Natural Gas (thousands dekatherms)
28,886
28,894
Annual Capital Expenditures
$80,100
$117,000
Financial:
Book Value of Company
$709,335
$834,428
Annual Interest Expense
$83,843
$56,942
Secured Debt Rating
Sub Investment Grade
Investment Grade
Unsecured Debt Rating
Not rated
LT Debt to Total Capital Ratio
51.84%
47.58%
Annual Dividend per Share
–
$1.32
Listing Exchange
NASDAQ
NYSE
2 of 3 at
investment grade
4
environmental stewardship…
Montana
Sediment removal at Milltown Dam
Dam spillway was removed in 2008
River is free flowing
Have met current Renewable Portfolio Standards
Seeking new sources of wind power to meet state
requirements for 2010 and 2015
South Dakota
Reclamation of century old manufactured gas plant in
Aberdeen, SD
Coal tar removed in Moccasin Creek
Request for proposal issued in November 2007 for wind
power to meet increasing electric demand
.
Significant reduction of environmental issues.
5

financial results – 2007 income…
(Dollars in 000's)
2007
2006
Variance
% Change
Operating Revenues
1,200,060
1,132,653
67,407
Cost of Sales
668,405
613,582
54,823
Gross Margin
531,655
519,071
12,584
2.4%
Operating Expenses
Operating, general & administrative
221,566
240,215
(18,649)
Property and other taxes
87,581
74,187
13,394
Depreciation
82,415
75,305
7,110
Ammondson verdict
-
19,000
(19,000)
Total Operating Expenses
391,562
408,707
(17,145)
-4.2%
Operating Income
140,093
110,364
29,729
26.9%
Interest Expense
(56,942)
(56,016)
(926)
Investment Income and Other
2,428
9,065
(6,637)
Income (Loss) from Cont. Ops. Before Taxes
85,579
63,413
22,166
Benefit (Provision) for Income Taxes
(32,388)
(25,931)
(6,457)
Income (Loss) from Continuing Operations
53,191
37,482
15,709
Discontinued Ops., Net of Taxes
-
418
(418)
Net Income (Loss)
53,191
37,900
15,291
40.3%
Year Ended December 31,
6

financial results – 2007 balance sheet…
Debt Ratings
Unaudited (Dollars in 000's)
December 31,
2007
2006
Cash
12,773
1,930
Restricted Cash
14,482
15,836
Accounts Receivable, Net
143,482
149,793
Inventories
63,586
60,543
Other Current Assets
44,031
40,372
Goodwill
355,128
435,076
PP&E and Other Non-current Assets
1,913,898
1,692,387
Total Assets
2,547,380
$
2,395,937
$
Payables
91,588
78,739
Other Current Liabilities
209,245
192,504
Long & Short Term Capital Leases
40,391
42,462
Long & Short Term Debt
805,977
704,655
Other Non-current Liabilities
577,155
634,806
Shareholders' Equity
823,024
742,771
Total Liabilities and Equity
2,547,380
$
2,395,937
$
Long & Short Term Debt / Total Capitalization
49.5%
48.7%
7
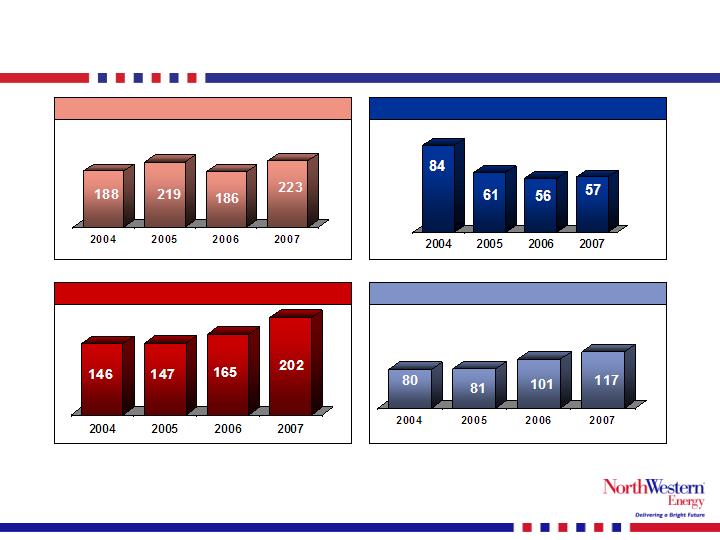
Source: Company reports and SEC filings.
Note: Full year 2004 results show combined results for NorthWestern’s predecessor company from January 1, 2004 to
October 31, 2004 and for NorthWestern from November 1, 2004 to December 31, 2004.
(1) EBITDA is calculated as total operating income plus depreciation. For 2004, EBITDA excludes reorganization items
and impairment on asset sales.
(2) Excludes cash used in acquisitions.
financial highlights…
EBITDA(1)
Interest Expense
Cash Flow from Operations
Capital Expenditures(2)
($ in millions)
($ in millions)
($ in millions)
($ in millions)
8
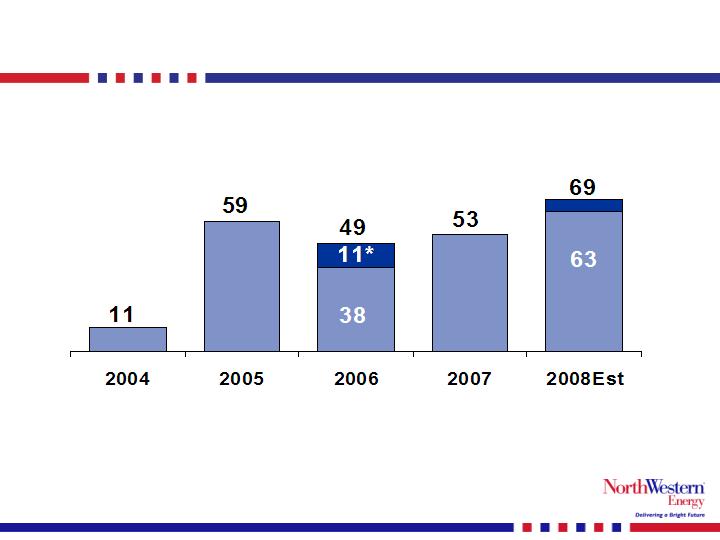
Source: Company reports and SEC filings.
Note: Full year 2004 results show combined results for NorthWstern’s predecessor company from January 1, 2004 to
October 31, 2004 and for NorthWestern from November 1, 2004 to December 31, 2004 and excludes debt
extinguishment income.
*Impact of Ammondson litigation.
earnings trend…
($ in millions)
Net Income
9
drivers to improve near term earnings…
Current rate case relief
Rate cases approved in South Dakota and Nebraska
Settled natural gas rate case with a base rate increase of
$4.6 million annually beginning December 1, 2007
FERC
Awaiting FERC approval of proposed settlement in the
transmission rate case with a margin increase of approximately
$3.0 million annually
Montana
Proposed settlement in electric and natural gas rate case with a
base rate increase of $15 million annually
Anticipate response from the MPSC by the first half of 2008
Magten settlement pending
Provides approximately $4 million payment to NorthWestern
for past legal fees
Stops legal fees to defend
.
Earnings Per Share Guidance for 2008: $1.60 to $1.75 per diluted share.
10
2008 1Q results…
(000's)
2008
2007
B(W)
% Change
Operating Revenues
385,975
366,565
19,410
5.3%
Cost of Sales
229,084
219,278
(9,806)
-4.5%
Gross Margin
156,891
147,287
9,604
6.5%
Operating Expenses
Operating, general & administrative
60,071
62,448
2,377
3.8%
Property and other taxes
23,640
20,592
(3,048)
-14.8%
Depreciation
21,091
19,894
(1,197)
-6.0%
Total Operating Expenses
104,802
102,934
(1,868)
-1.8%
Operating Income
52,089
44,353
7,736
17.4%
Interest Expense
(16,080)
(13,220)
(2,860)
21.6%
Investment Income and Other
662
378
284
75.1%
Income (Loss) from Cont. Ops. Before Taxes
36,671
31,511
5,160
16.4%
Benefit (Provision) for Income Taxes
(13,220)
(12,369)
(851)
6.9%
Net Income (Loss)
23,451
19,142
4,309
22.5%
Three Months Ended March 31,
11
delivering a bright future…
Operationally strong
Above-average reliability
Award-winning customer service
ServiceOne award for fourth consecutive year
Financially strong
Steady earnings growth
Superior cash flows
Consistent credit rating increases over past few years
Well positioned for future
Very strong balance sheet
Strong operational core competency
Significant growth opportunity
VISION: To be the top performing utility in our region.
12
generation growth highlights…
Mill Creek Generating Unit in Montana
What: 120-150 MW – built for regulation services to balance supply and load
Why: Existing services are becoming more expensive and scarce
South Dakota Peaking Generation
What: Construction of two 45 MW combustion turbines – one unit in Mitchell
and the second in Aberdeen
Why:
To meet rapidly increasing peak demand within our South Dakota service territory
Load growth projections for 2008-2010 are 15% versus historical 1%-2%
South Dakota’s peaking contract with MidAmerican Energy expires in 2009 with no
option of renewal and replacement contracts are not available in the region
South Dakota Base Load Generation
What: Evaluate ownership participation in regional coal-based plants that are
currently permitted and under development
Why:
Increased demand for energy in our South Dakota service territory.
Load forecasts for 2008-2010 are 15% versus a historical 1%-2% annual
growth rate
13
transmission growth highlights…
500 KV Upgrade and Collector System in Montana
What:
Upgrade the existing Colstrip 500 kV line to add approximately
500 to 600 MW of additional transfer capability
Construction of a 230 kV line from Great Falls to Three Rivers that will tie
into MSTI at the new Townsend substation
Why: To meet growing demand for transmission capacity related to
new generation sources within and out of Montana
Mountain States Transmission Intertie (“MSTI”)
What: Construction of a new 500 kV line from Southwest Montana to
central Idaho
Why: To meet growing demand for transmission service from
customers and relieve congestion and constraints on the high-
voltage transmission system in the region
14
distribution growth highlights…
South Dakota/Nebraska Natural Gas
Pipeline Expansions
What:
Potential acquisition of a South Dakota pipeline
Upgrade that pipeline for POET, Big Stone Ethanol expansion in SD ($10.5M)
Construction of a 44-mile pipeline from Trailblazer pipeline to Grand Island,
Nebraska and the St. Paul Ethanol Plant ($30M)
Why: Meet growing demand by ethanol plants for natural gas
Organic Growth
What: Currently our maintenance capital expenditures exceed our
depreciation by about $20 million annually
Why: Meet the organic growth of the communities we serve
15

growth project potential…
Opportunity to nearly double the rate base and earnings over the next few years.
Timing
Mill Creek Generator
7.5
$
to
10.0
$
150.0
$
to
200.0
$
Jan 2011
South Dakota Peaking generation
3.8
$
to
4.5
$
75.0
$
to
90.0
$
Jan 2011
South Dakota Baseload generation
6.3
$
to
10.0
$
125.0
$
to
200.0
$
Jan 2014
Natural Gas Pipeline Extensions
1.0
$
to
2.0
$
20.0
$
to
40.0
$
Thru 2009
MSTI transmission line
500 KV scenario
37.5
$
to
45.0
$
750.0
$
to
900.0
$
Jan 2013
345 KV scenario
32.5
$
to
35.0
$
650.0
$
to
700.0
$
Jan 2013
230 KV scenario
12.5
$
to
15.0
$
250.0
$
to
300.0
$
Jan 2013
Colstrip 500 kV transmission upgrade
10.0
$
to
12.5
$
200.0
$
to
250.0
$
Jan 2013
* For illustrative purposes = Cost of project times 50% equity ratio times estimated ROE of 10%
Cost of Project
Annual Earnings
Opportunity *
(in millions)
16
Northwestern – value and growth…
Montana regulatory clarity forthcoming
General rate case stipulation
Montana Consumer Council request for investigation
related to bankruptcy stipulation
Colstrip Unit 4
Value
Dividend yield of 5.4%
Currently trading at approximately 1.1x book value
Opportunity for Growth
Possibility of rate base growth in excess of $1 billion
Potential additional annual earnings of approximately
$50 million by 2013
Strong balance sheet and credit ratings to fund
growth projects
17
Colstrip Unit 4 strategic alternatives…
Options under consideration
Sale of the plant
Retain plant and place into rate base
Retain plant as unregulated
Next steps
Complete strategic review to maximize value of
the asset
Complete the bid process related to sale option
Work with regulators to determine viability of
rate base option
Expect resolution in third quarter 2008
18

summary…
Objectives achieved
related to focus on
core business
Superior cash flows
Strong balance sheet
Investment grade rated debt
Poised for growth
Solid foundation
Excellent Growth
Prospects
Unique geographic location to expand electric
and natural gas infrastructure
Increasing need to move energy through our
service area
Identified projects providing opportunity to nearly
double rate base and earnings
Nearly all consolidated earnings from regulated
business
Rate relief received in all jurisdictions
Outstanding bankruptcy litigation nearly completed
Attained investment grade ratings
19
