
Investor Update
July 22, 2008

forward-looking statement…
During the course of this presentation, there will be forward-
looking statements within the meaning of the “safe harbor”
provisions of the Private Securities Litigation Reform Act of
1995. Forward-looking statements often address our expected
future business and financial performance, and often contain
words such as “expects,” “anticipates,” “intends,” “plans,”
“believes,” “seeks,” or “will.”
The information in this presentation is based upon our current
expectations as of the date hereof. Our actual future business and
financial performance may differ materially and adversely from
those expressed in any forward-looking statements. We undertake
no obligation to revise or publicly update our forward-looking
statements or this presentation for any reason. Although our
expectations and beliefs are based on reasonable assumptions,
actual results may differ materially. The factors that may affect our
results are listed in certain of our press releases and disclosed in
the Company’s public filings with the SEC.

who we are…
Electric transmission lines
Natural gas distribution lines
Supplier-owned electric or natural gas lines
Electric generating plant
Natural gas storage fields
Natural gas compressor stations
(1) As of 12/31/07
(2)
Book capitalization calculated as total debt, excluding capital leases, plus shareholders’ equity.
650,000 customers
388,000 electric
262,000 natural gas
Approximately 123,000 square miles
of service territory in Montana,
Nebraska and South Dakota
Total Generation (mostly base load coal)
MT – 222 MW – unregulated
SD – 312 MW – regulated
Total Assets: (1) $2,547 MM
Total Capitalization: (1)(2) $1,629 MM
Total Employees: (1) 1,350

business overview…
Regulated Operations (89% of Gross Margins)
One of the largest providers of electricity and natural gas in the Upper Midwest and Northwest,
serving approximately 650,000 customers in Montana, South Dakota and Nebraska
Electric Operations (65%)
Montana
328,000 customers (transmission/distribution)
Approximately 7,000 miles of transmission
lines and 21,000 miles of distribution lines
South Dakota
60,100 customers (integrated utility)
Approximately 3,200 miles of T&D lines
Owns 312 net MW of power generation
Gas Operations (24%)
Montana
177,000 customers (residential/commercial)
3,900 miles of distribution pipelines
2,000 miles of intrastate transmission
pipelines
16.2 Bcf of gas storage
South Dakota/Nebraska
84,500 customers (residential/commercial)
2,200 miles of distribution pipelines
Unregulated Operations (11%)
Electric — 222 MW - Primarily consists of an equity participation in 30% of Colstrip Unit 4,
a 740 MW coal-fired power plant in Montana
Source: NorthWestern Corporation 2007 10-K.

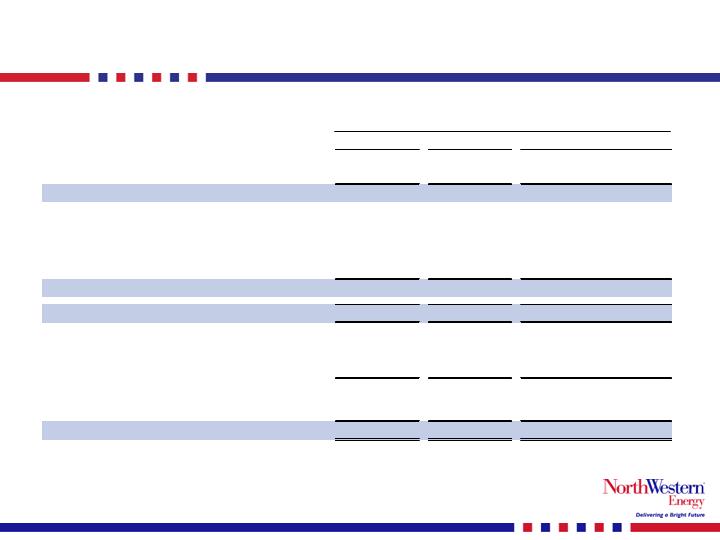
2007 segment information…
Unaudited (Dollars in 000's)
YE Dec 31, 2007
ELECTRIC
UTILITY
GAS
UTILITY
UNREGULATED
ELECTRIC
OTHER /
ELIMINATIONS
TOTAL
Gross Margin
346,976
127,626
56,152
901
531,655
% of Total
65%
24%
11%
0%
Operating Income
90,692
36,067
20,407
(7,073)
140,093
% of Total
65%
26%
15%
-5%
Net Income
33,730
14,599
10,274
(5,412)
53,191
% of Total
63%
27%
19%
-10%
2008 1Q results…
(000's)
2008
2007
B(W)
% Change
Operating Revenues
385,975
366,565
19,410
5.3%
Cost of Sales
229,084
219,278
(9,806)
-4.5%
Gross Margin
156,891
147,287
9,604
6.5%
Operating Expenses
Operating, general & administrative
60,071
62,448
2,377
3.8%
Property and other taxes
23,640
20,592
(3,048)
-14.8%
Depreciation
21,091
19,894
(1,197)
-6.0%
Total Operating Expenses
104,802
102,934
(1,868)
-1.8%
Operating Income
52,089
44,353
7,736
17.4%
Interest Expense
(16,080)
(13,220)
(2,860)
21.6%
Investment Income and Other
662
378
284
75.1%
Income (Loss) from Cont. Ops. Before Taxes
36,671
31,511
5,160
16.4%
Benefit (Provision) for Income Taxes
(13,220)
(12,369)
(851)
6.9%
Net Income (Loss)
23,451
19,142
4,309
22.5%
Three Months Ended March 31,
Source: Company reports and SEC filings.
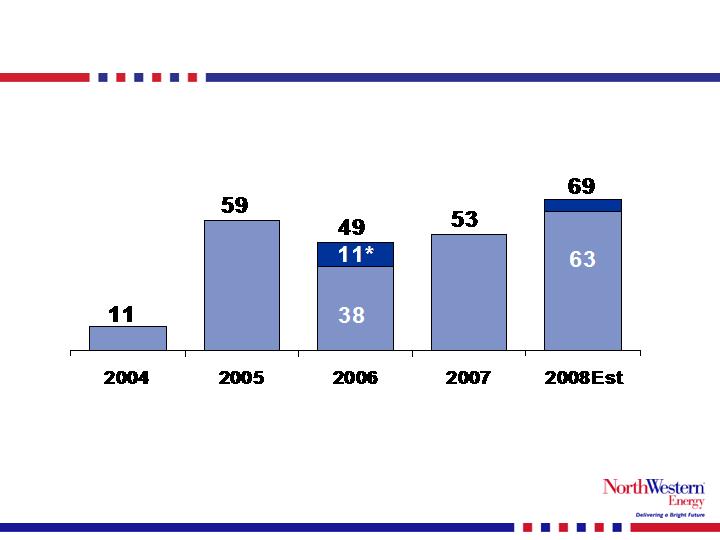
Note: Full year 2004 results show combined results for NorthWestern's predecessor company from January 1, 2004 to
October 31, 2004 and for NorthWestern from November 1, 2004 to December 31, 2004 and excludes debt
extinguishment income.
*Impact of Ammondson litigation.
earnings trend…
($ in millions)
Net Income

strong balance sheet…
Debt Ratings
Unaudited (Dollars in 000's)
March 31
December 31
2008
2007
Cash
33,755
12,773
Restricted Cash
13,904
14,482
Accounts Receivable, Net
142,280
143,482
Inventories
29,579
63,586
Other Current Assets
51,619
44,031
Goodwill
355,128
355,128
PP&E and Other Non-current Assets
1,922,041
1,913,898
Total Assets
2,548,306
$
2,547,380
$
Payables
65,989
91,588
Other Current Liabilities
234,642
209,245
Long & Short Term Capital Leases
39,877
40,391
Long & Short Term Debt
776,212
805,977
Other Non-current Liabilities
597,158
577,155
Shareholders' Equity
834,428
823,024
Total Liabilities and Equity
2,548,306
$
2,547,380
$
Long & Short Term Debt / Total Capitalization
48.2%
49.5%

2008 guidance bridge from 2007 results…
2008 = 2007 plus rate increases in MT, SD, NE
* Estimates by the three sell side firms covering NWEC average $1.71/fully diluted share for 2008.
2008 Guidance
Reported 2007 - EPS fully diluted
1.44
$
Mid-point
Guidance for 2008 - diluted
1.60
$
1.75
$
1.68
$
Yr over yr increase
0.24
$
per share
Bridge to 2008:
Rates - MT
0.23
$
Rates - FERC
0.01
$
Rates - SD
0.04
$
Rates - NE
0.02
$
Anticipated reduction to CU4 earnings in 2008
(0.04)
$
Anticipated yr over yr changes
0.26
$
per share
NorthWestern’s future…
Operationally strong
Cost competitive
Above-average reliability
Award-winning customer service
Financially strong
Steady earnings growth
Strong cash flows
Approximately a 50/50 debt to total capitalization ratio
Secured credit ratings of A-(MT) BBB+(SD) / BBB / Baa2
Unsecured credit ratings of investment grade from Moody’s, S&P, Fitch
Utilize excess cash flow and debt capacity to invest in the business
Organic growth in existing service territories
Electric generation opportunities in Montana and South Dakota
Electric transmission opportunities (Colstrip 500 kV upgrade and MSTI)
Gas transmission expansion in Nebraska and South Dakota
generation growth highlights…
Mill Creek Generating Unit in Montana
What: 120-150 MW – built for regulation services to balance supply and load;
estimated to cost around $200 million to complete
Why: Existing services are becoming more expensive and scarce
Anticipated 3Q 2008 filing with the MPSC
South Dakota Peaking Generation
What: Construction of two 45 MW combustion turbines – one unit in Mitchell
and the second in Aberdeen; estimated to cost approx. $80-$90 million
Why:
To meet rapidly increasing peak demand within our South Dakota service territory
Load growth projections for 2008-2010 are 15% versus historical 1%-2%
South Dakota’s peaking contract with MidAmerican Energy expires in 2009 with no
option of renewal and replacement contracts are not available in the region
South Dakota Base Load Generation
What: Evaluate ownership participation in regional coal-based plants that are
currently permitted and under development
Why:
Increased demand for energy in our South Dakota service territory.
Load forecasts for 2008-2010 are 15% versus a historical 1%-2% CAGR
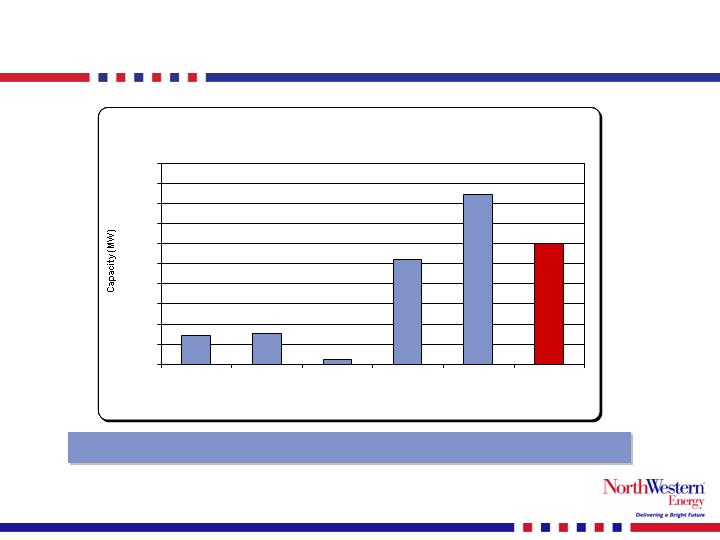
Montana proposed generation landscape…
New transmission is needed to support new generation
Potential Generation Development in Montana
722
770
116
2,606
4,213
3,000
-
500
1,000
1,500
2,000
2,500
3,000
3,500
4,000
4,500
5,000
Coal
Gas
Hydro
Wind
Total
MT Existing
Generation
transmission project developments…
Colstrip 500 KV Upgrade
NorthWestern may partner with others on the project
Renewed interest by certain of the other line owners
Significant proposed generation but mix is changing
May effect the timing and the configuration of the project
Looking to make the upgrade a “wind collector system”
Represents a change in scope of the project
Cost estimate of entire project = $200M - $250M
Inclusive of the collector system
Estimated to be on-line beginning of 2013
transmission project developments cont’d…
MSTI
Permitting for 500 KV line
Will scale this project to committed long term contracts
230KV, 270 mile line to move 430 MWs; cost = $250M - $300M
345KV, 370 mile line to move 800 MWs; cost = $650M - $700M
500KV, 400 mile line to move 1,500 MWs; cost = $750M - $900M
Major Facility Siting Act (MFSA) Application filed with Mont.
Department of Environmental Quality (MDEQ) in July 2008
Environmental review process takes about 2 years
Environmental review to be submitted to BLM in July 2008
Construction begins after environmental review
Indications of interest currently at 639 MW
Considering strategic partnering

distribution growth highlights…
South Dakota/Nebraska Natural Gas
Pipeline Expansions
What:
Potential acquisition of a South Dakota pipeline
Upgrade that pipeline for POET, Big Stone Ethanol expansion in SD ($10.5M)
Construction of a 44-mile pipeline from Trailblazer pipeline to Grand Island,
Nebraska and the St. Paul Ethanol Plant ($30M)
Why: Meet growing demand by ethanol plants for natural gas
Organic Growth
What: Currently our maintenance capital expenditures exceed our
depreciation by about $20 million annually
Why: Meet the organic growth of the communities we serve

growth project potential…
Current Estimated
Estimated
Timing
Mill Creek Generation Station
8.8
$
to
10.0
$
175.0
$
to
200.0
$
Jan 2011
South Dakota Peaking generation
3.8
$
to
4.5
$
75.0
$
to
90.0
$
Jan 2011
South Dakota Baseload generation
6.3
$
to
10.0
$
125.0
$
to
200.0
$
Jan 2014
Natural Gas Pipeline Extensions
1.0
$
to
2.0
$
20.0
$
to
40.0
$
Thru 2009
MSTI transmission line
(500 kV scenario)
37.5
$
to
45.0
$
750.0
$
to
900.0
$
Jan 2013
Colstrip 500 kV transmission upgrade
10.0
$
to
12.5
$
200.0
$
to
250.0
$
Jan 2013
* For illustrative purposes = Cost of project times 50% equity ratio times estimated ROE of 10%
Cost of Project
Annual Earnings
Opportunity *
(in millions)
Colstrip Unit 4 update…
Announced proposed transaction with Bicent on June 10, 2008
Proposal to pay NorthWestern $404 million in cash
Offer for the balance of plant (111 MW to 222 MWs) to NorthWestern at price
of Mid C minus $3/MWh from Nov 2010 to Dec 2020
Offer for an additional 50 MW to NorthWestern at price below Mid C from
Nov 2010 to Dec 2020
Allows NorthWestern the ability to work with interested parties on the
viability of placing into rate base at economics similar to the Bicent proposal
Submitted filing to rate base on June 27, 2008
Filed for $407 million into rate base ($404M + $6.25M break up fee - $3.25M
avoided transaction cost)
Requested cap structure = 50% debt/50% equity
Requested authorized ROE = 10.75%
Procedural schedule set by MPSC shows an October 2008 decision
Either conclusion is good news
If sold, capital infusion for growth projects and/or share repurchase
If rate based at requested structure, annual earnings potential of $21.8 M
2007 earnings at CU4 = $10.3 million
Consistent with NWE’s strategy to be a purely regulated entity
NorthWestern scorecard…
What we said at EEI (Nov 6, 2007) –
Rate case revenue opportunity
up to $57 million annually
Natural Gas generation for wind
firming in Montana
$110 million project
Completion expected July 2010
Colstrip 500 kV upgrade
$125 million project
Completion expected Jan 2011
MSTI
500 kV line
$800 million project
Completion expected Jan 2013
What occurred since then –
Rate increases approved
of approx. $21 million annually
Mill Creek site selected
$175 -$200 million project
Completion expected Jan 2011
Application with MPSC est. 3Q ‘08
Colstrip 500 kV upgrade
Wind collection system (scope change)
$200 - $250 million project
Completion expected 2013
MSTI
Between 230 kV and 500 kV line
$250 million - $900 million project
Completion expected 2013
Steady progress at the Company
NorthWestern scorecard cont’d…
What we said at EEI (Nov 6, 2007) –
GE Lease opportunity
Colstrip Unit 4
Reprice opportunity approx. $23 million
Earnings Guidance for 2007
$1.45 - $1.50 share
37 million shares outstanding
Ending Stock price – November 5, 2007
$27.14
Ending index value – November 5, 2007
DJU = 529.58
UTY = 565.88
What occurred since then –
GE Lease bought out
Approx $4 million annual savings
Colstrip Unit 4
Transaction announced with Bicent at
approx. $200 million over book value
Option to rate base at Bicent’s
purchase price and economic value
Earnings Guidance for 2008
$1.60 - $1.75 share
39 million shares outstanding
Ending Stock price – July 18, 2008
$24.47 (-6.19% - including dividends of
$.99/share paid since Nov. 5, 2007)
Ending index value – July 18, 2008
DJU = 493.40 (-6.83%)
UTY = 516.33 (-8.71%)
This analysis does not include the conclusion of Magten
litigation and introduction of share repurchase program.
Northwestern – value and growth…
Value
Dividend yield of 5.4%
Currently trading at approximately 1.14x book value
Opportunity for Growth
Possibility of rate base growth in excess of $1 billion
Potential additional annual earnings of more than
$50 million by 2013
Strong balance sheet/credit ratings
Moody’s recently upgraded Northwestern debt
All unsecured debt is now investment grade with
Moody’s, S&P and Fitch

summary…
Core regulated
business
Superior cash flows
Strong balance sheet
Investment grade rated debt
Poised for growth
Solid foundation
Excellent Growth
Prospects
Unique geographic location to expand electric
and natural gas infrastructure
Increasing need to move energy through our
service area
Identified projects providing opportunity to nearly
double rate base and earnings
Nearly all consolidated earnings from regulated
business
Rate relief received in all jurisdictions
Outstanding bankruptcy litigation nearly completed
Attained investment grade ratings