
Investor Update
Boston, Philadelphia, Cincinnati,
Columbus & Cleveland
September 29 – October 1, 2009

2
forward-looking statement…
During the course of this presentation, there will be forward-looking
statements within the meaning of the “safe harbor” provisions of the
Private Securities Litigation Reform Act of 1995. Forward-looking
statements often address our expected future business and financial
performance, and often contain words such as “expects,�� “anticipates,”
“intends,” “plans,” “believes,” “seeks,” or “will.”
Except as noted herein, the information in this presentation is based upon
our current expectations as of the date hereof. Our actual future business
and financial performance may differ materially and adversely from those
expressed in any forward-looking statements. We undertake no obligation
to revise or publicly update our forward-looking statements or this
presentation for any reason. Although our expectations and beliefs are
based on reasonable assumptions, actual results may differ materially.
The factors that may affect our results are listed in certain of our press
releases and disclosed in the Company’s public filings with the SEC.
3
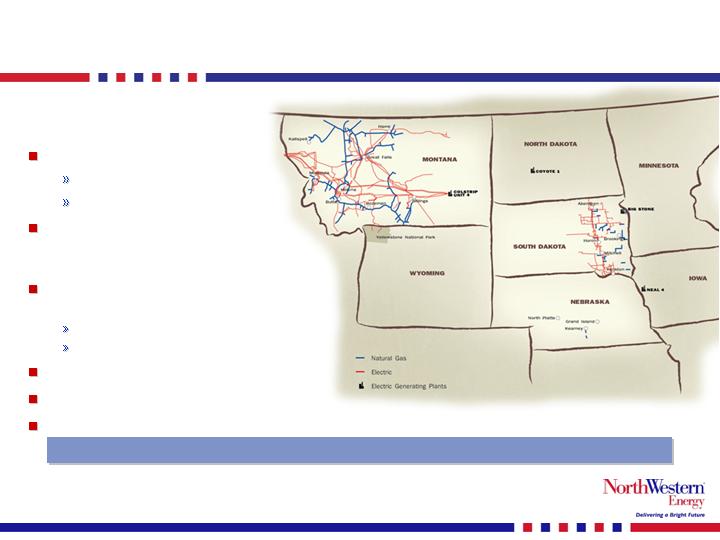
who we are…
(1)
As of 6/30/09
(2)
Book capitalization calculated as total debt, excluding capital leases, plus shareholders’ equity.
656,000 customers
392,000 electric
264,000 natural gas
Approximately 123,000 square
miles of service territory in
Montana, Nebraska and South Dakota
Total generation (mostly base load coal)
MT – 222 MW – regulated as of 1/1/09
SD – 312 MW – regulated
Total Assets: $2,720 MM (1)
Total Capitalization: $1,638 MM (1)(2)
Total Employees: 1,385 (1)
Located in relatively stable economies with potential grid expansion in the Northwest.
4
NorthWestern’s attributes…
Solid operations
Cost competitive
Above-average reliability
Award-winning customer service
Improving debt ratings and strong balance sheet and liquidity
Secured credit ratings of A-(MT) BBB+(SD) / BBB+ / Baa3
Moody’s has on “positive” outlook
Competitive dividend
Current yield approximately 5.5%
Positive earnings and ROE trend
Colstrip Unit 4 into rates effective Jan. 1, 2009
Delivery services rate case to be filed in MT for electric and nat. gas in October ‘09
Strong cash flows
NOLs provide an effective tax shield until at least 2012
Realistic growth prospects
Electric generation and transmission opportunities
Solid operations with strong growth prospects.
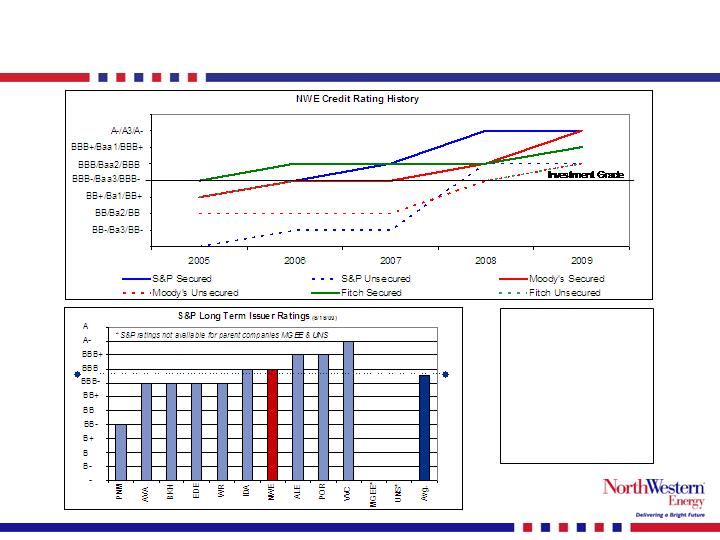
improving credit ratings…
Secured Ratings
S&P A-
Moody’s A3
Fitch BBB+
NWE credit ratings
now better than peer
average shown here.
5
6
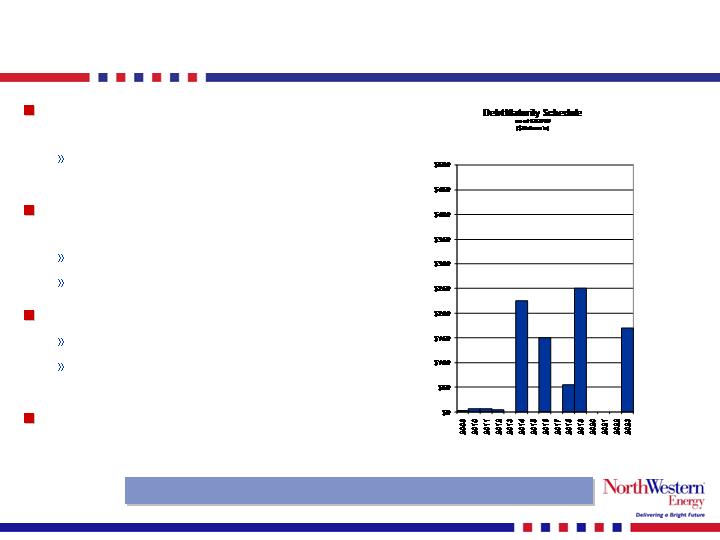
liquidity highlights…
Recently issued $250 million in
First Mortgage Bonds
10 year maturity with interest rate
of 6.34%
Priced $55 million additional First
Mortgage Bonds
30 year maturity at 5.71%
Expect to close in mid-October
Extended unsecured revolver
Maturity date now June 30, 2012
Added $50 million in availability to
increase to $250 million
Total liquidity currently in the
$250 million range
Nearly all long-term debt matures after 2014.

7
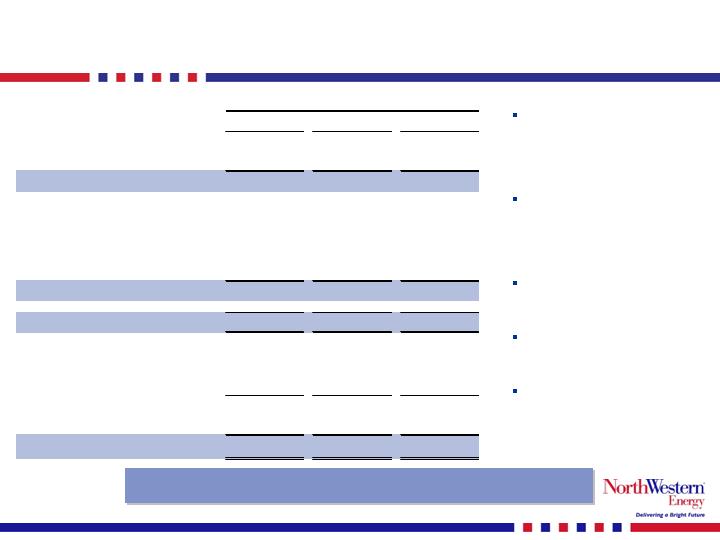
strong balance sheet…
Plan to maintain a 50%-55% debt to total capitalization ratio.
(Dollars in 000's)
June 30,
December 31,
2009
2008
Cash
22,963
11,292
Restricted Cash
16,640
14,727
Accounts Receivable, Net
97,962
155,672
Inventories
47,350
70,741
Other Current Assets
75,459
60,985
Goodwill
355,128
355,128
PP&E and Other Non-current Assets
2,104,468
2,093,492
Total Assets
2,719,970
$
2,762,037
$
Payables
56,121
94,685
Other Current Liabilities
258,520
264,654
Long & Short Term Capital Leases
36,202
37,991
Long & Short Term Debt
868,979
862,056
Other Non-current Liabilities
731,187
739,118
Shareholders' Equity
768,961
763,533
Total Liabilities and Equity
2,719,970
$
2,762,037
$
Long & Short Term Debt / Total Capitalization
53.1%
53.0%
8
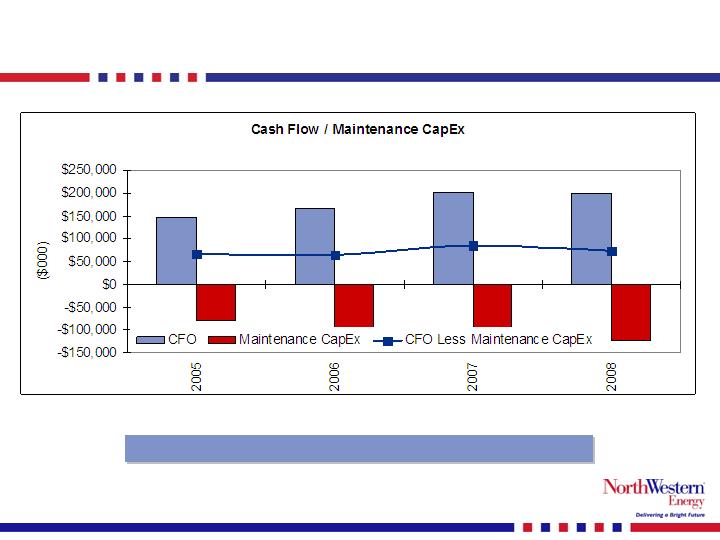
free cash flow…
Free cash flow available to fund future growth projects.
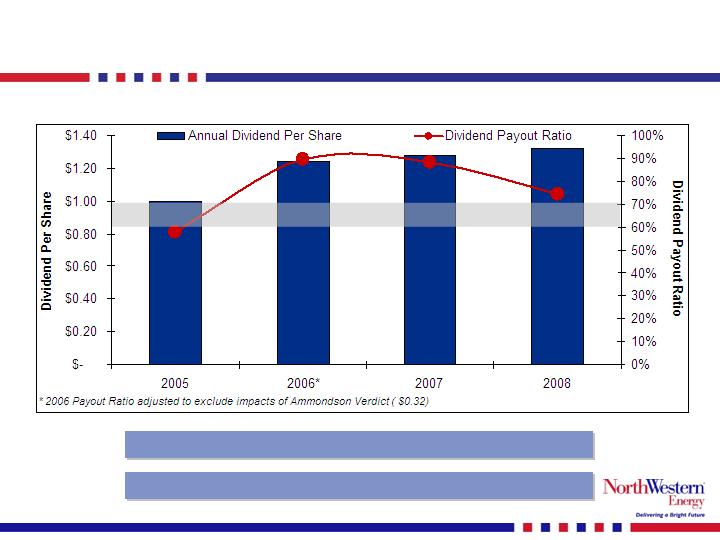
dividend history…
Current yield of approximately 5.5%.
9
Goal for dividend payout ratio of 60% to 70%.
0.0%
1.0%
2.0%
3.0%
4.0%
5.0%
6.0%
7.0%
8.0%
9.0%
10.0%
11.0%
12.0%
2005
2006
2007
2008
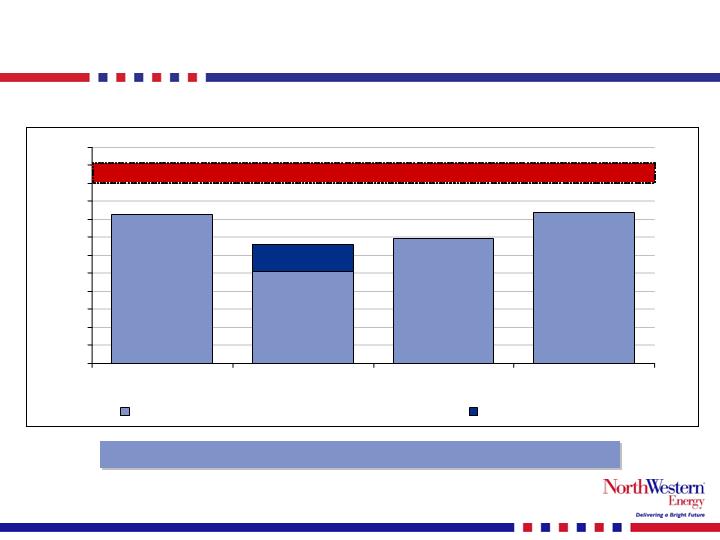
NWE Return on Average Equity
Ammondson Verdict
Authorized ROAE's in Utility Industry
return on average equity…
Authorized Return on Average Equity (ROAE) of 10-11% in utility industry.
10
11
potential earnings drivers…
2010
Expecting flat volumes
Not impacted like other utilities due to higher mix of
residential/commercial vs. industrial customers
68% Residential and Commercial vs. 32% Industrial and Other
Delivery services rate adjustment expected to take effect 3Q 2010 for
rate case to be filed in October 2009
2011
Full year effect of rate adjustment
Mill Creek in rate base starting 2Q 2011
Approximately $10 million annualized contribution to net income
2012 and beyond
Transmission projects to provide additional earnings potential
Near term earnings drivers independent of transmission projects.
12
regulatory update…
Rate case to be filed 4Q in Montana
Filing to include both electric and natural gas distribution businesses
Based on 2008 test year
Expect decision in 3Q 2010
Mill Creek Generation Station filed with MPSC
MPSC approval in 2Q 2009
Construction underway
Working with FERC for MSTI rate design
FERC encouraged Company to develop MSTI on a cost of service
basis by requesting appropriate tariff waivers from existing OATT
FERC acknowledged the need for innovative proposals to develop new
transmission projects
Continuing the development of the project without interruption
Establishing constructive regulatory regulations in all jurisdictions.
13
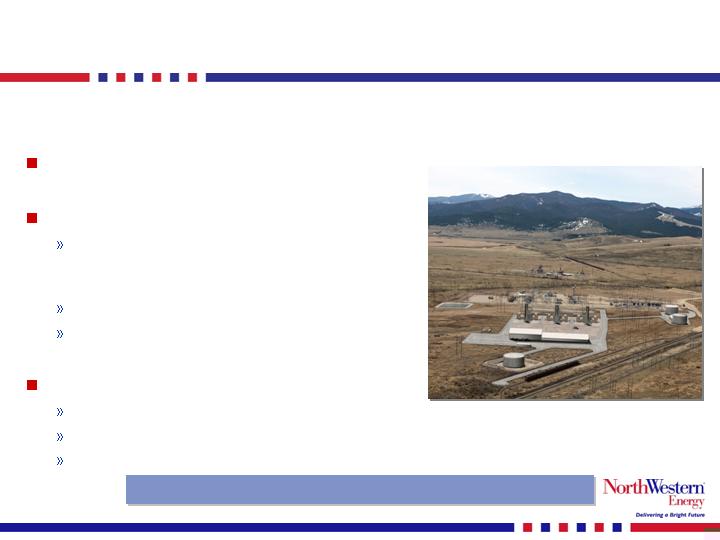
generation growth highlights…
In service date for Mill Creek Generation Station is 4Q 2010
Mill Creek Generating Unit in Montana
Existing regulating services are
becoming more expensive and scarce
150 MW plant near Anaconda, MT
To be built for regulation services to
balance supply and load for NWE’s
Balancing Area
Rate-based cost of service investment
Estimated to cost approximately
$200 million
MPSC approved plant in 2Q ‘09
Capital structure of 50/50
Authorized ROE of 10.25%
Construction underway
Artist rendering of completed plant.
14
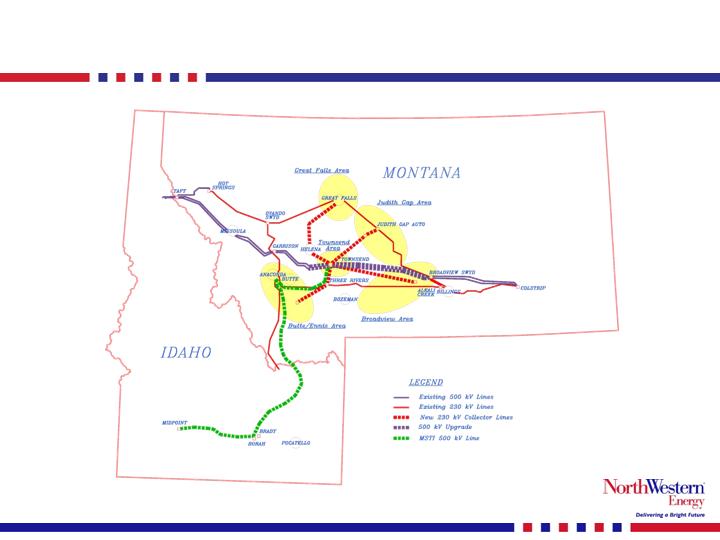
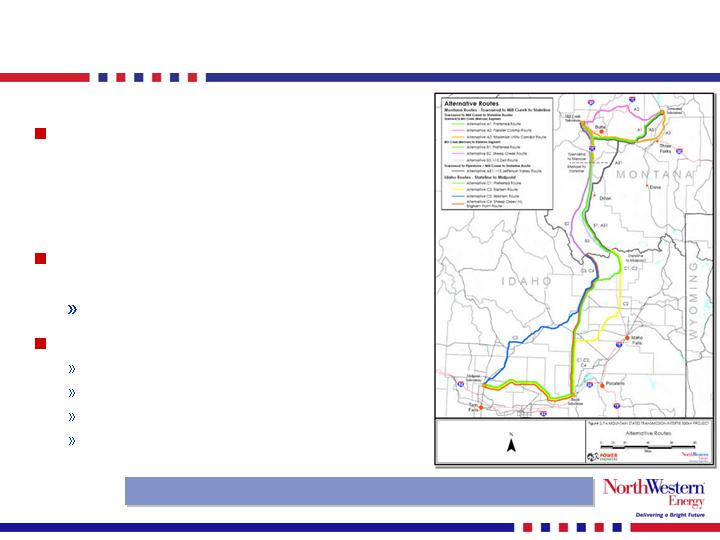
our proposed transmission projects…
15
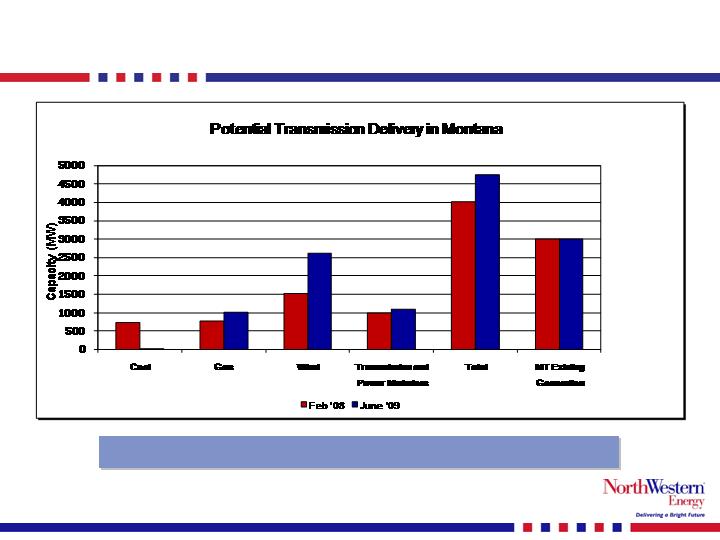
generation plans shifting to wind…
New generation in Montana mostly wind and will need to find an end user.
16
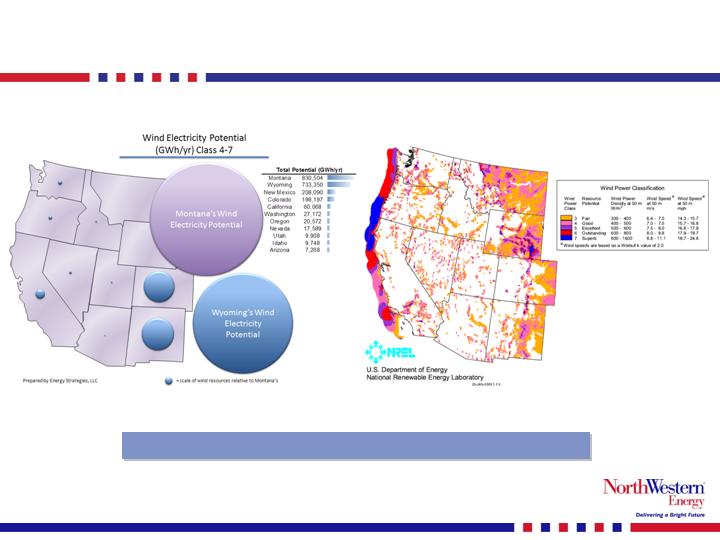
supply – Montana wind potential…
Very strong wind regime in Montana.
17
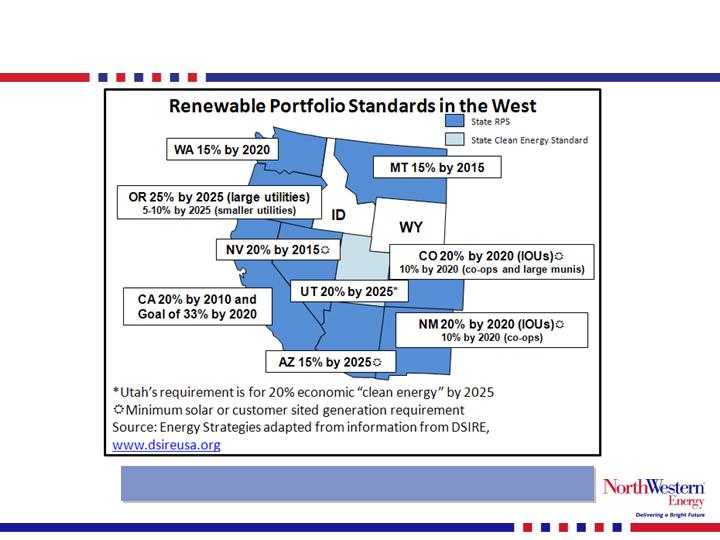
demand – renewable standards…
The current renewable percentage of NorthWestern’s
electric supply in Montana is a little more than 8%.
18
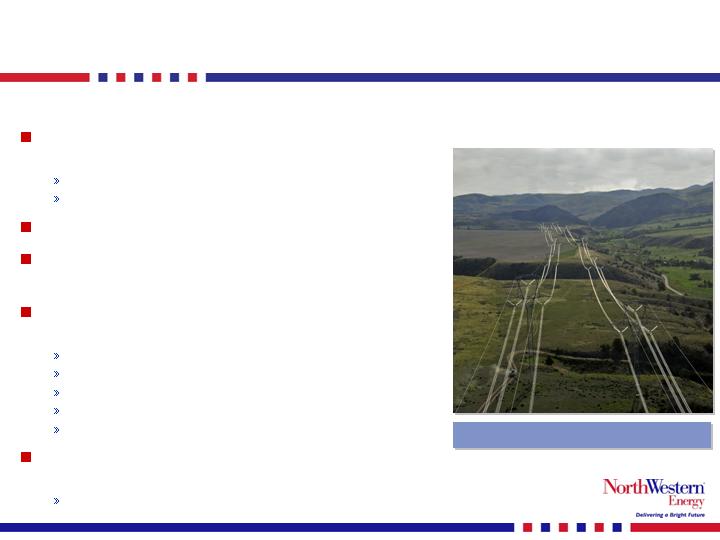
our transmission developments…
Line already exists – represents an
upgrade
Upgrades substation capacity
Increases load capacity of existing line by 500-600 MWs
Needed to relieve congestion to the West
Market interest is increasing for
Montana’s high quality wind profile
NorthWestern announced joint
development agreement with others
Portland General
Puget Sound Energy
Pacificorp
Avista
Bonneville Power Authority
Cost estimate of ourportion of 500 kV
upgrade = $50M - $75M
Anticipated ownership interest of 30% on upgrade
In service date of January 1, 2012.
Colstrip 500 kV Upgrade
19
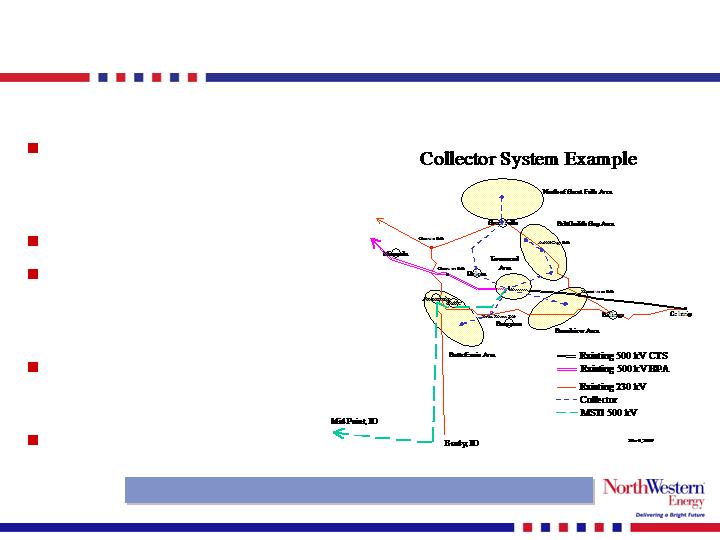
transmission project developments…
In service date in 2014.
230 kV “Collector System”
Provides gathering system for
new generation to access
MSTI and network system
benefits
Our project with no partners
In 2Q ’09, FERC approved
NorthWestern’s proposal to
directly assign the cost of the
project to the generators
The FERC found that the
project is an innovative
proposal
Cost estimate of “collector”
project = $200M
20
transmission project developments cont’d…
Provides additional capacity on a
historically constrained path, and
connects expanding new
renewable markets in Idaho, Utah
and the Southwest U.S.
Total project cost estimated from
$800 million to $1 billion
Considering strategic partners
Plan to be operational in 2014
Continuing filings with FERC
Open Season to be conducted
Start construction 2011
For current information:
www.MSTI500kV.com
Estimated to be on line early 2014.
MSTI
21
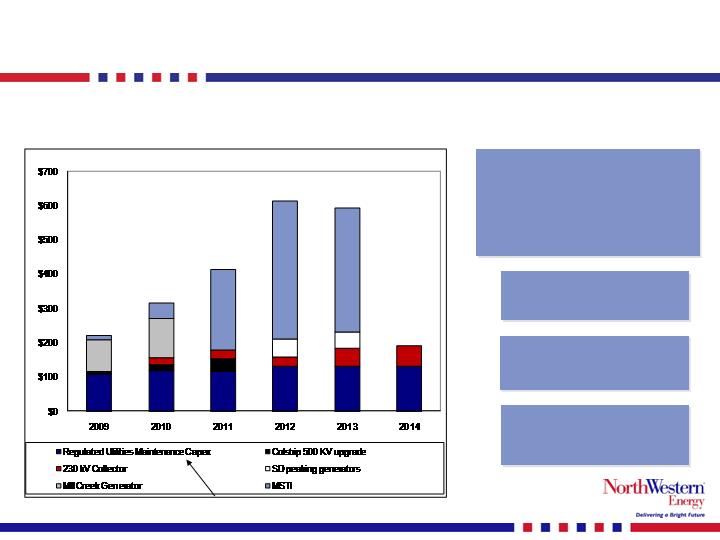
capex spending – next few years…
Includes more than $1 billion of potential generation
and transmission growth projects.
Non-discretionary
capex is funded 100%
by free cash flow.
Company doesn’t anticipate
needing equity unless we
proceed with MSTI.
We will move forward with
the funding of these projects
only when they make
economic sense.
MSTI project is now slated for
early 2014 and capex has
been modified accordingly.
Non-discretionary

22
growth project potential…
Possibility to double and diversify earnings as compared with our
existing $1.5 billion rate base as of 1/1/09.
(in millions)
Timing
Mill Creek Generation Station
200
$
to
200
$
10.0
$
to
10.0
$
Dec 2010
Colstrip 500 kV transmission upgrade **
50
$
to
75
$
2.5
$
to
3.8
$
Jan 2012
South Dakota Peaking generation
75
$
to
90
$
3.8
$
to
4.5
$
Jan 2013
230 kV Wind Collector system
150
$
to
200
$
7.5
$
to
10.0
$
Jan 2014
MSTI transmission line
800
$
to
1,000
$
40.0
$
to
50.0
$
Jan 2014
Totals
1,275
$
to
1,565
$
63.8
$
to
78.3
$
* For illustrative purposes = Cost of project times 50% equity ratio times estimated ROE of 10%.
** Assumes a 30% ownership of the $200 million project.
Cost of Project
Annual Earnings
Opportunity *
23
growth project milestones ’09 & ’10…
Mill Creek
2009
Expect decision from the MPSC (APPROVED) Q2
Begin construction Q3
500 kV upgrade
2009
Complete engineering and planning studies Q4
WECC regional planning process begins Q4
Finalize commercial terms w/partners Q4
230 kV Collector system
2009
Information meeting with customers Q2
FERC ruling allowing “open season” Q2
Conduct “open season” Q4
Complete commercial terms Q4
MSTI
2009
Continue discussions w/possible JV partner Q4
Work with FERC to clarify filings process Q4
Conduct “open season”/commercial terms Q4
EIS draft for public review due Q4
Mill Creek
2010
Complete construction Q4
Start up, commissioning and completion Q4
500 kV upgrade
2010
Run subscription process Q1
Complete regional planning process Q4
Begin construction Q4
230 kV Collector system
2010
WECC regional planning process Q2
Siting and permitting process begins Q3
MSTI
2010
Draft EIS Q1
Record of decision Q3
Begin right of way procurement Q4
Final Engineering Q4

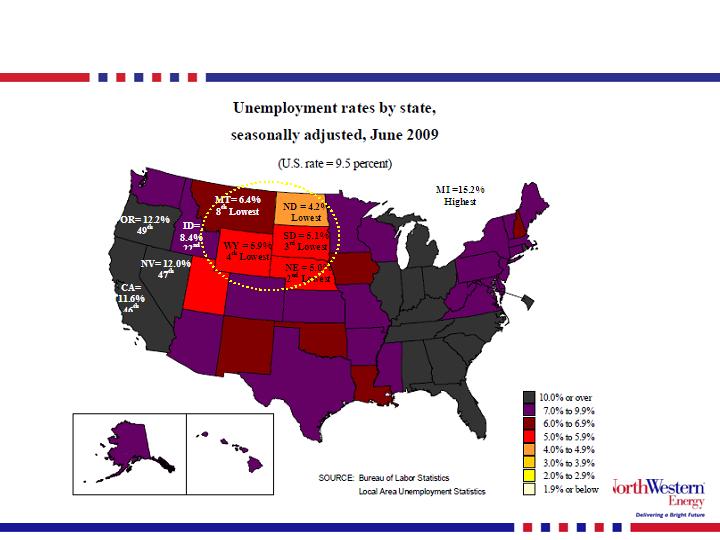
economic environment…
Worst national recession for past 25 years:
MT, SD, and NE better than a lot of areas
NE, SD, and MT have the 2ndlowest, 3rdlowest, and 8thlowest
unemployment respectively
Due to the current recession, many companies are:
reducing staff (# of unemployed nationally increased 5.5 million over
the past year),
reducing capital spends,
freezing pensions,
reducing salaries
capital spending is being reduced as well across the nation
Our Company has been impacted by:
reduced transmission OASIS sales,
lower SD wholesale pricing due to market demand,
increased pension funding and costs due to market conditions
weather
24
our service territory…
25
26
2009 results through June…
Earnings guidance range for 2009 reduced to $1.75 - $1.85 on the
earnings call on July 29, 2009 and is not being updated here.
Gross Margin increased
mainly due to transfer of
interest in CU4 into regulated
electric and offset by reduced
wholesale revenues
OG&A increased mainly due
to higher pension ($5.1M),
labor and benefits ($4.9M),
and insurance reserves
($2.6M)
Property and other taxes
decreased due to lower
property assessments.
Depreciation increased
primarily due to 2008 plant
additions.
Interest Expense increased
primarily due to increased
debt outstanding
Unaudited (Dollars in 000's)
2009
2008
Variance
Operating Revenues
606,616
662,481
(55,865)
Cost of Sales
314,850
378,438
(63,588)
Gross Margin
291,766
284,043
7,723
Operating Expenses
OG&A Expense
126,317
113,937
12,380
Property and other taxes
42,535
44,180
(1,645)
Depreciation
44,982
42,316
2,666
Total Operating Expenses
213,834
200,433
13,401
Operating Income
77,932
83,610
(5,678)
Interest Expense
(33,136)
(31,849)
(1,287)
Investment Income and Other
789
422
367
Income Before Taxes
45,585
52,183
(6,598)
Income Taxes
(16,674)
(19,229)
2,555
Net Income
28,911
32,954
(4,043)
Six Months Ended June 30,
27
summary…
Value
Dividend yield of approx. 5.5%
Strong financial profile
All debt is investment grade rated
Strong cash flows from operations and NOLs expected into 2012
Improving regulatory relationships
Opportunity for growth
Montana rate case to be filed in October 2009
expecting a rate increase
expect new rates effective during 3Q 2010
Possibility of increasing rate base on growth projects with
investment in excess of $1 billion
Potential additional annual earnings of more than $60 million post 2014
Current value with growth opportunities.