
1 Third Quarter 2013 Earnings 10/24/2013
On the Call Today 2 • Bob Rowe, President & CEO • Brian Bird, VP & CFO • Heather Grahame, VP & General Counsel • Kendall Kliewer, VP & Controller • John Hines, VP - Energy Supply • Travis Meyer, Director of Investor Relations
3 Forward Looking Statements During the course of this presentation, there will be forward-looking statements within the meaning of the “safe harbor” provisions of the Private Securities Litigation Reform Act of 1995. Forward-looking statements often address our expected future business and financial performance, and often contain words such as “expects,” “anticipates,” “intends,” “plans,” “believes,” “seeks,” or “will.” The information in this presentation is based upon our current expectations as of the date hereof unless otherwise noted. Our actual future business and financial performance may differ materially and adversely from our expectations expressed in any forward-looking statements. We undertake no obligation to revise or publicly update our forward-looking statements or this presentation for any reason. Although our expectations and beliefs are based on reasonable assumptions, actual results may differ materially. The factors that may affect our results are listed in certain of our press releases and disclosed in the Company’s public filings with the SEC.
• September 26th hydro acquisition announcement – $900 million purchase of 11 hydro facilities and a storage reservoir – October 18th informational meeting with MPSC • Fortnightly 40 Company – Recognized as one of the “40 best energy companies” • Board declared a stock dividend – $0.38 cents – Payable on December 31, 2013 to shareholders of record as of December 13th. Significant Activities 4
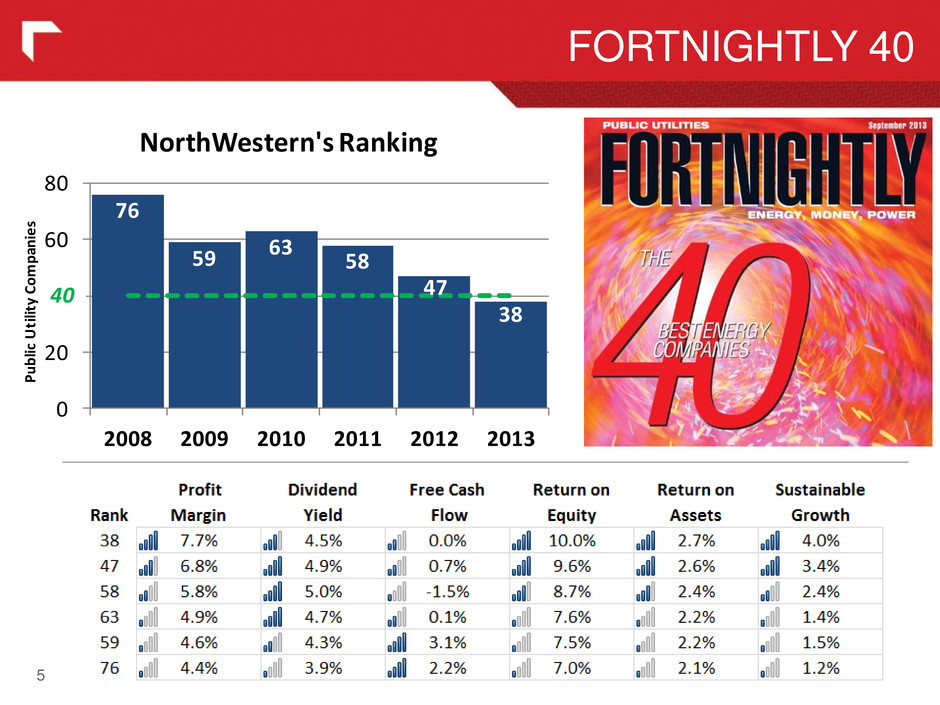
FORTNIGHTLY 40 5 76 59 63 58 47 38 0 20 40 60 80 2008 2009 2010 2011 2012 2013 Pu bli c U til ity Co m pa nie s NorthWestern's Ranking 40
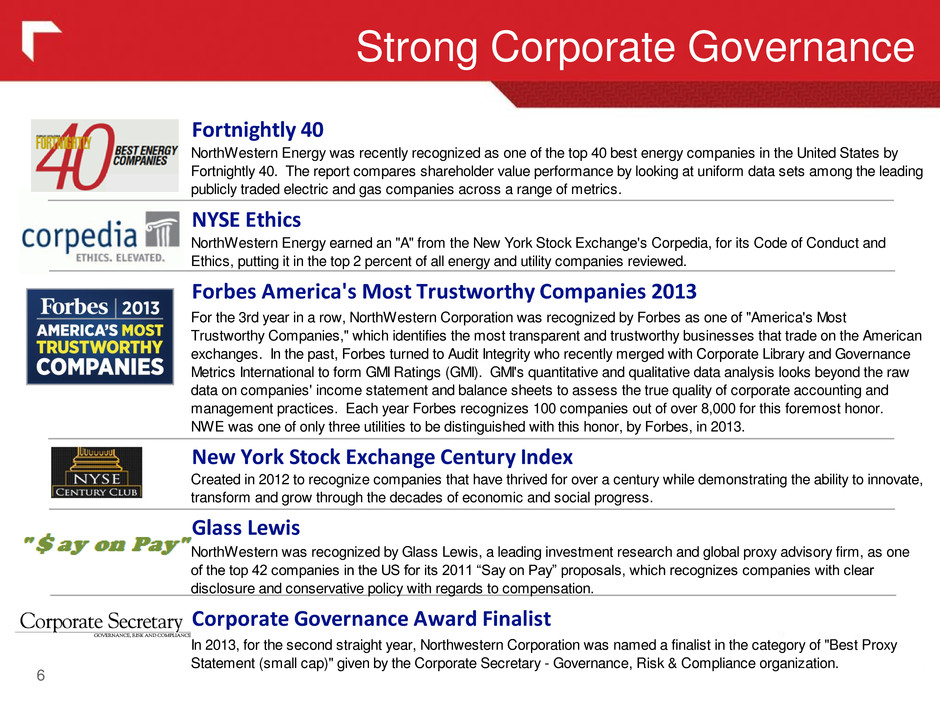
Strong Corporate Governance 6 Fortnightly 40 NorthWestern Energy was recently recognized as one of the top 40 best energy companies in the United States by Fortnightly 40. The report compares shareholder value performance by looking at uniform data sets among the leading publicly traded electric and gas companies across a range of metrics. NYSE Ethics NorthWestern Energy earned an "A" from the New York Stock Exchange's Corpedia, for its Code of Conduct and Ethics, putting it in the top 2 percent of all energy and utility companies reviewed. Forbes America's Most Trustworthy Companies 2013 For the 3rd year in a row, NorthWestern Corporation was recognized by Forbes as one of "America's Most Trustworthy Companies," which identifies the most transparent and trustworthy businesses that trade on the American exchanges. In the past, Forbes turned to Audit Integrity who recently merged with Corporate Library and Governance Metrics International to form GMI Ratings (GMI). GMI's quantitative and qualitative data analysis looks beyond the raw data on companies' income statement and balance sheets to assess the true quality of corporate accounting and management practices. Each year Forbes recognizes 100 companies out of over 8,000 for this foremost honor. NWE was one of only three utilities to be distinguished with this honor, by Forbes, in 2013. New York Stock Exchange Century Index Created in 2012 to recognize companies that have thrived for over a century while demonstrating the ability to innovate, transform and grow through the decades of economic and social progress. Glass Lewis NorthWestern was recognized by Glass Lewis, a leading investment research and global proxy advisory firm, as one of the top 42 companies in the US for its 2011 “Say on Pay” proposals, which recognizes companies with clear disclosure and conservative policy with regards to compensation. Corporate Governance Award Finalist In 2013, for the second straight year, Northwestern Corporation was named a finalist in the category of "Best Proxy Statement (small cap)" given by the Corporate Secretary - Governance, Risk & Compliance organization.

Strong Corporate Citizenship NorthWestern Energy works to help build strong communities everywhere we serve. 7 Montana Business of the Year NorthWestern Energy was recently selected as the 2012 Business of the Year by the Montana Ambassadors. The Ambassadors are a group of 120 business leaders from across Montana, the Pacific Northwest and the Bay Area of California who work to increase the economic vitality of Montana. Community Works Community Works encompasses NorthWestern Energy's tradition of funding community activities, charitable efforts and economic development within its service territory. NorthWestern Energy's Community Works programs currently provide more than $1.5 million annually in funds for community sponsorships, charitable contributions and economic development organizations in Montana, South Dakota and Nebraska. Worksite Health In May 2012 NorthWestern Corporation was recognized, by the Montana Worksite Health Promotion Coalition, for excellence in promoting worksite health and earned the Gold Award, for our wellness program "Energize Your Life."

Summary Financial Results 8 (in millions, except per share) 2013 2012 2013 2012 Operating Revenues $262.3 $235.9 $835.5 $789.5 Cost of Sales 104.3 93.0 343.4 327.9 Gross Margin 158.0 142.9 492.1 461.6 Operating Expenses Operating, general & administrative 72.5 63.1 208.7 195.7 MSTI impairment - 24.0 - 24.0 Property and other taxes 26.0 24.8 77.5 74.4 Depreciation 28.1 26.5 84.7 79.4 Total Operating Expenses 126.6 138.4 370.9 373.5 Operating Income 31.4 4.4 121.1 88.2 Interest Expense (17.1) (17.7) (51.0) (49.6) Other Income 3.1 1.0 6.8 3.1 Income (Loss) Before Taxes 17.5 (12.4) 76.9 41.7 Income Tax (Expense) Benefit (1.8) 8.6 (9.0) (2.0) Net Income (Loss) $15.6 ($3.8) $67.9 $39.7 Average Common Shares Outstanding 38.5 37.2 38.0 36.7 Basic Earnings per Average Common Share $0.41 ($0.10) $1.79 $1.09 Diluted Earnings per Average Common Share $0.40 ($0.10) $1.78 $1.08 Dividends Declared per Common Share $0.38 $0.37 $1.14 $1.11 Three Months Ended September 30, Nine Months Ended September 30,
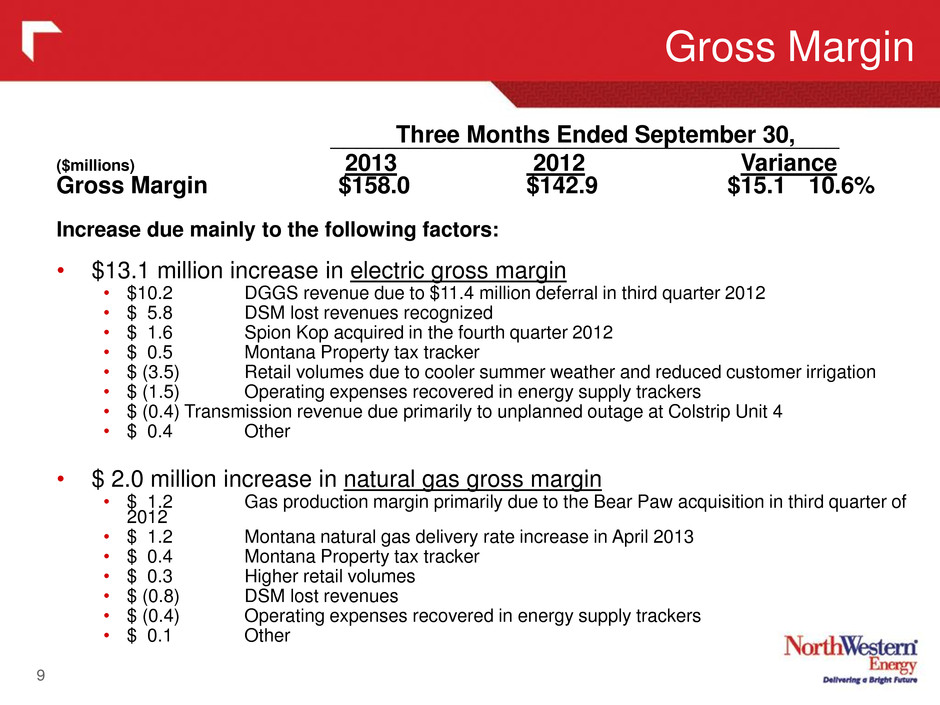
9 • $13.1 million increase in electric gross margin • $10.2 DGGS revenue due to $11.4 million deferral in third quarter 2012 • $ 5.8 DSM lost revenues recognized • $ 1.6 Spion Kop acquired in the fourth quarter 2012 • $ 0.5 Montana Property tax tracker • $ (3.5) Retail volumes due to cooler summer weather and reduced customer irrigation • $ (1.5) Operating expenses recovered in energy supply trackers • $ (0.4) Transmission revenue due primarily to unplanned outage at Colstrip Unit 4 • $ 0.4 Other • $ 2.0 million increase in natural gas gross margin • $ 1.2 Gas production margin primarily due to the Bear Paw acquisition in third quarter of 2012 • $ 1.2 Montana natural gas delivery rate increase in April 2013 • $ 0.4 Montana Property tax tracker • $ 0.3 Higher retail volumes • $ (0.8) DSM lost revenues • $ (0.4) Operating expenses recovered in energy supply trackers • $ 0.1 Other ($millions) 2013 2012 Variance Gross Margin $158.0 $142.9 $15.1 10.6% Increase due mainly to the following factors: Three Months Ended September 30, _______________________________________ Gross Margin
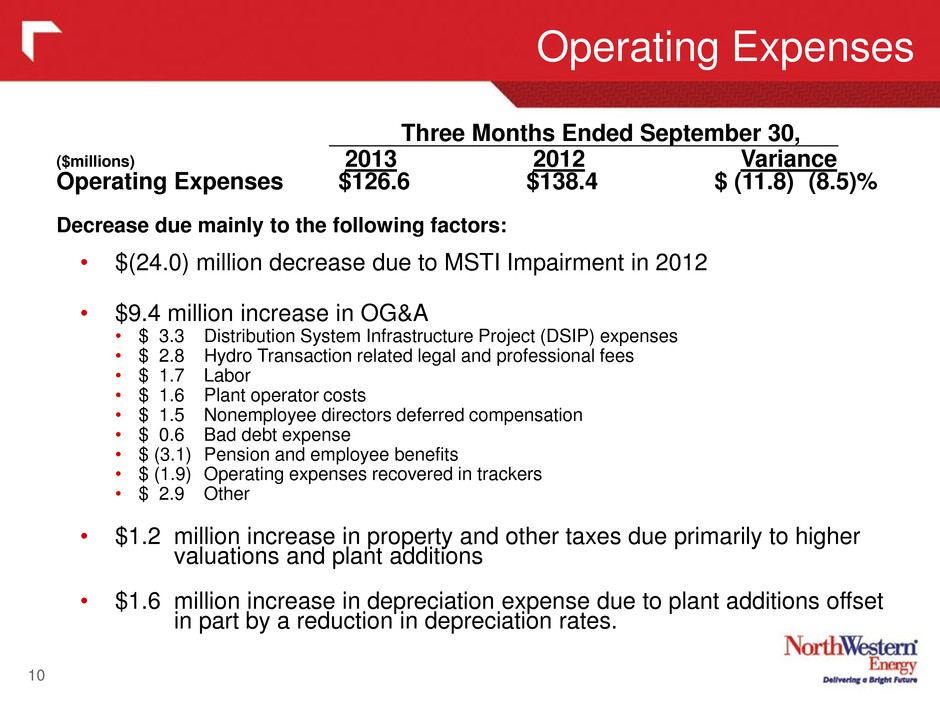
Operating Expenses 10 Three Months Ended September 30, ($millions) 2013 2012 Variance Operating Expenses $126.6 $138.4 $ (11.8) (8.5)% Decrease due mainly to the following factors: • $(24.0) million decrease due to MSTI Impairment in 2012 • $9.4 million increase in OG&A • $ 3.3 Distribution System Infrastructure Project (DSIP) expenses • $ 2.8 Hydro Transaction related legal and professional fees • $ 1.7 Labor • $ 1.6 Plant operator costs • $ 1.5 Nonemployee directors deferred compensation • $ 0.6 Bad debt expense • $ (3.1) Pension and employee benefits • $ (1.9) Operating expenses recovered in trackers • $ 2.9 Other • $1.2 million increase in property and other taxes due primarily to higher valuations and plant additions • $1.6 million increase in depreciation expense due to plant additions offset in part by a reduction in depreciation rates. _______________________________________
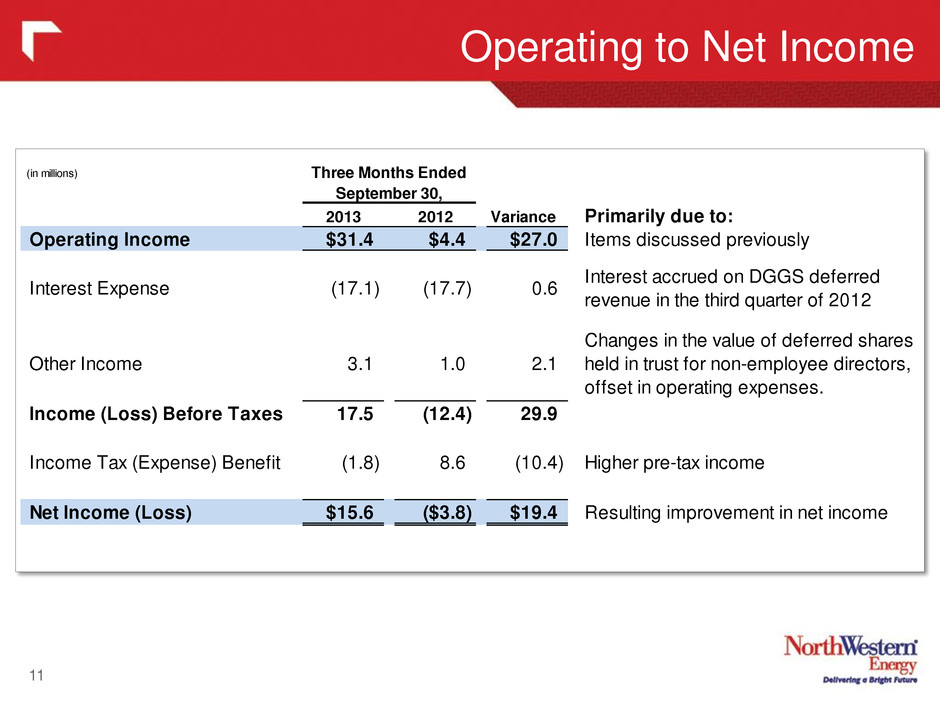
Operating to Net Income 11 (in millions) 2013 2012 Variance Primarily due to: Operating Income $31.4 $4.4 $27.0 Items discussed previously Interest Expense (17.1) (17.7) 0.6 Interest accrued on DGGS deferred revenue in the third quarter of 2012 Other Income 3.1 1.0 2.1 Changes in the value of deferred shares held in trust for non-employee directors, offset in operating expenses. Income (Loss) Before Taxes 17.5 (12.4) 29.9 Income Tax (Expense) Benefit (1.8) 8.6 (10.4) Higher pre-tax income Net Income (Loss) $15.6 ($3.8) $19.4 Resulting improvement in net income Three Months Ended September 30,

Balance Sheet 12 (in millions) Sept. 30, 2013 Dec. 31, 2012 Cash 10.9 9.8 Restricted cash 8.2 6.7 Accounts receivable, net 129.2 143.7 Inventories 62.6 54.2 Other current assets 69.7 88.8 Goodwill 355.1 355.1 PP&E and other non-current assets 2,997.9 2,827.3 Total Assets 3,633.7$ 3,485.5$ Payables 63.4 83.7 Current maturities of long-term debt & capital leases 1.7 1.6 Short-term borrowings 103.0 122.9 Other current liabilities 249.9 241.0 Long-term debt & capital leases 1,085.4 1,086.6 Other non-current liabilities 1,126.0 1,015.6 Shareholders' equity 1,004.3 934.0 Total Liabilities and Equity 3,633.7$ 3,485.5$ Capitalization: Current maturities of long-term debt & capital leases 1.7 1.6 Short Term borrowings 103.0 122.9 Long Term Debt & Capital Leases 1,085.4 1,086.6 Less: Basin Creek Capital Lease (31.8) (32.9) Shareholders' Equity 1,004.3 934.0 Total Capitalization 2,162.5$ 2,112.3$ Ratio of Debt to Total Capitalization 53.6% 55.8%
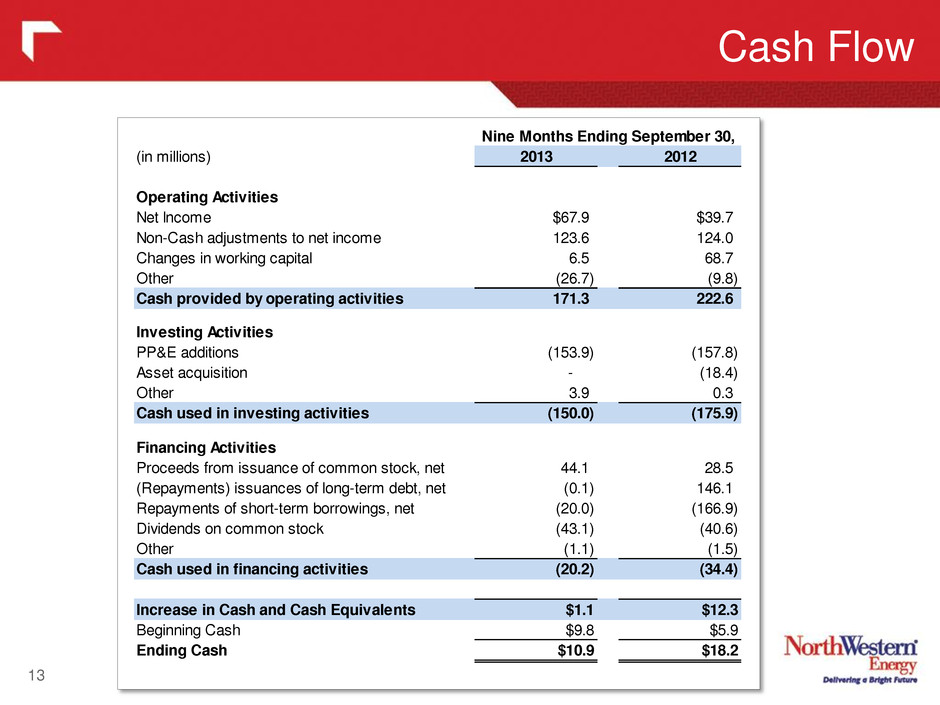
Cash Flow 13 (in millions) 2013 2012 Operating Activities Net Income $67.9 $39.7 Non-Cash adjustments to net income 123.6 124.0 Changes in working capital 6.5 68.7 Other (26.7) (9.8) Cash provided by operating activities 171.3 222.6 Investing Activities PP&E additions (153.9) (157.8) Asset acquisition - (18.4) Other 3.9 0.3 Cash used in investing activities (150.0) (175.9) Financing Activities Proceeds from issuance of common stock, net 44.1 28.5 (Repayments) issuances of long-term debt, net (0.1) 146.1 Repayments of short-term borrowings, net (20.0) (166.9) Dividends on common stock (43.1) (40.6) Other (1.1) (1.5) Cash used in financing activities (20.2) (34.4) Increase in Cash and Cash Equivalents $1.1 $12.3 Beginning Cash $9.8 $5.9 Ending Cash $10.9 $18.2 Nine Months Ending September 30,
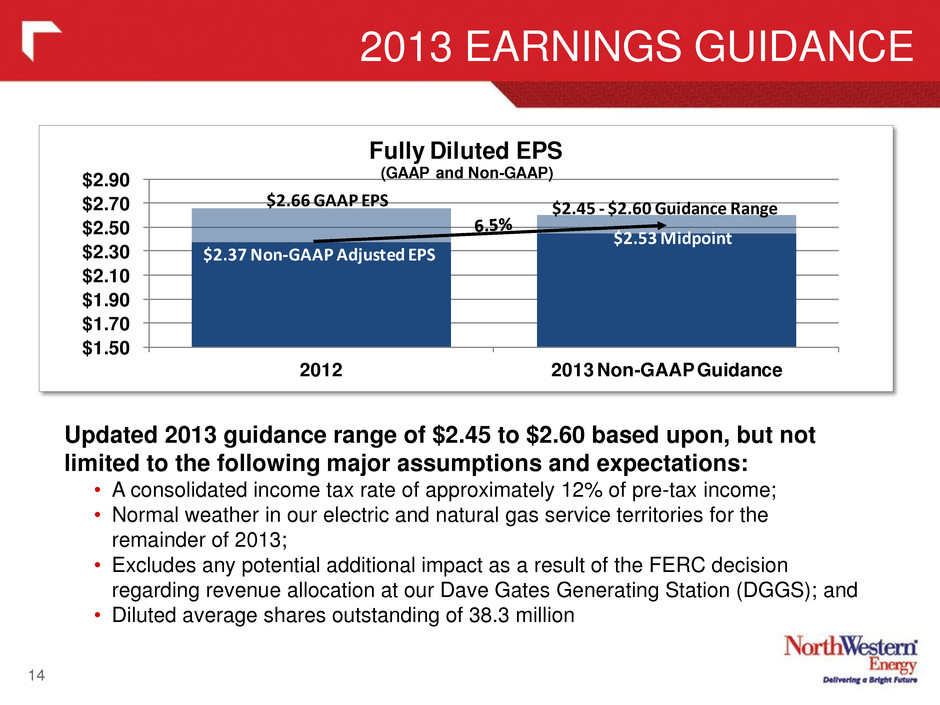
2013 EARNINGS GUIDANCE 14 Updated 2013 guidance range of $2.45 to $2.60 based upon, but not limited to the following major assumptions and expectations: • A consolidated income tax rate of approximately 12% of pre-tax income; • Normal weather in our electric and natural gas service territories for the remainder of 2013; • Excludes any potential additional impact as a result of the FERC decision regarding revenue allocation at our Dave Gates Generating Station (DGGS); and • Diluted average shares outstanding of 38.3 million $1.50 $1.70 $1.90 $2.10 $ .30 $2.50 $2.70 $2.90 2012 2013 Non-GAAP Guidance Fully Diluted EPS (GAAP and Non-GAAP) $2.45 - $2.60 Guidance Range $2.37 Non-GAAP Adjusted EPS $2.66 GAAP EPS $2.53 Midpoint

Adjusted EPS Schedule 15 Q1 Q2 Q3 Q4 2013 2013 Reported GAAP diluted EPS $1.01 $0.37 $0.40 $1.78 Non-GAAP Adjustments: Weather (0.02) (0.02) (0.04)$ Hydro Transaction related legal and professional fees 0.05 0.05$ DSM lost revenue recovery - portion related to 2012 (0.04) (0.04)$ 2013 Adjusted diluted EPS $1.01 $0.35 $0.39 $1.75 Q1 Q2 Q3 Q4 2012 2012 Reported GAAP diluted EPS $0.88 $0.31 ($0.10) $1.57 $2.66 Non-GAAP Adjustments: Weather 0.09 0.05 (0.06) 0.06 0.14$ Release of MPSC DGGS deferral (0.05) (0.05)$ DSM Lost revenue recovery related to 2010/2011 (0.05) (0.05)$ DGGS FERC ALJ initial decision - portion related to 2011 0.12 0.12$ MSTI Impairment 0.40 0.40$ Favorable CELP arbitration decision (0.79) (0.79)$ Income tax adjustment - benefit from MT NOL (0.06) (0.06)$ 2012 Adjusted diluted EPS $0.92 $0.31 $0.36 $0.78 $2.37
2014 Earnings Drivers 16 Potential earnings drivers for 2014 • Hydro transaction related expenses with potential income offset • Bear Paw South (Devon acquisition) • Organic volumetric electric and gas load growth • Full year of the 2013 Montana natural gas rate relief • Full year of depreciation with adjusted rates from depreciation study (3 quarters in 2013) • Increased operating, interest, depreciation, and property tax expense to be expected with a growing business • Upward pressure on income tax rates
Update: FERC / DGGS 17 • The Issue: FERC Administrative Law Judge issued a nonbinding decision to allocate only a fraction of the amount of revenue we believe should be allocated based on past practice to FERC customers for our Dave Gates Generating Station. – FERC is not obligated to follow any of the ALJ’s findings – Timing uncertain as to when FERC will issue its decision. • Once decision is issued and if we disagree, we may pursue full appellate rights through rehearing and appeal to the US Circuit Court of Appeals, which could extend into 2015 or beyond. • We have cumulative deferred revenue of $22.5 million as of September 30, 2013 and we continue to defer revenue of approximately $700K per month. • We continue to bill FERC jurisdictional customers interim rates that have been in effect since January 2011. These interim rates are subject to refund plus interest.
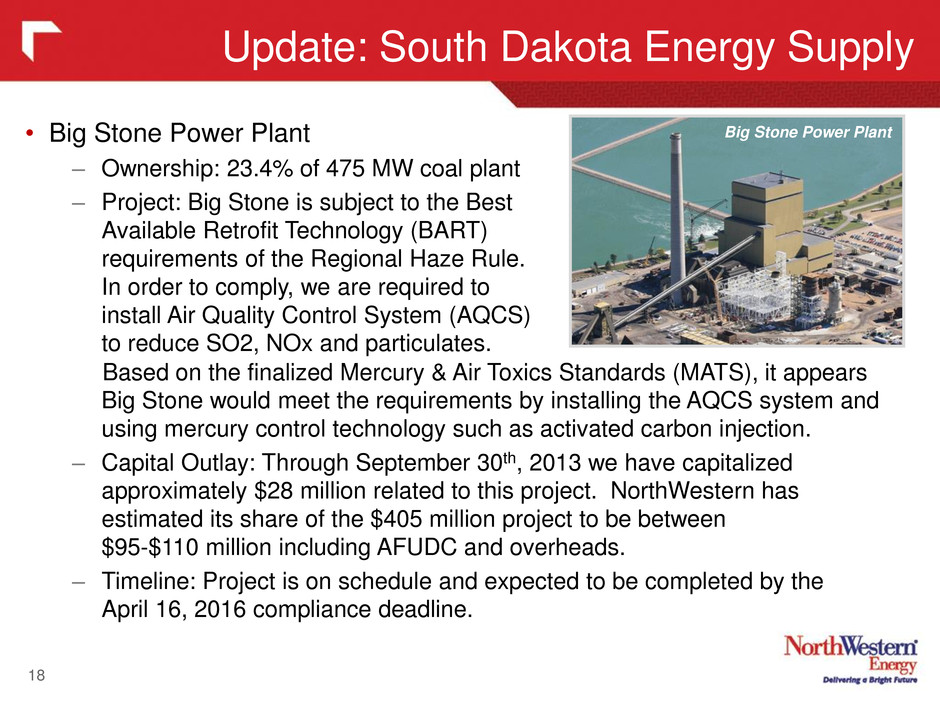
Update: South Dakota Energy Supply 18 • Big Stone Power Plant – Ownership: 23.4% of 475 MW coal plant – Project: Big Stone is subject to the Best Available Retrofit Technology (BART) requirements of the Regional Haze Rule. In order to comply, we are required to install Air Quality Control System (AQCS) to reduce SO2, NOx and particulates. Based on the finalized Mercury & Air Toxics Standards (MATS), it appears Big Stone would meet the requirements by installing the AQCS system and using mercury control technology such as activated carbon injection. – Capital Outlay: Through September 30th, 2013 we have capitalized approximately $28 million related to this project. NorthWestern has estimated its share of the $405 million project to be between $95-$110 million including AFUDC and overheads. – Timeline: Project is on schedule and expected to be completed by the April 16, 2016 compliance deadline. Big Stone Power Plant
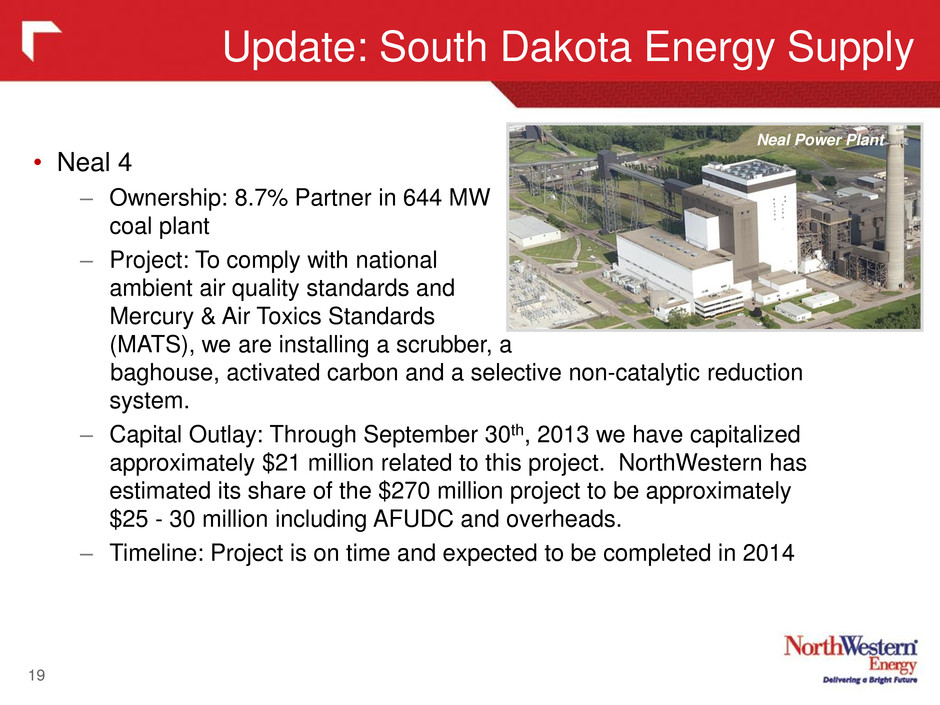
Update: South Dakota Energy Supply 19 • Neal 4 – Ownership: 8.7% Partner in 644 MW coal plant – Project: To comply with national ambient air quality standards and Mercury & Air Toxics Standards (MATS), we are installing a scrubber, a baghouse, activated carbon and a selective non-catalytic reduction system. – Capital Outlay: Through September 30th, 2013 we have capitalized approximately $21 million related to this project. NorthWestern has estimated its share of the $270 million project to be approximately $25 - 30 million including AFUDC and overheads. – Timeline: Project is on time and expected to be completed in 2014 Neal Power Plant
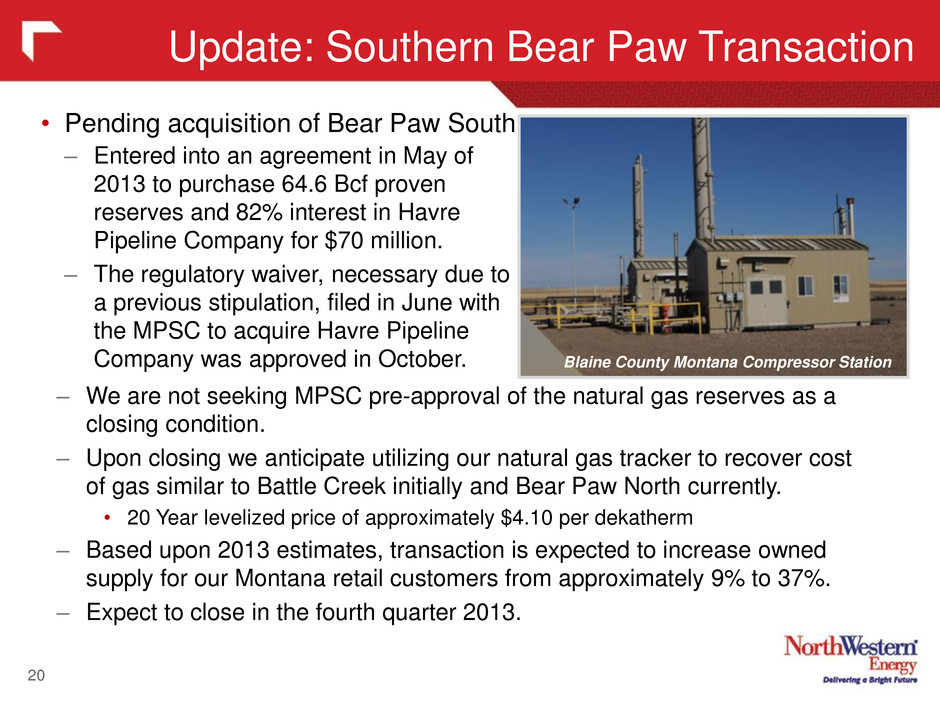
Update: Southern Bear Paw Transaction 20 • Pending acquisition of Bear Paw South – Entered into an agreement in May of 2013 to purchase 64.6 Bcf proven reserves and 82% interest in Havre Pipeline Company for $70 million. – The regulatory waiver, necessary due to a previous stipulation, filed in June with the MPSC to acquire Havre Pipeline Company was approved in October. – We are not seeking MPSC pre-approval of the natural gas reserves as a closing condition. – Upon closing we anticipate utilizing our natural gas tracker to recover cost of gas similar to Battle Creek initially and Bear Paw North currently. • 20 Year levelized price of approximately $4.10 per dekatherm – Based upon 2013 estimates, transaction is expected to increase owned supply for our Montana retail customers from approximately 9% to 37%. – Expect to close in the fourth quarter 2013. Blaine County Montana Compressor Station
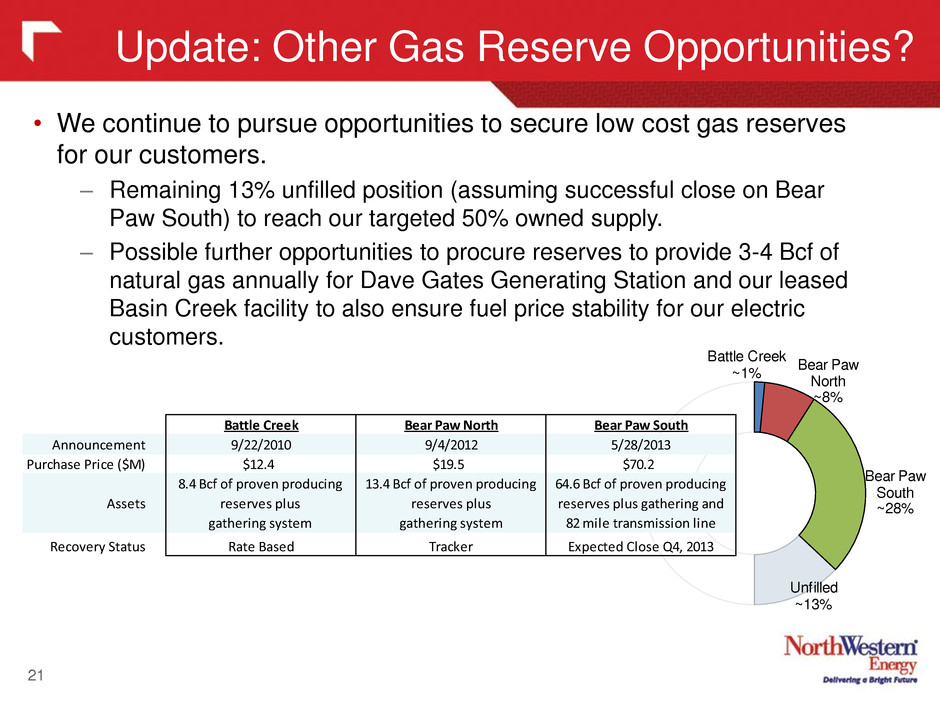
Battle Creek ~1% Bear Paw North ~8% Bear Paw South ~28% Unfilled ~13% Update: Other Gas Reserve Opportunities? 21 • We continue to pursue opportunities to secure low cost gas reserves for our customers. – Remaining 13% unfilled position (assuming successful close on Bear Paw South) to reach our targeted 50% owned supply. – Possible further opportunities to procure reserves to provide 3-4 Bcf of natural gas annually for Dave Gates Generating Station and our leased Basin Creek facility to also ensure fuel price stability for our electric customers. Battle Creek Bear Paw North Bear Paw South Announcement 9/22/2010 9/4/2012 5/28/2013 Purchase Price ($M) $12.4 $19.5 $70.2 Assets 8.4 Bcf of proven producing reserves plus gathering system 13.4 Bcf of proven producing reserves plus gathering system 64.6 Bcf of proven producing reserves plus gathering and 82 mile transmission line Recovery Status Rate Based Tracker Expected Close Q4, 2013
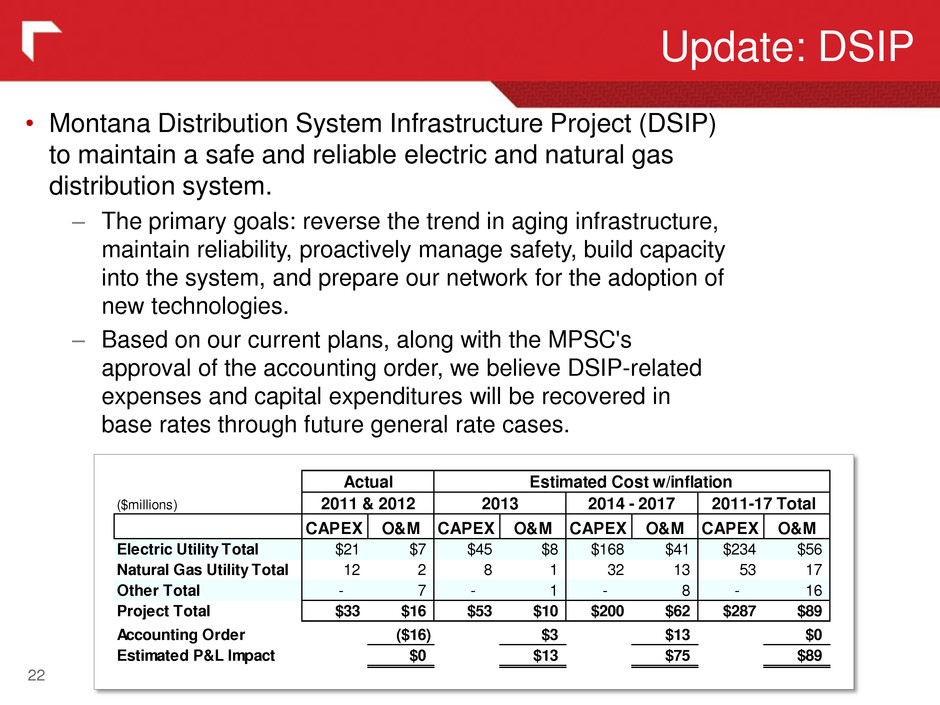
Update: DSIP 22 • Montana Distribution System Infrastructure Project (DSIP) to maintain a safe and reliable electric and natural gas distribution system. – The primary goals: reverse the trend in aging infrastructure, maintain reliability, proactively manage safety, build capacity into the system, and prepare our network for the adoption of new technologies. – Based on our current plans, along with the MPSC's approval of the accounting order, we believe DSIP-related expenses and capital expenditures will be recovered in base rates through future general rate cases. ($millions) CAPEX O&M CAPEX O&M CAPEX O&M CAPEX O&M Electric Utility Total $21 $7 $45 $8 $168 $41 $234 $56 Natural Gas Utility Total 12 2 8 1 32 13 53 17 Other Total - 7 - 1 - 8 - 16 Project Total $33 $16 $53 $10 $200 $62 $287 $89 Accounting Order ($16) $3 $13 $0 Estimated P&L Impact $0 $13 $75 $89 2011 & 2012 2013 2014 - 2017 2011-17 Total Actual Estimated Cost w/inflation
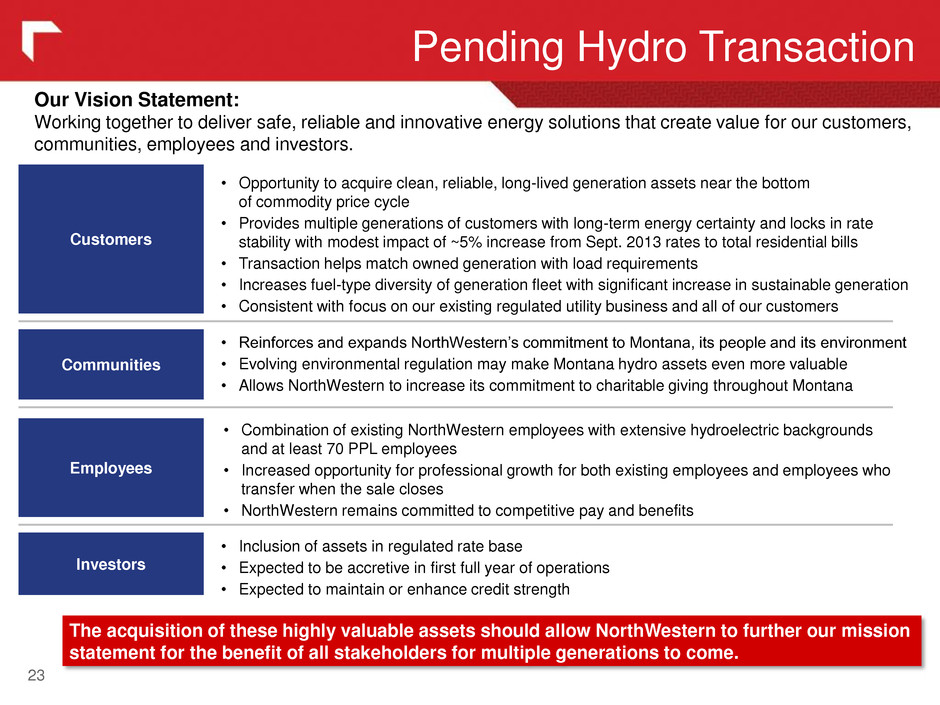
Pending Hydro Transaction Our Vision Statement: Working together to deliver safe, reliable and innovative energy solutions that create value for our customers, communities, employees and investors. The acquisition of these highly valuable assets should allow NorthWestern to further our mission statement for the benefit of all stakeholders for multiple generations to come. • Opportunity to acquire clean, reliable, long-lived generation assets near the bottom of commodity price cycle • Provides multiple generations of customers with long-term energy certainty and locks in rate stability with modest impact of ~5% increase from Sept. 2013 rates to total residential bills • Transaction helps match owned generation with load requirements • Increases fuel-type diversity of generation fleet with significant increase in sustainable generation • Consistent with focus on our existing regulated utility business and all of our customers Customers • Reinforces and expands NorthWestern’s commitment to Montana, its people and its environment • Evolving environmental regulation may make Montana hydro assets even more valuable • Allows NorthWestern to increase its commitment to charitable giving throughout Montana Communities • Combination of existing NorthWestern employees with extensive hydroelectric backgrounds and at least 70 PPL employees • Increased opportunity for professional growth for both existing employees and employees who transfer when the sale closes • NorthWestern remains committed to competitive pay and benefits Employees • Inclusion of assets in regulated rate base • Expected to be accretive in first full year of operations • Expected to maintain or enhance credit strength Investors 23
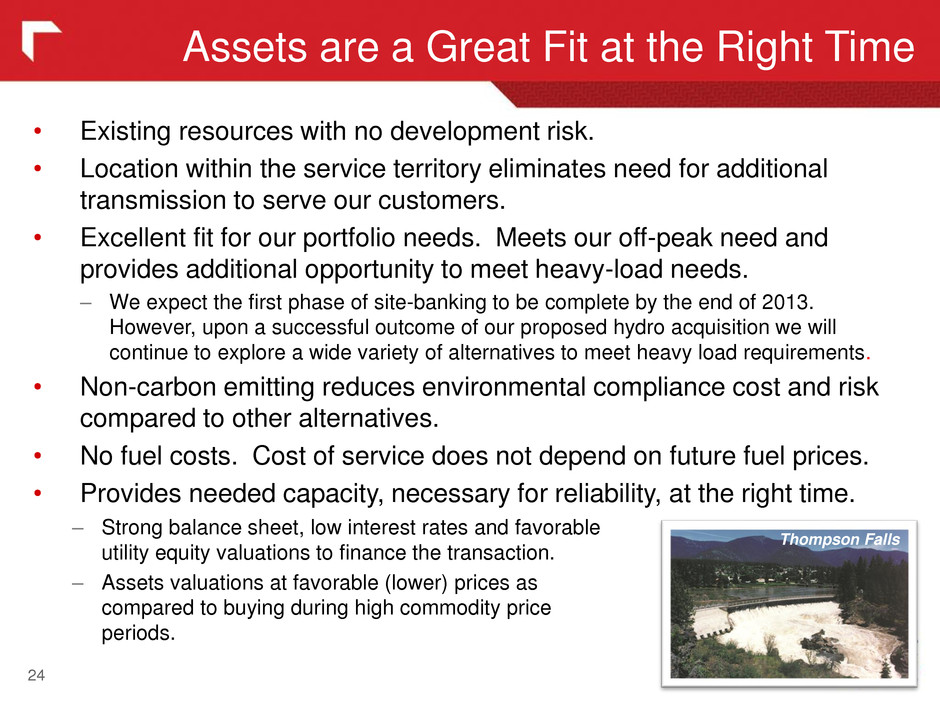
• Existing resources with no development risk. • Location within the service territory eliminates need for additional transmission to serve our customers. • Excellent fit for our portfolio needs. Meets our off-peak need and provides additional opportunity to meet heavy-load needs. – We expect the first phase of site-banking to be complete by the end of 2013. However, upon a successful outcome of our proposed hydro acquisition we will continue to explore a wide variety of alternatives to meet heavy load requirements. • Non-carbon emitting reduces environmental compliance cost and risk compared to other alternatives. • No fuel costs. Cost of service does not depend on future fuel prices. • Provides needed capacity, necessary for reliability, at the right time. Assets are a Great Fit at the Right Time 24 – Strong balance sheet, low interest rates and favorable utility equity valuations to finance the transaction. – Assets valuations at favorable (lower) prices as compared to buying during high commodity price periods. Thompson Falls

• Financing Plans – Plan to close into permanent financing with approximately $450 – 500 million of debt, up to $400 million of equity, and up to $50 million of free cash flows. – If capital market access is limited we have the option of closing into the $900 million committed Bridge Facility with Credit Suisse and Bank of America Merrill Lynch. Hydro Financing Strategy 25 Black Eagle

26
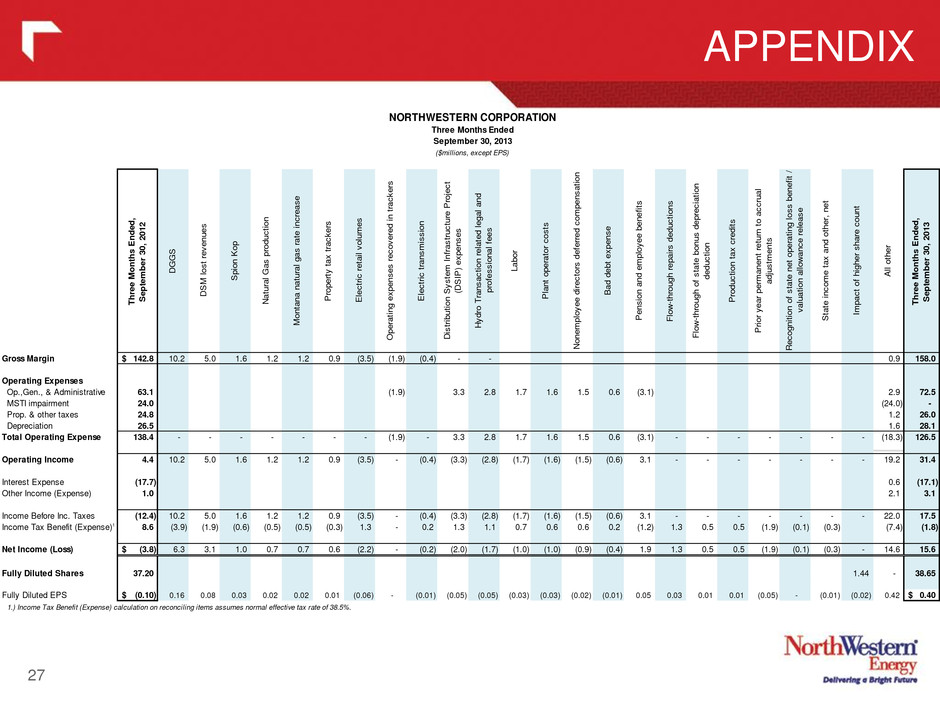
APPENDIX 27 NORTHWESTERN CORPORATION Three Months Ended September 30, 2013 ($millions, except EPS) Th re e M on th s E nd ed , Se pt em be r 3 0, 20 12 DG GS DS M los t r ev en ue s Sp ion K op Na tur al Ga s p rod uc tio n Mo nta na na tur al ga s r ate in cre as e Pr op ert y t ax tr ac ke rs El ec tric re tai l v olu me s Op era tin g e xp en se s r ec ov ere d i n t rac ke rs El ec tric tr an sm iss ion Di str ibu tio n S ys tem In fra str uc tur e P roj ec t (D SI P) ex pe ns es Hy dro T ran sa cti on re lat ed le ga l a nd pro fes sio na l fe es La bo r Pl an t o pe rat or co sts No ne mp loy ee di rec tor s d efe rre d c om pe ns ati on Ba d d eb t e xp en se Pe ns ion an d e mp loy ee be ne fits Flo w- thr ou gh re pa irs de du cti on s Flo w- thr ou gh of st ate bo nu s d ep rec iat ion de du cti on Pr od uc tio n t ax cr ed its Pr ior ye ar pe rm an en t r etu rn to ac cru al ad jus tm en ts Re co gn itio n o f s tat e n et op era tin g l os s b en efi t / va lua tio n a llo wa nc e r ele as e St ate in co me ta x a nd ot he r, ne t Im pa ct of hig he r s ha re co un t Al l o the r Th re e M on th s E nd ed , Se pt em be r 3 0, 20 13 Gross Margin 142.8$ 10.2 5.0 1.6 1.2 1.2 0.9 (3.5) (1.9) (0.4) - - 0.9 158.0 Operating Expenses Op.,Gen., & Administrative 63.1 (1.9) 3.3 2.8 1.7 1.6 1.5 0.6 (3.1) 2.9 72.5 MSTI impairment 24.0 (24.0) - Prop. & other taxes 24.8 1.2 26.0 Depreciation 26.5 1.6 28.1 Total Operating Expense 138.4 - - - - - - - (1.9) - 3.3 2.8 1.7 1.6 1.5 0.6 (3.1) - - - - - - - (18.3) 126.5 Operating Income 4.4 10.2 5.0 1.6 1.2 1.2 0.9 (3.5) - (0.4) (3.3) (2.8) (1.7) (1.6) (1.5) (0.6) 3.1 - - - - - - - 19.2 31.4 Interest Expense (17.7) 0.6 (17.1) Other Income (Expense) 1.0 2.1 3.1 Income Before Inc. Taxes (12.4) 10.2 5.0 1.6 1.2 1.2 0.9 (3.5) - (0.4) (3.3) (2.8) (1.7) (1.6) (1.5) (0.6) 3.1 - - - - - - - 22.0 17.5 Income Tax Benefit (Expense)1 8.6 (3.9) (1.9) (0.6) (0.5) (0.5) (0.3) 1.3 - 0.2 1.3 1.1 0.7 0.6 0.6 0.2 (1.2) 1.3 0.5 0.5 (1.9) (0.1) (0.3) (7.4) (1.8) Net Income (Loss) (3.8)$ 6.3 3.1 1.0 0.7 0.7 0.6 (2.2) - (0.2) (2.0) (1.7) (1.0) (1.0) (0.9) (0.4) 1.9 1.3 0.5 0.5 (1.9) (0.1) (0.3) - 14.6 15.6 Fully Diluted Shares 37.20 1.44 - 38.65 Fully Diluted EPS (0.10)$ 0.16 0.08 0.03 0.02 0.02 0.01 (0.06) - (0.01) (0.05) (0.05) (0.03) (0.03) (0.02) (0.01) 0.05 0.03 0.01 0.01 (0.05) - (0.01) (0.02) 0.42 0.40$ 1.) Income Tax Benefit (Expense) calculation on reconciling items assumes normal effective tax rate of 38.5%.
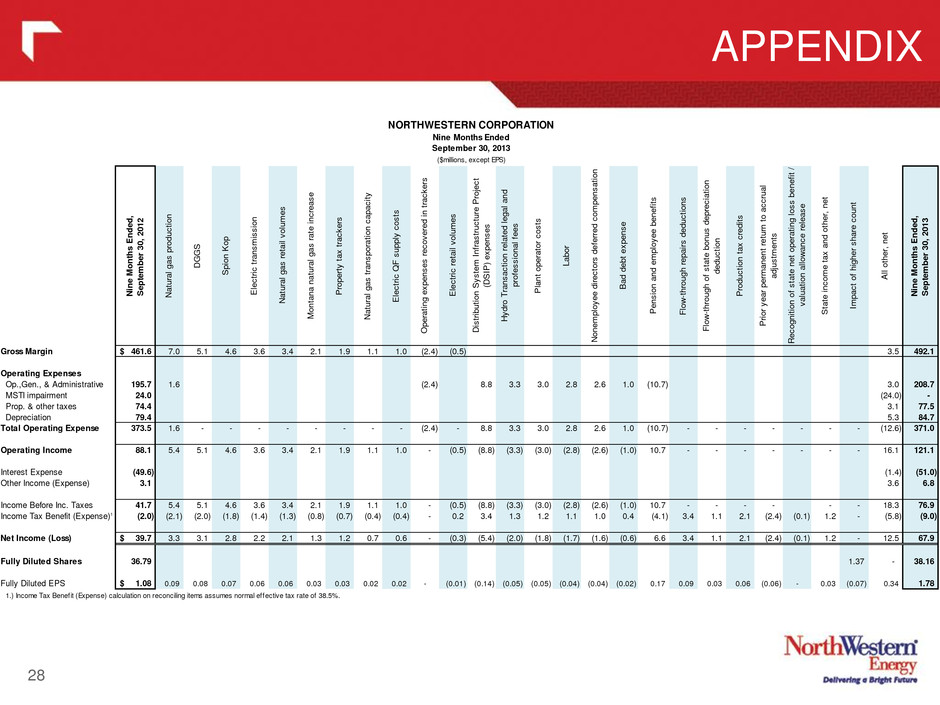
28 APPENDIX NORTHWESTERN CORPORATION Nine Months Ended September 30, 2013 ($millions, except EPS) Ni ne M on ths E nd ed , Se pte mb er 30 , 2 01 2 Na tur al ga s p rod uc tio n DG GS Sp ion K op Ele ctr ic tra ns mi ss ion Na tur al ga s r eta il v olu me s Mo nta na na tur al ga s r ate in cre as e Pr op ert y t ax tra ck ers Na tur al ga s t ran sp ora tio n c ap ac ity Ele ctr ic QF su pp ly co sts Op era tin g e xp en se s r ec ov ere d i n t rac ke rs Ele ctr ic ret ail vo lum es Dis trib uti on S ys tem In fra str uc tur e P roj ec t (D SI P) ex pe ns es Hy dro Tr an sa cti on re lat ed le ga l a nd pro fes sio na l fe es Pla nt op era tor co sts La bo r No ne mp loy ee di rec tor s d efe rre d c om pe ns ati on Ba d d eb t e xp en se Pe ns ion an d e mp loy ee be ne fits Flo w- thr ou gh re pa irs de du cti on s Flo w- thr ou gh of st ate bo nu s d ep rec iat ion de du cti on Pr od uc tio n t ax cr ed its Pr ior ye ar pe rm an en t re tur n t o a cc rua l ad jus tm en ts Re co gn itio n o f s tat e n et op era tin g l os s b en efi t / va lua tio n a llo wa nc e r ele as e St ate in co me ta x a nd ot he r, n et Im pa ct of hig he r s ha re co un t All ot he r, n et Ni ne M on ths E nd ed , Se pte mb er 30 , 2 01 3 Gross Margin 461.6$ 7.0 5.1 4.6 3.6 3.4 2.1 1.9 1.1 1.0 (2.4) (0.5) 3.5 492.1 Operating Expenses Op.,Gen., & Administrative 195.7 1.6 (2.4) 8.8 3.3 3.0 2.8 2.6 1.0 (10.7) 3.0 208.7 MSTI impairment 24.0 (24.0) - Prop. & other taxes 74.4 3.1 77.5 Depreciation 79.4 5.3 84.7 Total Operating Expense 373.5 1.6 - - - - - - - - (2.4) - 8.8 3.3 3.0 2.8 2.6 1.0 (10.7) - - - - - - - (12.6) 371.0 Operating Income 88.1 5.4 5.1 4.6 3.6 3.4 2.1 1.9 1.1 1.0 - (0.5) (8.8) (3.3) (3.0) (2.8) (2.6) (1.0) 10.7 - - - - - - - 16.1 121.1 Interest Expense (49.6) (1.4) (51.0) Other Income (Expense) 3.1 3.6 6.8 Income Before Inc. Taxes 41.7 5.4 5.1 4.6 3.6 3.4 2.1 1.9 1.1 1.0 - (0.5) (8.8) (3.3) (3.0) (2.8) (2.6) (1.0) 10.7 - - - - - - 18.3 76.9 Income Tax Benefit (Expense)1 (2.0) (2.1) (2.0) (1.8) (1.4) (1.3) (0.8) (0.7) (0.4) (0.4) - 0.2 3.4 1.3 1.2 1.1 1.0 0.4 (4.1) 3.4 1.1 2.1 (2.4) (0.1) 1.2 - (5.8) (9.0) Net Income (Loss) 39.7$ 3.3 3.1 2.8 2.2 2.1 1.3 1.2 0.7 0.6 - (0.3) (5.4) (2.0) (1.8) (1.7) (1.6) (0.6) 6.6 3.4 1.1 2.1 (2.4) (0.1) 1.2 - 12.5 67.9 Fully Diluted Shares 36.79 1.37 - 38.16 Fully Diluted EPS 1.08$ 0.09 0.08 0.07 0.06 0.06 0.03 0.03 0.02 0.02 - (0.01) (0.14) (0.05) (0.05) (0.04) (0.04) (0.02) 0.17 0.09 0.03 0.06 (0.06) - 0.03 (0.07) 0.34 1.78 1.) Income Tax Benefit (Expense) calculation on reconciling items assumes normal effective tax rate of 38.5%.
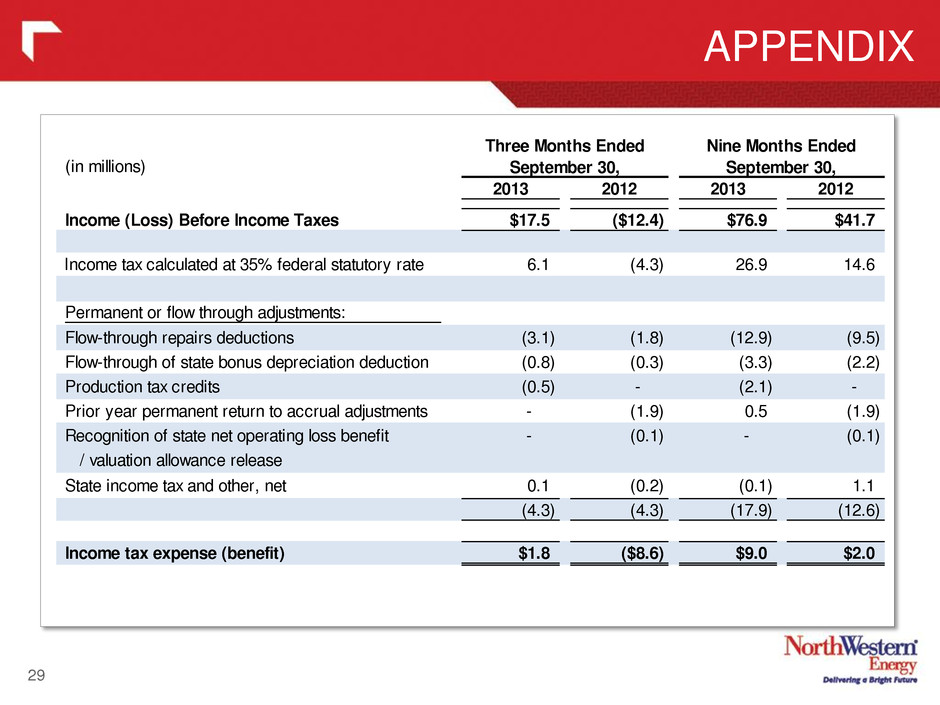
APPENDIX 29 (in millions) 2013 2012 2013 2012 Income (Loss) Before Income Taxes $17.5 ($12.4) $76.9 $41.7 Income tax calculated at 35% federal statutory rate 6.1 (4.3) 26.9 14.6 Permanent or flow through adjustments: Flow-through repairs deductions (3.1) (1.8) (12.9) (9.5) Flow-through of state bonus depreciation deduction (0.8) (0.3) (3.3) (2.2) Production tax credits (0.5) - (2.1) - Prior year permanent return to accrual adjustments - (1.9) 0.5 (1.9) Recognition of state net operating loss benefit - (0.1) - (0.1) / valuation allowance release State income tax and other, net 0.1 (0.2) (0.1) 1.1 (4.3) (4.3) (17.9) (12.6) Income tax expense (benefit) $1.8 ($8.6) $9.0 $2.0 Three Months Ended September 30, Nine Months Ended September 30,

These materials include financial information prepared in accordance with GAAP, as well as other financial measures, such as Gross Margin and Adjusted Diluted EPS, that are considered “non-GAAP financial measures.” Generally, a non-GAAP financial measure is a numerical measure of a company's financial performance, financial position or cash flows that exclude (or include) amounts that are included in (or excluded from) the most directly comparable measure calculated and presented in accordance with GAAP. Gross Margin (Revenues less Cost of Sales) is a non-GAAP financial measure due to the exclusion of depreciation from the measure. Gross Margin is used by us to determine whether we are collecting the appropriate amount of energy costs from customers to allow recovery of operating costs. Adjusted Diluted EPS is another non-GAAP measure. The Company believes the presentation of Adjusted Diluted EPS is more representative of our normal earnings than the GAAP EPS due to the exclusion (or inclusion) of certain impacts that are not reflective of ongoing earnings. The presentation of these non-GAAP measures is intended to supplement investors' understanding of our financial performance and not to replace other GAAP measures as an indicator of actual operating performance. Our measures may not be comparable to other companies' similarly titled measures. Non-GAAP Financial Measures 30


