
First Quarter 2014 Earnings Webcast 4/24/2014
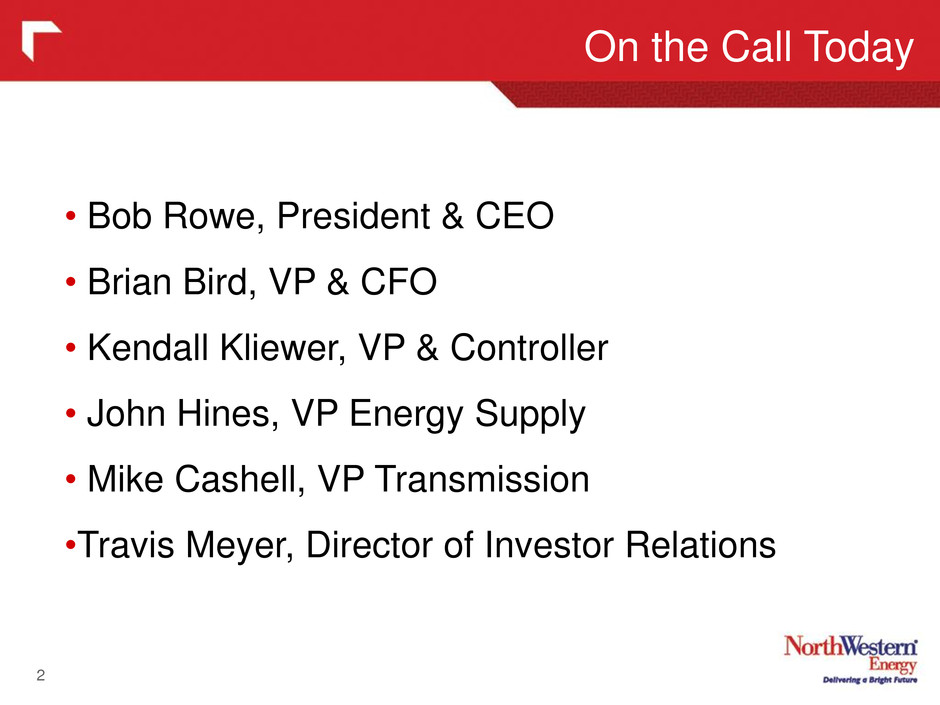
On the Call Today 2 • Bob Rowe, President & CEO • Brian Bird, VP & CFO • Kendall Kliewer, VP & Controller • John Hines, VP Energy Supply • Mike Cashell, VP Transmission •Travis Meyer, Director of Investor Relations

3 Forward Looking Statements During the course of this presentation, there will be forward-looking statements within the meaning of the “safe harbor” provisions of the Private Securities Litigation Reform Act of 1995. Forward-looking statements often address our expected future business and financial performance, and often contain words such as “expects,” “anticipates,” “intends,” “plans,” “believes,” “seeks,” or “will.” The information in this presentation is based upon our current expectations as of the date hereof unless otherwise noted. Our actual future business and financial performance may differ materially and adversely from our expectations expressed in any forward-looking statements. We undertake no obligation to revise or publicly update our forward-looking statements or this presentation for any reason. Although our expectations and beliefs are based on reasonable assumptions, actual results may differ materially. The factors that may affect our results are listed in certain of our press releases and disclosed in the Company’s 10-Q which we filed with the SEC on April 24, 2014 and our other public filings with the SEC.

• Improvement in net income of approximately $7.7 million as compared with the same period in 2013, due primarily to the impact of our acquisition of natural gas production assets and colder winter weather. • Moody’s upgrade in January 2014 – Secured: A2 to A1 and Unsecured from Baa1 to A3 • Board declared a quarterly stock dividend of 40 cents per share payable June 30, 2014 First Quarter Significant Activities 4
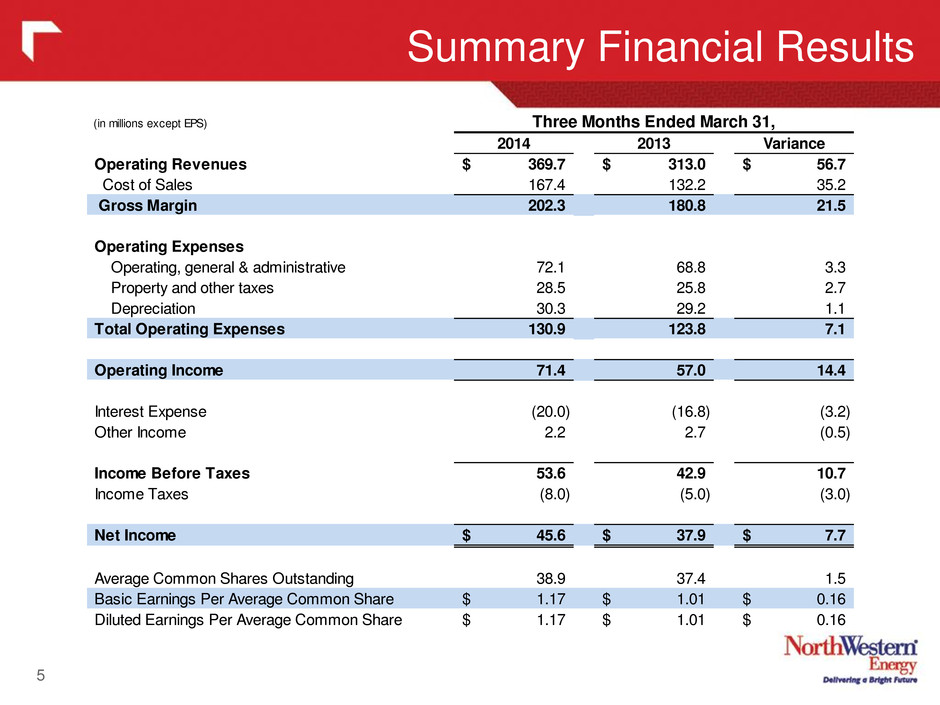
Summary Financial Results 5 (in millions except EPS) 2014 2013 Variance Operating Revenues 369.7$ 313.0$ 56.7$ Cost of Sales 167.4 132.2 35.2 Gross Margin 202.3 180.8 21.5 Operating Expenses Operating, general & administrative 72.1 68.8 3.3 Property and other taxes 28.5 25.8 2.7 Depreciation 30.3 29.2 1.1 Total Operating Expenses 130.9 123.8 7.1 Operating Income 71.4 57.0 14.4 Interest Expense (20.0) (16.8) (3.2) Other Income 2.2 2.7 (0.5) Income Before Taxes 53.6 42.9 10.7 Income Taxes (8.0) (5.0) (3.0) Net Income 45.6$ 37.9$ 7.7$ Average Common Shares Outstanding 38.9 37.4 1.5 Basic Earnings Per Average Common Share 1.17$ 1.01$ 0.16$ Diluted Earnings Per Average Common Share 1.17$ 1.01$ 0.16$ Three Months Ended March 31,

________________________________________ 6 $ 9.5 Natural gas production $ 5.7 Electric retail volumes $ 4.5 Montana natural gas rate increase $ 3.2 Natural gas retail volumes $ (1.4) Other $ 21.5 ($millions) 2014 2013 Variance Electric Margin $132.9 $127.0 $ 5.9 4.6% Natural Gas Margin 69.4 53.4 16.0 30.0% Other - 0.4 (0.4) (100.0%) Gross Margin $202.3 $180.8 $21.5 11.9% Increase in gross margin due to the following factors: Three Months Ended March 31, Gross Margin
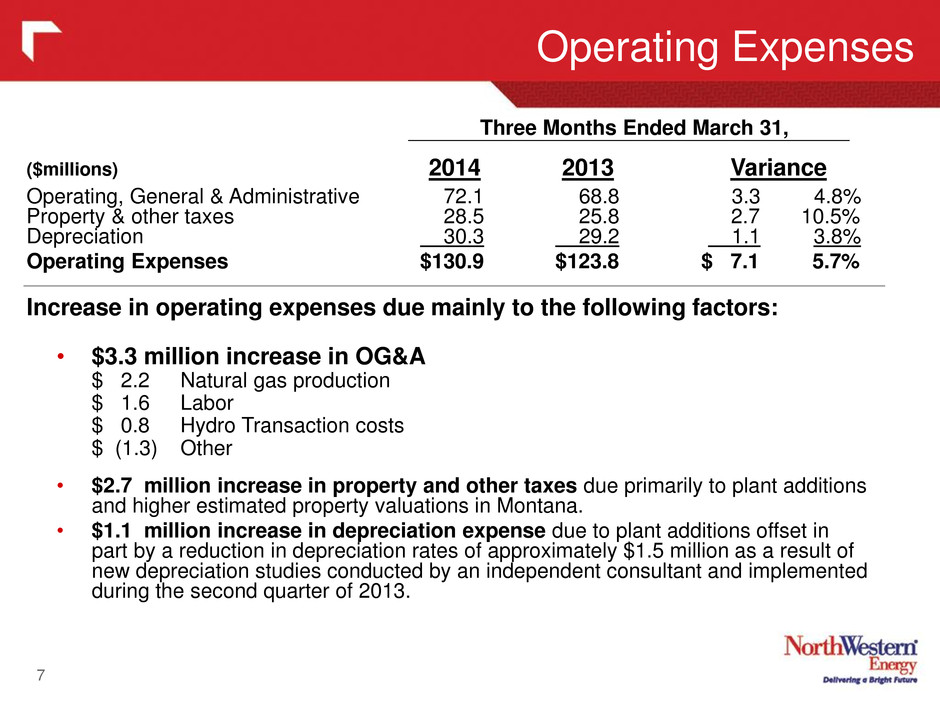
______________________________________ Operating Expenses 7 Three Months Ended March 31, ($millions) 2014 2013 Variance Operating, General & Administrative 72.1 68.8 3.3 4.8% Property & other taxes 28.5 25.8 2.7 10.5% Depreciation 30.3 29.2 1.1 3.8% Operating Expenses $130.9 $123.8 $ 7.1 5.7% Increase in operating expenses due mainly to the following factors: • $3.3 million increase in OG&A $ 2.2 Natural gas production $ 1.6 Labor $ 0.8 Hydro Transaction costs $ (1.3) Other • $2.7 million increase in property and other taxes due primarily to plant additions and higher estimated property valuations in Montana. • $1.1 million increase in depreciation expense due to plant additions offset in part by a reduction in depreciation rates of approximately $1.5 million as a result of new depreciation studies conducted by an independent consultant and implemented during the second quarter of 2013.
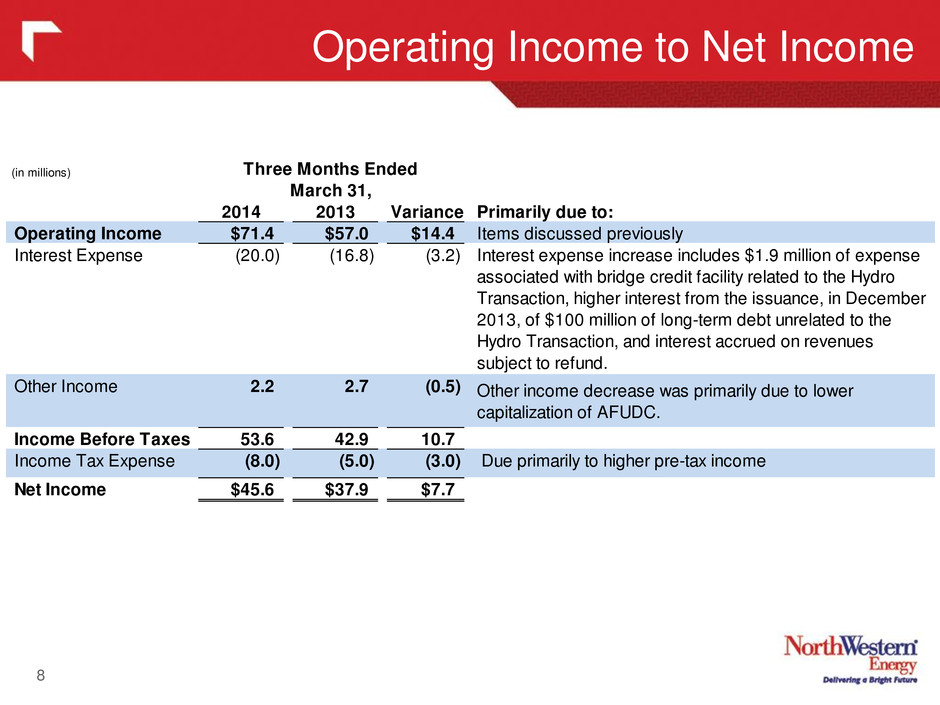
Operating Income to Net Income 8 (in millions) 2014 2013 Variance Primarily due to: Operating Income $71.4 $57.0 $14.4 Items discussed previously Interest Expense (20.0) (16.8) (3.2) Interest expense increase includes $1.9 million of expense associated with bridge credit facility related to the Hydro Transaction, higher interest from the issuance, in December 2013, of $100 million of long-term debt unrelated to the Hydro Transaction, and interest accrued on revenues subject to refund. Other Income 2.2 2.7 (0.5) Other income decrease was primarily due to lower capitalization of AFUDC. Income Before Taxes 53.6 42.9 10.7 Income Tax Expense (8.0) (5.0) (3.0) Due primarily to higher pre-tax income Net Income $45.6 $37.9 $7.7 Three Months Ended March 31,

(in millions) As of March 31, As of December 31, 2014 2013 Cash 19.5$ 16.6$ Restricted cash 12.6 6.9 Accounts receivable, net 171.2 174.9 Inventories 38.1 55.6 Other current assets 75.6 67.0 Goodwill 355.1 355.1 PP&E and other non-current assets 3,079.2 3,039.2 Total Assets 3,751.3$ 3,715.3$ Payables 68.7 93.0 Current maturities of long-term debt & capital leases 1.7 1.7 Short-term borrowings 85.0 141.0 Other current liabilities 263.9 228.0 Long-term debt & capital leases 1,184.6 1,185.0 Other non-current liabilities 1,073.1 1,035.9 Shareholders' equity 1,074.3 1,030.7 Total Liabilities and Equity 3,751.3$ 3,715.3$ Capitalization: Current maturities of long-term debt & capital leases 1.7 1.7 Short Term borrowings 85.0 141.0 Long Term Debt & Capital Leases 1,184.6 1,185.0 Less: Basin Creek Capital Lease (31.1) (31.4) Shareholders' Equity 1,074.3 1,030.7 Total Capitalization 2,314.5$ 2,327.0$ Ratio of Debt to Total Capitalization 53.6% 55.7% Balance Sheet 9
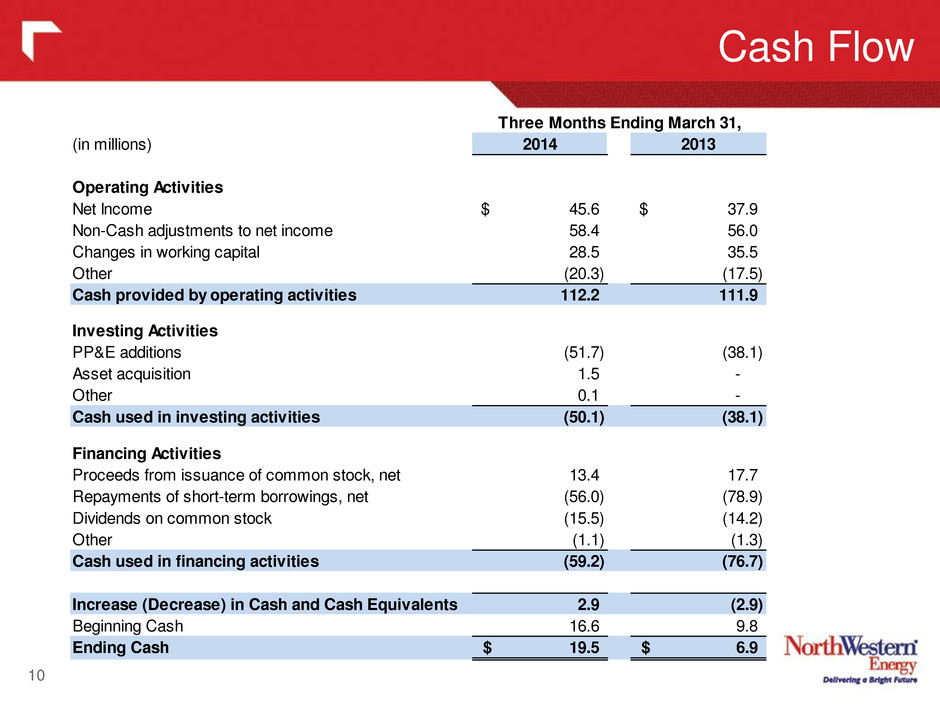
Cash Flow 10 (in millions) 2014 2013 Operating Activities Net Income 45.6$ 37.9$ Non-Cash adjustments to net income 58.4 56.0 Changes in working capital 28.5 35.5 Other (20.3) (17.5) Cash provided by operating activities 112.2 111.9 Investing Activities PP&E additions (51.7) (38.1) Asset acquisition 1.5 - Other 0.1 - Cash used in investing activities (50.1) (38.1) Financing Activities Proceeds from issuance of common stock, net 13.4 17.7 Repayments of short-term borrowings, net (56.0) (78.9) Dividends on common stock (15.5) (14.2) Other (1.1) (1.3) Cash used in financing activities (59.2) (76.7) Increase (Decrease) in Cash and Cash Equivalents 2.9 (2.9) Beginning Cash 16.6 9.8 Ending Cash 19.5$ 6.9$ Three Months Ending March 31,

Adjusted EPS Schedule 11 2014 Q1 2014 Q2 2014 Q3 2014 Q4 2014 FY 2014 Reported GAAP diluted EPS 1.17$ 1.17$ Non-GAAP Adjustments: Weather (0.05) (0.05)$ Hydro transaction professional fees & bridge financing 0.04 0.04$ Adjusted diluted EPS 1.16$ -$ -$ -$ 1.16$ 2013 Q1 2013 Q2 2013 Q3 2013 Q4 2013 FY 2013 Reported GAAP diluted EPS 1.01$ 0.37 0.40 0.68 2.46$ Non-GAAP Adjustments: Weather (0.02) (0.02) (0.01) (0.05)$ Hydro transaction professional fees & bridge financing 0.05 0.06 0.11$ Prior period DSM lost revenue (incl. accrued interest) (0.04) 0.02 (0.02)$ Adjusted diluted EPS 1.01$ 0.35$ 0.39$ 0.75$ 2.50$ $1.01 $1.17 $- $0.20 $0.40 $0.60 $0.80 $1.00 $1.20 2013 2014 GAAP EPS $1.01 $1.16 $- $0.20 $0.40 $0.60 $0.80 $1.00 $1.20 2013 2014 Non-GAAP Adjusted EPS
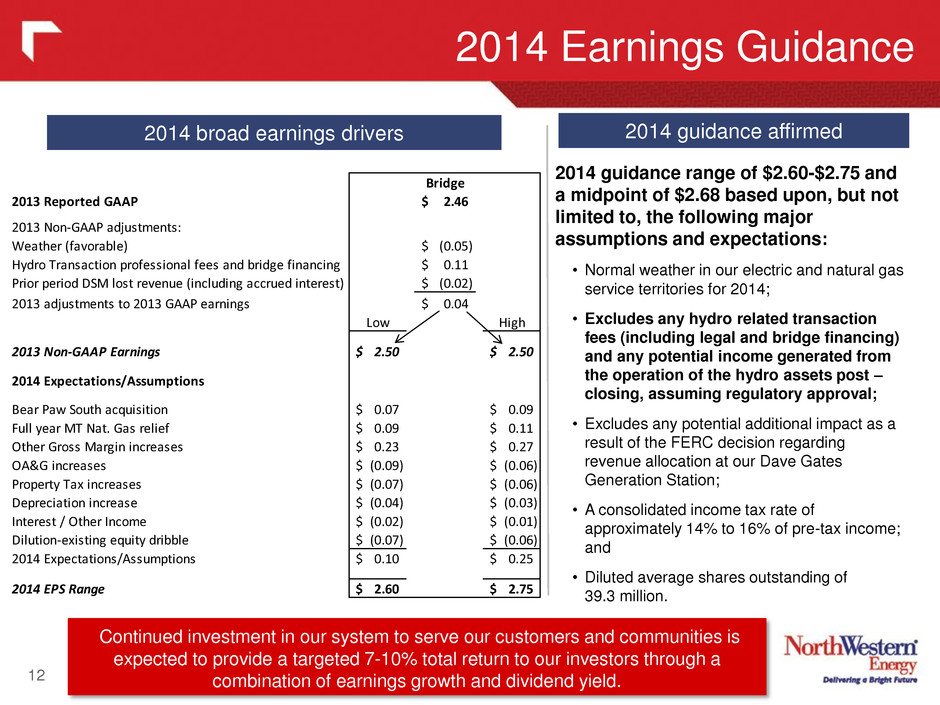
2014 Earnings Guidance 12 Continued investment in our system to serve our customers and communities is expected to provide a targeted 7-10% total return to our investors through a combination of earnings growth and dividend yield. 2014 guidance range of $2.60-$2.75 and a midpoint of $2.68 based upon, but not limited to, the following major assumptions and expectations: • Normal weather in our electric and natural gas service territories for 2014; • Excludes any hydro related transaction fees (including legal and bridge financing) and any potential income generated from the operation of the hydro assets post – closing, assuming regulatory approval; • Excludes any potential additional impact as a result of the FERC decision regarding revenue allocation at our Dave Gates Generation Station; • A consolidated income tax rate of approximately 14% to 16% of pre-tax income; and • Diluted average shares outstanding of 39.3 million. 2014 broad earnings drivers 2014 guidance affirmed Bridge 2013 Reported GAAP 2.46$ 2013 Non-GAAP adjustments: Weather (favorable) (0.05)$ Hydro Transaction professional fees and bridge financing 0.11$ Prior period DSM lost revenue (including accrued interest) (0.02)$ 2013 adjustments to 2013 GAAP earnings 0.04$ Low High 2013 Non-GAAP Earnings 2.50$ 2.50$ 2014 Expectations/Assumptions Bear Paw South acquisition 0.07$ 0.09$ Full year MT Nat. Gas relief 0.09$ 0.11$ Other Gross Margin increases 0.23$ 0.27$ OA&G increases (0.09)$ (0.06)$ Property Tax increases (0.07)$ (0.06)$ Depreciation increase (0.04)$ (0.03)$ Interest / Other Inc me (0.02)$ (0.01)$ Dilution-existing quity dribble (0.07)$ (0.06)$ 2014 Expectation /Assumptions 0.10$ 0.25$ 2014 EPS Range 2.60$ 2.75$
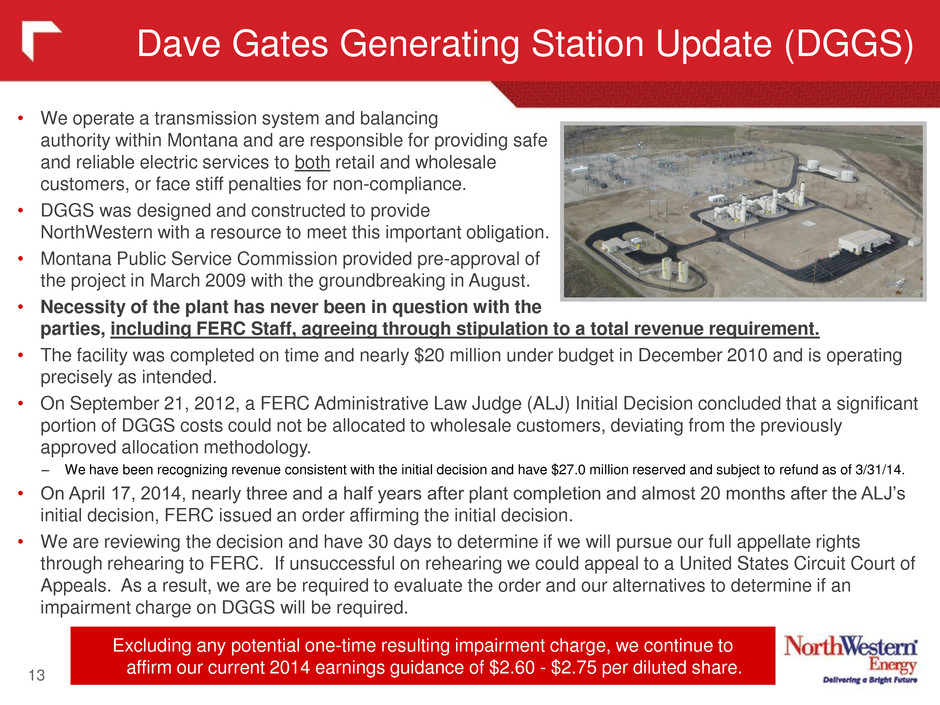
Dave Gates Generating Station Update (DGGS) 13 • We operate a transmission system and balancing authority within Montana and are responsible for providing safe and reliable electric services to both retail and wholesale customers, or face stiff penalties for non-compliance. • DGGS was designed and constructed to provide NorthWestern with a resource to meet this important obligation. • Montana Public Service Commission provided pre-approval of the project in March 2009 with the groundbreaking in August. • Necessity of the plant has never been in question with the parties, including FERC Staff, agreeing through stipulation to a total revenue requirement. • The facility was completed on time and nearly $20 million under budget in December 2010 and is operating precisely as intended. • On September 21, 2012, a FERC Administrative Law Judge (ALJ) Initial Decision concluded that a significant portion of DGGS costs could not be allocated to wholesale customers, deviating from the previously approved allocation methodology. – We have been recognizing revenue consistent with the initial decision and have $27.0 million reserved and subject to refund as of 3/31/14. • On April 17, 2014, nearly three and a half years after plant completion and almost 20 months after the ALJ’s initial decision, FERC issued an order affirming the initial decision. • We are reviewing the decision and have 30 days to determine if we will pursue our full appellate rights through rehearing to FERC. If unsuccessful on rehearing we could appeal to a United States Circuit Court of Appeals. As a result, we are be required to evaluate the order and our alternatives to determine if an impairment charge on DGGS will be required. Excluding any potential one-time resulting impairment charge, we continue to affirm our current 2014 earnings guidance of $2.60 - $2.75 per diluted share.
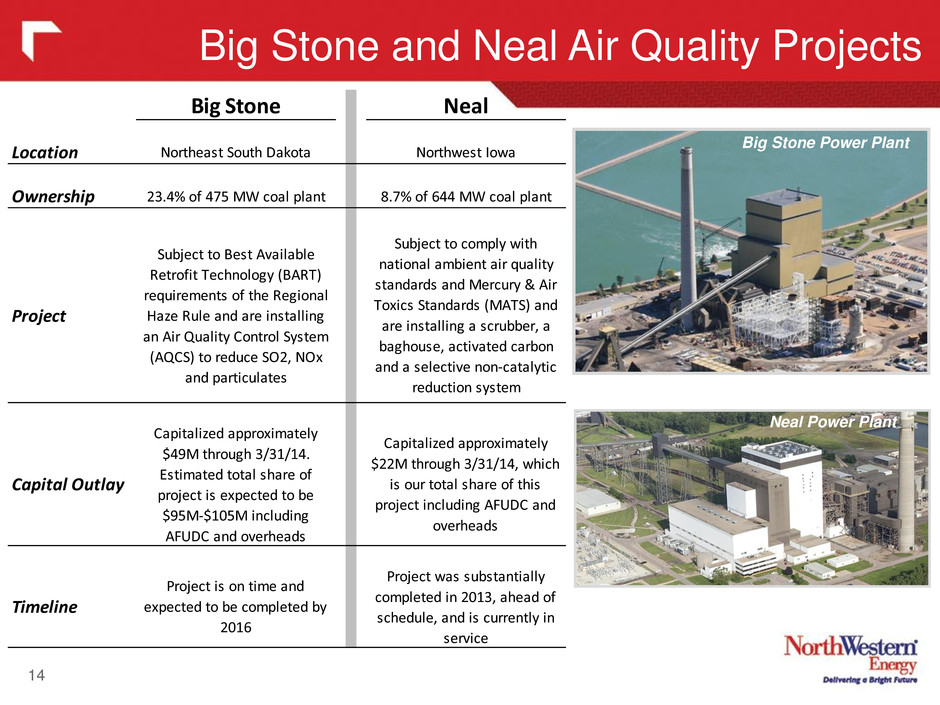
Big Stone and Neal Air Quality Projects 14 Big Stone Power Plant Neal Power Plant Big Stone Neal Location Northeast South Dakota Northwest Iowa Ownership 23.4% of 475 MW coal plant 8.7% of 644 MW coal plant Project Subject to Best Available Retrofit Technology (BART) requirements of the Regional Haze Rule and are installing an Air Quality Control System (AQCS) to reduce SO2, NOx and particulates Subject to comply with national ambient air quality standards and Mercury & Air Toxics Standards (MATS) and are installing a scrubber, a baghouse, activated carbon and a selective non-catalytic reduction system Capital Outlay Capitalized approximately $49M through 3/31/14. Estimated total share of project is expected to be $95M-$105M including AFUDC and overheads Capitalized approximately $22M through 3/31/14, which is our total share of this project including AFUDC and overheads Timeline Project is on time and expected to be completed by 2016 Project was substantially completed in 2013, ahead of schedule, and is currently in service
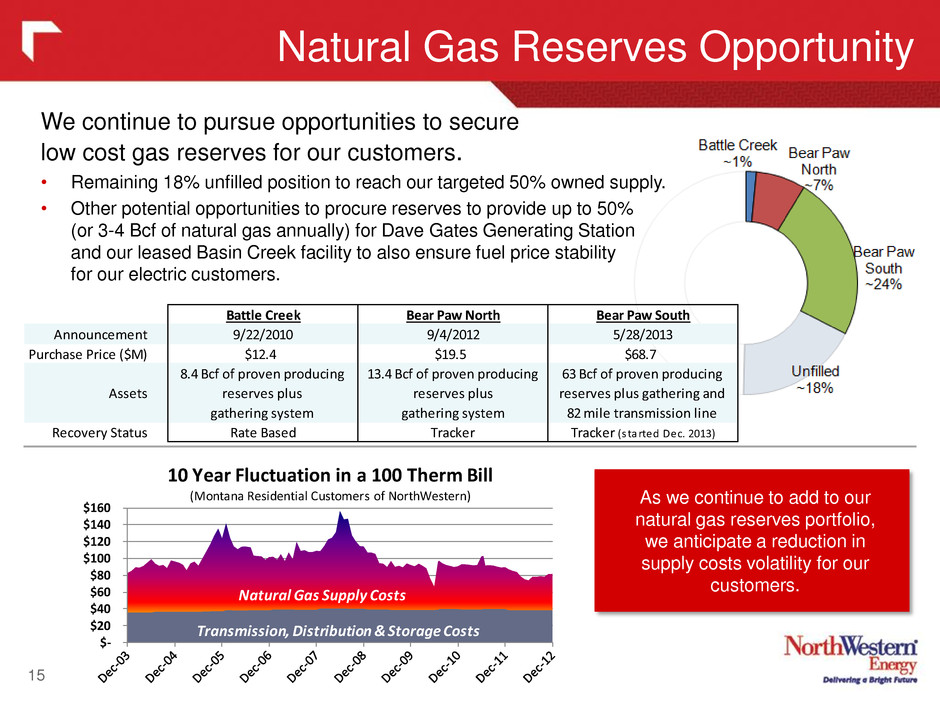
Natural Gas Reserves Opportunity 15 We continue to pursue opportunities to secure low cost gas reserves for our customers. • Remaining 18% unfilled position to reach our targeted 50% owned supply. • Other potential opportunities to procure reserves to provide up to 50% (or 3-4 Bcf of natural gas annually) for Dave Gates Generating Station and our leased Basin Creek facility to also ensure fuel price stability for our electric customers. $- $20 $40 $60 $80 $100 $120 $140 $160 Transmission, Distribution & Storage Costs Natural Gas Supply Costs 10 Year Fluctuation in a 100 Therm Bill (Montana Residential Customers of NorthWestern) As we continue to add to our natural gas reserves portfolio, we anticipate a reduction in supply costs volatility for our customers. Battle Creek Bear Paw North Bear Paw South Announcement 9/22/2010 9/4/2012 5/28/2013 Purchase Price ($M) $12.4 $19.5 $68.7 Assets 8.4 Bcf of proven producing reserves plus gathering sy tem 13.4 Bcf of proven producing reserves plus gathering system 63 Bcf of proven producing reserves plus gathering and 82 mile transmission line Recovery Status Rate Based Tracker Tracker (s tarted Dec. 2013)

Distribution System Infrastructure Project 16 • Montana Distribution System Infrastructure Project (DSIP) to maintain a safe and reliable electric and natural gas distribution system. – The primary goals: reverse the trend in aging infrastructure, maintain reliability, proactively manage safety, build capacity into the system, and prepare our network for the adoption of new technologies. – Based on our current plans, along with the MPSC's approval of the accounting order, we believe DSIP-related expenses and capital expenditures will be recovered in base rates through future general rate cases. ($millions) CAPEX O&M CAPEX O&M CAPEX O&M CAPEX O&M Electric Utility Total $59 $17 $45 $7 $127 $32 $231 $56 Natural Gas Utility Total 18 2 7 1 27 14 52 17 Other Total 4 6 - 1 0 9 4 16 Project Total $81 $25 $52 $9 $154 $55 $287 $89 Accounting Order ($13) $3 $10 $0 Estimated P&L Impact $12 $12 $65 $89 BudgetActual 2011 - 2013 2014 2015 - 2017 2011-17 Total Estimated Cost w/inflation

Pending Hydro Transaction Our Vision Statement: Working together to deliver safe, reliable and innovative energy solutions that create value for our customers, communities, employees and investors. With the addition of these assets, we anticipate over 50% of our owned and contracted generation in Montana will come from hydro and wind. • Opportunity to acquire clean, reliable, long-lived generation assets near the bottom of commodity price cycle • Provides multiple generations of customers with long-term energy certainty and locks in rate stability with modest impact of ~5% increase from Sept. 2013 rates to total residential bills • Transaction helps match owned generation with load requirements • Increases fuel-type diversity of generation fleet with significant increase in sustainable generation • Consistent with focus on our existing regulated utility business and all of our customers Customers • Reinforces and expands NorthWestern’s commitment to Montana, its people and its environment • Evolving environmental regulation may make Montana hydro assets even more valuable • Allows NorthWestern to increase its commitment to charitable giving throughout Montana Communities • Combination of existing NorthWestern employees with extensive hydroelectric backgrounds and at least 70 PPL employees • Increased opportunity for professional growth for both existing employees and employees who transfer when the sale closes • NorthWestern remains committed to competitive pay and benefits Employees • Inclusion of assets in regulated rate base • Expected to be accretive in first full year of operations • Expected to maintain or enhance credit strength Investors 17
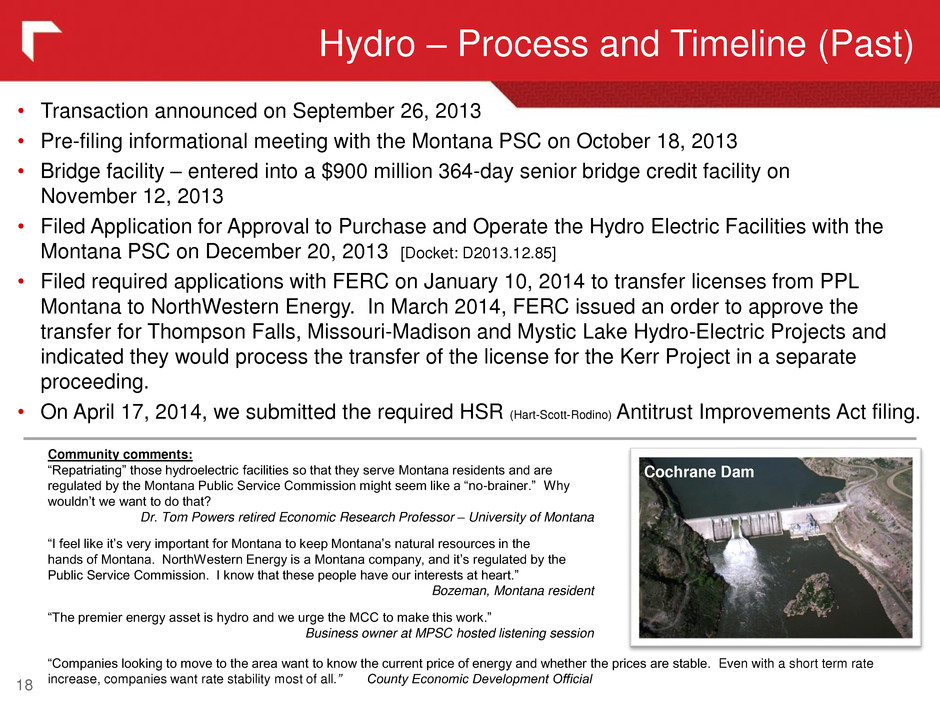
• Transaction announced on September 26, 2013 • Pre-filing informational meeting with the Montana PSC on October 18, 2013 • Bridge facility – entered into a $900 million 364-day senior bridge credit facility on November 12, 2013 • Filed Application for Approval to Purchase and Operate the Hydro Electric Facilities with the Montana PSC on December 20, 2013 [Docket: D2013.12.85] • Filed required applications with FERC on January 10, 2014 to transfer licenses from PPL Montana to NorthWestern Energy. In March 2014, FERC issued an order to approve the transfer for Thompson Falls, Missouri-Madison and Mystic Lake Hydro-Electric Projects and indicated they would process the transfer of the license for the Kerr Project in a separate proceeding. • On April 17, 2014, we submitted the required HSR (Hart-Scott-Rodino) Antitrust Improvements Act filing. Hydro – Process and Timeline (Past) 18 Cochrane Dam Community comments: “Repatriating” those hydroelectric facilities so that they serve Montana residents and are regulated by the Montana Public Service Commission might seem like a “no-brainer.” Why wouldn’t we want to do that? Dr. Tom Powers retired Economic Research Professor – University of Montana “I feel like it’s very important for Montana to keep Montana’s natural resources in the hands of Montana. NorthWestern Energy is a Montana company, and it’s regulated by the Public Service Commission. I know that these people have our interests at heart.” Bozeman, Montana resident “The premier energy asset is hydro and we urge the MCC to make this work.” Business owner at MPSC hosted listening session “Companies looking to move to the area want to know the current price of energy and whether the prices are stable. Even with a short term rate increase, companies want rate stability most of all.” County Economic Development Official
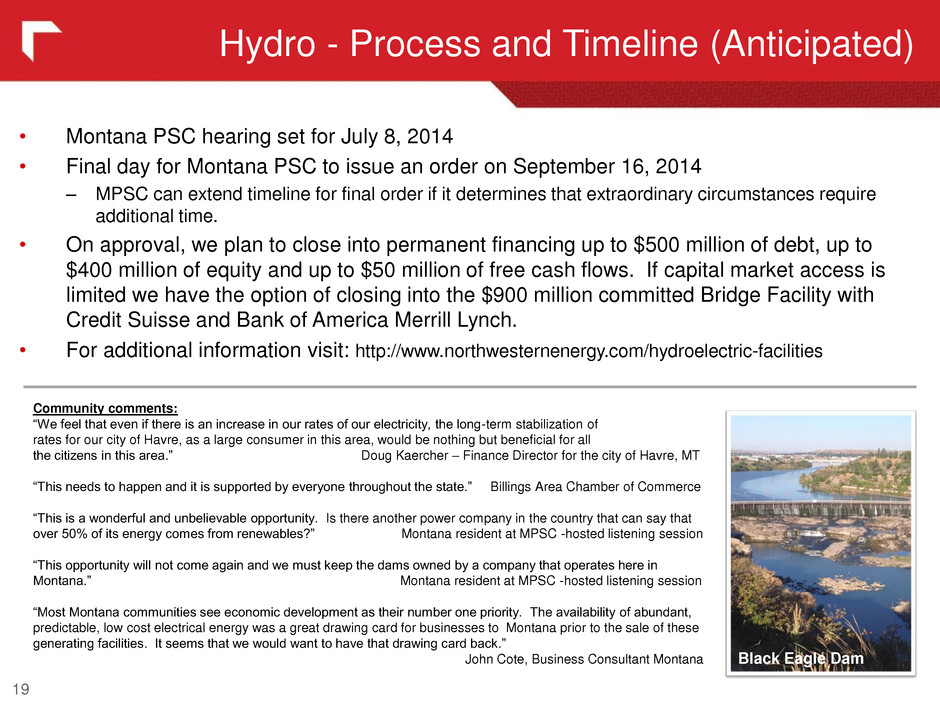
Hydro - Process and Timeline (Anticipated) 19 • Montana PSC hearing set for July 8, 2014 • Final day for Montana PSC to issue an order on September 16, 2014 – MPSC can extend timeline for final order if it determines that extraordinary circumstances require additional time. • On approval, we plan to close into permanent financing up to $500 million of debt, up to $400 million of equity and up to $50 million of free cash flows. If capital market access is limited we have the option of closing into the $900 million committed Bridge Facility with Credit Suisse and Bank of America Merrill Lynch. • For additional information visit: http://www.northwesternenergy.com/hydroelectric-facilities Black Eagle Dam Community comments: “We feel that even if there is an increase in our rates of our electricity, the long-term stabilization of rates for our city of Havre, as a large consumer in this area, would be nothing but beneficial for all the citizens in this area.” Doug Kaercher – Finance Director for the city of Havre, MT “This needs to happen and it is supported by everyone throughout the state.” Billings Area Chamber of Commerce “This is a wonderful and unbelievable opportunity. Is there another power company in the country that can say that over 50% of its energy comes from renewables?” Montana resident at MPSC -hosted listening session “This opportunity will not come again and we must keep the dams owned by a company that operates here in Montana.” Montana resident at MPSC -hosted listening session “Most Montana communities see economic development as their number one priority. The availability of abundant, predictable, low cost electrical energy was a great drawing card for businesses to Montana prior to the sale of these generating facilities. It seems that we would want to have that drawing card back.” John Cote, Business Consultant Montana

20 APPENDIX

21 EPS Reconciliation NORTHWESTERN CORPORATION Three Months Ended March 31, 2014 ($millions, except EPS) T h re e M o n th s E n d ed , M ar ch 3 1, 2 01 3 N at ur al g as p ro du ct io n E le ct ric r et ai l v ol um es M on ta na n at ur al g as r at e in cr ea se N at ur al g as r et ai l v ol um es N at ur al g as p ro du ct io n La bo r H yd ro T ra ns ac tio n co st s S ta te in co m e, n et o f fe de ra l p ro vi si on s F lo w -t hr ou gh r ep ai rs d ed uc tio ns P ro du ct io n ta x cr ed its P la nt a nd d ep re ci at io n of f lo w t hr ou gh it em s O th er p er m an en t or f lo w t hr ou gh a dj us tm en ts , ne t Im pa ct o f hi gh er s ha re c ou nt (m ai nl y eq ui ty s he lf pr og ra m ) A ll ot he r, n et T h re e M o n th s E n d ed , M ar ch 3 1, 2 01 4 Gross Margin 180.8$ 9.5 5.7 4.5 3.2 (1.4) 202.3$ Operating Expenses Op.,Gen., & Administrative 68.8 2.2 1.6 0.8 (1.3) 72.1 Prop. & other taxes 25.8 2.7 28.5 Depreciation 29.2 1.1 30.3 Total Operating Expense 123.8 - - - - 2.2 1.6 0.8 - - - - - - 2.5 130.9 Operating Income 57.0 9.5 5.7 4.5 3.2 (2.2) (1.6) (0.8) - - - - - - (3.9) 71.4 Interest Expense (16.8) (3.2) (20.0) Other Income (Expense) 2.7 (0.5) 2.2 Income Before Inc. Taxes 42.9 9.5 5.7 4.5 3.2 (2.2) (1.6) (0.8) - - - - - (7.6) 53.6 Income Tax Benefit (Expense)1 (5.0) (3.7) (2.2) (1.7) (1.2) 0.8 0.6 0.3 (1.8) 2.0 0.2 0.4 - - 3.2 (8.0) Net Income (Loss) 37.9$ 5.8 3.5 2.8 2.0 (1.4) (1.0) (0.5) (1.8) 2.0 0.2 0.4 - - (4.3) 45.6$ Diluted Shares 37.49 1.47 - 38.95 Diluted EPS 1.01$ 0.15 0.09 0.07 0.05 (0.04) (0.03) (0.01) (0.05) 0.05 0.01 0.01 - (0.05) (0.09) 1.17$ 1.) Income Tax Benefit (Expense) calculation on reconciling items assumes effective tax rate of 38.5%. 2.) EPS calculated using f irst quarter 2014's diluted share count of 38.955 million.
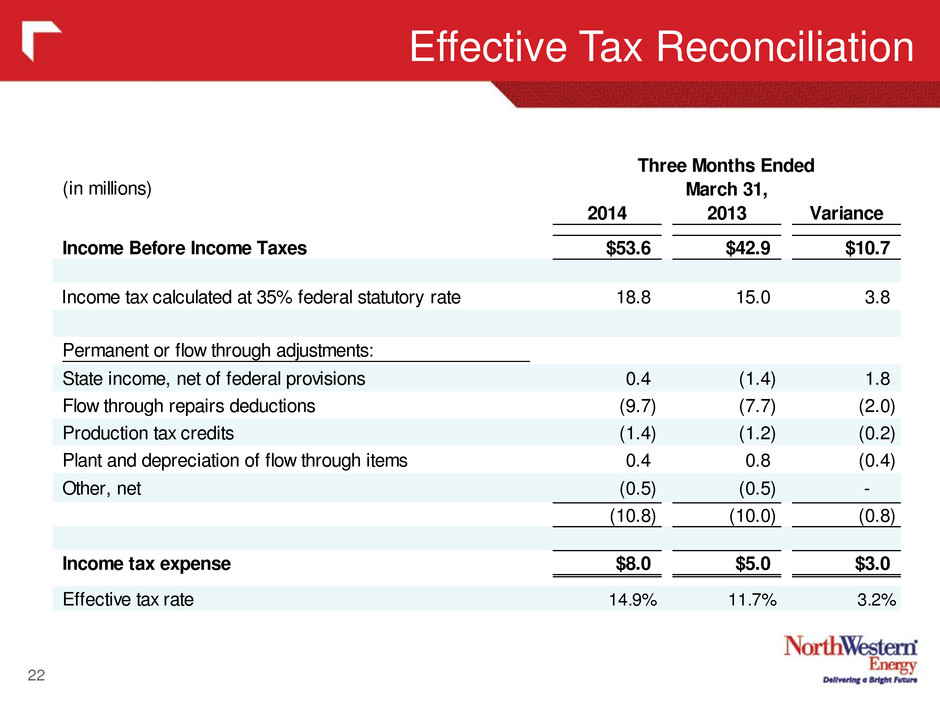
Effective Tax Reconciliation 22 (in millions) 2014 2013 Variance Income Before Income Taxes $53.6 $42.9 $10.7 Income tax calculated at 35% federal statutory rate 18.8 15.0 3.8 Permanent or flow through adjustments: State income, net of federal provisions 0.4 (1.4) 1.8 Flow through repairs deductions (9.7) (7.7) (2.0) Production tax credits (1.4) (1.2) (0.2) Plant and depreciation of flow through items 0.4 0.8 (0.4) Other, net (0.5) (0.5) - (10.8) (10.0) (0.8) Income tax expense $8.0 $5.0 $3.0 Effective tax rate 14.9% 11.7% 3.2% Three Months Ended March 31,
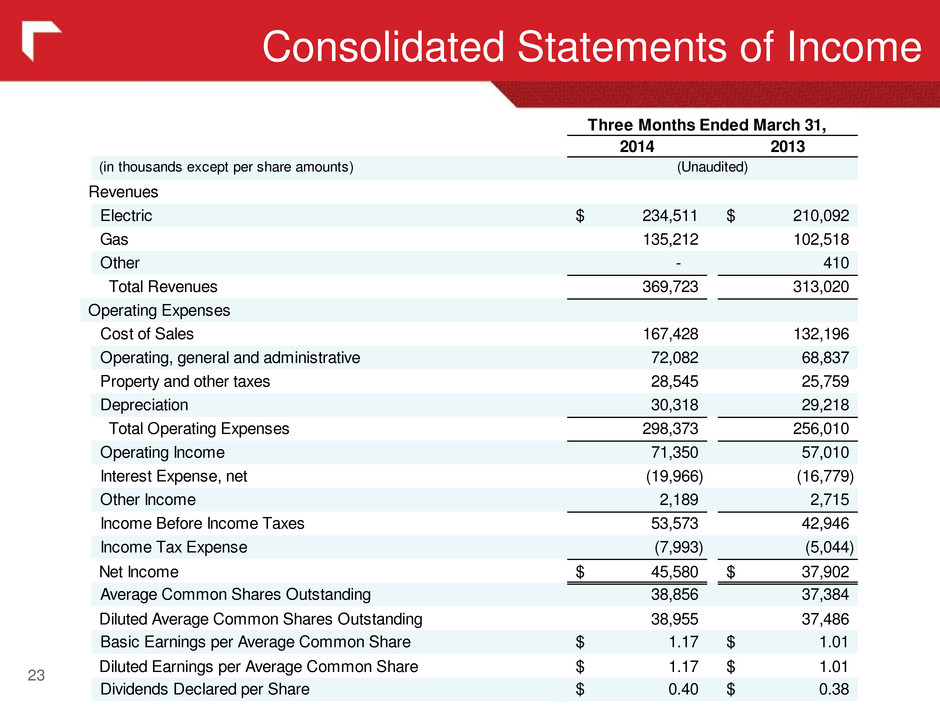
23 Consolidated Statements of Income 2014 2013 (in thousands except per share amounts) Revenues Electric 234,511$ 210,092$ Gas 135,212 102,518 Other - 410 Total Revenues 369,723 313,020 Operating Expenses Cost of Sales 167,428 132,196 Operating, general and administrative 72,082 68,837 Property and other taxes 28,545 25,759 Depreciation 30,318 29,218 Total Operating Expenses 298,373 256,010 Operating Income 71,350 57,010 Interest Expense, net (19,966) (16,779) Other Income 2,189 2,715 Income Before Income Taxes 53,573 42,946 Income Tax Expense (7,993) (5,044) Net Income 45,580$ 37,902$ Average Common Shares Outstanding 38,856 37,384 Diluted Average Common Shares Outstanding 38,955 37,486 Basic Earnings per Average Common Share 1.17$ 1.01$ Diluted Earnings per Average Common Share 1.17$ 1.01$ Dividends Declared per Share 0.40$ 0.38$ (Unaudited) Three Months Ended March 31,
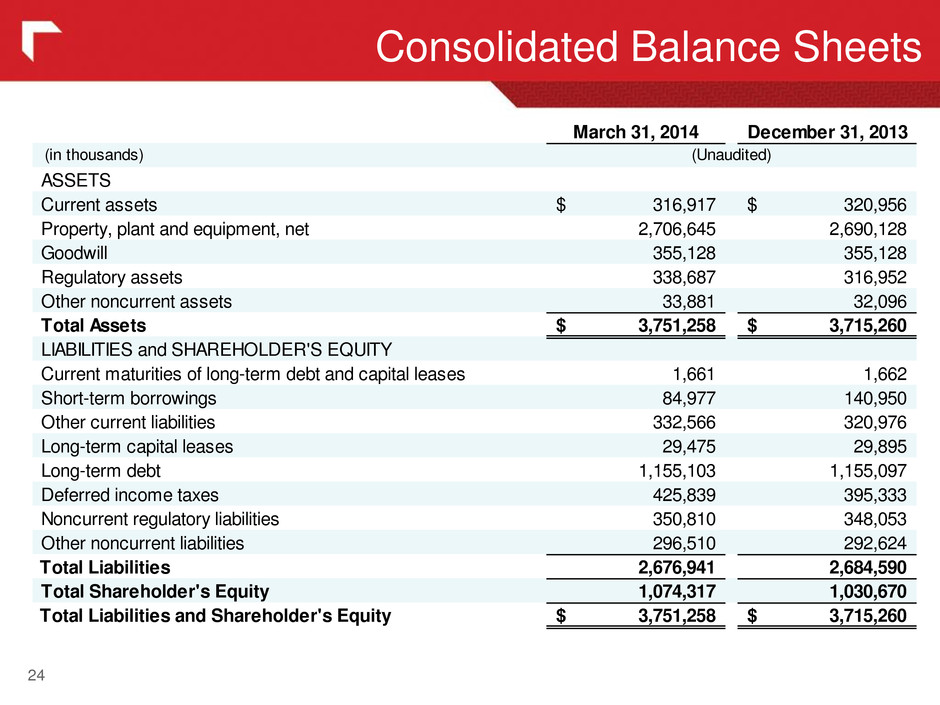
24 Consolidated Balance Sheets March 31, 2014 December 31, 2013 (in thousands) ASSETS Current assets 316,917$ 320,956$ Property, plant and equipment, net 2,706,645 2,690,128 Goodwill 355,128 355,128 Regulatory assets 338,687 316,952 Other noncurrent assets 33,881 32,096 Total Assets 3,751,258$ 3,715,260$ LIABILITIES and SHAREHOLDER'S EQUITY Current maturities of long-term debt and capital leases 1,661 1,662 Short-term borrowings 84,977 140,950 Other current liabilities 332,566 320,976 Long-term capital leases 29,475 29,895 Long-term debt 1,155,103 1,155,097 Deferred income taxes 425,839 395,333 Noncurrent regulatory liabilities 350,810 348,053 Other noncurrent liabilities 296,510 292,624 Total Liabilities 2,676,941 2,684,590 Total Shareholder's Equity 1,074,317 1,030,670 Total Liabilities and Shareholder's Equity 3,751,258$ 3,715,260$ (Unaudited)
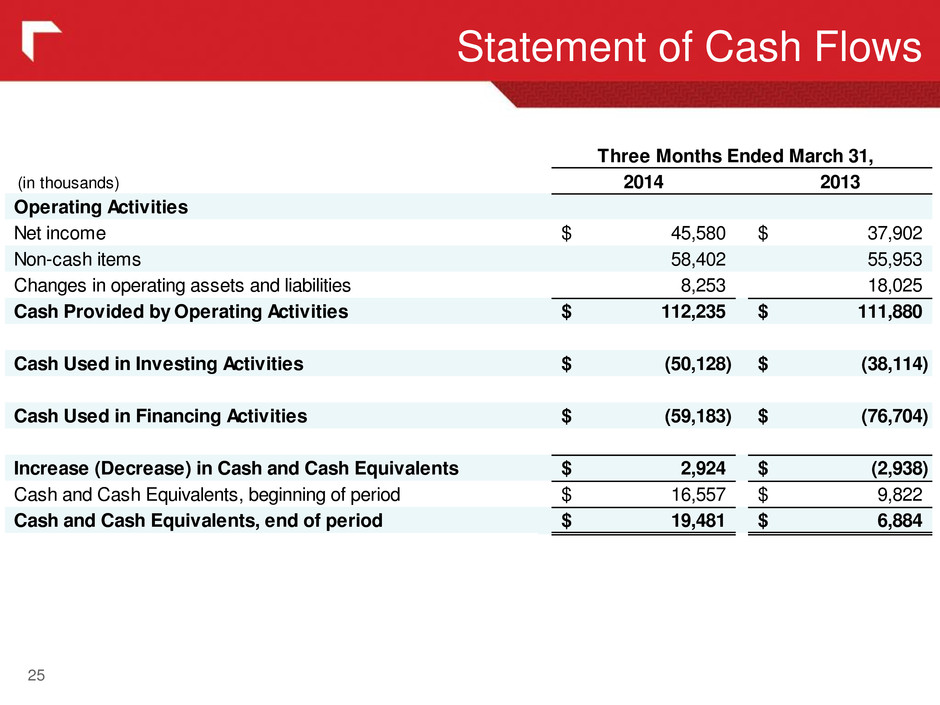
25 Statement of Cash Flows (in thousands) 2014 2013 Operating Activities Net income 45,580$ 37,902$ Non-cash items 58,402 55,953 Changes in operating assets and liabilities 8,253 18,025 Cash Provided by Operating Activities 112,235$ 111,880$ Cash Used in Investing Activities (50,128)$ (38,114)$ Cash Used in Financing Activities (59,183)$ (76,704)$ Increase (Decrease) in Cash and Cash Equivalents 2,924$ (2,938)$ Cash and Cash Equivalents, beginning of period 16,557$ 9,822$ Cash and Cash Equivalents, end of period 19,481$ 6,884$ Three Months Ended March 31,

26 Regulated Electric Segment Heating Degree Days 2014 2013 Historic Average 2013 Historic Average Montana 3,475 3,223 3,275 8% colder 6% colder S uth Dakota 4,626 4, 17 4,098 10 l r 13 l r Degree Days 4 as compared with: (dollars in millions) 2014 2013 Change % Change Retail revenues 209.5$ 200.0$ 9.5$ 4.8% Regulatory amortization 9.3 (5.9) 15.2 (257.6) Total retail revenue 218.8 194.1 24.7 12.7 Transmission 13.4 13.6 (0.2) (1.5) Ancillary services 0.4 0.4 - - Wholesale 0.2 0.5 (0.3) (60.0) Other 1.7 1.5 0.2 13.3 Total Revenues 234.5 210.1 24.4 11.6 Total Cost of Sales 101.6 83.1 18.5 22.3 Gross Margin 132.9$ 127.0$ 5.9$ 4.6% 2014 2013 2014 2013 2014 2013 Retail Electric Montana 79,807$ 76,006$ 732 681 282,250 279,841 South Dakota 15,396 13,824 200 178 49,563 49,175 Residential 95,203 89,830 932 859 331,813 329,016 Montana 80,804 77,772 815 780 63,480 63,024 South Dakota 18,579 17,344 256 245 12,166 12,060 Commercial 99,383 95,116 1,071 1,025 75,646 75,084 Industrial 10,190 10,401 674 748 74 74 Other 4,682 4,660 23 23 4,644 4,509 Total Retail Electric 209,458$ 200,007$ 2,700 2,655 412,177 408,683 Total Wholesale Electric 244$ 507$ 11 23 - - Megawatt Hours (MWH) Avg. Customer CountRevenues (in thousands) Results
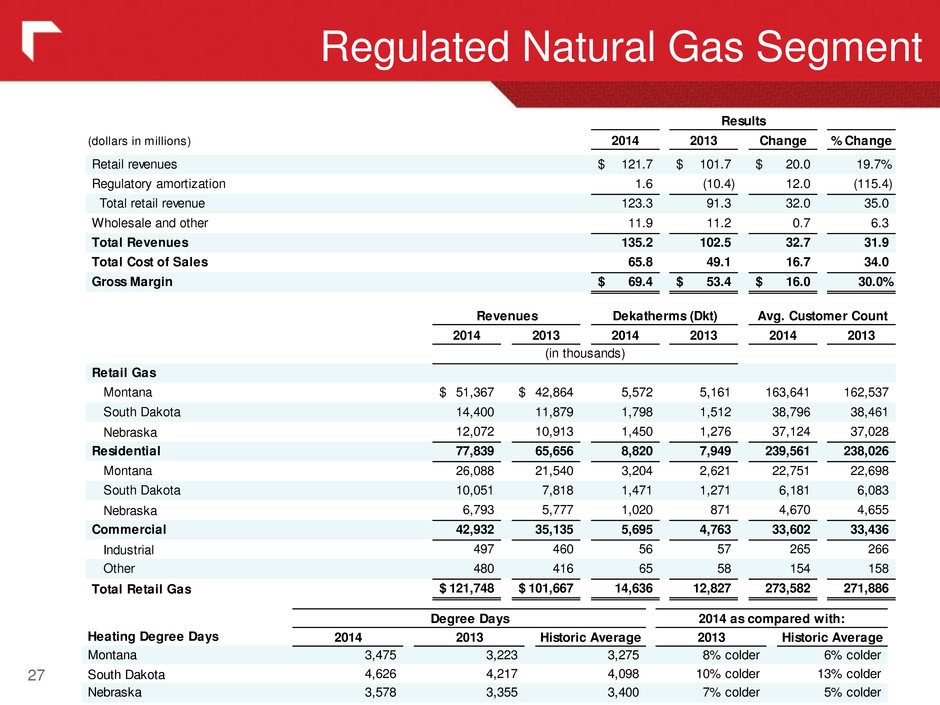
27 Regulated Natural Gas Segment Heating Degree Days 2014 2013 Historic Average 2013 Historic Average Montana 3,475 3,223 3,275 8% colder 6% colder S uth Dakota 4,626 4, 17 4,098 10 c l r 13 c l r Nebrask 3,578 3,355 3,400 7% colder 5% colder Degree Days 4 as compared with: (dollars in millions) 2014 2013 Change % Change Retail revenues 121.7$ 101.7$ 20.0$ 19.7% Regulatory amortization 1.6 (10.4) 12.0 (115.4) Total retail revenue 123.3 91.3 32.0 35.0 Wholesale and other 11.9 11.2 0.7 6.3 Total Revenues 135.2 102.5 32.7 31.9 Total Cost of Sales 65.8 49.1 16.7 34.0 Gross Margin 69.4$ 53.4$ 16.0$ 30.0% 2014 2013 2014 2013 2014 2013 Retail Gas Montana 51,367$ 42,864$ 5,572 5,161 163,641 162,537 South Dakota 14,400 11,879 1,798 1,512 38,796 38,461 Nebraska 12,072 10,913 1,450 1,276 37,124 37,028 Residential 77,839 65,656 8,820 7,949 239,561 238,026 Montana 26,088 21,540 3,204 2,621 22,751 22,698 South Dakota 10,051 7,818 1,471 1,271 6,181 6,083 Nebraska 6,793 5,777 1,020 871 4,670 4,655 Commercial 42,932 35,135 5,695 4,763 33,602 33,436 Industrial 497 460 56 57 265 266 Other 480 416 65 58 154 158 Total Retail Gas 121,748$ 101,667$ 14,636 12,827 273,582 271,886 Avg. Customer Count Results (in thousands) Revenues Dekatherms (Dkt)
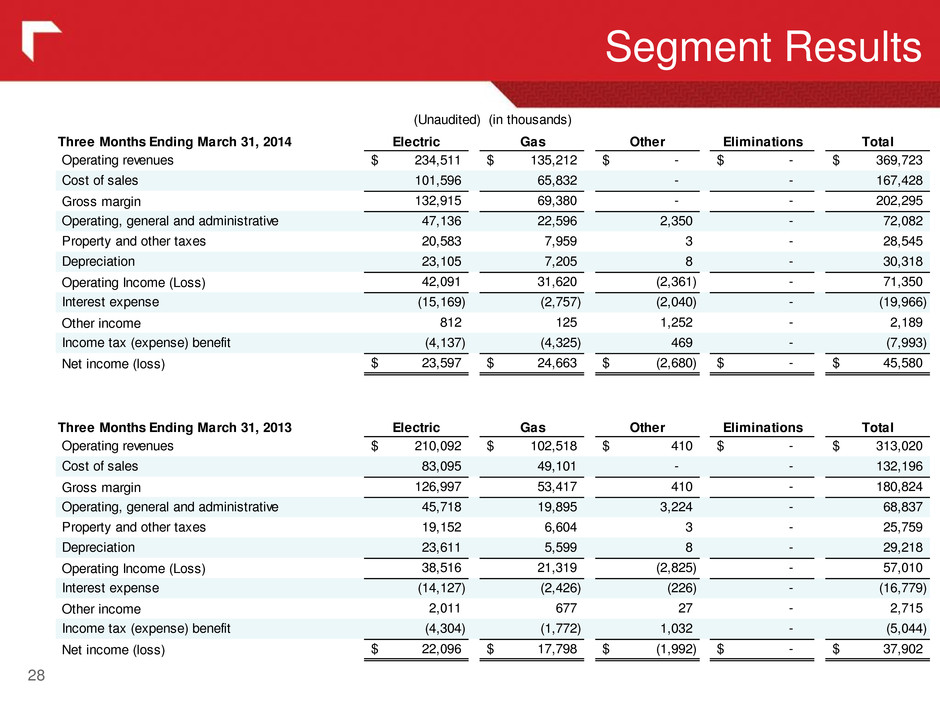
28 Segment Results Three Months Ending March 31, 2014 Electric Gas Other Eliminations Total Operating revenues 234,511$ 135,212$ -$ -$ 369,723$ Cost of sales 101,596 65,832 - - 167,428 Gross margin 132,915 69,380 - - 202,295 Operating, general and administrative 47,136 22,596 2,350 - 72,082 Property and other taxes 20,583 7,959 3 - 28,545 Depreciation 23,105 7,205 8 - 30,318 Operating Income (Loss) 42,091 31,620 (2,361) - 71,350 Interest expense (15,169) (2,757) (2,040) - (19,966) Other income 812 125 1,252 - 2,189 Income tax (expense) benefit (4,137) (4,325) 469 - (7,993) Net income (loss) 23,597$ 24,663$ (2,680)$ -$ 45,580$ Three Months Ending March 31, 2013 Electric Gas Other Eliminations Total Operating revenues 210,092$ 102,518$ 410$ -$ 313,020$ Cost of sales 83,095 49,101 - - 132,196 Gross margin 126,997 53,417 410 - 180,824 Operating, general and administrative 45,718 19,895 3,224 - 68,837 Property and other taxes 19,152 6,604 3 - 25,759 Depreciation 23,611 5,599 8 - 29,218 Operating Income (Loss) 38,516 21,319 (2,825) - 57,010 Interest expense (14,127) (2,426) (226) - (16,779) Other income 2,011 677 27 - 2,715 Income tax (expense) benefit (4,304) (1,772) 1,032 - (5,044) Net income (loss) 22,096$ 17,798$ (1,992)$ -$ 37,902$ (Unaudited) (in thousands)

These materials include financial information prepared in accordance with GAAP, as well as other financial measures, such as Gross Margin and Adjusted Diluted EPS, that are considered “non-GAAP financial measures.” Generally, a non-GAAP financial measure is a numerical measure of a company's financial performance, financial position or cash flows that exclude (or include) amounts that are included in (or excluded from) the most directly comparable measure calculated and presented in accordance with GAAP. Gross Margin (Revenues less Cost of Sales) is a non-GAAP financial measure due to the exclusion of depreciation from the measure. Gross Margin is used by us to determine whether we are collecting the appropriate amount of energy costs from customers to allow recovery of operating costs. Adjusted Diluted EPS is another non-GAAP measure. The Company believes the presentation of Adjusted Diluted EPS is more representative of our normal earnings than the GAAP EPS due to the exclusion (or inclusion) of certain impacts that are not reflective of ongoing earnings. The presentation of these non-GAAP measures is intended to supplement investors' understanding of our financial performance and not to replace other GAAP measures as an indicator of actual operating performance. Our measures may not be comparable to other companies' similarly titled measures. Non-GAAP Financial Measures 29

30


