
1 AGA Financial Forum | May 18-20, 2014
2 Forward Looking Statements Forward Looking Statements During the course of this presentation, there will be forward- looking statements within the meaning of the “safe harbor” provisions of the Private Securities Litigation Reform Act of 1995. Forward-looking statements often address our expected future business and financial performance, and often contain words such as “expects,” “anticipates,” “intends,” “plans,” “believes,” “seeks,” or “will.” The information in this presentation is based upon our current expectations as of the date hereof unless otherwise noted. Our actual future business and financial performance may differ materially and adversely from our expectations expressed in any forward-looking statements. We undertake no obligation to revise or publicly update our forward-looking statements or this presentation for any reason. Although our expectations and beliefs are based on reasonable assumptions, actual results may differ materially. The factors that may affect our results are listed in certain of our press releases and disclosed in the Company’s 10-Q which we filed with the SEC on April 24, 2014 and our other public filings with the SEC. Company Information NorthWestern Corp. dba: NorthWestern Energy www.northwesternenergy.com Corporate Support Office 3010 West 69th Street Sioux Falls, SD 57106 (605) 978-2900 Montana Operational Support Office 40 East Broadway Butte, MT 59701 (406) 497-1000 SD/NE Operational Support Office 600 Market Street West Huron, SD 57350 (605) 353-7478 Director of Investor Relations Travis Meyer 605-978-2945 travis.meyer@northwestern.com
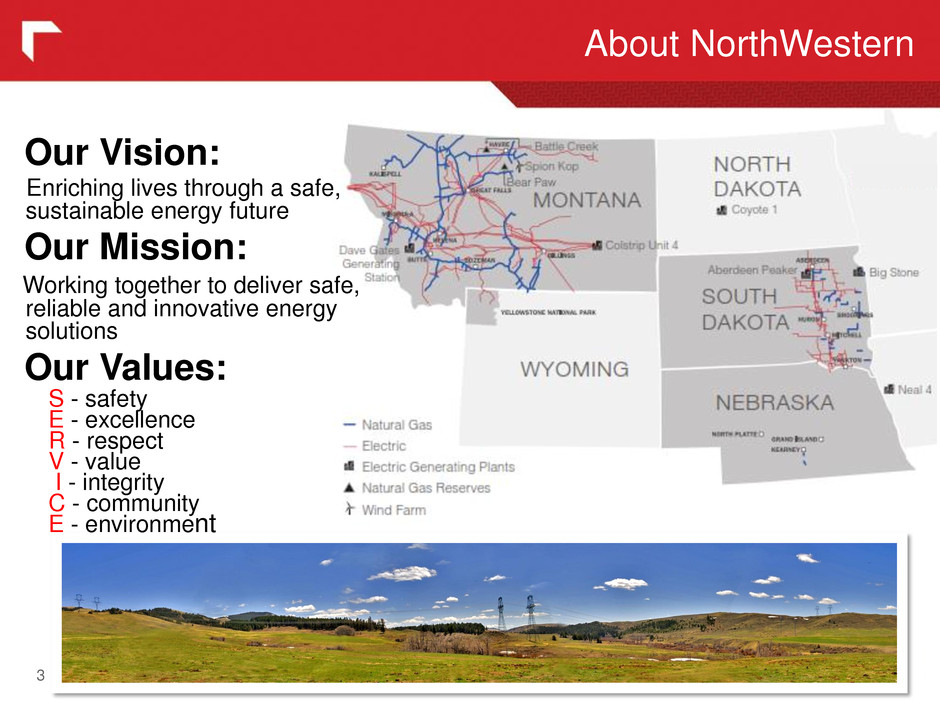
About NorthWestern 3 Our Vision: Enriching lives through a safe, sustainable energy future Our Mission: Working together to deliver safe, reliable and innovative energy solutions Our Values: S - safety E - excellence R - respect V - value I - integrity C - community E - environment
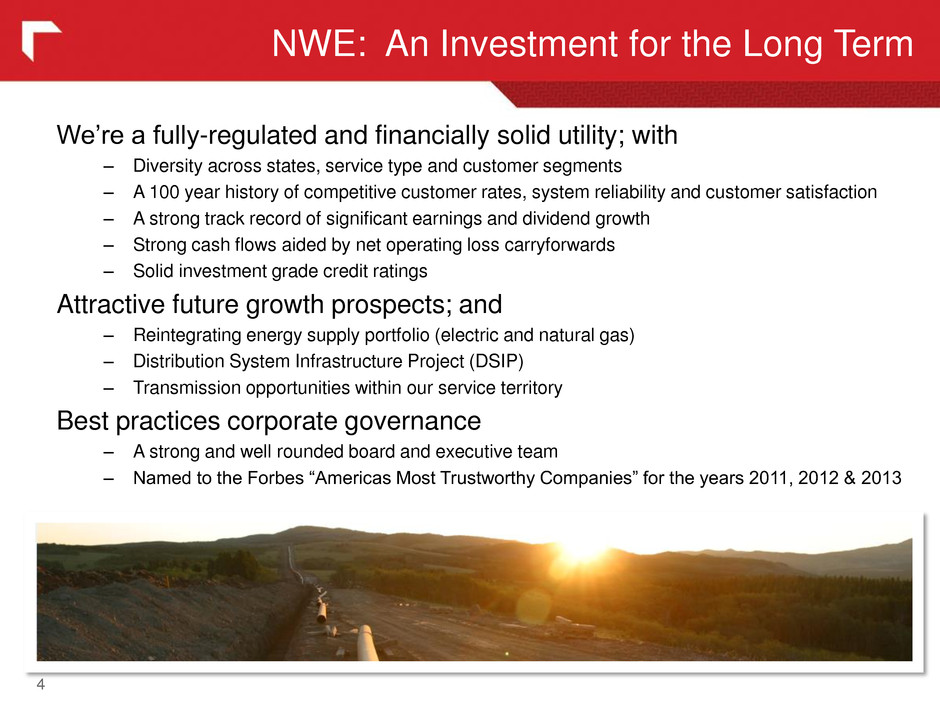
NWE: An Investment for the Long Term 4 We’re a fully-regulated and financially solid utility; with – Diversity across states, service type and customer segments – A 100 year history of competitive customer rates, system reliability and customer satisfaction – A strong track record of significant earnings and dividend growth – Strong cash flows aided by net operating loss carryforwards – Solid investment grade credit ratings Attractive future growth prospects; and – Reintegrating energy supply portfolio (electric and natural gas) – Distribution System Infrastructure Project (DSIP) – Transmission opportunities within our service territory Best practices corporate governance – A strong and well rounded board and executive team – Named to the Forbes “Americas Most Trustworthy Companies” for the years 2011, 2012 & 2013
Fortnightly 40 NorthWestern Energy was recently recognized as one of the top 40 best energy companies in the United States by Fortnightly 40. The report compares shareholder value performance by looking at uniform data sets among the leading publicly traded electric and gas companies across a range of metrics. NYSE Ethics NorthWestern Energy earned an "A" from the New York Stock Exchange's Corpedia, for its Code of Conduct and Ethics, putting it in the top 2 percent of all energy and utility companies reviewed. Forbes America's Most Trustworthy Companies for 2011, 2012 & 2013 For the years 2011, 2012 and 2013, NorthWestern Corporation was recognized by Forbes as one of "America's Most Trustworthy Companies," which identifies the most transparent and trustworthy businesses that trade on the American exchanges. In the past, Forbes turned to Audit Integrity who recently merged with Corporate Library and Governance Metrics International to form GMI Ratings (GMI). GMI's quantitative and qualitative data analysis looks beyond the raw data on companies' income statement and balance sheets to assess the true quality of corporate accounting and management practices. Each year Forbes recognizes 100 companies out of over 8,000 for this foremost honor. New York Stock Exchange Century Index Created in 2012 to recognize companies that have thrived for over a century while demonstrating the ability to innovate, transform and grow through the decades of economic and social progress. Glass Lewis NorthWestern was recognized by Glass Lewis, a leading investment research and global proxy advisory firm, as one of the top 42 companies in the US for its 2011 “Say on Pay” proposals, which recognizes companies with clear disclosure and conservative policy with regards to compensation. Corporate Governance Award Finalist In 2013, for the second straight year, Northwestern Corporation was named a finalist in the category of "Best Proxy Statement (small cap)" given by the Corporate Secretary - Governance, Risk & Compliance organization. Strong Corporate Governance 5
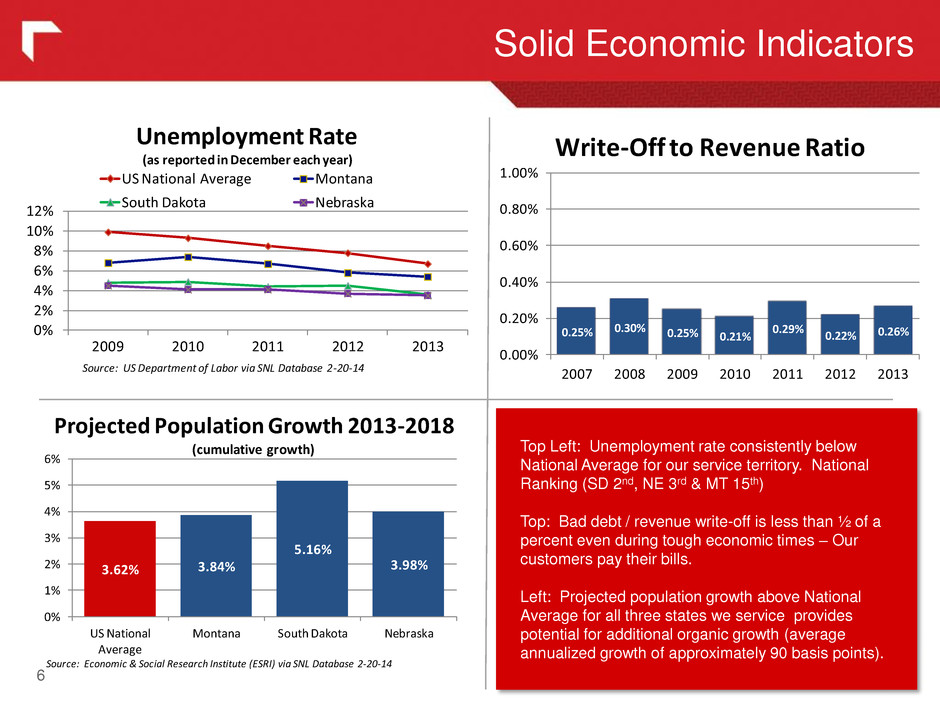
3.62% 3.84% 5.16% 3.98% 0% 1% 2% 3% 4% 5% 6% US National Average Montana South Dakota Nebraska Source: Economic & Social Research Institute (ESRI) via SNL Database 2-20-14 Projected Population Growth 2013-2018 (cumulative growth) Solid Economic Indicators 6 Top Left: Unemployment rate consistently below National Average for our service territory. National Ranking (SD 2nd, NE 3rd & MT 15th) Top: Bad debt / revenue write-off is less than ½ of a percent even during tough economic times – Our customers pay their bills. Left: Projected population growth above National Average for all three states we service provides potential for additional organic growth (average annualized growth of approximately 90 basis points). 0% 2% 4% 6% 8% 10% 12% 2009 2010 2011 2012 2013 US National Average Montana South Dakota Nebraska Source: US Department of Labor via SNL Database 2-20-14 Unemployment Rate (as reported in December each year) 0.25% 0.30% 0.25% 0.21% 0.29% 0.22% 0.26% 0. 0% 0.20% 0.40% 0.60% 0.80% 1.00% 2007 2008 2009 2010 1 2012 2013 Write-Off to Revenue Ratio

A Diversified Electric and Gas Utility 7 The “80/20” rules of NorthWestern Gross Margin in 2013: Electric: $506M Natural Gas: $167M Other $ 2M Gross Margin in 2013: Montana: $561M South Dakota: $103M Nebraska: $ 11M Average Customers in 2013: Residential: 561k Commercial: 108k Industrial: 6k Above data reflects full year 2013 results. Jurisdiction and service type based upon gross margin contribution. See “Non-GAAP Financial Measures” slide in appendix for Gross Margin reconciliation. 83% Montana 15% South Dakota 2% Nebraska 83% Residential 16% Commercial 1% Industrial 75% Electric 25% Natural Gas
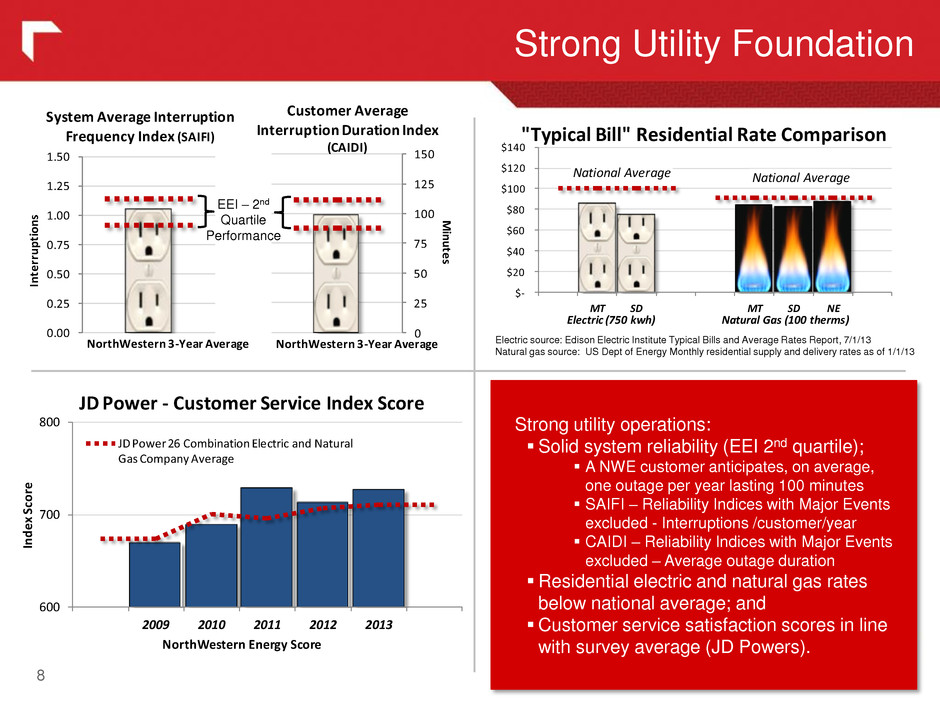
600 700 800 2009 2010 2011 2012 2013 Ind ex Sc or e NorthWestern Energy Score JD Power 26 Combination Electric and Natural Gas Company Average JD Power - Customer Service Index Score 0 25 50 75 100 125 150 M in u te s NorthWestern 3-Year Average Customer Average Interruption Duration Index (CAIDI) 0.00 0.25 0.50 0.75 1.00 1.25 1.50 In te rr up ti on s NorthWestern 3-Year Average System Average In erruption Frequency Index (SAIFI) Strong Utility Foundation 8 Strong utility operations: Solid system reliability (EEI 2nd quartile); A NWE customer anticipates, on average, one outage per year lasting 100 minutes SAIFI – Reliability Indices with Major Events excluded - Interruptions /customer/year CAIDI – Reliability Indices with Major Events excluded – Average outage duration Residential electric and natural gas rates below national average; and Customer service satisfaction scores in line with survey average (JD Powers). EEI – 2nd Quartile Performance Electric source: Edison Electric Institute Typical Bills and Average Rates Report, 7/1/13 Natural gas source: US Dept of Energy Monthly residential supply and delivery rates as of 1/1/13 $- $20 $40 $60 $80 $100 $120 $140 MT SD MT SD NE Electric (750 kwh) Natural Gas (100 therms) National Average ational Average "Typical Bill" Residential Rate Comparison
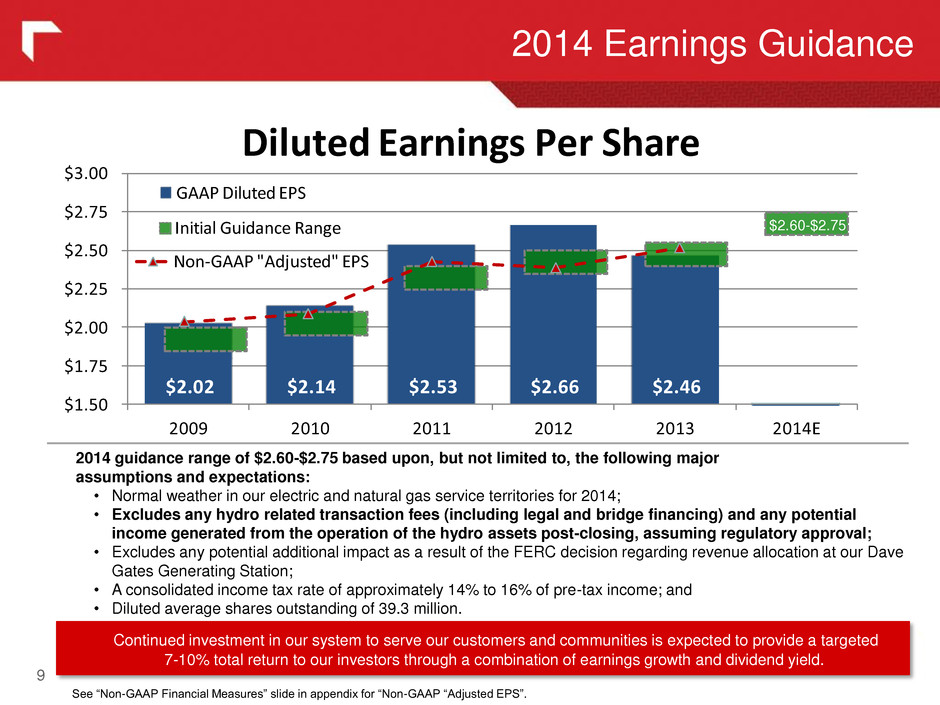
$2.02 $2.14 $2.53 $2.66 $2.46 $- $1.50 $1.75 $2.00 $2.25 $2.50 $2.75 $3.00 2009 2010 2011 2012 2013 2014E GAAP Diluted EPS 2014 Earnings Guidance 9 2014 guidance range of $2.60-$2.75 based upon, but not limited to, the following major assumptions and expectations: • Normal weather in our electric and natural gas service territories for 2014; • Excludes any hydro related transaction fees (including legal and bridge financing) and any potential income generated from the operation of the hydro assets post-closing, assuming regulatory approval; • Excludes any potential additional impact as a result of the FERC decision regarding revenue allocation at our Dave Gates Generating Station; • A consolidated income tax rate of approximately 14% to 16% of pre-tax income; and • Diluted average shares outstanding of 39.3 million. Continued investment in our system to serve our customers and communities is expected to provide a targeted 7-10% total return to our investors through a combination of earnings growth and dividend yield. Initial Guidance Range Non-GAAP "Adjusted" EPS Diluted Earnings Per Share $2.60-$2.75 See “Non-GAAP Financial Measures” slide in appendix for “Non-GAAP “Adjusted EPS”.
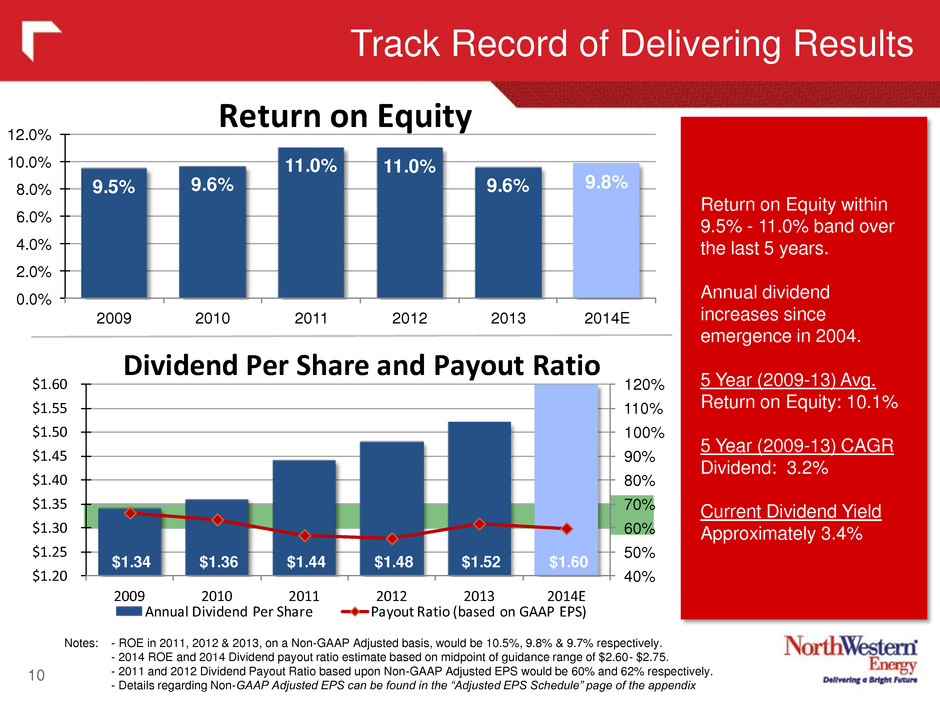
Track Record of Delivering Results 10 Notes: - ROE in 2011, 2012 & 2013, on a Non-GAAP Adjusted basis, would be 10.5%, 9.8% & 9.7% respectively. - 2014 ROE and 2014 Dividend payout ratio estimate based on midpoint of guidance range of $2.60- $2.75. - 2011 and 2012 Dividend Payout Ratio based upon Non-GAAP Adjusted EPS would be 60% and 62% respectively. - Details regarding Non-GAAP Adjusted EPS can be found in the “Adjusted EPS Schedule” page of the appendix Return on Equity within 9.5% - 11.0% band over the last 5 years. Annual dividend increases since emergence in 2004. 5 Year (2009-13) Avg. Return on Equity: 10.1% 5 Year (2009-13) CAGR Dividend: 3.2% Current Dividend Yield Approximately 3.4% $1.34 $1.36 $1.44 $1.48 $1.52 $1.60 40% 50% 60% 70% 80% 90% 100% 110% 120% $1.20 $1.25 $1.30 $1.35 $1.40 $1.45 $1.50 $1.55 $1.60 2009 2010 2011 2012 2013 2014E Annual Dividend Per Share Payout Ratio (based on GAAP EPS) Dividend Per Share and Payout Ratio 9.5% 9.6% 11.0% 11.0% 9.6% 9.8% 0.0% 2.0% .0% 6.0% 8.0% 0.0% 12.0% 2009 2010 2011 2012 2013 2014E Return on Equity
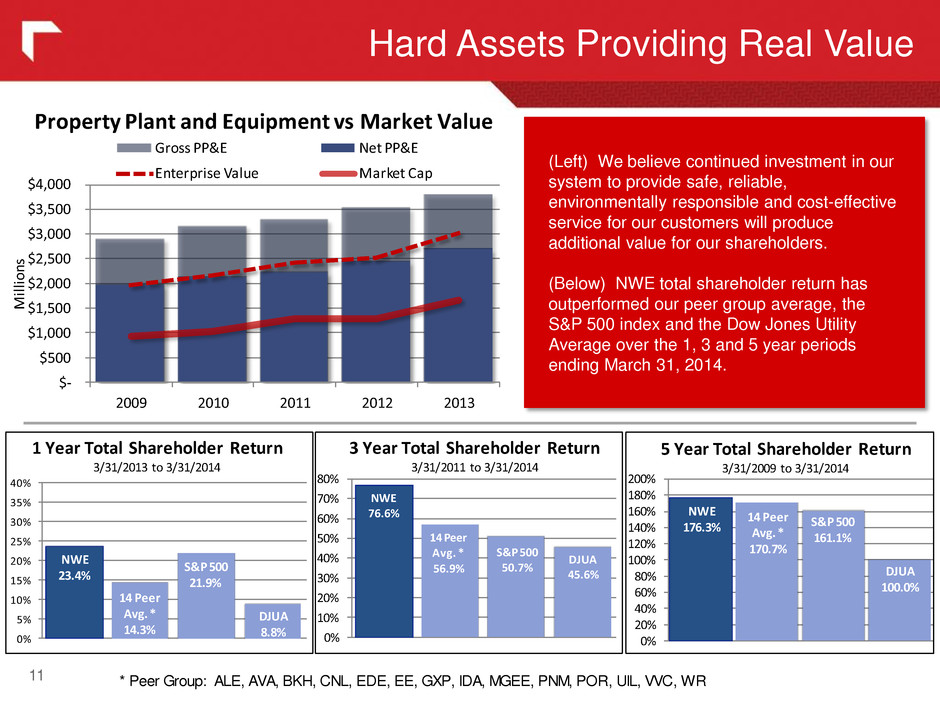
Hard Assets Providing Real Value 11 (Left) We believe continued investment in our system to provide safe, reliable, environmentally responsible and cost-effective service for our customers will produce additional value for our shareholders. (Below) NWE total shareholder return has outperformed our peer group average, the S&P 500 index and the Dow Jones Utility Average over the 1, 3 and 5 year periods ending March 31, 2014. $- $500 $1,000 $1,500 $2,000 $2,500 $3,000 $3,500 $4,000 2009 2010 2011 2012 2013 M illi on s Gross PP&E Net PP&E Enterprise Value Market Cap Property Plant and Equipment vs Market Value NWE 76.6% 14 Peer Avg. * 56.9% S&P 500 50.7% DJUA 45.6% 0% 10% 20% 30% 40% 50% 60% 70% 80% 3 Year Total Shareholder Return 3/31/2011 to 3/31/2014 NWE 23.4% 14 Peer Avg. * 14.3% S&P 500 21.9% DJUA 8.8% 0% 5% 10% 15% 20% 25% 30% 35% 40% 1 Year Total Shareholder Return 3/31/2013 to 3/31/2014 NWE 176.3% 14 Peer Avg. * 170.7% S&P 500 161.1% DJUA 100.0% 0% 20% 40% 60% 80% 100% 120% 140% 160% 180% 200% 5 Year Total Shareholder Return 3/31/2009 to 3/31/2014 * Peer Group: ALE, AVA, BKH, CNL, EDE, EE, GXP, IDA, MGEE, PNM, POR, UIL, VVC, WR
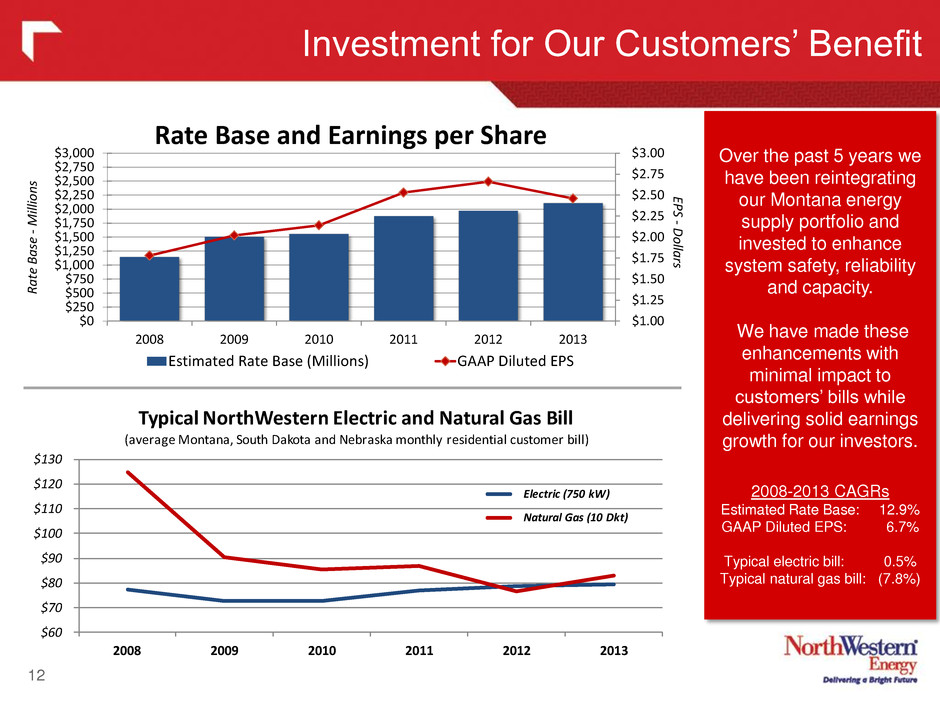
$60 $70 $80 $90 $100 $110 $120 $130 2008 2009 2010 2011 2012 2013 Typical NorthWestern Electric and Natural Gas Bill (average Montana, South Dakota and Nebraska monthly residential customer bill) Electric (750 kW) Natural Gas (10 Dkt) Investment for Our Customers’ Benefit Over the past 5 years we have been reintegrating our Montana energy supply portfolio and invested to enhance system safety, reliability and capacity. We have made these enhancements with minimal impact to customers’ bills while delivering solid earnings growth for our investors. 2008-2013 CAGRs Estimated Rate Base: 12.9% GAAP Diluted EPS: 6.7% Typical electric bill: 0.5% Typical natural gas bill: (7.8%) 12 $1.00 $1.25 $1.50 $1.75 $2.00 $2.25 $2.50 $2.75 $3.00 $0 $250 $500 $750 $1,000 $1,250 $1,500 $1,750 $2,000 $2,250 $2,500 $2,750 $3,000 2008 2009 2010 2011 2012 2013 Rate Base and Earnings per Share Estimated Rate Base (Millions) GAAP Diluted EPS Rate Bas e -Million s EPS -Dollar s
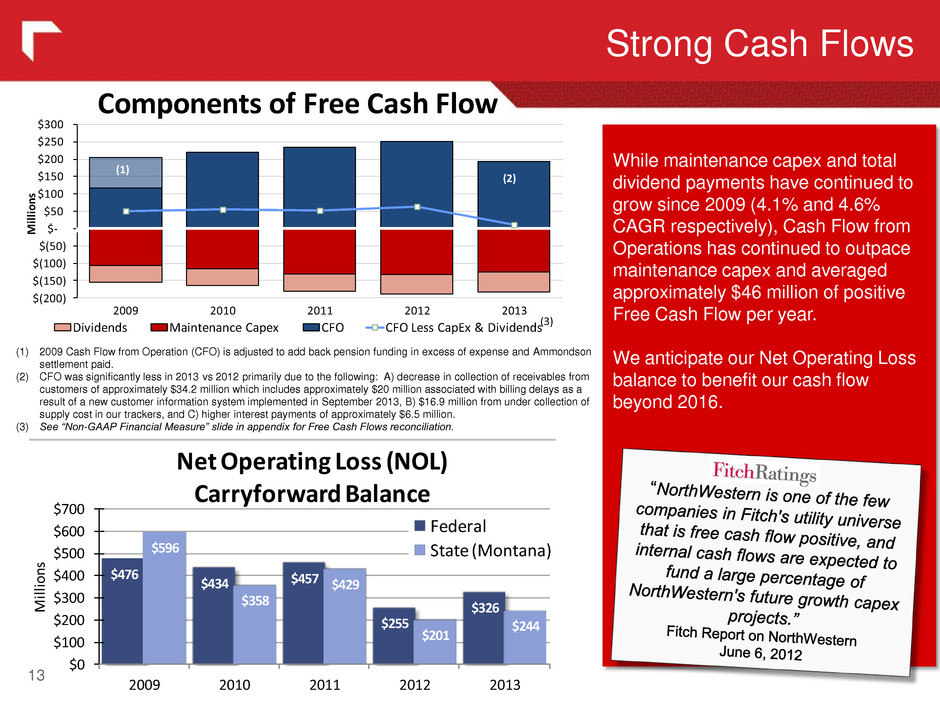
$(200) $(150) $(100) $(50) $- $50 $100 $150 $200 $250 $300 2009 2010 2011 2012 2013 Dividends Maintenance Capex CFO CFO Less CapEx & Dividends Mil lion s While maintenance capex and total dividend payments have continued to grow since 2009 (4.1% and 4.6% CAGR respectively), Cash Flow from Operations has continued to outpace maintenance capex and averaged approximately $46 million of positive Free Cash Flow per year. We anticipate our Net Operating Loss balance to benefit our cash flow beyond 2016. Strong Cash Flows 13 (3) (1) 2009 Cash Flow from Operation (CFO) is adjusted to add back pension funding in excess of expense and Ammondson settlement paid. (2) CFO was significantly less in 2013 vs 2012 primarily due to the following: A) decrease in collection of receivables from customers of approximately $34.2 million which includes approximately $20 million associated with billing delays as a result of a new customer information system implemented in September 2013, B) $16.9 million from under collection of supply cost in our trackers, and C) higher interest payments of approximately $6.5 million. (3) See “Non-GAAP Financial Measure” slide in appendix for Free Cash Flows reconciliation. Components of Free Cash Flow (2) (1) $476 $434 $457 $255 $326 $596 $358 $429 $201 $244 $0 $100 $200 $300 $400 $500 $600 $70 2009 2010 2011 2012 2013 Mi llio ns Net Operating Loss (NOL) Carryforward Balance Federal State (Montana)

$0 $50 $100 $150 $200 $250 $300 $350 Q1 Q2 Q3 '10 Q4 Q1 Q2 Q3 '11 Q4 Q1 Q2 Q3 '12 Q4 Q1 Q2 Q3 '13 Q4 M illi on s Liquidity Actual >$100M Target Balance Sheet Strength and Liquidity 14 Annual ratio is average of each quarter end debt/cap ratio Excludes Basin Creek capital leases Goal: 50% - 55% Senior Secured Rating Senior Unsecured Rating Commercial Paper Outlook Fitch A- BBB+ F2 Positive Watch Moody's A1 A3 Prime-2 Stable S&P A- BBB A-2 Stable A security rating is not a recommendation to buy, sell or hold securities. Such ratings may be subject to revision or withdrawal at any time by the credit rating agency and each rating should be evaluated independently of any other rating. Credit Ratings $0 $50 $1 0 $150 $200 $250 $300 Mi llio ns Year Debt Maturity Schedule 54.0% 55.5% 54.8% 54.3% 53.8% 30% 40% 50% 60% 2009 2010 2011 2012 2013 Debt to Capital Ratio
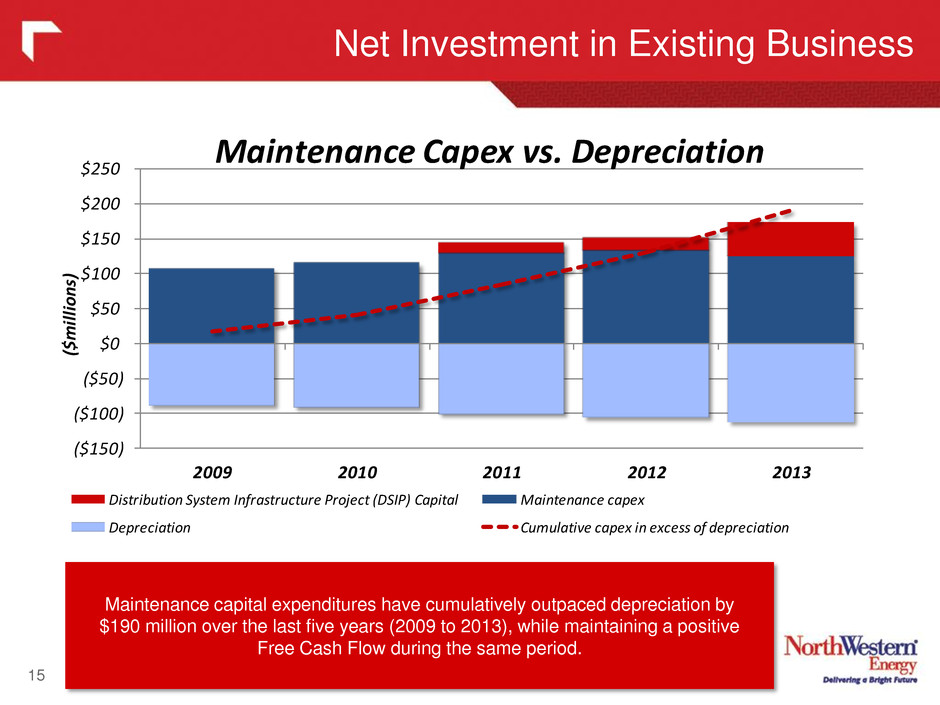
Net Investment in Existing Business 15 Maintenance capital expenditures have cumulatively outpaced depreciation by $190 million over the last five years (2009 to 2013), while maintaining a positive Free Cash Flow during the same period. ($150) ($100) ($50) $0 $50 $100 $150 $200 $250 2009 2010 2011 2012 2013 ($m illi on s) Maintenance Capex vs. Depreciation Distribution System Infrastructure Project (DSIP) Capital Maintenance capex Depreciation Cumulative capex in excess of depreciation
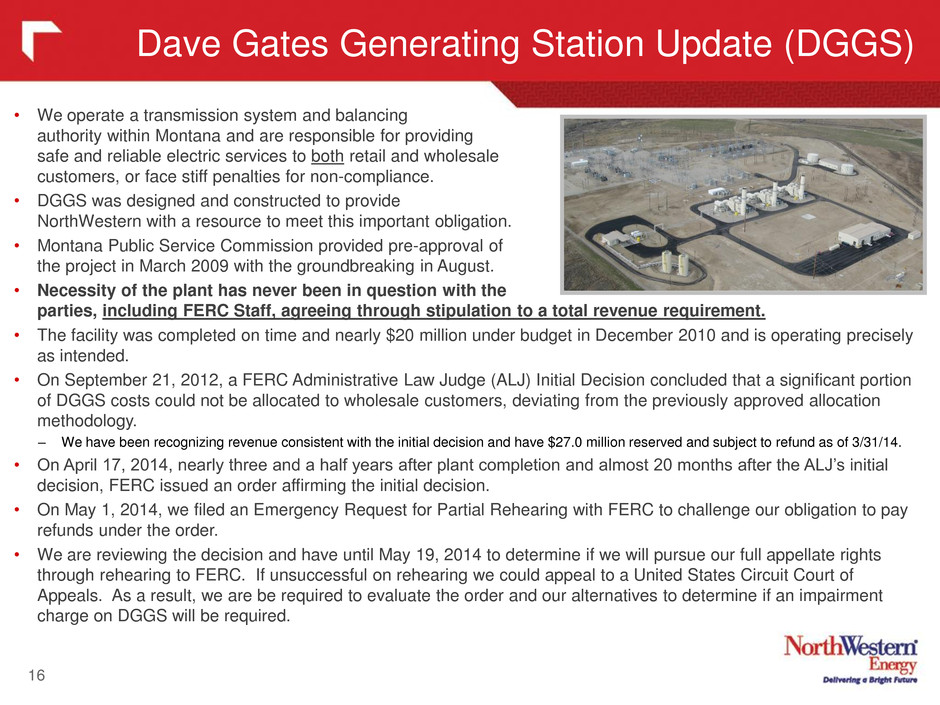
Dave Gates Generating Station Update (DGGS) 16 • We operate a transmission system and balancing authority within Montana and are responsible for providing safe and reliable electric services to both retail and wholesale customers, or face stiff penalties for non-compliance. • DGGS was designed and constructed to provide NorthWestern with a resource to meet this important obligation. • Montana Public Service Commission provided pre-approval of the project in March 2009 with the groundbreaking in August. • Necessity of the plant has never been in question with the parties, including FERC Staff, agreeing through stipulation to a total revenue requirement. • The facility was completed on time and nearly $20 million under budget in December 2010 and is operating precisely as intended. • On September 21, 2012, a FERC Administrative Law Judge (ALJ) Initial Decision concluded that a significant portion of DGGS costs could not be allocated to wholesale customers, deviating from the previously approved allocation methodology. – We have been recognizing revenue consistent with the initial decision and have $27.0 million reserved and subject to refund as of 3/31/14. • On April 17, 2014, nearly three and a half years after plant completion and almost 20 months after the ALJ’s initial decision, FERC issued an order affirming the initial decision. • On May 1, 2014, we filed an Emergency Request for Partial Rehearing with FERC to challenge our obligation to pay refunds under the order. • We are reviewing the decision and have until May 19, 2014 to determine if we will pursue our full appellate rights through rehearing to FERC. If unsuccessful on rehearing we could appeal to a United States Circuit Court of Appeals. As a result, we are be required to evaluate the order and our alternatives to determine if an impairment charge on DGGS will be required.
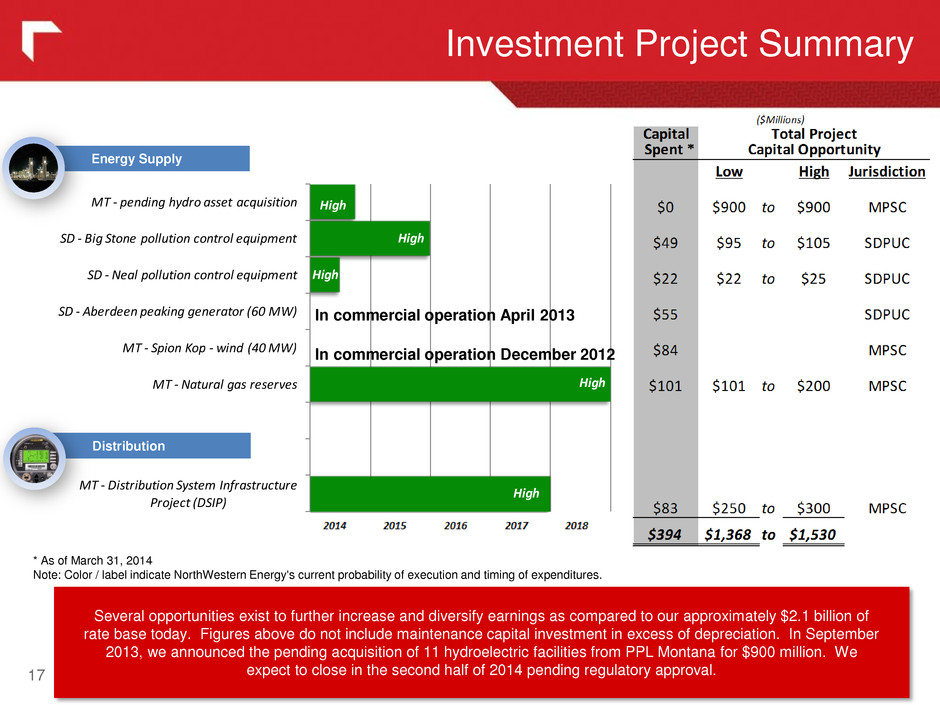
High High High High High MT - Distribution System Infrastructure Project (DSIP) MT - Natural gas reserves MT - Spion Kop - wind (40 MW) SD - Aberdeen peaking generator (60 MW) SD - Neal pollution control equipment SD - Big Stone pollution control equipment MT - pending hydro asset acquisition Investment Project Summary 17 Energy Supply Distribution * As of March 31, 2014 Note: Color / label indicate NorthWestern Energy's current probability of execution and timing of expenditures. Several opportunities exist to further increase and diversify earnings as compared to our approximately $2.1 billion of rate base today. Figures above do not include maintenance capital investment in excess of depreciation. In September 2013, we announced the pending acquisition of 11 hydroelectric facilities from PPL Montana for $900 million. We expect to close in the second half of 2014 pending regulatory approval. In commercial operation April 2013 In commercial operation December 2012
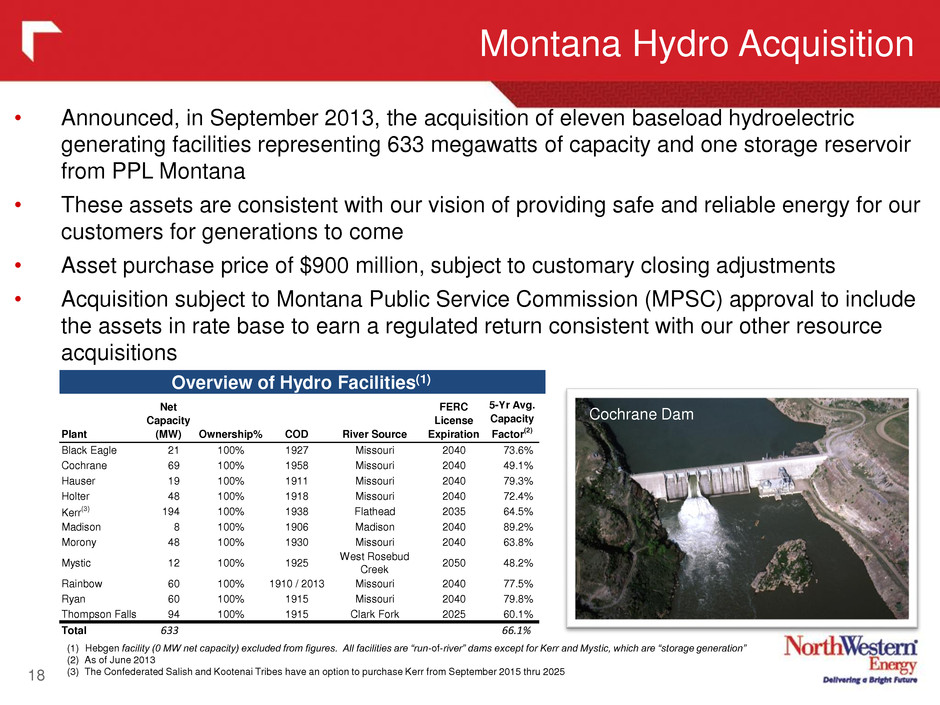
Montana Hydro Acquisition 18 • Announced, in September 2013, the acquisition of eleven baseload hydroelectric generating facilities representing 633 megawatts of capacity and one storage reservoir from PPL Montana • These assets are consistent with our vision of providing safe and reliable energy for our customers for generations to come • Asset purchase price of $900 million, subject to customary closing adjustments • Acquisition subject to Montana Public Service Commission (MPSC) approval to include the assets in rate base to earn a regulated return consistent with our other resource acquisitions Plant Net Capacity (MW) Ownership% COD River Source FERC License Expiration 5-Yr Avg. Capacity Factor (2) Black Eagle 21 100% 1927 Missouri 2040 73.6% Cochrane 69 100% 1958 Missouri 2040 49.1% Hauser 19 100% 1911 Missouri 2040 79.3% Holter 48 100% 1918 Missouri 2040 72.4% Kerr(3) 194 100% 1938 Flathead 2035 64.5% Madison 8 100% 1906 Madison 2040 89.2% Morony 48 100% 1930 Missouri 2040 63.8% My tic 12 100% 1925 West Rosebud Creek 2050 48.2% Rainbow 60 100% 1910 / 2013 Missouri 2040 77.5% Ryan 60 100% 1915 Missouri 2040 79.8% Thompson Falls 94 100% 1915 Clark Fork 2025 60.1% Total 633 66.1% (1) Hebgen facility (0 MW net capacity) excluded from figures. All facilities are “run-of-river” dams except for Kerr and Mystic, which are “storage generation” (2) As of June 2013 (3) The Confederated Salish and Kootenai Tribes have an option to purchase Kerr from September 2015 thru 2025 Cochrane Dam Overview of Hydro Facilities(1)
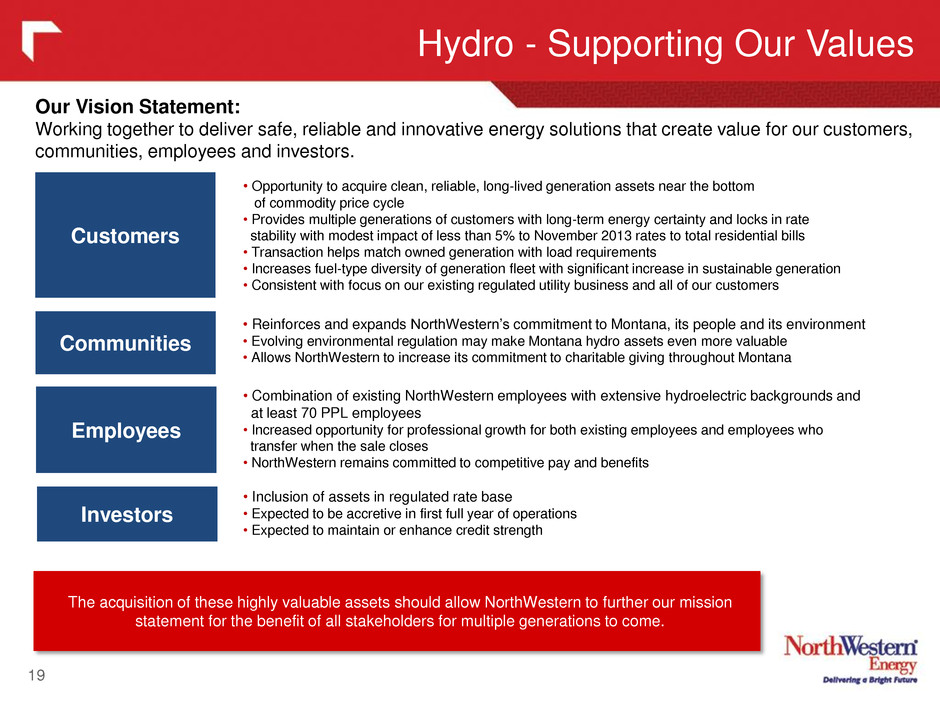
Hydro - Supporting Our Values 19 Our Vision Statement: Working together to deliver safe, reliable and innovative energy solutions that create value for our customers, communities, employees and investors. The acquisition of these highly valuable assets should allow NorthWestern to further our mission statement for the benefit of all stakeholders for multiple generations to come. • Opportunity to acquire clean, reliable, long-lived generation assets near the bottom of commodity price cycle • Provides multiple generations of customers with long-term energy certainty and locks in rate stability with modest impact of less than 5% to November 2013 rates to total residential bills • Transaction helps match owned generation with load requirements • Increases fuel-type diversity of generation fleet with significant increase in sustainable generation • Consistent with focus on our existing regulated utility business and all of our customers • Reinforces and expands NorthWestern’s commitment to Montana, its people and its environment • Evolving environmental regulation may make Montana hydro assets even more valuable • Allows NorthWestern to increase its commitment to charitable giving throughout Montana • Combination of existing NorthWestern employees with extensive hydroelectric backgrounds and at least 70 PPL employees • Increased opportunity for professional growth for both existing employees and employees who transfer when the sale closes • NorthWestern remains committed to competitive pay and benefits • Inclusion of assets in regulated rate base • Expected to be accretive in first full year of operations • Expected to maintain or enhance credit strength Customers Communities Employees Investors
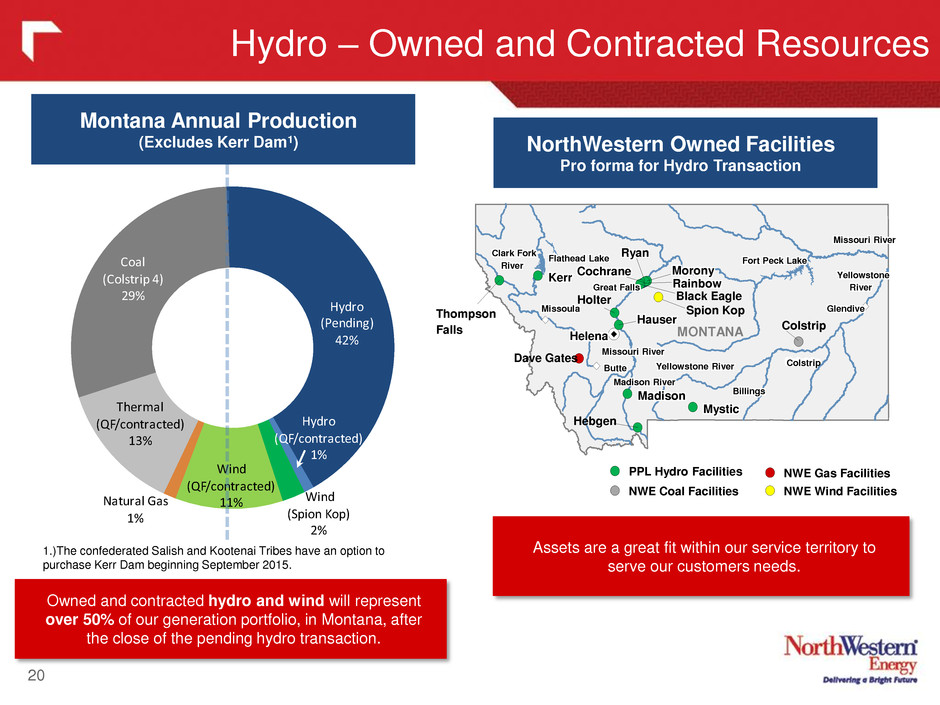
Coal (Colstrip 4) 29% Hydro (Pending) 42% Hydro (QF/contracted) 1% Wind (Spion Kop) 2% Wind (QF/contracted) 11%Natural Gas 1% Thermal (QF/contracted) 13% 20 Hydro – Owned and Contracted Resources MONTANA Yellowstone River ll t r Yellowstone River ll t ll t Ye lo stone River l t r Ye lo stone River ll t Yellowstone ll t Yellowstone ll t ll t Ye lo stone l t Ye lo stone ll t River r River River r River Missouri River i ri r issouri River i i i i issouri River i ri r issouri River i i Missouri River i ri r issouri River i i i i issouri River i ri r issouri River i i Madison River i r adison River i i adison River i r adison River i Clark Fork r r Clark Fork Clark Fork r r Clark Fork River r River River r River Fort Peck Lake rt Fort Peck Lake t t Fort Peck Lake rt Fort Peck Lake t Flathead Lake l t Flathead Lake l t l t Flathead Lake l t Flathead Lake l t Billings li Billings li li Billings li Billings li Colstrip l tri Colstrip l t i l t i Colstrip l tri Colstrip Glendive l i Glendive l i l i lendive l i lendive l i Helena l lena l l le a l le a l Great Falls r t ll Great Falls t ll t ll reat Fa ls r t l reat Fa ls t ll Missoula i l issoula i l i l issoula i l issoula i l Mystic sti y tic i ystic sti y tic Hebgen Hauser user ser ser Black Eagle Holter Rainbow Rainbo inbo i i i ai i i Morony orony oro y oro y Cochrane chrane chra e chra e Ryan yan ya ya Thompson Tho pson s s Falls ll Falls ll ll a ls l a ls ll Butte tt Butte tt tt Bu te t Bu te tt Kerr Kerr Kerr Kerr Madison i adison i i a is i a is i Colstrip Spion Kop Dave Gates PPL Hydro Facilities NWE Coal Facilities NWE Wind Facilities NWE Gas Facilities Assets are a great fit within our service territory to serve our customers needs. 1.)The confederated Salish and Kootenai Tribes have an option to purchase Kerr Dam beginning September 2015. Owned and contracted hydro and wind will represent over 50% of our generation portfolio, in Montana, after the close of the pending hydro transaction. Montana Annual Production (Excludes Kerr Dam1) NorthWestern Owned Facilities Pro forma for Hydro Transaction
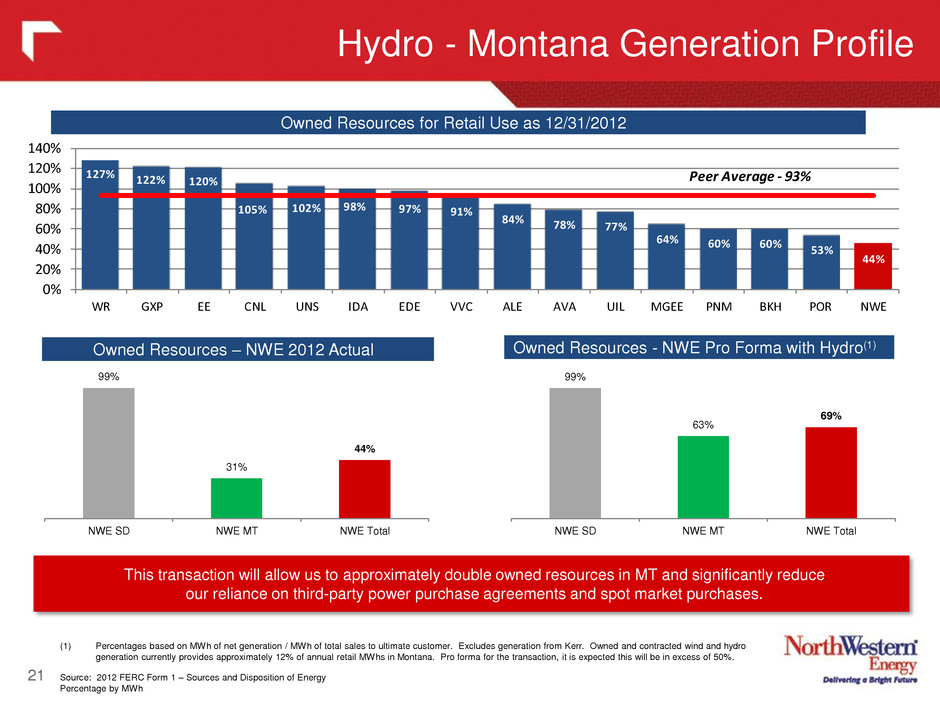
Hydro - Montana Generation Profile 21 99% 31% 44% NWE SD NWE MT NWE Total 99% 63% 69% NWE SD NWE MT NWE Total This transaction will allow us to approximately double owned resources in MT and significantly reduce our reliance on third-party power purchase agreements and spot market purchases. (1) Percentages based on MWh of net generation / MWh of total sales to ultimate customer. Excludes generation from Kerr. Owned and contracted wind and hydro generation currently provides approximately 12% of annual retail MWhs in Montana. Pro forma for the transaction, it is expected this will be in excess of 50%. Source: 2012 FERC Form 1 – Sources and Disposition of Energy Percentage by MWh Owned Resources for Retail Use as 12/31/2012 Owned Resources – NWE 2012 Actual Owned Resources - NWE Pro Forma with Hydro(1) 127% 122% 120% 105% 102% 98% 97% 91% 84% 78% 77% 64% 60% 60% 53% 44% 0% 20% 40% 60% 80% 100% 120% 140% WR GXP EE CNL UNS IDA EDE VVC ALE AVA UIL MGEE PNM BKH POR NWE Peer Average - 93%
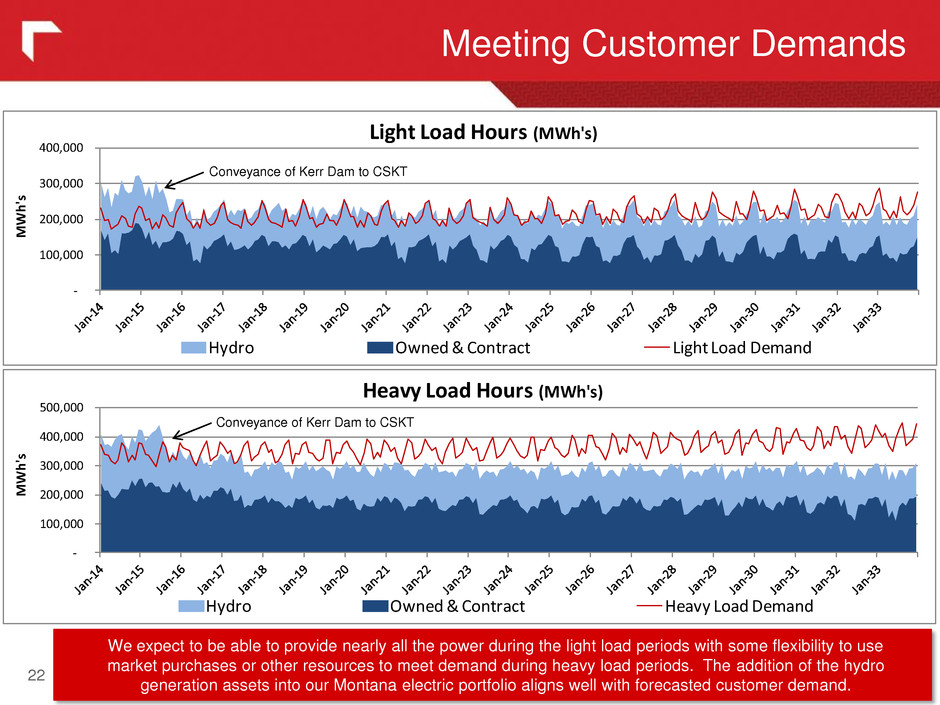
Meeting Customer Demands 22 We expect to be able to provide nearly all the power during the light load periods with some flexibility to use market purchases or other resources to meet demand during heavy load periods. The addition of the hydro generation assets into our Montana electric portfolio aligns well with forecasted customer demand. - 100,000 200,000 300,000 400,000 Hydro Owned & Contract Light Load Demand Light Load Hours (MWh's) MWh 's - 100,000 200,000 300,000 400,000 500,000 Hydro Owned & Contract Heavy Load Demand Heavy Load Hours (MWh's) MWh 'sConveyance of Kerr Dam to CSKT Conveyance of Kerr Dam to CSKT
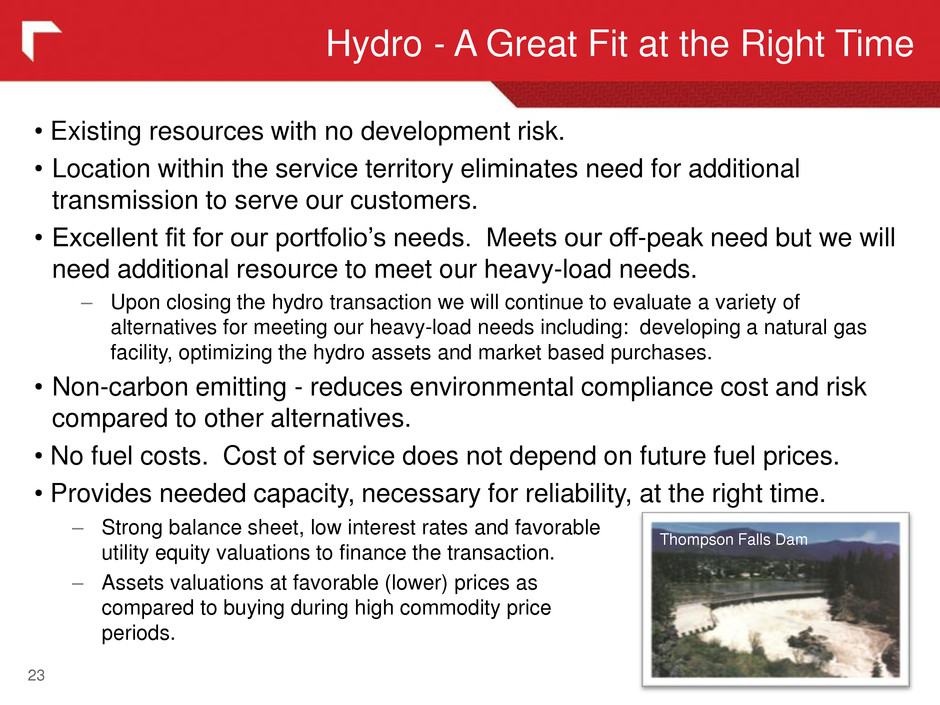
Hydro - A Great Fit at the Right Time 23 – Strong balance sheet, low interest rates and favorable utility equity valuations to finance the transaction. – Assets valuations at favorable (lower) prices as compared to buying during high commodity price periods. Thompson Falls Dam • Existing resources with no development risk. • Location within the service territory eliminates need for additional transmission to serve our customers. • Excellent fit for our portfolio’s needs. Meets our off-peak need but we will need additional resource to meet our heavy-load needs. – Upon closing the hydro transaction we will continue to evaluate a variety of alternatives for meeting our heavy-load needs including: developing a natural gas facility, optimizing the hydro assets and market based purchases. • Non-carbon emitting - reduces environmental compliance cost and risk compared to other alternatives. • No fuel costs. Cost of service does not depend on future fuel prices. • Provides needed capacity, necessary for reliability, at the right time.
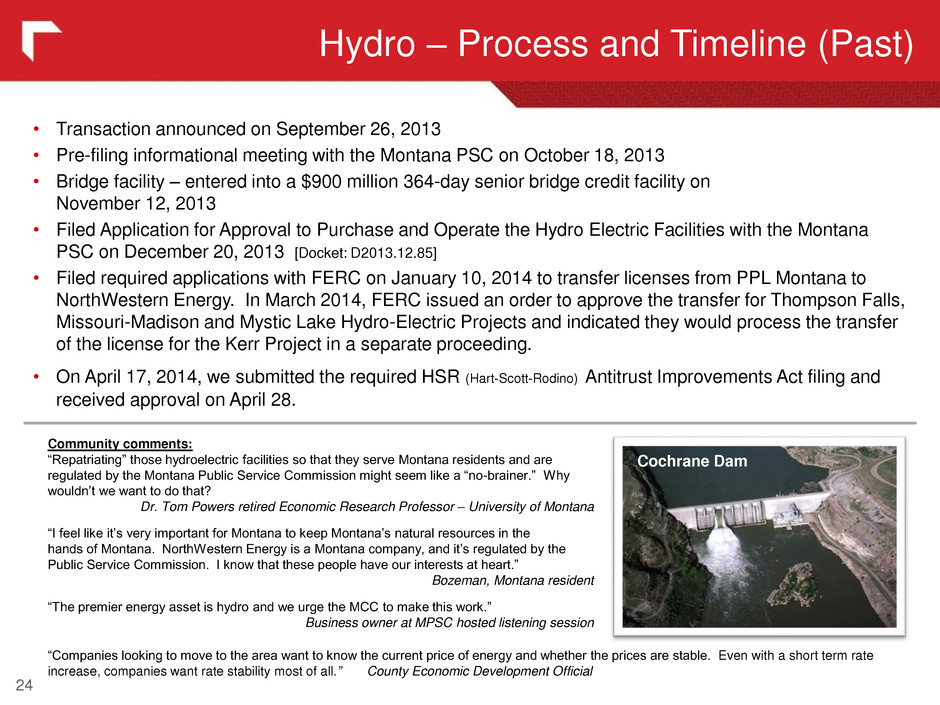
• Transaction announced on September 26, 2013 • Pre-filing informational meeting with the Montana PSC on October 18, 2013 • Bridge facility – entered into a $900 million 364-day senior bridge credit facility on November 12, 2013 • Filed Application for Approval to Purchase and Operate the Hydro Electric Facilities with the Montana PSC on December 20, 2013 [Docket: D2013.12.85] • Filed required applications with FERC on January 10, 2014 to transfer licenses from PPL Montana to NorthWestern Energy. In March 2014, FERC issued an order to approve the transfer for Thompson Falls, Missouri-Madison and Mystic Lake Hydro-Electric Projects and indicated they would process the transfer of the license for the Kerr Project in a separate proceeding. • On April 17, 2014, we submitted the required HSR (Hart-Scott-Rodino) Antitrust Improvements Act filing and received approval on April 28. Hydro – Process and Timeline (Past) 24 Cochrane Dam Community comments: “Repatriating” those hydroelectric facilities so that they serve Montana residents and are regulated by the Montana Public Service Commission might seem like a “no-brainer.” Why wouldn’t we want to do that? Dr. Tom Powers retired Economic Research Professor – University of Montana “I feel like it’s very important for Montana to keep Montana’s natural resources in the hands of Montana. NorthWestern Energy is a Montana company, and it’s regulated by the Public Service Commission. I know that these people have our interests at heart.” Bozeman, Montana resident “The premier energy asset is hydro and we urge the MCC to make this work.” Business owner at MPSC hosted listening session “Companies looking to move to the area want to know the current price of energy and whether the prices are stable. Even with a short term rate increase, companies want rate stability most of all.” County Economic Development Official
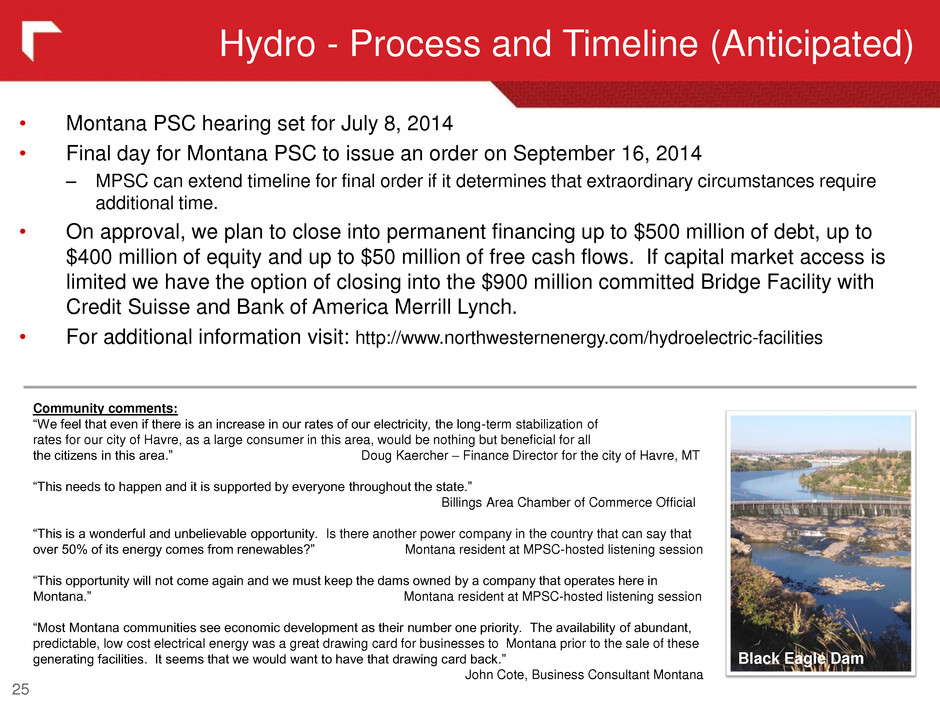
Hydro - Process and Timeline (Anticipated) 25 • Montana PSC hearing set for July 8, 2014 • Final day for Montana PSC to issue an order on September 16, 2014 – MPSC can extend timeline for final order if it determines that extraordinary circumstances require additional time. • On approval, we plan to close into permanent financing up to $500 million of debt, up to $400 million of equity and up to $50 million of free cash flows. If capital market access is limited we have the option of closing into the $900 million committed Bridge Facility with Credit Suisse and Bank of America Merrill Lynch. • For additional information visit: http://www.northwesternenergy.com/hydroelectric-facilities Black Eagle Dam Community comments: “We feel that even if there is an increase in our rates of our electricity, the long-term stabilization of rates for our city of Havre, as a large consumer in this area, would be nothing but beneficial for all the citizens in this area.” Doug Kaercher – Finance Director for the city of Havre, MT “This needs to happen and it is supported by everyone throughout the state.” Billings Area Chamber of Commerce Official “This is a wonderful and unbelievable opportunity. Is there another power company in the country that can say that over 50% of its energy comes from renewables?” Montana resident at MPSC-hosted listening session “This opportunity will not come again and we must keep the dams owned by a company that operates here in Montana.” Montana resident at MPSC-hosted listening session “Most Montana communities see economic development as their number one priority. The availability of abundant, predictable, low cost electrical energy was a great drawing card for businesses to Montana prior to the sale of these generating facilities. It seems that we would want to have that drawing card back.” John Cote, Business Consultant Montana
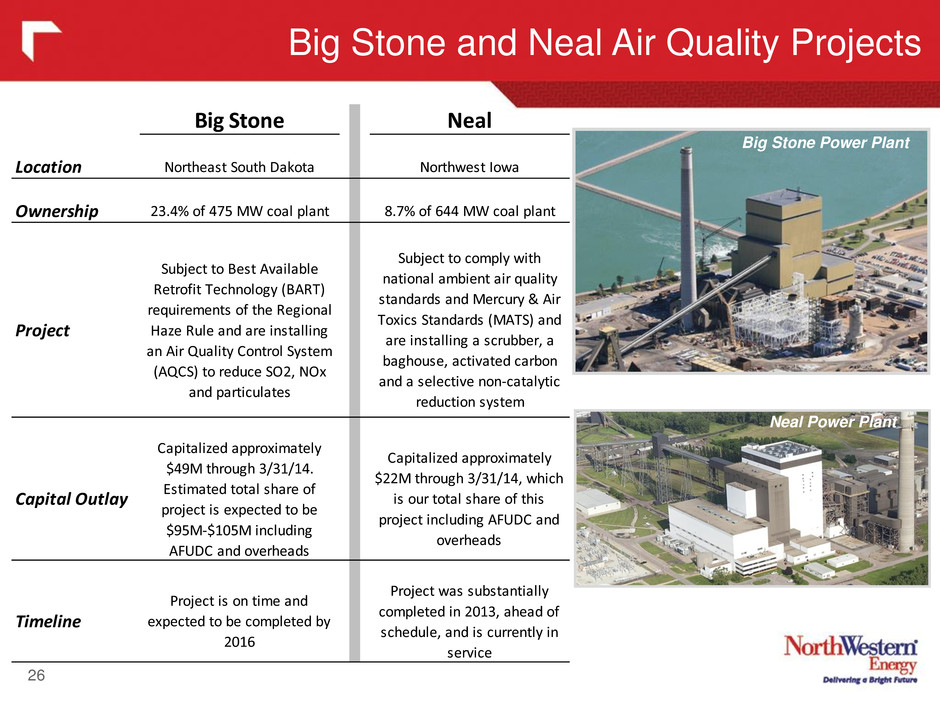
Big Stone and Neal Air Quality Projects 26 Big Stone Power Plant Neal Power Plant Big Stone Neal Location Northeast South Dakota Northwest Iowa Ownership 23.4% of 475 MW coal plant 8.7% of 644 MW coal plant Project Subject to Best Available Retrofit Technology (BART) requirements of the Regional Haze Rule and are installing an Air Quality Control System (AQCS) to reduce SO2, NOx and particulates Subject to comply with national ambient air quality standards and Mercury & Air Toxics Standards (MATS) and are installing a scrubber, a baghouse, activated carbon and a selective non-catalytic reduction system Capital Outlay Capitalized approximately $49M through 3/31/14. Estimated total share of project is expected to be $95M-$105M including AFUDC and overheads Capitalized approximately $22M through 3/31/14, which is our total share of this project including AFUDC and overheads Timeline Project is on time and expected to be completed by 2016 Project was substantially completed in 2013, ahead of schedule, and is currently in service
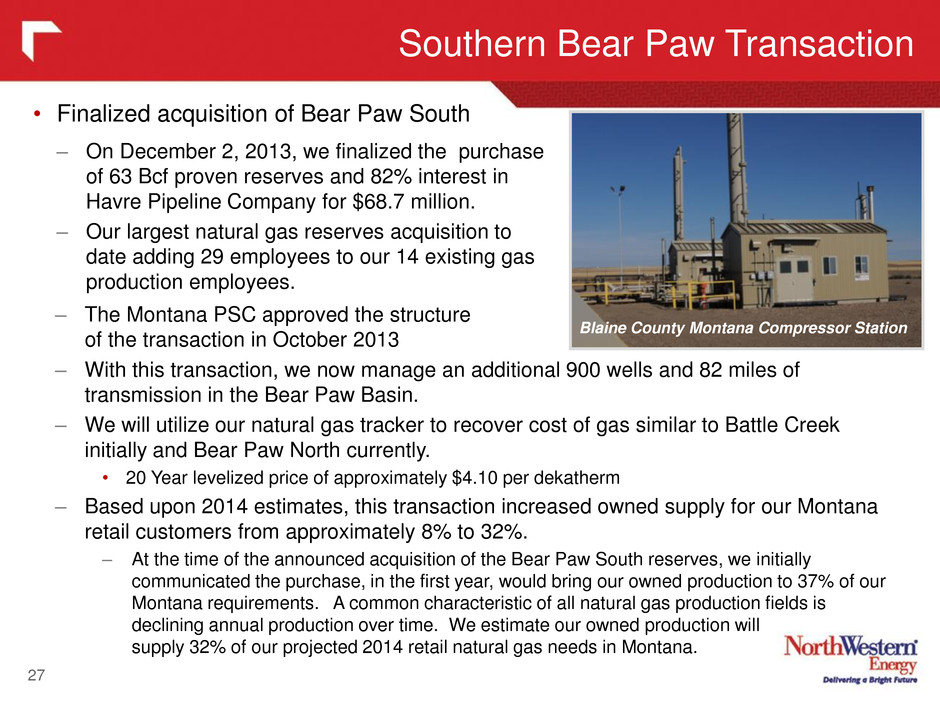
Southern Bear Paw Transaction 27 • Finalized acquisition of Bear Paw South – On December 2, 2013, we finalized the purchase of 63 Bcf proven reserves and 82% interest in Havre Pipeline Company for $68.7 million. – Our largest natural gas reserves acquisition to date adding 29 employees to our 14 existing gas production employees. – The Montana PSC approved the structure of the transaction in October 2013 – With this transaction, we now manage an additional 900 wells and 82 miles of transmission in the Bear Paw Basin. – We will utilize our natural gas tracker to recover cost of gas similar to Battle Creek initially and Bear Paw North currently. • 20 Year levelized price of approximately $4.10 per dekatherm – Based upon 2014 estimates, this transaction increased owned supply for our Montana retail customers from approximately 8% to 32%. – At the time of the announced acquisition of the Bear Paw South reserves, we initially communicated the purchase, in the first year, would bring our owned production to 37% of our Montana requirements. A common characteristic of all natural gas production fields is declining annual production over time. We estimate our owned production will supply 32% of our projected 2014 retail natural gas needs in Montana. Blaine County Montana Compressor Station
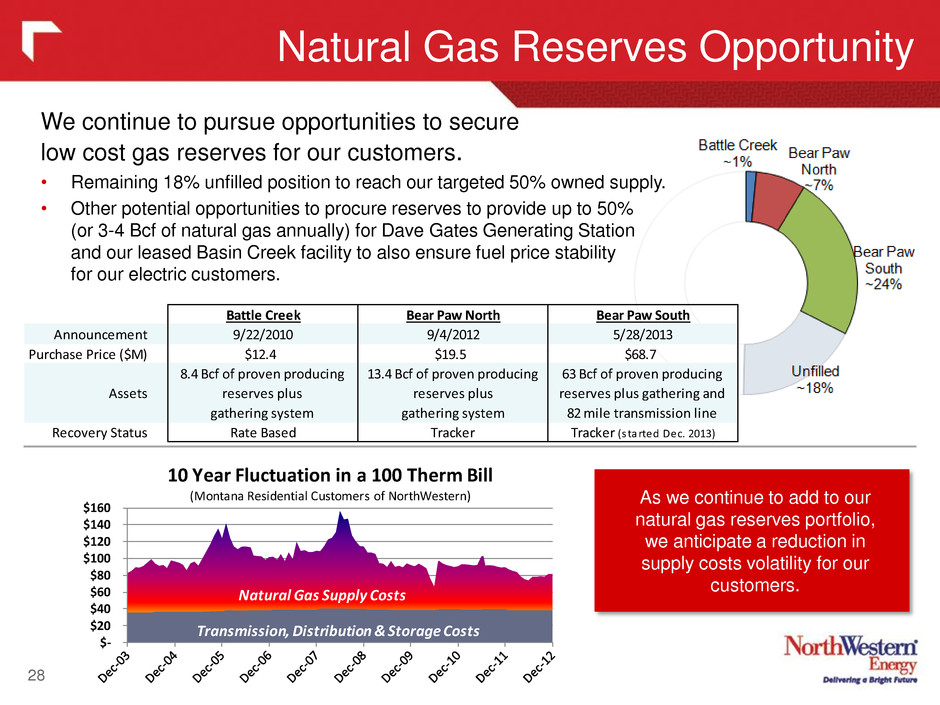
Natural Gas Reserves Opportunity 28 We continue to pursue opportunities to secure low cost gas reserves for our customers. • Remaining 18% unfilled position to reach our targeted 50% owned supply. • Other potential opportunities to procure reserves to provide up to 50% (or 3-4 Bcf of natural gas annually) for Dave Gates Generating Station and our leased Basin Creek facility to also ensure fuel price stability for our electric customers. $- $20 $40 $60 $80 $100 $120 $140 $160 Transmission, Distribution & Storage Costs Natural Gas Supply Costs 10 Year Fluctuation in a 100 Therm Bill (Montana Residential Customers of NorthWestern) As we continue to add to our natural gas reserves portfolio, we anticipate a reduction in supply costs volatility for our customers. Battle Creek Bear Paw North Bear Paw South Announcement 9/22/2010 9/4/2012 5/28/2013 Purchase Price ($M) $12.4 $19.5 $68.7 Assets 8.4 Bcf of proven producing reserves plus gathering sy tem 13.4 Bcf of proven producing reserves plus gathering system 63 Bcf of proven producing reserves plus gathering and 82 mile transmission line Recovery Status Rate Based Tracker Tracker (s tarted Dec. 2013)
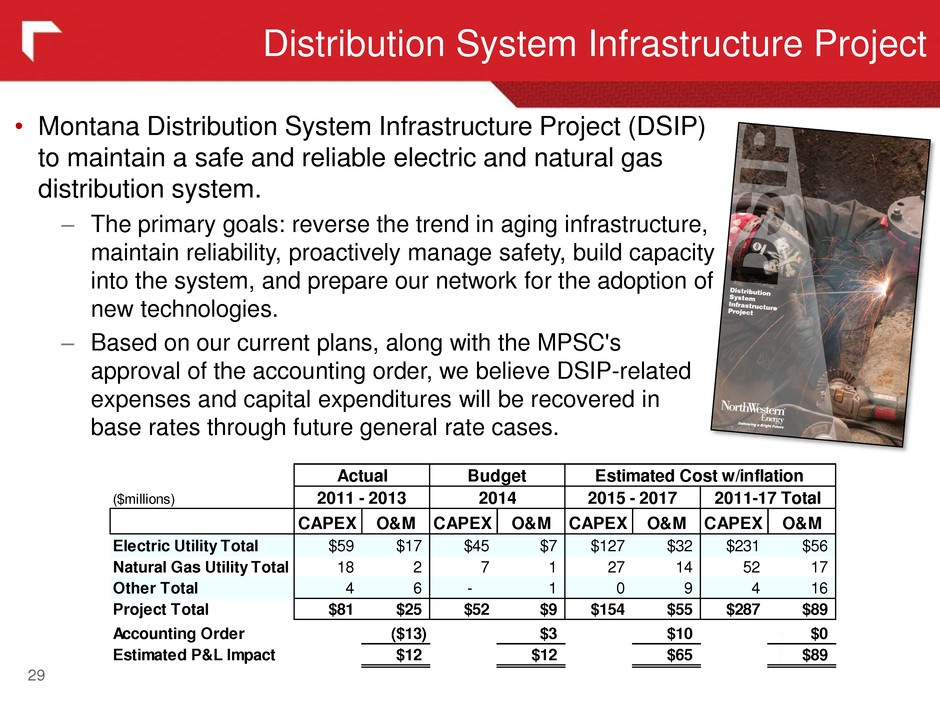
Distribution System Infrastructure Project 29 • Montana Distribution System Infrastructure Project (DSIP) to maintain a safe and reliable electric and natural gas distribution system. – The primary goals: reverse the trend in aging infrastructure, maintain reliability, proactively manage safety, build capacity into the system, and prepare our network for the adoption of new technologies. – Based on our current plans, along with the MPSC's approval of the accounting order, we believe DSIP-related expenses and capital expenditures will be recovered in base rates through future general rate cases. ($millions) CAPEX O&M CAPEX O&M CAPEX O&M CAPEX O&M Electric Utility Total $59 $17 $45 $7 $127 $32 $231 $56 Natural Gas Utility Total 18 2 7 1 27 14 52 17 Other Total 4 6 - 1 0 9 4 16 Project Total $81 $25 $52 $9 $154 $55 $287 $89 Accounting Order ($13) $3 $10 $0 Estimated P&L Impact $12 $12 $65 $89 BudgetActual 2011 - 2013 2014 2015 - 2017 2011-17 Total Estimated Cost w/inflation
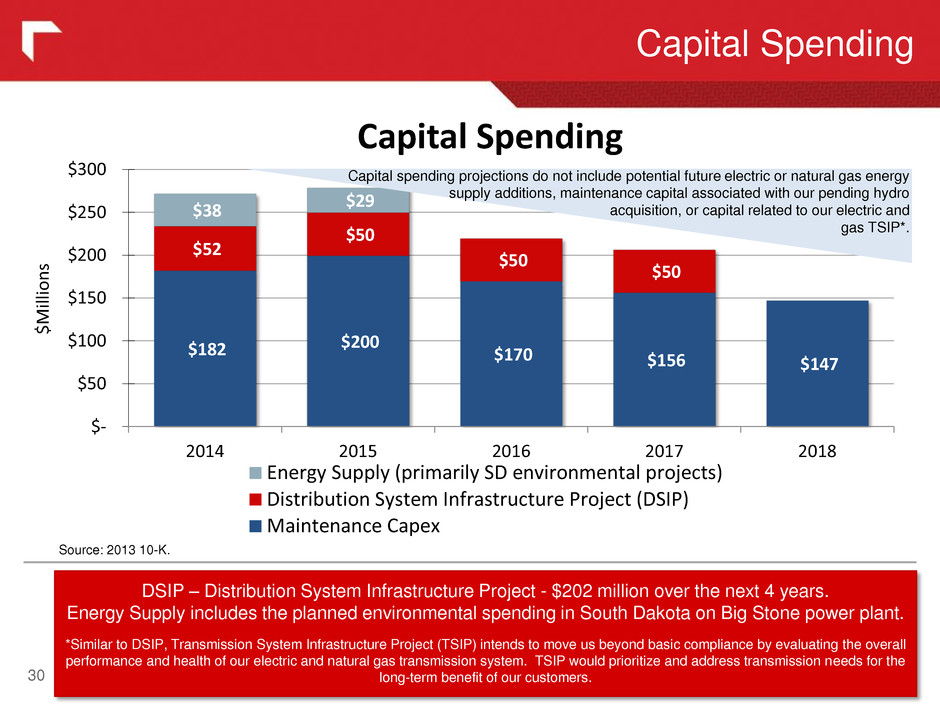
$182 $200 $170 $156 $147 $52 $50 $50 $50 $38 $29 $- $50 $100 $150 $200 $250 $300 2014 2015 2016 2017 2018 $M illion s Capital Spending Energy Supply (primarily SD environmental projects) Distribution System Infrastructure Project (DSIP) Maintenance Capex Capital Spending 30 DSIP – Distribution System Infrastructure Project - $202 million over the next 4 years. Energy Supply includes the planned environmental spending in South Dakota on Big Stone power plant. *Similar to DSIP, Transmission System Infrastructure Project (TSIP) intends to move us beyond basic compliance by evaluating the overall performance and health of our electric and natural gas transmission system. TSIP would prioritize and address transmission needs for the long-term benefit of our customers. Capital spending projections do not include potential future electric or natural gas energy supply additions, maintenance capital associated with our pending hydro acquisition, or capital related to our electric and gas TSIP*. Source: 2013 10-K.
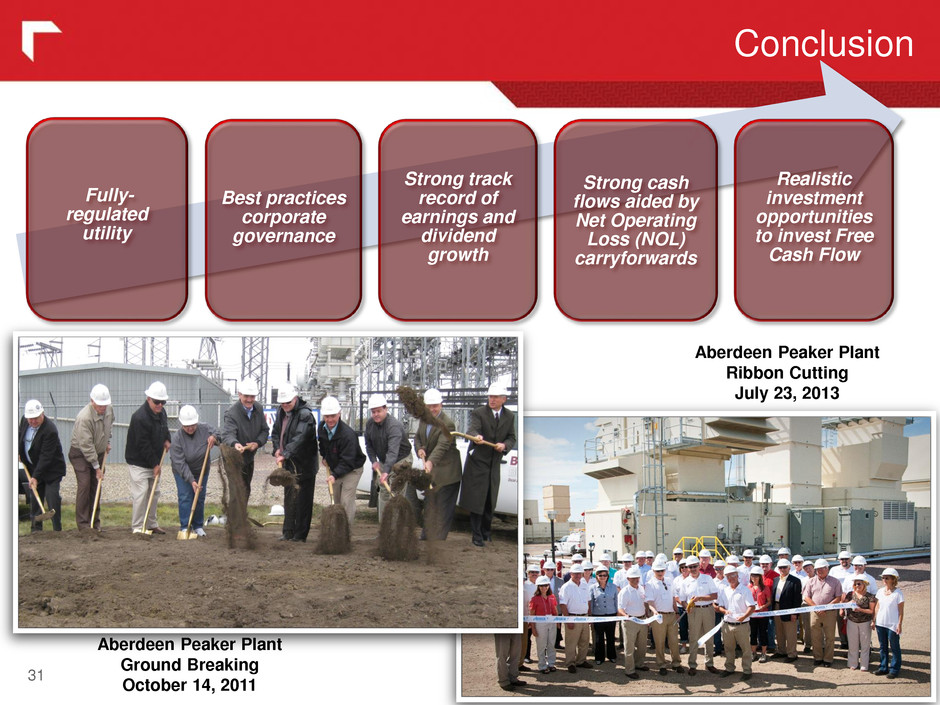
Conclusion 31 Fully- regulated utility Best practices corporate governance Strong track record of earnings and dividend growth Strong cash flows aided by Net Operating Loss (NOL) carryforwards Realistic investment opportunities to invest Free Cash Flow Aberdeen Peaker Plant Ground Breaking October 14, 2011 Aberdeen Peaker Plant Ribbon Cutting July 23, 2013
Appendix 32
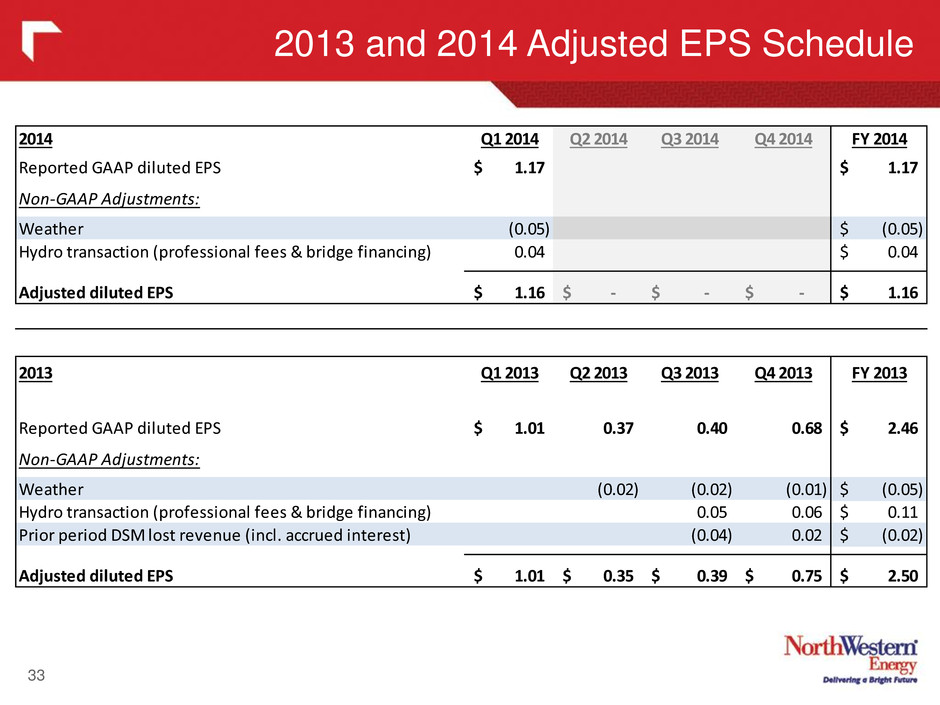
2013 and 2014 Adjusted EPS Schedule 33 2014 Q1 2014 Q2 2014 Q3 2014 Q4 2014 FY 2014 Reported GAAP diluted EPS 1.17$ 1.17$ Non-GAAP Adjustments: Weather (0.05) (0.05)$ Hydro transaction (professional fees & bridge financing) 0.04 0.04$ Adjusted diluted EPS 1.16$ -$ -$ -$ 1.16$ 2013 Q1 2013 Q2 2013 Q3 2013 Q4 2013 FY 2013 Reported GAAP diluted EPS 1.01$ 0.37 0.40 0.68 2.46$ Non-GAAP Adjustments: Weather (0.02) (0.02) (0.01) (0.05)$ Hydro transaction (professional fees & bridge financing) 0.05 0.06 0.11$ Prior period DSM lost revenue (incl. accrued interest) (0.04) 0.02 (0.02)$ Adjusted diluted EPS 1.01$ 0.35$ 0.39$ 0.75$ 2.50$
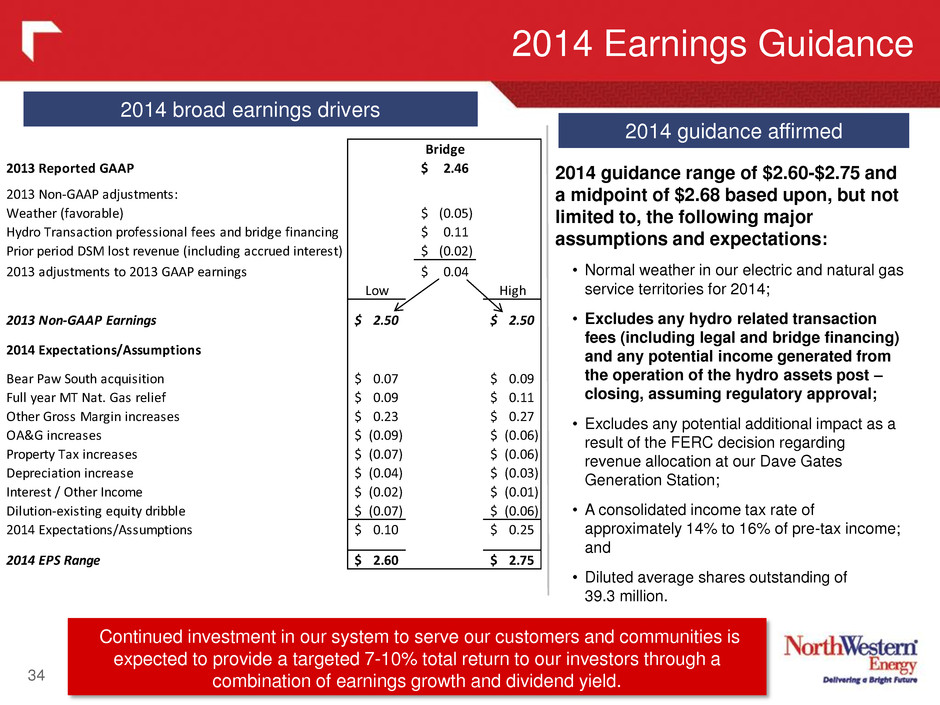
2014 Earnings Guidance 34 Continued investment in our system to serve our customers and communities is expected to provide a targeted 7-10% total return to our investors through a combination of earnings growth and dividend yield. 2014 guidance range of $2.60-$2.75 and a midpoint of $2.68 based upon, but not limited to, the following major assumptions and expectations: • Normal weather in our electric and natural gas service territories for 2014; • Excludes any hydro related transaction fees (including legal and bridge financing) and any potential income generated from the operation of the hydro assets post – closing, assuming regulatory approval; • Excludes any potential additional impact as a result of the FERC decision regarding revenue allocation at our Dave Gates Generation Station; • A consolidated income tax rate of approximately 14% to 16% of pre-tax income; and • Diluted average shares outstanding of 39.3 million. 2014 broad earnings drivers 2014 guidance affirmed Bridge 2013 Reported GAAP 2.46$ 2013 Non-GAAP adjustments: Weather (favorable) (0.05)$ Hydro Transaction professional fees and bridge financing 0.11$ Prior period DSM lost revenue (including accrued interest) (0.02)$ 2013 adjustments to 2013 GAAP earnings 0.04$ Low High 2013 Non-GAAP Earnings 2.50$ 2.50$ 2014 Expectations/Assumptions Bear Paw South acquisition 0.07$ 0.09$ Full year MT Nat. Gas relief 0.09$ 0.11$ Other Gross Margin increases 0.23$ 0.27$ OA&G increases (0.09)$ (0.06)$ Property Tax increases (0.07)$ (0.06)$ Depreciation increase (0.04)$ (0.03)$ Interest / Other I come (0.02)$ (0.01)$ Dilution-existing quity dribble (0.07)$ (0.06)$ 2014 Expectation /Assumptions 0.10$ 0.25$ 2014 EPS Range 2.60$ 2.75$

Income Statement 35 (in millions except EPS) 2014 2013 Variance Operating Revenues 369.7$ 313.0$ 56.7$ Cost of Sales 167.4 132.2 35.2 Gross Margin 202.3 180.8 21.5 Operating Expenses Operating, general & administrative 72.1 68.8 3.3 Property and other taxes 28.5 25.8 2.7 Depreciation 30.3 29.2 1.1 Total Operating Expenses 130.9 123.8 7.1 Operating Income 71.4 57.0 14.4 Interest Expense (20.0) (16.8) (3.2) Other Income 2.2 2.7 (0.5) Income Before Taxes 53.6 42.9 10.7 Income Taxes (8.0) (5.0) (3.0) Net Income 45.6$ 37.9$ 7.7$ Average Common Shares Outstanding 38.9 37.4 1.5 Basic Earnings Per Average Common Share 1.17$ 1.01$ 0.16$ Diluted Earnings Per Average Common Share 1.17$ 1.01$ 0.16$ Three Months Ended March 31,
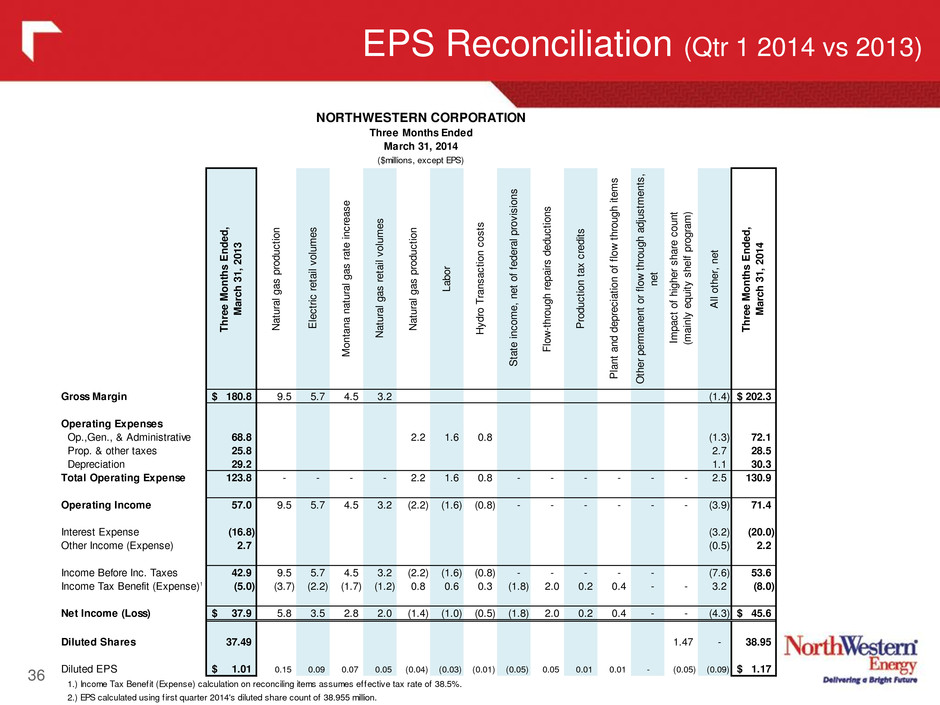
36 EPS Reconciliation (Qtr 1 2014 vs 2013) NORTHWESTERN CORPORATION Three Months Ended March 31, 2014 ($millions, except EPS) T h re e M o n th s E n d ed , M ar ch 3 1, 2 01 3 N at ur al g as p ro du ct io n E le ct ric r et ai l v ol um es M on ta na n at ur al g as r at e in cr ea se N at ur al g as r et ai l v ol um es N at ur al g as p ro du ct io n La bo r H yd ro T ra ns ac tio n co st s S ta te in co m e, n et o f fe de ra l p ro vi si on s F lo w -t hr ou gh r ep ai rs d ed uc tio ns P ro du ct io n ta x cr ed its P la nt a nd d ep re ci at io n of f lo w t hr ou gh it em s O th er p er m an en t or f lo w t hr ou gh a dj us tm en ts , ne t Im pa ct o f hi gh er s ha re c ou nt (m ai nl y eq ui ty s he lf pr og ra m ) A ll ot he r, n et T h re e M o n th s E n d ed , M ar ch 3 1, 2 01 4 Gross Margin 180.8$ 9.5 5.7 4.5 3.2 (1.4) 202.3$ Operating Expenses Op.,Gen., & Administrative 68.8 2.2 1.6 0.8 (1.3) 72.1 Prop. & other taxes 25.8 2.7 28.5 Depreciation 29.2 1.1 30.3 Total Operating Expense 123.8 - - - - 2.2 1.6 0.8 - - - - - - 2.5 130.9 Operating Income 57.0 9.5 5.7 4.5 3.2 (2.2) (1.6) (0.8) - - - - - - (3.9) 71.4 Interest Expense (16.8) (3.2) (20.0) Other Income (Expense) 2.7 (0.5) 2.2 Income Before Inc. Taxes 42.9 9.5 5.7 4.5 3.2 (2.2) (1.6) (0.8) - - - - - (7.6) 53.6 Income Tax Benefit (Expense)1 (5.0) (3.7) (2.2) (1.7) (1.2) 0.8 0.6 0.3 (1.8) 2.0 0.2 0.4 - - 3.2 (8.0) Net Income (Loss) 37.9$ 5.8 3.5 2.8 2.0 (1.4) (1.0) (0.5) (1.8) 2.0 0.2 0.4 - - (4.3) 45.6$ Diluted Shares 37.49 1.47 - 38.95 Diluted EPS 1.01$ 0.15 0.09 0.07 0.05 (0.04) (0.03) (0.01) (0.05) 0.05 0.01 0.01 - (0.05) (0.09) 1.17$ 1.) Income Tax Benefit (Expense) calculation on reconciling items assumes effective tax rate of 38.5%. 2.) EPS calculated using f irst quarter 2014's diluted share count of 38.955 million.
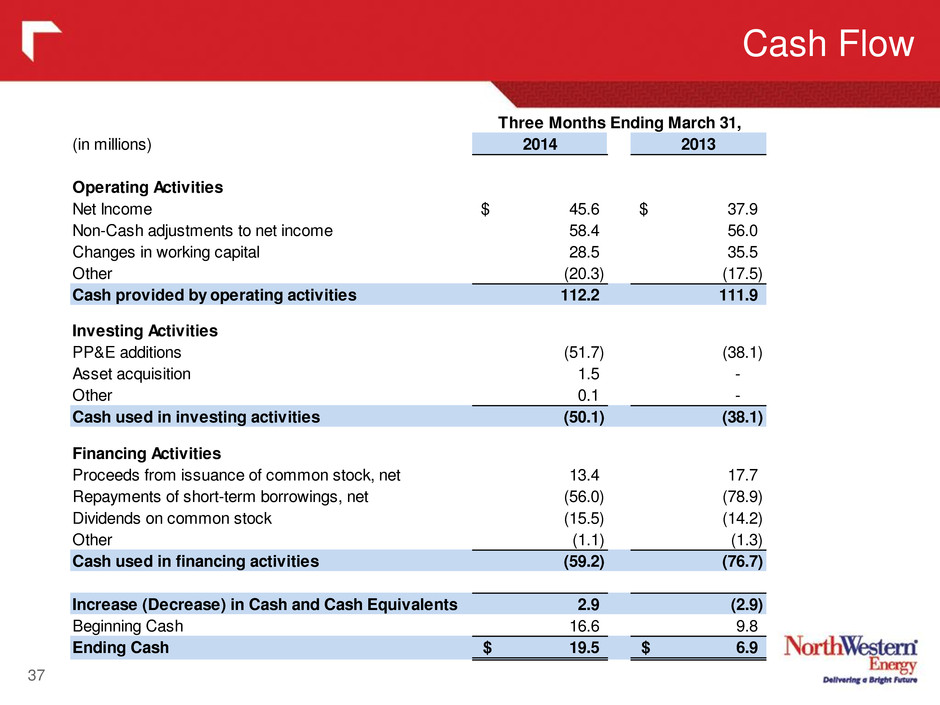
Cash Flow 37 (in millions) 2014 2013 Operating Activities Net Income 45.6$ 37.9$ Non-Cash adjustments to net income 58.4 56.0 Changes in working capital 28.5 35.5 Other (20.3) (17.5) Cash provided by operating activities 112.2 111.9 Investing Activities PP&E additions (51.7) (38.1) Asset acquisition 1.5 - Other 0.1 - Cash used in investing activities (50.1) (38.1) Financing Activities Proceeds from issuance of common stock, net 13.4 17.7 Repayments of short-term borrowings, net (56.0) (78.9) Dividends on common stock (15.5) (14.2) Other (1.1) (1.3) Cash used in financing activities (59.2) (76.7) Increase (Decrease) in Cash and Cash Equivalents 2.9 (2.9) Beginning Cash 16.6 9.8 Ending Cash 19.5$ 6.9$ Three Months Ending March 31,
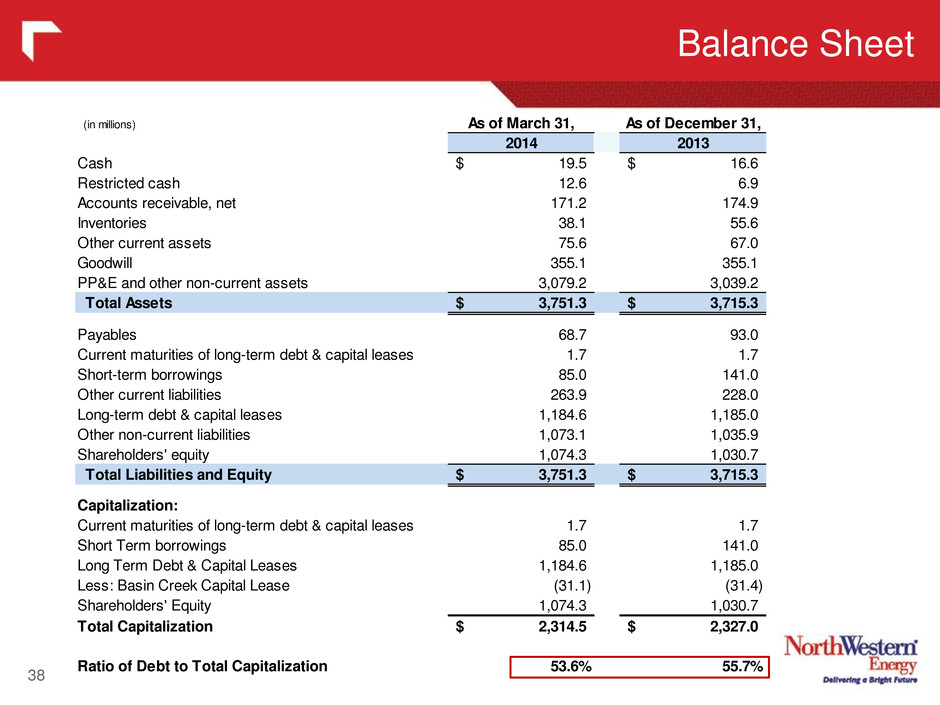
(in millions) As of March 31, As of December 31, 2014 2013 Cash 19.5$ 16.6$ Restricted cash 12.6 6.9 Accounts receivable, net 171.2 174.9 Inventories 38.1 55.6 Other current assets 75.6 67.0 Goodwill 355.1 355.1 PP&E and other non-current assets 3,079.2 3,039.2 Total Assets 3,751.3$ 3,715.3$ Payables 68.7 93.0 Current maturities of long-term debt & capital leases 1.7 1.7 Short-term borrowings 85.0 141.0 Other current liabilities 263.9 228.0 Long-term debt & capital leases 1,184.6 1,185.0 Other non-current liabilities 1,073.1 1,035.9 Shareholders' equity 1,074.3 1,030.7 Total Liabilities and Equity 3,751.3$ 3,715.3$ Capitalization: Current maturities of long-term debt & capital leases 1.7 1.7 Short Term borrowings 85.0 141.0 Long Term Debt & Capital Leases 1,184.6 1,185.0 Less: Basin Creek Capital Lease (31.1) (31.4) Shareholders' Equity 1,074.3 1,030.7 Total Capitalization 2,314.5$ 2,327.0$ Ratio of Debt to Total Capitalization 53.6% 55.7% Balance Sheet 38
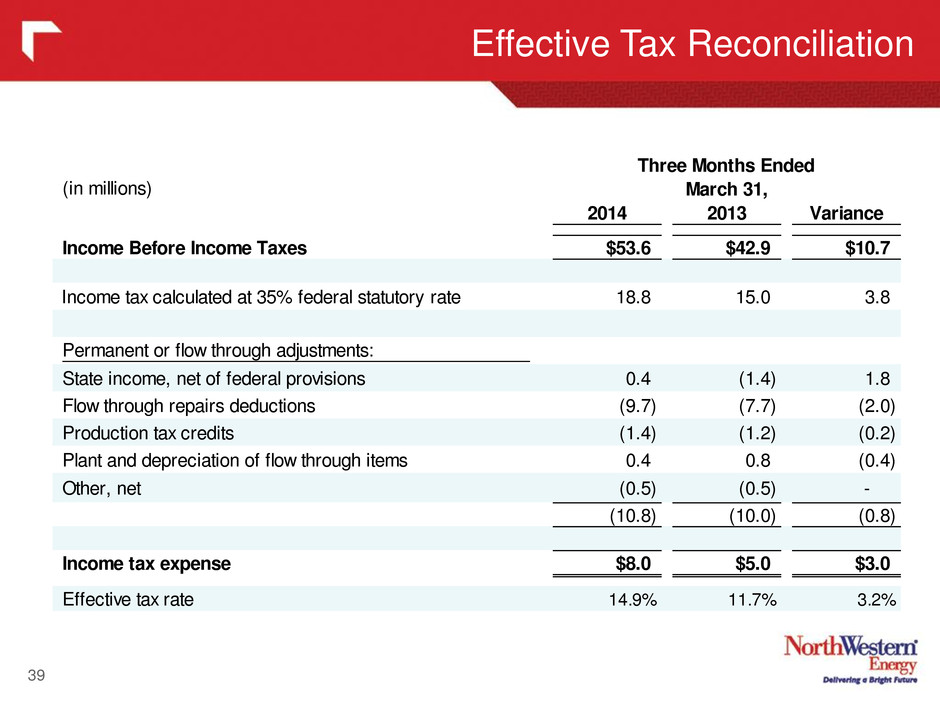
Effective Tax Reconciliation 39 (in millions) 2014 2013 Variance Income Before Income Taxes $53.6 $42.9 $10.7 Income tax calculated at 35% federal statutory rate 18.8 15.0 3.8 Permanent or flow through adjustments: State income, net of federal provisions 0.4 (1.4) 1.8 Flow through repairs deductions (9.7) (7.7) (2.0) Production tax credits (1.4) (1.2) (0.2) Plant and depreciation of flow through items 0.4 0.8 (0.4) Other, net (0.5) (0.5) - (10.8) (10.0) (0.8) Income tax expense $8.0 $5.0 $3.0 Effective tax rate 14.9% 11.7% 3.2% Three Months Ended March 31,
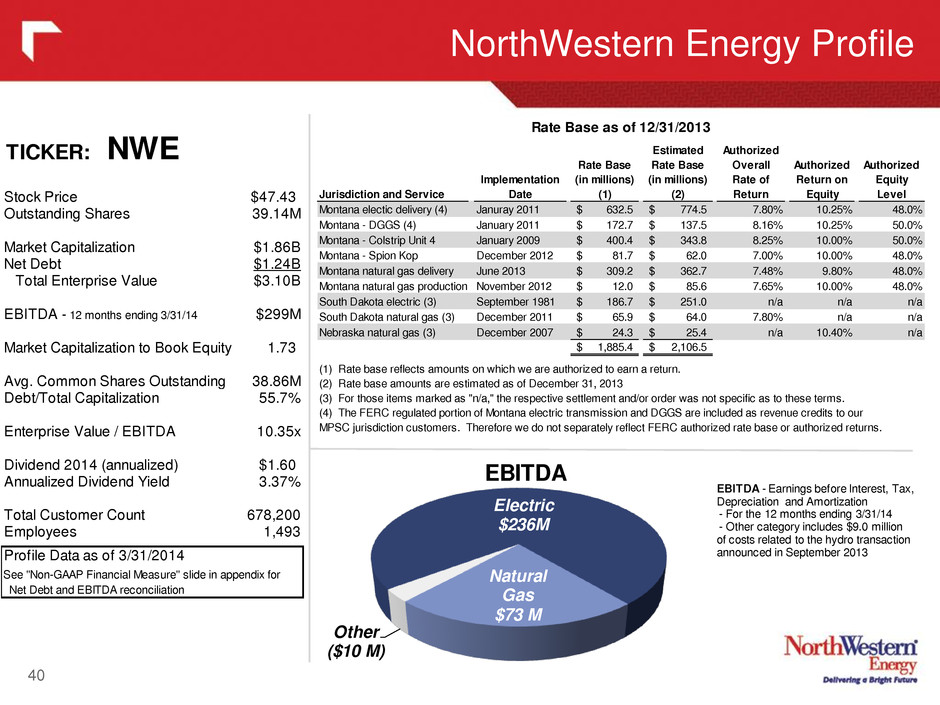
NorthWestern Energy Profile 40 TICKER: NWE Jurisdiction and Service Implementation Date Rate Base (in millions) (1) Estimated Rate Base (in millions) (2) Authorized Overall Rate of Return Authorized Return on Equity Authorized Equity Level Montana electic delivery (4) Januray 2011 632.5$ 774.5$ 7.80% 10.25% 48.0% Montana - DGGS (4) January 2011 172.7$ 137.5$ 8.16% 10.25% 50.0% Montana - Colstrip Unit 4 January 2009 400.4$ 343.8$ 8.25% 10.00% 50.0% Montana - Spion Kop December 2012 81.7$ 62.0$ 7.00% 10.00% 48.0% Montana natural gas delivery June 2013 309.2$ 362.7$ 7.48% 9.80% 48.0% Montana natural gas production November 2012 12.0$ 85.6$ 7.65% 10.00% 48.0% South Dakota electric (3) September 1981 186.7$ 251.0$ n/a n/a n/a South Dakota natural gas (3) December 2011 65.9$ 64.0$ 7.80% n/a n/a Nebraska natural gas (3) December 2007 24.3$ 25.4$ n/a 10.40% n/a 1,885.4$ 2,106.5$ (1) Rate base reflects amounts on which we are authorized to earn a return. (2) Rate base amounts are estimated as of December 31, 2013 (3) For those items marked as "n/a," the respective settlement and/or order was not specific as to these terms. (4) The FERC regulated portion of Montana electric transmission and DGGS are included as revenue credits to our MPSC jurisdiction customers. Therefore we do not separately reflect FERC authorized rate base or authorized returns. Rate Base as of 12/31/2013 Stock Price $47.43 Outstanding Shares 39.14M Market Capitalization $1.86B Net Debt $1.24B Total Enterprise Value $3.10B EBITDA - 12 months ending 3/31/14 $299M Market Capitalization to Book Equity 1.73 Avg. Common Shares Outstanding 38.86M Debt/Total Capitaliz tion 55.7% Enterprise Value / EBITDA 10.35x Dividend 2014 (annualized) $1.60 Annualized Dividend Yield 3.37% Total Customer Count 678,200 Employees 1,493 Profile Data as of 3/31/2014 See "Non-GAAP Financial Measure" slide in appendix for Net Debt and EBITDA reconciliation Natural Gas $73 M Other ($10 M) Electric $236M EBITDA EBITDA - E rnings before Interest, Tax, Depreciation and Amortization - For the 12 months ending 3/31/14 - Other category includes $9.0 million of costs related to the hydro transaction announced in September 2013
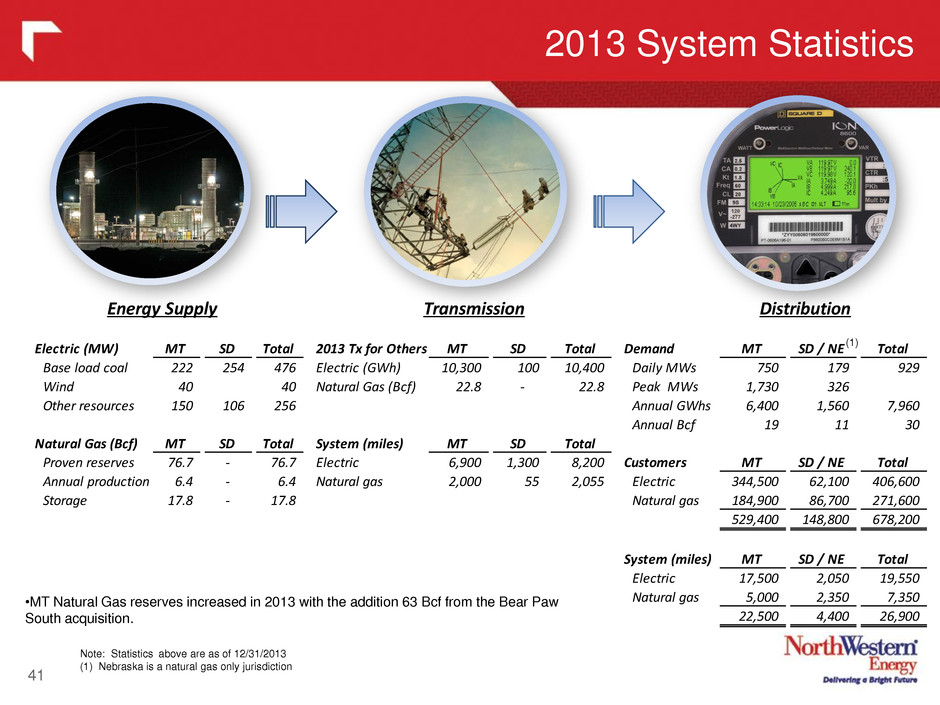
2013 System Statistics 41 Note: Statistics above are as of 12/31/2013 (1) Nebraska is a natural gas only jurisdiction •MT Natural Gas reserves increased in 2013 with the addition 63 Bcf from the Bear Paw South acquisition. (1) Energy Supply Transmission Distribution Electric (MW) MT SD Total 2013 Tx for Others MT SD Total Demand MT SD / NE Total Base load coal 222 254 476 Electric (GWh) 10,300 100 10,400 Daily MWs 750 179 929 Wind 40 40 Natural Gas (Bcf) 22.8 - 22.8 Peak MWs 1,730 326 Other resources 150 106 256 Annual GWhs 6,400 1,560 7,960 Annual Bcf 19 11 30 Natural Gas (Bcf) MT SD Total System (miles) MT SD Total Proven reserves 76.7 - 76.7 Electric 6,900 1,300 8,200 Customers MT SD / NE Total Annual production 6.4 - 6.4 Natural gas 2,000 55 2,055 Electric 344,500 62,100 406,600 Storage 17.8 - 17.8 Natural gas 184,900 86,700 271,600 529,400 148,800 678,200 System (miles) MT SD / NE Total Electric 17,500 2,050 19,550 Natural gas 5,000 2,350 7,350 22,500 4,400 26,900
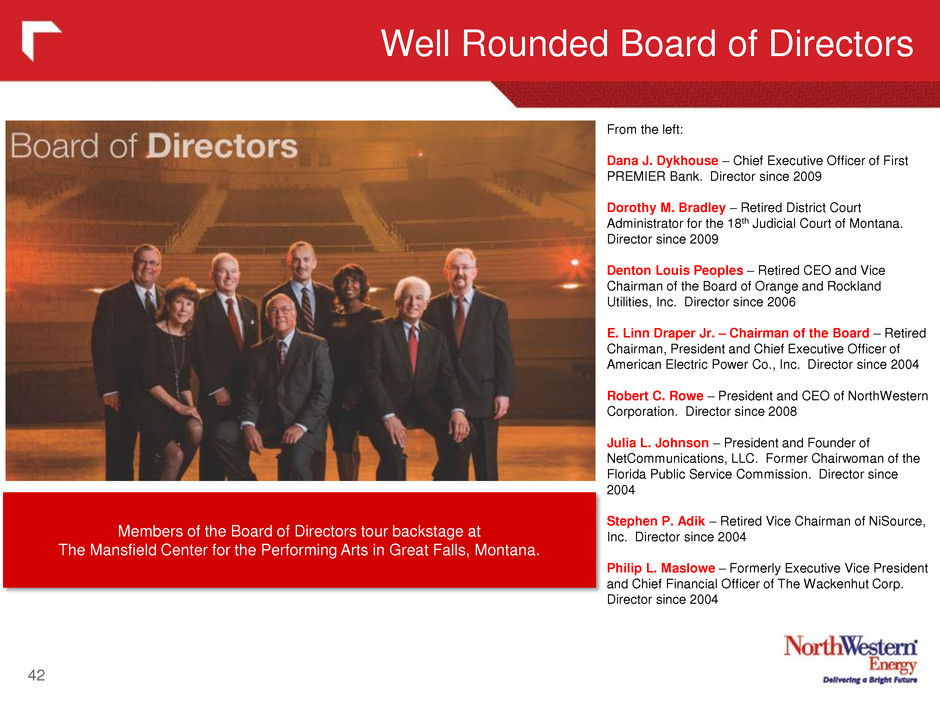
Well Rounded Board of Directors 42 Members of the Board of Directors tour backstage at The Mansfield Center for the Performing Arts in Great Falls, Montana. From the left: Dana J. Dykhouse – Chief Executive Officer of First PREMIER Bank. Director since 2009 Dorothy M. Bradley – Retired District Court Administrator for the 18th Judicial Court of Montana. Director since 2009 Denton Louis Peoples – Retired CEO and Vice Chairman of the Board of Orange and Rockland Utilities, Inc. Director since 2006 E. Linn Draper Jr. – Chairman of the Board – Retired Chairman, President and Chief Executive Officer of American Electric Power Co., Inc. Director since 2004 Robert C. Rowe – President and CEO of NorthWestern Corporation. Director since 2008 Julia L. Johnson – President and Founder of NetCommunications, LLC. Former Chairwoman of the Florida Public Service Commission. Director since 2004 Stephen P. Adik – Retired Vice Chairman of NiSource, Inc. Director since 2004 Philip L. Maslowe – Formerly Executive Vice President and Chief Financial Officer of The Wackenhut Corp. Director since 2004
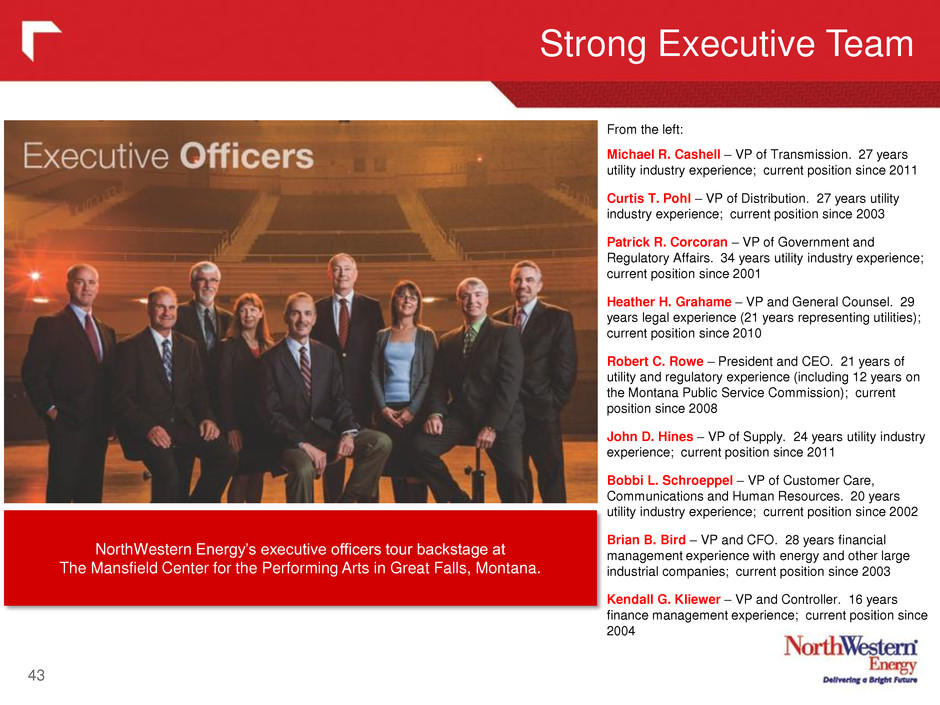
Strong Executive Team 43 NorthWestern Energy’s executive officers tour backstage at The Mansfield Center for the Performing Arts in Great Falls, Montana. From the left: Michael R. Cashell – VP of Transmission. 27 years utility industry experience; current position since 2011 Curtis T. Pohl – VP of Distribution. 27 years utility industry experience; current position since 2003 Patrick R. Corcoran – VP of Government and Regulatory Affairs. 34 years utility industry experience; current position since 2001 Heather H. Grahame – VP and General Counsel. 29 years legal experience (21 years representing utilities); current position since 2010 Robert C. Rowe – President and CEO. 21 years of utility and regulatory experience (including 12 years on the Montana Public Service Commission); current position since 2008 John D. Hines – VP of Supply. 24 years utility industry experience; current position since 2011 Bobbi L. Schroeppel – VP of Customer Care, Communications and Human Resources. 20 years utility industry experience; current position since 2002 Brian B. Bird – VP and CFO. 28 years financial management experience with energy and other large industrial companies; current position since 2003 Kendall G. Kliewer – VP and Controller. 16 years finance management experience; current position since 2004
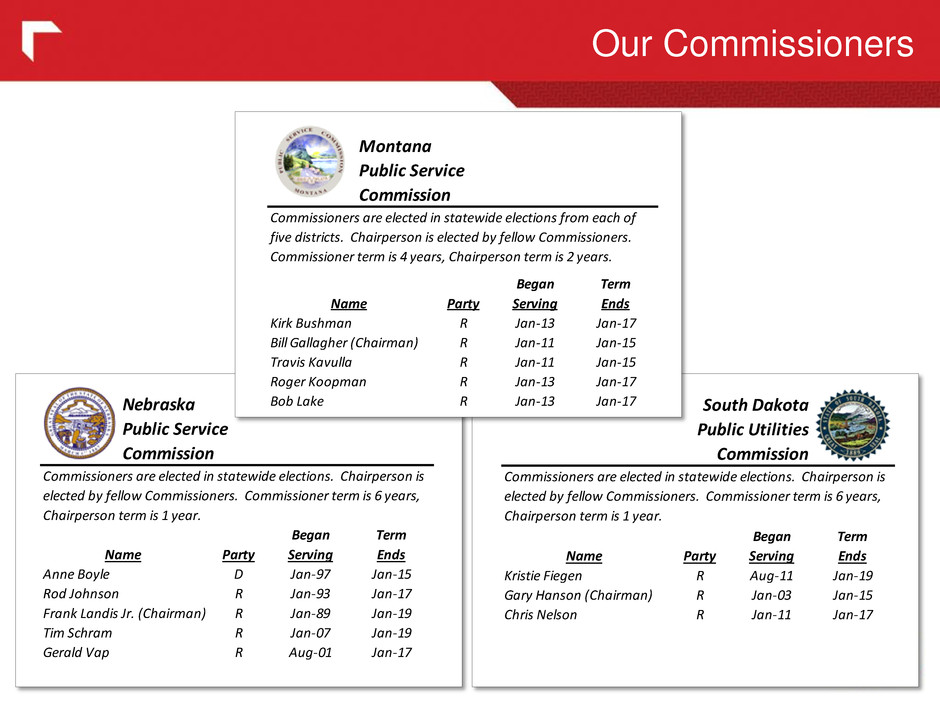
Our Commissioners 44 Name Party Began Serving Term Ends Kirk Bushman R Jan-13 Jan-17 Bill Gallagher (Chairman) R Jan-11 Jan-15 Travis Kavulla R Jan-11 Jan-15 Roger Koopman R Jan-13 Jan-17 Bob Lake R Jan-13 Jan-17 Commissioners are elected in statewide elections from each of five districts. Chairperson is elected by fellow Commissioners. Commissioner term is 4 years, Chairperson term is 2 years. Montana Public Service Commission Name Party Began Serving Term Ends Kristie Fiegen R Aug-11 Jan-19 Gary Hanson (Chairman) R Jan-03 Jan-15 Chris Nelson R Jan-11 Jan-17 Commissioners are elected in statewide elections. Chairperson is elected by fellow Commissioners. Commissioner term is 6 years, Chairperson term is 1 year. South Dakota Public Utilities Commission Name Party Began Se ving Term Ends Anne Boyle D Jan-97 Jan-15 Rod Johnson R Jan-93 Jan-17 Frank Landis Jr. (Chairman) R Jan-89 Jan-19 Tim Schram R Jan-07 Jan-19 Gerald Vap R Aug-01 Jan-17 Commissioners are elected in statewide elections. Chairperson is elected by fellow Commissioners. Commissioner term is 6 years, Chairperson term is 1 year. Nebraska Public Service Commission
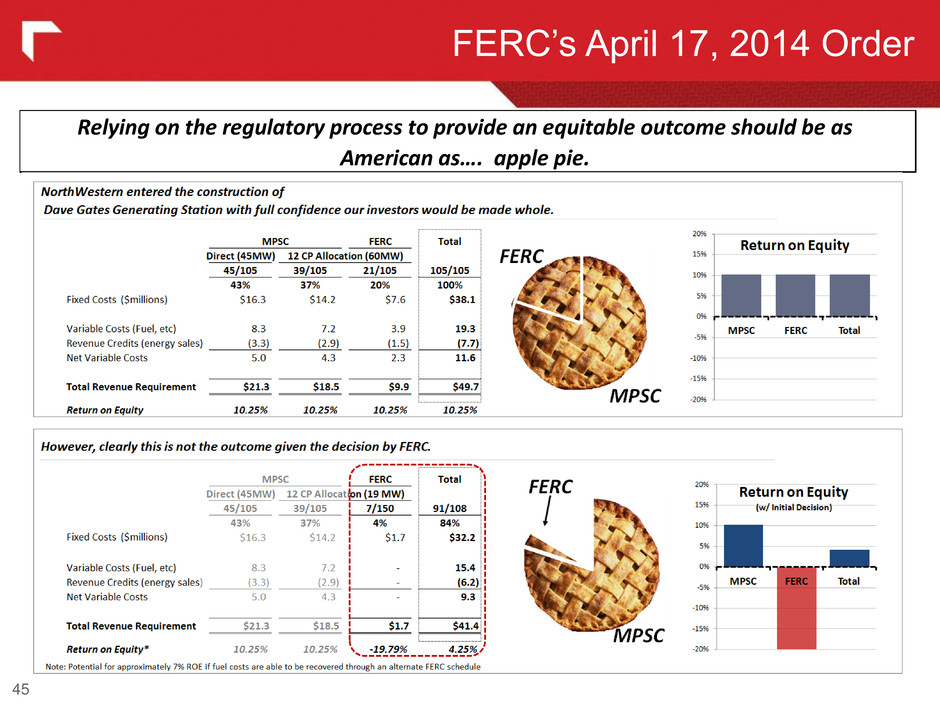
FERC’s April 17, 2014 Order 45 Relying on the regulatory process to provide an equitable outcome should be as American as…. apple pie.
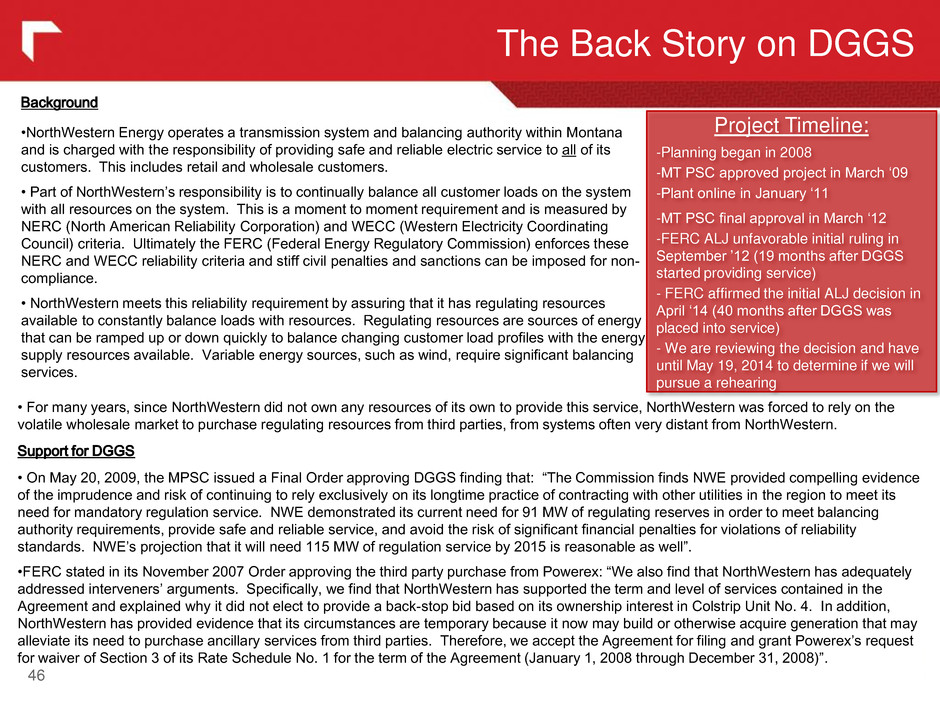
The Back Story on DGGS 46 Background •NorthWestern Energy operates a transmission system and balancing authority within Montana and is charged with the responsibility of providing safe and reliable electric service to all of its customers. This includes retail and wholesale customers. • Part of NorthWestern’s responsibility is to continually balance all customer loads on the system with all resources on the system. This is a moment to moment requirement and is measured by NERC (North American Reliability Corporation) and WECC (Western Electricity Coordinating Council) criteria. Ultimately the FERC (Federal Energy Regulatory Commission) enforces these NERC and WECC reliability criteria and stiff civil penalties and sanctions can be imposed for non- compliance. • NorthWestern meets this reliability requirement by assuring that it has regulating resources available to constantly balance loads with resources. Regulating resources are sources of energy that can be ramped up or down quickly to balance changing customer load profiles with the energy supply resources available. Variable energy sources, such as wind, require significant balancing services. • For many years, since NorthWestern did not own any resources of its own to provide this service, NorthWestern was forced to rely on the volatile wholesale market to purchase regulating resources from third parties, from systems often very distant from NorthWestern. Support for DGGS • On May 20, 2009, the MPSC issued a Final Order approving DGGS finding that: “The Commission finds NWE provided compelling evidence of the imprudence and risk of continuing to rely exclusively on its longtime practice of contracting with other utilities in the region to meet its need for mandatory regulation service. NWE demonstrated its current need for 91 MW of regulating reserves in order to meet balancing authority requirements, provide safe and reliable service, and avoid the risk of significant financial penalties for violations of reliability standards. NWE’s projection that it will need 115 MW of regulation service by 2015 is reasonable as well”. •FERC stated in its November 2007 Order approving the third party purchase from Powerex: “We also find that NorthWestern has adequately addressed interveners’ arguments. Specifically, we find that NorthWestern has supported the term and level of services contained in the Agreement and explained why it did not elect to provide a back-stop bid based on its ownership interest in Colstrip Unit No. 4. In addition, NorthWestern has provided evidence that its circumstances are temporary because it now may build or otherwise acquire generation that may alleviate its need to purchase ancillary services from third parties. Therefore, we accept the Agreement for filing and grant Powerex’s request for waiver of Section 3 of its Rate Schedule No. 1 for the term of the Agreement (January 1, 2008 through December 31, 2008)”. Project Timeline: -Planning began in 2008 -MT PSC approved project in March ‘09 -Plant online in January ‘11 -MT PSC final approval in March ‘12 -FERC ALJ unfavorable initial ruling in September ’12 (19 months after DGGS started providing service) - FERC affirmed the initial ALJ decision in April ‘14 (40 months after DGGS was placed into service) - We are reviewing the decision and have until May 19, 2014 to determine if we will pursue a rehearing
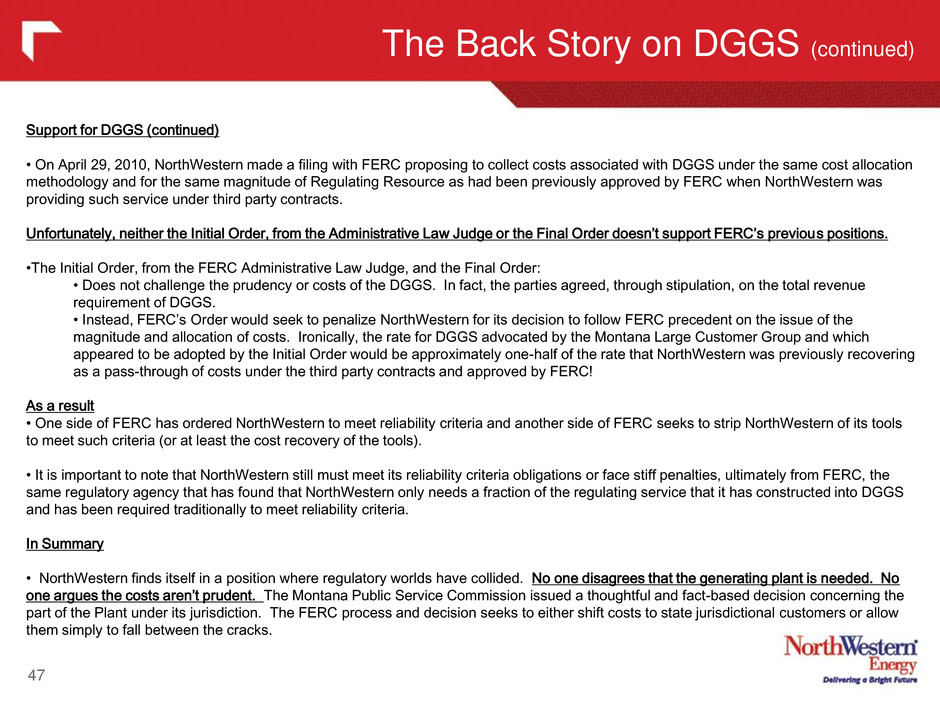
The Back Story on DGGS (continued) 47 Support for DGGS (continued) • On April 29, 2010, NorthWestern made a filing with FERC proposing to collect costs associated with DGGS under the same cost allocation methodology and for the same magnitude of Regulating Resource as had been previously approved by FERC when NorthWestern was providing such service under third party contracts. Unfortunately, neither the Initial Order, from the Administrative Law Judge or the Final Order doesn’t support FERC’s previous positions. •The Initial Order, from the FERC Administrative Law Judge, and the Final Order: • Does not challenge the prudency or costs of the DGGS. In fact, the parties agreed, through stipulation, on the total revenue requirement of DGGS. • Instead, FERC’s Order would seek to penalize NorthWestern for its decision to follow FERC precedent on the issue of the magnitude and allocation of costs. Ironically, the rate for DGGS advocated by the Montana Large Customer Group and which appeared to be adopted by the Initial Order would be approximately one-half of the rate that NorthWestern was previously recovering as a pass-through of costs under the third party contracts and approved by FERC! As a result • One side of FERC has ordered NorthWestern to meet reliability criteria and another side of FERC seeks to strip NorthWestern of its tools to meet such criteria (or at least the cost recovery of the tools). • It is important to note that NorthWestern still must meet its reliability criteria obligations or face stiff penalties, ultimately from FERC, the same regulatory agency that has found that NorthWestern only needs a fraction of the regulating service that it has constructed into DGGS and has been required traditionally to meet reliability criteria. In Summary • NorthWestern finds itself in a position where regulatory worlds have collided. No one disagrees that the generating plant is needed. No one argues the costs aren’t prudent. The Montana Public Service Commission issued a thoughtful and fact-based decision concerning the part of the Plant under its jurisdiction. The FERC process and decision seeks to either shift costs to state jurisdictional customers or allow them simply to fall between the cracks.
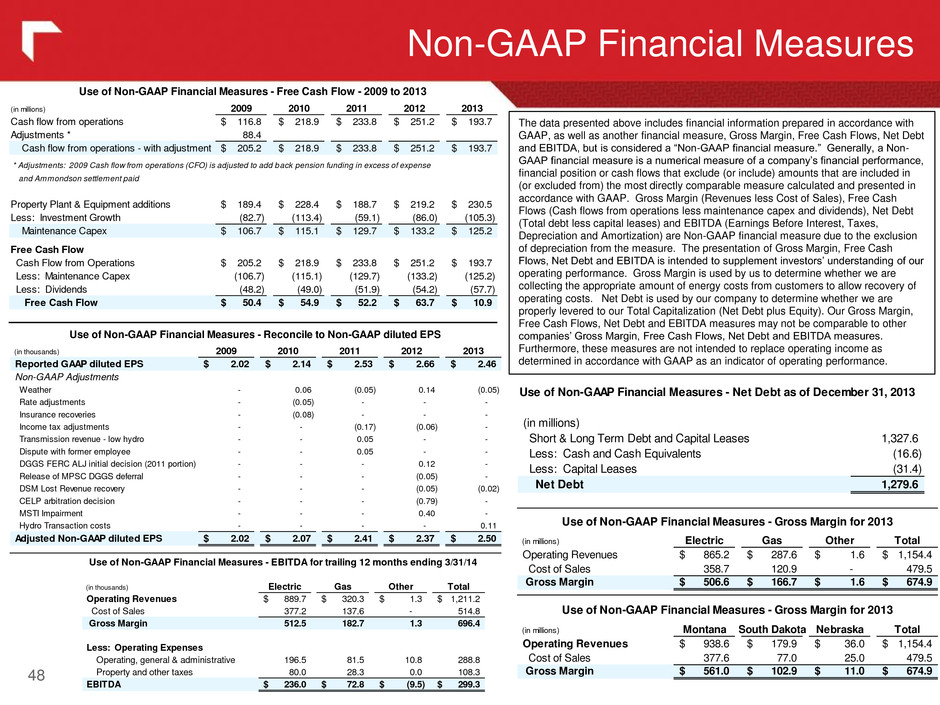
Non-GAAP Financial Measures 48 The data presented above includes financial information prepared in accordance with GAAP, as well as another financial measure, Gross Margin, Free Cash Flows, Net Debt and EBITDA, but is considered a “Non-GAAP financial measure.” Generally, a Non- GAAP financial measure is a numerical measure of a company’s financial performance, financial position or cash flows that exclude (or include) amounts that are included in (or excluded from) the most directly comparable measure calculated and presented in accordance with GAAP. Gross Margin (Revenues less Cost of Sales), Free Cash Flows (Cash flows from operations less maintenance capex and dividends), Net Debt (Total debt less capital leases) and EBITDA (Earnings Before Interest, Taxes, Depreciation and Amortization) are Non-GAAP financial measure due to the exclusion of depreciation from the measure. The presentation of Gross Margin, Free Cash Flows, Net Debt and EBITDA is intended to supplement investors’ understanding of our operating performance. Gross Margin is used by us to determine whether we are collecting the appropriate amount of energy costs from customers to allow recovery of operating costs. Net Debt is used by our company to determine whether we are properly levered to our Total Capitalization (Net Debt plus Equity). Our Gross Margin, Free Cash Flows, Net Debt and EBITDA measures may not be comparable to other companies’ Gross Margin, Free Cash Flows, Net Debt and EBITDA measures. Furthermore, these measures are not intended to replace operating income as determined in accordance with GAAP as an indicator of operating performance. Us of n-GAAP Financial Measures - Net Debt as of December 31, 2013 (in millions) Short & Long Term Debt and Capital Leases 1,327.6 Less: Cash and Cash Equivalents (16.6) Less: Capital Leases (31.4) Net Debt 1,279.6 (in millions) 2009 2010 2011 2012 2013 Cash flow from operations 116.8$ 218.9$ 233.8$ 251.2$ 193.7$ Adjustments * 88.4 Cash flow from operations - with adjustment 205.2$ 218.9$ 233.8$ 251.2$ 193.7$ * Adjustments: 2009 Cash flow from operations (CFO) is adjusted to add back pension funding in excess of expense and Ammondson settlement paid Property Plant & Equipment additions 189.4$ 228.4$ 188.7$ 219.2$ 230.5$ Less: Investment Growth (82.7) (113.4) (59.1) (86.0) (105.3) Maintenance Capex 106.7$ 115.1$ 129.7$ 133.2$ 125.2$ Free Cash Flow Cash Flow from Operations 205.2$ 218.9$ 233.8$ 251.2$ 193.7$ Less: Maintenanc C p x (106.7) (115.1) (129.7) (133.2) (125.2) Less: Dividen (48.2) (49.0) (51.9) (54.2) (57.7) Free Cash Fl w 50.4$ 54.9$ 52.2$ 63.7$ 10.9$ Use of Non-GAAP Financial Measures - Free Cash Flow - 2009 to 2013 (in mllions) Electric Gas Other Total Op rating Revenues 865.2$ 287.6$ 1.6$ 1,154.4$ Cost f Sales 358.7 120.9 - 479.5 Gr ss Margin 506.6$ 166.7$ 1.6$ 674.9$ (in millions) Montana South Dakota Nebraska Total Operating Revenues 938.6$ 179.9$ 36.0$ 1,154.4$ Cost of Sales 377.6 77.0 25.0 479.5 Gross Margin 561.0$ 102.9$ 11.0$ 674.9$ Us of Non-GAAP Financial Measures - Gross Margin for 2013 Use of Non-GAAP Financial Measures - Gross Margin for 2013 (in thousands) 2009 2010 2011 2012 2013 Re orted GAAP diluted EPS 2.02$ .1$ 2.53$ 2.66$ 2.46$ Non-GAAP Adjustments Weather - 0.06 (0.05) 0.14 (0.05) Rate adjustments - (0.05) - - - Insurance rec veries - (0.08) - - - Income tax adjustments - - (0.17) (0.06) - Transmission rev u - low hydro - - 0.05 - - Dispute with fo mer e p oy e - - 0.05 - - DGGS FERC ALJ iti l d ision (2011 portion) - - - 0.12 - Release of MPSC DGGS d ferral - - - (0.05) - DSM Lost Reve u recovery - - - (0.05) (0.02) CELP arbitration d cisi n - - - (0.79) - MSTI Impairment - - - 0.40 - Hydro Transaction costs - - - - 0.11 Adjusted Non-GAAP diluted EPS 2.02$ 2.07$ 2.41$ 2.37$ 2.50$ Use of Non-GAAP Financial Measures - Reconcile to Non-GAAP diluted EPS (in thousands) Electric Gas Other Total Operating Revenues 889.7$ 320.3$ 1.3$ ,211.2$ Cost of Sales 377.2 137.6 - 514.8 Gross Margi 512.5 182.7 1.3 696. Less: Operating Expenses Operating, general & administrative 196.5 81.5 10.8 288.8 Property and other axes 80.0 28.3 0.0 108.3 EBITDA 236.0$ 72.8$ (9.5)$ 299.3$ Use of Non-GAAP Fi ncial M asures - EBITDA for trailing 12 months ending 3/31/14

49


