2016 Third Quarter Earnings Webcast October 20, 2016
Presenting Today 2 Bob Rowe, President & CEO Brian Bird, Vice President & CFO
3 Forward Looking Statements During the course of this presentation, there will be forward-looking statements within the meaning of the “safe harbor” provisions of the Private Securities Litigation Reform Act of 1995. Forward-looking statements often address our expected future business and financial performance, and often contain words such as “expects,” “anticipates,” “intends,” “plans,” “believes,” “seeks,” or “will.” The information in this presentation is based upon our current expectations as of the date hereof unless otherwise noted. Our actual future business and financial performance may differ materially and adversely from our expectations expressed in any forward-looking statements. We undertake no obligation to revise or publicly update our forward-looking statements or this presentation for any reason. Although our expectations and beliefs are based on reasonable assumptions, actual results may differ materially. The factors that may affect our results are listed in certain of our press releases and disclosed in the Company’s 10-Q which we filed with the SEC on October 20, 2016 and our other public filings with the SEC.
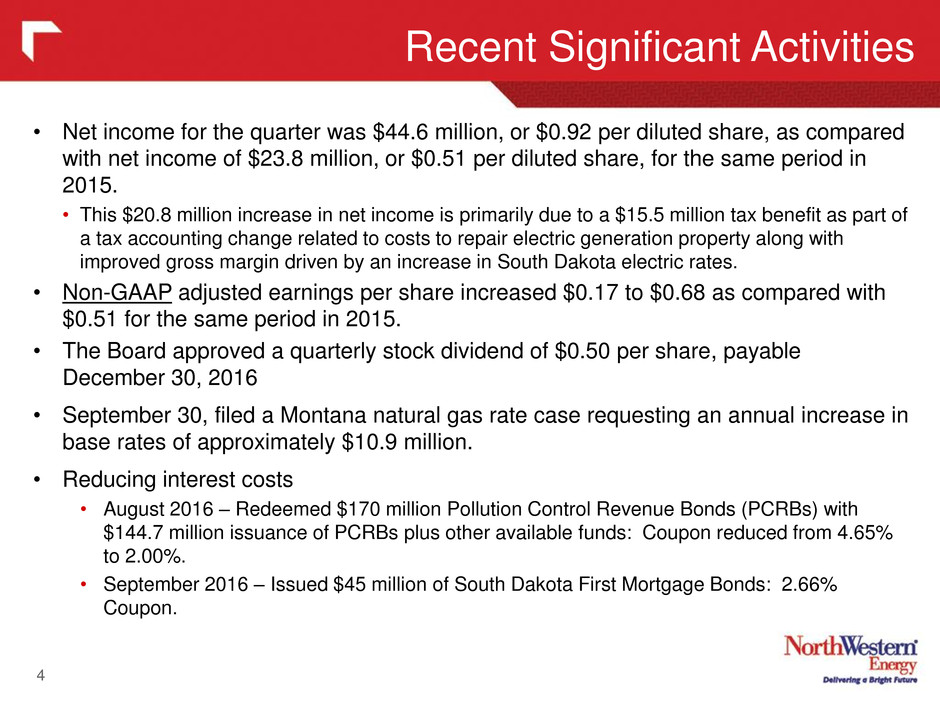
• Net income for the quarter was $44.6 million, or $0.92 per diluted share, as compared with net income of $23.8 million, or $0.51 per diluted share, for the same period in 2015. • This $20.8 million increase in net income is primarily due to a $15.5 million tax benefit as part of a tax accounting change related to costs to repair electric generation property along with improved gross margin driven by an increase in South Dakota electric rates. • Non-GAAP adjusted earnings per share increased $0.17 to $0.68 as compared with $0.51 for the same period in 2015. • The Board approved a quarterly stock dividend of $0.50 per share, payable December 30, 2016 • September 30, filed a Montana natural gas rate case requesting an annual increase in base rates of approximately $10.9 million. • Reducing interest costs • August 2016 – Redeemed $170 million Pollution Control Revenue Bonds (PCRBs) with $144.7 million issuance of PCRBs plus other available funds: Coupon reduced from 4.65% to 2.00%. • September 2016 – Issued $45 million of South Dakota First Mortgage Bonds: 2.66% Coupon. Recent Significant Activities 4
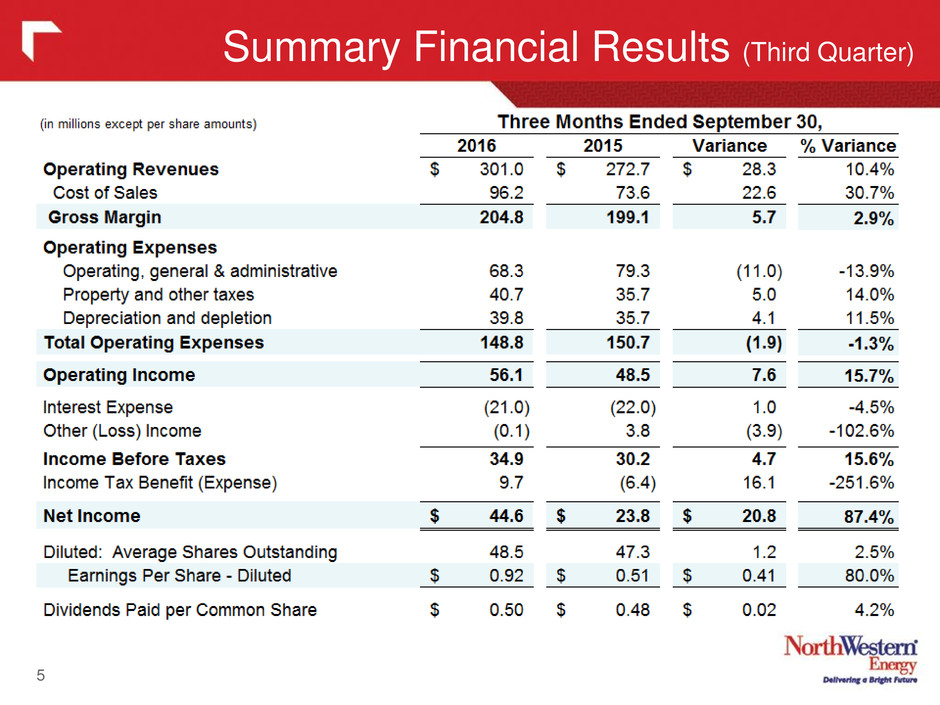
Summary Financial Results (Third Quarter) 5
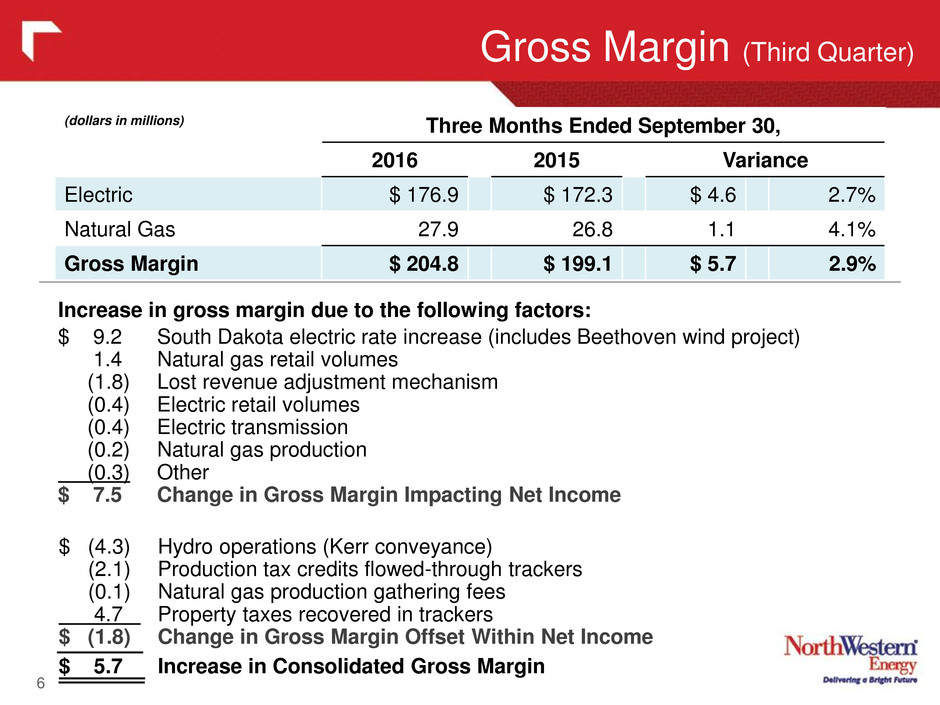
6 Gross Margin (Third Quarter) (dollars in millions) Three Months Ended September 30, 2016 2015 Variance Electric $ 176.9 $ 172.3 $ 4.6 2.7% Natural Gas 27.9 26.8 1.1 4.1% Gross Margin $ 204.8 $ 199.1 $ 5.7 2.9% Increase in gross margin due to the following factors: $ 9.2 South Dakota electric rate increase (includes Beethoven wind project) 1.4 Natural gas retail volumes (1.8) Lost revenue adjustment mechanism (0.4) Electric retail volumes (0.4) Electric transmission (0.2) Natural gas production (0.3) Other $ 7.5 Change in Gross Margin Impacting Net Income $ (4.3) Hydro operations (Kerr conveyance) (2.1) Production tax credits flowed-through trackers (0.1) Natural gas production gathering fees 4.7 Property taxes recovered in trackers $ (1.8) Change in Gross Margin Offset Within Net Income $ 5.7 Increase in Consolidated Gross Margin
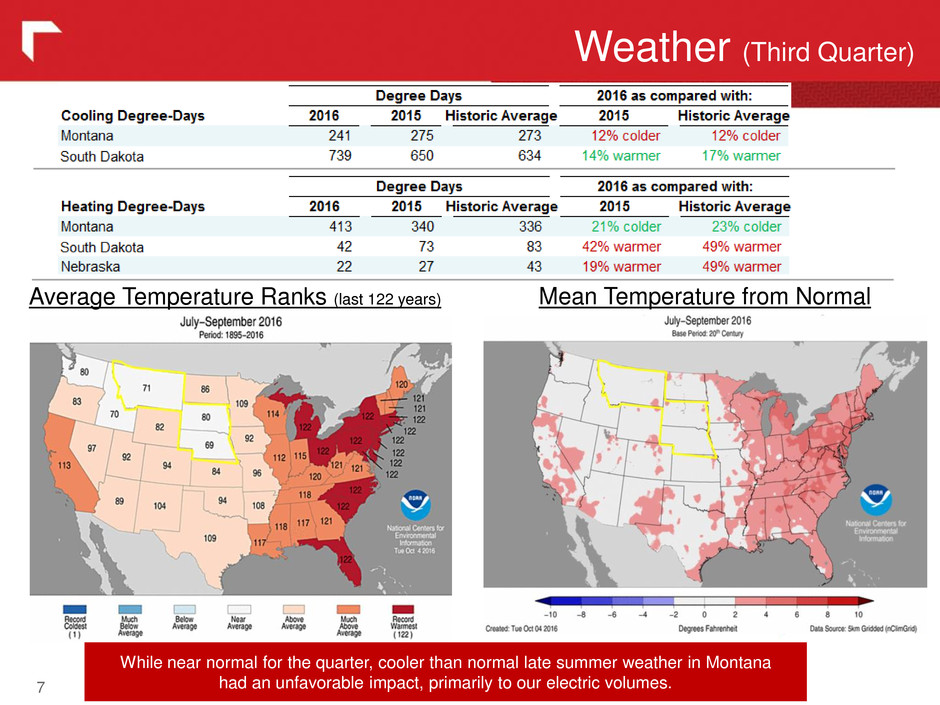
Weather (Third Quarter) 7 Average Temperature Ranks (last 122 years) Mean Temperature from Normal While near normal for the quarter, cooler than normal late summer weather in Montana had an unfavorable impact, primarily to our electric volumes.
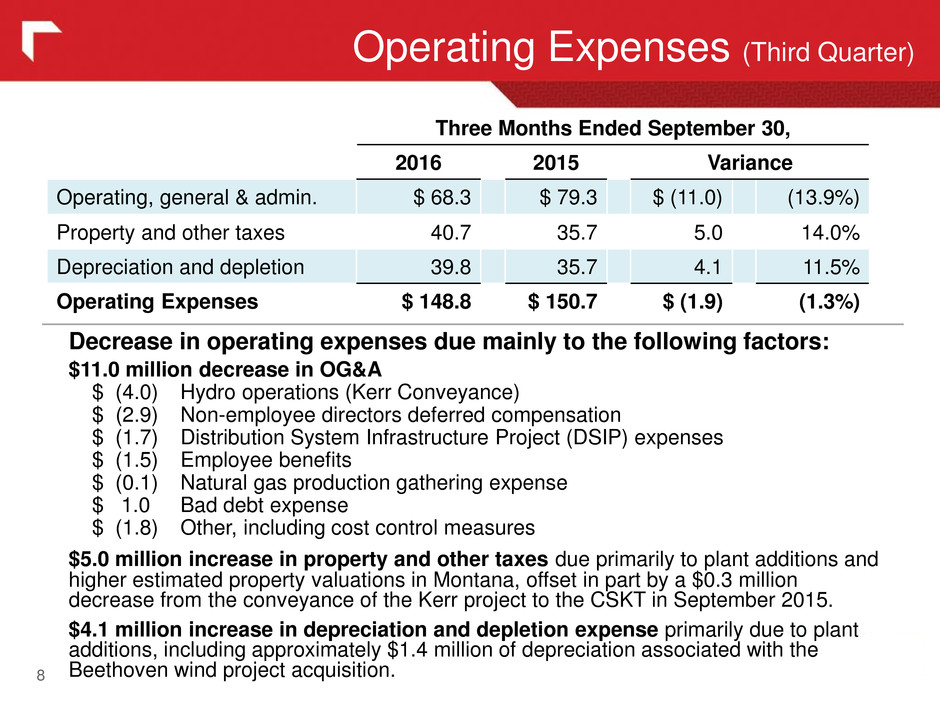
Operating Expenses (Third Quarter) 8 Decrease in operating expenses due mainly to the following factors: $11.0 million decrease in OG&A $ (4.0) Hydro operations (Kerr Conveyance) $ (2.9) Non-employee directors deferred compensation $ (1.7) Distribution System Infrastructure Project (DSIP) expenses $ (1.5) Employee benefits $ (0.1) Natural gas production gathering expense $ 1.0 Bad debt expense $ (1.8) Other, including cost control measures $5.0 million increase in property and other taxes due primarily to plant additions and higher estimated property valuations in Montana, offset in part by a $0.3 million decrease from the conveyance of the Kerr project to the CSKT in September 2015. $4.1 million increase in depreciation and depletion expense primarily due to plant additions, including approximately $1.4 million of depreciation associated with the Beethoven wind project acquisition. Three Months Ended September 30, 2016 2015 Variance Operating, general & admin. $ 68.3 $ 79.3 $ (11.0) (13.9%) Property and other taxes 40.7 35.7 5.0 14.0% Depreciation and depletion 39.8 35.7 4.1 11.5% Operating Expenses $ 148.8 $ 150.7 $ (1.9) (1.3%)
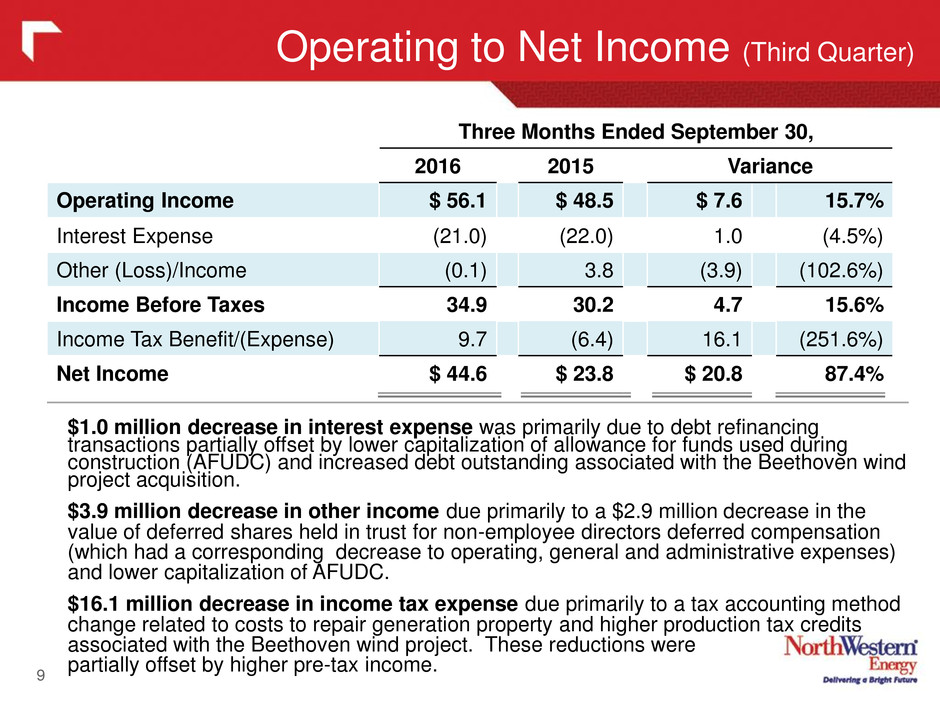
Operating to Net Income (Third Quarter) 9 $1.0 million decrease in interest expense was primarily due to debt refinancing transactions partially offset by lower capitalization of allowance for funds used during construction (AFUDC) and increased debt outstanding associated with the Beethoven wind project acquisition. $3.9 million decrease in other income due primarily to a $2.9 million decrease in the value of deferred shares held in trust for non-employee directors deferred compensation (which had a corresponding decrease to operating, general and administrative expenses) and lower capitalization of AFUDC. $16.1 million decrease in income tax expense due primarily to a tax accounting method change related to costs to repair generation property and higher production tax credits associated with the Beethoven wind project. These reductions were partially offset by higher pre-tax income. Three Months Ended September 30, 2016 2015 Variance Operating Income $ 56.1 $ 48.5 $ 7.6 15.7% Interest Expense (21.0) (22.0) 1.0 (4.5%) Other (Loss)/Income (0.1) 3.8 (3.9) (102.6%) Income Before Taxes 34.9 30.2 4.7 15.6% Income Tax Benefit/(Expense) 9.7 (6.4) 16.1 (251.6%) Net Income $ 44.6 $ 23.8 $ 20.8 87.4%
Balance Sheet 10
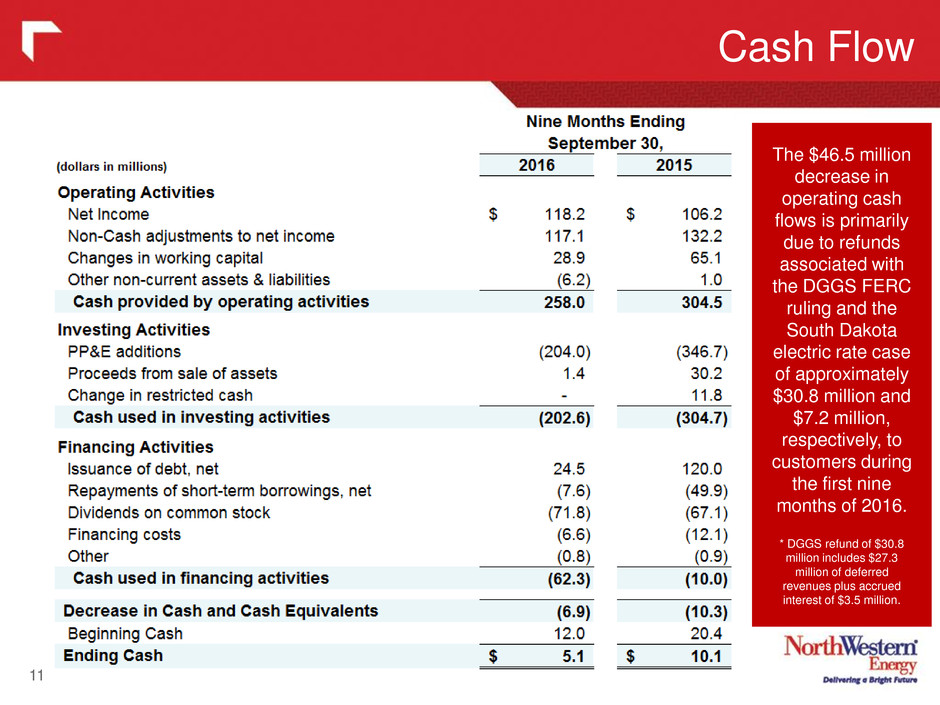
Cash Flow 11 The $46.5 million decrease in operating cash flows is primarily due to refunds associated with the DGGS FERC ruling and the South Dakota electric rate case of approximately $30.8 million and $7.2 million, respectively, to customers during the first nine months of 2016. * DGGS refund of $30.8 million includes $27.3 million of deferred revenues plus accrued interest of $3.5 million.
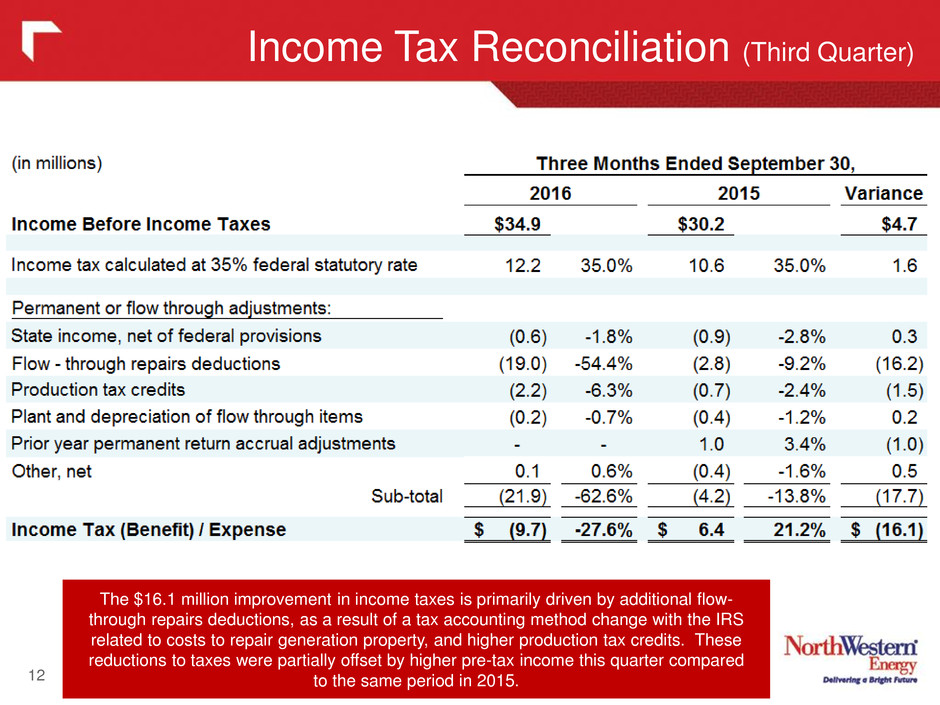
Income Tax Reconciliation (Third Quarter) 12 The $16.1 million improvement in income taxes is primarily driven by additional flow- through repairs deductions, as a result of a tax accounting method change with the IRS related to costs to repair generation property, and higher production tax credits. These reductions to taxes were partially offset by higher pre-tax income this quarter compared to the same period in 2015.
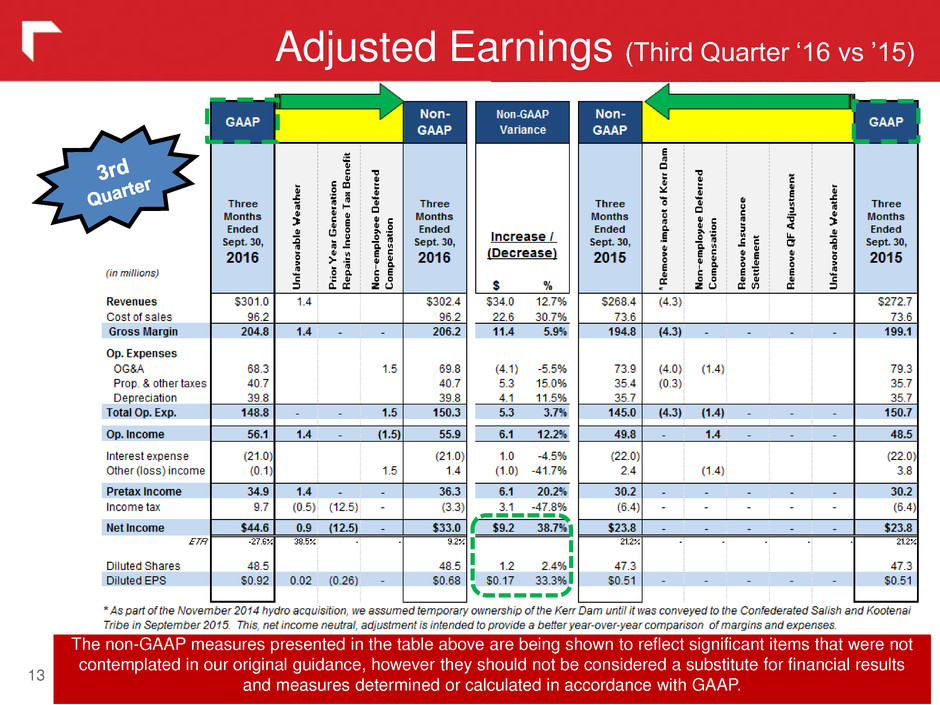
Adjusted Earnings (Third Quarter ‘16 vs ’15) 13 The non-GAAP measures presented in the table above are being shown to reflect significant items that were not contemplated in our original guidance, however they should not be considered a substitute for financial results and measures determined or calculated in accordance with GAAP.
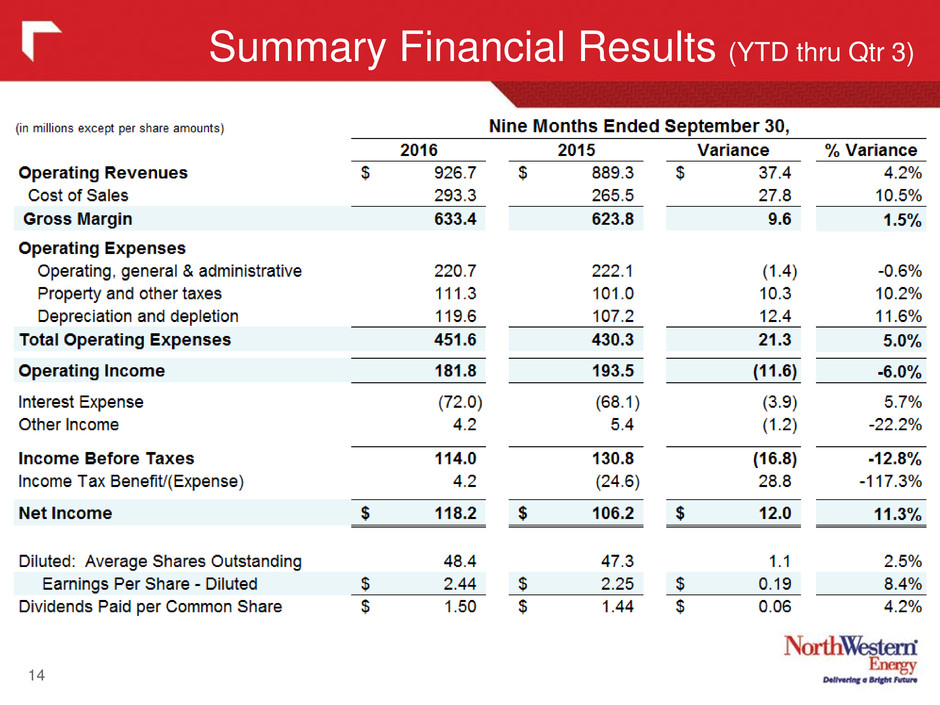
Summary Financial Results (YTD thru Qtr 3) 14
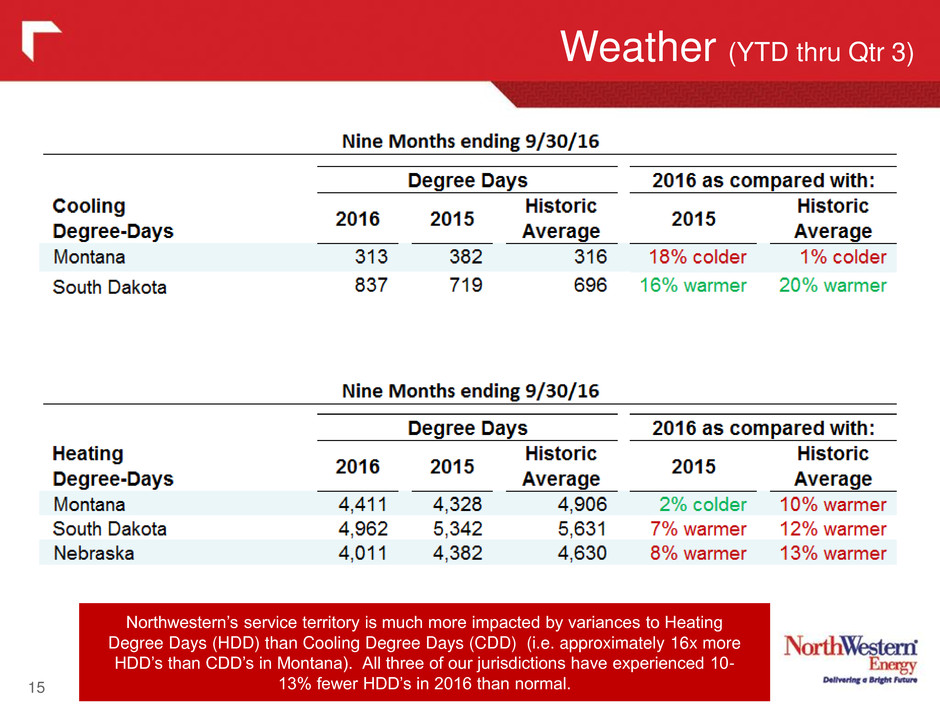
Weather (YTD thru Qtr 3) 15 Northwestern’s service territory is much more impacted by variances to Heating Degree Days (HDD) than Cooling Degree Days (CDD) (i.e. approximately 16x more HDD’s than CDD’s in Montana). All three of our jurisdictions have experienced 10- 13% fewer HDD’s in 2016 than normal.
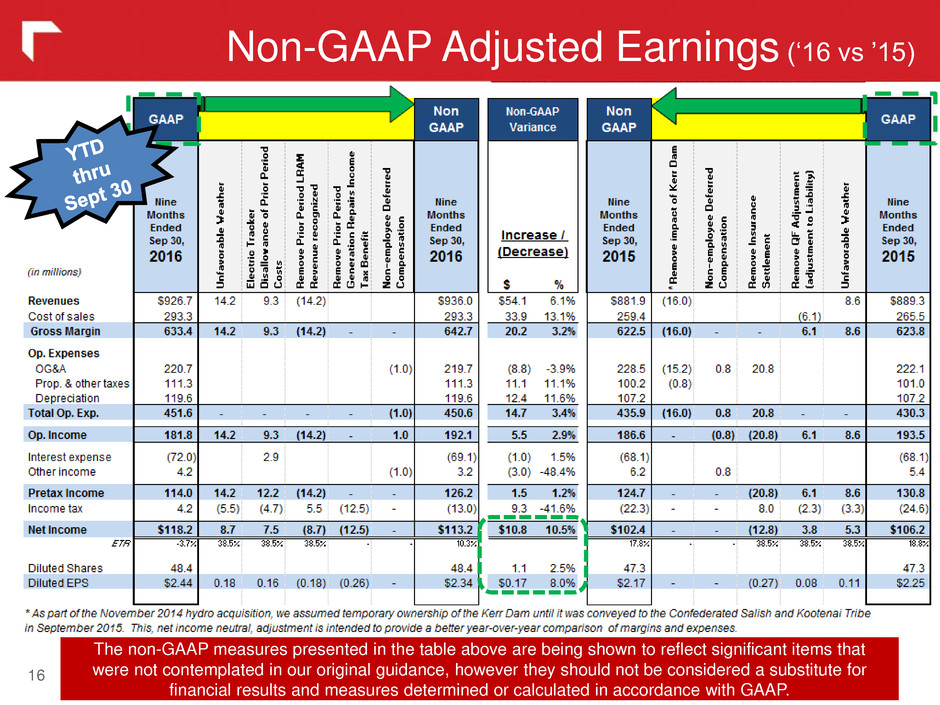
Non-GAAP Adjusted Earnings (‘16 vs ’15) 16 The non-GAAP measures presented in the table above are being shown to reflect significant items that were not contemplated in our original guidance, however they should not be considered a substitute for financial results and measures determined or calculated in accordance with GAAP.
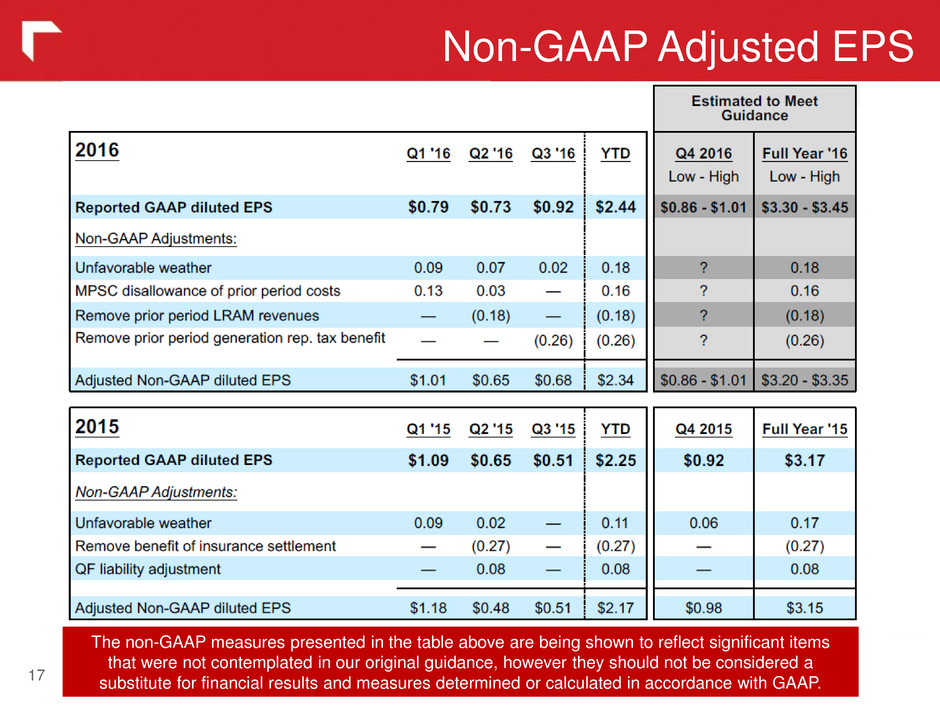
Non-GAAP Adjusted EPS 17 The non-GAAP measures presented in the table above are being shown to reflect significant items that were not contemplated in our original guidance, however they should not be considered a substitute for financial results and measures determined or calculated in accordance with GAAP.
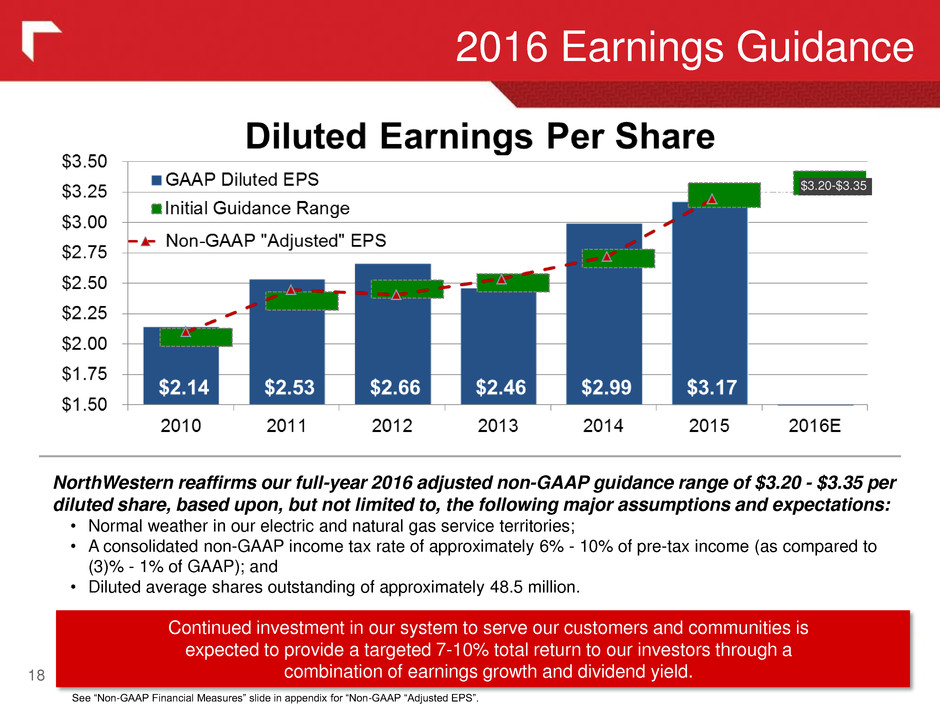
2016 Earnings Guidance 18 NorthWestern reaffirms our full-year 2016 adjusted non-GAAP guidance range of $3.20 - $3.35 per diluted share, based upon, but not limited to, the following major assumptions and expectations: • Normal weather in our electric and natural gas service territories; • A consolidated non-GAAP income tax rate of approximately 6% - 10% of pre-tax income (as compared to (3)% - 1% of GAAP); and • Diluted average shares outstanding of approximately 48.5 million. Continued investment in our system to serve our customers and communities is expected to provide a targeted 7-10% total return to our investors through a combination of earnings growth and dividend yield. See “Non-GAAP Financial Measures” slide in appendix for “Non-GAAP “Adjusted EPS”. $2.60 - $2.75 $3.20-$3.35
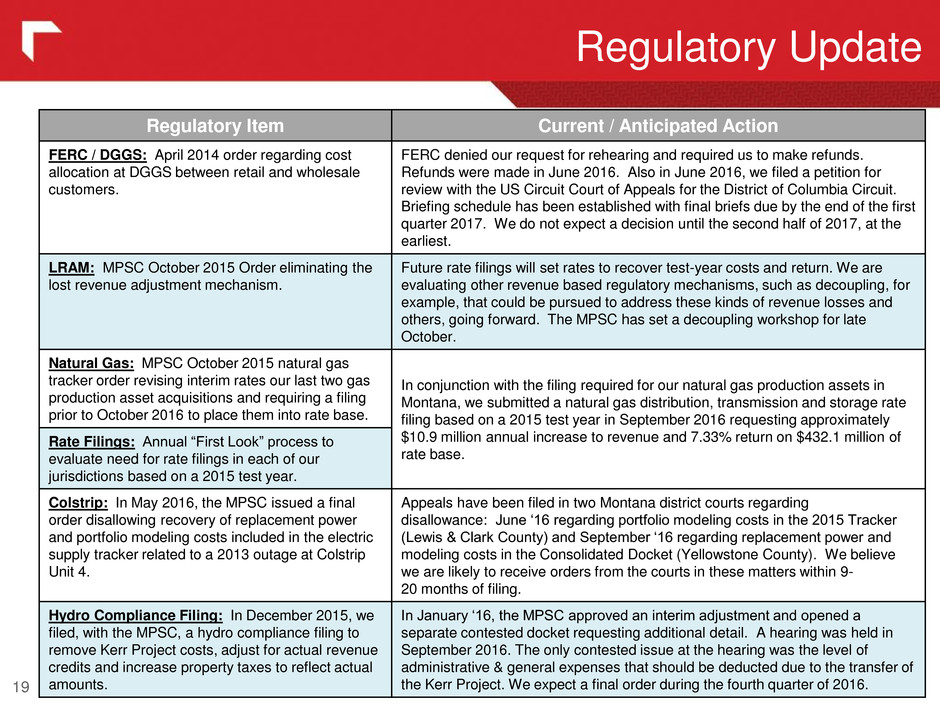
19 Regulatory Update Regulatory Item Current / Anticipated Action FERC / DGGS: April 2014 order regarding cost allocation at DGGS between retail and wholesale customers. FERC denied our request for rehearing and required us to make refunds. Refunds were made in June 2016. Also in June 2016, we filed a petition for review with the US Circuit Court of Appeals for the District of Columbia Circuit. Briefing schedule has been established with final briefs due by the end of the first quarter 2017. We do not expect a decision until the second half of 2017, at the earliest. LRAM: MPSC October 2015 Order eliminating the lost revenue adjustment mechanism. Future rate filings will set rates to recover test-year costs and return. We are evaluating other revenue based regulatory mechanisms, such as decoupling, for example, that could be pursued to address these kinds of revenue losses and others, going forward. The MPSC has set a decoupling workshop for late October. Natural Gas: MPSC October 2015 natural gas tracker order revising interim rates our last two gas production asset acquisitions and requiring a filing prior to October 2016 to place them into rate base. In conjunction with the filing required for our natural gas production assets in Montana, we submitted a natural gas distribution, transmission and storage rate filing based on a 2015 test year in September 2016 requesting approximately $10.9 million annual increase to revenue and 7.33% return on $432.1 million of rate base. Rate Filings: Annual “First Look” process to evaluate need for rate filings in each of our jurisdictions based on a 2015 test year. Colstrip: In May 2016, the MPSC issued a final order disallowing recovery of replacement power and portfolio modeling costs included in the electric supply tracker related to a 2013 outage at Colstrip Unit 4. Appeals have been filed in two Montana district courts regarding disallowance: June ‘16 regarding portfolio modeling costs in the 2015 Tracker (Lewis & Clark County) and September ‘16 regarding replacement power and modeling costs in the Consolidated Docket (Yellowstone County). We believe we are likely to receive orders from the courts in these matters within 9- 20 months of filing. Hydro Compliance Filing: In December 2015, we filed, with the MPSC, a hydro compliance filing to remove Kerr Project costs, adjust for actual revenue credits and increase property taxes to reflect actual amounts. In January ‘16, the MPSC approved an interim adjustment and opened a separate contested docket requesting additional detail. A hearing was held in September 2016. The only contested issue at the hearing was the level of administrative & general expenses that should be deducted due to the transfer of the Kerr Project. We expect a final order during the fourth quarter of 2016.

Montana Natural Gas Rate Filing 20 Montana PSC Docket D2016.9.68 In September 2016, we filed a request with MPSC for an annual revenue increase of $10.9 million. This increase is primarily due to investments made to our gas infrastructure and natural gas reserves since 2012. The $10.9 million increase will represent a 6.77% increase* in monthly bills for a typical residential customer using 100 therms per month. * Increase over September 2016 bill. NWE 100 Therm bill with proposed rates:
21 Appendix
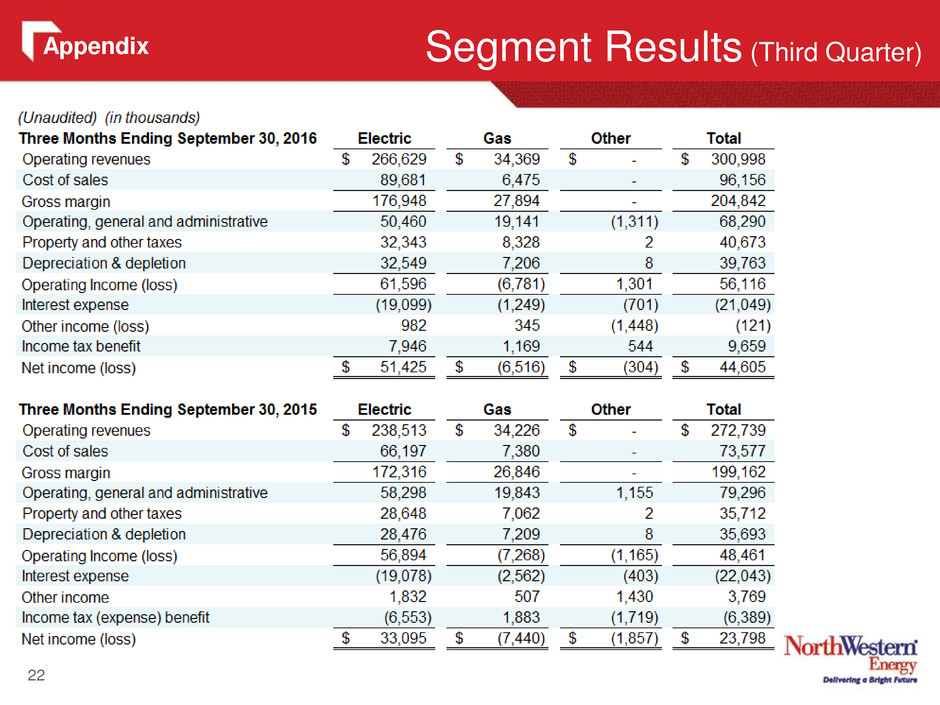
22 Segment Results (Third Quarter) Appendix
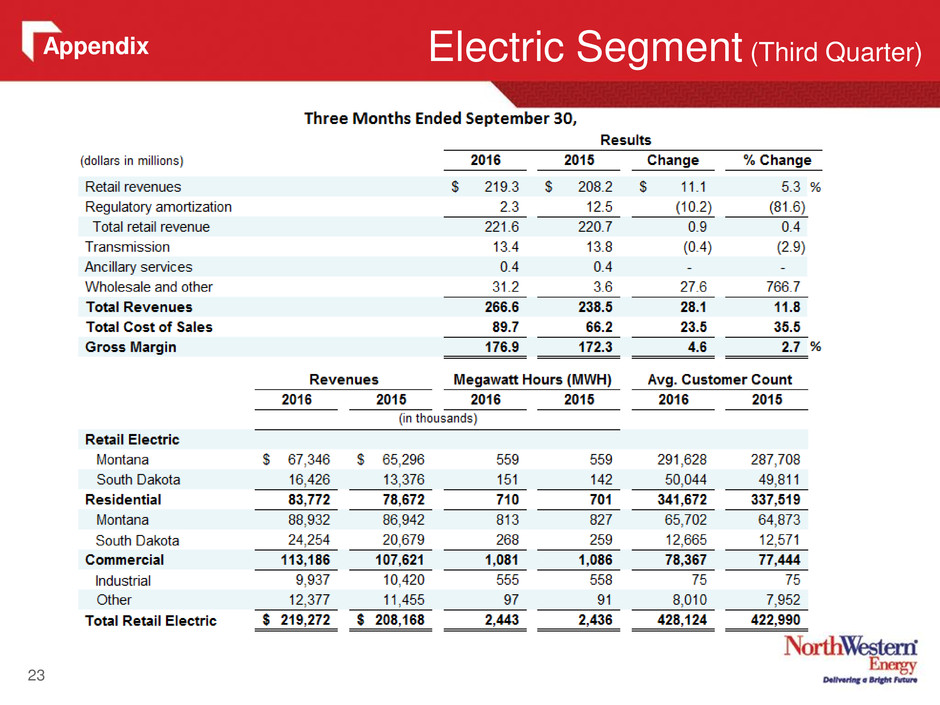
23 Electric Segment (Third Quarter) Appendix
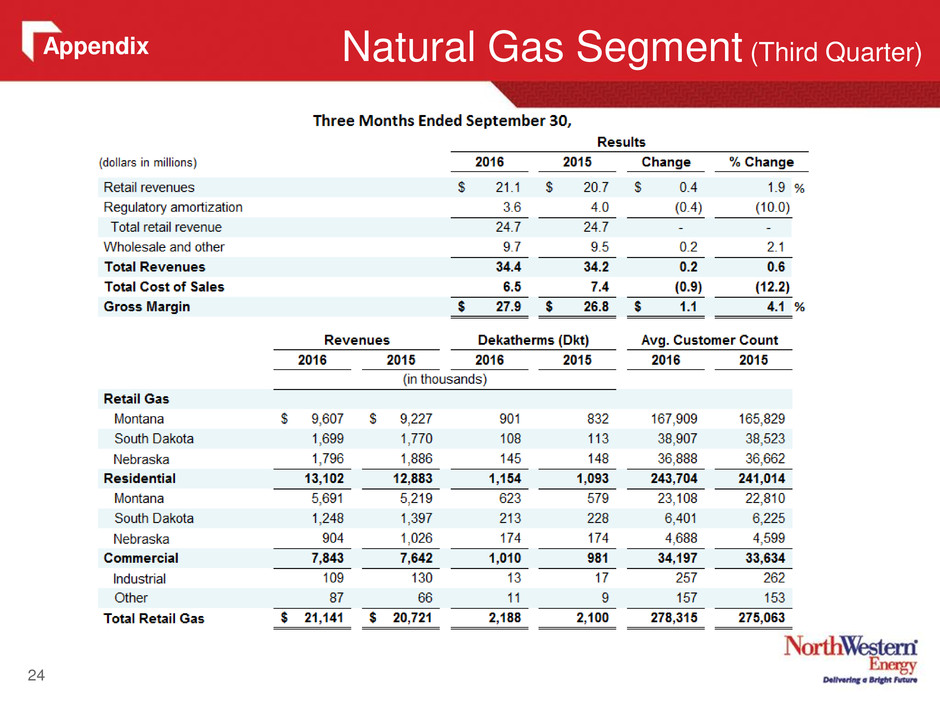
24 Natural Gas Segment (Third Quarter) Appendix
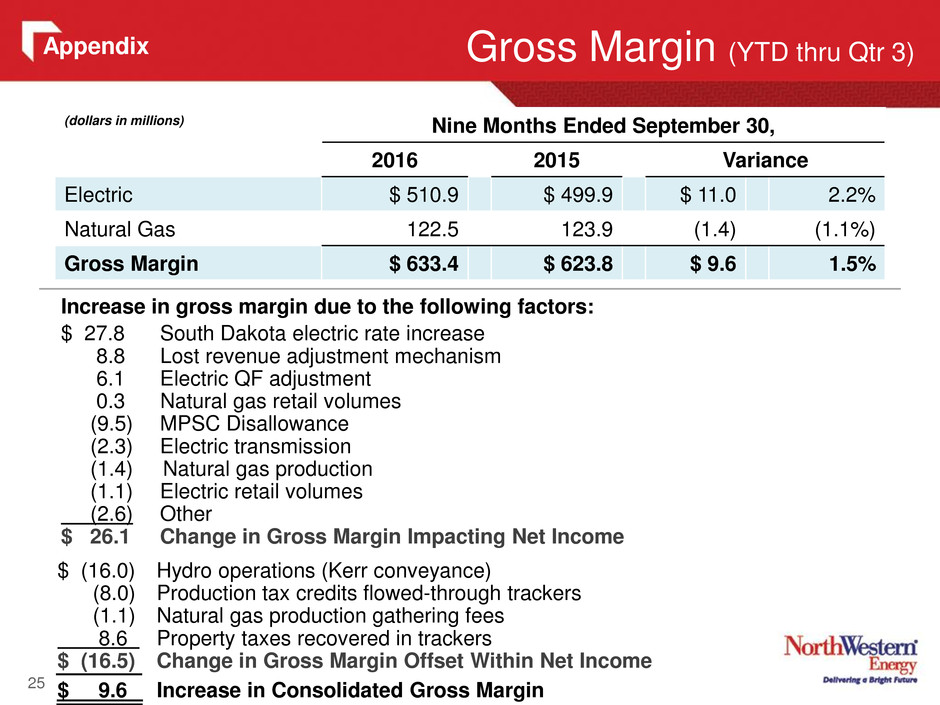
25 Gross Margin (YTD thru Qtr 3) (dollars in millions) Nine Months Ended September 30, 2016 2015 Variance Electric $ 510.9 $ 499.9 $ 11.0 2.2% Natural Gas 122.5 123.9 (1.4) (1.1%) Gross Margin $ 633.4 $ 623.8 $ 9.6 1.5% Increase in gross margin due to the following factors: $ 27.8 South Dakota electric rate increase 8.8 Lost revenue adjustment mechanism 6.1 Electric QF adjustment 0.3 Natural gas retail volumes (9.5) MPSC Disallowance (2.3) Electric transmission (1.4) Natural gas production (1.1) Electric retail volumes (2.6) Other $ 26.1 Change in Gross Margin Impacting Net Income $ (16.0) Hydro operations (Kerr conveyance) (8.0) Production tax credits flowed-through trackers (1.1) Natural gas production gathering fees 8.6 Property taxes recovered in trackers $ (16.5) Change in Gross Margin Offset Within Net Income $ 9.6 Increase in Consolidated Gross Margin Appendix
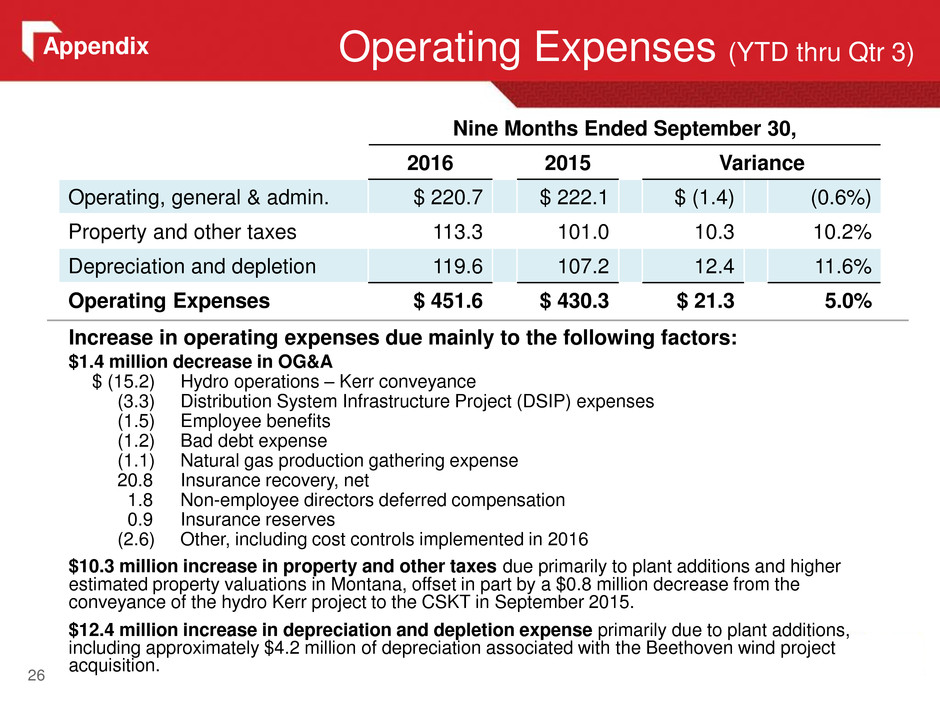
Operating Expenses (YTD thru Qtr 3) 26 Increase in operating expenses due mainly to the following factors: $1.4 million decrease in OG&A $ (15.2) Hydro operations – Kerr conveyance (3.3) Distribution System Infrastructure Project (DSIP) expenses (1.5) Employee benefits (1.2) Bad debt expense (1.1) Natural gas production gathering expense 20.8 Insurance recovery, net 1.8 Non-employee directors deferred compensation 0.9 Insurance reserves (2.6) Other, including cost controls implemented in 2016 $10.3 million increase in property and other taxes due primarily to plant additions and higher estimated property valuations in Montana, offset in part by a $0.8 million decrease from the conveyance of the hydro Kerr project to the CSKT in September 2015. $12.4 million increase in depreciation and depletion expense primarily due to plant additions, including approximately $4.2 million of depreciation associated with the Beethoven wind project acquisition. Nine Months Ended September 30, 2016 2015 Variance Operating, general & admin. $ 220.7 $ 222.1 $ (1.4) (0.6%) Property and other taxes 113.3 101.0 10.3 10.2% Depreciation and depletion 119.6 107.2 12.4 11.6% Operating Expenses $ 451.6 $ 430.3 $ 21.3 5.0% Appendix

Operating to Net Income (YTD thru Qtr 3) 27 $3.9 million increase in interest expense was primarily due to $2.9 million of interest associated with the MPSC disallowance, lower capitalization of allowance for funds used during construction (AFUDC), increased debt outstanding associated with the Beethoven acquisition, partly offset by debt refinancing transactions. $1.2 million decrease in other income due primarily to lower capitalization of AFUDC, partly offset by a $1.8 million increase in the value of deferred shares held in trust for non-employee directors deferred compensation (which had a corresponding increase to operating, general and administrative expenses). $28.8 million decrease in income tax expense due primarily to a tax accounting change related to costs to repair generation property, lower pre-tax income and higher production tax credits associated with Beethoven wind project. Nine Months Ended September 30, 2016 2015 Variance Operating Income $ 181.8 $ 193.5 $ (11.7) (6.0%) Interest Expense (72.0) (68.1) (3.9) 5.7% Other (Loss)/Income 4.2 5.4 (1.2) (22.2%) Income Before Taxes 114.0 130.8 (16.8) (12.8%) Income Tax Benefit/(Expense) 4.2 (24.6) 28.8 (117.1%) Net Income $ 118.2 $ 106.2 $ 12.0 11.3% Appendix
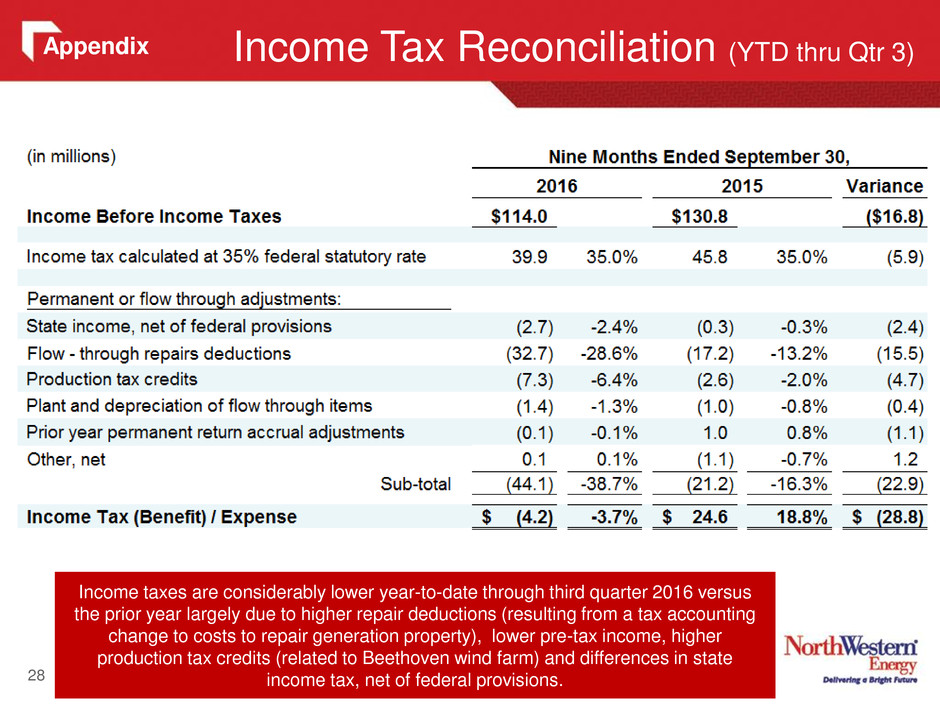
Income Tax Reconciliation (YTD thru Qtr 3) 28 Income taxes are considerably lower year-to-date through third quarter 2016 versus the prior year largely due to higher repair deductions (resulting from a tax accounting change to costs to repair generation property), lower pre-tax income, higher production tax credits (related to Beethoven wind farm) and differences in state income tax, net of federal provisions. Appendix
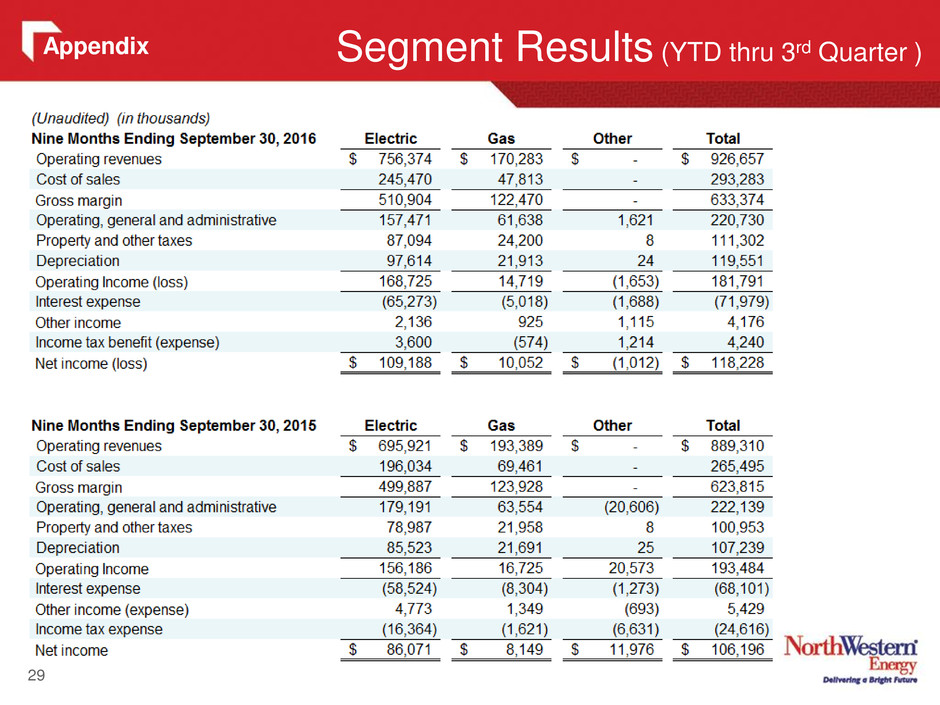
29 Segment Results (YTD thru 3rd Quarter ) Appendix
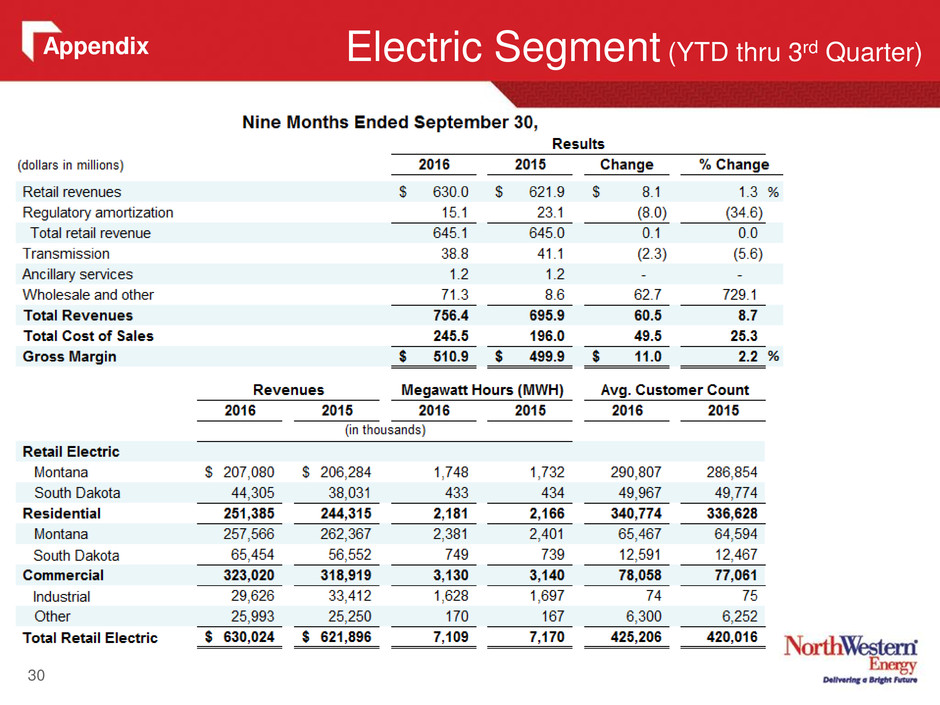
30 Electric Segment (YTD thru 3rd Quarter) Appendix
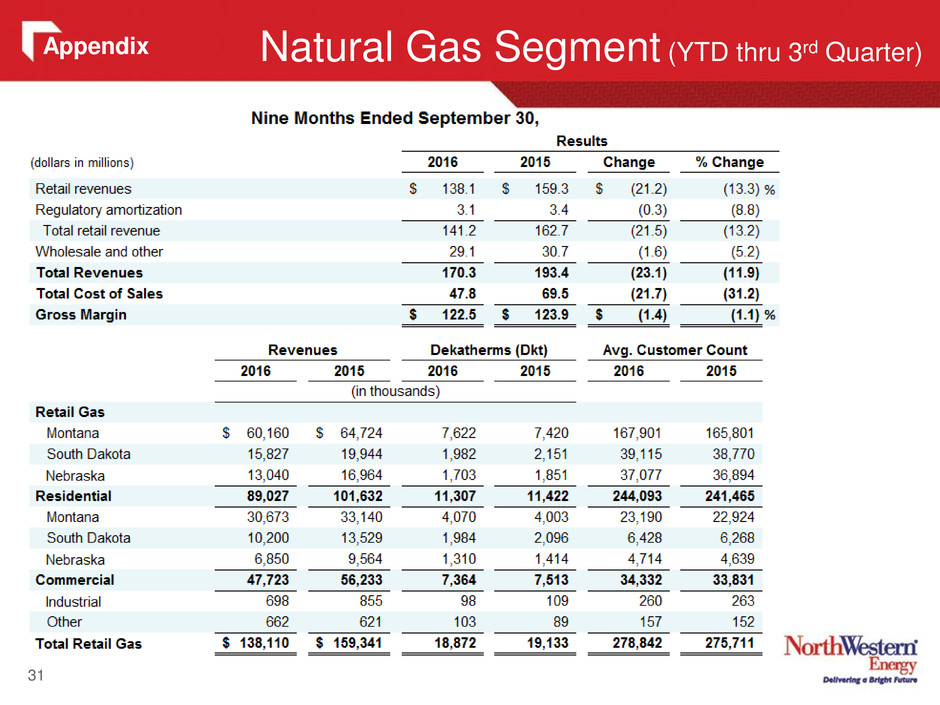
31 Natural Gas Segment (YTD thru 3rd Quarter) Appendix
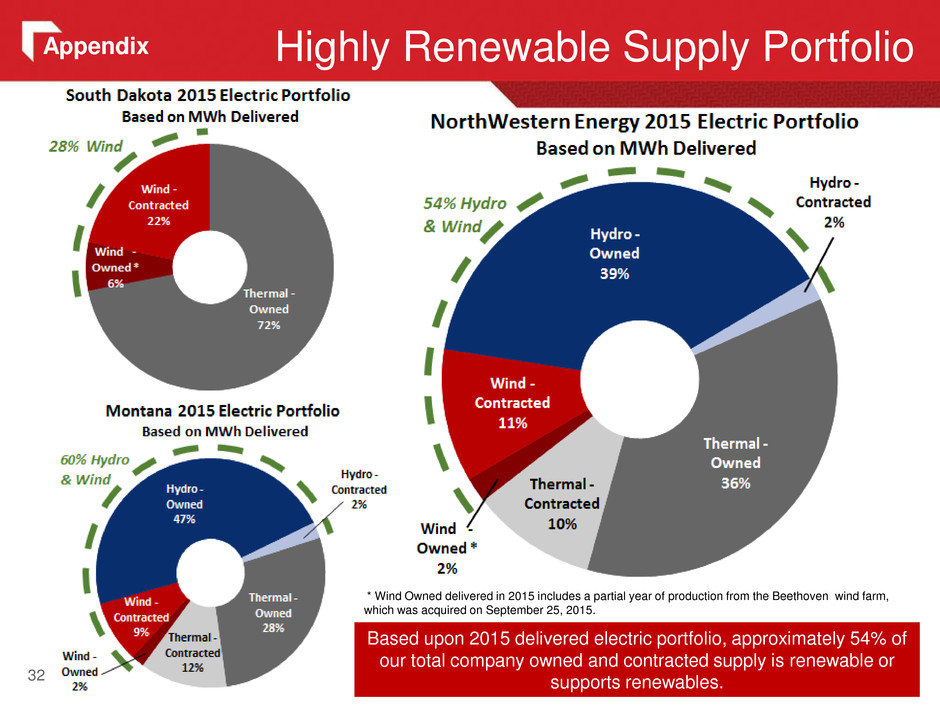
32 Highly Renewable Supply Portfolio Based upon 2015 delivered electric portfolio, approximately 54% of our total company owned and contracted supply is renewable or supports renewables. * Wind Owned delivered in 2015 includes a partial year of production from the Beethoven wind farm, which was acquired on September 25, 2015. Appendix
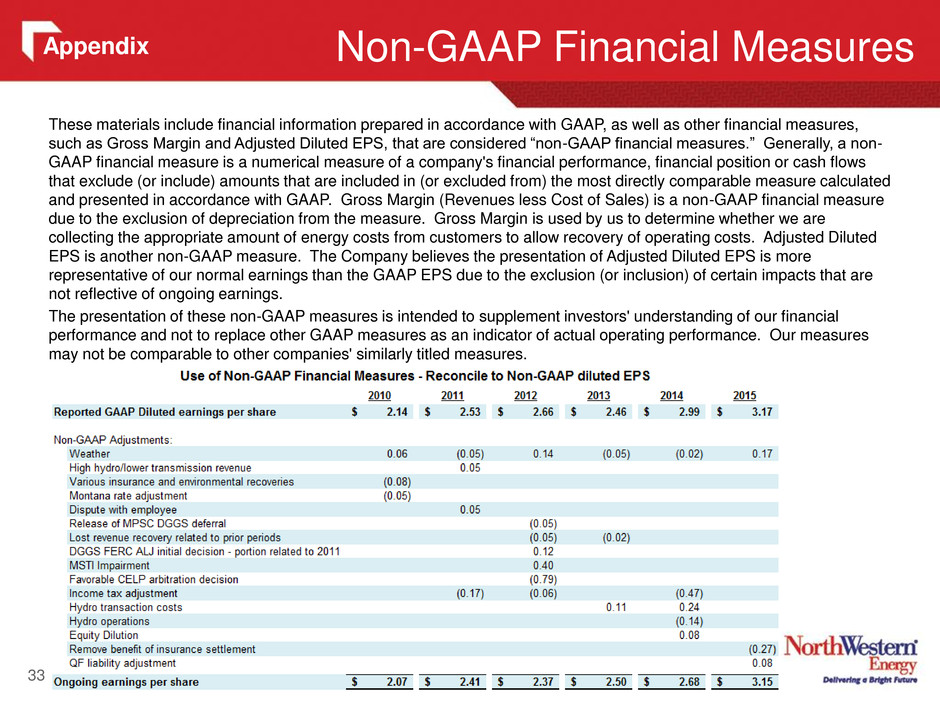
These materials include financial information prepared in accordance with GAAP, as well as other financial measures, such as Gross Margin and Adjusted Diluted EPS, that are considered “non-GAAP financial measures.” Generally, a non- GAAP financial measure is a numerical measure of a company's financial performance, financial position or cash flows that exclude (or include) amounts that are included in (or excluded from) the most directly comparable measure calculated and presented in accordance with GAAP. Gross Margin (Revenues less Cost of Sales) is a non-GAAP financial measure due to the exclusion of depreciation from the measure. Gross Margin is used by us to determine whether we are collecting the appropriate amount of energy costs from customers to allow recovery of operating costs. Adjusted Diluted EPS is another non-GAAP measure. The Company believes the presentation of Adjusted Diluted EPS is more representative of our normal earnings than the GAAP EPS due to the exclusion (or inclusion) of certain impacts that are not reflective of ongoing earnings. The presentation of these non-GAAP measures is intended to supplement investors' understanding of our financial performance and not to replace other GAAP measures as an indicator of actual operating performance. Our measures may not be comparable to other companies' similarly titled measures. Non-GAAP Financial Measures 33 Appendix

34


