2017 Third Quarter Earnings Webcast November 2, 2017 Madison Dam

Presenting Today 2 Bob Rowe, President & CEO Brian Bird, Vice President & CFO Forward Looking Statements During the course of this presentation, there will be forward-looking statements within the meaning of the “safe harbor” provisions of the Private Securities Litigation Reform Act of 1995. Forward-looking statements often address our expected future business and financial performance, and often contain words such as “expects,” “anticipates,” “intends,” “plans,” “believes,” “seeks,” or “will.” The information in this presentation is based upon our current expectations as of the date hereof unless otherwise noted. Our actual future business and financial performance may differ materially and adversely from our expectations expressed in any forward-looking statements. We undertake no obligation to revise or publicly update our forward-looking statements or this presentation for any reason. Although our expectations and beliefs are based on reasonable assumptions, actual results may differ materially. The factors that may affect our results are listed in certain of our press releases and disclosed in the Company’s 10-Q which we filed with the SEC on November 1, 2017 and our other public filings with the SEC.

• Net income for the third quarter was $36.4 million, or $0.75 per diluted share, as compared with net income of $44.6 million, or $0.92 per diluted share, for the same period in 2016. • This $8.2 million decrease in net income is primarily due to the inclusion in our 2016 results of a $15.5 million income tax benefit due to the adoption of a tax accounting method change related to the cost to repair generation assets, partly offset by an increase in gross margin driven by favorable weather, and to a lesser extent, by customer growth. Third Quarter Highlights 3 • Non-GAAP adjusted earnings per share increased $0.06 or 8.8% to $0.74 as compared with $0.68 for the same period in 2016. • The Board approved a quarterly stock dividend of $0.525 per share, payable December 29, 2017.
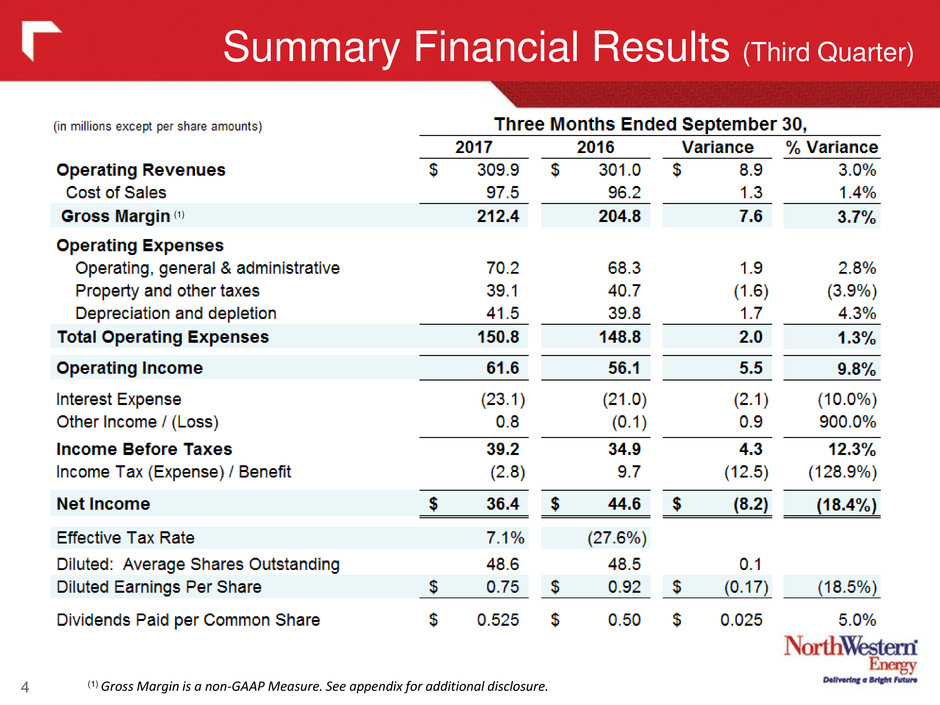
Summary Financial Results (Third Quarter) 4 (1) Gross Margin is a non-GAAP Measure. See appendix for additional disclosure. (1)

5 Gross Margin (Third Quarter) (dollars in millions) Three Months Ended September 30, 2017 2016 Variance Electric $ 183.5 $ 176.9 $ 6.6 3.7% Natural Gas 28.9 27.9 1.0 3.6% Gross Margin $ 212.4 $ 204.8 $ 7.6 3.7% Increase in gross margin due to the following factors: $ 5.1 Electric retail volumes 0.7 Montana natural gas and production rates 0.1 Natural gas retail volumes (0.3) Electric transmission 1.6 Other $ 7.2 Change in Gross Margin Impacting Net Income $ 1.0 Production tax credits flowed-through trackers 0.6 Operating expenses recovered in trackers (1.0) Property taxes recovered in trackers (0.2) Gas production gathering fees $ 0.4 Change in Gross Margin Offset Within Net Income $ 7.6 Increase in Gross Margin (1) Gross Margin is a non-GAAP Measure. See appendix for additional disclosure. (1)
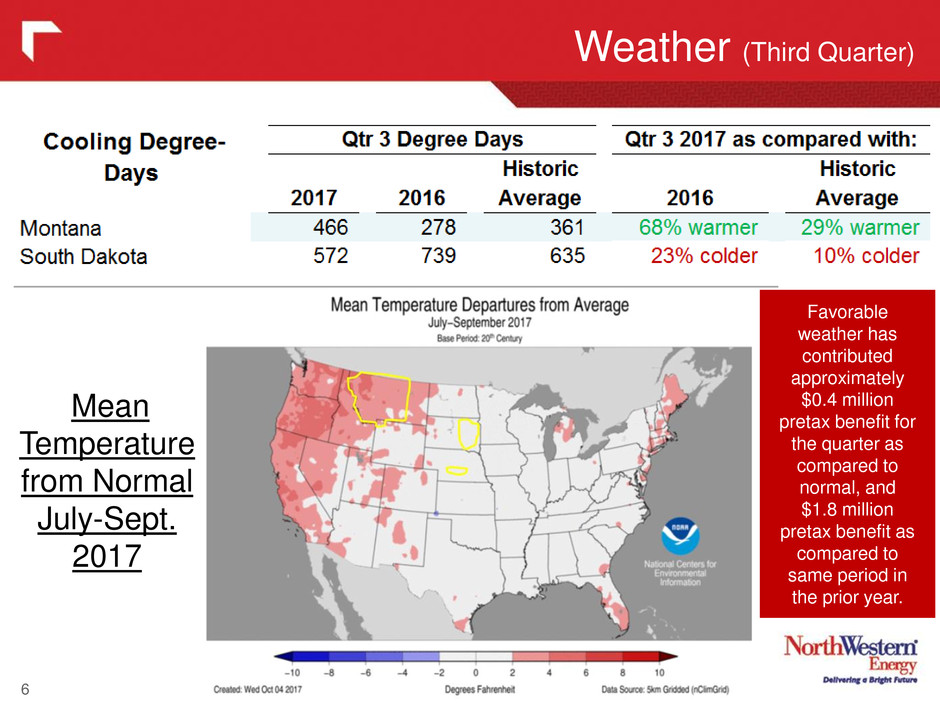
Weather (Third Quarter) 6 Mean Temperature from Normal July-Sept. 2017 Favorable weather has contributed approximately $0.4 million pretax benefit for the quarter as compared to normal, and $1.8 million pretax benefit as compared to same period in the prior year.
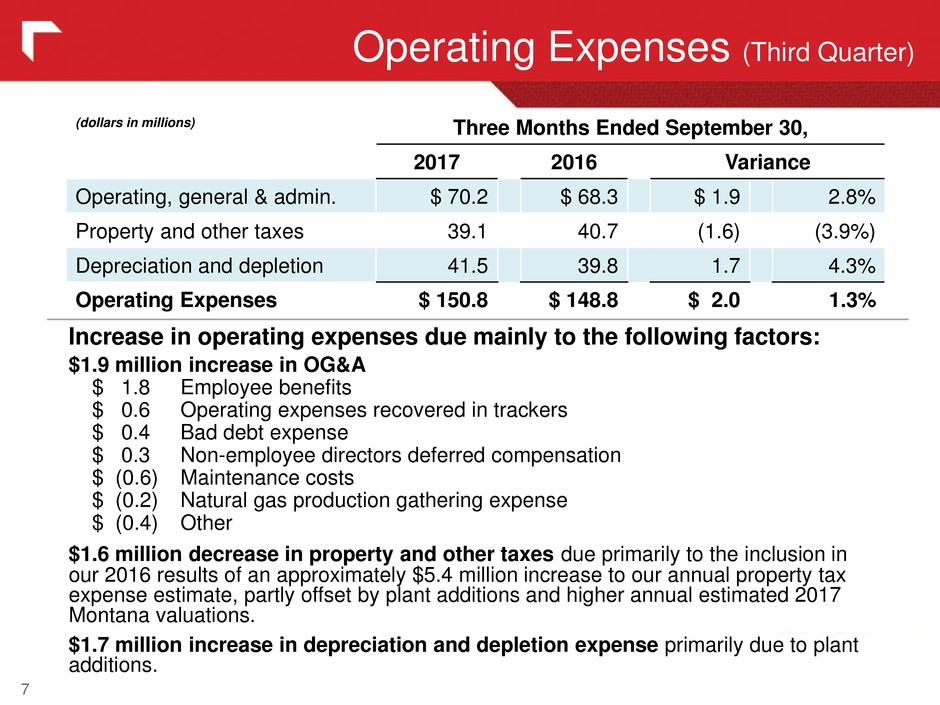
Operating Expenses (Third Quarter) 7 Increase in operating expenses due mainly to the following factors: $1.9 million increase in OG&A $ 1.8 Employee benefits $ 0.6 Operating expenses recovered in trackers $ 0.4 Bad debt expense $ 0.3 Non-employee directors deferred compensation $ (0.6) Maintenance costs $ (0.2) Natural gas production gathering expense $ (0.4) Other $1.6 million decrease in property and other taxes due primarily to the inclusion in our 2016 results of an approximately $5.4 million increase to our annual property tax expense estimate, partly offset by plant additions and higher annual estimated 2017 Montana valuations. $1.7 million increase in depreciation and depletion expense primarily due to plant additions. (dollars in millions) Three Months Ended September 30, 2017 2016 Variance Operating, general & admin. $ 70.2 $ 68.3 $ 1.9 2.8% Property and other taxes 39.1 40.7 (1.6) (3.9%) Depreciation and depletion 41.5 39.8 1.7 4.3% Operating Expenses $ 150.8 $ 148.8 $ 2.0 1.3%
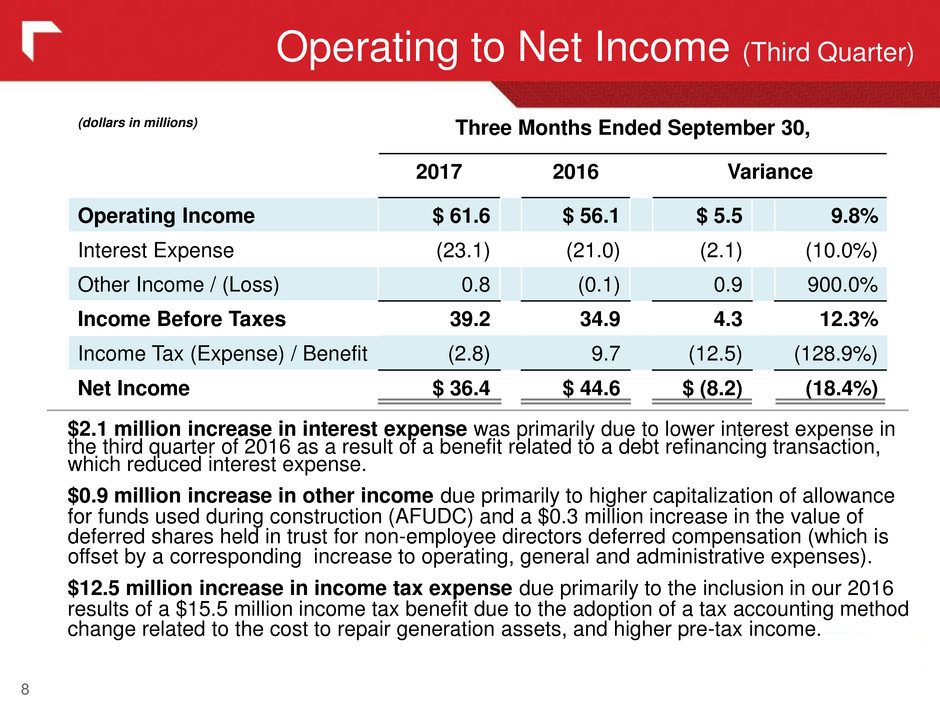
Operating to Net Income (Third Quarter) 8 $2.1 million increase in interest expense was primarily due to lower interest expense in the third quarter of 2016 as a result of a benefit related to a debt refinancing transaction, which reduced interest expense. $0.9 million increase in other income due primarily to higher capitalization of allowance for funds used during construction (AFUDC) and a $0.3 million increase in the value of deferred shares held in trust for non-employee directors deferred compensation (which is offset by a corresponding increase to operating, general and administrative expenses). $12.5 million increase in income tax expense due primarily to the inclusion in our 2016 results of a $15.5 million income tax benefit due to the adoption of a tax accounting method change related to the cost to repair generation assets, and higher pre-tax income. (dollars in millions) Three Months Ended September 30, 2017 2016 Variance Operating Income $ 61.6 $ 56.1 $ 5.5 9.8% Interest Expense (23.1) (21.0) (2.1) (10.0%) Other Income / (Loss) 0.8 (0.1) 0.9 900.0% Income Before Taxes 39.2 34.9 4.3 12.3% Income Tax (Expense) / Benefit (2.8) 9.7 (12.5) (128.9%) Net Income $ 36.4 $ 44.6 $ (8.2) (18.4%)

Income Tax Reconciliation (Third Quarter) 9 During the third quarter of 2016, we filed a tax accounting method change with the IRS related to costs to repair generation property. This resulted in an income tax benefit of approximately $15.5 million during the three months ended September 30, 2016, of which approximately $12.5 million was related to 2015 and prior tax years, and is reflected in the flow-through repairs deductions line above.
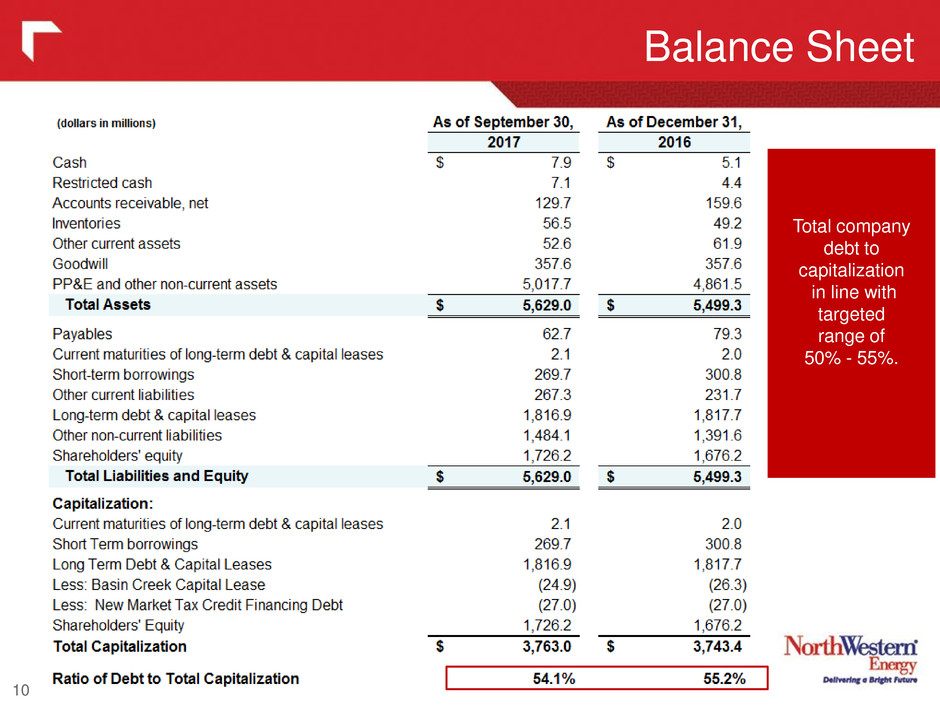
Balance Sheet 10 Total company debt to capitalization in line with targeted range of 50% - 55%.

Cash Flow 11 The $42 million improvement in Cash provided by Operating Activities is largely attributed to refunds associated with the DGGS FERC ruling and the South Dakota electric rate case of approximately $30.8 million* and $7.2 million respectively, to customers during the first nine months of 2016. * $27.3 million of deferred revenues plus accrued interest of $3.5 million.

Adjusted Earnings (Third Quarter „17 vs ‟16) 12 The non-GAAP measures presented in the table are being shown to reflect significant items that were not contemplated in our original guidance, however they should not be considered a substitute for financial results and measures determined or calculated in accordance with GAAP.

Summary Financial Results (YTD thru Qtr 3) 13 (1) Gross Margin is a non-GAAP Measure. See appendix for additional disclosure. (1)

Weather- 2017 versus Normal (YTD Qtr 3) 14 Heating Degree Day Months Cooling Degree Day Months Mean Temperature Departures from Average Year-to-date, favorable weather has contributed approximately $1.6 million pretax benefit as compared to normal, and $15.8 million pretax benefit as compared to same period in prior year.
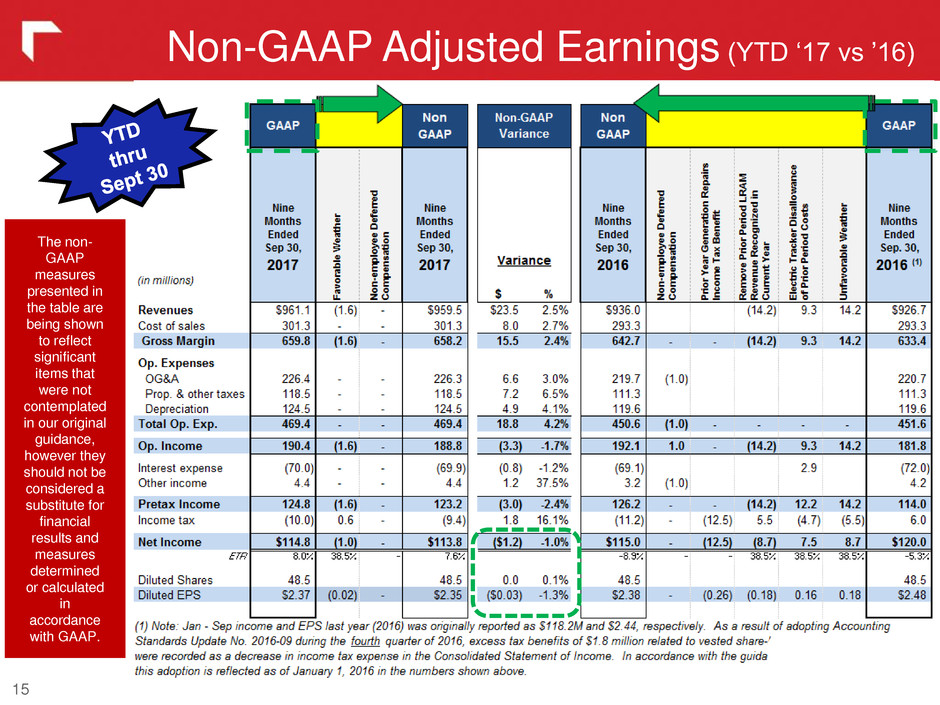
Non-GAAP Adjusted Earnings (YTD „17 vs ‟16) 15 The non- GAAP measures presented in the table are being shown to reflect significant items that were not contemplated in our original guidance, however they should not be considered a substitute for financial results and measures determined or calculated in accordance with GAAP.

Updated 2017 Earnings Guidance 16 NorthWestern updates our 2017 earnings guidance range to $3.30 - $3.45 (previously $3.30 - $3.50) per diluted share and is based upon, but not limited to, the following major assumptions and expectations: • Normal weather in our electric and natural gas service territories; • A consolidated income tax rate of approximately 7% to 11% of pre-tax income; and • Diluted average shares outstanding of approximately 48.6 million. Based upon our current year-end forecast, we are tightening our guidance range in recognition that we are unlikely to reach the top end of our original range. See “Non-GAAP Financial Measures” slide in appendix for “Non-GAAP “Adjusted EPS”. $2.60 - $2.75 $3.10 - $3.30 $3.30-$3.45

Full Year Adjusted Non-GAAP Guidance 17 In order to meet our adjusted Non-GAAP full-year guidance, in the range of $3.30 to $3.45 per share, in 2017 we anticipate these improvements over Q4 2016: • Margin improvement more commensurate with Q1, aided by rate relief from Montana natural gas case. • Timing of expenses and appropriate cost controls resulting in flat-to-lower OG&A expense. The non-GAAP measures presented in the table to the left are being shown to reflect significant items that were not contemplated in our original guidance, however they should not be considered a substitute for financial results and measures determined or calculated in accordance with GAAP.

Financing Activities 18 Long-Term Debt Refinancing • In October 2017, we priced $250 million principal, 4.03% - 30 year Montana First Mortgage Bonds • We expect to close the transaction in early November 2017. • Proceeds used to redeem existing $250 million – 6.34% Montana First Mortgage Bonds due in 2019 Big Sky Substation Expect annual interest expense savings of over $5 million net of make-whole amortization We anticipate issuing the remaining $95 million, from time to time, by the end of 2018. At-The-Market Equity Offering Program • Initiated in September 2017 • Proceeds to repay or refinance debt (including short-term debt), fund capital expenditures and other general corporate purposes • During the third quarter 2017 we sold 83,769 shares of common stock at an average price of $59.56 per share, for a total of approximately $5 million of proceeds.

19 Regulatory / Legal Update Property Tax Tracker Rules Filing – In March 2017, the MPSC proposed new rules to establish minimum filing requirements for property tax trackers. • Current MT Property tax tracker rules allows recovery of 60 percent of the change in state and local taxes and fees. • In June 2017, the MPSC adopted new rules to establish minimum filing requirements with some of the rules appearing to be based on a narrow interpretation of the enabling statute and suggest that the MPSC will challenge the amount and allocation of these taxes to customers. We expect to submit our annual filing in December 2017, with resolution during the first quarter of 2018. Montana Natural Gas Rate Filing • In June 2017, we reached a settlement agreement with intervenors. In August 2017,the MPSC’s issued a final order accepting the settlement with modifications resulting in an annual revenue increase $5.1 million, ROE at 9.55% with ROR of 6.96% and including an annual reduction in production rates to reflect depletion until our next rate filing. Rates were effective September 1, 2017. • While the final order reflects an annual increase of approximately $5.1 million, we expect the increase in 2018 to be approximately $2.0 million due to the inclusion in 2017 of four months of increased rates and the step down of gas production rates to reflect depletion. FERC / DGGS – April 2014 order regarding cost allocation at DGGS between retail & wholesale customers • FERC denied our request for rehearing in May 2016 • Required us to make refunds in June 2016 of $27.3 million plus interest • We filed a petition for review with the US Circuit Court of Appeals for the District of Columbia Circuit in June 2016 and oral argument is scheduled for December 1, 2017. • We do not expect a decision until the first quarter of 2018, at the earliest. Colstrip – In May 2016, the MPSC issued a final order disallowing recovery of certain costs included in the electric supply tracker related to a 2013 Unit 4 outage • Appeals have been filed in two Montana district courts regarding disallowance. • We believe we are likely to receive orders from the courts in these matters within the next 12 months.
20 Regulatory Update (continued) Qualified Facilities (QF) Decision: Under the Public Utility Regulatory Policies Act (PURPA), electric utilities are required, with exceptions, to purchase energy and capacity from independent power producers that are QF‟s. • In July 2017, the MPSC issued a final order in the QF-1 docket that adopted generally lower rates and shortened the maximum contract length for new QFs to 10 years (with a rate adjustment after 5 years). The MPSC also ordered that any future resources, be subject to the same period, saying it “will not initially authorize NorthWestern rate revenue for more than ten years” and “at the end of the ten year period the Commission may provide for subsequent rate revenue based on a consideration of the value of the asset to customers and not necessarily based on the costs of the resource.” • We and other parties filed motions for reconsideration of this decision. The MPSC voted in October 2017 to revise the initial order extending the contract length to 15 years and to continue to apply the contract term to both QF contracts and our future electric supply resources, however, it has not yet issued a final order. Based on the MPSC‟s October 2017 vote, we expect that the decision will result in substantially lower rates for future QF contracts. • We have significant generation capacity deficits and negative reserve margins, and our 2016 resource plan identified price and reliability risks to our customers if we rely solely upon market purchases to address these capacity needs. In addition to our responsibility to meet peak demand, national reliability standards effective July 2016 require us to have even greater dispatchable generation capacity available and be capable of increasing or decreasing output to address the irregular nature of intermittent generation such as wind or solar. As a result of the MPSC’s July decision, we suspended a competitive solicitation process to determine the lowest-cost / least-risk approach for addressing capacity needs in Montana. A final determination regarding the competitive solicitation will be dependent upon reviewing the MPSC’s revised order (based on the October reconsideration). We anticipate the order to be issued during the fourth quarter of 2017.

Montana - Implementation of HB 193 21 PCCAM - as proposed by NorthWestern Procedural Timeline: May 2017 MPSC issued Notice of Commission Action (NCA) initiating process July 7, 2017 MPSC issued additional NCA addressing arguments in our motion to reconsider the original NCA. (July 7, 2017 – D2017.5.39). July 14, 2017 We proposed electric Power Cost and Credit Adjustment Mechanism (PCCAM) with the MPSC. Aug. 1, 2017 MPSC concluded work session declining to require NWE to submit additional filing. Sept. 20, 2017 MPSC established procedural schedule for PCCAM. Nov. 13, 2017 Final day for Intervenor testimony Jan. 12, 2017 Final day for NWE to file rebuttal testimony Mar. 12, 2018 Hearing on PCCAM. Background: In April 2017, the Montana legislature passed House Bill 193 (HB 193), repealing the statutory language that provided for mandatory recovery of our prudently incurred electric supply costs, effective July 1, 2017. The enacted legislation gives the MPSC discretion whether to approve an electric supply cost adjustment mechanism. In support of the passage of HB 193, A MPSC Commissioner testified before Senate requesting the bill should be passed “to subject NorthWestern to the exact same regulatory treatment as Montana Dakota Utilities.” The proposed PCCAM, with the 90% / 10% risk sharing mechanism was designed to be responsive to the Commission‟s advocacy. If the MPSC approves the PCCAM, we expect it will apply the mechanism to variable costs on a retroactive basis to the effective date of HB 193 (July 1, 2017)

Capital Spending 22 * Approximately $100 million of this capital spend is earmarked for Montana generation capacity and could be impacted by the recent 15 year contract limitations implemented by the MPSC. We suspended a competitive solicitation process for addressing capacity needs in Montana and a final determination will be dependent upon reviewing the MPSC’s revised order in the matter (expected in the fourth quarter 2017). We anticipate funding the expenditures with a combination of cash flows, aided by NOLs now anticipated to be available into 2021, long-term debt and our current $100 million equity distribution program. If other opportunities arise that are not in the above projections, additional equity funding may be necessary.

Conclusion Best Practices Corporate Governance Pure Electric & Gas Utility Solid Utility Foundation Strong Earnings & Cash Flows Attractive Future Growth Prospects

24 Appendix

25 Segment Results (Third Quarter) Appendix (1) Gross Margin is a non-GAAP Measure. See appendix for additional disclosure. (1) (1)

26 Electric Segment (Third Quarter) Appendix (1) (1) Gross Margin is a non-GAAP Measure. See appendix for additional disclosure.
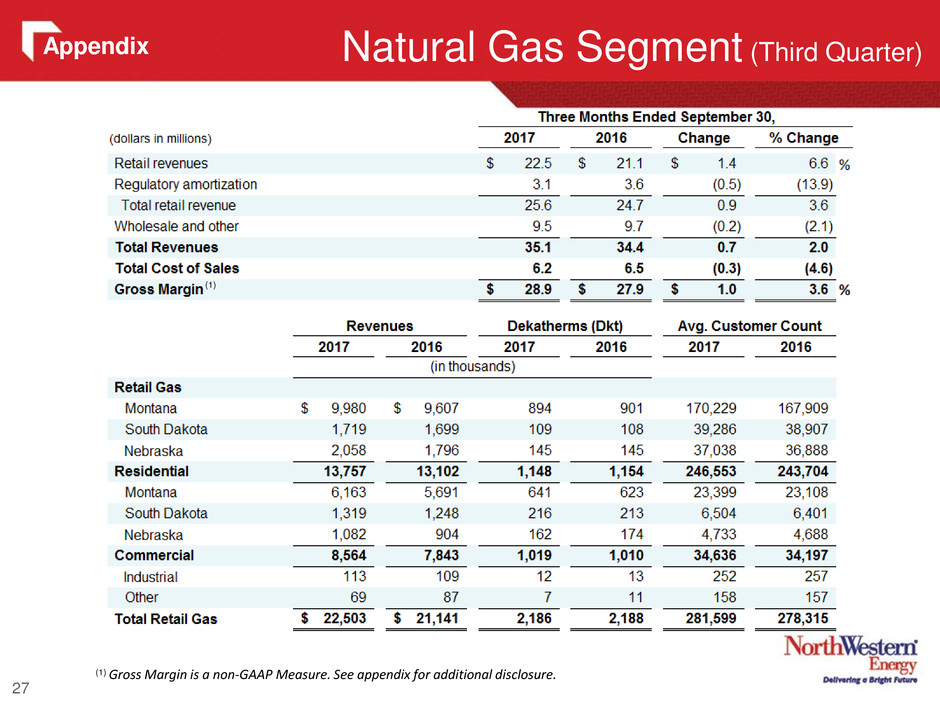
27 Natural Gas Segment (Third Quarter) Appendix (1) (1) Gross Margin is a non-GAAP Measure. See appendix for additional disclosure.
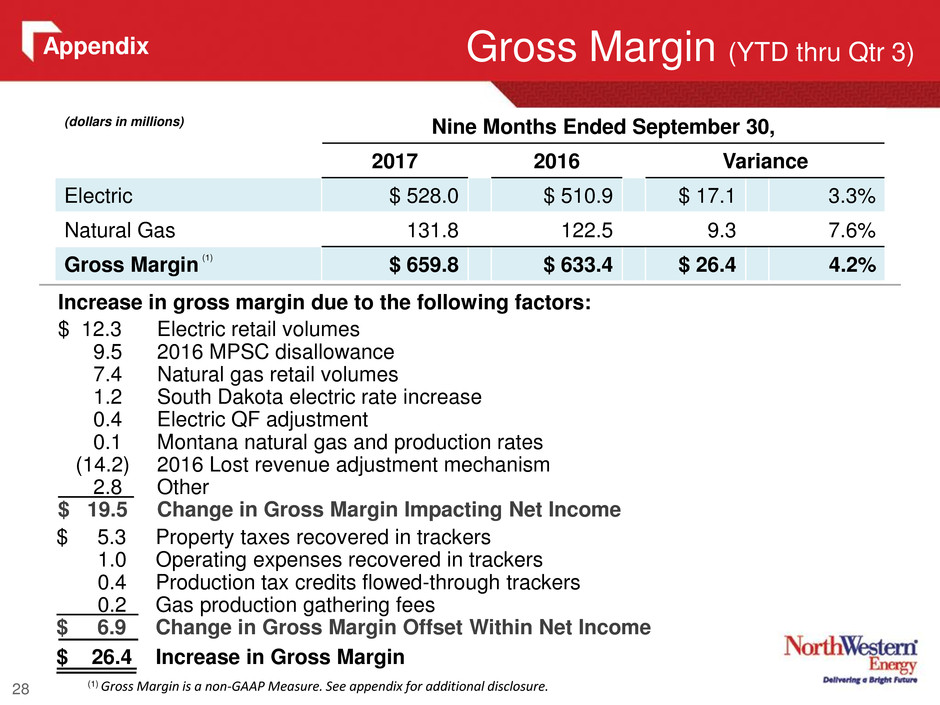
28 Gross Margin (YTD thru Qtr 3) (dollars in millions) Nine Months Ended September 30, 2017 2016 Variance Electric $ 528.0 $ 510.9 $ 17.1 3.3% Natural Gas 131.8 122.5 9.3 7.6% Gross Margin $ 659.8 $ 633.4 $ 26.4 4.2% Increase in gross margin due to the following factors: $ 12.3 Electric retail volumes 9.5 2016 MPSC disallowance 7.4 Natural gas retail volumes 1.2 South Dakota electric rate increase 0.4 Electric QF adjustment 0.1 Montana natural gas and production rates (14.2) 2016 Lost revenue adjustment mechanism 2.8 Other $ 19.5 Change in Gross Margin Impacting Net Income $ 5.3 Property taxes recovered in trackers 1.0 Operating expenses recovered in trackers 0.4 Production tax credits flowed-through trackers 0.2 Gas production gathering fees $ 6.9 Change in Gross Margin Offset Within Net Income $ 26.4 Increase in Gross Margin Appendix (1) (1) Gross Margin is a non-GAAP Measure. See appendix for additional disclosure.

Operating Expenses (YTD thru Qtr 3) 29 Increase in operating expenses due mainly to the following factors: $5.7 million increase in OG&A $ 2.3 Bad debt expense 1.4 Labor 1.4 Maintenance costs 1.0 Operating expenses recovered in trackers 0.8 Employee benefits 0.2 Natural gas production gathering expense (1.0) Insurance reserves (1.0) Non-employee directors deferred compensation 0.6 Other $7.2 million increase in property and other taxes due primarily to plant additions and higher estimated property valuations in Montana. $4.9 million increase in depreciation and depletion expense primarily due to plant additions. (dollars in millions) Nine Months Ended September 30, 2017 2016 Variance Operating, general & admin. $ 226.4 $ 220.7 $ 5.7 2.6% Property and other taxes 118.5 111.3 7.2 6.5% Depreciation and depletion 124.5 119.6 4.9 4.1% Operating Expenses $ 469.4 $ 451.6 $ 17.8 3.9% Appendix

Operating to Net Income (YTD thru Qtr 3) 30 $2.0 million decrease in interest expense was primarily due to a debt refinancing transaction in 2016. $0.2 million increase in other income due primarily to higher capitalization of AFUDC and was offset in part by a $1.0 million decrease in the value of deferred shares held in trust for non-employee directors deferred compensation (which is offset by a corresponding decrease to operating, general and administrative expenses). $16.0 million increase in income tax expense due primarily to the inclusion in our 2016 results of a $15.5 million income tax benefit due to the adoption of a tax accounting method change related to the cost to repair generation assets, and higher pre-tax income. (dollars in millions) Nine Months Ended September 30, 2017 2016 Variance Operating Income $ 190.4 $ 181.8 $ 8.6 4.7% Interest Expense (70.0) (72.0) (2.0) (2.8%) Other Income 4.4 4.2 0.2 4.8% Income Before Taxes 124.8 114.0 10.8 9.5% Income Tax Expense (10.0) 6.0 (16.0) (266.7%) Net Income $ 114.8 $ 120.0 ($ 5.2) (4.3%) Appendix

Income Tax Reconciliation (YTD thru Qtr 3) 31 The increase in income tax expense was primarily due to the inclusion in our 2016 results of a $15.5 million income tax benefit due to the adoption of a tax accounting method change related to the costs to repair generation assets, and higher pre-tax income. Appendix

32 Segment Results (YTD thru 3rd Quarter ) Appendix (1) (1) Gross Margin is a non-GAAP Measure. See appendix for additional disclosure. (1)

33 Electric Segment (YTD thru 3rd Quarter) Appendix (1) (1) Gross Margin is a non-GAAP Measure. See appendix for additional disclosure.

34 Natural Gas Segment (YTD thru 3rd Quarter) Appendix (1) (1) Gross Margin is a non-GAAP Measure. See appendix for additional disclosure.

Montana Natural Gas Rate Filing 35 Montana PSC Docket D2016.9.68 $5.1M 6.96% $430.2M 9.55% 4.47% * Parties will have 10 days from the date of a final order to object. Derivation of Rate Increase ($Millions) Revenue Request in Initial Application ..... $10.9 Property Tax (adjustment to actual) ….….. ($2.0) Income Tax correction and other misc. ..... 0.5 Rebuttal Revenue Request …………….. $9.4 1st Stipulation with MCC ROE Reduction (10.35% to 9.55%) ...... (2.6) Deprec. Reserve and other misc. …...... (0.2) 1st Stipulation Revenue Request …...... $6.6 2nd Stipulation with MCC / LCG A&G Concession ………………………. (0.8) 2nd Stipulation Revenue Request …...… $5.7 July 20, 2017 MPSC Work Session Remove A&G Concession ……………… 0.8 Accumulated depletion adjustment ……. (1.4) MPSC Settlement ………………..……..… $5.1* * Includes annual reduction in production charges to reflect depletion until our next rate filing.

These materials include financial information prepared in accordance with GAAP, as well as other financial measures, such as Gross Margin and Adjusted Diluted EPS, that are considered “non-GAAP financial measures.” Generally, a non- GAAP financial measure is a numerical measure of a company's financial performance, financial position or cash flows that exclude (or include) amounts that are included in (or excluded from) the most directly comparable measure calculated and presented in accordance with GAAP. Gross Margin (Revenues less Cost of Sales) is a non-GAAP financial measure due to the exclusion of depreciation from the measure. Gross Margin is used by us to determine whether we are collecting the appropriate amount of energy costs from customers to allow recovery of operating costs. Adjusted Diluted EPS is another non-GAAP measure. The Company believes the presentation of Adjusted Diluted EPS is more representative of our normal earnings than the GAAP EPS due to the exclusion (or inclusion) of certain impacts that are not reflective of ongoing earnings. The presentation of these non-GAAP measures is intended to supplement investors' understanding of our financial performance and not to replace other GAAP measures as an indicator of actual operating performance. Our measures may not be comparable to other companies' similarly titled measures. Non-GAAP Financial Measures 36 Appendix

37


