


Searchable text section of graphics shown above
[GRAPHIC]
[LOGO]
Midwest Seminar
Hosted by:
Berenson & Company and The Williams Capital Group
April 12, 2005
Forward-Looking Statement
During the course of this presentation today, we will be discussing certain subjects including those pertaining to our strategy, and our discussions may contain forward-looking information. Although our expectations and beliefs are based on reasonable assumptions, actual results may differ materially. These factors also are listed in each of our press releases and disclosed in the company’s public filings with the SEC.
[LOGO]
2
Introduction
• Following emergence, NorthWestern is a much stronger company
• Significantly reduced debt, strong balance sheet, solid cash flow
• Focused on our transmission and distribution utility operations
• Better positioned to serve our customers
• Able to grow with the communities we serve
3
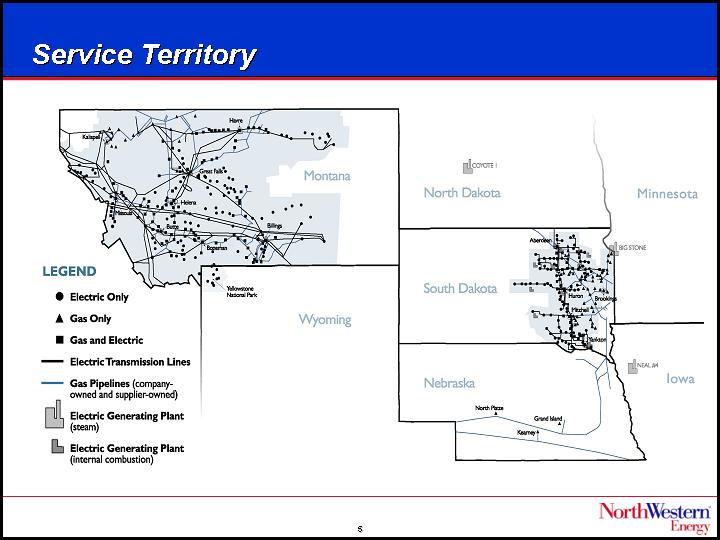
Company Overview
• NorthWestern Corporation, headquartered in Sioux Falls, S.D., is an investor-owned utility and one of the largest providers of electricity and natural gas in the northwest quadrant of the United States
• We serve approximately 617,100 customers – 368,200 electric and 248,900 natural gas – in Montana, South Dakota and Nebraska
• We have approximately 1,350 employees
• Our market capitalization is approximately $950 million
• In March 2005, we initiated a quarterly dividend of 22 cents per share
• Annualizes to 88 cents per share (3.3% yield)
• Payout ratio of approximately 60% to 65% (continuing operations)
4
Electric Demand
DEMAND
|
| Montana |
| South Dakota |
|
Peak (systemwide) |
| 1,500 | MW | 275 | MW |
Ave. Daily Load (systemwide) |
| 1,100 | MW | 135 | MW |
SUPPLY
|
| Montana |
| South Dakota |
|
Company-owned regulated generation |
| — |
| 100 | % |
Unregulated Colstrip Unit 4 |
| 12 | % | — |
|
PPL |
| 59 | % | — |
|
Qualifying Facilities (QF) |
| 13 | % | — |
|
Market Purchases |
| 9 | % | — |
|
Other Small Contracts |
| 7 | % | — |
|
7
Montana Regulated Electric Portfolio
Resource Mix | Yearly Resource Cost |
|
|
[CHART] | [CHART] |
84% of the forecasted energy requirement is under contract through 6/30/07
8
Value Drivers
• T&D business focus
• Solid and reliable operations
• Complete default supply portfolio procurement
• Continue to improve regulatory environment
• Efficiency improvement and cost control
• Asset sales
• Attain investment grade rating
• Resolve outstanding bankruptcy claims
• Develop strategy to redeploy excess free cash flow
9
NorthWestern’s Value Creation Strategy – Grow the Business
[GRAPHIC]
• NorthWestern is looking to take advantage of its strategically located position
• Opportunities may exist to expand electric and gas transmission infrastructure to meet increased needs
• Evaluate strategic opportunities in northwestern U.S.
10
2004 Financial Overview
• 2004 results utilize fresh-start reporting
• Consolidated net income was $544.4 million in 2004 vs. loss of $128.7 million in 2003
• Earnings improvement primarily result of reorganization items
• Gross margins were $475.2 million, compared to $476.8 million in 2003
• Nearly $175 million provided by cash flow from operations and asset sales in 2004
• Invested approximately $80 million in cap ex
• Paid down approximately $80 million in secured debt after emergence
11
P&L Summary
|
| UNAUDITED |
| |||||||
|
| Successor |
| Reorganization |
| 2004 |
| |||
(in millions) |
| Dec. 31, 2004 |
| Items |
| as Adjusted |
| |||
OPERATING REVENUES |
| $ | 1,039.0 |
| $ | — |
| $ | 1,039.0 |
|
COST OF SALES |
| 563.8 |
| (10.0 | )(b) | 553.8 |
| |||
GROSS MARGIN |
| 475.2 |
| 10.0 |
| 485.2 |
| |||
OPERATING EXPENSES |
|
|
|
|
|
|
| |||
Operating, general and administrative |
| 221.7 |
| — |
| 221.7 |
| |||
Property and other taxes |
| 65.1 |
| — |
| 65.1 |
| |||
Depreciation |
| 72.8 |
| — |
| 72.8 |
| |||
Reorganization items |
| (532.6 | ) | 532.6 |
| — |
| |||
Impairment on assets held for sale |
| 10.0 |
| (10.0 | ) | — |
| |||
Total Operating Expenses |
| (163.0 | ) | 522.6 |
| 359.6 |
| |||
OPERATING INCOME |
| 638.2 |
| (512.6 | ) | 125.6 |
| |||
Interest Expense |
| (83.8 | ) | — |
| (83.8 | ) | |||
Gain (Loss) on Debt Extinguishment |
| (21.3 | ) | 21.3 |
| — |
| |||
Investment Income and Other |
| 3.2 |
| — |
| 3.2 |
| |||
Income (Loss) from Continuing Operations Before Income Taxes |
| 536.3 |
| (491.3 | ) | 45.0 |
| |||
Benefit (Provision) for Income Taxes |
| 6.3 |
| (23.6 | ) | (17.3 | )(a) | |||
Income (Loss) from Continuing Operations |
| $ | 542.6 |
| $ | (514.9 | ) | $ | 27.7 |
|
Estimated Basic EPS from Continuing Operations (35.6 million shares) |
|
|
|
|
| $ | 0.78 |
| ||
(a) 2004 as Adjusted assumed an effective book tax rate of 38.75%.
(b) Consists of losses on fixed-price natural gas and electric contracts and disallowed natural gas costs.
We believe presenting adjustments for the reorganization and other significant items above provides investors with a more meaningful analysis of 2004 for comparison with future operating results. While we believe this to be useful information, it should not be used in isolation or as a substitute for consolidated statement of income (loss) data prepared in accordance with generally accepted accounting principles.
12
2005 Outlook
• Projecting earnings from continuing operations of $1.30 to $1.45 per share (basic)
• Absent any unusual weather and unforeseen reorganization issues
• Bridge from 2004 to 2005
• Significant reduction in interest expense
• Reduced G&A expense
• Modest increase in margins due to organic growth
13
Rating Agency Update
|
| Secured |
| Unsecured |
| ||||
|
| Rating |
| Outlook |
| Rating |
| Outlook |
|
Fitch |
| BB+ |
| Positive |
| BB |
| Positive* |
|
Moody’s |
| Ba1 |
| Stable |
| Ba2 |
| Stable |
|
S&P |
| BB |
| Positive |
| BB- |
| Positive |
|
*Implied by structural subordination
Steps necessary for investment grade rating
1. Financial performance track record
2. Asset sales proceeds received
3. Progress on outstanding litigation
4. Pay down debt
15
NorthWestern Energy
Solid utility operations…
• Improved balance sheet, earnings and cash flow
• Improving regulatory relationships
• Reengaging with customers and communities
• Reestablishing trust and credibility with stakeholders
16
NorthWestern Energy
2003 - 2004 Volumes
REGULATED OPERATIONS
|
| 2003 |
| 2004 |
| ||||||||||||||||
|
| 1Q |
| 2Q |
| 3Q |
| 4Q |
| Total |
| 1Q |
| 2Q |
| 3Q |
| 4Q |
| Total |
|
|
|
|
|
|
|
|
|
|
|
|
|
|
|
|
|
|
|
|
|
|
|
Retail Electric MWh’s |
|
|
|
|
|
|
|
|
|
|
|
|
|
|
|
|
|
|
|
|
|
|
|
|
|
|
|
|
|
|
|
|
|
|
|
|
|
|
|
|
|
|
|
Retail Electric Loads - MT |
|
|
|
|
|
|
|
|
|
|
|
|
|
|
|
|
|
|
|
|
|
Residential |
| 584,471 |
| 441,612 |
| 512,242 |
| 551,487 |
| 2,089,813 |
| 581,909 |
| 429,861 |
| 467,308 |
| 541,150 |
| 2,020,229 |
|
Commercial |
| 712,524 |
| 701,467 |
| 827,034 |
| 732,464 |
| 2,973,490 |
| 737,502 |
| 701,125 |
| 782,042 |
| 736,953 |
| 2,957,621 |
|
Industrial |
| 614,323 |
| 551,496 |
| 636,376 |
| 685,496 |
| 2,487,691 |
| 722,733 |
| 702,367 |
| 724,081 |
| 758,765 |
| 2,907,946 |
|
Other |
| 15,289 |
| 41,912 |
| 89,940 |
| 10,175 |
| 157,316 |
| 15,377 |
| 48,658 |
| 74,652 |
| 12,159 |
| 150,846 |
|
Total MT |
| 1,926,608 |
| 1,736,487 |
| 2,065,592 |
| 1,979,623 |
| 7,708,310 |
| 2,057,522 |
| 1,882,011 |
| 2,048,083 |
| 2,049,026 |
| 8,036,642 |
|
|
|
|
|
|
|
|
|
|
|
|
|
|
|
|
|
|
|
|
|
|
|
Retail Electric Loads - SD |
|
|
|
|
|
|
|
|
|
|
|
|
|
|
|
|
|
|
|
|
|
Residential |
| 129,953 |
| 91,243 |
| 131,599 |
| 100,348 |
| 453,143 |
| 129,898 |
| 91,924 |
| 113,465 |
| 102,542 |
| 437,829 |
|
Commercial |
| 178,760 |
| 165,298 |
| 203,005 |
| 174,656 |
| 721,719 |
| 181,323 |
| 171,020 |
| 198,102 |
| 184,682 |
| 735,127 |
|
Other |
| 4,865 |
| 3,585 |
| 4,593 |
| 4,867 |
| 17,910 |
| 4,887 |
| 3,863 |
| 4,678 |
| 5,002 |
| 18,430 |
|
Total SD |
| 313,578 |
| 260,126 |
| 339,197 |
| 279,871 |
| 1,192,772 |
| 316,108 |
| 266,807 |
| 316,245 |
| 292,226 |
| 1,191,386 |
|
|
|
|
|
|
|
|
|
|
|
|
|
|
|
|
|
|
|
|
|
|
|
Total Retail Electric Loads |
| 2,240,186 |
| 1,996,613 |
| 2,404,789 |
| 2,259,494 |
| 8,901,082 |
| 2,373,630 |
| 2,148,818 |
| 2,364,328 |
| 2,341,252 |
| 9,228,028 |
|
|
|
|
|
|
|
|
|
|
|
|
|
|
|
|
|
|
|
|
|
|
|
Wholesale Electric MWh’s |
|
|
|
|
|
|
|
|
|
|
|
|
|
|
|
|
|
|
|
|
|
|
|
|
|
|
|
|
|
|
|
|
|
|
|
|
|
|
|
|
|
|
|
Wholesale Electric Loads - SD |
| 71,520 |
| 64,639 |
| 73,491 |
| 93,882 |
| 303,532 |
| 101,393 |
| 116,929 |
| 91,043 |
| 92,326 |
| 401,691 |
|
|
|
|
|
|
|
|
|
|
|
|
|
|
|
|
|
|
|
|
|
|
|
Retail Gas Dkt’s |
|
|
|
|
|
|
|
|
|
|
|
|
|
|
|
|
|
|
|
|
|
|
|
|
|
|
|
|
|
|
|
|
|
|
|
|
|
|
|
|
|
|
|
Retail Gas Loads - MT |
|
|
|
|
|
|
|
|
|
|
|
|
|
|
|
|
|
|
|
|
|
Residential |
| 5,265,938 |
| 1,845,852 |
| 872,324 |
| 4,573,045 |
| 12,557,159 |
| 5,293,708 |
| 1,877,755 |
| 992,962 |
| 4,202,457 |
| 12,366,881 |
|
Commercial |
| 2,555,899 |
| 861,535 |
| 552,291 |
| 2,176,294 |
| 6,146,019 |
| 2,577,930 |
| 876,523 |
| 593,091 |
| 1,981,008 |
| 6,028,552 |
|
Industrial |
| 95,207 |
| 22,200 |
| 17,581 |
| 79,628 |
| 214,616 |
| 99,951 |
| 17,955 |
| 13,624 |
| 64,211 |
| 195,742 |
|
Other |
| 42,670 |
| 17,247 |
| 4,837 |
| 28,482 |
| 93,235 |
| 47,338 |
| 18,070 |
| 6,199 |
| 27,139 |
| 98,746 |
|
Total MT |
| 7,959,714 |
| 2,746,833 |
| 1,447,033 |
| 6,857,449 |
| 19,011,029 |
| 8,018,927 |
| 2,790,302 |
| 1,605,876 |
| 6,274,816 |
| 18,689,920 |
|
|
|
|
|
|
|
|
|
|
|
|
|
|
|
|
|
|
|
|
|
|
|
Retail Gas Loads - SD |
|
|
|
|
|
|
|
|
|
|
|
|
|
|
|
|
|
|
|
|
|
Residential |
| 1,672,658 |
| 567,763 |
| 137,011 |
| 772,865 |
| 3,150,297 |
| 1,576,487 |
| 505,126 |
| 144,593 |
| 648,509 |
| 2,874,715 |
|
Commercial |
| 1,037,327 |
| 337,094 |
| 112,268 |
| 478,696 |
| 1,965,385 |
| 964,835 |
| 302,787 |
| 121,735 |
| 601,176 |
| 1,990,533 |
|
Other |
| 5,643 |
| 1,505 |
| 176 |
| 1,886 |
| 9,210 |
| 5,266 |
| 1,341 |
| 88 |
| 2,212 |
| 8,907 |
|
Total SD |
| 2,715,628 |
| 906,362 |
| 249,455 |
| 1,253,447 |
| 5,124,892 |
| 2,546,588 |
| 809,254 |
| 266,416 |
| 1,251,897 |
| 4,874,155 |
|
|
|
|
|
|
|
|
|
|
|
|
|
|
|
|
|
|
|
|
|
|
|
Retail Gas Loads - NE |
|
|
|
|
|
|
|
|
|
|
|
|
|
|
|
|
|
|
|
|
|
Residential |
| 1,449,676 |
| 498,752 |
| 185,019 |
| 693,110 |
| 2,826,557 |
| 1,446,105 |
| 431,367 |
| 186,773 |
| 627,889 |
| 2,692,134 |
|
Commercial |
| 1,180,595 |
| 527,441 |
| 292,389 |
| 732,597 |
| 2,733,022 |
| 1,200,548 |
| 465,119 |
| 284,779 |
| 675,349 |
| 2,625,795 |
|
Other |
| 2,347 |
| 388 |
| 172 |
| 523 |
| 3,430 |
| 2,059 |
| 411 |
| 140 |
| 1,091 |
| 3,701 |
|
Total NE |
| 2,632,618 |
| 1,026,581 |
| 477,580 |
| 1,426,230 |
| 5,563,009 |
| 2,648,712 |
| 896,897 |
| 471,692 |
| 1,304,329 |
| 5,321,630 |
|
|
|
|
|
|
|
|
|
|
|
|
|
|
|
|
|
|
|
|
|
|
|
Total Retail Gas Loads |
| 13,307,960 |
| 4,679,776 |
| 2,174,068 |
| 9,537,126 |
| 29,698,930 |
| 13,214,227 |
| 4,496,453 |
| 2,343,984 |
| 8,831,042 |
| 28,885,705 |
|
UNREGULATED OPERATIONS
|
| 2003 |
| 2004 |
| ||||||||||||||||
|
| 1Q |
| 2Q |
| 3Q |
| 4Q |
| Total |
| 1Q |
| 2Q |
| 3Q |
| 4Q |
| Total |
|
|
|
|
|
|
|
|
|
|
|
|
|
|
|
|
|
|
|
|
|
|
|
Wholesale Electric MWh’s |
|
|
|
|
|
|
|
|
|
|
|
|
|
|
|
|
|
|
|
|
|
|
|
|
|
|
|
|
|
|
|
|
|
|
|
|
|
|
|
|
|
|
|
Wholesale Electric Loads - MT |
| 462,034 |
| 398,076 |
| 425,763 |
| 415,452 |
| 1,701,325 |
| 454,264 |
| 369,826 |
| 568,589 |
| 401,772 |
| 1,794,451 |
|
|
|
|
|
|
|
|
|
|
|
|
|
|
|
|
|
|
|
|
|
|
|
Wholesale Gas Dkt’s |
|
|
|
|
|
|
|
|
|
|
|
|
|
|
|
|
|
|
|
|
|
|
|
|
|
|
|
|
|
|
|
|
|
|
|
|
|
|
|
|
|
|
|
Wholesale Gas Loads - SD |
| 2,679,000 |
| 2,226,867 |
| 2,204,438 |
| 2,657,278 |
| 9,767,583 |
| 3,859,777 |
| 3,369,460 |
| 3,514,011 |
| 3,977,716 |
| 14,720,964 |
|
|
|
|
|
|
|
|
|
|
|
|
|
|
|
|
|
|
|
|
|
|
|
Wholesale Gas Loads - NE |
| 2,373,073 |
| 1,171,902 |
| 785,612 |
| 1,351,330 |
| 5,681,917 |
| 2,493,392 |
| 956,815 |
| 626,029 |
| 1,180,632 |
| 5,256,868 |
|
|
|
|
|
|
|
|
|
|
|
|
|
|
|
|
|
|
|
|
|
|
|
Total Wholesale Gas Loads |
| 5,052,073 |
| 3,398,769 |
| 2,990,050 |
| 4,008,608 |
| 15,449,500 |
| 6,353,169 |
| 4,326,275 |
| 4,140,040 |
| 5,158,348 |
| 19,977,832 |
|
17