Exhibit 99.2
Link to searchable text of slide shown above
Link to searchable text of slide shown above

Link to searchable text of slide shown above

Link to searchable text of slide shown above
Link to searchable text of slide shown above
Link to searchable text of slide shown above
Link to searchable text of slide shown above
Link to searchable text of slide shown above
Link to searchable text of slide shown above
Link to searchable text of slide shown above
Link to searchable text of slide shown above
Link to searchable text of slide shown above
Link to searchable text of slide shown above
Link to searchable text of slide shown above
Link to searchable text of slide shown above
Link to searchable text of slide shown above
Link to searchable text of slide shown above
Link to searchable text of slide shown above
Link to searchable text of slide shown above
Link to searchable text of slide shown above
Link to searchable text of slide shown above
Searchable text section of graphics shown above
[GRAPHIC]
[LOGO]
AGA Financial Forum
Michael J. Hanson
President
Brian B. Bird
Chief Financial Officer
New Orleans, La.
May 2, 2005
Forward-Looking Statement
During the course of this presentation today, we will be discussing certain subjects including those pertaining to our strategy, and our discussions may contain forward-looking information. Although our expectations and beliefs are based on reasonable assumptions, actual results may differ materially. These factors also are listed in each of our press releases and disclosed in the company’s public filings with the SEC.
3
Introduction
• Following emergence, NorthWestern is a much stronger company
• Significantly reduced debt, strong balance sheet, solid cash flow
• Focused on our transmission and distribution utility operations
• Better positioned to serve our customers
• Able to grow with the communities we serve
4
Company Overview
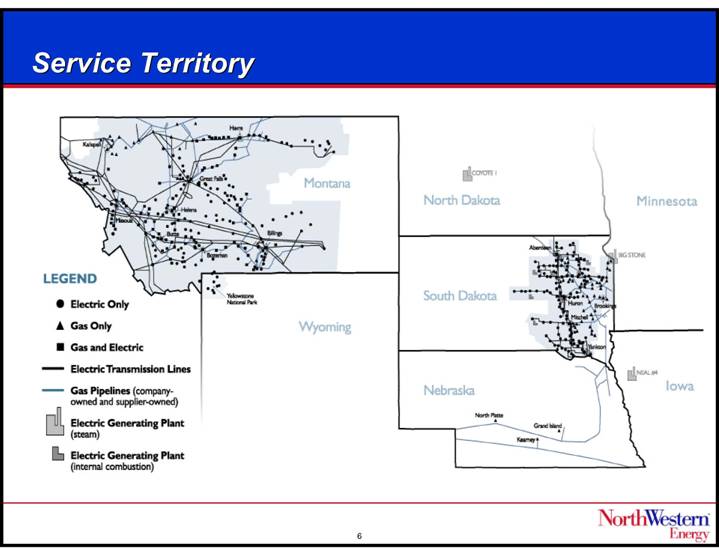
• NorthWestern Corporation, headquartered in Sioux Falls, S.D., is an investor-owned utility and one of the largest providers of electricity and natural gas in the northwest quadrant of the United States
• We serve approximately 617,100 customers – 368,200 electric and 248,900 natural gas – in Montana, South Dakota and Nebraska
• We have approximately 1,350 employees
• Our market capitalization is approximately $1 billion
• In March 2005, we initiated a quarterly dividend of 22 cents per share
• Annualizes to 88 cents per share (3.2% yield)
• Payout ratio of approximately 60% to 65% (continuing operations)
5
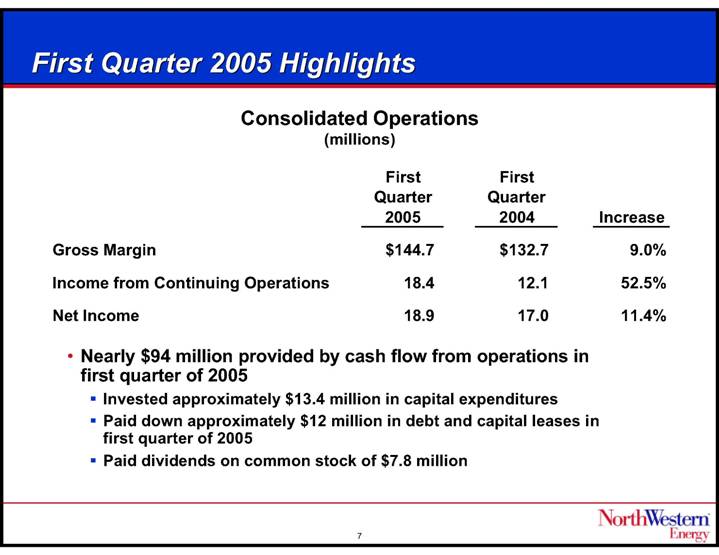
First Quarter 2005 Highlights
Consolidated Operations
(millions)
|
| First |
| First |
| Increase |
| ||
|
|
|
|
|
|
|
| ||
Gross Margin |
| $ | 144.7 |
| $ | 132.7 |
| 9.0 | % |
|
|
|
|
|
|
|
| ||
Income from Continuing Operations |
| 18.4 |
| 12.1 |
| 52.5 | % | ||
|
|
|
|
|
|
|
| ||
Net Income |
| 18.9 |
| 17.0 |
| 11.4 | % | ||
• Nearly $94 million provided by cash flow from operations in first quarter of 2005
• Invested approximately $13.4 million in capital expenditures
• Paid down approximately $12 million in debt and capital leases in first quarter of 2005
• Paid dividends on common stock of $7.8 million
7
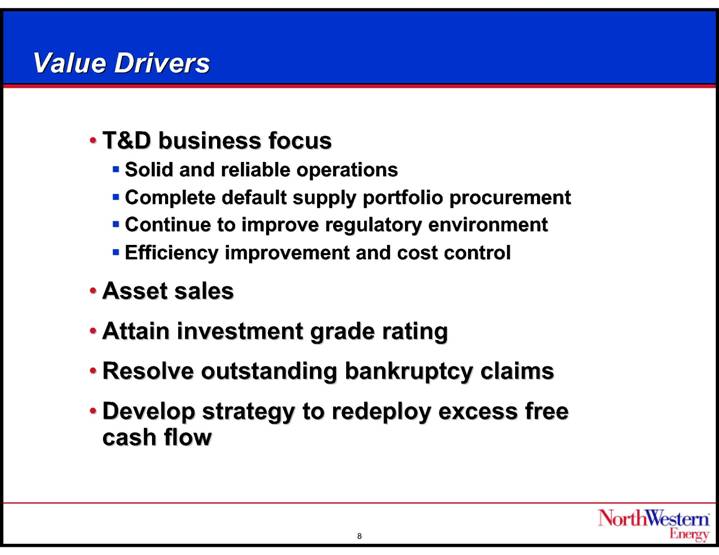
Value Drivers
• T&D business focus
• Solid and reliable operations
• Complete default supply portfolio procurement
• Continue to improve regulatory environment
• Efficiency improvement and cost control
• Asset sales
• Attain investment grade rating
• Resolve outstanding bankruptcy claims
• Develop strategy to redeploy excess free cash flow
8
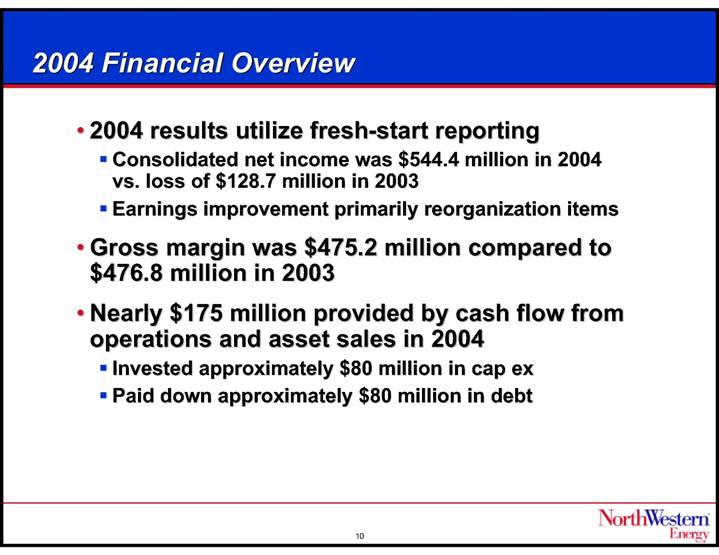
2004 Financial Overview
• 2004 results utilize fresh-start reporting
• Consolidated net income was $544.4 million in 2004 vs. loss of $128.7 million in 2003
• Earnings improvement primarily reorganization items
• Gross margin was $475.2 million compared to $476.8 million in 2003
• Nearly $175 million provided by cash flow from operations and asset sales in 2004
• Invested approximately $80 million in cap ex
• Paid down approximately $80 million in debt
10
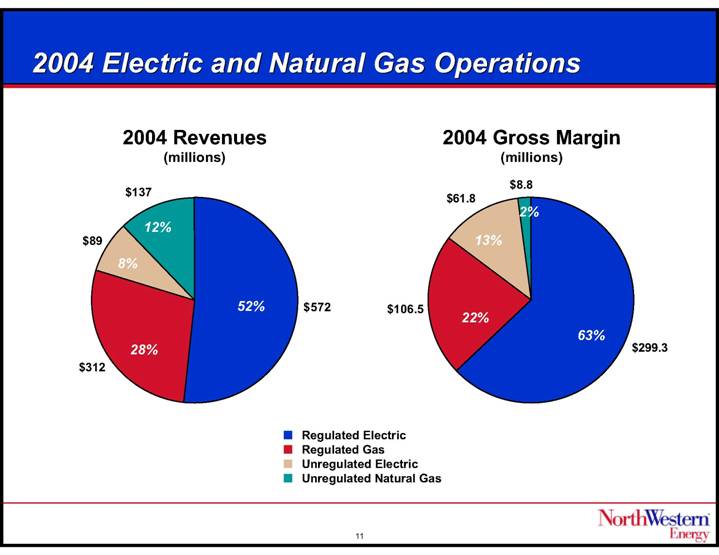
2004 Electric and Natural Gas Operations
2004 Revenues |
| 2004 Gross Margin |
(millions) |
| (millions) |
|
|
|
[CHART] |
| [CHART] |
11
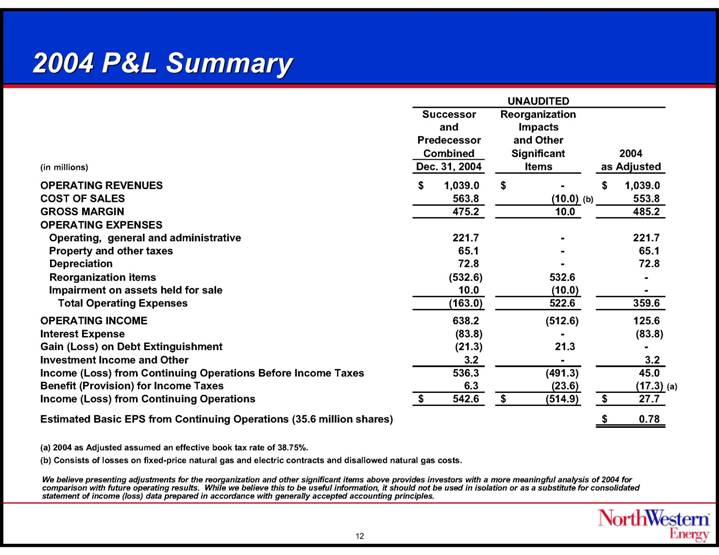
2004 P&L Summary
|
| UNAUDITED |
| |||||||
(in millions) |
| Successor |
| Reorganization |
| 2004 |
| |||
OPERATING REVENUES |
| $ | 1,039.0 |
| $ | — |
| $ | 1,039.0 |
|
COST OF SALES |
| 563.8 |
| (10.0 | )(b) | 553.8 |
| |||
GROSS MARGIN |
| 475.2 |
| 10.0 |
| 485.2 |
| |||
OPERATING EXPENSES |
|
|
|
|
|
|
| |||
Operating, general and administrative |
| 221.7 |
| — |
| 221.7 |
| |||
Property and other taxes |
| 65.1 |
| — |
| 65.1 |
| |||
Depreciation |
| 72.8 |
| — |
| 72.8 |
| |||
Reorganization items |
| (532.6 | ) | 532.6 |
| — |
| |||
Impairment on assets held for sale |
| 10.0 |
| (10.0 | ) | — |
| |||
Total Operating Expenses |
| (163.0 | ) | 522.6 |
| 359.6 |
| |||
OPERATING INCOME |
| 638.2 |
| (512.6 | ) | 125.6 |
| |||
Interest Expense |
| (83.8 | ) | — |
| (83.8 | ) | |||
Gain (Loss) on Debt Extinguishment |
| (21.3 | ) | 21.3 |
| — |
| |||
Investment Income and Other |
| 3.2 |
| — |
| 3.2 |
| |||
Income (Loss) from Continuing Operations Before Income Taxes |
| 536.3 |
| (491.3 | ) | 45.0 |
| |||
Benefit (Provision) for Income Taxes |
| 6.3 |
| (23.6 | ) | (17.3 | )(a) | |||
Income (Loss) from Continuing Operations |
| $ | 542.6 |
| $ | (514.9 | ) | $ | 27.7 |
|
|
|
|
|
|
|
|
| |||
Estimated Basic EPS from Continuing Operations (35.6 million shares) |
|
|
|
|
| $ | 0.78 |
| ||
(a) 2004 as Adjusted assumed an effective book tax rate of 38.75%.
(b) Consists of losses on fixed-price natural gas and electric contracts and disallowed natural gas costs.
We believe presenting adjustments for the reorganization and other significant items above provides investors with a more meaningful analysis of 2004 for comparison with future operating results. While we believe this to be useful information, it should not be used in isolation or as a substitute for consolidated statement of income (loss) data prepared in accordance with generally accepted accounting principles.
12
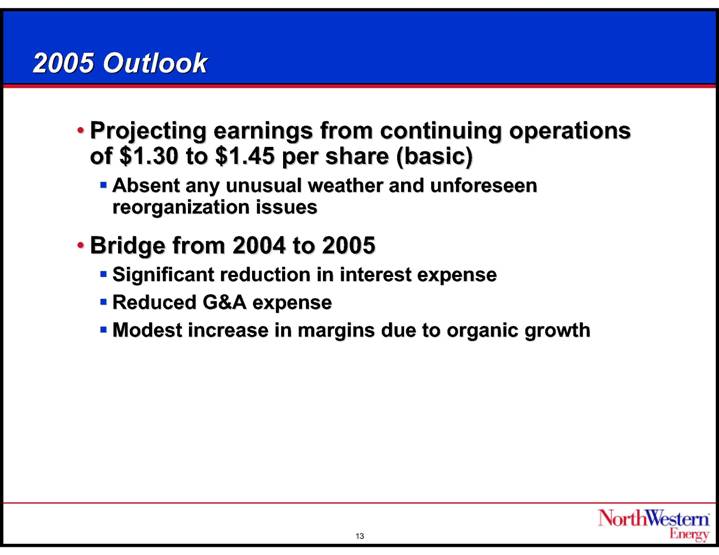
2005 Outlook
• Projecting earnings from continuing operations of $1.30 to $1.45 per share (basic)
• Absent any unusual weather and unforeseen reorganization issues
• Bridge from 2004 to 2005
• Significant reduction in interest expense
• Reduced G&A expense
• Modest increase in margins due to organic growth
13
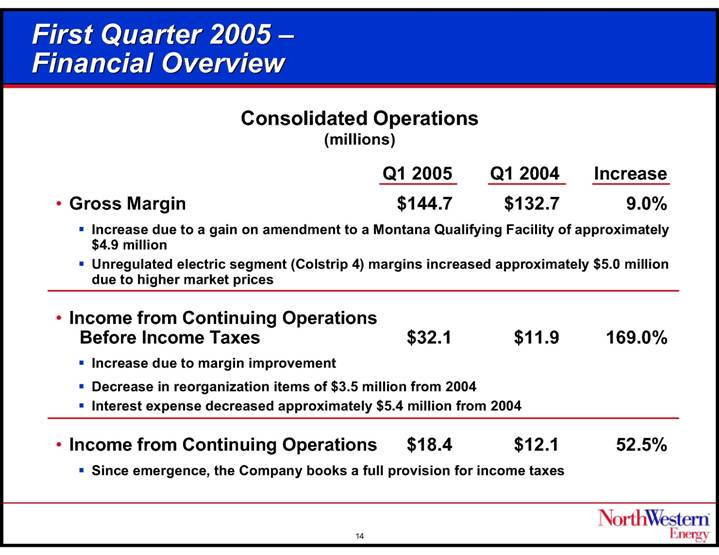
First Quarter 2005 –
Financial Overview
Consolidated Operations
(millions)
|
| Q1 2005 |
| Q1 2004 |
| Increase |
| ||
• Gross Margin |
| $ | 144.7 |
| $ | 132.7 |
| 9.0 | % |
|
|
|
|
|
|
|
| ||
• Increase due to a gain on amendment to a Montana Qualifying Facility of approximately $4.9 million |
|
|
|
|
|
|
| ||
|
|
|
|
|
|
|
| ||
• Unregulated electric segment (Colstrip 4) margins increased approximately $5.0 million due to higher market prices |
|
|
|
|
|
|
| ||
|
|
|
|
|
|
|
| ||
• Income from Continuing Operations Before Income Taxes |
| $ | 32.1 |
| $ | 11.9 |
| 169.0 | % |
|
|
|
|
|
|
|
| ||
• Increase due to margin improvement |
|
|
|
|
|
|
| ||
|
|
|
|
|
|
|
| ||
• Decrease in reorganization items of $3.5 million from 2004 |
|
|
|
|
|
|
| ||
|
|
|
|
|
|
|
| ||
• Interest expense decreased approximately $5.4 million from 2004 |
|
|
|
|
|
|
| ||
|
|
|
|
|
|
|
| ||
• Income from Continuing Operations |
| $ | 18.4 |
| $ | 12.1 |
| 52.5 | % |
|
|
|
|
|
|
|
| ||
• Since emergence, the Company books a full provision for income taxes |
|
|
|
|
|
|
| ||
14
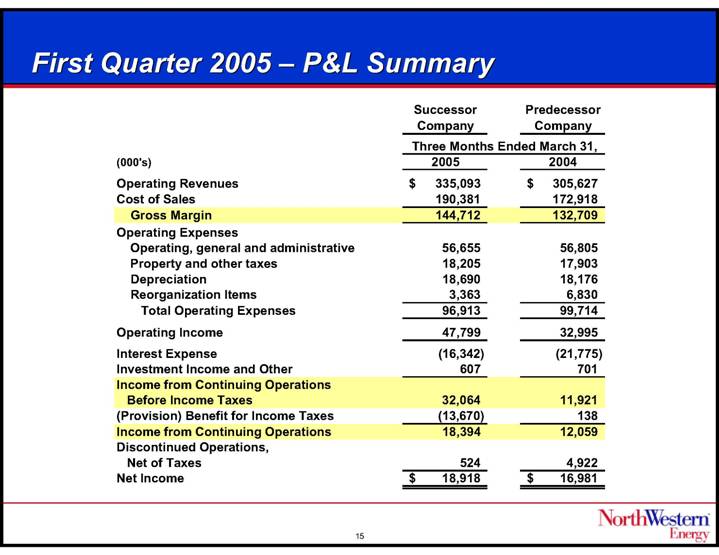
First Quarter 2005 – P&L Summary
|
| Successor |
| Predecessor |
| ||
|
| Three Months Ended March 31, |
| ||||
(000’s) |
| 2005 |
| 2004 |
| ||
Operating Revenues |
| $ | 335,093 |
| $ | 305,627 |
|
Cost of Sales |
| 190,381 |
| 172,918 |
| ||
Gross Margin |
| 144,712 |
| 132,709 |
| ||
Operating Expenses |
|
|
|
|
| ||
Operating, general and administrative |
| 56,655 |
| 56,805 |
| ||
Property and other taxes |
| 18,205 |
| 17,903 |
| ||
Depreciation |
| 18,690 |
| 18,176 |
| ||
Reorganization Items |
| 3,363 |
| 6,830 |
| ||
Total Operating Expenses |
| 96,913 |
| 99,714 |
| ||
Operating Income |
| 47,799 |
| 32,995 |
| ||
Interest Expense |
| (16,342 | ) | (21,775 | ) | ||
Investment Income and Other |
| 607 |
| 701 |
| ||
Income from Continuing Operations Before Income Taxes |
| 32,064 |
| 11,921 |
| ||
(Provision) Benefit for Income Taxes |
| (13,670 | ) | 138 |
| ||
Income from Continuing Operations |
| 18,394 |
| 12,059 |
| ||
Discontinued Operations, Net of Taxes |
| 524 |
| 4,922 |
| ||
Net Income |
| $ | 18,918 |
| $ | 16,981 |
|
15
First Quarter 2005 –
Electric and Natural Gas Operations
Q1 2005 Revenues |
| Q1 2005 Gross Margin |
(millions) |
| (millions) |
|
|
|
[CHART] |
| [CHART] |
16
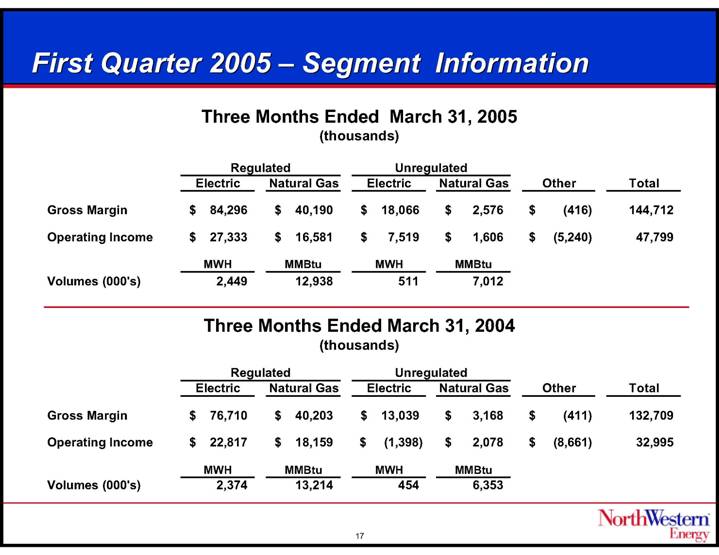
First Quarter 2005 – Segment Information
Three Months Ended March 31, 2005
(thousands)
|
| Regulated |
| Unregulated |
|
|
|
|
| |||||||||
|
| Electric |
| Natural Gas |
| Electric |
| Natural Gas |
| Other |
| Total |
| |||||
|
|
|
|
|
|
|
|
|
|
|
|
|
| |||||
Gross Margin |
| $ | 84,296 |
| $ | 40,190 |
| $ | 18,066 |
| $ | 2,576 |
| $ | (416 | ) | 144,712 |
|
|
|
|
|
|
|
|
|
|
|
|
|
|
| |||||
Operating Income |
| $ | 27,333 |
| $ | 16,581 |
| $ | 7,519 |
| $ | 1,606 |
| $ | (5,240 | ) | 47,799 |
|
|
| MWH |
| MMBtu |
| MWH |
| MMBtu |
|
|
|
|
|
Volumes (000’s) |
| 2,449 |
| 12,938 |
| 511 |
| 7,012 |
|
|
|
|
|
Three Months Ended March 31, 2004
(thousands)
|
| Regulated |
| Unregulated |
|
|
|
|
| |||||||||
|
| Electric |
| Natural Gas |
| Electric |
| Natural Gas |
| Other |
| Total |
| |||||
|
|
|
|
|
|
|
|
|
|
|
|
|
| |||||
Gross Margin |
| $ | 76,710 |
| $ | 40,203 |
| $ | 13,039 |
| $ | 3,168 |
| $ | (411 | ) | 132,709 |
|
|
|
|
|
|
|
|
|
|
|
|
|
|
| |||||
Operating Income |
| $ | 22,817 |
| $ | 18,159 |
| $ | (1,398 | ) | $ | 2,078 |
| $ | (8,661 | ) | 32,995 |
|
|
| MWH |
| MMBtu |
| MWH |
| MMBtu |
|
|
|
|
|
Volumes (000’s) |
| 2,374 |
| 13,214 |
| 454 |
| 6,353 |
|
|
|
|
|
17
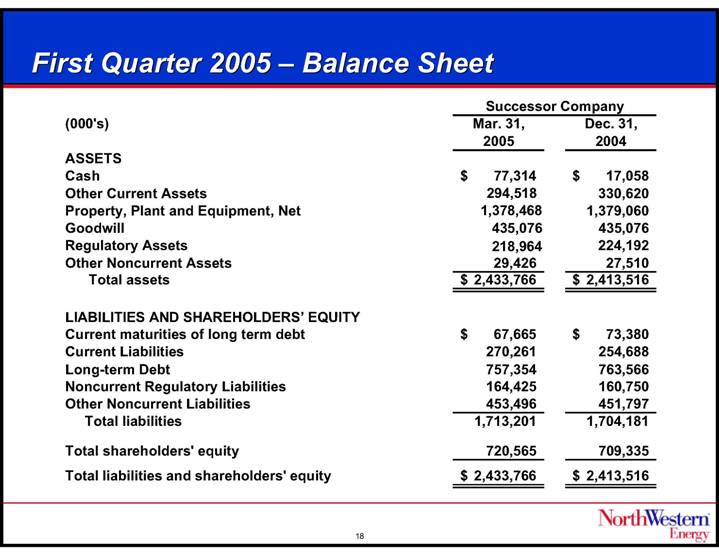
First Quarter 2005 – Balance Sheet
|
| Successor Company |
| ||||
(000’s) |
| Mar. 31, |
| Dec. 31, |
| ||
ASSETS |
|
|
|
|
| ||
Cash |
| $ | 77,314 |
| $ | 17,058 |
|
Other Current Assets |
| 294,518 |
| 330,620 |
| ||
Property, Plant and Equipment, Net |
| 1,378,468 |
| 1,379,060 |
| ||
Goodwill |
| 435,076 |
| 435,076 |
| ||
Regulatory Assets |
| 218,964 |
| 224,192 |
| ||
Other Noncurrent Assets |
| 29,426 |
| 27,510 |
| ||
Total assets |
| $ | 2,433,766 |
| $ | 2,413,516 |
|
|
|
|
|
|
| ||
LIABILITIES AND SHAREHOLDERS’ EQUITY |
|
|
|
|
| ||
Current maturities of long term debt |
| $ | 67,665 |
| $ | 73,380 |
|
Current Liabilities |
| 270,261 |
| 254,688 |
| ||
Long-term Debt |
| 757,354 |
| 763,566 |
| ||
Noncurrent Regulatory Liabilities |
| 164,425 |
| 160,750 |
| ||
Other Noncurrent Liabilities |
| 453,496 |
| 451,797 |
| ||
Total liabilities |
| 1,713,201 |
| 1,704,181 |
| ||
|
|
|
|
|
| ||
Total shareholders’ equity |
| 720,565 |
| 709,335 |
| ||
Total liabilities and shareholders’ equity |
| $ | 2,433,766 |
| $ | 2,413,516 |
|
18
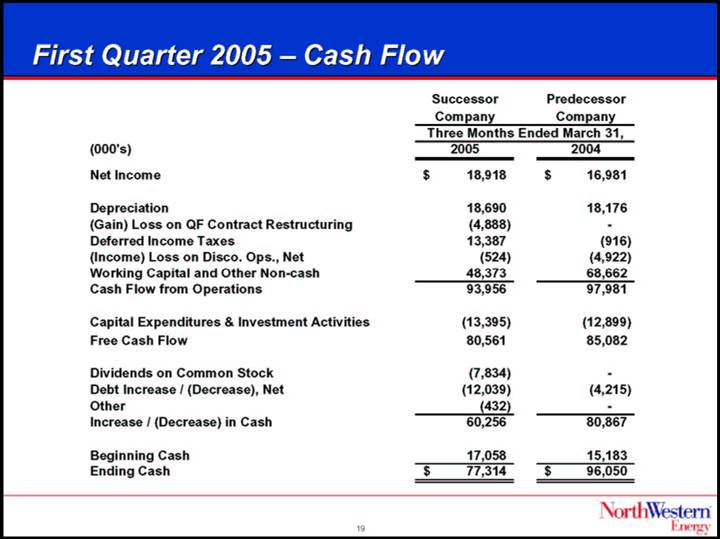
First Quarter 2005 – Cash Flow
|
| Successor |
| Predecessor |
| ||
|
| Three Months Ended March 31, |
| ||||
(000’s) |
| 2005 |
| 2004 |
| ||
Net Income |
| $ | 18,918 |
| $ | 16,981 |
|
|
|
|
|
|
| ||
Depreciation |
| 18,690 |
| 18,176 |
| ||
(Gain) Loss on QF Contract Restructuring |
| (4,888 | ) | — |
| ||
Deferred Income Taxes |
| 13,387 |
| (916 | ) | ||
(Income) Loss on Disco. Ops., Net |
| (524 | ) | (4,922 | ) | ||
Working Capital and Other Non-cash |
| 48,373 |
| 68,662 |
| ||
Cash Flow from Operations |
| 93,956 |
| 97,981 |
| ||
|
|
|
|
|
| ||
Capital Expenditures & Investment Activities |
| (13,395 | ) | (12,899 | ) | ||
Free Cash Flow |
| 80,561 |
| 85,082 |
| ||
|
|
|
|
|
| ||
Dividends on Common Stock |
| (7,834 | ) | — |
| ||
Debt Increase / (Decrease), Net |
| (12,039 | ) | (4,215 | ) | ||
Other |
| (432 | ) | — |
| ||
Increase / (Decrease) in Cash |
| 60,256 |
| 80,867 |
| ||
|
|
|
|
|
| ||
Beginning Cash |
| 17,058 |
| 15,183 |
| ||
Ending Cash |
| $ | 77,314 |
| $ | 96,050 |
|
19
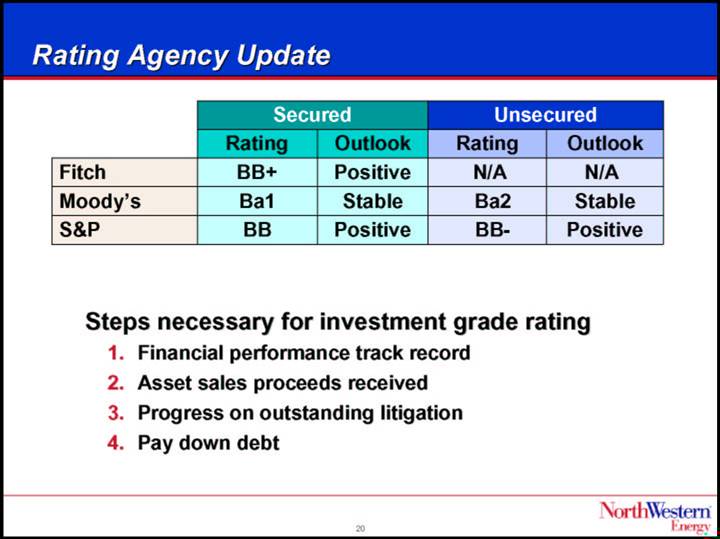
Rating Agency Update
|
| Secured |
| Unsecured |
| ||||
|
| Rating |
| Outlook |
| Rating |
| Outlook |
|
Fitch |
| BB+ |
| Positive |
| N/A |
| N/A |
|
Moody’s |
| Ba1 |
| Stable |
| Ba2 |
| Stable |
|
S&P |
| BB |
| Positive |
| BB- |
| Positive |
|
Steps necessary for investment grade rating
1. Financial performance track record
2. Asset sales proceeds received
3. Progress on outstanding litigation
4. Pay down debt
20
Summary
• Solid first quarter 2005 financial results
• Reaffirming guidance on basic earnings from continuing operations of $1.30 to $1.45 per share
• Absent any unusual weather and unforeseen reorganization items
• Taking steps to attain investment grade rating
• Developing strategy to redeploy excess free cash flow
21