1 northerntrust.com | © Northern Trust 2016 northerntrust.co | 2017 Northern Trust Raymond James Institutional Investors Conference 2017 NORTHERN TRUST CORPORATION S. Biff Bowman Executive Vice President & Chief Financial Officer J.W. Marriott Grande Lakes Orlando 7 March 2017 Exhibit 99.1

2 northerntrust.com | © Northern Trust 2016 FORWARD-LOOKING STATEMENTS This presentation may include statements which constitute “forward-looking statements” within the meaning of the safe harbor provisions of the Private Securities Litigation Reform Act of 1995. Forward-looking statements are identified typically by words or phrases such as “believe,” “expect,” “anticipate,” “intend,” “estimate,” “project,” “likely,” “plan,” “goal,” “target,” “strategy,” and similar expressions or future or conditional verbs such as “may,” “will,” “should,” “would,” and “could”. Forward-looking statements include statements, other than those related to historical facts, that relate to Northern Trust’s financial results and outlook, capital adequacy, dividend policy, anticipated expense levels, spending related to technology and regulatory initiatives, risk management policies, contingent liabilities, strategic initiatives, industry trends, and expectations regarding the impact of recent legislation. These statements are based on Northern Trust’s current beliefs and expectations of future events or future results, and involve risks and uncertainties that are difficult to predict and subject to change. These statements are also based on assumptions about many important factors, including the factors discussed in Northern Trust’s most recent annual report on Form 10-K and other filings with the U.S. Securities and Exchange Commission, all of which are available on Northern Trust’s website. We caution you not to place undue reliance on any forward-looking statement as actual results may differ materially from those expressed or implied by forward-looking statements. Northern Trust assumes no obligation to update its forward-looking statements.

3 northerntrust.com | © 2017 Northern Trust $8.5 trillion $124 billion $942 billion ASSETS UNDER CUSTODY/ ADMINISTRATION BANKING ASSETS ASSETS UNDER MANAGEMENT Client-Centric and Globally Integrated NORTHERN TRUST CORPORATION Service Expertise Integrity Relentless drive to provide exceptional service. Resolving complex challenges with multi-asset class capabilities. Acting with the highest ethics, utmost honesty and unfailing reliability. As of 12/31/2016

4 northerntrust.com | © 2017 Northern Trust FOCUSED ON ATTRACTIVE MARKETS The personal and institutional markets, where we focus, are large and growing. North America Private Financial Wealth $US Trillion $60 $76 2015 2020E CAGR: 7.8% 7.4% Sources: BCG Global Wealth 2016, Cerulli Associates Global Markets 2016, The City UK, eVestment, PWC, ETFGI, Ernst & Young and internal estimates Global Institutional Assets $US Trillion $38 $31 $29 $17 $7 $3 $161 $50 $40 $35 $20 $10 $6 2015 2019E Total $125 Retirement Funds Mutual/ Collective Funds Insurance Assets Sovereign Wealth Funds Alternatives ETFs CAGR: 6.5% 5.8% 1.3% Wealth Holdings > $100M Wealth Holdings $20-$100M Wealth Holdings $1-$20M Wealth Holdings < $1M
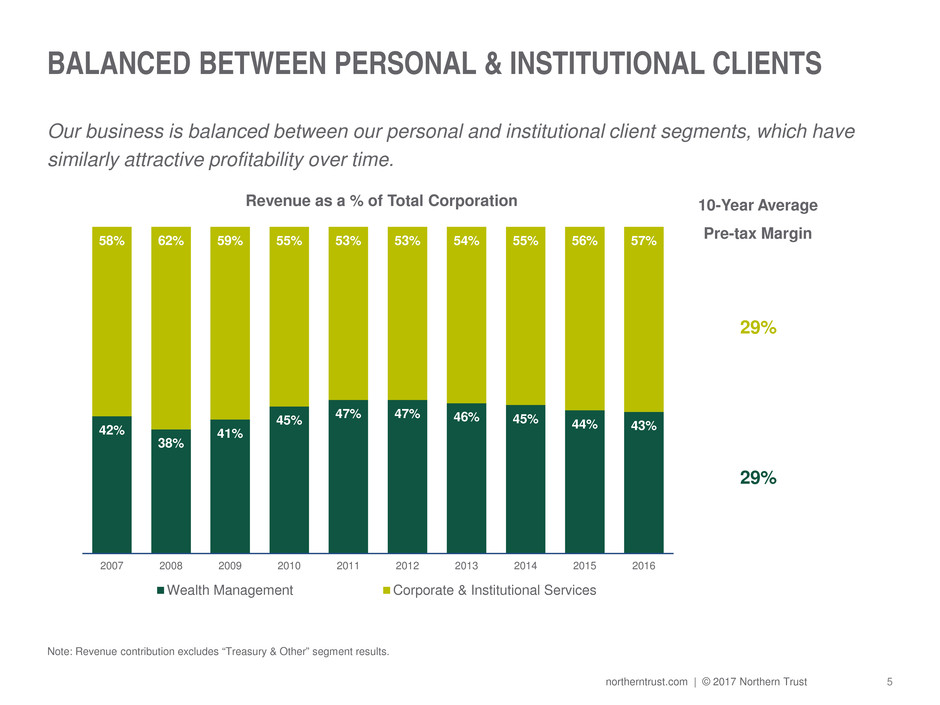
5 northerntrust.com | © 2017 Northern Trust BALANCED BETWEEN PERSONAL & INSTITUTIONAL CLIENTS Our business is balanced between our personal and institutional client segments, which have similarly attractive profitability over time. Note: Revenue contribution excludes “Treasury & Other” segment results. 42% 38% 41% 45% 47% 47% 46% 45% 44% 43% 58% 62% 59% 55% 53% 53% 54% 55% 56% 57% 2007 2008 2009 2010 2011 2012 2013 2014 2015 2016 Wealth Management Corporate & Institutional Services Revenue as a % of Total Corporation 10-Year Average Pre-tax Margin 29% 29%
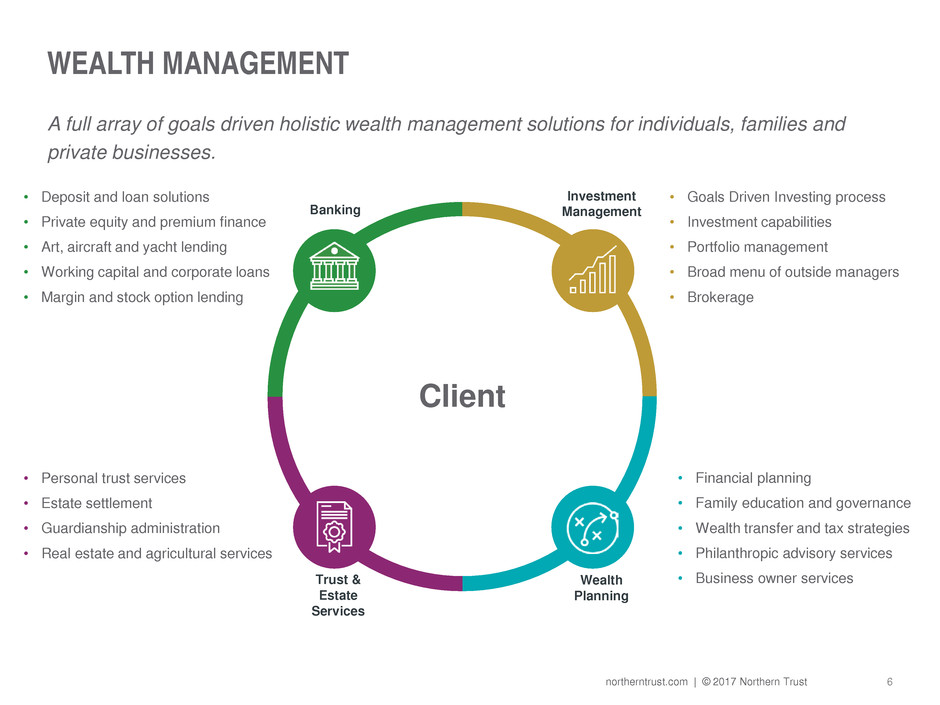
6 northerntrust.com | © 2017 Northern Trust WEALTH MANAGEMENT A full array of goals driven holistic wealth management solutions for individuals, families and private businesses. Client Banking Investment Management Trust & Estate Services Wealth Planning • Deposit and loan solutions • Private equity and premium finance • Art, aircraft and yacht lending • Working capital and corporate loans • Margin and stock option lending • Personal trust services • Estate settlement • Guardianship administration • Real estate and agricultural services • Goals Driven Investing process • Investment capabilities • Portfolio management • Broad menu of outside managers • Brokerage • Financial planning • Family education and governance • Wealth transfer and tax strategies • Philanthropic advisory services • Business owner services

7 northerntrust.com | © 2017 Northern Trust SPOTLIGHT: GOALS DRIVEN INVESTING The Goals Driven Wealth Management approach helps align financial resources with personal goals creating an integrated strategy that empowers a full understanding of how to achieve lifetime goals. Funding lifestyles Pursuing dreams Investing in future generations Exploring philanthropic legacies YOUR LIFE. YOUR GOALS.
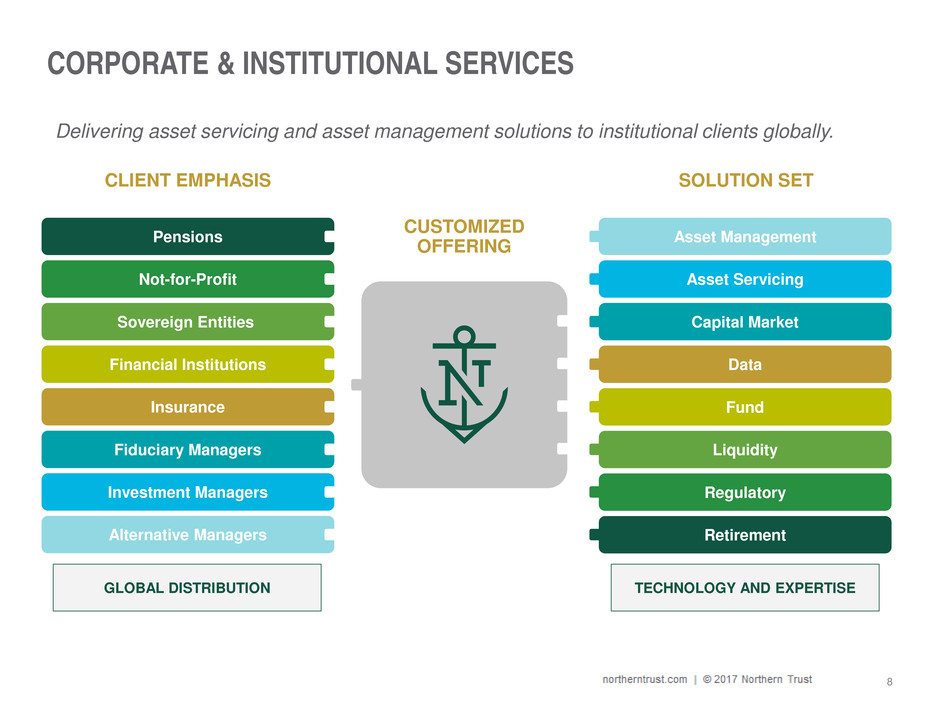
8 northerntrust.com | © Northern Trust 2016 CORPORATE & INSTITUTIONAL SERVICES Delivering asset servicing and asset management solutions to institutional clients globally. GLOBAL DISTRIBUTION TECHNOLOGY AND EXPERTISE CLIENT EMPHASIS SOLUTION SET CUSTOMIZED OFFERING Not-for-Profit Pensions Sovereign Entities Financial Institutions Insurance Fiduciary Managers Alternative Managers Investment Managers Asset Management Asset Servicing Capital Market Data Fund Liquidity Regulatory Retirement
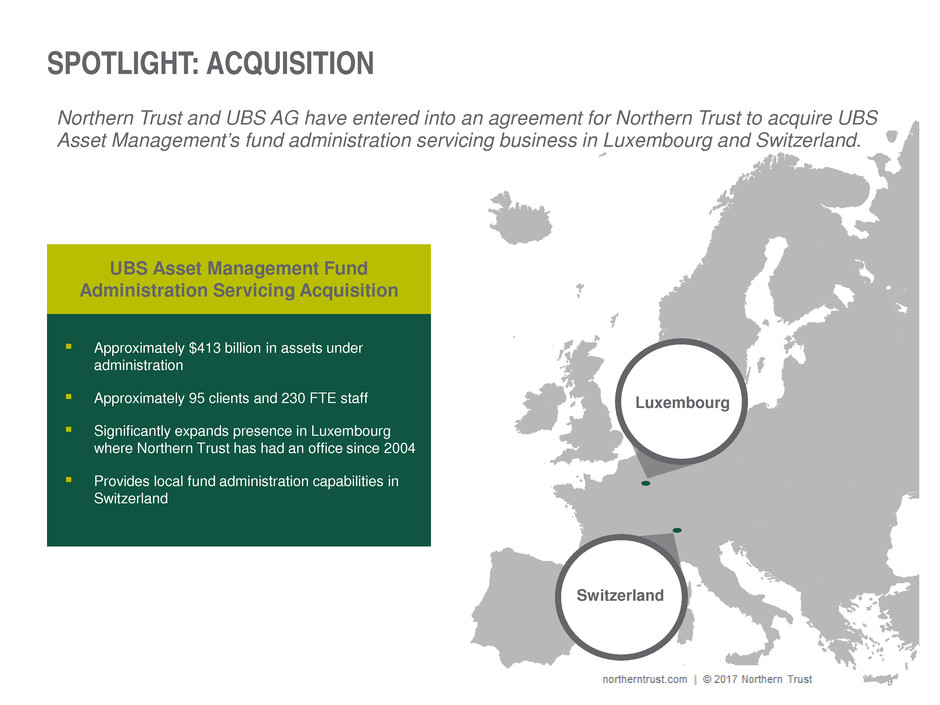
9 northerntrust.com | © Northern Trust 2016 SPOTLIGHT: ACQUISITION Northern Trust and UBS AG have entered into an agreement for Northern Trust to acquire UBS Asset Management’s fund administration servicing business in Luxembourg and Switzerland. Approximately $413 billion in assets under administration Approximately 95 clients and 230 FTE staff Significantly expands presence in Luxembourg where Northern Trust has had an office since 2004 Provides local fund administration capabilities in Switzerland UBS Asset Management Fund Administration Servicing Acquisition Luxembourg Switzerland
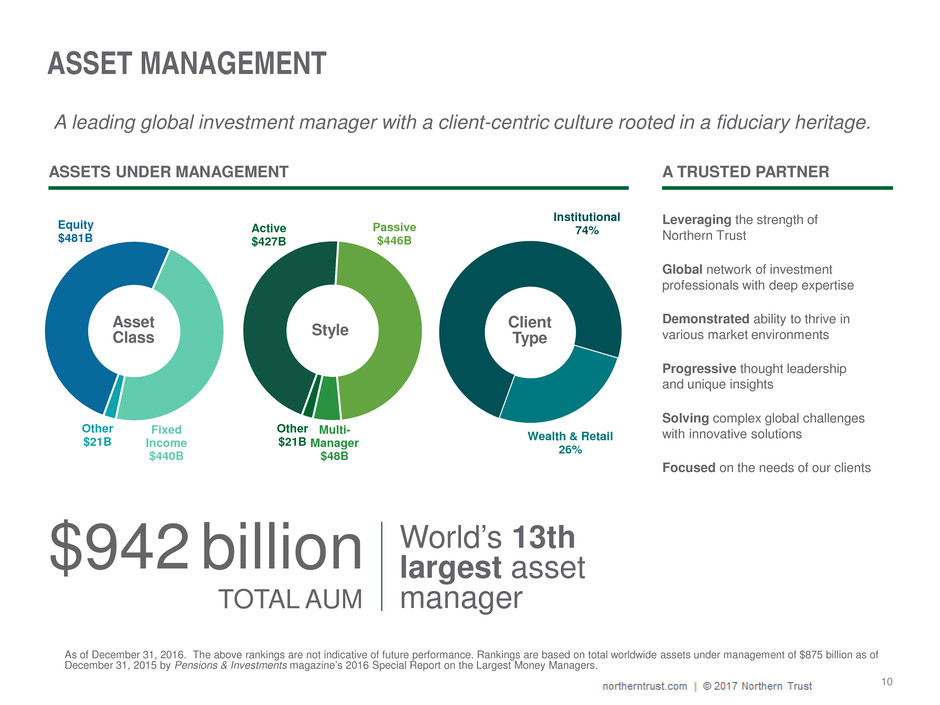
10 northerntrust.com | © Northern Trust 2016 ASSET MANAGEMENT ASSETS UNDER MANAGEMENT A leading global investment manager with a client-centric culture rooted in a fiduciary heritage. World’s 13th largest asset manager $942 billion TOTAL AUM Leveraging the strength of Northern Trust Global network of investment professionals with deep expertise Demonstrated ability to thrive in various market environments Progressive thought leadership and unique insights Solving complex global challenges with innovative solutions Focused on the needs of our clients A TRUSTED PARTNER Institutional 74% Active $427B Passive $446B Multi- Manager $48B Other $21B Equity $481B Fixed Income $440B Other $21B Wealth & Retail 26% Asset Class Style Client Type As of December 31, 2016. The above rankings are not indicative of future performance. Rankings are based on total worldwide assets under management of $875 billion as of December 31, 2015 by Pensions & Investments magazine’s 2016 Special Report on the Largest Money Managers.

11 northerntrust.com | © Northern Trust 2016 SPOTLIGHT: FLEXSHARES FlexShares has 25 funds across equity, alternatives and fixed income categories and is the 14th largest ETF sponsor in the United States and the 25th largest globally. $6.7 $8.4 $7.6 $11.8 15 17 22 25 2013 2014 2015 2016 AUM ($B) No. of Funds FlexShares ETFs are designed to help investors pursue targeted investment opportunities, by blending: Intelligent Portfolio Construction – engineering strategies to pursue targeted outcomes, with Passive Management – minimizing turnover and containing costs, or Active Management – combining research and fundamental analysis with quantitative filters Since 2013, FlexShares AUM has grown at a 20.4% CAGR versus the industry growth of 14.5% FlexShares
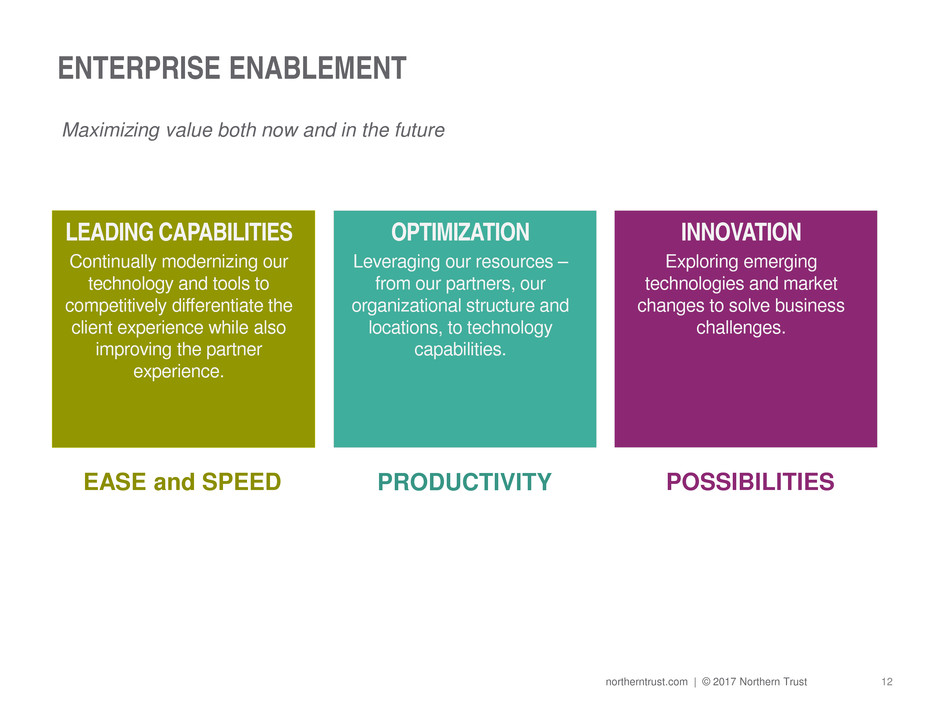
12 northerntrust.com | © 2017 Northern Trust LEADING CAPABILITIES Continually modernizing our technology and tools to competitively differentiate the client experience while also improving the partner experience. INNOVATION Exploring emerging technologies and market changes to solve business challenges. ENTERPRISE ENABLEMENT EASE and SPEED PRODUCTIVITY POSSIBILITIES OPTIMIZATION Leveraging our resources – from our partners, our organizational structure and locations, to technology capabilities. Maximizing value both now and in the future

13 northerntrust.com | © 2017 Northern Trust PROFITABILITY AND RETURNS We remain focused on sustainably improving profitability and returns Ratio of expenses to trust & investment fees was 112% on a reported basis for 2016 Return on equity was 11.9%, which is within our target range of 10%-15% 1 Pre-tax margin stated on an FTE basis is a non-GAAP financial measure. A reconciliation to pre-tax margin prepared in accordance with U.S. GAAP is included in the Appendix on page 16. Return on Equity 9.3% 9.5% 10.0% 11.5% 11.9% 26.2% 30.9% 120% 112% Pre-tax Margin (FTE)1 Noninterest Expense as a % of Trust & Investment Fees FY 2012 FY 2013 FY 2014 FY 2015 FY 2016

14 northerntrust.com | © 2017 Northern Trust CONSISTENTLY STRONG AND FOCUSED +8% +12% +9% +12% Market Leader in Focused Businesses A History of Organic Growth Distinctive Financial Strength Proven Record of Managing for Long-Term Growth and Profitability LONG-TERM SUCCESS THROUGH A FOCUSED STRATEGY

15 northerntrust.com | © 2017 Northern Trust

16 northerntrust.com | © 2017 Northern Trust The following tables present a reconciliation of pre-tax income, total revenue and pre-tax margin prepared in accordance with GAAP to such measures on a fully taxable equivalent (FTE) basis, which are non-GAAP financial measures. Management believes this presentation provides a clearer indication of these financial measures for comparative purposes. RECONCILIATION OF NON-GAAP FINANCIAL MEASURES Twelve Months Ended December 31, 2016 December 31, 2015 December 31, 2014 ($ In Millions) Reported FTE Adj. FTE Reported FTE Adj. FTE Reported FTE Adj. FTE Pre-tax Income $ 1,517.1 $ 25.1 $ 1,542.2 $ 1,465.0 $ 25.3 $ 1,490.3 $ 1,190.2 $ 29.4 $ 1,219.6 Total Revenue $ 4,961.8 $ 25.1 $ 4,986.9 $ 4,702.6 $ 25.3 $ 4,727.9 $ 4,331.2 $ 29.4 $ 4,360.6 Pre-tax Margin 30.6 % 30.9 % 31.2 % 31.5 % 27.5 % 28.0 % Twelve Months Ended December 31, 2013 December 31, 2012 ($ In Millions) Reported FTE Adj. FTE Reported FTE Adj. FTE Pre-tax Income $ 1,075.5 $ 32.5 $ 1,108.0 $ 992.3 $ 40.8 $ 1,033.1 Total Revenue $ 4,089.3 $ 32.5 $ 4,121.8 $ 3,896.1 $ 40.8 $ 3,936.9 Pre-tax Margin 26.3 % 26.9 % 25.5 % 26.2 %


