 © 2009 Northern Trust Corporation Service Expertise Integrity Frederick H. Waddell President & Chief Executive Officer May 12, 2009 NORTHERN TRUST CORPORATION 2009 UBS Global Financial Services Conference EXHIBIT 99.1 |
 Integrity Expertise Service 2 Forward Looking Statement This presentation may include forward-looking statements such as statements that relate to Northern Trust’s financial goals, dividend policy, expansion and business development plans, anticipated expense levels and projected profit improvements, business prospects and positioning with respect to market, demographic and pricing trends, strategic initiatives, re-engineering and outsourcing activities, new business results and outlook, changes in securities market prices, credit quality including reserve levels, planned capital expenditures and technology spending, anticipated tax benefits and expenses, and the effects of any extraordinary events and various other matters (including developments with respect to litigation, other contingent liabilities and obligations, and regulation involving Northern Trust and changes in accounting policies, standards and interpretations) on Northern Trust’s business and results. These statements speak of Northern Trust’s plans, goals, targets, strategies, beliefs, and expectations, and refer to estimates or use similar terms. Actual results could differ materially from those indicated by these statements because the realization of those results is subject to many risks and uncertainties. Our 2008 annual report and periodic reports to the SEC contain information about specific factors that could cause actual results to differ, and you are urged to read them. Northern Trust disclaims any continuing accuracy of the information provided in this presentation after today. |
 Integrity Expertise Service 3 Agenda Recent Capital Raise Northern Trust: Strategic Overview Financial Performance Highlights Balance Sheet Highlights Concluding Thoughts |
 © 2009 Northern Trust Corporation Service Expertise Integrity Capital Raise |
 Integrity Expertise Service 5 Why Did We Raise Capital? Further enhances our distinctive and robust capital position Positions us to redeem TARP CPP in consultation with our regulators Better enables us to pursue compelling growth opportunities |
 © 2009 Northern Trust Corporation Service Expertise Integrity Strategic Overview |
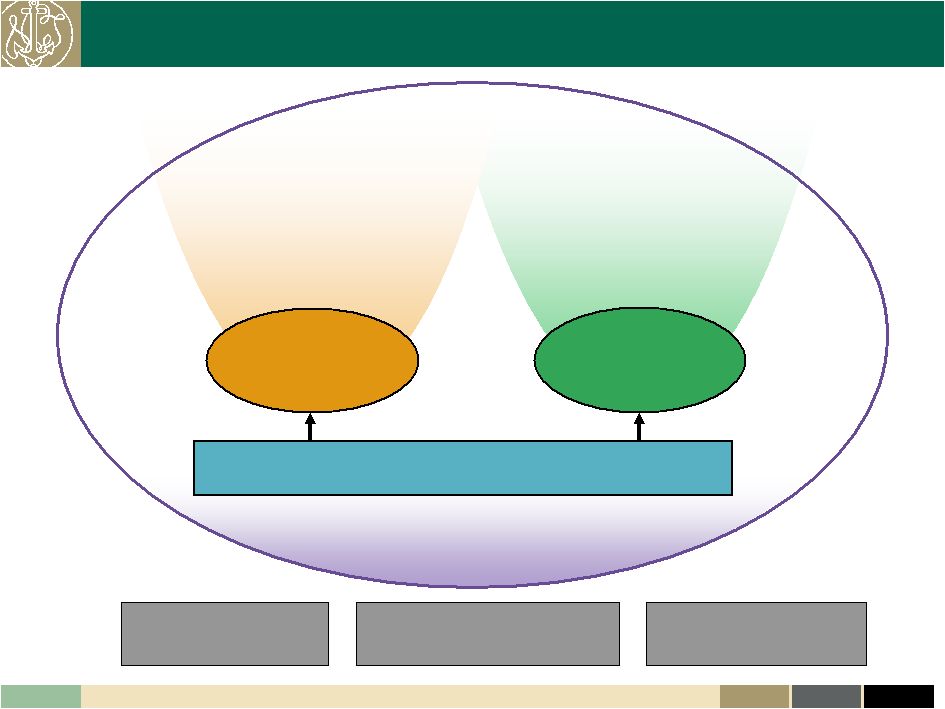 7 Integrity Expertise Service Client-centric and Highly Focused Business Model Our Clients Operations & Technology Government Agencies Taft-Hartley Foundations / Endowments / Healthcare Individuals Privately Held Businesses Pension Funds Large Corporations Investment Management Firms Insurance Companies Families Family Foundations Family Offices Personal Financial Services Corporate & Institutional Services Northern Trust Global Investments Sovereign Wealth Funds Assets Under Custody $2.8 Trillion Assets Under Management $522 Billion As of 3/31/09 Balance Sheet Assets $78.5 Billion |
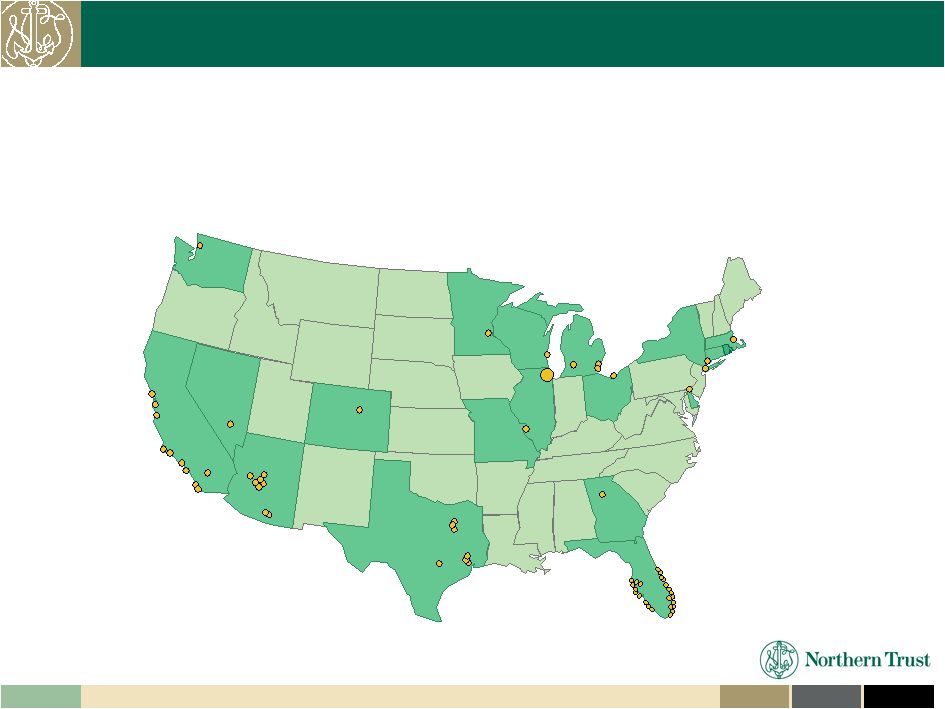 8 Integrity Expertise Service Network of over 80 PFS Offices in 18 States Over 50% of the U.S. millionaire market resides within a 45-minute drive of Northern Trust offices. Arizona (8) Florida (25) Illinois (19) Illinois (19) Colorado (1) Colorado (1) Nevada (1) Nevada (1) Missouri (1) Missouri (1) Washington (1) Michigan (3) Texas (7) California (11) New York (1) Connecticut (1) Delaware (1) Georgia (1) Georgia (1) Wisconsin (1) Wisconsin (1) Ohio (1) Ohio (1) Minnesota (1) Minnesota (1) Massachusetts (1) Personal Financial Services Extensive Reach in Affluent Market |
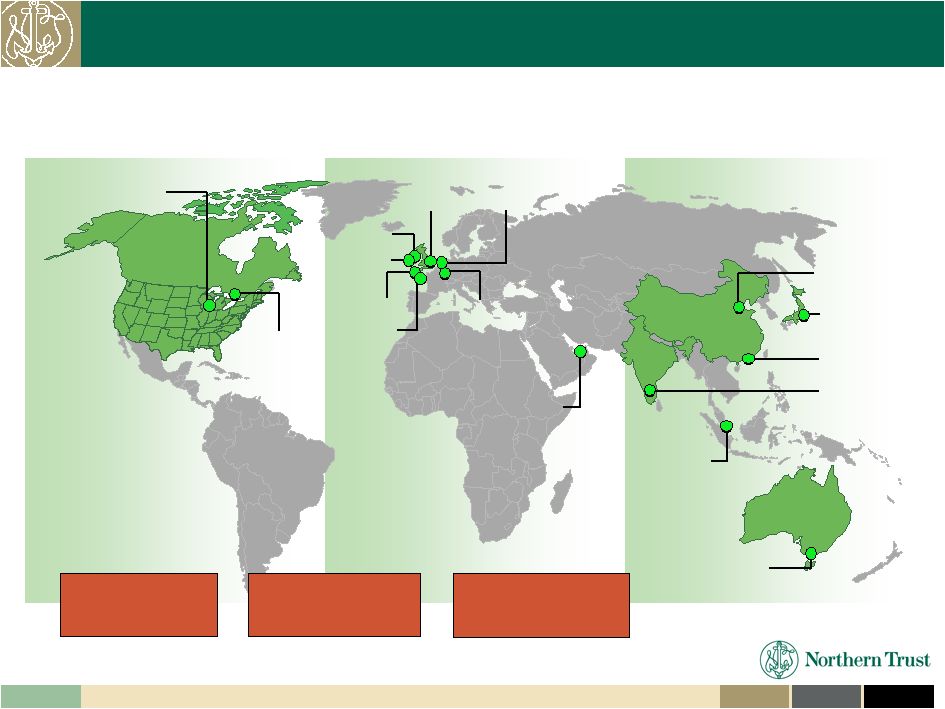 9 Integrity Expertise Service Corporate & Institutional Services Strategically Positioned in Three Dynamic Regions North America Europe, Middle East & Africa Asia Pacific Abu Dhabi Dublin Toronto London Limerick Amsterdam Luxembourg Guernsey Melbourne Singapore Hong Kong Bangalore Beijing Tokyo Jersey Chicago 17 Locations Worldwide Trade Settlement in 90+ Markets Clients in 41 Countries |
 10 Integrity Expertise Service Northern Trust Global Investments Diversified, World Class Investment Manager $522.3 Billion Assets Under Management as of March 31, 2009 A Diversified Asset Manager $290 Billion (56%) Active $206 Billion (39%) Quantitative $26 Billion (5%) Manager of Managers Across Asset Classes Across Client Segments $392 Billion Institutional $130 Billion Personal Across Styles Equities $182 Billion (35%) Fixed Income $100 Billion (19%) Short Duration $228 Billion (44%) Other $12 Billion (2%) |
 11 Integrity Expertise Service Positioned for Growth Personal Financial Services Corporate & Institutional Services Northern Trust Global Investments Attractive markets and geographic expansion opportunities New business and human capital gains from global disruption Benefitting from flight to quality Comprehensive product capabilities combined with distinctive service |
 © 2009 Northern Trust Corporation Service Expertise Integrity Financial Performance Highlights |
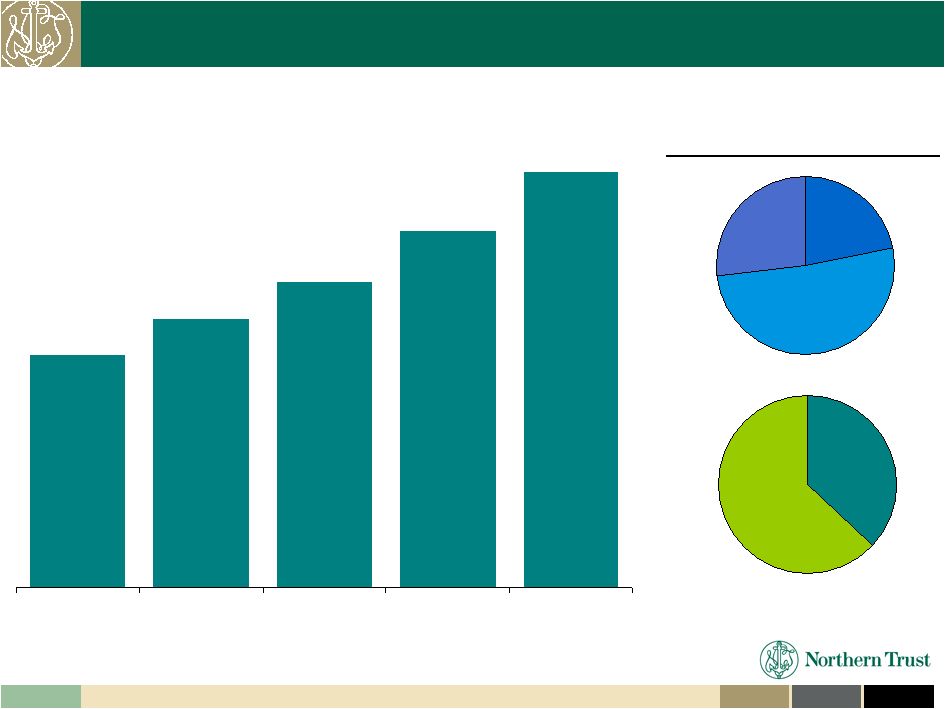
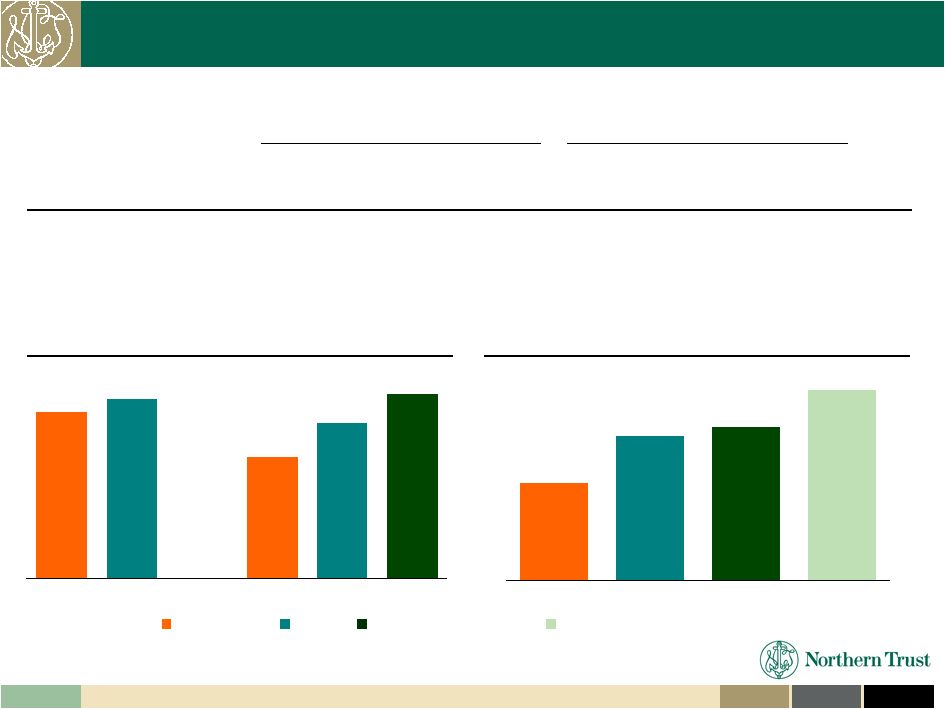
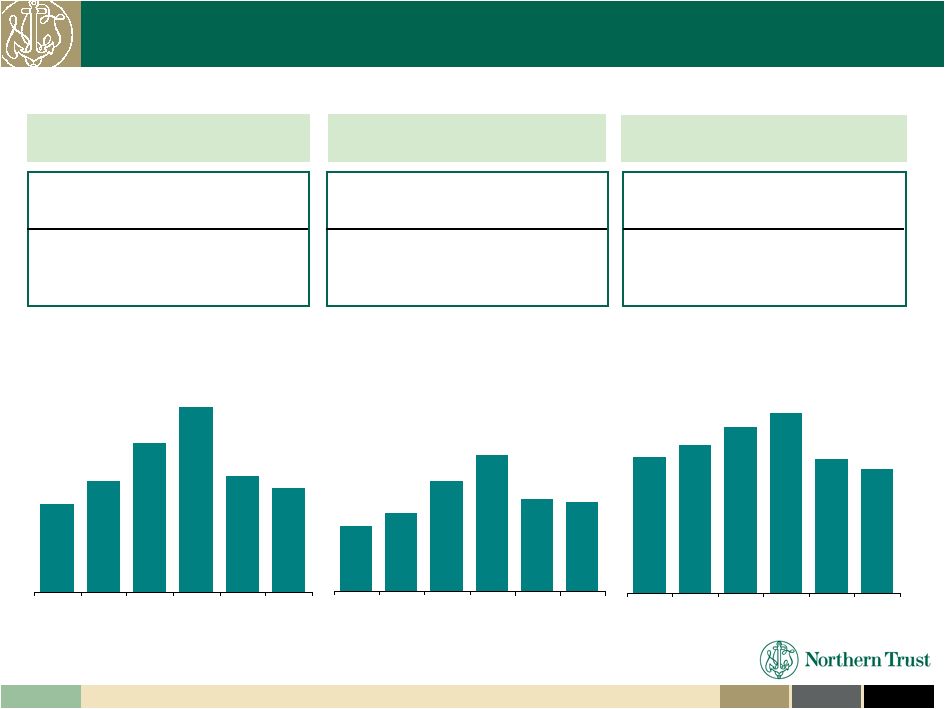 Integrity Expertise Service 13 AUM S&P 500 0.1% (7) (20)% (31) Since Jun-2007 5-Year CAGR 1Q04 - Q109 Since Jun-2007 AUC S&P 500 5% (7) Global Custody EAFE 11% (5) (18)% (36) $1.0 $1.2 $1.7 $2.1 $1.4 $1.4 2004 2005 2006 2007 2008 1Q09 $572 $618 $697 $757 $559 $522 2004 2005 2006 2007 2008 1Q09 Asset Accumulation Significantly Outperforming the Market $2.6 $2.9 $3.5 $4.1 $3.0 $2.8 2004 2005 2006 2007 2008 1Q09 Assets Under Management ($ Billions) Global Custody Assets ($ Trillions) Assets Under Custody ($ Trillions) Since Jun-2007 (18)% (31) 5-Year CAGR 1Q04 - Q109 5-Year CAGR 1Q04 - Q109 |
 Integrity Expertise Service 14 High-Growth and Balanced Revenue Stream $4,160 $3,572 $3,061 $2,686 $2,326 2004 2005 2006 2007 2008 2004 – 2008 CAGR = 16% S&P 500 (7)% EAFE (5)% ($ Millions) Operating Revenue Note: Excludes VISA items for 2007 and 2008. 2008 Revenue Contribution Other Noninterest Income 22% Trust Fees 51% Net Interest Income 27% International 37% US 63% |
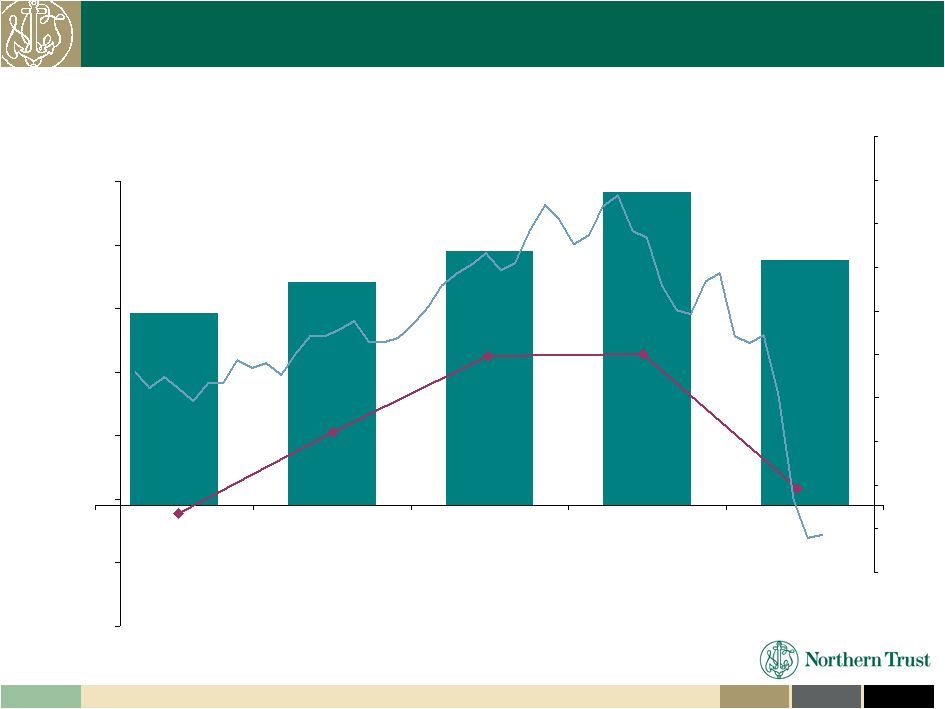 Integrity Expertise Service 15 $506 $584 $821 $641 $665 2004 2005 2006 2007 2008 0% 1% 2% 3% 4% 5% 6% 7% 8% 9% 10% (40%) (30%) (20%) (10%) 0% 10% 20% 30% Earnings Strength Across Cycle ($ Millions) Operating Net Income S&P500 Annual Fed Funds S&P 500 Note: S&P 500 line represents percent change from12/31/04 base. 2007 and 2008 Net Income are on an Operating Basis e.g. excluding all VISA items. 2004 – 2008 Avg. ROE = 17% Fed Funds |
 Integrity Expertise Service 16 Fixed income market dislocation Strength relative to equity market declines First Quarter 2009 Highlights Trust, Inv. & Other Svcing Fees (ex. Securities Lending) Securities Lending Other Noninterest Income Net Interest Income Total Revenues Noninterest Expenses Net Income Earnings Per Common Share Market Indices: S&P 500 US$EAFE % Change 1Q09 vs 1Q08 $419 $(8) $206 $288 $904 $594 $162 $0.61 -15% NM +11% +8% -8% -3% -30% -41% -40% -49% First Quarter 2009 ($ Million) Note: Comparison excludes the impact of the First Quarter 2008 VISA item. Well controlled Managing the business in the context of a difficult market environment and positioning ourselves to take advantage of market opportunities Common Dividend of $0.28 maintained TARP dividend of $0.09 |
 © 2009 Northern Trust Corporation Service Expertise Integrity Balance Sheet Highlights |
 Integrity Expertise Service 18 Client Deposit-Driven Balance Sheet Securities 23% Money Market Assets 28% Client Loans 39% Other 10% Assets Other Purchased Funds 13% Client Deposits 68% Long-Term Debt & Senior Notes 6% Other 5% Liabilities & Equity As of March 31, 2009 Equity 8% Total Assets = $78.5 Billion Total Risk Weighted Assets = $52.4 Billion |
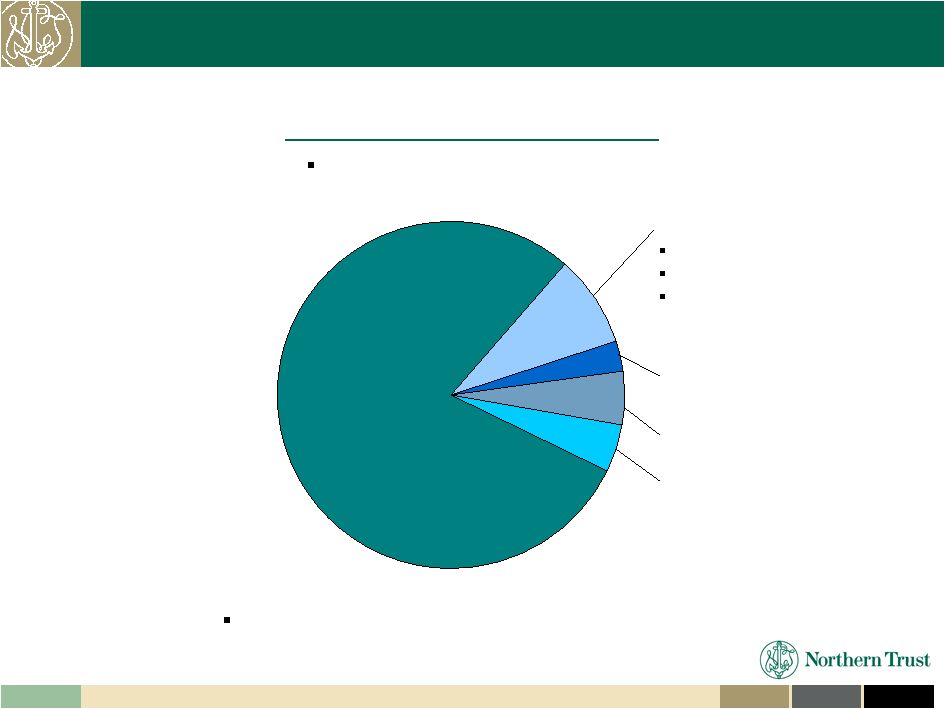 Integrity Expertise Service 19 High Quality Securities Portfolio $17.8B SECURITIES PORTFOLIO 90% of total securities rated triple-A Government Sponsored Agency / FDIC TLG Funding ($13.4B / $0.8B) Auction Rate Securities ($0.5B) Municipal Bonds ($0.8B) Asset-Backed ($1.5B) Well diversified 76% rated triple-A Subprime asset-backed total < 2% of total portfolio Other ($0.9B) Total net unrealized losses (pretax) of $240 million 8% 3% 5% 4% 80% As of March 31, 2009 |
 Integrity Expertise Service 20 Focused Lending Practices Produce Superior Results Relationship-based lending practices Each mortgage individually underwritten and managed Commercial lending supports-fee based clients Northern Trust does not: Underwrite mortgage loans to sub-prime borrowers Participate in credit card lending Offer an off-balance sheet commercial paper conduit Lend directly to hedge funds As of March 31, 2009 High Net Worth Residential Real Estate ($10.6B) 35% 26% Commercial ($7.8B) 10% Commercial Real Estate ($3.1B) 15% Personal ($4.6B) 4% Other ($1.2B) Leases ($1.0B) Non-U.S. ($2.1B) 3% 7% $30B Loan Portfolio NCO’s / Avg. Loans 0.04% 0.09% 1.62% 1.57% Q1 2009 2008 NPA’s / Loans 0.57% 0.33% 2.71% 2.06% Q1 2009 2008 Reserves / NPA’S 166% 237% 75% 86% Q1 2009 2008 NTRS Median Top 20 Bank Peers |
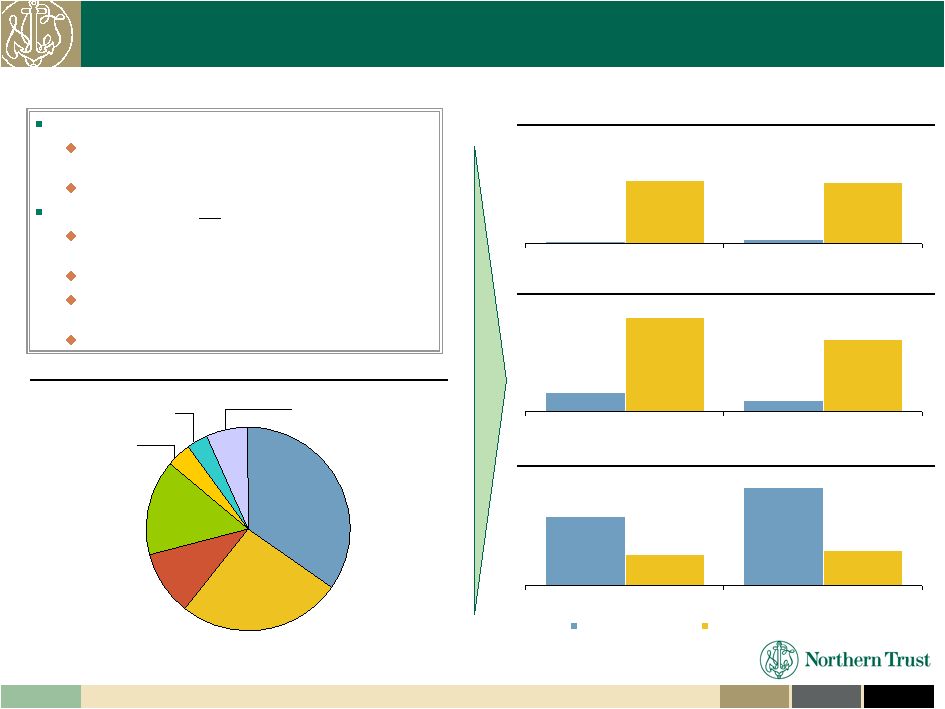
 Integrity Expertise Service 21 Top Tier Capital Strength 88% 71% 45% 67% TCE/TA TCE/RWA Tier 1 Capital Capital Ratios Pro Forma with New Common With TARP Redemption 5.9% 8.8% 13.0% Top 20 Banks Peer Median (incl. CPP) Capital Composition – TCE as % of Tier 1 7.0% 5.9% 4.6% 6.8% 6.3% TCE / TA Ratio – Continued Differentiation ¹ Proforma for common stock offering and TARP CPP redemption (excludes impact of warrant redemption). NTRS 4.6% 5.0% 11.0% 7.0% 10.4% 14.7% 6.9% 10.3% 11.7% Actual March 31, 2009 2004 Q1 2009 Q1 2009 No TARP Redemption Top 20 Banks NTRS NTRS Pro Forma (w/ TARP) NTRS Pro Forma (w/ TARP Repayment) 1 |
 © 2009 Northern Trust Corporation Service Expertise Integrity Concluding Thoughts |
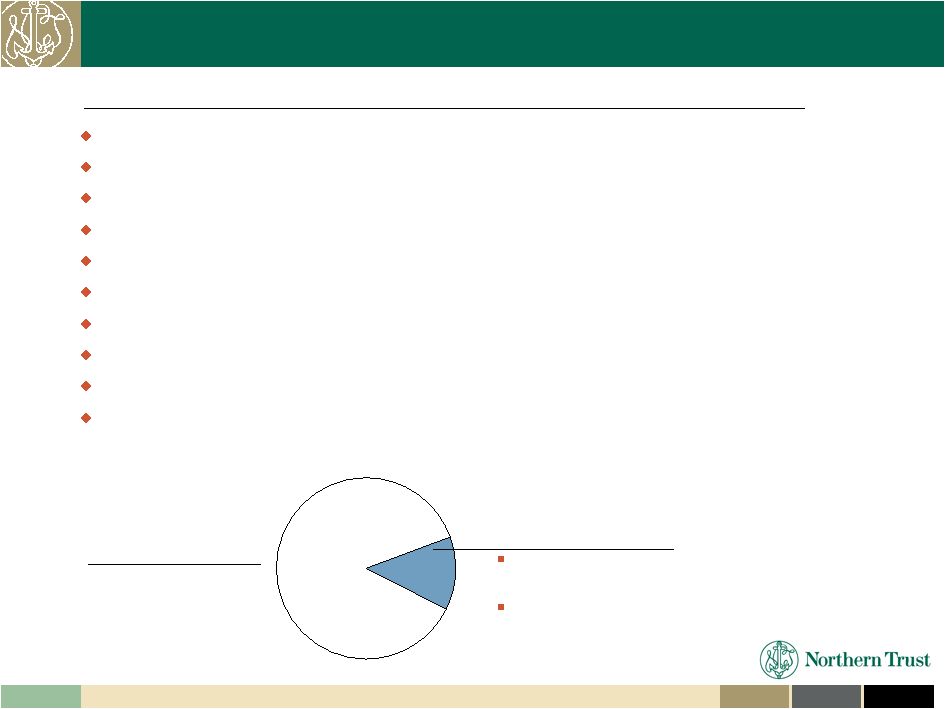 Integrity Expertise Service 23 Invested, Experienced and Stable Management Team Management Northern Trust Industry Rick Waddell - President & CEO 34 Years 34 Years Sherry Barrat - President – PFS 19 Years 39 Years Steve Fradkin - EVP & Chief Financial Officer 24 Years 24 Years Tim Moen - EVP – Human Resources & Admin. 8 Years 34 Years Bill Morrison - President – PFS 13 Years 36 Years Steve Potter - President – NTGI 27 Years 27 Years Joyce St. Clair - EVP – Corporate Risk Mgt. 17 Years 28 Years Jana Schreuder - President – O&T 29 Years 29 Years Tim Theriault - President – C&IS 25 Years 27 Years Kelly Welsh - EVP & General Counsel 9 Years 31 Years Average Tenure 21 Years 28 Years NTRS Ownership (As of December 31, 2008) ~13% Employees, Directors and Retirees Approximately 76% of employees own Northern Trust stock |
 Integrity Expertise Service 24 Strategic Growth Opportunity + Financial Strength Leadership position in attractive, client-focused, business segments Strong brand and reputation – “flight to quality” in the current environment Compelling growth opportunities from global dislocation Proven record of managing the business for long-term growth and profitability Conservative management practices Distinctive balance sheet strength Strong capital levels Invested, experienced and stable management team Well Positioned to Capitalize on Global Growth Opportunities Financial Strength and Soundness a Differentiating Factor |
 © 2009 Northern Trust Corporation Service Expertise Integrity Frederick H. Waddell President & Chief Executive Officer May 12, 2009 NORTHERN TRUST CORPORATION 2009 UBS Global Financial Services Conference |