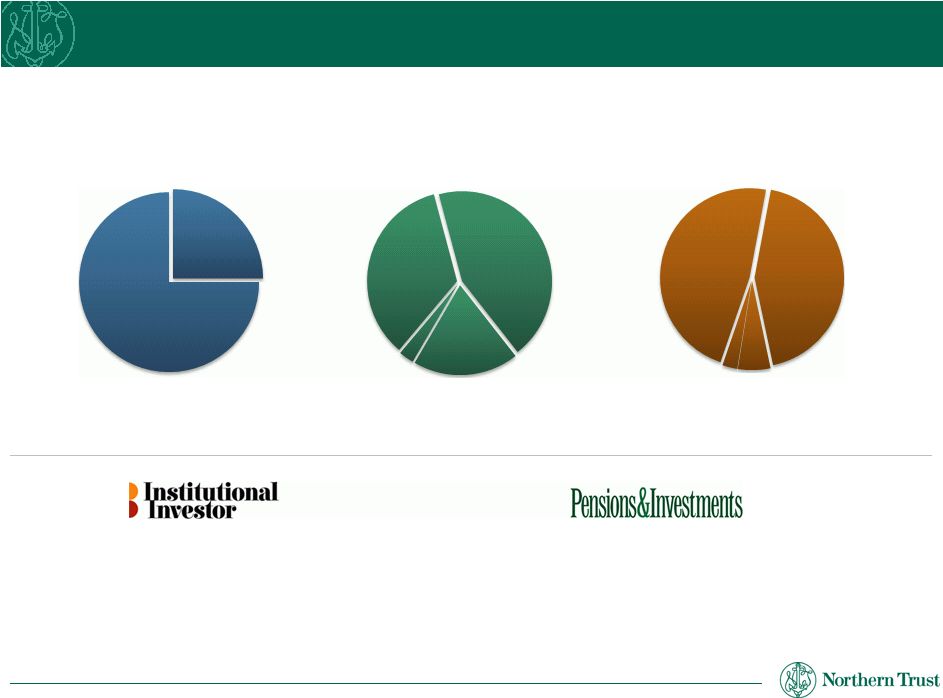
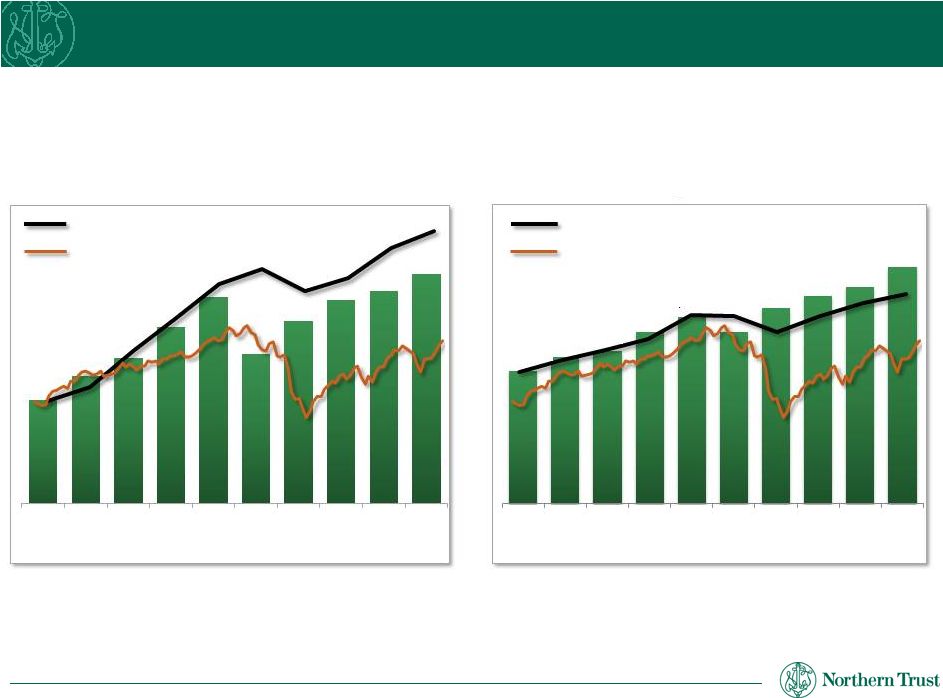
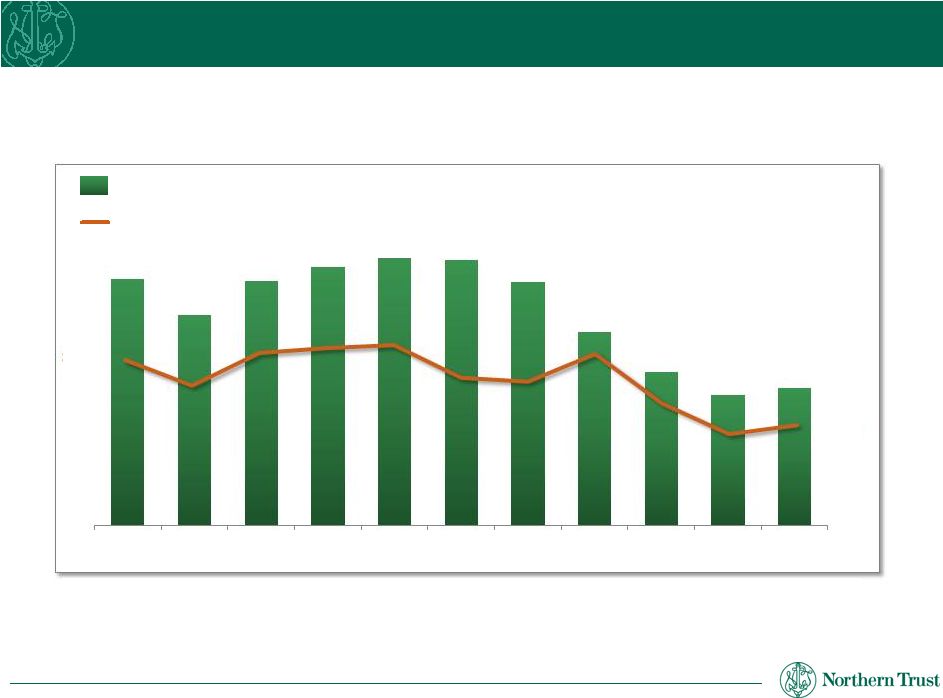
11 Barclays Americas Select Franchise Conference 2012 Northern Trust data is as of March 31, 2012 and for the quarter then ended. Peer data is as of the fourth quarter of 2011 as sourced from SNL Financial. Peer group includes U.S. based banks with assets of more than $50 billion as of December 31, 2011, a group of 18 institutions excluding Northern Trust. Northern Trust Peer Avg. Relationship-based lending Diversified by loan type, including residential real estate (36%), commercial & institutional (24%), commercial real estate (10%) Consistent and conservative underwriting standards Placed with banks that have strong internal risk ratings and external credit ratings Includes exposure to banks in the Eurozone of $3.0 billion, primarily in the Netherlands and in the Nordic region Average duration of less than 2 months 85% of Northern Trust’s total securities portfolio composed of U.S. Treasury, government sponsored agency and triple-A rated securities 87% of Asset-Backed Securities rated triple-A The securities portfolio is in a net unrealized gain position Average maturity duration of ~2 years and a re-pricing duration of ~11 months Balance Sheet Consistently Strong and Conservative 0.08% 1.25% 0.98% 2.16% NCOs to Avg. Loans NPAs to Loans & REO Loan Portfolio $29 billion Securities $32 billion Deposits with Banks $19 billion |