BancAnalysts Association of Boston Conference 2015 S. Biff Bowman Executive Vice President & Chief Financial Officer Northern Trust Corporation Boston | November 5, 2015 EXHIBIT 99.1
Forward-Looking Statements This presentation may include forward-looking statements concerning Northern Trust’s financial results and outlook, capital adequacy, dividend policy and stock repurchase program, anticipated expense levels and technology investments, risk management policies, contingent liabilities, strategic initiatives and investments, industry trends, and expectations regarding governmental and regulatory initiatives and developments. Forward-looking statements are typically identified by words or phrases such as “believe”, “expect”, “anticipate”, “intend”, “estimate”, “project”, “likely”, “may increase”, “plan”, “goal”, “target”, “strategy”, and similar expressions or future or conditional verbs such as “may”, “will”, “should”, “would”, and “could”. Forward-looking statements are Northern Trust’s current estimates or expectations of future events or future results, and involve risks and uncertainties that are difficult to predict. These statements are based on assumptions about many important factors, including the factors discussed in Northern Trust’s most recent annual report on Form 10-K and other filings with the U.S. Securities and Exchange Commission, all of which are available on Northern Trust’s website. We caution you not to place undue reliance on any forward-looking statement as actual results may differ materially from those expressed or implied by forward-looking statements. Northern Trust assumes no obligation to update its forward-looking statements.
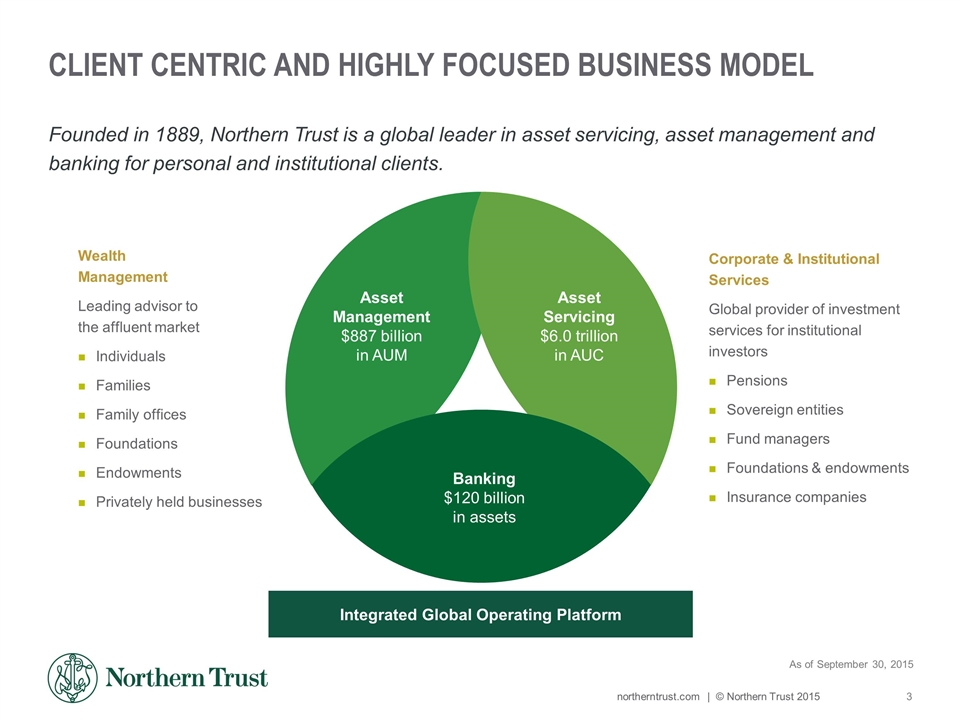
Client Centric and Highly Focused Business Model Founded in 1889, Northern Trust is a global leader in asset servicing, asset management and banking for personal and institutional clients. As of September 30, 2015 Wealth Management Leading advisor to the affluent market Individuals Families Family offices Foundations Endowments Privately held businesses Corporate & Institutional Services Global provider of investment services for institutional investors Pensions Sovereign entities Fund managers Foundations & endowments Insurance companies Banking $120 billion in assets Asset Servicing $6.0 trillion in AUC Asset Management $887 billion in AUM Integrated Global Operating Platform
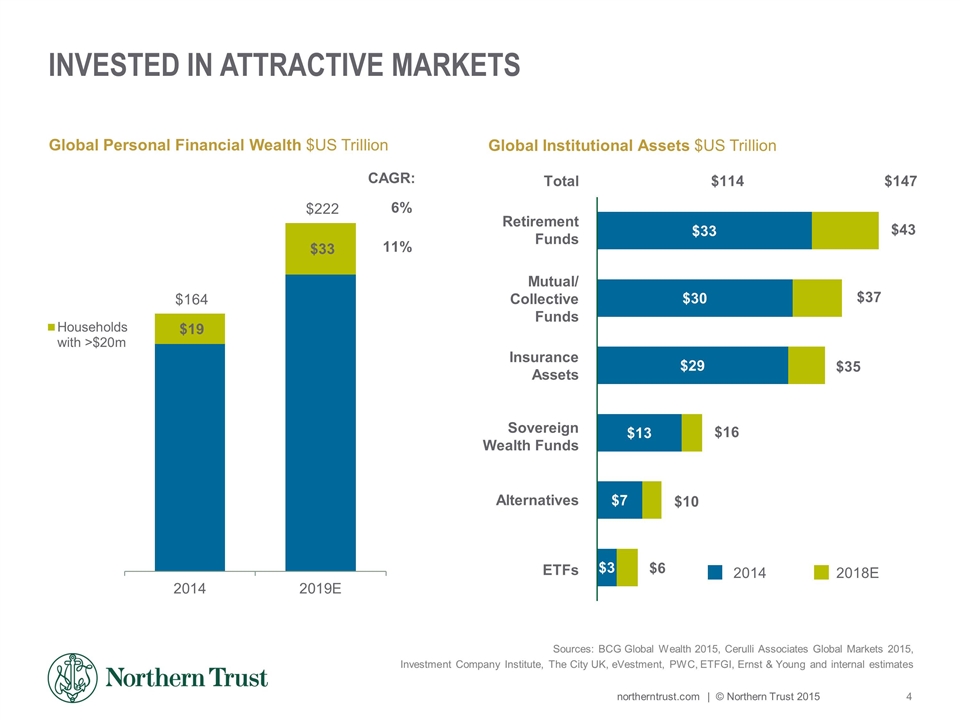
Invested in ATTRACTIVE MARKETS Sources: BCG Global Wealth 2015, Cerulli Associates Global Markets 2015, Investment Company Institute, The City UK, eVestment, PWC, ETFGI, Ernst & Young and internal estimates Global Personal Financial Wealth $US Trillion CAGR: 6% 11% Sovereign Wealth Funds 2014 2018E Total $114 $147 Global Institutional Assets $US Trillion $6 $10 $16 $35 $37 $43
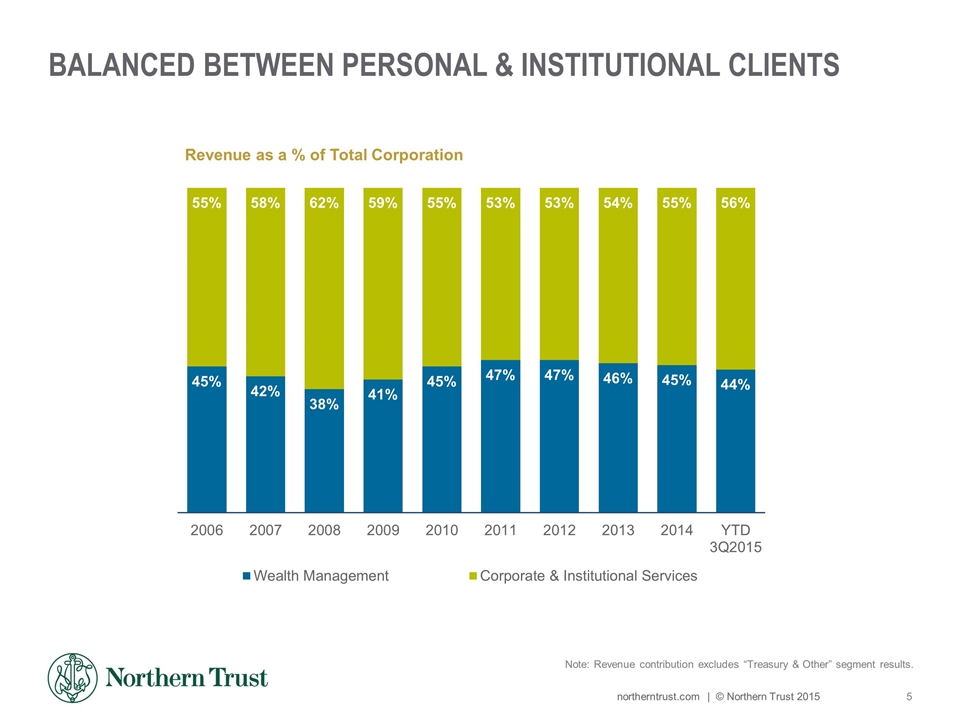
Balanced Between Personal & Institutional Clients Note: Revenue contribution excludes “Treasury & Other” segment results. Revenue as a % of Total Corporation
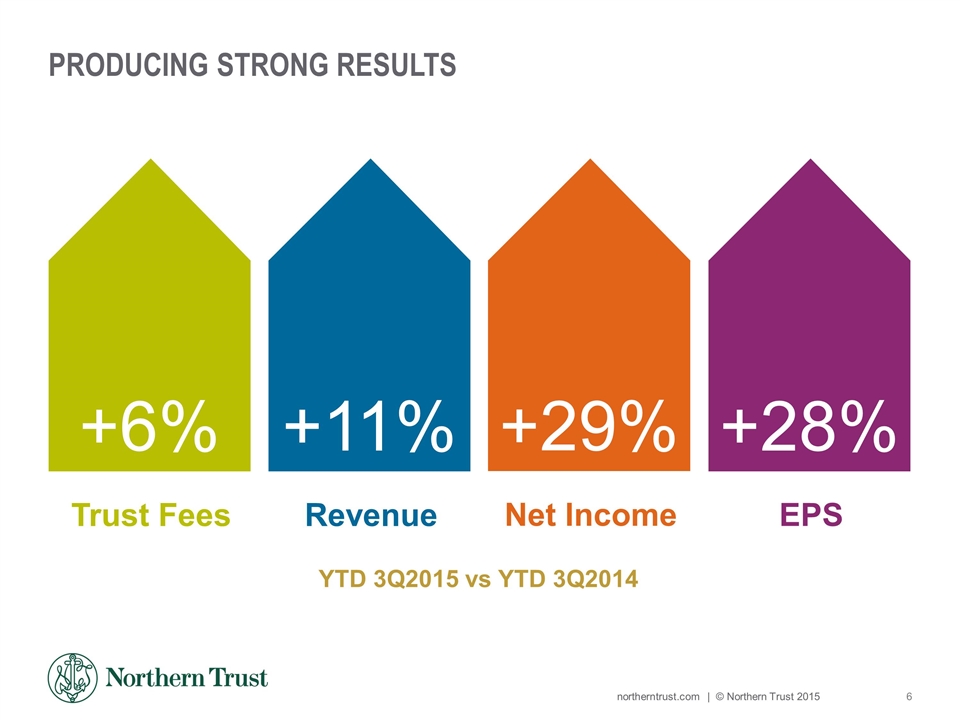
PRODUCING STRONG RESULTS +28% EPS +29% Net Income +11% Revenue +6% Trust Fees YTD 3Q2015 vs YTD 3Q2014
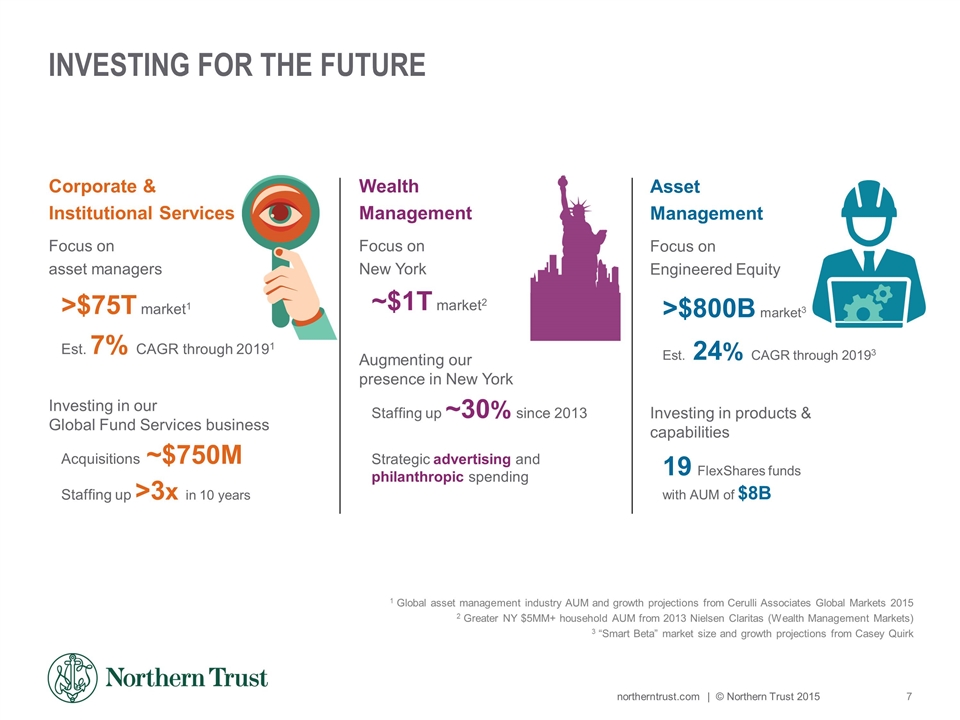
INVESTING FOR THE FUTURE 1 Global asset management industry AUM and growth projections from Cerulli Associates Global Markets 2015 2 Greater NY $5MM+ household AUM from 2013 Nielsen Claritas (Wealth Management Markets) 3 “Smart Beta” market size and growth projections from Casey Quirk Asset Management Focus on Engineered Equity >$800B market3 Est. 24% CAGR through 20193 Investing in products & capabilities 19 FlexShares funds with AUM of $8B Corporate & Institutional Services Focus on asset managers >$75T market1 Est. 7% CAGR through 20191 Investing in our Global Fund Services business Acquisitions ~$750M Staffing up >3x in 10 years Wealth Management Focus on New York ~$1T market2 Augmenting our presence in New York Staffing up ~30% since 2013 Strategic advertising and philanthropic spending
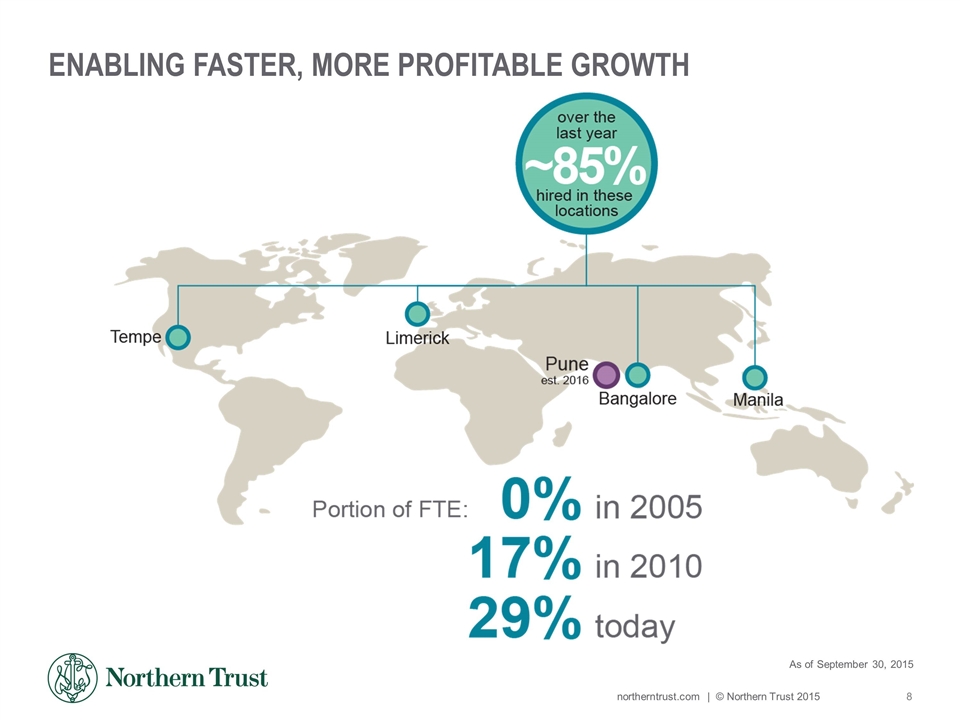
ENABLING FASTER, MORE PROFITABLE GROWTH As of September 30, 2015
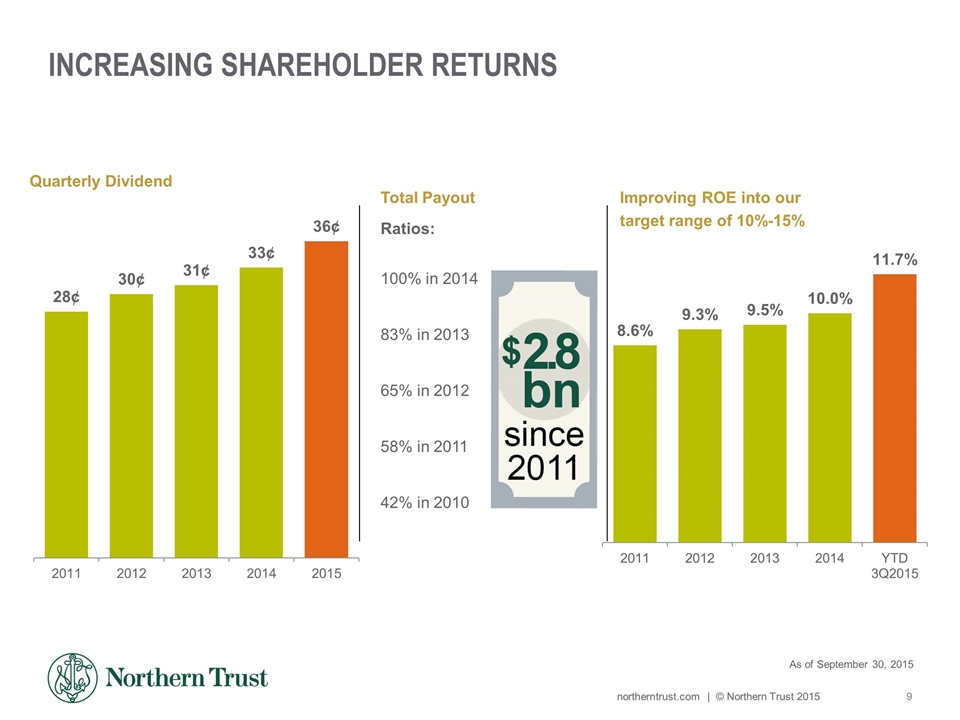
Increasing Shareholder Returns Total Payout Ratios: 100% in 2014 83% in 2013 65% in 2012 58% in 2011 42% in 2010 Improving ROE into our target range of 10%-15% As of September 30, 2015
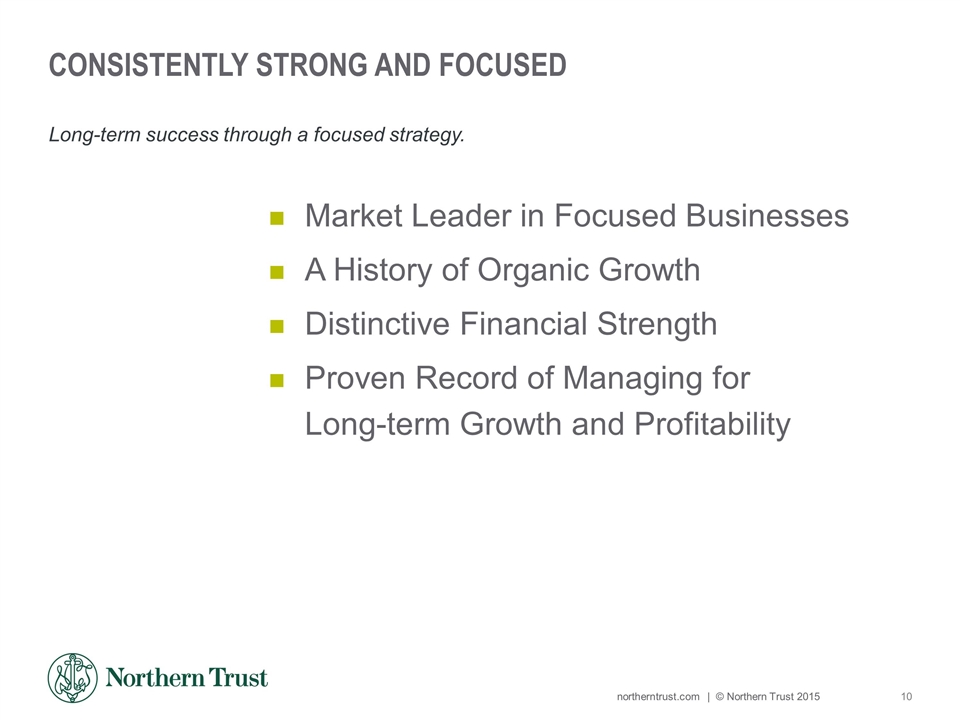
Consistently Strong and Focused Long-term success through a focused strategy. Market Leader in Focused Businesses A History of Organic Growth Distinctive Financial Strength Proven Record of Managing for Long-term Growth and Profitability
