Exhibit 13
A Letter from the President and CEO

To the shareholders of United Bancorp, Inc….
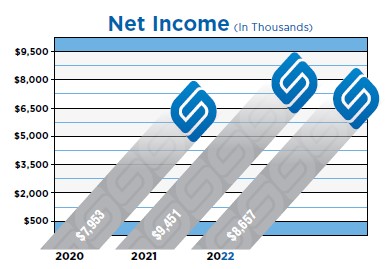
t is with great pleasure that I report to you, our valued shareholders, on the strong earnings and solid operational performance that United Bancorp, Inc. (UBCP) achieved in 2022. This past year, UBCP reported diluted earnings per share of $1.50 and net income of $8,657,000. Even though these reported earnings metrics were lower than the record levels achieved the previous year for each… they were still the second highest levels achieved in our storied company’s history! Worthy of note, this high level of earnings was produced on a more “core” operating basis, since we did not have the level of non-recurring income that we achieved the prior year. By achieving this higher, core-levels of earnings performance in 2022, we are truly grateful considering the dynamic environment in which we continued to operate this past year. In 2022, our country began to put the effects of the pandemic that dominated our existence for the previous two years into the rear-view mirror and our economy began to normalize. Unfortunately, the “corrective actions” necessitated by the pandemic to strengthen our economy during one of the most extreme shocks in our history--- such as the stimulus funding paid to individuals and businesses within our country and the very loose, zero interest rate/ quantitative easing monetary policy under which our central bank operated for the better part of two years--- finally caused our economy to “heat-up.” As a result, we experienced heightening inflation levels and a tightening of our monetary policy that we had not seen in more than forty years. Fortunately, UBCP was properly positioned for such a rapid change in our economy and, once again, had very solid performance with a focus on the future. Going forth, we look forward to confronting the continued challenges with which we are presented and building a better company in the year ahead.
Operating in A Dynamic Environment--- A Sudden, and Unexpected Change in the Direction of Monetary Policy: At the onset of the pandemic in the first quarter of 2020, the Federal Open Market Committee (FOMC) took unprecedented and drastic action that, almost overnight, implemented a Zero Interest Rate Policy (ZIRP) and began increasing large scale asset purchases ((LSAPs) aka: Quantitative Easing) to a level that more than doubled the Feds balance sheet in a relatively short period of time. In addition to this drastic action, fiscal policy injected a tremendous level of stimulus into our economy in the form of monetary payouts to both individuals and businesses in order to counter the negative effect of our economy essentially being shut-down in response to the pandemic. At this unprecedented time, we all feared that the sudden shuttering of our economy would have a cataclysmic effect that had never been experienced prior thereto. Fortunately, this quick response of both accommodating monetary policy and stimulating fiscal policy did, indeed, counter the effects of the shutting down of our economy in response to the pandemic. But, as we all know, too much of a good thing can actually be bad! In this case, too much fiscal stimulus and a prolonged ZIRP/ LSAPs caused inflation to start rearing its ugly head in 2021. Throughout that year, the FOMC coined a new term for this inflation… “transitory.” Quite simply, it was believed that as our economy recovered from the pandemic shutdown, things would normalize as the economy more fully reopened and the supply chain improved. This normalization of our economy, it was thought, would bring stability back to pricing; especially, as demand for goods diminished and services increased, as more people went back to work and as the supply chain functioned more closely to pre-pandemic levels. Therefore, the inflation that we were experiencing in 2021 was initially thought by the FOMC to be temporary or “transitory.”

A Letter from the President and CEO - Continued
With the Federal Open Market Committee’s (FOMC) rationale that inflation would come closer to their longer-term target in the near term and our economy would operate more normally as we entered 2022, it was forecast that large scale asset purchases (LSAPs) would start to curtail sometime in the first quarter and the target for the Federal Funds Rate would increase two to three times in 2022-- by 25 basis points each increase--- beginning at mid-year. Quite simply, the FOMC telegraphed that inflation was under control and they would only need to mildly tighten monetary policy as our economy recovered to pre-pandemic levels. Unfortunately, inflation was not under control and it continued to burn hotter and hotter as we entered 2022 and went into the first quarter. Ultimately, inflation increased to levels that we had not seen for more than forty years… peaking in June 2022 at 9.1 percent. Of greater concern, inflation expectations were no longer anchored and started to go higher. At that point, the FOMC realized that inflation was not “transitory” as previously thought; but, rather, it was a real issue. Getting inflation under control and inflation expectations anchored, once again, became the primary focus of the FOMC. At their March meeting, the FOMC increased the target for the Federal Funds Rate (FF’s) by 25 basis points and began curtailing LSAPs at a faster pace than anticipated. As the inflation rate continued to heat-up, the FOMC got more aggressive with the tightening of monetary policy. At the May meeting, the FOMC increased the target for FF’s by 50 basis points. This action had little impact on taming inflation and inflation expectations. Accordingly, the FOMC had to get even more aggressive with the tightening of monetary policy at future meetings. At the June, July, September and November meetings, the FOMC increased the target for the FF’s rate at each meeting by 75 basis points. Although Inflation was coming down at this point, it was still at levels that caused concern. At the December meeting, the FOMC increased the target for the FF’s rate by another 50 basis points. Over the course of twelve months in 2022, we went from operating in a zero interest-rate environment to one where the target for the FF’s rate increased by 425 basis points. At year-end, the FF’s target rate was a range of 4.25 percent to 4.50 percent. Such aggressive action by the FOMC did start to have an impact on overall inflation and, by the end of the year 2022, even though inflation was still well-above the desired 2.0 percent target of the FOMC, it came down from the mid-year peak of 9.1 percent to a level around 6.5 percent.
The Impact of the Dramatic Change in Monetary Policy on United Bancorp: As the Federal Open Market Committee (FOMC) conducted its all-out assault on inflation in 2022 by raising the target for the federal funds rate (FF’s) at a level that no one anticipated and at a pace that we had not seen for more than forty years, United Bancorp, Inc. (UBCP) faired very well. This extreme rise in interest rates presented opportunities for our Company that we had not seen for a couple of years since the beginning of the pandemic. Fortunately for our Company, we did not purchase any investment securities from the beginning of the pandemic in March 2020 until rates started to increase this past year; therefore, we did not lock into exceedingly low rates at the bottom of the market. Being patient during the pandemic at times was uncomfortable as we horded a large percentage of our earning assets in low-yielding, overnight funding. This patience definitely paid off for our Company in 2022. As the economy more fully recovered and started to heat-up over the course of the past year, we had opportunities in the increasing rate environment to more fully leverage our capital and change the mix of our balance sheet into longer-term, higher-yielding assets and, once again, focus on growing our Company.
With the extreme tightening bias of the Federal Open Market Committee (FOMC) with monetary policy--- which began in the first quarter of 2022--- for the first time in a couple of years we experienced a prime opportunity to invest, once again, in both municipal and agency securities as both intermediate and longer term yields rose to levels that we had not seen for quite some time. As previously mentioned, remaining patient and not investing in any municipal or agency securities since the first quarter of 2020 until this year enabled our Company to change the overall mix of our balance sheet from a more cash-intensive, liquid position to one that is longer-duration and higher yielding. This allowed our Company to more fully leverage its capital by growing assets to a level of $757.4 million, an increase over the previous year of $32.9 million or 4.5 percent. This growth in our total assets was primarily driven by the growth that we experienced in securities, along with minimal growth in our loan portfolio. In 2022, gross loans increased by $6.5 million or 1.4 percent. Overall, UBCP did have acceptable loan origination volume; but, our Company experienced several large payoffs on loans; whereby, the borrowers sold the underlying collateral which secured our loans. Ultimately and for the most part, it was not driven by competitive forces relating to interest rates. Having a higher level of loan payoffs than anticipated was not necessarily a negative occurrence for our Company, since we were able to redeploy these funds at higher yields rather quickly. We achieved most of our growth by investing in both municipal and agency securities in the increasing rate environment in which we operated over the course of this past year. In 2022, UBCP had growth in securities of $71.3 million, or 48.7 percent, over the previous year and finished the year with balances in its securities portfolio of $217.6 million. As we invested in higher yielding loans and securities this past year, our Company saw a corresponding decline in its cash and overnight, lower-yielding investments. In 2022, cash and cash equivalents declined by $52.9 million, or 63.8 percent, to a level of $30.1 million at year-end. With the changing mix of and the added horsepower to our balance sheet in 2022, UBCP saw an increase in the level of interest income that it generated. Until the final three quarters of this past year, our Company had not experienced growth in interest income since the first quarter of 2020 (which was the quarter the pandemic-related slowdown and related Zero Interest Rate Policy (ZIRP) commenced). For the year, interest income increased by $3.0 million or 12 percent.
The rapidly rising interest rate environment in which United Bancorp, Inc. (UBCP) operated in 2022 did, as you would expect, cause interest expense to also increase. But, fortunately, total interest expense did not increase as rapidly as total interest income. In 2022, UBCP saw its level of interest expense increase by $677,000 or 26.1 percent. And, contrary to what you might reason, the level of the

increase in interest expense was not entirely driven by UBCP operating in a higher rate environment. It was also driven by a counterindustry trend achieved by our Company of actually growing deposit totals. In 2022, the total deposits of UBCP increased by $44.8 million, or 7.4 percent, to a level of $649.9 million. Overall, most of this growth occurred in time deposits with lower-cost funding balances (consisting of demand deposits and savings) remaining relatively flat… decreasing by $717,000. At mid-year, management anticipated the Federal Open Market Committee’s (FOMC) more extreme tightening of monetary policy and introduced time deposit pricing that was at the time, above market. Being responsive to the anticipated acceleration of the tightening of monetary policy allowed UBCP to attract in $45.5 million in time deposit balances over the course of the remainder of 2022 (with a majority of this being attracted in the third quarter), which helped our Company to produce the growth in total deposits and control interest expense levels by attracting this retailbased funding when rates were lower earlier in the year.
Although United Bancorp, Inc. (UBCP) experienced higher levels of interest expense in 2022, our Company was able to grow interest income to a greater degree and higher level. Accordingly, UBCP experienced growth in the net interest income that it generated. For the year, net interest income increased from the previous year by $2.3 million, or 10.3 percent, to a level of $24.4 million. Over the course of this past year, UBCP saw its net interest margin go from 3.48 percent to 3.73 percent, an increase of 25 basis points. This increase in the net interest margin and the corresponding increase in net interest income led to the “core” earnings improvement of our Company and offset some of the non-recurring income achieved the previous year, which totaled approximately $1.9 million on a gross basis and added approximately $0.27 to diluted earnings per share in 2021. The major items making-up this non-recurring income the previous year was: $300,000 more in negative provision credits, $100,000 in bank owned life insurance payouts, $225,000 in gains on the sale of real estate and, lastly, $1,250,000 in gains on the sale of securities. Management is very pleased that we were able to overcome the non-recurring income gap in 2022 and generate more earnings on a core operating basis. As previously mentioned, UBCP’s level of net income generated in 2022 was $8,657,000, which was the second highest level ever achieved by our Company outside of our record earnings in 2021. At this level of earnings, UBCP had a return on average assets (ROA) of 1.18% and a return on average equity of 14.74% in 2022, which compares very favorably with our peer group of banks and industry. Management was also extremely happy to report that UBCP, once again, was recognized by American Banker in their annual “Top 200 Publicly Traded Community Banks”, coming in at number 84 which was an improvement of 40 spots over the previous year.
A Letter from the President and CEO - Continued
Relating to the noninterest margin of United Bancorp, Inc. (UBCP) in 2022, our Company did feel pressure relating to the noninterest income that it generated and noninterest expense that it incurred. Each of these metrics were negatively impacted by the fast-paced, rising-rate and strong inflationary environment in which we operated this past year. In 2022, we saw a decline in some of our fee-income related lines of business (primarily, relating to mortgage origination) and, as previously mentioned, the non-recurrence of substantial security gains and other noninterest income realized the previous year. For the year, noninterest income declined by $1.6 million or 28.4 percent. With the rising inflationary pressure under which UBCP operated in 2022, our Company experienced an increase in total noninterest expense of $1.5 million, an increase of 8.1 percent. Most of this increase in noninterest expense is correlated to a higher level of employee related expenses tied to more optimum staffing levels throughout our Company, higher IT-related expense due to the implementation and upgrading of systems to improve our delivery and enhance the overall customer experience, higher wage levels attributed to the tight labor market and incentive payouts. Even though UBCP saw noninterest expenses increase over the course of 2022, our Company did have a focus on achieving cost-savings in appropriate areas. A few of the recent cost-containment initiatives implemented that led to realized savings this past year were… the consolidation of our former banking centers located in both Dillonvale and Amesville, Ohio into other in-market banking centers and the closure of our Loan Production Office in Wheeling, West Virginia. In the coming year, UBCP will continue to focus on containing noninterest expense levels--- while selectively investing in our future in order to more effectively compete and remain relevant--- as the environment in which we operate becomes more challenging.
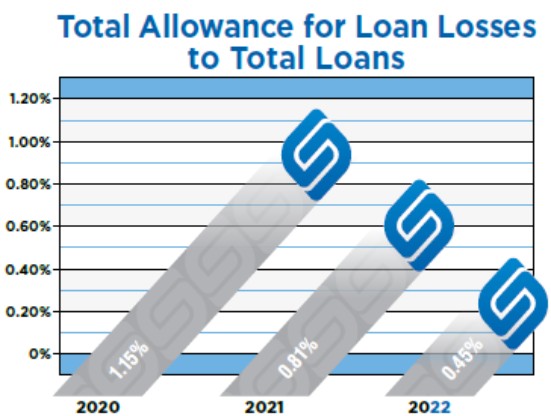
In 2022, we were able to continue successfully maintaining credit related strength and stability within the loan portfolio of United Bancorp, Inc. (UBCP) as our economy continued to more fully recover from the pandemic-induced economic downturn and, even as, borrowers began to feel the pressure of rising interest rates. At year-end, our Company’s total nonaccrual loans were $182,000 or 0.04 percent of total loans. This level of nonaccrual loans was a decline of $4.0 million over the previous year and was primarily the result of the resolution of an issue with a single, non-performing commercial relationship with which our Company had been dealing for the better part of a year. The resolution of this matter did lead to net loans charged off, excluding overdraft charge offs, of $558,000, which was 0.12 percent of total loans and a year-over-year increase of $450,000. Further relating to this matter, other real estate and repossessions (OREO) increased by $3.1 million year-over-year. As of December 31, 2022, nonaccrual loans and OREO to total assets was a very solid 0.49 percent, along with loans past due thirty plus days at a very respectable $425,000 or 0.09 percent of total loans. Regarding accounting related changes being mandated by the Financial Accounting Standards Board (FASB) relating to our industry’s loan loss reserve methodology, our Company has spent the better part of the past two years developing a current expected credit loss (CECL) model and is fully prepared to implement this new loan loss reserve methodology in the first quarter of 2023 in compliance with the new requirements.
| | |
| 3 |
A Letter from the President and CEO - Continued
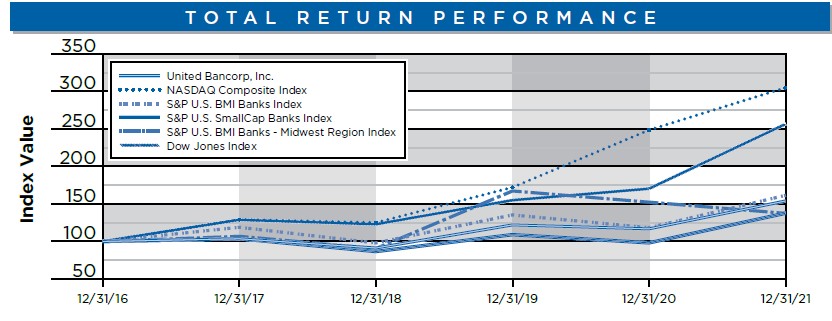
At United Bancorp, Inc. (UBCP), our primary focus is protecting the investment of our valued shareholders in our Company and rewarding you in a balanced fashion by growing your value over time and paying an attractive cash dividend. This past year was a challenging one for the market values of all financial sector stocks and--- even though we had very solid earnings results--- we did see the market value of our Company’s stock decline from the previous year. At year-end, UBCP’s stock closed at $14.72. Once again in 2022, our Company rewarded our shareholders with a very solid dividend payout of $0.775 per share, which was higher than the previous year’s cash dividend payout of $0.685… an increase of $0.09 per share or 13.1 percent. At this dividend payout level and our year-end market value, our dividend yield is a very solid 5.26 percent. In looking at the Total Return Performance Chart in this annual report, the five year total return performance--- which takes into account both market value appreciation and cash dividend payouts--- shows that your investment in UBCP outpaced all of the other bank related indices, to which our Company compares, listed on this chart. As always, our goal is to provide the highest level of return to you, our valued shareholders, while growing our company in a safe and sound manner!
As you can see, United Bancorp, Inc. (UBCP) had one of its most historic years in terms of performance in 2022, while operating in a very dynamic economic and regulatory environment. But… your management team will never be satisfied resting on past performance and laurels. We are strongly focusing on moving forward and achieving our goal of becoming a $1.0 billion community banking organization in, hopefully, the not too distant future. While reaching this goal, we will maintain our commitment to and standard of producing stellar, above peer, performance-related results as we confidently move forward as one of the premier community banks in our industry. UBCP is truly blessed to have a “Unified and United” team, management, board of directors and shareholder group. As a successful financial services company, we truly appreciate everyone’s continued support… Together, We Will Accomplish More!

Scott A. Everson
President and Chief Executive Officer
ceo@unitedbancorp.com
February 19, 2023
Certain statements contained herein are not based on historical facts and are "forward-looking statements" within the meaning of Section 21A of the Securities Exchange Act of 1934. Forward-looking statements, which are based on various assumptions (some of which are beyond the Company's control), may be identified by reference to a future period or periods, or by the use of forward-looking terminology, such as "may," "will," "believe," "expect," "estimate," "anticipate," "continue," or similar terms or variations on those terms, or the negative of these terms. Actual results could differ materially from those set forth in forward-looking statements, due to a variety of factors, including, but not limited to, those related to the economic environment, particularly in the market areas in which the company operates, competitive products and pricing, fiscal and monetary policies of the U.S. Government, changes in government regulations affecting financial institutions, including regulatory fees and capital requirements, changes in prevailing interest rates, acquisitions and the integration of acquired businesses, credit risk management, asset/liability management, changes in the financial and securities markets, including changes with respect to the market value of our financial assets, and the availability of and costs associated with sources of liquidity. The Company undertakes no obligation to update or clarify forward-looking statements, whether as a result of new information, future events or otherwise. |
|

4 |
| |
DIVIDEND AND STOCK HISTORY
| | | | | | | |
|
| | |
| |
| Distribution Date of |
| | Cash Dividends | | Special Cash Dividends | | Dividends and | |
| | Declared (1) | | and Stock Dividends |
| Exchanges | |
1983 |
| $ | 0.05 |
| — |
| — |
1984 |
| $ | 0.06 |
| 4 for 1 Exchange (2) | | January 2, 1984 |
1985 |
| $ | 0.07 |
| — | | — |
1986 |
| $ | 0.09 |
| — | | — |
1987 |
| $ | 0.09 |
| 50% Stock Dividend | | October 2, 1987 |
1988 |
| $ | 0.10 |
| — | | — |
1989 |
| $ | 0.10 |
| — | | — |
1990 |
| $ | 0.11 |
| — | | — |
1991 |
| $ | 0.12 |
| — | | — |
1992 |
| $ | 0.12 |
| 100% Stock Dividend | | September 10, 1992 |
1993 |
| $ | 0.12 |
| 100% Stock Dividend | | November 30, 1993 |
1994 |
| $ | 0.13 |
| 10% Stock Dividend | | September 9, 1994 |
1995 |
| $ | 0.19 |
| — | | — |
1996 |
| $ | 0.20 |
| 10% Stock Dividend | | June 20, 1996 |
1997 |
| $ | 0.23 |
| 10% Stock Dividend | | September 19, 1997 |
1998 |
| $ | 0.26 |
| 5% Stock Dividend | | December 18, 1998 |
1999 |
| $ | 0.30 |
| 5% Stock Dividend | | December 20, 1999 |
2000 |
| $ | 0.31 |
| 5% Stock Dividend | | December 20, 2000 |
2001 |
| $ | 0.32 |
| 5% Stock Dividend | | December 20, 2001 |
2002 |
| $ | 0.33 |
| 5% Stock Dividend | | December 20, 2002 |
2003 |
| $ | 0.35 |
| 10% Stock Dividend | | December 19, 2003 |
2004 |
| $ | 0.39 |
| 10% Stock Dividend | | December 20, 2004 |
2005 |
| $ | 0.43 |
| 10% Stock Dividend | | December 20, 2005 |
2006 |
| $ | 0.48 |
| 10% Stock Dividend | | December 20, 2006 |
2007 |
| $ | 0.52 |
| — | | — |
2008 |
| $ | 0.54 |
| — | | — |
2009 |
| $ | 0.56 |
| — | | — |
2010 |
| $ | 0.56 |
| — | | — |
2011 |
| $ | 0.56 |
| — | | — |
2012 |
| $ | 0.42 |
| — | | — |
2013 |
| $ | 0.29 |
| — | | — |
2014 |
| $ | 0.33 |
| — | | — |
2015 |
| $ | 0.37 |
| 5¢ Per Share Special Dividend | | December 29, 2016 |
2016 |
| $ | 0.42 |
| 5¢ Per Share Special Dividend | | December 29, 2017 |
2017 |
| $ | 0.46 |
| 5¢ Per Share Special Dividend | | December 29, 2018 |
2018 |
| $ | 0.52 |
| 5¢ Per Share Special Dividend | | December 28, 2020 |
2019 |
| $ | 0.545 |
| — | | — |
2020 |
| $ | 0.57 |
| — | | — |
2021 |
| $ | 0.685 |
| 10¢ Per Share Special Dividend | | March 19, 2022 |
2022 | | $ | 0.775 | | 15¢ Per Share Special Dividend | | March 18, 2023 |
| | |
| 5 |
2023 ANTICIPATED DIVIDEND PAYABLE DATES
♦ | First Quarter |
| March 20, 2023 |
| |
| |
♦ | Second Quarter* |
| June 20, 2023 |
| |
| |
♦ | Third Quarter* |
| September 20, 2023 |
| |
| |
♦ | Fourth Quarter* |
| December 20, 2023 |
| |
* | Subject to action by Board of Directors |
| (1) | Adjusted for stock dividends and exchanges. |
| (2) | Formation of United Bancorp, Inc. (UBCP). Unified Bank (formerly The Citizen’s Saving Bank) shareholders received 4 shares of UBCP stock in exchange for 1 share of bank stock. |
| | | | | | | | | | | | |
Index |
| 12/31/17 |
| 12/31/18 |
| 12/31/19 |
| 12/31/20 |
| 12/31/21 |
| 12/31/22 |
United Bancorp, Inc. |
| 100.00 |
| 90.24 |
| 118.27 |
| 113.86 |
| 150.36 |
| 139.28 |
NASDAQ Composite Index |
| 100.00 |
| 97.16 |
| 132.81 |
| 192.47 |
| 235.15 |
| 158.65 |
S&P U.S. BMI Banks Index |
| 100.00 |
| 83.54 |
| 114.74 |
| 100.10 |
| 136.10 |
| 112.89 |
S&P U.S. SmallCap Banks Index |
| 100.00 |
| 83.44 |
| 104.69 |
| 95.08 |
| 132.36 |
| 116.69 |
S&P U.S. BMI Banks - Midwest Region Index |
| 100.00 |
| 85.39 |
| 111.10 |
| 95.52 |
| 126.19 |
| 108.91 |
Dow Jones Index |
| 100.00 |
| 96.52 |
| 120.98 |
| 132.75 |
| 160.55 |
| 149.53 |
6 |
| |

Directors and Officers
DIRECTORS OF UNITED BANCORP, INC. | |||
| | | |
Scott A. Everson1 |
| President & Chief Executive Officer, United Bancorp, Inc. | |
| | Chairman, President & Chief Executive Officer, Unified Bank, Martins Ferry, Ohio | |
| | | |
Gary W. Glessner2 | | CPA & CGMA, Managing Member, Glessner & Associates, PLLC; | |
| | Glessner Wharton Andrews Insurance, LLC; Tiffany’s, LLC; GWA Realty, LLC, | |
| | GW Rentals, LLC; Trustee, Windmill Truckers Center, Inc. | |
| | | |
John M. Hoopingarner, Esq.1,2,3,4 | | Of Counsel, McMahon, DeGulis LLP, Columbus, Cleveland & Cincinnati, Ohio | |
| | | |
Richard L. Riesbeck1,2,3,4 | | Chairman, United Bancorp, Inc.; President, Riesbeck Food Markets, Inc., St. Clairsville, Ohio | |
| | | |
James W. Everson | | Chairman Emeritus 1969 - 2016 | |
OFFICERS OF UNITED BANCORP, INC. | ||
| | |
Scott A. Everson |
| President & Chief Executive Officer |
Matthew F. Branstetter | | Senior Vice President, Chief Operating Officer |
Randall M. Greenwood | | Senior Vice President, Chief Financial Officer, Treasurer & Corporate Secretary |
8 |
| |
| | | | |
DIRECTORS OF UNIFIED BANK | | |||
| | | | |
Erin S. Ball |
| Vice President, Carenbauer Distributing Corporation, Wheeling, West Virginia |
| |
| | | | |
Jonathan C. Clark, Esq. | | Attorney at Law, Lancaster, Ohio | | |
| | | | |
Scott A. Everson1 | | President & Chief Executive Officer, United Bancorp, Inc. | | |
| | Chairman, President & Chief Executive Officer, Unified Bank, Martins Ferry, Ohio | | |
| | | | |
Gary W. Glessner2 | | CPA & CGMA, Managing Member, Glessner & Associates, PLLC; | | |
| | Glessner Wharton Andrews Insurance, LLC; Tiffany’s, LLC; GWA Realty, LLC, | | |
| | GW Rentals, LLC; Trustee, Windmill Truckers Center, Inc. | | |
| | | | |
Brian M. Hendershot | | President, Ohio-West Virginia Excavating, Shadyside, Ohio | | |
| | | | |
John R. Herzig | | President, Toland-Herzig Funeral Homes & Crematory, Strasburg and Dover, Ohio |
| |
| | | | |
John M. Hoopingarner, Esq.1,2 | | Of Counsel, McMahon, DeGulis LLP, Columbus, Cleveland and Cincinnati, Ohio | | |
| | | | |
Richard L. Riesbeck1,2, F | | Chairman, United Bancorp, Inc.; President, Riesbeck Food Markets, Inc., St. Clairsville, Ohio | | |
| | | | |
Bethany E. Schunn | | Plant Manager, Cardinal Operating Company, Brilliant, Ohio | | |
| | | | |
James W. Everson | | Chairman Emeritus 1969 - 2016 | | |
1 = Executive Committee 2 = Audit Committee 3 = Compensation Committee 4 = Nominating and Governance Committee ö = Lead Director | ||||
| ||||
| | |
| 9 |
Bank Past Presidents & Directors
The journey to becoming the institution we are today began in Martins Ferry, Ohio in 1902. Originally founded as The German Savings Bank and renamed to The Citizens Savings Bank in 1918, the last 120 years have seen growth and change that would have been unimaginable at its' founding. The bank has grown through sound management, the addition of new offices and the acquisition of others. With the name change from The Citizens Savings Bank to Unified Bank in 2018, it has and will continue to move forward.
The growth and success of the bank has been attributed to the association of
many dedicated individuals.
PAST PRESIDENTS
Edward E. McCombs, 1902-1936
John E. Reynolds, 1936 – 1940
Harold H. Riethmiller, 1940 – 1973
James W. Everson, 1973 – 2002
Past Board of Directors | |
| |
Edward E. McCombs, 1902-1936* | Dr. Charles D. Messerly, 1957-1987 |
John E. Reynolds, 1902-1940 | James M. Blackford, 1962-1968 |
Dr. Joseph W. Darrah, 1902-1937 | John H. Morgan, 1967-1976 |
J.A. Crossley, 1902-1903 | Emil F. Snyder, 1968-1975 |
William M. Lupton, 1902-1902 | James H. Cook, 1976-1986 |
F.K. Dixon, 1902-1909 | Paul Ochsenbein, 1978-1991 |
Dr. R.H. Wilson, 1902-1905 | David W. Totterdale, 1981-1995 |
Chris A. Heil, 1903-1909 | Albert W. Lash, 1975-1996 |
David Coss, 1904-1938 | Premo R. Funari, 1976-1997 |
L.L. Scheele, 1905-1917 | Donald A. Davison, 1963-1997* |
A.T. Selby, 1906-1954 | Harold W. Price, 1999-1999 |
H.H. Rothermund, 1907-1912 | John H. Clark, Jr., 1976-2001 |
Dr. J.G. Parr, 1912-1930 | Dwain R. Hicks, 1999-2002 |
T.E. Pugh, 1920-1953 | Michael A. Ley, 1999-2002 |
J.J. Weiskircher, 1925-1942 | Michael J. Arciello 1992 - 2009 |
David H. James, 1925-1963 | Leon F. Favede, O.D., 1981-2012 |
Dr. C.B. Messerly, 1931-1957 | Herman E. Borkoski, 1987-2012 |
H.H. Riethmiller, 1936-1980* | James W. Everson, 1969-2014* |
E.M. Nickles, 1938-1968 | Robin L. Rhodes, 2007-2015 |
L.A. Darrah, 1939-1962 | Andrew C. Phillips, 2007-2015 |
R.L. Heslop, 1941-1983 | Errol C. Sambuco, 1996-2015 |
Joseph E. Weiskircher, 1943-1975 | Samuel J. Jones, 2007-2015 |
Edward M. Selby, 1953-1976 | Matthew C. Thomas, 1988-2016 |
David W. Thompson, 1954-1966 | Terry A. McGhee, 2001-2017 |
Carl A Novak, D.D.S., 2018-2021 | |
| |
| * Past Chairman |
10 |
| |
Shareholder Information
United Bancorp, Inc.’s (the Company) common stock trades on The Nasdaq Capital Market tier of The Nasdaq Stock Market under the symbol UBCP, CUSIP #909911109. At year-end 2022, there were 6,043,851 shares issued, held among approximately 3,000 shareholders of record and in street name. The following table sets forth the quarterly high and low closing prices of the Company’s common stock from January 1, 2022 to December 31, 2022 compared to the same periods in 2021 as reported by the NASDAQ.
| | | | | | | | | | | | | | | | | | | |
| | 2022 | | | 2021 | ||||||||||||||
|
| 31-Mar |
| 30-Jun |
| 30-Sep |
| 31-Dec |
|
| 31-Mar |
| 30-Jun |
| 30-Sep |
| 31-Dec | ||
Market Price Range | | | | | | | | | | | | | | | | | | | |
High ($) |
| $ | 18.38 |
| 20.60 |
| 18.04 |
| 16.70 |
| | $ | 15.88 |
| 15.66 |
| 15.79 |
| 16.65 |
Low ($) |
| $ | 16.51 |
| 15.40 |
| 14.99 |
| 14.35 |
| | $ | 12.75 |
| 14.26 |
| 12.90 |
| 14.75 |
| | | | | | | | | | | | | | | | | | | |
Cash Dividends | | | | | | | | | | | | | | | | | | | |
Quarter ($) |
| $ | 0.3025 |
| 0.1550 |
| 0.1575 |
| 0.1600 |
| | $ | 0.2425 |
| 0.1450 |
| 0.1475 |
| 0.1500 |
Cumulative ($) |
| $ | 0.3025 |
| 0.4575 |
| 0.6150 |
| 0.7750 |
| | $ | 0.2425 |
| 0.3875 |
| 0.5350 |
| 0.6850 |
Investor Relations:
A copy of the Company’s Annual Report on form 10-K as filed with the SEC, will be furnished free of charge upon written or E-mail request to:
Randall M. Greenwood, CFO United Bancorp, Inc.
201 South 4th Street PO Box 10
Martins Ferry, OH 43935
or
cfo@unitedbancorp.com
Dividend Reinvestment and Stock Purchase Plan:
Shareholders may elect to reinvest their dividends in additional shares of United Bancorp, Inc.’s common stock through the Company’s Dividend Reinvestment Plan. Shareholders may also invest optional cash payments of up to $5,000 per month in our common stock at market price. To arrange automatic purchase of shares with quarterly dividend proceeds, please contact:
American Stock Transfer
and Trust Company
Attn: Dividend Reinvestment
6201 15th Avenue, 3rd Floor
Brooklyn, NY 11219
1-800-278-4353
Annual Meeting:
The Annual Meeting of Shareholders will be held at 2:00 p.m., April 19, 2023 at the Corporate Offices in Martins Ferry, Ohio.
Internet:
Please look us up at http//:www.unitedbancorp.com
Independent Auditors:
S.R. Snodgrass, P.C.
2009 Mackenzie Way, Suite 340
Cranberry Township, PA 16066
(724) 934 0344
| | |
| 11 |
Corporate Offices:
Unified Bank Building
201 South 4th Street, Martins Ferry, Ohio 43935
Randall M. Greenwood
Corporate Secretary
(888) 275-5566 (EXT 6181)
(740) 633-0445 (EXT 6181)
(740) 633-1448 (FAX)
Transfer Agent and Registrar:
For transfers and general correspondence, please contact:
American Stock Transfer and Trust Company
6201 15th Avenue, 3rd Floor
Brooklyn, NY 11219
1-800-937-5449
Stock Trading:
Raymond James
222 South Riverside Plaza
7th Floor
Chicago, Illinois 60606
Anthony LanFranco
312-655-2961
Stifel, Nicolaus & Company Inc.
6636 Longshore Street
Dublin, Ohio 43017
Steven Jefferis
877-875-9352
Piper | Sandler
Johathan Rooks
1 Greewich Plz
Greewich, CT 06830-6352
212-466-8036
12 |
| |
Management’s Discussion and Analysis
In the following pages, management presents an analysis of United Bancorp, Inc.’s financial condition and results of operations as of and for the year ended December 31, 2022 as compared to prior years. This discussion is designed to provide shareholders with a more comprehensive review of the operating results and financial position than could be obtained from an examination of the financial statements alone. This analysis should be read in conjunction with the Consolidated Financial Statements and related footnotes and the selected financial data included elsewhere in this report.
When used in this discussion or future filings by the Company with the Securities and Exchange Commission, or other public or shareholder communications, or in oral statements made with approval of an authorized executive officer, the words or phrases “will likely result,” “are expected to,” “will continue,” “is anticipated,” “estimate,” “project,” “believe,” or similar expressions are intended to identify “forward-looking statements” within the meaning of the Private Securities Litigation Reform Act of 1995. The Company wishes to caution readers not to place undue reliance on any such forward-looking statements, which speak only as of the date made, and to advise readers that various factors, including regional and national economic conditions, changes in levels of market interest rates, credit risks of lending activities and competitive and regulatory factors, could affect the Company’s financial performance and could cause the Company’s actual results for future periods to differ materially from those anticipated or projected.
The Company is not aware of any trends, events or uncertainties that will have or are reasonably likely to have a material effect on its liquidity, capital resources or operations except as discussed herein. The Company is not aware of any current recommendations by regulatory authorities that would have such effect if implemented.
The Company does not undertake, and specifically disclaims, any obligation to publicly release any revisions that may be made to any forwardlooking statements to reflect occurrence of anticipated or unanticipated events or circumstances after the date of such statements.
| | |
| 13 |
Financial Condition
Overview
We are pleased to report on the earnings performance of our Company for the fourth quarter and for the year 2022. For the quarter ended December 31, 2022, our Company achieved net income of $2,306,000 and diluted earnings per share of $0.40, which were respective decreases of $150,000 and $0.01 over the previous year. For the year ended December 31, 2022, our Company produced net income of $8,657,000 and diluted earnings per share of $1.50, which were both respectively lower than the same period the previous year by $794,000 and $0.12. Impacting our Company’s earnings performance for the most recently ended quarter in comparison to last year is that last year, we had nonrecurring income which included: a gain of $225,000 on the sale of real property owned by our company, a payout on bank owned life insurance of $100,000 and a negative provision for loan losses (or, credit) of $400,000. Even with all of this non-recurring income realized the previous year, which totaled approximately $600,000 or $0.11 per diluted share, our diluted earnings per share for the fourth quarter of 2022 was $0.40, a decline of only $0.01. Similarly, comparing year-ended 2022 to last year, our Company generated more non-recurring income the previous year which led to the decrease in earnings in 2022. Specifically--- and, outside of the aforementioned non-recurring income items--- our Company did not have gains on sale of available-for-sale securities which totaled $1,250,000 the previous year, along with a higher level of negative provisioning from the loan loss reserve of $300,000. Even with this absence of non-recurring income in the most recently completed year, our Company was able to produce its second highest level of both diluted earnings per share and net income in its history which was only lower than the record levels that we achieved the previous year. In 2022, we were able to offset this nonrecurring income realized last year by more fully leveraging of our capital and changing of the mix of our Company’s balance sheet from lower-yielding cash investments into higher-yielding loan and securities investments. With the extreme tightening bias of the Federal Open Market Committee (FOMC) with monetary policy, which began in
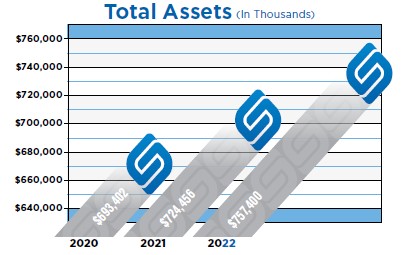
the first quarter of 2022 and became much stronger as the year has progressed (especially over the course of the second six months of the year), we have experienced a prime opportunity to invest, once again, in both municipal and agency securities as both intermediate and longer-term yields have risen to levels that we have not seen for a couple of years. Remaining patient and not investing in any municipal or agency securities since the first quarter of 2020 until this year, we are pleased to have the opportunity that developed this past year, which enabled us to change the overall mix of our balance sheet from a more cash-intensive, liquid position to one that is longer-duration and higher yielding. This allowed our Company to more fully leverage capital by growing total assets as of December 31, 2022 to a level of $757.4 million, an increase over the previous year of $32.9 million or 4.6%. This growth in our total assets was primarily driven by the growth that our Company experienced in securities and other restricted stock, along with minimal growth in its loan portfolio. As of December 31, 2022, gross loans increased by $6.5 million, or 1.4%, over the previous year to a level of $460.9 million. Overall, our Company did have acceptable origination volume; but, we experienced several large payoffs on loans whereby the borrowers sold the underlying collateral securing said loans. This was not necessarily bad, since it allowed us to redeploy most of these funds at higher yields. Regarding securities and other restricted stock, we saw our balances increase year-overyear by $71.3 million, or 48.7%, to a level of $217.6 million. Of significance is the quarter-ending balances for securities and other restricted stock are at higher levels than the quarterly average by $31.0 million. With the changing mix of and added horsepower to our balance sheet in 2022, we saw an increase in the level of interest income that we generated. Until the final three quarters of 2022, our Company had not experienced growth in interest income since the first quarter of 2020 (which was the quarter the pandemic-related slowdown and related Zero Interest Rate Policy commenced). For the most recently ended quarter, interest income increased by $1.8 million, or 28.8%, which was higher on a percentage basis than the increase in interest income for the entire year of 2022, which was $3.0 million or 12.0%. We believe that we will continue to see improvement in the level of interest income that we will generate in the coming quarters.
14 |
| |
Considering the increase in the level of interest income that we generated and the less significant increase in our total interest expense in the fourth quarter ended December 31, 2022, our Company experienced an increase in the net interest income that it realized during the quarter of $905,000 or 16.2%. For the year 2022, net interest income increased by $2.3 million or 10.3%. The acceleration of the net interest income on a percentage basis in this most recently ended quarter and the increase thereof that we achieved this past year are attributable to our overall success in managing interest expense, even though our Company experienced growth in total deposits of $44.8 million, or 7.4%, year-over-year and operated in an extreme rising rate environment. Due to both volume and rate, our interest expense increased in the most recently ended quarter by $865,000 from the previous year. As with most financial institutions, we saw our interest expense levels accelerate over the course of the year with the FOMC’s aggressive tightening of monetary policy the most extreme that we have seen in more than forty years. As we enter the new year, we believe that the increase in the level of the interest income that we realize will outpace the degree to which interest expense rises; thus, continuing the positive trend relating to the improvement in the level of net interest income that our Company realizes; although, at lower levels than achieved in 2022. Contributing to this anticipated improvement is the level of fixed rate, term deposits that we successfully attracted early in the third quarter at reasonably priced levels relative to current rates. Attracting this fixed rate, term funding very early in the tightening cycle at reasonable pricing levels should afford our Company the ability to not be as price competitive for term funding as rates continue to increase. At year-end 2022, total deposits were $649.9 million. Of the aforementioned growth in total deposits year-over-year, $45.5 million was achieved in term funding, as mentioned, at very competitive rates compared to the current environment. As of December 31, 2022, on a year-over-year basis we saw our net interest margin increase by nineteen basis points from 3.48% to 3.73%.
Over the course of 2022, our Company’s bottom-line net income was impacted by the strong inflationary and corresponding fast-paced, rising-rate environment in which we operated. As of December 31, 2022, the decline in some of our fee-income related lines of business (primarily relating to mortgage origination) and, as previously mentioned, the nonrecurrence of substantial security gains and other income realized the previous year strongly influenced the decrease in the level of non-interest income that our Company realized in 2022. At year-end, noninterest income declined by $1.6 million or 28.4%. With the strong inflationary pressures under which we operated this past year, our Company experienced an increase in total noninterest expense. In 2022, total noninterest expense increased by $1.5 million or 8.2%. Most of this increase in non-interest expense is correlated to a higher level of employee-related expenses tied to more optimum staffing levels throughout our company, higher IT-related expense due to our investment in our future and higher customer utilization, higher wage levels attributed to the tight labor market and incentive payouts. Even though our Company saw non-interest expense increase over the course of the past twelve months, we did have a focus on achieving cost savings in appropriate areas. A few of the recent cost containment initiatives implemented by our Company that led to cost savings this past year were the consolidation of our former banking centers located in both Dillonvale and Amesville, Ohio into other in-market banking centers and the closure of our Loan Production Office in Wheeling, West Virginia. We will continue to focus on containing noninterest expense levels throughout our Company while selectively investing in our future as the environment in which we operate becomes more challenging.
| | |
| 15 |
We have successfully maintained credit-related strength and stability within our loan portfolio over the course of the past two years during the pandemic-induced economic downturn and this trend continued for our Company this past year. At December 31, 2022, our total non-accrual loans were $182,000 or 0.04% of total loans. This level of non-accrual loans was a decline of $4.0 million over the previous year as we resolved an issue with a non-performing commercial relationship that we previously disclosed. The resolution of this matter did lead to net loans charged off, excluding overdraft charge offs, of $558,000, which was 0.12% of average loans, a year-over-year increase of $450,000. In addition, other real estate and repossession (OREO) increased by $3.1 million year-over-year. At yearend, nonaccrual loans and OREO to total assets was a very solid 0.49%, along with loans past due 30+ days at $425,000 or 0.09% of total loans. As of December 31, 2022, our Company continues to be well capitalized with equity to assets of 7.9% and total shareholders’ equity of $59.7 million. As with most financial institutions in this time of rapidly rising rates from a zero-interest rate environment, our Company did see a reduction in total shareholder’s equity. This reduction is primarily attributed to an accumulated other comprehensive income (AOCI) adjustment related to current losses within our securities portfolio. At the most recent year-end, total shareholder’s equity was reduced by an accumulated other accumulated loss, net of tax benefits of $9.3 million. Accordingly, we saw our book value decline on a year-over-year basis.
As the economy more fully recovered and started to heatup over the course of this past year, we saw opportunities to more fully leverage our capital and change the mix of our balance sheet into longer-term, higher-yielding assets and, once again, focus on growing our Company. Even though the Federal Open Market Committee (FOMC) of the Federal Reserve aggressively raised the target rate for federal funds in 2022, we were able to rebalance and grow our balance sheet which produced positive operating results for our Company. During each quarter of this past year, we saw an increase in the level of net interest income that our Company generated after not experiencing this for several quarters after the commencement of the economic slowdown related to the pandemic. With the change in the mix of our balance sheet into higher yielding assets, we continued to see our net interest margin increase in a positive fashion over the course of the year. In addition, by investing in municipal securities and having higher balances in these tax-exempt investments for the first time in a couple of years, we saw greater tax efficiency which should continue going forward and provide additional benefit to our bottom-line. Like almost every other financial services organization in today’s rapidly rising interest rate environment, our Company does have an accumulated other comprehensive loss primarily attributed to its investment portfolio, which continued to have an impact on our reported capital levels. Ultimately, our Company is considered to be well capitalized and this does not have an impact on regulatory capital at the bank-level. Our growth goal for our Company remains to increase our total assets to a level of $1.0 billion or greater in the short to intermediate term. This will be a challenge for us as rates are rapidly increasing and there are signs that our economy is now slowing as the FOMC fights off heightened inflation. With the higher costs with which we are presently confronted due to inflation and expenses related to achieving the growth that we seek, we have seen some increase in our overhead expenses. But, we firmly believe that we are doing the things necessary for us to remain relevant in these ever-changing times and will see a positive return on our investments, which will help us to achieve greater efficiencies and better returns as we execute on our strategy for growth.
Our primary focus is protecting the investment of our shareholders in our Company and rewarding them in a balanced fashion by growing their value and paying an attractive cash dividend. In these areas, our shareholders have been nicely rewarded with a year-over-year increase in cash dividends paid of $0.09, or 13.1%, which is inclusive of a special cash dividend of $0.15 paid in the first quarter. Even though our Company and industry have been through a couple of challenging years from an operating perspective due to the pandemic, we are now fully looking forward and focusing on growing and building a better, more profitable company. In the short-term, there is clearly a threat that the FOMC could overcorrect by raising rates too quickly and highly; thus, having a negative impact on our economy by pushing it into a recessionary state. We are hopeful that this does not occur and obstruct our vision for growth. As always, we are highly optimistic about the potential of our Company. Over the last couple of years, we have become more efficient and better at delivering our products and services in a fashion demanded by our evolving markets. We will continue to build upon our solid
16 |
| |
foundation and have a longer-term vision. With a keen focus on continual process improvement, product development and delivery, we firmly believe the future for our Company is very bright. This past year our Company achieved solid performance and produced the second highest level of net income in our history, which produced a return on assets (ROA) of 1.18% and return on equity (ROE) of 14.7%. Once again, this past year our Company was recognized by American Banker in their annual “Top 200 Publicly Traded Community Banks”, coming in at 84. This accomplishment during exceedingly challenging times makes us extremely proud of what we are achieving at United Bancorp, Inc.
Earning Assets - Loans
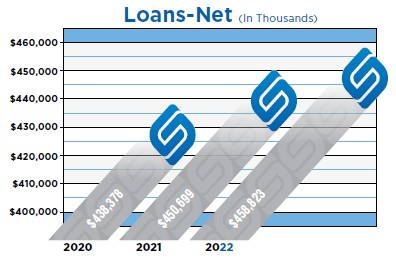
The Company’s gross loans totaled $460.9 million at December 31, 2022, representing a $6.5 million, or 1.43%, increase over the $454.4 million at December 31, 2021. Average loans totaled $462.7 million for 2022, representing a 2.42% increase compared to average loans of $451.8 million for 2021.
The increase in gross loans from December 31, 2021 to December 31, 2022 was primarily an increase in commercial real estate by $3.5 million and residential real estate by $3.9 million.
The Company's commercial and commercial real estate loan portfolio represents 78.3% of the total portfolio at December 31, 2022 compared to 78.7% at December 31, 2021. The Company’s commercial and commercial real estate loans increased approximately $3.2 million from December 31, 2021 to December 31, 2022. We utilize all the SBA, Ohio Department of Development and State of Ohio loan programs as well as local revolving loan funds to best fit the needs of our customers.
The Company’s installment lending portfolio represented 1.3% of the total portfolio at December 31, 2022, compared to 1.5% at December 31, 2021. Competition for installment loans principally comes from the captive finance companies offering low to zero percent financing for extended terms.
The Company’s residential real estate portfolio represents 20.4% of the total portfolio at December 31, 2022, compared to 19.8% at December 31, 2021. Residential real estate loans are comprised of 1-, 3-, and 5-year adjustable-rate mortgages and 15-year fixed rate loans used to finance 1-4 family units. The Company also offers fixed-rate real estate loans through our Secondary Market Real Estate Mortgage Program. Once these fixed-rate loans are originated and immediately sold without recourse in what is referred to as the secondary market, the Company does not assume credit risk or interest rate risk in this portfolio. This arrangement is quite common in banks and saves our customers from looking elsewhere for their home financing needs.
The Company did recognize a gain on the sale of secondary market loans of $36,000 in 2022 and a gain of $272,000 in
2021.
The allowance for loan losses represents the amount which management and the Board of Directors estimates is adequate to provide for probable incurred losses in the loan portfolio. Accounting for the allowance and the related provision for loan losses is viewed by management as a critical accounting policy. The allowance balance and the annual provision charged to expense are reviewed by management and the Board of Directors on a monthly basis. The allowance calculation is determined by utilizing a risk grading model that considers borrowers’ past due experience, coverage ratio to industry averages, economic conditions and various other circumstances that are subject to change over time. In general, the loan loss policy for installment loans requires a charge-off if the
| | |
| 17 |
loan reaches 120-day delinquent status or if notice of bankruptcy liquidation is received. The Company follows lending policies, with established criteria for determining the repayment capacity of borrowers, requirements for down payments and current market appraisals or other valuations of collateral when loans are originated. Installment lending also utilizes credit scoring to help in the determination of credit quality and pricing.
The Company generally recognizes interest income on the accrual basis, except for certain loans which are placed on non-accrual status, when in the opinion of management; doubt exists as to collection on the loan. The Company’s policy is to generally place loans greater than 90 days past due on non-accrual status unless the loan is both well secured and in the process of collection. When a loan is placed on non-accrual status, interest income may be recognized on a cash basis as payment is received if the loan is well secured. If the loan is not deemed well secured, payments are credited to principal.
Management and the Board of Directors believe the current balance of the allowance for loan losses is sufficient to cover probable incurred losses. Refer to the Provision for Loan Losses section for further discussion on the Company’s credit quality.
Earning Assets – Securities and Federal Funds Sold
The securities portfolio is comprised of U.S. Government agency-backed securities, tax-exempt obligations of state and political subdivisions and certain other investments. Securities available for sale at December 31, 2022 increased approximately $71.3 million from December 31, 2021 totals. To take advantage of a favorable yield curve on state and municipal obligation, the Company sold certain availablefor-sale securities for a total gain of approximately $1.3 million during 2021.
Sources of Funds – Deposits
The Company’s primary source of funds is retail core deposits from individuals and business customers. These core deposits include all categories of time deposits, excluding certificates of deposit greater than $250,000. Total deposits increased $44.8 million, or 7.4%, from $605.1 million at December 31, 2021 to $649.9 million at December 31, 2022. Overall total deposit growth was mainly focused on non-interest and certificate of deposit accounts.
The Company has a strong deposit base from public agencies, including local school districts, city and township municipalities, public works facilities and others, which may tend to be more seasonal in nature resulting from the receipt and disbursement of state and federal grants. These entities have maintained relatively stable balances with the Company due to various funding and disbursement timeframes.
Certificates of deposit greater than $250,000 are not considered part of core deposits and, as such, are used to balance rate sensitivity as a tool of funds management. Certificates of deposit greater than $250,000 increased $6.9 million, from $4.4 million at December 31, 2021, to $11.3 million at December 31, 2022.
Sources of Funds – Securities Sold Under Agreements to Repurchase and Other Borrowed Funds Other interest-bearing liabilities include securities sold under agreements to repurchase, and Federal Home Loan Bank (“FHLB”) advances. Securities sold under agreements to repurchase increased approximately $2.4 million from December 31, 2021 to December 31, 2022. Securities sold under agreements to repurchase totaled $18.1 million and $15.7 million at December 31, 2022 and 2021, respectively.
On May 14, 2019 the Company issued $20,000,000 of junior subordinated debentures in denominations of not less than $250,000. The debentures bear interest at a fixed rate of 6.0% until May 2024, which then becomes a floating interest rate equal to the three-month LIBOR (or an equivalent index) plus 3.625%, resetting quarterly. Interest on the subordinated notes will be payable semiannually through May 2024 and quarterly thereafter through the maturity date of May 2029. Principal is due upon maturity. The debentures are unsecured and payable to various investors. For purposes of computing regulatory capital, the debentures are included in Tier 2 Capital. The subordinated notes may not be repaid in whole or in part prior to the fifth anniversary of the issue date (May 2019).
Performance Overview 2022 to 2021
Net Income
The Company reported basic and diluted earnings per share of $1.50 and net income of $8,657,000 for the year ended December 31, 2022, a decrease of $794,000, or 8.4%, over net income of $9,451,000 for the year ended December 31, 2021.
Net Interest Income
Net interest income, by definition, is the difference between interest income generated on interest-earning assets and the interest expense incurred on interest-bearing liabilities. Various factors contribute to changes in net interest income, including volumes, interest rates
18 |
| |
and the composition or mix of interest-earning assets in relation to interest-bearing liabilities. Comparing the year ended December 31, 2022 to 2021, the Company’s net interest margin was 3.73% compared to 3.48%, an increase of 19 basis points.
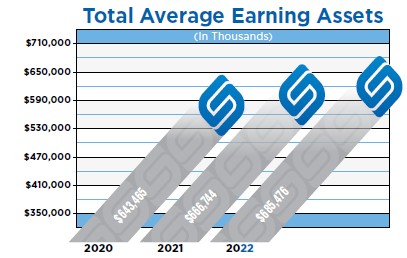
Average interest-earning assets increased $18.7 million in 2022 as compared to 2021 while the associated weightedaverage yield on these interest-earning assets increased from 3.87% in 2021 to 4.21% for 2022. Average interestbearing liabilities increased $18.0 million in 2022 as compared to 2021, while the associated weighted-average costs on these interest-bearing liabilities decreased from
0.52% in 2021 to 0.63% in 2022. Refer to the sections on Asset and Liability Management and Sensitivity to Market Risks and Average Balances, Net Interest Income and Yields Earned and Rates Paid elsewhere herein for further information.
Provision For Loan Losses
The provision or credit for loan losses is a charge or credit to expense recorded to maintain the related balance sheet allowance for loan losses at an amount considered adequate by Management and the Board of Directors to cover probable incurred losses in the portfolio. In 2022 the Company released $955,000 in credit reserves as compared to a $1,255,000 credit release in 2021.
At December 31, 2022, our total non-accrual loans were $182,000 or 0.04% of total loans. This level of non-accrual loans was a decline of $4.0 million over the previous year as we resolved an issue with a non-performing commercial relationship that we previously disclosed. The resolution of
this matter did lead to net loans charged off, excluding overdraft charge offs, of $558,000, which was 0.12% of average loans, a year-over-year increase of $450,000. In addition, other real estate and repossession (OREO) increased by $3.1 million year-over-year. At year-end, nonaccrual loans and OREO to total assets was a very solid 0.49%, along with loans past due 30+ days at $425,000 or 0.09% of total loans.
Noninterest Income
Total noninterest income is made up of bank-related fees and service charges, as well as other income-producing services, sales of loans in the secondary market, ATM income, early-redemption penalties for certificates of deposit, safe deposit rental income, deposit service fees, earnings on bank-owned life insurance and other miscellaneous items.
Noninterest income for the year ended December 31, 2022 was $4.1 million, a decrease of $1.6 million, compared to $5.7 million for the year ended December 31, 2021. The main driver of this decrease was the $1.3 million gain recognized on the sale of available-for- sale securities in 2021.
Noninterest Expense
With the strong inflationary pressures under which we operated this past year, our Company experienced an increase in total noninterest expense. In 2022, total noninterest expense increased by $1.5 million or 8.2%. Most of this increase in non-interest expense is correlated to a higher level of employee-related expenses tied to more optimum staffing levels throughout our company, higher IT-related expense due to our investment in our future and higher customer utilization, higher wage levels attributed to the tight
| | |
| 19 |
labor market and incentive payouts. Even though our Company saw non-interest expense increase over the course of the past twelve months, we did have a focus on achieving cost savings in appropriate areas.
Income tax expense for 2022 was $879,000 compared to $1,230,000 in 2021, a decrease of $351,000. The Company’s effective income tax rate was 9.2% in 2022 and 11.5% in 2021. Refer to Note 9 Income Taxes for a reconciliation of the effective tax rate for the Company.
20 |
| |
Asset/Liability Management and \Sensitivity to Market Risks
In the environment of changing business cycles, interest rate fluctuations and growing competition, it has become increasingly difficult for banks to produce adequate earnings on a consistent basis. Although management can anticipate changes in interest rates, it is not possible to
| | | | | | |
(In thousands) |
| 2022 |
| 2021 | ||
Noninterest income | | | | | | |
Customer service fees |
| $ | 2,978 |
| $ | 2,852 |
Gains on sales of loans | | | 36 | | | 272 |
Earnings on bank-owned life insurance | | | 708 | | | 802 |
Realized gains on available-for-sale securities | | | — | | | 1,250 |
Other income | | | 361 | | | 530 |
Total noninterest income |
| $ | 4,083 |
| $ | 5,706 |
| | | | | | |
Noninterest expense | | | | | | |
Salaries and employee benefits |
| $ | 10,305 |
| $ | 9,698 |
Occupancy and equipment | | | 2,217 | | | 2,364 |
Professional services | | | 1,451 | | | 1,217 |
Insurance | | | 568 | | | 531 |
Deposit insurance premiums | | | 198 | | | 195 |
Franchise and other taxes | | | 562 | | | 551 |
Marketing expense | | | 346 | | | 380 |
Printing and office supplies | | | 110 | | | 115 |
Amortization of intangibles | | | 150 | | | 150 |
Other expenses | | | 3,983 | | | 3,191 |
Total noninterest expense |
| $ | 19,890 |
| $ | 18,392 |
reliably predict the magnitude of interest rate changes. As a result, the Company must establish a sound asset/liability management policy, which will minimize exposure to interest rate risk while maintaining an acceptable interest rate spread and insuring adequate liquidity.
The principal goal of asset/liability management – earnings management – can be accomplished by establishing decision processes and control procedures for all bank assets and liabilities. Thus, the full scope of asset/liability management encompasses the entire balance sheet of the Company. The broader principal components of asset/ liability management include, but are not limited to liquidity planning, capital planning, gap management and spread management.
By definition, liquidity is measured by the Company’s ability to raise cash at a reasonable cost or with a minimum amount of loss. Liquidity planning is necessary so the Company will be capable of funding all obligations to its customers at all times, from meeting their immediate cash withdrawal requirements to fulfilling their short-term credit needs.
Capital planning is an essential portion of asset/liability management, as capital is a limited Bank resource, which, due to minimum capital requirements, can place possible restraints on Bank growth. Capital planning refers to maintaining capital standards through effective growth management, dividend policies and asset/liability strategies.
Gap is defined as the dollar difference between rate sensitive assets and rate sensitive liabilities with respect to a specified time frame. A gap has three components – the asset component, the liability component, and the time component. Gap management involves the management of all three components.
Gap management is defined as those actions taken to measure and match rate-sensitive assets to rate-sensitive liabilities. A rate-sensitive asset is any interest-earning asset, which can be repriced to a market rate in a given time frame. Similarly, a rate-sensitive liability is any interestbearing liability, which can have its interest rate changed to a market rate during the specified time period. Caps, collars and prepayment penalties may prevent certain loans and securities from adjusting to the market rate.
A negative gap is created when rate-sensitive liabilities exceed rate-sensitive assets and, conversely, a positive gap occurs when rate-sensitive assets exceed rate-sensitive liabilities. Generally, a negative gap position will cause profits to decline in a rising interest rate environment and cause profits to increase in a falling interest rate environment. Conversely, a positive gap will cause profits to decline in a falling interest rate environment and increase is a rising interest rate environment. The Company’s goal is to have acceptable profits under any interest rate environment. To avoid volatile profits as a result of interest rate fluctuations, the Company attempts to match
| | |
| 21 |
interest rate sensitivities. The Company achieves this by pricing both the asset and liability components to yield a sufficient interest rate spread, so that profits will remain relatively consistent across interest rate cycles.
Management of the income statement is called spread management and is defined as managing investments, loans, and liabilities to achieve an acceptable spread between the Company’s return on its earning assets and its cost of funds. Gap management without consideration of interest spread can cause unacceptably low profit margins. Spread management without consideration of gap positions can cause acceptable profits in some interest rate environments and unacceptable profits in others. A sound asset/liability management program combines gap and spread management into a single cohesive system.
Management measures the Company’s interest rate risk by computing estimated changes in net interest income and the Net Portfolio Value (“NPV”) of its cash flows from assets, liabilities and off-balance-sheet items in the event of a range of assumed changes in market interest rates. The Bank’s senior management and the Executive Committee of the Board of Directors, comprising the Asset/Liability Committee (“ALCO”), review the exposure to interest rates monthly. Exposure to interest rate risk is measured with the use of an interest rate sensitivity analysis to determine the change in NPV in the event of hypothetical changes in interest rates, while interest rate sensitivity gap analysis is used to determine the repricing characteristics of the assets and liabilities.
NPV represents the market value of portfolio equity and is equal to the market value of assets minus the market value of liabilities, with adjustments made for off-balance-sheet items.
Computations of prospective effects of hypothetical interest rate changes are based on numerous assumptions, including relative levels of market interest rates, loan prepayments and deposit decay rates, and should not be relied upon as indicative of actual results. Further, the computations do not contemplate any actions the Company may undertake in response to changes in interest rates. The NPV calculation is based on the net present value of discounted cash flows utilizing market prepayment assumptions and market rates of interest provided by surveys performed during each quarterly period, with adjustments made to reflect the shift in the Treasury yield curve between the survey date and quarter-end date. Certain shortcomings are inherent in this method of analysis presented in the computation of estimated NPV. Certain assets such as adjustable-rate loans have features that restrict changes in interest rates on a short-term basis and over the life of the asset. In addition, the portion of adjustable-rate loans in the Company’s portfolio could decrease in future periods if market interest rates remain at or decrease below current levels due to refinancing activity. Further, in the event of a change in interest rates, prepayment and early withdrawal levels would likely deviate from those assumed in the table. Finally, the ability of many borrowers to repay their adjustable-rate debt may decrease in the case of an increase in interest rates.
The following tables present an analysis of the potential sensitivity of the Company’s net present value of its financial instruments to sudden and sustained changes in the prevailing interest rates.
| | | | | | | |
(Dollars in Thousands) |
| ||||||
Net Portfolio Value - December 31, 2022 |
| ||||||
Change in Rates |
| $ Amount |
| $ Change |
| % Change |
|
+200 |
| 176,852 |
| 1,133 |
| 1 | % |
+100 |
| 177,236 |
| 1,517 |
| 1 | % |
Base |
| 175,719 |
| — |
| — | |
-100 |
| 170,591 |
| (5,128) |
| (3) | % |
-200 | | 159,361 | | (16,358) | | (9) | |
| | | | | | | |
(Dollars in Thousands) |
| ||||||
Net Portfolio Value - December 31, 2021 |
| ||||||
Change in Rates |
| $ Amount |
| $ Change |
| % Change |
|
+200 |
| 184,334 |
| 18,563 |
| 12 | % |
+100 |
| 165,771 |
| 10,675 |
| 7 | % |
Base |
| 155,096 |
| — |
| — | |
-100 |
| 138,685 |
| (16,411) |
| (11) | % |
The projected volatility of the net present value at both December 31, 2022 and 2021 fall within the general guidelines established by the Board of Directors. The 2022 NPV table shows that in a falling interest rate environment, in the event of a 100 basis point change, the NPV would decrease 3%. In the event of a 200 basis point change. The NPV would decrease 9%.
In an upward change in interest rates, the Company’s NPV would increase 1% with a 100 basis point interest rate increase. In a 200 basis point rate increase, the Company’s NPV would also increase 1%.
22 |
| |
The following table is a summary of selected quarterly results of operations for the years ended December 31, 2022 and 2021.
| | | | | | | | | | | | |
| | Three Months Ended | ||||||||||
| | March 31 |
| June 30 |
| September 30 |
| December 31 | ||||
| | (In thousands, except per share data) | ||||||||||
| | 2022 | ||||||||||
Total interest income |
| $ | 5,997 |
| $ | 6,445 |
| $ | 7,297 |
| $ | 7,922 |
Total interest expense | | | 487 | | | 477 | | | 928 | | | 1,381 |
| | | | | | | | | | | | |
Net interest income | | | 5,510 | | | 5,968 | | | 6,369 | | | 6,541 |
| | | | | | | | | | | | |
Provision for losses on loans | | | (500) | | | (485) | | | 15 | | | 15 |
Other income | | | 987 | | | 988 | | | 1,043 | | | 1,065 |
General, administrative and other expense | | | 5,110 | | | 4,849 | | | 4,879 | | | 5,052 |
| | | | | | | | | | | | |
Income before income taxes | | | 1,887 | | | 2,592 | | | 2,518 | | | 2,539 |
Federal income taxes | | | 136 | | | 295 | | | 215 | | | 233 |
| | | | | | | | | | | | |
Net income |
| $ | 1,751 |
| $ | 2,297 |
| $ | 2,303 |
| $ | 2,306 |
| | | | | | | | | | | | |
Earnings per share | | | | | | | | | | | | |
Basic |
| $ | 0.30 |
| $ | 0.40 |
| $ | 0.40 |
| $ | 0.40 |
Diluted |
| $ | 0.30 |
| $ | 0.40 |
| $ | 0.40 |
| $ | 0.40 |
| | | | | | | | | | | | |
|
| Three Months Ended | ||||||||||
| | March 31 |
| June 30 | �� | September 30 |
| December 31 | ||||
| | (In thousands, except per share data) | ||||||||||
|
| 2021 | ||||||||||
Total interest income |
| $ | 6,088 |
| $ | 6,233 |
| $ | 6,234 |
| $ | 6,153 |
Total interest expense | | | 775 | | | 676 | | | 629 | | | 516 |
| | | | | | | | | | | | |
Net interest income | | | 5,313 | | | 5,557 | | | 5,605 | | | 5,637 |
(Credit) Provision for losses on loans | | | (205) | | | (250) | | | (400) | | | (400) |
Other income | | | 926 | | | 1,142 | | | 2,287 | | | 1,351 |
General, administrative and other expense | | | | | | | | | | | | |
| | | 4,449 | | | 4,550 | | | 4,942 | | | 4,451 |
| | | | | | | | | | | | |
Income before income taxes | | | 1,995 | | | 2,399 | | | 3,350 | | | 2,937 |
Federal income taxes | | | 87 | | | 214 | | | 448 | | | 481 |
| | | | | | | | | | | | |
Net income |
| $ | 1,908 |
| $ | 2,185 |
| $ | 2,902 |
| $ | 2,456 |
| | | | | | | | | | | | |
Earnings per share | | | | | | | | | | | | |
Basic |
| $ | 0.33 |
| $ | 0.38 |
| $ | 0.50 |
| $ | 0.41 |
Diluted |
| $ | 0.33 |
| $ | 0.38 |
| $ | 0.50 |
| $ | 0.41 |
Average Balances, Net Interest Income and Yields Earned and Rates Paid
The following table provides average balance sheet information and reflects the taxable equivalent average yield on interest-earning assets and the average cost of interest-bearing liabilities for the years ended December 31, 2022 and 2021. The yields and costs are calculated by dividing income or expense by the average balance of interest-earning assets or interest-bearing liabilities.
The average balance of available-for-sale securities is computed using the carrying value of securities while the yield for available for sale securities has been computed using the average amortized cost. Average balances are derived from average month-end balances,
| | |
| 23 |
which include nonaccruing loans in the loan portfolio, net of the allowance for loan losses. Interest income has been adjusted to taxequivalent basis.
| | | | | | | | | | | | | | | | | | |
|
| 2022 | | | 2021 |
| ||||||||||||
(Dollars In thousands) | | | |
| Interest |
| | | | | |
| Interest |
| |
| ||
|
| Average |
| Income/ |
| Yield/ |
| | Average |
| Income/ |
| Yield/ | | ||||
|
| Balance |
| Expense |
| Rate |
|
| Balance |
| Expense |
| Rate | | ||||
Assets | | | | | | | | | | | | | | | | | | |
Interest-earning assets | | | | | | | | | | | | | | | | | | |
Loans (1) |
| $ | 462,692 | |
| 20,748 |
| 4.48 | % | | $ | 451,762 | |
| 20,220 |
| 4.48 | % |
Taxable securities - AFS | | | 54,852 | |
| 1,899 |
| 3.46 | | | | 13,297 | |
| 467 |
| 3.51 | |
Tax-exempt securities - AFS (1) | | | 120,073 | |
| 5,565 |
| 4.63 | | | | 118,062 | |
| 4,908 |
| 4.16 | |
Federal funds sold | | | 44,668 | |
| 493 |
| 1.10 | | | | 79,698 | |
| 101 |
| 0.13 | |
FHLB stock and other | | | 3,191 | |
| 139 |
| 4.35 | | | | 3,925 | |
| 81 |
| 2.06 | |
Total interest-earning assets | | | 685,476 | |
| 28,844 |
| 4.21 | | | | 666,744 | |
| 25,777 |
| 3.87 | |
| | | | | | | | | | | | | | | | | | |
Noninterest-earning assets | | | | | | | | | | | | | | | | | | |
Cash and due from banks | | | 8,301 | | | | | | | | | 8,593 | | | | | | |
Premises and equipment (net) | | | 12,547 | | | | | | | | | 13,469 | | | | | | |
Other nonearning assets | | | 32,471 | | | | | | | | | 38,170 | | | | | | |
Less: allowance for loan losses | | | (3,020) | | | | | | | | | (4,576) | | | | | | |
Total noninterest-earning assets | | | 50,299 | | | | | | | | | 55,656 | | | | | | |
Total assets | | $ | 735,775 | | | | | | | | $ | 722,400 | | | | | | |
| | | | | | | | | | | | | | | | | | |
Liabilities & stockholders’ equity | | | | | | | | | | | | | | | | | | |
Interest-bearing liabilities | | | | | | | | | | | | | | | | | | |
Demand deposits |
| $ | 262,763 | |
| 845 |
| 0.32 | % | | $ | 256,638 | |
| 313 |
| 0.12 | % |
Savings deposits | | | 144,283 | |
| 77 |
| 0.05 | | | | 133,826 | |
| 17 |
| 0.01 | |
Time deposits | | | 67,848 | |
| 722 |
| 1.06 | | | | 69,591 | |
| 920 |
| 1.32 | |
Subordinated debentures | | | 23,726 | |
| 1,387 |
| 5.85 | | | | 23,665 | |
| 1,323 |
| 5.59 | |
Repurchase agreements | | | 22,581 | |
| 242 |
| 1.07 | | | | 19,452 | |
| 23 |
| 0.12 | |
Total interest-bearing liabilities | | | 521,201 | |
| 3,273 |
| 0.63 | | | | 503,172 | |
| 2,596 |
| 0.52 | |
| | | | | | | | | | | | | | | | | | |
Noninterest-bearing liabilities | | | | | | | | | | | | | | | | | | |
Demand deposits | | | 151,842 | | | | | | | | | 140,555 | | | | | | |
Other liabilities | | | 4,016 | | | | | | | | | 7,512 | | | | | | |
Total noninterest-bearing liabilities | | | 155,858 | | | | | | | | | 148,067 | | | | | | |
Total liabilities | | | 677,059 | | | | | | | | | 651,239 | | | | | | |
Total stockholders’ equity | | | 58,716 | | | | | | | | | 71,161 | | | | | | |
Total liabilities & stockholders’ equity |
| $ | 735,775 | | | | | |
| | $ | 722,400 | | | | | | |
Net interest income | | | |
| $ | 25,571 | | | | | | |
| $ | 23,181 | | | |
Net interest spread | | | | | | |
| 3.58 | % | | | | | | |
| 3.35 | % |
| | | | | | | | | | | | | | | | | | |
Net yield on interest-earning assets | | | | | | |
| 3.73 | % | | | | | | |
| 3.48 | % |
| ● | For purposes of this schedule, nonaccrual loans are included in loans. |
| ● | Fees collected on loans are included in interest on loans. Not material for comparative purposes. |
| (1) | Shown on a tax equivalent basis. Federal taxes of 21%. |
Rate/Volume Analysis
The table below describes the extent to which changes in interest rates and changes in volume of interest-earning assets and interest-bearing liabilities have affected interest income and expense during 2022. For purposes of this table, changes in interest due to volume and rate were determined using the following methods:
| ● | Volume variance results when the change in volume is multiplied by the previous year’s rate. |
| ● | Rate variance results when the change in rate is multiplied by the previous year’s volume. |
24 |
| |
| ● | Rate/volume variance results when the change in volume is multiplied by the change in rate. |
NOTE: The rate/volume variance was allocated to volume variance and rate variance in proportion to the relationship of the absolute dollar amount of the change in each. Nonaccrual loans are ignored for purposes of the calculations due to the nominal amount of the loans.
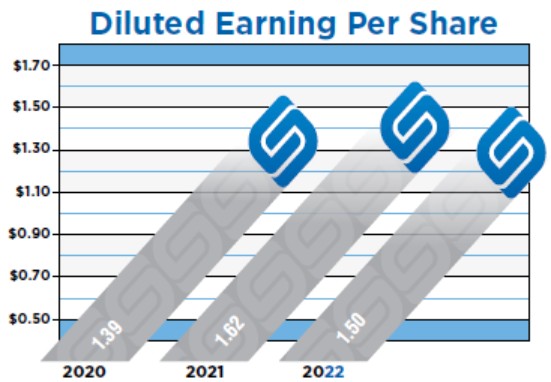
| | |
| 25 |
Capital Resources
Internal capital growth, through the retention of earnings, is the primary means of maintaining capital adequacy for the Bank. The Company’s stockholders’ equity was $59.7 million and $71.1 million at December 31, 2022 and 2021, respectively. Total stockholders’ equity in relation to total assets was 7.89% at December 31, 2022 and 9.90% at December 31, 2021. Please refer to the Consolidated
| | | | | | | | | |
|
| 2022 Compared to 2021 | |||||||
| | Increase/(Decrease) | |||||||
| | (In thousands) | |||||||
| | | | Change | | Change | |||
| | Total | | Due To | | Due To | |||
|
| Change |
| Volume |
| Rate | |||
Interest and dividend income | | | | | | | | | |
Loans |
| $ | 528 | | $ | 490 | |
| 38 |
Taxable securities available for sale | | | 1,432 | |
| 1,367 | |
| 65 |
Tax-exempt securities available for sale | | | 657 | |
| 550 | |
| 107 |
Federal funds sold | | | 392 | |
| (63) | |
| 455 |
FHLB stock and other | | | 58 | |
| (18) | |
| 76 |
Total interest and dividend income | | | 3,067 | |
| 2,326 | |
| 741 |
| | | | | | | | | |
Interest expense | | | | | | | | | |
Demand deposits | | | 532 | |
| 8 | |
| 524 |
Savings deposits | | | 60 | |
| 1 | |
| 59 |
Time deposits | | | (198) | |
| (23) | |
| (175) |
Subordinated debentures | | | 64 | |
| — | |
| 64 |
Repurchase agreements | | | 219 | |
| 4 | |
| 215 |
Total interest expense | | | 677 | |
| (10) | |
| 687 |
| | | | | | | | | |
Net interest income |
| $ | 2,390 | | $ | 2,336 | | $ | 54 |
Statements of Stockholders’ Equity for a detailed roll forward of stockholders’ equity from 2021 to 2022.
The Company has established a Dividend Reinvestment Plan (“The Plan”) for stockholders under which the Company’s common stock will be purchased by The Plan for participants with automatically reinvested dividends. The Plan does not represent a change in the dividend policy or a guarantee of future dividends. Stockholders who do not wish to participate in The Plan continue to receive cash dividends, as declared in the usual and customary manner.
The Company’s Articles of Incorporation permits the creation of a class of preferred shares with 2,000,000 authorized shares. If utilized, this will enable the Company, at the option of the Board of Directors, to issue series of preferred shares in a manner calculated to take advantage of financing techniques which may provide a lower effective cost of capital to the Company. The class of preferred shares provides greater flexibility to the Board of Directors in structuring the terms of equity securities that may be issued by the Company. As of December 31, 2022, the Company has not issued any preferred shares.
26 |
| |
On May 14, 2019 the Company issued $20,000,000 of junior subordinated debentures in denominations of not less than $250,000. The debentures bear interest at a fixed rate of 6.0% until May 2024, which then becomes a floating interest rate equal to the three-month LIBOR (or an equivalent index) plus 3.625%, resetting quarterly. Interest on the subordinated notes will be payable semiannually through May 2024 and quarterly thereafter through the maturity date of May 2029. Principal is due upon maturity. The debentures are unsecured and payable to various investors. For purposes of computing regulatory capital, the debentures are included in Tier 2 Capital. The subordinated notes may not be repaid in whole or in part prior to the fifth anniversary of the issue date (May 2019).

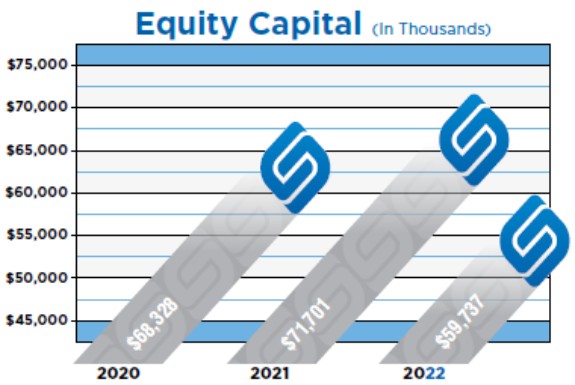
In 2005, a Delaware statutory business trust owned by the Company, United Bancorp Statutory Trust I (“Trust I” or the “Trust”), issued $4.1 million of mandatorily redeemable debt securities which mature in 2035. The sale proceeds were utilized to purchase $4.1 million of the Company’s subordinated debentures. The Company’s subordinated debentures are the sole asset of Trust I. The Company’s investment in Trust I is not consolidated herein as the Company is not deemed the primary beneficiary of the Trust. However, the $4.1 million of mandatorily redeemable debt securities issued by the Trust are includible for regulatory purposes as a component of the Company’s Tier 1 Capital. The interest rate is a variable rate per annum, reset quarterly, equal to three-month LIBOR plus 1.35% and is payable quarterly.
| | |
| 27 |
Liquidity
Liquidity relates primarily to the Company’s ability to fund loan demand, meet deposit customers’ withdrawal requirements and provide for operating expenses. Assets used to satisfy these needs consist of cash and due from banks, federal funds sold and securities available-for-sale. These assets are commonly referred to as liquid assets. Liquid assets were $247.7 million at December 31, 2022, compared to $229.3 million at December 31, 2021. The Company’s residential real estate portfolio can and has been readily used to collateralize borrowings as an additional source of liquidity. Management believes its current liquidity level is sufficient to meet cash requirements.
The Cash Flow Statements for the periods presented provide an indication of the Company’s sources and uses of cash as well as an indication of the ability of the Company to maintain an adequate level of liquidity. A discussion of the cash flow statements for 2022 and 2021 follows.
Net cash provided by operating activities totaled $8.4 million and $8.2 million for the years ended December 31, 2022 and 2021, respectively. The adjustments to reconcile net income to net cash from operating activities consisted mainly of depreciation and amortization of premises and equipment and intangibles, gain on sales of loans, securities and other assets, the provision for loan losses, Federal Home Loan Bank stock dividends, net amortization of securities and net changes in other assets and liabilities.
For the year ended December 31, 2022, net cash used in investing activities totaled $103.3 million. For the year ended December 31, 2021 net cash used in investing activities totaled $1.2 million. The changes in net cash from investing activities include loan growth, security purchases, as well as normal maturities, security calls/sales and reinvestments of securities and premises and equipment expenditures.
Net cash provided by financing activities totaled $41.9 million for the year ended December 31, 2022. For the year ended December 31, 2021 net cash provided by financing activities totaled $24.4 million. The net cash provided by financing activities in 2022 was primarily attributable to a $44.8 million increase in deposits.
Management feels that it has the capital adequacy, profitability, liquidity and reputation to meet the current and projected financial needs of its customers.
28 |
| |
Inflation
The majority of assets and liabilities of the Company are monetary in nature and therefore the Company differs greatly from most commercial and industrial companies that have significant investments in fixed assets or inventories. However, inflation does have an important
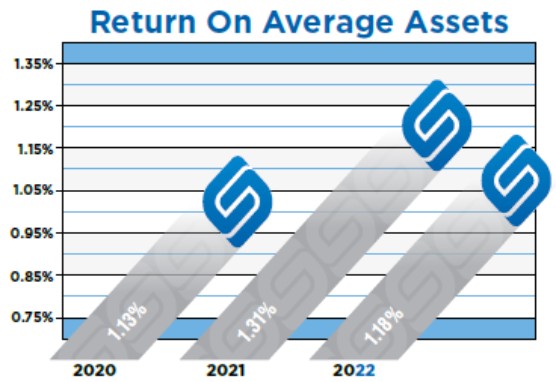
impact on the growth of total assets in the banking industry and the resulting need to increase equity capital at higher than normal rates in order to maintain an appropriate equity to assets ratio. Inflation significantly affects noninterest expense, which tends to rise during periods of general inflation. Management believes the most significant impact on financial results is the Company’s ability to react to changes in interest rates. Management seeks to maintain an essentially balanced position between interest sensitive assets and liabilities and actively manages the amount of securities available for sale in order to protect against the effects of wide interest rate fluctuations on net income and shareholders’ equity.
| | |
| 29 |

REPORT OF INDEPENDENT REGISTERED PUBLIC ACCOUNTING FIRM
To the Shareholders and the Board of Directors of United Bancorp, Inc.
Opinion on the Financial Statements
We have audited the accompanying consolidated balance sheet of United Bancorp, Inc. (the “Company”) as of December 31, 2022; the related consolidated statements of income, comprehensive income, stockholders’ equity, and cash flows for the year then ended; and the related notes to the consolidated financial statements (collectively, the financial statements). In our opinion, the financial statements present fairly, in all material respects, the financial position of the Company as of December 31, 2022, and the results of its operations and its cash flows for the year then ended, in conformity with accounting principles generally accepted in the United States of America.
Basis for Opinion
These financial statements are the responsibility of the Company’s management. Our responsibility is to express an opinion on the Company’s financial statements based on our audit. We are a public accounting firm registered with the Public Company Accounting Oversight Board (United States) (PCAOB) and are required to be independent, with respect to the Company, in accordance with U.S. federal securities laws and the applicable rules and regulations of the Securities and Exchange Commission and the PCAOB.
We conducted our audit in accordance with the standards of the PCAOB. Those standards require that we plan and perform the audit to obtain reasonable assurance about whether the financial statements are free of material misstatement, whether due to error or fraud. The Company is not required to have, nor were we engaged to perform, an audit of its internal control over financial reporting. As part of our audit, we are required to obtain an understanding of internal control over financial reporting but not for the purpose of expressing an opinion on the effectiveness of the Company’s internal control over financial reporting. Accordingly, we express no such opinion.
Our audit included performing procedures to assess the risks of material misstatement of the financial statements, whether due to error or fraud, and performing procedures that respond to those risks. Such procedures included examining, on a test basis, evidence regarding the amounts and disclosures in the financial statements. Our audit also included evaluating the accounting principles used and significant estimates made by management, as well as evaluating the overall presentation of the financial statements. We believe that our audit provides a reasonable basis for our opinion.
PITTSBURGH, PA |
| PHILADELPHIA, PA |
| WHEELING, WV |
| STEUBENVILLE, OH |
|
2009 Mackenzie Way • Suite 340 | | 2100 Renaissance Blvd. • Suite 110 | | 980 National Road | | 511 N. Fourth Street | |
Cranberry Township, PA 16066 | | King of Prussia, PA 19406 | | Wheeling, WV 26003 | | Steubenville, OH 43952 | |
(724) 934-0344 | | (610) 278-9800 | | (304) 233-5030 | | (304) 233-5030 | |
| | S.R. Snodgrass, P.C. d/b/a S.R. Snodgrass, A.C. in West Virginia | | | | ||
Report of Independent Registered Public Accounting Firm
Critical Audit Matters
The critical audit matter communicated below is a matter arising from the current period audit of the financial statements that were communicated or required to be communicated to the Audit Committee and that: (1) relate to accounts or disclosures that are material to the financial statements; and (2) involve our especially challenging, subjective, or complex judgments. The communication of critical audit matters does not alter, in any way, our opinion on the financial statements, taken as a whole, and we are not, by communicating the critical audit matter below, providing separate opinions on the critical audit matters or on the accounts or disclosures to which they relate.
Allowance for Loan Losses – Qualitative Factors
Description of the Matter
The Company’s loan portfolio totaled $460.9 million as of December 31, 2022, and the associated allowance for loan losses was $2.1 million. As discussed in Note 1 and 4 to the consolidated financial statements, determining the amount of the allowance for loan losses requires significant judgment about the collectability of loans, which includes an assessment of quantitative factors such as historical loss experience within each risk category of loans and testing of certain commercial loans for impairment. Management applies additional qualitative adjustments to reflect the inherent losses that exist in the loan portfolio at the balance sheet date that are not reflected in the historical loss experience. Qualitative adjustments are made based upon changes in lending policies and practices, economic conditions, changes in the loan portfolio mix, trends in loan delinquencies and classified loans, loan review system, collateral values, and concentrations of credit risk for the commercial loan portfolios.
We identified these qualitative adjustments within the allowance for loan losses as critical audit matters because they involve a high degree of subjectivity. In turn, auditing management’s judgments regarding the qualitative factors applied in the allowance for loan losses calculation involved a high degree of subjectivity.
How We Addressed the Matter in Our Audit
The primary procedures performed to address this critical audit matter included:
| ● | Obtaining an understanding of the design and implementation of controls relating to management’s calculation of the allowance for loan losses. |
| ● | Analytically evaluating the qualitative factors year over year for directional consistency, testing for reasonableness, and obtaining evidence for significant changes. |
| ● | Testing the mathematical accuracy of the allowance for loan losses calculation, including the calculation of the qualitative factors. This testing included evaluating the completeness, accuracy, and relevance of the data and inputs utilized in management’s estimate. |
| ● | Evaluating the appropriateness of management’s risk-rating processes by utilizing internal credit review specialists to ensure that the risk ratings applied to the commercial loan portfolio were appropriate. |
| ● | Evaluating the accuracy and completeness of disclosures in the consolidated financial statements. |
We have served as the Company’s auditor since 2022.

Cranberry Township, Pennsylvania
March 17, 2023
Consolidated Balance Sheets
December 31, 2022 and 2021
(In thousands, except share data)
| | | | | | |
|
| 2022 |
| 2021 | ||
Assets | | | | | | |
Cash and due from banks | | $ | 8,279 | | $ | 7,653 |
Interest-bearing demand deposits | |
| 21,801 | | | 75,346 |
Cash and cash equivalents | |
| 30,080 | | | 82,999 |
| |
| | |
| |
Available-for-sale securities | |
| 217,624 | |
| 146,313 |
Loans, net of allowance for loan losses of $2,052 and $3,673 at December 31, 2022 and 2021, respectively | |
| 458,823 | | | 450,699 |
Premises and equipment | |
| 12,144 | | | 12,757 |
Federal Home Loan Bank stock | |
| 2,499 | | | 3,704 |
Foreclosed assets held for sale, net | |
| 3,519 | | | 415 |
Core deposit intangible assets | |
| 410 | | | 560 |
Goodwill | |
| 682 | | | 682 |
Accrued interest receivable | |
| 3,403 | | | 2,345 |
Deferred federal income tax | |
| 2,423 | | | — |
Bank-owned life insurance | |
| 19,000 | | | 18,809 |
Other assets | | | 6,793 | | | 5,173 |
Total Assets | | $ | 757,400 | | $ | 724,456 |
Liabilities and Stockholders’ Equity | |
|
| |
|
|
Liabilities | |
|
| |
|
|
Deposits | | | | | | |
Demand | | $ | 402,341 | | $ | 408,296 |
Savings | |
| 145,836 | | | 140,598 |
Time | |
| 101,736 | | | 56,242 |
Total deposits | |
| 649,913 | | | 605,136 |
Securities sold under repurchase agreements | |
| 18,106 | | | 15,701 |
Subordinated debentures | |
| 23,726 | | | 23,665 |
Deferred federal income tax | |
| — | | | 1,681 |
Interest payable and other liabilities | |
| 5,918 | | | 6,572 |
Total liabilities | |
| 697,663 | |
| 652,755 |
Stockholders’ Equity | |
| | |
| |
Preferred stock, no par value, authorized 2,000,000 shares; no shares issued | |
| –– | | | –– |
Common stock, $1 par value; authorized 10,000,000 shares; issued 2022 – 6,043,851 shares, 2021 - 6,053,851 shares; outstanding 2022 – 5,740,251, 2021 – 5,791,853 | |
| 6,044 | | | 6,054 |
Additional paid-in capital | |
| 24,814 | | | 23,635 |
Retained earnings | |
| 41,945 | | | 37,847 |
Stock held by deferred compensation plan; 2022 – 174,237 shares, 2021 – 172,538 shares | |
| (1,902) | | | (1,738) |
Unearned ESOP compensation | |
| — | | | — |
Accumulated other comprehensive (loss) income | |
| (9,336) | |
| 6,964 |
Treasury stock, at cost 2022 – 129,363 shares, 2021 – 84,363 shares | |
| (1,828) | | | (1,061) |
Total stockholders’ equity | |
| 59,737 | | | 71,701 |
Total liabilities and stockholders’ equity | | $ | 757,400 | | $ | 724,456 |
See Notes to Consolidated Financial Statements

Consolidated Statements of Income
Years Ended December 31, 2022 and 2021
(In thousands, except per share data)
| | | | | | |
|
| 2022 |
| 2021 | ||
Interest and Dividend Income |
| |
|
| |
|
Loans | | $ | 20,734 | | $ | 20,181 |
Securities | |
| | | | |
Taxable | |
| 1,899 | | | 468 |
Tax-exempt | |
| 4,396 | | | 3,877 |
Federal funds sold | |
| 493 | | | 101 |
Dividends on Federal Home Loan Bank and other stock | |
| 139 | | | 81 |
Total interest and dividend income | |
| 27,661 | | | 24,708 |
Interest Expense | |
| | | | |
Deposits | |
| 1,643 | | | 1,273 |
Borrowings | |
| 1,630 | | | 1,323 |
Total interest expense | |
| 3,273 | | | 2,596 |
Net Interest Income | |
| 24,388 | | | 22,112 |
(Credit) Provision for Loan Losses | |
| (955) | | | (1,255) |
Net Interest Income After (Credit) Provision for Loan Losses | |
| 25,343 | | | 23,367 |
Noninterest Income | |
| | | | |
Customer service fees | |
| 2,978 | | | 2,852 |
Net gains on loan sales | |
| 36 | | | 272 |
Earnings on bank-owned life insurance | |
| 708 | | | 802 |
Realized gains on available-for-sale securities | |
| — | | | 1,250 |
Other | |
| 361 | | | 530 |
Total noninterest income | |
| 4,083 | | | 5,706 |
Noninterest Expense | |
| | | | |
Salaries and employee benefits | |
| 10,305 | | | 9,698 |
Net occupancy and equipment expense | |
| 2,217 | | | 2,364 |
Professional fees | |
| 1,451 | | | 1,217 |
Insurance | |
| 568 | | | 531 |
Deposit insurance premiums | |
| 198 | | | 195 |
Franchise and other taxes | |
| 562 | | | 551 |
Advertising expense | |
| 346 | | | 380 |
Printing and office supplies | |
| 110 | | | 115 |
Amortization of intangible assets | |
| 150 | | | 150 |
Other | |
| 3,983 | | | 3,191 |
Total noninterest expense | |
| 19,890 | | | 18,392 |
Income Before Federal Income Taxes | | | 9,536 | | | 10,681 |
Provision for Federal Income Taxes | | | 879 | | | 1,230 |
Net Income | | $ | 8,657 | | $ | 9,451 |
Basic Earnings Per Share | | $ | 1.50 | | $ | 1.62 |
Diluted Earnings Per Share | | $ | 1.50 | | $ | 1.62 |
See Notes to Consolidated Financial Statements

Consolidated Statements of Comprehensive Income
Years Ended December 31, 2022 and 2021
(In thousands)
| | | | | | |
|
| 2022 |
| 2021 | ||
Net income | | $ | 8,657 | | $ | 9,451 |
Other comprehensive income (loss), net of tax | |
| | |
| |
Reclassification adjustment for realized gains on available-for-sale securities included in net income, net of taxes $— and $263 for each respective period | |
| — | |
| (987) |
Unrealized holding losses on available-for-sale securities during the period, net of benefits of $4,605 and $497 for each respective period | |
| (17,322) | |
| (1,871) |
Change in funded status of defined benefit plan, net of taxes of $252 and $104 for each respective period | |
| 947 | |
| 396 |
Amortization of prior service included in net periodic pension expense, net of tax benefits of $19 and $19 for each respective period | |
| (70) | |
| (70) |
Amortization of net loss included in net periodic pension cost, net of taxes of $38 and $57 for each respective period | |
| 145 | |
| 213 |
Comprehensive (loss) income | | $ | (7,643) | | $ | 7,132 |
See Notes to Consolidated Financial Statements
| | |
34 |
| |
Consolidated Statements of Stockholders’ Equity
Years Ended December 31, 2022 and 2021
(In thousands, except per share data)
| | | | | | | | | | | | | | | | | | |
| | | | | | | | Treasury | | | | | Accumulated | | | | ||
| | | | | Additional | | Stock and | | | | | Other | | | | |||
| | Common | | Paid-in | | Deferred | | Retained | | Comprehensive | | | | |||||
|
| Stock |
| Capital |
| Compensation |
| Earnings |
| Income (Loss) |
| Total | ||||||
Balance, January 1, 2021 | | $ | 6,046 | | $ | 23,166 | | $ | (2,664) | | $ | 32,497 | | $ | 9,283 | | $ | 68,328 |
Net income | |
| — | |
| — | |
| — | |
| 9,451 | |
| — | |
| 9,451 |
Other comprehensive loss | |
| — | |
| — | |
| — | |
| — | |
| (2,319) | |
| (2,319) |
Cash dividends - $0.685 per share | |
| — | |
| — | |
| — | |
| (4,101) | |
| — | |
| (4,101) |
Shares activity for deferred compensation plan | |
| — | |
| 63 | |
| (63) | |
| — | |
| — | |
| — |
Shares purchased for treasury stock | | | — | | | — | | | (72) | | | — | | | — | | | (72) |
Expense related to share-based compensation plans | |
| — | |
| 414 | |
| — | |
| — | |
| — | |
| 414 |
Restricted stock activity | |
| 8 | |
| (8) | |
| — | |
| — | |
| — | |
| — |
Balance, December 31, 2021 | | | 6,054 | | $ | 23,635 | | $ | (2,799) | | $ | 37,847 | | $ | 6,964 | | $ | 71,701 |
Net income | |
| — | |
| — | |
| — | |
| 8,657 | |
| — | |
| 8,657 |
Other comprehensive loss | |
| — | |
| — | |
| — | |
| — | |
| (16,300) | |
| (16,300) |
Cash dividends - $0.775 per share | |
| — | |
| — | |
| — | |
| (4,559) | |
| — | |
| (4,559) |
Shares activity for deferred compensation plan | |
| — | |
| 164 | |
| (164) | |
| — | |
| — | |
| — |
Shares purchased for treasury stock | | | — | | | — | | | (767) | | | — | | | — | | | (767) |
Expense related to share-based compensation plans | |
| — | |
| 1,005 | |
| — | |
| — | |
| — | |
| 1,005 |
Restricted stock activity | |
| (10) | |
| 10 | |
| — | |
| — | |
| — | |
| — |
| |
|
| |
|
| |
|
| |
|
| |
|
| |
|
|
Balance, December 31, 2022 | | $ | 6,044 | | $ | 24,814 | | $ | (3,730) | | $ | 41,945 | | $ | (9,336) | | $ | 59,737 |
See Notes to Consolidated Financial Statements
| | |
| 35 |
Consolidated Statements of Cash Flows
Years Ended December 31, 2022 and 2021
(In thousands)
| | | | | | |
|
| 2022 |
| 2021 | ||
Operating Activities |
| |
|
| |
|
Net income | | $ | 8,657 | | $ | 9,451 |
Items not requiring (providing) cash: | |
| | |
|
|
Depreciation and amortization | |
| 1,013 | | | 1,143 |
(Credit) provision for loan losses | |
| (955) | | | (1,255) |
Gain on sale of available-for-sale securities | |
| — | | | (1,250) |
Amortization of premiums and discounts on securities-net | |
| 533 | | | 384 |
Amortization of intangible assets | |
| 150 | | | 150 |
Deferred income taxes | |
| 342 | | | 112 |
Originations of loans held for sale | |
| (1,891) | | | (11,631) |
Proceeds from sale of loans held for sale | |
| 1,927 | | | 11,903 |
Net gains on sales of loans | |
| (36) | | | (272) |
Expense related to share-based compensation plans | |
| 1,005 | | | 414 |
Net loss (gain) or on sale or write-down of foreclosed assets and other repossessed assets | |
| 23 | | | (75) |
Increase in cash surrender value of bank-owned life insurance | |
| (191) | |
| (441) |
Amortization of debt issuance costs | | | 61 | | | 61 |
Changes in: | |
| | |
|
|
Accrued interest receivable | |
| (1,058) | | | 556 |
Other assets | |
| (824) | | | (1,237) |
Interest payable and other liabilities | |
| (275) | | | 179 |
Net cash provided by operating activities | |
| 8,481 | |
| 8,192 |
Investing Activities | |
| | |
|
|
Purchases of available-for-sale securities | |
| (99,992) | | | (24,371) |
Sale of available-for-sale securities | |
| — | | | 12,684 |
Maturities, prepayments and calls | |
| 6,190 | | | 20,834 |
Net change in loans | |
| (10,415) | | | (10,864) |
Mandatory redemption (purchase) of Federal Home Loan Bank Stock | | | 1,205 | | | 473 |
Purchases of bank-owned life insurance | | | — | | | (259) |
Purchases of premises and equipment, net | |
| (511) | | | (777) |
Proceeds from sale of premises and equipment | |
| 111 | | | 620 |
Proceeds from sales of foreclosed assets | |
| 156 | | | 451 |
Net cash (used in) investing activities | |
| (103,256) | | | (1,209) |
See Notes to Consolidated Financial Statements
| | |
36 |
| |
Consolidated Statements of Cash Flows Continued
Years Ended December 31, 2022 and 2021
(In thousands)
| | | | | | |
|
| 2022 |
| 2021 | ||
Financing Activities |
| |
|
| |
|
Net increase in deposits | | $ | 44,777 | | $ | 25,601 |
Net change in securities sold under repurchase agreements | |
| 2,405 | |
| 2,996 |
Repurchase of common stock | | | (767) | | | (72) |
Cash dividends paid | |
| (4,559) | |
| (4,101) |
Net cash provided by financing activities | |
| 41,856 | |
| 24,424 |
(Decrease) Increase in Cash and Cash Equivalents | |
| (52,919) | |
| 31,407 |
Cash and Cash Equivalents, Beginning of Year | |
| 82,999 | |
| 51,592 |
Cash and Cash Equivalents, End of Year | | $ | 30,080 | | $ | 82,999 |
Supplemental Cash Flows Information | |
| | |
| |
Interest paid on deposits and borrowings | | $ | 3,150 | | $ | 2,182 |
Federal income taxes paid | | $ | 230 | | $ | 710 |
Supplemental Disclosure of Non-Cash Investing Activities | |
| | |
| |
Transfers from loans to foreclosed assets held for sale | | $ | 3,283 | | $ | 70 |
See Notes to Consolidated Financial Statements
| | |
| 37 |
Notes to Consolidated Financial Statements
December 31, 2022 and 2021
Note 1: Nature of Operations and Summary of Significant Accounting Policies
Principles of Consolidation
The consolidated financial statements include the accounts of United Bancorp, Inc. (“United” or “the Company”) and its wholly-owned subsidiary, Unified Bank of Martins Ferry, Ohio (“the Bank” or “Unified”). All intercompany transactions and balances have been eliminated in consolidation.
Nature of Operations
The Company’s revenues, operating income and assets are almost exclusively derived from banking. Accordingly, all of the Company’s banking operations are considered by management to be aggregated in one reportable operating segment. Customers are mainly located in Athens, Belmont, Carroll, Fairfield, Harrison, Jefferson and Tuscarawas Counties in Ohio and Marshall and Ohio Counties in West Virginia and the surrounding localities in northeastern, east-central and southeastern Ohio and include a wide range of individuals, businesses and other organizations. Unified Bank conducts its business through its main office in Martins Ferry, Ohio and branches in Bridgeport, Colerain, Dellroy, Dover, Glouster, Jewett, Lancaster Downtown, Lancaster East, Nelsonville, New Philadelphia, Powhatan Point, St. Clairsville East, St. Clairsville West, Sherrodsville, Strasburg, Tiltonsville, Ohio and Moundsville West Virginia.
The Company’s primary deposit products are checking, savings and term certificate accounts and its primary lending products are residential mortgage, commercial and installment loans. Substantially all loans are secured by specific items of collateral including business assets, consumer assets and real estate. Commercial loans are expected to be repaid from cash flow from operations of businesses. Real estate loans are secured by both residential and commercial real estate. Net interest income is affected by the relative amount of interest-earning assets and interest-bearing liabilities and the interest received or paid on these balances. The level of interest rates paid or received by the Company can be significantly influenced by a number of environmental factors, such as governmental monetary policy, that are outside of management’s control.
Revenue Recognition
Accounting Standards Codification (“ASC”) 606, Revenue from Contracts with Customers (“ASC 606”), establishes principles for reporting information about the nature, amount, timing and uncertainty of revenue and cash flows arising from the entity’s contracts to provide goods or services to customers. The core principle requires an entity to recognize revenue to depict the transfer of goods or services to customers in an amount that reflects the consideration that it expects to be entitled to receive in exchange for those goods or services recognized as performance obligations are satisfied.
The majority of our revenue-generating transactions are not subject to ASC 606, including revenue generated from financial instruments, such as our loans, investment securities, as well as revenue related to our mortgage banking activities, as these activities are subject to other GAAP discussed elsewhere within our disclosures.
Descriptions of our revenue-generating activities that are within the scope of ASC 606, which are presented in our statements of income as components of non-interest income are as follows:
Service charges on deposit accounts - these represent general service fees for monthly account maintenance and activity- or transaction-based fees and consist of transaction-based revenue, time-based revenue (service period), item-based revenue or some other individual attribute-based revenue. Revenue is recognized when our performance obligation is completed which is generally monthly for account maintenance services or when a transaction has been completed (such as a wire transfer). Payment for such performance obligations are generally received at the time the performance obligations are satisfied.
Use of Estimates
The preparation of financial statements in conformity with accounting principles generally accepted in the United States of America requires management to make estimates and assumptions that affect the reported amounts of assets and liabilities and disclosure of contingent assets and liabilities at the date of the financial statements and the reported amounts of revenues and expenses during the reporting period. Actual results could differ from those estimates.
| | |
38 |
| |
Notes to Consolidated Financial Statements
December 31, 2022 and 2021
Material estimates that are particularly susceptible to significant change relate to the determination of the allowance for loan losses and the valuation of real estate acquired in connection with foreclosures or in satisfaction of loans. In connection with the determination of the allowance for loan losses and the valuation of foreclosed assets held for sale, management obtains independent appraisals for significant properties.
Cash Equivalents
The Company considers all liquid investments with original maturities of three months or less to be cash equivalents. At December 31, 2022 and 2021, cash equivalents consisted primarily of due from accounts with the Federal Reserve and other correspondent banks.
Currently, the FDIC’s insurance limits are $250,000. At December 31, 2022 and 2021, the Company’s various cash accounts did not exceed the federally insured limit of $250,000. At December 31, 2022 and 2021, the Company held $21,541,000 and $74,752,000 at the Federal Home Loan Bank and the Federal Reserve Bank, respectively, which are not subject to FDIC limits.
Securities
Certain debt securities that management has the positive intent and ability to hold to maturity would be classified as “held to maturity” and recorded at amortized cost. Securities not classified as held to maturity, including equity securities with readily determinable fair values, are classified as “available for sale” and recorded at fair value, with unrealized gains and losses excluded from earnings and reported in other comprehensive income. Purchase premiums and discounts are recognized in interest income using the interest method over the terms of the securities. Gains and losses on the sale of securities are recorded on the trade date and are determined using the specific identification method.
For debt securities with fair value below amortized cost, when the Company does not intend to sell a debt security, and it is more likely than not the Company will not have to sell the security before recovery of its cost basis, it recognizes the credit component of an other-than-temporary impairment of a debt security in earnings and the remaining portion in other comprehensive income.
Loans Held for Sale
Mortgage loans originated and intended for sale in the secondary market are carried at the lower of cost or fair value in the aggregate. Net unrealized losses, if any, are recognized through a valuation allowance by charges to income. At December 31, 2022 and 2021, the Company did not have any loans held for sale.
Loans
Loans that management has the intent and ability to hold for the foreseeable future or until maturity or payoffs are reported at their outstanding principal balances adjusted for unearned income, charge-offs, the allowance for loan losses, any unamortized deferred fees or costs on originated loans and unamortized premiums or discounts on purchased loans.
For loans amortized at cost, interest income is accrued based on the unpaid principal balance. Loan origination fees, net of certain direct origination costs, as well as premiums and discounts, are deferred and amortized as a level yield adjustment over the respective term of the loan.
For all loan classes, the accrual of interest is discontinued at the time the loan is 90 days past due unless the credit is wellsecured and in process of collection. Past due status is based on contractual terms of the loan. For all loan classes, the entire balance of the loan is considered past due if the minimum payment contractually required to be paid is not received by the contractual due date. For all loan classes, loans are placed on nonaccrual or charged off at an earlier date if collection of principal or interest is considered doubtful.
Management’s general practice is to proactively charge down loans individually evaluated for impairment to the fair value of the underlying collateral. Consistent with regulatory guidance, charge-offs on all loan segments are taken when specific loans, or portions thereof, are considered uncollectible. The Company’s policy is to promptly charge these loans off in the period the uncollectible loss is reasonably determined.
| | |
| 39 |
Notes to Consolidated Financial Statements
December 31, 2022 and 2021
For all loan portfolio segments except residential and consumer loans, the Company promptly charges-off loans, or portions thereof, when available information confirms that specific loans are uncollectible based on information that includes, but is not limited to, (1) the deteriorating financial condition of the borrower, (2) declining collateral values, and/or (3) legal action, including bankruptcy, that impairs the borrower’s ability to adequately meet its obligations. For impaired loans that are considered to be solely collateral dependent, a partial charge-off is recorded when a loss has been confirmed by an updated appraisal or other appropriate valuation of the collateral.
The Company charges-off residential and consumer loans when the Company reasonably determines the amount of the loss. The Company adheres to timeframes established by applicable regulatory guidance which provides for the charge-down of 1-4 family first and junior lien mortgages to the net realizable value less costs to sell when the loan is 120 days past due, chargeoff of unsecured open-end loans when the loan is 120 days past due, and charge down to the net realizable value when other secured loans are 120 days past due. Loans at these respective delinquency thresholds for which the Company can clearly document that the loan is both well-secured and in the process of collection, such that collection will occur regardless of delinquency status, need not be charged off.
For all classes, all interest accrued but not collected for loans that are placed on nonaccrual or charged off are reversed against interest income. The interest on these loans is accounted for on the cash-basis or cost-recovery method, until qualifying for return to accrual. Loans are returned to accrual status when all the principal and interest amounts contractually due are brought current and future payments are reasonably assured. Nonaccrual loans are returned to accrual status when, in the opinion of management, the financial position of the borrower indicates there is no longer any reasonable doubt as to the timely collection of interest or principal. The Company requires a period of satisfactory performance of not less than six months before returning a nonaccrual loan to accrual status.
When cash payments are received on impaired loans in each loan class, the Company records the payment as interest income unless collection of the remaining recorded principal amount is doubtful, at which time payments are used to reduce the principal balance of the loan. Troubled debt restructured loans recognize interest income on an accrual basis at the renegotiated rate if the loan is in compliance with the modified terms, no principal reduction has been granted and the loan has demonstrated the ability to perform in accordance with the renegotiated terms for a period of at least six months.
Allowance for Loan Losses
The allowance for loan losses is established as losses are estimated to have occurred through a provision for loan losses charged to income. Loan losses are charged against the allowance when management believes the uncollectibility of a loan balance is confirmed. Subsequent recoveries, if any, are credited to the allowance.
The allowance for loan losses is evaluated on a monthly basis by Bank management and is based upon management’s periodic review of the collectability of the loans in light of historical experience, the nature and volume of the loan portfolio, adverse situations that may affect the borrower’s ability to repay, estimated value of any underlying collateral and prevailing economic conditions. This evaluation is inherently subjective as it requires estimates that are susceptible to significant revision as more information becomes available.
The allowance consists of allocated and general components. The allocated component relates to loans that are classified as impaired. For those loans that are classified as impaired, an allowance is established when the discounted cash flows (or collateral value or observable market price) of the impaired loan is lower than the carrying value of that loan. The general component covers non-impaired loans and is based on historical charge-off experience by segment. The historical loss experience is determined by portfolio segment and is based on the actual loss history experienced by the Company over the prior five years. Management believes the five year historical loss experience methodology is appropriate in the current economic environment. Other adjustments (qualitative/environmental considerations) for each segment may be added to the allowance for each loan segment after an assessment of internal or external influences on credit quality that are not fully reflected in the historical loss or risk rating data.
A loan is considered impaired when, based on current information and events, it is probable that the Company will be unable to collect the scheduled payments of principal or interest when due according to the contractual terms of the loan agreement. Factors considered by management in determining impairment include payment status, collateral value and the probability of collecting scheduled principal and interest payments when due based on the loan’s current payment status and the borrower’s
| | |
40 |
| |
Notes to Consolidated Financial Statements
December 31, 2022 and 2021
financial condition including available sources of cash flows. Loans that experience insignificant payment delays and payment shortfalls generally are not classified as impaired.
Management determines the significance of payment delays and payment shortfalls on a case-by-case basis, taking into consideration all of the circumstances surrounding the loan and the borrower, including the length of the delay, the reasons for the delay, the borrower’s prior payment record and the amount of the shortfall in relation to the principal and interest owed. Impairment is measured on a loan-by-loan basis for non-homogenous type loans such as commercial, non-owner residential and construction loans by either the present value of expected future cash flows discounted at the loan’s effective interest rate, the loan’s obtainable market price or the fair value of the collateral if the loan is collateral dependent. For impaired loans where the Company utilizes the discounted cash flows to determine the level of impairment, the Company includes the entire change in the present value of cash flows as bad debt expense.
The fair values of collateral dependent impaired loans are based on independent appraisals of the collateral. In general, the Company acquires an updated appraisal upon identification of impairment and annually thereafter for commercial, commercial real estate and multi-family loans. If the most recent appraisal is over a year old, and a new appraisal is not performed, due to lack of comparable values or other reasons, the existing appraisal is utilized and discounted generally 10% -35% based on the age of the appraisal, condition of the subject property, and overall economic conditions. After determining the collateral value as described, the fair value is calculated based on the determined collateral value less selling expenses. The potential for outdated appraisal values is considered in our determination of the allowance for loan losses through our analysis of various trends and conditions including the local economy, trends in charge-offs and delinquencies, etc. and the related qualitative adjustments assigned by the Company.
Segments of loans with similar risk characteristics are collectively evaluated for impairment based on the segment’s historical loss experience adjusted for changes in trends, conditions and other relevant factors that affect repayment of the loans. Accordingly, the Company does not separately identify individual consumer and residential loans for impairment measurements, unless such loans are the subject of a restructuring agreement due to financial difficulties of the borrower.
In the course of working with borrowers, the Company may choose to restructure the contractual terms of certain loans. In this scenario, the Company attempts to work-out an alternative payment schedule with the borrower in order to optimize collectability of the loan. Any loans that are modified are reviewed by the Company to identify if a troubled debt restructuring (“TDR”) has occurred, which is when, for economic or legal reasons related to a borrower’s financial difficulties, the Company grants a concession to the borrower that it would not otherwise consider. Terms may be modified to fit the ability of the borrower to repay in line with its current financial status and the restructuring of the loan may include the transfer of assets from the borrower to satisfy the debt, a modification of loan terms, or a combination of the two. If such efforts by the Company do not result in a satisfactory arrangement, the loan is referred to legal counsel, at which time foreclosure proceedings are initiated. At any time prior to a sale of the property at foreclosure, the Company may terminate foreclosure proceedings if the borrower is able to work-out a satisfactory payment plan.
It is the Company’s policy to have any restructured loans which are on nonaccrual status prior to being restructured remain on nonaccrual status until six months of satisfactory borrower performance at which time management would consider its return to accrual status. If a loan was accruing at the time of restructuring, the Company reviews the loan to determine if it is appropriate to continue the accrual of interest on the restructured loan.
With regard to determination of the amount of the allowance for credit losses, trouble debt restructured loans are considered to be impaired. As a result, the determination of the amount of impaired loans for each portfolio segment within troubled debt restructurings is the same as detailed previously.
Premises and Equipment
Land is carried at cost. Depreciable assets are stated at cost less accumulated depreciation which range from 10-39 years for Company buildings, 3-7 years for furniture and equipment, and 1-3 years for computer software. Depreciation is charged to expense using the straight-line method over the estimated useful lives of the assets. An accelerated method is used for tax purposes. Expenditures for maintenance and repairs are charged against income as incurred. Costs of major additions and improvements are capitalized.
| | |
| 41 |
Notes to Consolidated Financial Statements
December 31, 2022 and 2021
Federal Home Loan Bank Stock
Federal Home Loan Bank stock is a required investment for institutions that are members of the Federal Home Loan Bank system. The required investment in the common stock is based on a predetermined formula, carried at cost and evaluated for impairment.
Foreclosed Assets Held for Sale
Assets acquired through, or in lieu of, loan foreclosure are held for sale and are initially recorded at fair value, less costs to sell, at the date of foreclosure, establishing a new cost basis. Subsequent to foreclosure, valuations are periodically performed by management and the assets are carried at the lower of carrying amount or fair value less cost to sell. Revenue and expenses from operations and changes in the valuation allowance are included in net income or expense from foreclosed assets.
Bank-Owned Life Insurance
The Company and the Bank have purchased life insurance policies on certain key executives. Company and bank-owned life insurance is recorded at its cash surrender value, or the amount that can be realized.
Treasury Stock
Common shares repurchased are recorded at cost. Cost of shares retired or reissued is determined using the weighted average cost.
Restricted Stock Awards
The Company has a share-based employee compensation plan, which is described more fully in Note 14.
Income Taxes
The Company accounts for income taxes in accordance with income tax accounting guidance (ASC 740, Income Taxes). The income tax accounting guidance results in two components of income tax expense: current and deferred. Current income tax expense reflects taxes to be paid or refunded for the current period by applying the provisions of the enacted tax law to the taxable income or excess of deductions over revenues. The Company determines deferred income taxes using the liability (or balance sheet) method. Under this method, the net deferred tax asset or liability is based on the tax effects of the differences between the book and tax bases of assets and liabilities, and enacted changes in tax rates and laws are recognized in the period in which they occur.
Deferred income tax expense results from changes in deferred tax assets and liabilities between periods. Deferred tax assets are reduced by a valuation allowance if based on the weight of evidence available it is more likely than not that some portion or all of a deferred tax asset will not be realized.
Uncertain tax positions are recognized if it is more likely than not, based on the technical merits, that the tax position will be realized or sustained upon examination. The term more likely than not means a likelihood of more than 50 percent; the terms examined and upon examination also include resolution of the related appeals or litigation processes, if any. A tax position that meets the more-likely-than-not recognition threshold is initially and subsequently measured as the largest amount of tax benefit that has a greater than 50 percent likelihood of being realized upon settlement with a taxing authority that has full knowledge of all relevant information. The determination of whether or not a tax position has met the more-likely-than-not recognition threshold considers the facts, circumstances and information available at the reporting date and is subject to management’s judgment. At December 31, 2022, the Company had no uncertain tax positions.
The Company recognizes interest and penalties on income taxes as a component of income tax expense.
The Company files consolidated income tax returns with its subsidiary. With a few exceptions, the Company is no longer subject to the examination by tax authorities for years before 2019.
| | |
42 |
| |
Notes to Consolidated Financial Statements
December 31, 2022 and 2021
Deferred Compensation Plan
Directors have the option to defer all or a portion of fees for their services into a deferred stock compensation plan that invests in common shares of the Company. Officers of the Company have the option to defer up to 50% of their annual incentive award into this plan. The plan does not permit diversification and must be settled by the delivery of a fixed number of shares of the Company stock. The stock held in the plan is included in equity as deferred shares and is accounted for in a manner similar to treasury stock. Subsequent changes in the fair value of the Company’s stock are not recognized. The deferred compensation obligation is also classified as an equity instrument and changes in the fair value of the amount owed to the participant are not recognized.
The Company has entered into supplemental income agreements for certain individuals. These agreements call for a fixed payment over 180 months after the individual reaches normal retirement age.
Stockholders’ Equity and Dividend Restrictions
The Bank is subject to certain restrictions on the amount of dividends that it may declare without prior regulatory approval. Generally, the Bank’s payment of dividends is limited to net income for the current year plus the two preceding calendar years, less capital distributions paid over the comparable time period. Dividend payments to the stockholders may be legally paid from additional paid-in capital or retained earnings.
Earnings Per Share
Basic earnings per share allocated to common stockholders is calculated using the two-class method and is computed by dividing net income allocated to common stockholders by the weighted average number of commons shares outstanding during the period. Diluted earnings per share is adjusted for the dilutive effects of stock based compensation and is calculated using the two-class method or the treasury method. There were no dilutive effects for the years ended December 31, 2022 and 2021.
Comprehensive Income (Loss)
Comprehensive income consists of net income (loss) and other comprehensive (loss) income, net of applicable income taxes. Other comprehensive (loss) income includes unrealized appreciation (depreciation) on available-for-sale securities and changes in the funded status of the defined benefit pension plan.
Advertising
Advertising expenses are expensed as incurred.
Note 2: Restriction on Cash and Due From Banks
The Company did not have a reserve requirement at December 31, 2022 and 2021.
| | |
| 43 |
Notes to Consolidated Financial Statements
December 31, 2022 and 2021
Note 3: Securities
The amortized cost and approximate fair values, together with gross unrealized gains and losses of securities are as follows:
| | | | | | | | | | | | |
|
| | |
| Gross |
| Gross |
| | | ||
| | Amortized | | Unrealized | | Unrealized | | | ||||
| | Cost | | Gains | | Losses | | Fair Value | ||||
| | (In thousands) | ||||||||||
Available-for-sale Securities: |
| |
|
| |
|
| |
|
| |
|
December 31, 2022: |
| |
|
| |
|
| |
|
| |
|
U.S. government agencies | | $ | 45,000 | | $ | — | | $ | (968) | | $ | 44,032 |
Subordinated notes | | | 31,160 | | | — | | | (3,066) | | | 28,094 |
State and municipal obligations | | | 152,447 | | | 459 | | | (7,408) | | | 145,498 |
Total debt securities | | $ | 228,607 | | $ | 459 | | $ | (11,442) | | $ | 217,624 |
Available-for-sale Securities: | |
| | |
| | |
| | |
| |
December 31, 2021: | |
| | |
| | |
| | |
| |
U.S. government agencies | | $ | — | | $ | — | | $ | — | | $ | — |
Subordinated notes | | | 28,837 | | | 76 | | | (148) | | | 28,765 |
State and municipal obligations | | | 106,533 | | | 11,015 | | | — | | | 117,548 |
Total debt securities | | $ | 135,370 | | $ | 11,091 | | $ | (148) | | $ | 146,313 |
There were no sales of investment securities during 2022. During 2021, the Company sold $11.4 million of State and Municipal securities for a total gain of approximately $1,250,000.
The amortized cost and fair value of available-for-sale securities at December 31, 2022, by contractual maturity, are shown below. Expected maturities will differ from contractual maturities because issuers may have the right to call or prepay obligations with or without call or prepayment penalties.
| | | | | | |
|
| Amortized |
| Fair | ||
| | Cost | | Value | ||
| | (In thousands) | ||||
One to five years | | $ | 45,651 | | $ | 44,484 |
Five to ten years | |
| 33,440 | | | 30,414 |
Over ten years | |
| 149,516 | | | 142,726 |
Totals | | $ | 228,607 | | $ | 217,624 |
The carrying value of securities pledged as collateral, to secure public deposits and for other purposes, was $68.7 million and $64.4 million at December 31, 2022 and 2021, respectively.
Certain investments in debt securities are reported in the financial statements at an amount less than their historical cost. The total fair value of these investments at December 31, 2022 and 2021, was $166.1 million and $14.2 million, which represented approximately 76% and approximately 10%, respectively, of the Company’s available-for-sale investment portfolio.
Based on evaluation of available evidence, including recent changes in market interest rates, credit rating information and information obtained from regulatory filings, management believes the declines in fair value for these securities are temporary.
| | |
44 |
| |
Notes to Consolidated Financial Statements
December 31, 2022 and 2021
The following tables show the Company’s investments’ gross unrealized losses and fair value, aggregated by investment category and length of time that individual securities have been in a continuous unrealized loss position at December 31, 2022 and 2021:
| | | | | | | | | | | | | | | | | | |
| | December 31, 2022 | ||||||||||||||||
| | Less than 12 Months | | 12 Months or More | | Total | ||||||||||||
Description of |
| Fair |
| Unrealized |
| Fair |
| Unrealized |
| Fair |
| Unrealized | ||||||
Securities | | Value | | Losses | | Value | | Losses | | Value | | Losses | ||||||
| | (In thousands) | ||||||||||||||||
US government agencies | | $ | 44,032 | | $ | (968) | | $ | — | | $ | — | | $ | 44,032 | | $ | (968) |
Subordinated notes | | | 11,185 | | | (1,565) | | | 10,300 | | | (1,501) | | | 21,485 | | | (3,066) |
State and municipal obligations | | | 100,599 | | | (7,408) | | | — | | | — | | | 100,599 | | | (7,408) |
Total temporarily impaired securities | | $ | 155,816 | | $ | (9,941) | | $ | 10,300 | | $ | (1,501) | | $ | 166,116 | | $ | (11,442) |
| | | | | | | | | | | | | | | | | | |
| | December 31, 2021 | ||||||||||||||||
| | Less than 12 Months | | 12 Months or More | | Total | ||||||||||||
Description of |
| Fair |
| Unrealized |
| Fair |
| Unrealized |
| Fair |
| Unrealized | ||||||
Securities | | Value | | Losses | | Value | | Losses | | Value | | Losses | ||||||
| | (In thousands) | ||||||||||||||||
US government agencies | | $ | — | | $ | — | | $ | — | | $ | — | | $ | — | | $ | — |
Subordinated notes | | | 14,204 | | | (148) | | | — | | | — | | | 14,204 | | | (148) |
State and municipal obligations | | | — | | | — | | | — | | | — | | | — | | | — |
Total temporarily impaired securities | | $ | 14,204 | | $ | (148) | | $ | — | | $ | — | | $ | 14,204 | | $ | (148) |
The unrealized losses on the Company’s investments in US government agencies, state and municipal obligations, and subordinated notes were caused by interest rate increases. Because the Company does not intend to sell the investments and it is not more likely than not the Company will be required to sell the investments before recovery of their amortized cost bases, which may be maturity, the Company does not consider those investments to be other-than-temporarily impaired at December 31, 2022.
Note 4: Loans and Allowance for Loan Losses
Categories of loans at December 31, include:
| | | | | | |
|
| 2022 |
| 2021 | ||
| | (In thousands) | ||||
Commercial loans | | $ | 90,548 | | $ | 90,892 |
Commercial real estate | |
| 270,312 | |
| 266,777 |
Residential real estate | |
| 94,012 | |
| 90,132 |
Installment loans | |
| 6,003 | |
| 6,571 |
Total gross loans | |
| 460,875 | |
| 454,372 |
Less allowance for loan losses | |
| (2,052) | |
| (3,673) |
Total loans | | $ | 458,823 | | $ | 450,699 |
The risk characteristics of each loan portfolio segment are as follows:
Commercial
Commercial loans are primarily based on the identified cash flows of the borrower and secondarily on the underlying collateral provided by the borrower. The cash flows of borrowers, however, may not be as expected and the collateral securing these loans may fluctuate in value. Most commercial loans are secured by the assets being financed or other business assets, such as accounts receivable or inventory, and may include a personal guarantee. Short-term loans may be made on an unsecured basis. In the case of loans secured by accounts receivable, the availability of funds for the repayment of these loans may be substantially dependent on the ability of the borrower to collect amounts due from its customers.
| | |
| 45 |
Notes to Consolidated Financial Statements
December 31, 2022 and 2021
Commercial Real Estate
Commercial real estate loans are viewed primarily as cash flow loans and secondarily as loans secured by real estate. Commercial real estate lending typically involves higher loan principal amounts and the repayment of these loans is generally dependent on the successful operation of the property securing the loan or the business conducted on the property securing the loan. Commercial real estate loans may be more adversely affected by conditions in the real estate markets or in the general economy. The characteristics of properties securing the Company’s commercial real estate portfolio are diverse, but with geographic location almost entirely in the Company’s market area. Management monitors and evaluates commercial real estate loans based on collateral, geography and risk grade criteria. In general, the Company avoids financing single purpose projects unless other underwriting factors are present to help mitigate risk. In addition, management tracks the level of owner-occupied commercial real estate versus nonowner-occupied loans.
Residential and Installment
Residential and installment loans consist of two segments - residential mortgage loans and personal loans. For residential mortgage loans that are secured by 1-4 family residences and are generally owner-occupied, the Company generally establishes a maximum loan-to-value ratio and requires private mortgage insurance if that ratio is exceeded. Home equity loans are typically secured by a subordinate interest in 1-4 family residences, and consumer personal loans are secured by consumer personal assets, such as automobiles or recreational vehicles. Some consumer personal loans are unsecured, such as small installment loans and certain lines of credit. Repayment of these loans is primarily dependent on the personal income of the borrowers, which can be impacted by economic conditions in their market areas, such as unemployment levels. Repayment can also be impacted by changes in property values on residential properties. Risk is mitigated by the fact that the loans are of smaller individual amounts and spread over a large number of borrowers.
| | |
46 |
| |
Notes to Consolidated Financial Statements
December 31, 2022 and 2021
The following tables present the balance in the allowance for loan losses and the recorded investment in loans based on portfolio segment and impairment method as of December 31, 2022 and 2021:
| | | | | | | | | | | | | | | | | | |
|
| 2022 | ||||||||||||||||
| | | |
| Commercial |
| | |
| | |
| | |
| | | |
| | Commercial | | Real Estate | | Residential | | Installment | | Unallocated | | Total | ||||||
|
| (In thousands) | ||||||||||||||||
Allowance for loan losses: | | | | | | | | | | | | | | | | | | |
Balance, beginning of year | | $ | 1,046 | | $ | 1,235 | | $ | 1,121 | | $ | 271 | | $ | — | | $ | 3,673 |
(Credit) Provision charged to expense | |
| (842) | |
| 141 | |
| (303) | |
| 49 | |
| — | |
| (955) |
Losses charged off | |
| (16) | |
| (561) | |
| (2) | |
| (143) | |
| — | |
| (722) |
Recoveries | |
| 27 | |
| — | |
| — | |
| 29 | |
| — | |
| 56 |
Balance, end of year | | $ | 215 | | $ | 815 | | $ | 816 | | $ | 206 | | $ | — | | $ | 2,052 |
Ending balance: individually evaluated for impairment | | $ | — | | $ | — | | $ | — | | $ | — | | $ | — | | $ | — |
Ending balance: collectively evaluated for impairment | | $ | 215 | | $ | 815 | | $ | 816 | | $ | 206 | | $ | — | | $ | 2,052 |
Loans: | |
| | |
| | |
| | |
| | |
|
| |
| |
Ending balance: individually evaluated for impairment | | $ | — | | $ | 123 | | $ | — | | $ | — | | $ | — | | $ | 123 |
Ending balance: collectively evaluated for impairment | | $ | 90,548 | | $ | 270,189 | | $ | 94,012 | | $ | 6,003 | | $ | — | | $ | 460,875 |
| | | | | | | | | | | | | | | | | | |
| | 2021 | ||||||||||||||||
|
| | |
| Commercial |
| | |
| | |
| | |
| | | |
| | Commercial | | Real Estate | | Residential | | Installment | | Unallocated | | Total | ||||||
|
| (In thousands) | ||||||||||||||||
Allowance for loan losses: |
| |
|
| |
|
| |
|
| |
|
| |
|
| |
|
Balance, beginning of year | | $ | 1,397 | | $ | 1,821 | | $ | 1,471 | | $ | 424 | | $ | — | | $ | 5,113 |
Provision charged to expense | |
| (276) | |
| (586) | |
| (331) | |
| (62) | |
| — | |
| (1,255) |
Losses charged off | |
| (78) | |
| — | |
| (26) | |
| (126) | |
| — | |
| (230) |
Recoveries | |
| 3 | |
| — | |
| 7 | |
| 35 | |
| — | |
| 45 |
Balance, end of year | | $ | 1,046 | | $ | 1,235 | | $ | 1,121 | | $ | 271 | | $ | — | | $ | 3,673 |
Ending balance: individually evaluated for impairment | | $ | — | | $ | 230 | | $ | — | | $ | — | | $ | — | | $ | 230 |
Ending balance: collectively evaluated for impairment | | $ | 1,046 | | $ | 1,005 | | $ | 1,121 | | $ | 271 | | $ | — | | $ | 3,443 |
Loans: | |
| | |
| | |
| | |
| | |
|
| |
| |
Ending balance: individually evaluated for impairment | | $ | — | | $ | 3,933 | | $ | — | | $ | — | | $ | — | | $ | 3,933 |
Ending balance: collectively evaluated for impairment | | $ | 90,892 | | $ | 262,844 | | $ | 90,132 | | $ | 6,571 | | $ | — | | $ | 450,439 |
To facilitate the monitoring of credit quality within the loan portfolio, and for purposes of analyzing historical loss rates used in the determination of the allowance for loan loss estimate, the Company utilizes the following categories of credit grades: pass, special mention, substandard, and doubtful. The four categories, which are derived from standard regulatory rating definitions, are assigned upon initial approval of credit to borrowers and updated periodically thereafter. Pass ratings, which are assigned to those borrowers that do not have identified potential or well defined weaknesses and for which there is a high likelihood of orderly repayment, are updated periodically based on the size and credit characteristics of the borrower. All other categories are updated on at least a quarterly basis.
We have successfully maintained credit-related strength and stability within our loan portfolio over the course of the past two years during the pandemic-induced economic downturn and this trend continued for our Company this past year. For the years ended December 31, 2022 and 2021 the Company recorded a credit to the loan loss provision of $955,000 and $1,255,000, respectively.
| | |
| 47 |
Notes to Consolidated Financial Statements
December 31, 2022 and 2021
The Company assigns a special mention rating to loans that have potential weaknesses that deserve management’s close attention. If left uncorrected, these potential weaknesses may, at some future date, result in the deterioration of the repayment prospects for the loan or the Company’s credit position.
The Company assigns a substandard rating to loans that are inadequately protected by the current sound worth and paying capacity of the borrower or of the collateral pledged. Substandard loans have well defined weaknesses or weaknesses that could jeopardize the orderly repayment of the debt. Loans and leases in this grade also are characterized by the distinct possibility that the Company will sustain some loss if the deficiencies noted are not addressed and corrected.
The Company assigns a doubtful rating to loans that have all the attributes of a substandard rating with the added characteristic that the weaknesses make collection or liquidation in full, on the basis of currently existing facts, conditions, and values, highly questionable and improbable. The possibility of loss is extremely high, but because of certain important and reasonable specific pending factors that may work to the advantage of and strengthen the credit quality of the loan or lease, its classification as an estimated loss is deferred until its more exact status may be determined. Pending factors may include a proposed merger or acquisition, liquidation proceeding, capital injection, perfecting liens on additional collateral or refinancing plans.
The following table shows the portfolio quality indicators as of December 31, 2022:
| | | | | | | | | | | | | | | |
|
| | |
| Commercial |
| | |
| | |
| | | |
Loan Class | | Commercial | | Real Estate | | Residential | | Installment | | Total | |||||
|
| (In thousands) | |||||||||||||
Pass Grade | | $ | 90,548 | | $ | 262,472 | | $ | 94,012 | | $ | 6,003 | | $ | 453,035 |
Special Mention | |
| — | |
| 4,066 | | | — | |
| — | |
| 4,066 |
Substandard | |
| — | |
| 3,774 | | | — | |
| — | |
| 3,774 |
Doubtful | |
| — | |
| — | |
| — | |
| — | |
| — |
| | $ | 90,548 | | $ | 270,312 | | $ | 94,012 | | $ | 6,003 | | $ | 460,875 |
The following table shows the portfolio quality indicators as of December 31, 2021:
| | | | | | | | | | | | | | | |
|
| | |
| Commercial |
| | |
| | |
| | | |
Loan Class | | Commercial | | Real Estate | | Residential | | Installment | | Total | |||||
|
| (In thousands) | |||||||||||||
Pass Grade | | $ | 90,892 | | $ | 254,760 | | $ | 90,132 | | $ | 6,571 | | $ | 442,355 |
Special Mention | |
| — | |
| 4,115 | | | — | |
| — | |
| 7,943 |
Substandard | |
| — | |
| 7,902 | | | — | |
| — | |
| 4,074 |
Doubtful | |
| — | |
| — | |
| — | |
| — | |
| — |
| | $ | 90,892 | | $ | 266,777 | | $ | 90,132 | | $ | 6,571 | | $ | 454,372 |
The Company evaluates the loan risk grading system definitions and allowance for loan losses methodology on an ongoing basis. No significant methodology changes were made during 2022 and 2021.
| | |
48 |
| |
Notes to Consolidated Financial Statements
December 31, 2022 and 2021
The following table shows the loan portfolio aging analysis of the recorded investment in loans as of December 31, 2022:
| | | | | | | | | | | | | | | | | | | | | |
|
| 30‑59 Days |
| 60‑89 Days |
| Greater |
| |
| |
| | |
| | ||||||
| | Past | | Past | | Than 90 | | | | Total Past | | | | | | ||||||
|
| Due and |
| Due and |
| Days and | | Non |
| Due and | | | | | Total Loans | ||||||
|
| Accruing |
| Accruing |
| Accruing | | Accrual | | Non Accrual | | Current | | Receivable | |||||||
|
| (In thousands) | |||||||||||||||||||
Commercial | | $ | 126 | | $ | — | | $ | — | | $ | — | | $ | 126 | | $ | 90,422 | | $ | 90,548 |
Commercial real estate | |
| 158 | |
| — | |
| — | |
| 9 | |
| 167 | |
| 270,145 | |
| 270,312 |
Residential | |
| 102 | |
| 24 | |
| — | |
| 173 | |
| 299 | |
| 93,713 | |
| 94,012 |
Installment | |
| 15 | |
| — | |
| — | |
| — | |
| 15 | |
| 5,988 | |
| 6,003 |
Total | | $ | 401 | | $ | 24 | | $ | — | | $ | 182 | | $ | 607 | | $ | 460,268 | | $ | 460,875 |
The following table shows the loan portfolio aging analysis of the recorded investment in loans as of December 31, 2021:
| | | | | | | | | | | | | | | | | | | | | |
|
| 30‑59 Days |
| 60‑89 Days |
| Greater |
| |
| |
| | |
| | ||||||
| | Past | | Past | | Than 90 | | | | Total Past | | | | | | ||||||
|
| Due and |
| Due and |
| Days and | | Non |
| Due and | | | | | Total Loans | ||||||
|
| Accruing |
| Accruing |
| Accruing | | Accrual | | Non Accrual | | Current | | Receivable | |||||||
|
| (In thousands) | |||||||||||||||||||
Commercial | | $ | 63 | | $ | — | | $ | — | | $ | — | | $ | 63 | | $ | 90,829 | | $ | 90,892 |
Commercial real estate | |
| 220 | |
| — | |
| — | |
| 3,818 | |
| 4,038 | |
| 262,739 | |
| 266,777 |
Residential | |
| 22 | |
| — | |
| — | |
| 391 | |
| 413 | |
| 89,719 | |
| 90,132 |
Installment | |
| 40 | |
| — | |
| — | |
| — | |
| 40 | |
| 6,531 | |
| 6,571 |
Total | | $ | 345 | | $ | — | | $ | — | | $ | 4,209 | | $ | 4,554 | | $ | 449,818 | | $ | 454,372 |
A loan is considered impaired, in accordance with the impairment accounting guidance (ASC 310-10-35-16), when based on current information and events, it is probable the Company will be unable to collect all amounts due from the borrower in accordance with the contractual terms of the loan. Impaired loans include nonperforming commercial loans but also include loans modified in troubled debt restructurings where concessions have been granted to borrowers experiencing financial difficulties. These concessions could include a reduction in the interest rate on the loan, payment extensions, forgiveness of principal, forbearance or other actions intended to maximize collection.
The following table presents impaired loans for the year ended December 31, 2022:
| | | | | | | | | | | | | | | |
|
| |
| |
| |
| Average |
| | |||||
| | | | Unpaid | | | | Investment in | | Interest | |||||
| | Recorded |
| Principal | | Specific |
| Impaired |
| Income | |||||
| | Balance | | Balance | | Allowance |
| Loans | | Recognized | |||||
|
| (In thousands) | |||||||||||||
Loans without a specific valuation allowance: |
| |
|
| |
|
| |
|
| |
|
| |
|
Commercial | | $ | — | | $ | — | | $ | — | | $ | 27 | | $ | 1 |
Commercial real estate | |
| 123 | |
| 123 | |
| — | |
| 130 | |
| 11 |
Real Estate | |
| — | |
| — | |
| — | |
| — | |
| — |
Installment | |
| — | |
| — | |
| — | |
| — | |
| — |
| | $ | 123 | | $ | 123 | | $ | — | | $ | 157 | | $ | 12 |
Loans with a specific valuation allowance: | | | | | | | | | | | | | | | |
Commercial | | $ | — | | $ | — | | $ | — | | $ | — | | $ | — |
Commercial real estate | |
| — | |
| — | |
| — | |
| 3,653 | |
| 40 |
Real Estate | | | — | | | — | | | — | | | — | | | — |
| | $ | — | | $ | — | | $ | — | | $ | 3,653 | | $ | 40 |
| | | | | | | | | | | | | | | |
Total: | | | | | | | | | | | | | | | |
Commercial | | $ | — | | $ | — | | $ | — | | $ | 27 | | $ | 1 |
Commercial Real Estate | | $ | 123 | | $ | 123 | | $ | — | | $ | 3,783 | | $ | 51 |
Real Estate | | $ | — | | $ | — | | $ | — | | $ | — | | $ | — |
Installment | | $ | — | | $ | — | | $ | — | | $ | — | | $ | — |
| | |
| 49 |
Notes to Consolidated Financial Statements
December 31, 2022 and 2021
The following table presents impaired loans for the year ended December 31, 2021:
| | | | | | | | | | | | | | | |
|
| | |
| | |
| | |
| Average |
| | | |
| | | | Unpaid | | | | Investment in | | Interest | |||||
| | Recorded |
| Principal | | Specific |
| Impaired |
| Income | |||||
| | Balance | | Balance | | Allowance |
| Loans | | Recognized | |||||
|
| (In thousands) | |||||||||||||
Loans without a specific valuation allowance: |
| |
|
| |
|
| |
|
| |
|
| |
|
Commercial | | $ | — | | $ | — | | $ | — | | $ | — | | $ | — |
Commercial real estate | |
| 128 | |
| 128 | |
| — | |
| 128 | |
| 6 |
Real Estate | | | — | | | — | | | — | | | — | | | — |
Installment | |
| — | |
| — | |
| — | |
| — | |
| — |
| |
| 128 | |
| 128 | |
| — | |
| 128 | |
| 6 |
Loans with a specific valuation allowance: | |
|
| |
|
| |
|
| |
|
| |
|
|
Commercial | | $ | — | | $ | — | | $ | — | | $ | — | | $ | — |
Commercial real estate | |
| 3,805 | |
| 3,805 | |
| 230 | |
| 3,822 | |
| 105 |
Real Estate | |
| — | |
| — | |
| — | |
| — | |
| — |
| | $ | 3,805 | | $ | 3,805 | | $ | 230 | | $ | 3,822 | | $ | 105 |
| |
|
| |
|
| |
|
| |
|
| |
|
|
Total: | |
|
| |
|
| |
|
| |
|
| |
|
|
Commercial | | $ | — | | $ | — | | $ | — | | $ | — | | $ | — |
Commercial Real Estate | | $ | 3,933 | | $ | 3,933 | | $ | 230 | | $ | 3,950 | | $ | 111 |
Real Estate | | $ | — | | $ | — | | $ | — | | $ | — | | $ | — |
Installment | | $ | — | | $ | — | | $ | — | | $ | — | | $ | — |
At December 31, 2022, the Company had certain loans that were modified in troubled debt restructurings and impaired. The modification of terms of such loans included one or a combination of the following: an extension of maturity, a reduction of the stated interest rate.
The following tables present information regarding troubled debt restructurings by class and by type of modification for the year ended December 31, 2022 and 2021:
| | | | | | | | |
| | Year Ended December 31, 2022 | ||||||
|
| |
| Pre-Modification |
| Post-Modification | ||
| | | | Outstanding | | Outstanding | ||
| | Number of |
| Recorded |
| Recorded | ||
| | Contracts |
| Investment |
| Investment | ||
|
| (In thousands) | ||||||
Commercial |
| — | | $ | — | | $ | — |
Commercial Real Estate | | 1 | | $ | 48 | | $ | 48 |
| | | | | | | | | | | | |
| | Year Ended December 31, 2022 | ||||||||||
|
| Interest |
| | |
| | |
| Total | ||
| | Only | | Term | | Combination | | Modification | ||||
|
| (In thousands) | ||||||||||
Commercial | | $ | — | | $ | — | | $ | — | | $ | — |
Commercial Real Estate | | $ | 1 | | $ | 1 | | $ | — | | $ | 1 |
| | |
50 |
| |
Notes to Consolidated Financial Statements
December 31, 2022 and 2021
The Company did not have any loan modifications during 2021.
| | | | | | | | |
| | Year Ended December 31, 2021 | ||||||
|
| |
| Pre-Modification |
| Post-Modification | ||
| | | | Outstanding | | Outstanding | ||
| | Number of | | Recorded | | Recorded | ||
| | Contracts | | Investment | | Investment | ||
|
| (In thousands) | ||||||
Commercial |
| — | | $ | — | | $ | — |
Commercial Real Estate |
| — | | $ | — | | $ | — |
| | | | | | | | | | | | |
| | Year Ended December 31, 2021 | ||||||||||
|
| Interest |
| | |
| | |
| Total | ||
| | Only | | Term | | Combination | | Modification | ||||
|
| (In thousands) | ||||||||||
Commercial | | $ | — | | $ | — | | $ | — | | $ | — |
Commercial Real Estate |
| $ | — |
| $ | — |
| $ | — |
| $ | — |
During the year ended December 31, 2022 and 2021, troubled debt restructurings did not have an impact on the allowance for loan losses. At December 31, 2022 and 2021 and for the years then ended, there were no material defaults of any troubled debt restructurings that were modified in the last 12 months. The Company generally considers TDR’s that become 90 days or more past due under the modified terms as subsequently defaulted.
Note 5: Premises and Equipment
Major classifications of premises and equipment, stated at cost, are as follows:
| | | | | | |
|
| 2022 |
| 2021 | ||
| | (In thousands) | ||||
Land, buildings and improvements | | $ | 20,493 | | $ | 19,838 |
Furniture and equipment | |
| 15,567 | |
| 15,079 |
Computer software | |
| 2,460 | |
| 2,284 |
| |
| 38,520 | |
| 37,201 |
Less accumulated depreciation | |
| (26,376) | |
| (24,444) |
Net premises and equipment | | $ | 12,144 | | $ | 12,757 |
Depreciation and amortization charged to operations was $1,013 in 2022.
Note 6: Time Deposits
Time deposits in denominations of $250,000 or more were $11.3 million at December 31, 2022 and $4.4 million at December 31, 2021. At December 31, 2022, the scheduled maturities of time deposits are as follows:
| | | |
|
| (In thousands) | |
Due during the year ending December 31, | | | |
2023 | | $ | 52,854 |
2024 | |
| 19,344 |
2025 | |
| 28,084 |
2026 | |
| 977 |
2027 | |
| 70 |
Thereafter | |
| 407 |
| | $ | 101,736 |
Note 7: Borrowings
At December 31, 2022 and 2021, as a member of the Federal Home Loan Bank system the Bank had the ability to obtain up to $177.2 million and $154.1 million, respectively, in additional borrowings based on securities and certain loans pledged to the FHLB. At December 31, 2022 and 2021, the Bank had approximately $248.0 million and $228.2 million, respectively of one-
| | |
| 51 |
Notes to Consolidated Financial Statements
December 31, 2022 and 2021
to four-family residential real estate and commercial real estate loans pledged as collateral for borrowings. Also at December 31, 2022 and 2021, the Company and the Bank have cash management lines of credit with various correspondent banks (excluding FHLB cash management lines of credit) enabling additional borrowings of up to $18.0 million. At December 31, 2022 and 2021 the Company had no outstanding borrowings with the FHLB.
Securities sold under repurchase agreements were approximately $18.1 million and $15.7 million at December 31, 2022 and 2021, respectively.
Securities sold under agreements to repurchase are financing arrangements whereby the Company sells securities and agrees to repurchase the identical securities at the maturities of the agreements at specified prices. Physical control is maintained for all securities sold under repurchase agreements. Information concerning securities sold under agreements to repurchase is summarized as follows:
| | | | | | | |
|
| 2022 |
| 2021 |
| ||
| | (Dollars in thousands) |
| ||||
Balance outstanding at year end | | $ | 18,106 | | $ | 15,701 | |
Average daily balance during the year | | $ | 22,581 | | $ | 19,452 | |
Average interest rate during the year | |
| 1.02 | % |
| 0.12 | % |
Maximum month-end balance during the year | | $ | 28,114 | | $ | 26,653 | |
Weighted-average interest rate at year end | |
| 3.04 | % |
| 0.12 | % |
All repurchase agreements are subject to term and conditions of repurchase/security agreements between the Company and the customer and are accounted for as secured borrowings. The Company’s repurchase agreements reflected in short-term borrowings consist of customer accounts and securities which are pledged on an individual security basis.
The following table presents the Company’s repurchase agreements accounted for as secured borrowings:
Remaining Contractual Maturity of the Agreement
(In thousands)
| | | | | | | | | | | | | | | |
|
| Overnight and |
| |
| |
| Greater than 90 |
| | |||||
December 31, 2022 |
| Continuous | | Up to 30 Days | | 30‑90 Days |
| Days | | Total | |||||
Repurchase Agreements |
| |
|
| |
|
| |
|
| |
|
| |
|
State and municipal obligations | | $ | 18,106 | | $ | — | | $ | — | | $ | — | | $ | 18,106 |
Total | | $ | 18,106 | | $ | — | | $ | — | | $ | — | | $ | 18,106 |
| | | | | | | | | | | | | | | |
|
| Overnight and |
| |
| |
| Greater than 90 |
| | |||||
December 31, 2021 |
| Continuous | | Up to 30 Days | | 30‑90 Days |
| Days | | Total | |||||
Repurchase Agreements |
| |
|
| |
|
| |
|
| |
|
| |
|
U.S government agencies | | $ | 15,701 | | $ | — | | $ | — | | $ | — | | $ | 15,701 |
Total | | $ | 15,701 | | $ | — | | $ | — | | $ | — | | $ | 15,701 |
Securities with an approximate carrying value of $38.8 million and $37.5 million at December 31, 2022 and 2021, respectively, were pledged as collateral for repurchase borrowings.
Note 8: Subordinated Debentures
On May 14, 2019 the Company issued $20,000,000 of junior subordinated debentures. The debentures bear interest at a fixed rate of 6.0% until May 2024, which then becomes a floating interest rate equal to the three-month LIBOR (or an equivalent index) plus 3.625%, resetting quarterly. Interest on the subordinated notes is payable semiannually through May 2024 and quarterly thereafter through the maturity date of May 2029. Principal is due upon maturity. The debentures are unsecured and payable to various investors. For purposes of computing regulatory capital, the debentures are included in Tier 2 Capital. The subordinated notes may not be repaid in whole or in part prior to the fifth anniversary of the issue date (May 2019). Unamortized debt costs were $398,000 and $459,000 as of December 31, 2022 and 2021, respectively.
In 2005, a Delaware statutory business trust owned by the Company, United Bancorp Statutory Trust I (“Trust I” or the “Trust”), issued $4.1 million of mandatorily redeemable debt securities. The sale proceeds were utilized to purchase $4.1 million of the
| | |
52 |
| |
Notes to Consolidated Financial Statements
December 31, 2022 and 2021
Company’s subordinated debentures which mature in 2035. The Company’s subordinated debentures are the sole asset of Trust I. The Company’s investment in Trust I is not consolidated herein as the Company is not deemed the primary beneficiary of the Trust. However, the $4.1 million of mandatorily redeemable debt securities issued by the Trust are includible for regulatory purposes as a component of the Company’s Tier I Capital. Interest on the Company’s subordinated debentures is equal to three month LIBOR plus 1.35% and is payable quarterly. Subordinated debentures, net of unamortized debt costs, totaled $23.7 million and $23.7 million at December 31, 2022 and 2021, respectively.
Note 9: Income Taxes
The provision for income taxes includes these components:
| | | | | | |
|
| 2022 |
| 2021 | ||
| | (In thousands) | ||||
Taxes currently payable | | $ | 537 | | $ | 1,118 |
Deferred income taxes | |
| 342 | |
| 112 |
Income tax expense | | $ | 879 | | $ | 1,230 |
| | | | | | |
A reconciliation of income tax expense at the statutory rate to the Company’s actual income tax expense is shown below:
| | | | | | |
|
| 2022 |
| 2021 | ||
| | (In thousands) | ||||
Computed at the statutory rate (21%) | | $ | 2,003 | | $ | 2,243 |
(Decrease) increase resulting from | |
| | |
| |
Tax exempt interest | |
| (935) | |
| (822) |
Earnings on bank-owned life insurance - net | |
| (149) | |
| (168) |
Low income housing credit | |
| (49) | |
| (52) |
Other | |
| 9 | |
| 29 |
Actual tax expense | | $ | 879 | | $ | 1,230 |
The tax effects of temporary differences related to deferred taxes shown on the balance sheets were:
| | | | | | |
|
| 2022 |
| 2021 | ||
| | (In thousands) | ||||
Deferred tax assets | | | | | | |
Allowance for loan losses | | $ | 431 | | $ | 771 |
Stock based compensation | |
| 310 | |
| 253 |
Deferred compensation, and other accruals | |
| 507 | |
| 472 |
Employee benefit expense | |
| — | |
| — |
Non-accrual loan interest | |
| 1 | |
| 33 |
Unrealized loss on securities available for sale | | | 2,307 | | | — |
Other | |
| 10 | |
| 7 |
Total deferred tax assets | |
| 3,566 | |
| 1,536 |
| |
|
| |
|
|
Deferred tax liabilities | |
|
| |
|
|
Depreciation | |
| (414) | | | (407) |
Deferred loan costs, net | |
| (11) | | | (34) |
FHLB stock dividends | |
| (182) | | | (304) |
Unrealized gains on securities available for sale | |
| — | | | (2,298) |
Prepaid expenses | |
| (68) | | | (49) |
Intangibles | |
| (78) | | | (97) |
Employee benefit expense | |
| (390) | | | (28) |
| | | | | | |
Total deferred tax liabilities | |
| (1,143) | | | (3,217) |
Net deferred tax asset (liability) | | $ | 2,423 | | $ | (1,681) |
| | |
| 53 |
Notes to Consolidated Financial Statements
December 31, 2022 and 2021
Note 10: Accumulated Other Comprehensive Income (Loss)
The components of accumulated other comprehensive income (loss), included in stockholders’ equity, are as follows:
| | | | | | |
|
| 2022 |
| 2021 | ||
| | (In thousands) | ||||
Net unrealized (loss) gain on securities available-for-sale | | $ | (10,984) | | $ | 10,943 |
Net unrealized loss for funded status of defined benefit plan liability | |
| (835) | |
| (2,127) |
| |
| (11,819) | |
| 8,816 |
Tax effect | |
| 2,483 | |
| (1,852) |
Net-of-tax amount | | $ | (9,336) | | $ | 6,964 |
Reclassifications out of accumulated other comprehensive income during 2021 and the affected line items in the Consolidated Financial Statements of Income were as follows:
| | | | | | |
|
| 2022 |
| 2021 | ||
|
| (In thousands) | ||||
Realized gains on securities available-for-sale | | $ | — | | $ | 1,250 |
Less provision for federal income taxes | |
| — | |
| 263 |
Reclassification adjustment, net of taxes | | $ | — | | $ | 987 |
Note 11: Regulatory Matters
The Company and the Bank are subject to various regulatory capital requirements administered by the federal banking agencies. Failure to meet minimum capital requirements can initiate certain mandatory–and possibly additional discretionary–actions by regulators that, if undertaken, could have a direct material effect on the Company’s and the Bank’s financial statements. Under capital adequacy guidelines and the regulatory framework for prompt corrective action, the Company and the Bank must meet specific capital guidelines that involve quantitative measures of assets, liabilities and certain off-balance-sheet items as calculated under regulatory accounting practices. The capital amounts and classification are also subject to qualitative judgments by the regulators about components, risk weightings and other factors. Furthermore, the Company and the Bank’s regulators could require adjustments to regulatory capital not reflected in these financial statements.
In July 2013, the Federal Reserve approved final rules, referred to herein as the Basel III Rules, establishing a new comprehensive capital framework for U.S. banking organizations. The Basel III Rules generally implement the Basel Committee on Banking Supervision’s December 2010 final capital framework referred to as “Basel III” for strengthening international capital standards. The Basel III Rules substantially revise the risk-based capital requirements applicable to bank holding companies and their depository institution subsidiaries, including the Company and Unified, as compared to the current U.S. general risk-based capital rules. The Basel III Rules revise the definitions and the components of regulatory capital, as well as address other issues affecting the computation of regulatory capital ratios. The Basel III rules added another capital ratio component “Tier 1 Common Capital Ratio” which is a measurement of a bank’s core equity capital compared with its total risk-weighted assets The Basel III Rules also prescribe a new standardized approach for risk weightings that expand the risk-weighting categories from the current categories to a larger more risk-sensitive number of categories, depending on the nature of the assets, generally ranging from 0% for U.S. government and agency securities, to 600% for certain equity exposures, and resulting in higher risk weights for a variety of asset classes.
The Basel III capital rules became effective for the Company and Unified on January 1, 2015, subject to phase-in periods for certain components. The net unrealized gain or loss on available-for-sale securities is not included in computing regulatory capital.
As of December 31, 2022, the most recent notification from Federal Deposit Insurance Corporation categorized the Bank as well capitalized under the regulatory framework for prompt corrective action. To be categorized as well-capitalized, the Bank must maintain capital ratios as set forth in the table. There are no conditions or events since that notification that management believes have changed the Bank’s category.
| | |
54 |
| |
Notes to Consolidated Financial Statements
December 31, 2022 and 2021
The Company’s and Bank’s actual capital amounts and ratios are presented in the following table.
| | | | | | | | | | | | | | | | |
| | | | | | | | | | | | To Be Well Capitalized |
| |||
| | | | | | | For Capital Adequacy | | Under Prompt Corrective |
| ||||||
| | Actual | | Purposes | | Action Provisions |
| |||||||||
|
| Amount |
| Ratio |
| Amount | �� | Ratio |
| Amount |
| Ratio | | |||
|
| (Dollars in thousands) | | |||||||||||||
As of December 31, 2022 | | | | | | | | | | | | | | | | |
Total Capital (to Risk-Weighted Assets) |
| |
|
|
|
| |
|
|
|
| |
|
|
| |
Consolidated | | $ | 103,369 |
| 17.4 | % | $ | 47,579 |
| 8.0 | % | | N/A |
| N/A | |
Unified | |
| 79,551 |
| 14.2 | |
| 44,778 |
| 8.0 | | $ | 55,973 |
| 10.0 | % |
| |
| |
| | |
| |
| | |
| |
| | |
Common Equity Tier 1 Capital (to Risk-Weighted Assets) | |
| |
| | |
| |
| | |
| |
| | |
Consolidated | | $ | 77,317 |
| 13.0 | % | $ | 26,763 |
| 4.5 | % |
| N/A |
| N/A | |
Unified | |
| 77,499 |
| 13.9 | |
| 25,188 |
| 4.5 | | $ | 36,383 |
| 6.5 | % |
| |
| |
| | |
| |
| | |
| |
| | |
Tier I Capital (to Risk-Weighted Assets) | |
| |
| | |
| |
| | |
| |
| | |
Consolidated | | $ | 81,317 |
| 13.7 | % | $ | 35,685 |
| 6.0 | % |
| N/A |
| N/A | |
Unified | |
| 77,499 |
| 13.9 | |
| 33,584 |
| 6.0 | | $ | 44,778 |
| 8.0 | % |
| |
| |
| | |
| |
| | |
| |
| | |
Tier I Capital (to Average Assets) | |
| |
| | |
| |
| | |
| |
| | |
Consolidated | | $ | 81,317 |
| 11.1 | % | $ | 29,387 |
| 4.0 | % |
| N/A |
| N/A | |
Unified | |
| 77,499 |
| 10.1 | |
| 30,617 |
| 4.0 | | $ | 38,272 |
| 5.0 | % |
| |
| |
| | |
| |
| | |
| |
| | |
As of December 31, 2021 | |
| |
| | |
| |
| | |
| |
| | |
Total Capital (to Risk-Weighted Assets) | |
| |
| | |
| |
| | |
| |
| | |
Consolidated | | $ | 96,785 |
| 19.5 | % | $ | 39,746 |
| 8.0 | % | | N/A |
| N/A | |
Unified | |
| 79,740 |
| 15.0 | |
| 42,683 |
| 8.0 | | $ | 53,353 |
| 10.0 | % |
| |
| |
| | |
| |
| | |
| |
| | |
Common Equity Tier 1 Capital (to Risk-Weighted Assets) | |
| |
| | |
| |
| | |
| |
| | |
Consolidated | | $ | 69,112 |
| 13.9 | % | $ | 22,357 |
| 4.5 | % |
| N/A |
| N/A | |
Unified | |
| 76,067 |
| 14.3 | |
| 24,009 |
| 4.5 | | $ | 34,680 |
| 6.5 | % |
| |
| |
| | |
| |
| | |
| |
| | |
Tier I Capital (to Risk-Weighted Assets) | |
| |
| | |
| |
| | |
| |
| | |
Consolidated | | $ | 73,112 |
| 14.7 | % | $ | 29,810 |
| 6.0 | % |
| N/A |
| N/A | |
Unified | |
| 76,067 |
| 14.3 | |
| 32,012 |
| 6.0 | | $ | 42,683 |
| 8.0 | % |
| |
| |
| | |
| |
| | |
| |
| | |
Tier I Capital (to Average Assets) | |
| |
| | |
| |
| | |
| |
| | |
Consolidated | | $ | 73,112 |
| 10.3 | % | $ | 28,438 |
| 4.0 | % |
| N/A |
| N/A | |
Unified | |
| 76,067 |
| 10.6 | |
| 28,594 |
| 4.0 | | $ | 35,742 |
| 5.0 | % |
Note 12: Related Party Transactions
At December 31, 2022 and 2021, the Bank had loan commitments outstanding to executive officers, directors, significant stockholders and their affiliates (related parties). In management’s opinion, such loans and other extensions of credit and deposits were made in the ordinary course of business and were made on substantially the same terms (including interest rates and collateral) as those prevailing at the time for comparable transactions with other persons. Further, in management’s opinion,
| | |
| 55 |
Notes to Consolidated Financial Statements
December 31, 2022 and 2021
these loans did not involve more than normal risk of collectability or present other unfavorable features. Such loans are summarized below.
| | | | | | |
|
| 2022 |
| 2021 | ||
| | (In thousands) | ||||
Aggregate balance – January 1 | | $ | 20,347 | | $ | 20,984 |
New loans | |
| 1,726 | |
| 4,439 |
Repayments | |
| (2,032) | |
| (5,076) |
Aggregate balance – December 31 | | $ | 20,041 | | $ | 20,347 |
Deposits from related parties held by the Bank at December 31, 2022 and 2021, totaled approximately $3.3 million and $5.6 million, respectively.
Note 13: Benefit Plans
Pension and Other Postretirement Benefit Plans
The Company has a noncontributory defined benefit pension plan covering all employees who meet the eligibility requirements. The Company’s funding policy is to make the minimum annual contribution that is required by applicable regulations, plus such amounts as the Company may determine to be appropriate from time to time. The Company expects to contribute $742,000 to the plan in 2023.
The Company has certain agreements which provide for a fixed number of payments once the individual reaches normal retirement age. At December 31, 2022, the present value of these future payments was approximately $397,000.
The Company uses a December 31st measurement date for the plan. Information about the plan’s funded status and pension cost follows:
| | | | | | |
| | Pension Benefits | ||||
|
| 2022 |
| 2021 | ||
| | (In thousands) | ||||
Change in benefit obligation |
| |
|
| |
|
Beginning of year | | $ | (7,558) | | $ | (7,215) |
Service cost | |
| (519) | | | (528) |
Interest cost | |
| (274) | | | (239) |
Actuarial gain (loss) | |
| 2,989 | | | 45 |
Benefits paid | |
| 282 | | | 379 |
| |
| | | | |
End of year | |
| (5,078) | | | (7,558) |
| |
| | | | |
Change in fair value of plan assets | |
| | | | |
Beginning of year | |
| 7,744 | | | 6,522 |
Actual return on plan assets | |
| (1,217) | | | 944 |
Employer contribution | |
| 744 | | | 657 |
Benefits paid | |
| (283) | | | (379) |
| |
| | | | |
End of year | |
| 6,988 | | | 7,744 |
| |
| | | | |
Funded (unfunded) status at end of year | | $ | 1,910 | | $ | 186 |
| | |
56 |
| |
Notes to Consolidated Financial Statements
December 31, 2022 and 2021
Amounts recognized in accumulated other comprehensive loss not yet recognized as components of net periodic benefit cost consist of:
| | | | | | |
| | Pension Benefits | ||||
|
| 2022 |
| 2021 | ||
| | (In thousands) | ||||
Unamortized net loss | | $ | 1,150 | | $ | 2,531 |
Unamortized prior service | |
| (315) | |
| (403) |
| |
| | |
| |
| | $ | 835 | | $ | 2,128 |
The estimated net loss and prior service credit for the defined benefit pension plan that will be amortized from accumulated other comprehensive income as a credit into net periodic benefit cost over the next fiscal year is approximately $89,000. The accumulated benefit obligation for the defined benefit pension plan was $4.4 million and $6.4 million at December 31, 2022 and 2021, respectively.
Information for the pension plan with respect to accumulated benefit obligation and plan assets is as follows:
| | | | | | |
| | December 31, | ||||
|
| 2022 |
| 2021 | ||
| | (In thousands) | ||||
Projected benefit obligation | | $ | 5,078 | | $ | 7,558 |
Accumulated benefit obligation | | $ | 4,421 | | $ | 6,405 |
Fair value of plan assets | | $ | 6,988 | | $ | 7,744 |
| | | | | | |
| | December 31, | ||||
|
| 2022 |
| 2021 | ||
| | (In thousands) | ||||
Components of net periodic benefit cost |
| |
|
| |
|
Service cost | | $ | 519 | | $ | 528 |
Interest cost | |
| 274 | |
| 239 |
Expected return on plan assets | |
| (575) | |
| (487) |
Amortization of prior service credit | |
| (89) | |
| (89) |
Amortization of net loss | |
| 183 | |
| 270 |
| |
| | |
| |
Net periodic benefit cost | | $ | 312 | | $ | 461 |
Significant assumptions include:
| | | | | |
| | Pension Benefits |
| ||
|
| 2022 |
| 2021 |
|
Weighted-average assumptions used to determine benefit obligation: |
|
|
|
| |
Discount rate |
| 3.75 | % | 3.75 | % |
Rate of compensation increase |
| 3.50 | % | 3.50 | % |
|
| |
| | |
Weighted-average assumptions used to determine benefit cost: |
| |
| | |
Discount rate |
| 3.75 | % | 3.75 | % |
Expected return on plan assets |
| 7.00 | % | 7.00 | % |
Rate of compensation increase |
| 3.50 | % | 3.50 | % |
The Company has estimated the long-term rate of return on plan assets based primarily on historical returns on plan assets, adjusted for changes in target portfolio allocations and recent changes in long-term interest rates based on publicly available information.
| | |
| 57 |
Notes to Consolidated Financial Statements
December 31, 2022 and 2021
The following benefit payments, which reflect expected future service, as appropriate, are expected to be paid as of December 31, 2022:
| | | |
|
| Pension | |
| | Benefits | |
|
| (In thousands) | |
2023 | | $ | 285 |
2024 | | | 304 |
2025 | |
| 333 |
2026 | |
| 318 |
2027 | |
| 613 |
2028-2032 | |
| 3,795 |
Total | | $ | 5,648 |
Plan assets are held by an outside trustee which invests the plan assets in accordance with the provisions of the plan agreement. All equity and fixed income investments are held in various mutual funds with quoted market prices. Mutual fund equity securities primarily include investment funds that are comprised of large-cap, mid-cap and international companies. Fixed income mutual funds primarily include investments in corporate bonds, mortgage-backed securities and U.S. Treasuries. Other types of investments include a prime money market fund.
The asset allocation strategy of the plan is designed to allow flexibility in the determination of the appropriate investment allocations between equity and fixed income investments. This strategy is designed to help achieve the actuarial long term rate on plan assets of 7.0%. The target asset allocation percentages for both 2022 and 2021 are as follows:
| | |
Large-Cap stocks |
| Not to exceed 68% |
Small-Cap stocks |
| Not to exceed 23% |
Mid-Cap stocks |
| Not to exceed 23% |
International equity securities |
| Not to exceed 30% |
Fixed income investments |
| Not to exceed 35% |
Alternative investments |
| Not to exceed 19% |
At December 31, 2022 and 2021, the fair value of plan assets as a percentage of the total was invested in the following:
| | | | | |
| | December 31, |
| ||
|
| 2022 |
| 2021 |
|
Equity securities |
| 70.0 | % | 69.5 | % |
Debt securities |
| 27.8 |
| 28.0 | |
Cash and cash equivalents |
| 2.2 |
| 2.5 | |
|
| |
| | |
|
| 100.0 | % | 100.0 | % |
Pension Plan Assets
Following is a description of the valuation methodologies used for pension plan assets measured at fair value on a recurring basis, as well as the general classification of pension plan assets pursuant to the valuation hierarchy.
Where quoted market prices are available in an active market, plan assets are classified within Level 1 of the valuation hierarchy. Level 1 plan assets include investments in mutual funds that involve equity, bond and money market investments. All of the Plan’s assets are classified as Level 1. If quoted market prices are not available, then fair values are estimated by using pricing models, quoted prices of plan assets with similar characteristics or discounted cash flows. In certain cases where Level 1 or Level 2 inputs are not available, plan assets are classified within Level 3 of the hierarchy. At December 31, 2022 and 2021, the Plan did not contain Level 2 or Level 3 investments.
| | |
58 |
| |
Notes to Consolidated Financial Statements
December 31, 2022 and 2021
The fair values of Company’s pension plan assets at December 31st, by asset category are as follows:
| | | | | | | | | | | | |
December 31, 2022 | ||||||||||||
| | | | | Fair Value Measurements Using | |||||||
|
| | |
| Quoted Prices |
| Significant |
| | |||
| | | |
| in Active |
| Other |
| Significant | |||
| | | |
| Markets for |
| Observable |
| Unobservable | |||
| | Total Fair |
| Identical Assets |
| Inputs |
| Inputs | ||||
Asset Category | | Value |
| (Level 1) |
| (Level 2) | | (Level 3) | ||||
|
| (In thousands) | ||||||||||
Mutual money market | | $ | 154 | | $ | 154 | | $ | — | | $ | — |
Mutual funds – equities | |
| | |
| | |
|
| |
|
|
ETF mutual funds | |
| 4,445 | |
| 4,445 | |
| — | |
| — |
Large and small Cap | |
| 142 | |
| 142 | |
| — | |
| — |
International | |
| 301 | |
| 301 | |
|
| |
|
|
Mutual funds – fixed income | |
| | |
| | |
|
| |
|
|
Fixed income | |
| 1,348 | |
| 1,348 | |
| — | |
| — |
ETF fixed income | |
| 598 | |
| 598 | |
| — | |
| — |
| |
| | |
| | |
|
| |
|
|
Total | | $ | 6,988 | | $ | 6,988 | | $ | — | | $ | — |
| | | | | | | | | | | | |
December 31, 2021 | ||||||||||||
| | | | | Fair Value Measurements Using | |||||||
|
| | |
| Quoted Prices |
| Significant |
| | | ||
| | | | | in Active | | Other | | Significant | |||
| | | | | Markets for | | Observable | | Unobservable | |||
| | Total Fair | | Identical Assets | | Inputs | | Inputs | ||||
Asset Category | | Value | | (Level 1) | | (Level 2) | | (Level 3) | ||||
|
| (In thousands) | ||||||||||
Mutual money market | | $ | 198 | | $ | 198 | | $ | — | | $ | — |
Mutual funds – equities | |
| | |
| | |
|
| |
|
|
ETF mutual funds | |
| 4,964 | |
| 4,964 | |
| — | |
| — |
Large and small Cap | |
| 99 | |
| 99 | |
| — | |
| — |
International | |
| 319 | |
| 319 | |
|
| |
|
|
Mutual funds – fixed income | |
| | |
| | |
|
| |
|
|
Fixed income | |
| 1,340 | |
| 1,340 | |
| — | |
| — |
ETF fixed income | |
| 824 | |
| 824 | |
| — | |
| — |
| |
| | |
| | |
|
| |
|
|
Total | | $ | 7,744 | | $ | 7,744 | | $ | — | | $ | — |
Employee Stock Ownership and 401(k) Plans
The Company has an Employee Stock Ownership Plan (“ESOP”) with an integrated 401(k) plan covering substantially all employees of the Company. The Company’s 401(k) matching percentage was 50% of the employees’ first 6% of contributions for 2022 and 2021.
The Company’s 401(k) expense for the years ended December 31, 2022 and 2021 was approximately $141,000 and $132,000, respectively.
| | |
| 59 |
Notes to Consolidated Financial Statements
December 31, 2022 and 2021
Share information for the ESOP is as follows at December 31, 2022 and 2021:
| | | | | | |
|
| 2022 |
| 2021 | ||
Allocated shares at beginning of the year | | | 398,104 | | | 417,086 |
Net shares distributed due to retirement/diversification | |
| (13,700) | |
| (18,982) |
| |
| | |
| |
Total ESOP shares | |
| 384,404 | |
| 398,104 |
| |
| | |
| |
Fair value of unearned shares at December 31st | | $ | — | | $ | — |
At December 31, 2022, the fair value of the 384,404 the shares held by the ESOP was approximately $5,658,000. There were no unearned ESOP shares as of December 31, 2022.
Split Dollar Life Insurance Arrangements
The Company has split-dollar life insurance arrangements with its executive officers and certain directors that provide certain death benefits to the executive’s beneficiaries upon his or her death. The agreements provide a pre- and post-retirement death benefit payable to the beneficiaries of the executive in the event of the executive’s death. The Company has purchased life insurance policies on the lives of all participants covered by these agreements in amounts sufficient to provide the sums necessary to pay the beneficiaries, and the Company pays all premiums due on the policies. In the case of an early separation from the Company, the nonvested executive portion of the death benefit is retained by the Company. The accumulated post retirement benefit obligation was $1.9 million and $1.8 million at December 31, 2022 and 2021, respectively.
Note 14: Restricted Stock Plan
During 2018, the Company’s stockholders authorized the adoption of the United Bancorp, Inc. 2018 Stock Incentive Plan (the “2018 Plan”). No more than 500,000 shares of the Company’s common stock may be issued under the 2018 Plan. As of December 31, 2021, 142,500 shares have been issued under this plan. The shares that may be issued can be authorized but unissued shares or treasury shares. The 2018 Plan permits the grant of incentive awards in the form of options, stock appreciation rights, restricted share and share unit awards, and performance share awards. The 2018 Plan contains annual limits on certain types of awards to individual participants. In any calendar year, no participant may be granted awards covering more than 25,000 shares.
During 2008, the Company’s stockholders authorized the adoption of the United Bancorp, Inc. 2008 Stock Incentive Plan (the “2008 Plan”). No more than 500,000 shares of the Company’s common stock may be issued under the 2008 Plan. The shares that may be issued can be authorized but unissued shares or treasury shares. The 2008 Plan permits the grant of incentive awards in the form of options, stock appreciation rights, restricted share and share unit awards, and performance share awards. The 2008 Plan contains annual limits on certain types of awards to individual participants. In any calendar year, no participant may be granted awards covering more than 25,000 shares. As of December 31, 2018, no additional shares can be awarded under the 2008 Plan.
The Company believes that such awards better align the interests of its employees with those of its stockholders. Stock options are generally granted with an exercise price, and restricted stock awards are valued, equal to the market price of the Company’s stock at the date of grant; stock option awards generally vest within 9.5 years of continuous service and have a 9.5 year contractual term. Restricted stock awards generally vest over a 9.5 year contractual term, or over the period to retirement, whichever is shorter. Restricted stock awards have no post-vesting restrictions. Restricted stock awards provide for accelerated vesting if there is a change in control (as defined in the Plans).
| | |
60 |
| |
Notes to Consolidated Financial Statements
December 31, 2022 and 2021
A summary of the status of the Company’s nonvested restricted shares as of December 31, 2022, and changes during the year then ended, is presented below:
| | | | | |
|
| |
| Weighted- | |
| | |
| Average | |
| | |
| Grant-Date | |
| | Shares |
| Fair Value | |
Nonvested, beginning of year |
| 317,500 | | $ | 11.83 |
Granted |
| — | |
| — |
Vested |
| (50,000) | |
| 17.20 |
Forfeited |
| (10,000) | |
| 9.94 |
Nonvested, end of year |
| 257,500 | | $ | 11.86 |
Total compensation cost recognized in the income statement for share-based payment arrangements during the years ended December 31, 2022 and 2021 was $1,006,000 and $414,000, respectively.
The recognized tax benefits related thereto were $211,000 and $65,000, for the years ended December 31, 2022 and 2021, respectively.
As of December 31, 2022 and 2021, there was $1,549,000 and $2,890,000, respectively, of total unrecognized compensation cost related to nonvested share-based compensation arrangements granted under the Plan. That cost is expected to be recognized over a weighted-average period of 4.1 years.
Note 15: Earnings Per Share
Earnings per share (EPS) were computed as follows:
| | | | | | | | |
| | Year Ended December 31, 2022 | ||||||
|
| | |
| Weighted- |
| | |
| | | | | Average | | | |
| | Net | | Shares | | Per Share | ||
| | Income | | Outstanding | | Amount | ||
| | (In thousands) | | | | | | |
Net income | | $ | 8,657 |
|
|
| |
|
Less allocated earnings on non-vested restricted stock | |
| (185) |
|
|
| |
|
Less allocated dividends on non-vested restricted stock | |
| (203) |
|
|
| |
|
Net income allocated to common stockholders | |
| 8,269 |
|
|
| |
|
| |
|
|
| 5,483,305 |
| |
|
Basic and diluted earnings per share | |
|
|
|
| | $ | 1.50 |
| | | | | | | | |
| | Year Ended December 31, 2021 | ||||||
|
| | |
| Weighted- |
| | |
| | | | | Average | | Per Share | |
| | Net | | Shares | | | | |
| | Income | | Outstanding | | Amount | ||
| | (In thousands) | | | | | | |
Net income | | $ | 9,451 |
|
|
| |
|
Less allocated earnings on non-vested restricted stock | |
| (348) |
|
|
| |
|
Less allocated dividends on non-vested restricted stock | |
| (221) |
|
|
| |
|
Net income allocated to common stockholders | |
| 8,882 |
|
|
| |
|
| |
|
|
| 5,477,266 |
| |
|
Basic and diluted earnings per share | |
|
|
|
| | $ | 1.62 |
| | |
| 61 |
Notes to Consolidated Financial Statements
December 31, 2022 and 2021
Note 16: Disclosures about Fair Value of Financial Instruments and Other Assets and Liabilities
The Company defines fair value as the price that would be received to sell an asset or paid to transfer a liability in an orderly transaction between market participants at the measurement date. The Company also utilizes a fair value hierarchy which requires an entity to maximize the use of observable inputs and minimize the use of unobservable inputs when measuring fair value. The standard describes three levels of inputs that may be used to measure fair value:
Level 1 | Quoted prices in active markets for identical assets or liabilities |
Level 2 | Observable inputs other than Level 1 prices, such as quoted prices for similar assets or liabilities; quoted prices in markets that are not active; or other inputs that are observable or can be corroborated by observable market data for substantially the full term of the assets or liabilities |
Level 3 | Unobservable inputs that are supported by little or no market activity and that are significant to the fair value of the assets or liabilities |
Following is a description of the valuation methodologies used for assets measured at fair value on a recurring basis and recognized in the accompanying balance sheets, as well as the general classification of such assets pursuant to the valuation hierarchy.
Available-for-sale Securities
Where quoted market prices are available in an active market, securities are classified within Level 1 of the valuation hierarchy. If quoted market prices are not available, then fair values are estimated by using quoted prices of securities with similar characteristics or independent asset pricing services and pricing models, the inputs of which are market-based or independently sourced market parameters, including, but not limited to, yield curves, interest rates, volatilities, prepayments, defaults, cumulative loss projections and cash flows. Such securities are classified in Level 2 of the valuation hierarchy.
The following tables present the fair value measurements of assets recognized in the accompanying balance sheets measured at fair value on a recurring basis and the level within the fair value hierarchy in which the fair value measurements fall at December 31, 2022 and 2021:
| | | | | | | | | | | | |
| | | | | December 31, 2022 | |||||||
| | | | | Fair Value Measurements Using | |||||||
|
| | |
| Quoted Prices in |
| Significant |
| | | ||
| | | | | Active Markets | | Other | | Significant | |||
| | | | | for Identical | | Observable | | Unobservable | |||
| | Fair | | Assets | | Inputs | | Inputs | ||||
| | Value | | (Level 1) | | (Level 2) | | (Level 3) | ||||
| | (In thousands) | ||||||||||
U.S government agencies | | $ | 44,032 | | $ | — | | $ | 44,032 | | $ | — |
Subordinated notes | | | 28,094 | | | — | | | 28,094 | | | — |
State and municipal obligation | | | 145,498 | |
| — | | | 145,498 | |
| — |
| | | | | | | | | | | | |
| | | | | December 31, 2021 | |||||||
| | | | | Fair Value Measurements Using | |||||||
|
| | |
| Quoted Prices in |
| Significant |
| | | ||
| | | | | Active Markets | | Other | | Significant | |||
| | | | | for Identical | | Observable | | Unobservable | |||
| | Fair | | Assets | | Inputs | | Inputs | ||||
| | Value | | (Level 1) | | (Level 2) | | (Level 3) | ||||
| | (In thousands) | ||||||||||
Subordinated notes | | $ | 28,765 | | $ | — | | $ | 28,765 | | $ | — |
State and municipal obligations | | | 117,548 | |
| — | | | 117,548 | |
| — |
Following is a description of the valuation methodologies used for instruments measured at fair value on a non-recurring basis and recognized in the accompanying balance sheets, as well as the general classification of such instruments pursuant to the valuation hierarchy.
| | |
62 |
| |
Notes to Consolidated Financial Statements
December 31, 2022 and 2021
Impaired Loans (Collateral Dependent)
Collateral dependent impaired loans consisted primarily of loans secured by nonresidential real estate. Management has determined fair value measurements on impaired loans primarily through evaluations of appraisals performed. Due to the nature of the valuation inputs, impaired loans are classified within Level 3 of the hierarchy.
The Company considers the appraisal or evaluation as the starting point for determining fair value and then considers other factors and events in the environment that may affect the fair value. Appraisals of the collateral underlying collateral-dependent loans are obtained when the loan is determined to be collateral-dependent and subsequently as deemed necessary by the Company’s Chief Lender. Appraisals are reviewed for accuracy and consistency by the Company’s Chief Lender. Appraisers are selected from the list of approved appraisers maintained by management. The appraised values are reduced by discounts to consider lack of marketability and estimated cost to sell if repayment or satisfaction of the loan is dependent on the sale of the collateral. These discounts and estimates are developed by the Company’s Chief Lender by comparison to historical results.
Foreclosed Assets Held for Sale
Assets acquired through, or in lieu of, loan foreclosure are held for sale and are initially recorded at fair value (based on current appraised value) at the date of foreclosure, establishing a new cost basis. Subsequent to foreclosure, valuations are periodically performed by management and the assets are carried at the lower of carrying amount or fair value less cost to sell. Management has determined fair value measurements on other real estate owned primarily through evaluations of appraisals performed, and current and past offers for the other real estate under evaluation. Due to the nature of the valuation inputs, foreclosed assets held for sale are classified within Level 3 of the hierarchy.
Appraisals of other real estate owned (OREO) are obtained when the real estate is acquired and subsequently as deemed necessary by the Company’s Chief Lender. Appraisals are reviewed for accuracy and consistency by the Company’s Chief Lender and are selected from the list of approved appraisers maintained by management.
The following tables present the fair value measurements of assets recognized in the accompanying balance sheets measured at fair value on a non-recurring basis and the level within the fair value hierarchy in which the fair value measurements fall at December 31, 2022 and 2021:
| | | | | | | | | | | | |
| | | | | December 31, 2022 | |||||||
| | | | | Fair Value Measurements Using | |||||||
|
| | |
| Quoted Prices in |
| Significant |
| | | ||
| | | | | Active Markets | | Other | | Significant | |||
| | | | | for Identical | | Observable | | Unobservable | |||
| | Fair | | Assets | | Inputs | | Inputs | ||||
| | Value | | (Level 1) | | (Level 2) | | (Level 3) | ||||
| | (In thousands) | ||||||||||
Collateral dependent impaired loans | | $ | 9 | | $ | — | | $ | — | | $ | 9 |
Foreclosed assets held for sale | |
| 3,519 | |
| — | |
| — | |
| 3,519 |
| | | | | | | | | | | | |
| | | | | December 31, 2021 | |||||||
| | | | | Fair Value Measurements Using | |||||||
|
| |
| Quoted Prices in |
| Significant |
| | ||||
| | | | Active Markets | | Other | | Significant | ||||
| | | | for Identical | | Observable | | Unobservable | ||||
| | Fair | | Assets | | Inputs | | Inputs | ||||
| | Value | | (Level 1) | | (Level 2) | | (Level 3) | ||||
| | (In thousands) | ||||||||||
Collateral dependent impaired loans | | $ | 2,822 | | $ | — | | $ | — | | $ | 2,822 |
Foreclosed assets held for sale | |
| — | |
| — | |
| — | |
| — |
| | |
| 63 |
Notes to Consolidated Financial Statements
December 31, 2022 and 2021
Unobservable (Level 3) Inputs
The following tables present quantitative information about unobservable inputs used in nonrecurring Level 3 fair value measurements.
| | | | | | | | | |
|
| Fair Value at |
| Valuation |
| |
| | |
| | 12/31/22 | | Technique | | Unobservable Inputs | | Range | |
| | (In thousands) | | | | | | | |
Collateral-dependent impaired loans | | $ | 9 |
| Market comparable properties |
| Comparability adjustments |
| 5% – 10% |
Foreclosed assets held for sale | |
| 3,519 |
| Market comparable properties |
| Marketability discount |
| 10% – 35% |
| | | | | | | | | |
|
| Fair Value at |
| Valuation |
| |
| | |
| | 12/31/21 | | Technique | | Unobservable Inputs | | Range | |
| | (In thousands) | | | | | | | |
Collateral-dependent impaired loans | | $ | 2,822 |
| Market comparable properties |
| Comparability adjustments |
| 5% – 10% |
Foreclosed assets held for sale | |
| — |
| Market comparable properties |
| Marketability discount |
| 10% – 35% |
There were no significant changes in the valuation techniques used during 2022.
The following table presents estimated fair values of the Company’s financial instruments not required to be reported at fair value. The fair values of certain of these instruments were calculated by discounting expected cash flows, which involves significant judgments by management and uncertainties. Fair value is the estimated amount at which financial assets or liabilities could be exchanged in a current transaction between willing parties, other than in a forced or liquidation sale. Because no market exists for certain of these financial instruments and because management does not intend to sell these financial
| | |
64 |
| |
Notes to Consolidated Financial Statements
December 31, 2022 and 2021
instruments, the Company does not know whether the fair values shown below represent values at which the respective financial instruments could be sold individually or in the aggregate.
| | | | | | | | | | | | |
| | | | | Fair Value Measurements Using | |||||||
|
| | |
| Quoted Prices |
| | |
| | | |
| | | | | in Active | | | | | | | |
| | | | | Markets for | | Significant | | Significant | |||
| | | | | Identical | | Other | | Unobservable | |||
| | Carrying | | Assets | | Observable Inputs | | Inputs | ||||
| | Amount | | (Level 1) | | (Level 2) | | (Level 3) | ||||
| | (In thousands) | ||||||||||
December 31, 2022 | | | | | | | | | | | | |
Financial assets |
| |
|
| |
|
| |
|
| |
|
Cash and cash equivalents | | $ | 30,080 | | $ | 30,080 | | $ | — | | $ | — |
Loans, net of allowance | |
| 458,823 | |
| — | |
| — | |
| 444,704 |
Federal Home Loan Bank stock | |
| 2,499 | |
| — | |
| 2,499 | |
| — |
Accrued interest receivable | |
| 3,403 | |
| — | |
| 3,403 | |
| — |
| |
| | |
|
| |
| | |
|
|
Financial liabilities | |
| | |
|
| |
| | |
|
|
Deposits | | $ | 649,913 | | $ | — | | $ | 646,455 | | $ | — |
Securities sold under repurchase agreements | |
| 18,106 | |
| — | |
| 18,106 | |
| — |
Subordinated debentures | |
| 23,726 | |
| — | |
| 24,454 | |
| — |
Interest payable | |
| 304 | |
| — | |
| 304 | |
| — |
The fair value has been derived from the December 31, 2021 audited consolidated financial statements.
| | | | | | | | | | | | |
| | | | | Fair Value Measurements Using | |||||||
|
| | |
| Quoted Prices |
| | |
| | | |
| | | | | in Active | | Significant | | | | ||
| | | | | Markets for | | Other | | Significant | |||
| | | | | Identical | | Observable | | Unobservable | |||
| | Carrying | | Assets | | Inputs | | Inputs | ||||
| | Amount | | (Level 1) | | (Level 2) | | (Level 3) | ||||
| | (In thousands) | ||||||||||
December 31, 2021 | | | | | | | | | | | | |
Financial assets |
| |
|
| |
|
| |
|
| |
|
Cash and cash equivalents | | $ | 82,999 | | $ | 82,999 | | $ | — | | $ | — |
Loans, net of allowance | |
| 450,699 | |
| — | |
| — | |
| 459,031 |
Federal Home Loan Bank stock | |
| 3,704 | |
| — | |
| 3,704 | |
| — |
Accrued interest receivable | |
| 2,345 | |
| — | |
| 2,345 | |
| — |
| |
| | |
|
| |
| | |
|
|
Financial liabilities | |
| | |
|
| |
| | |
|
|
Deposits | | $ | 605,136 | | $ | — | | $ | 605,855 | | $ | — |
Securities sold under repurchase agreements | |
| 15,701 | |
| — | |
| 15,701 | |
| — |
Subordinated debentures | |
| 23,665 | |
| — | |
| 23,575 | |
| — |
Interest payable | |
| 180 | |
| — | |
| 180 | |
| — |
The following methods and assumptions were used to estimate the fair value of each class of financial instruments.
Cash and Cash Equivalents, Accrued Interest Receivable and Federal Home Loan Bank Stock
The carrying amounts approximate fair value.
Loans
Fair values of loans and leases are estimated on an exit price basis incorporating discounts for credit, liquidity and marketability factors.
| | |
| 65 |
Notes to Consolidated Financial Statements
December 31, 2022 and 2021
Deposits
Deposits include demand deposits, savings accounts, NOW accounts and certain money market deposits. The carrying amount approximates fair value. The fair value of fixed-maturity time deposits is estimated using a discounted cash flow calculation that applies the rates currently offered for deposits of similar remaining maturities.
Interest Payable
The carrying amount approximates fair value.
Securities Sold Under Repurchase Agreements and Subordinated Debentures
Rates currently available to the Company for debt with similar terms and remaining maturities are used to estimate the fair value of existing debt.
Commitments to Originate Loans, Letters of Credit and Lines of Credit
The fair value of commitments to originate loans is estimated using the fees currently charged to enter into similar agreements, taking into account the remaining terms of the agreements and the present creditworthiness of the counterparties. For fixed-rate loan commitments, fair value also considers the difference between current levels of interest rates and the committed rates. The fair values of letters of credit and lines of credit are based on fees currently charged for similar agreements or on the estimated cost to terminate or otherwise settle the obligations with the counterparties at the reporting date. Fair values of commitments were not material at December 31, 2022 and 2021.
Note 17: Significant Estimates and Concentrations
Accounting principles generally accepted in the United States of America require disclosure of certain significant estimates and current vulnerabilities due to certain concentrations. Estimates related to the allowance for loan losses are reflected in the footnote regarding loans. Current vulnerabilities due to certain concentrations of credit risk are discussed in the footnote on commitments and credit risk.
The Company invests in various investment securities. Investment securities are exposed to various risks such as interest rate, market and credit risks. Due to the level of risk associated with certain investment securities, it is possible that changes in the values of investment securities may occur and that such changes could affect the amounts reported in the accompanying statements of financial position.
Note 18: Commitments and Credit Risk
At December 31, 2022 and 2021, total commercial and commercial real estate loans made up 78.3% and 78.7%, respectively, of the loan portfolio. Installment loans account for 1.3% and 1.5%, respectively, of the loan portfolio. Real estate loans comprise 20.4% and 19.8% of the loan portfolio as of December 31, 2022 and 2021, respectively, and primarily include first mortgage loans on residential properties and home equity lines of credit.
Included in cash and cash and cash equivalents as of December 31, 2022 and 2021 is $21.5 million and $79.6 million, respectively, of deposits with the Federal Reserve Bank of Cleveland and the Federal Home Loan Bank.
Commitments to Originate Loans
Commitments to originate loans are agreements to lend to a customer as long as there is no violation of any condition established in the contract. Commitments generally have fixed expiration dates or other termination clauses and may require payment of a fee. Since a portion of the commitments may expire without being drawn upon, the total commitment amounts do not necessarily represent future cash requirements. Each customer’s creditworthiness is evaluated on a case-by-case basis. The amount of collateral obtained, if deemed necessary, is based on management’s credit evaluation of the counterparty. Collateral held varies, but may include accounts receivable, inventory, property, plant and equipment, commercial real estate and residential real estate.
| | |
66 |
| |
Notes to Consolidated Financial Statements
December 31, 2022 and 2021
At December 31, 2022 and 2021, the Company had outstanding commitments to originate variable rate loans aggregating approximately $77.9 million and $75.8 million, respectively. The commitments extended over varying periods of time with the majority being disbursed within a one-year period.
Mortgage loans in the process of origination represent amounts that the Company plans to fund within a normal period of 60 to 90 days, some of which are intended for sale to investors in the secondary market. The Company did not have any mortgage loans in the process of origination which are intended for sale at December 31, 2022 or 2021.
Standby Letters of Credit
Standby letters of credit are irrevocable conditional commitments issued by the Company to guarantee the performance of a customer to a third party. Financial standby letters of credit are primarily issued to support public and private borrowing arrangements, including commercial paper, bond financing and similar transactions. Performance standby letters of credit are issued to guarantee performance of certain customers under non-financial contractual obligations. The credit risk involved in issuing standby letters of credit is essentially the same as that involved in extending loans to customers. Fees for letters of credit are initially recorded by the Company as deferred revenue and are included in earnings at the termination of the respective agreements. Should the Company be obligated to perform under the standby letters of credit, the Company may seek recourse from the customer for reimbursement of amounts paid.
The Company had $136,000 and $127,000 at December 31, 2022 and 2021, respectively in outstanding standby letters of credit. At both December 31, 2022 and 2021, the Company had no deferred revenue under standby letter of credit agreements.
Lines of Credit and Other
Lines of credit are agreements to lend to a customer as long as there is no violation of any condition established in the contract. Lines of credit generally have fixed expiration dates. Since a portion of the line may expire without being drawn upon, the total unused lines do not necessarily represent future cash requirements. Each customer’s creditworthiness is evaluated on a case-by-case basis. The amount of collateral obtained, if deemed necessary, is based on management’s credit evaluation of the counterparty. Collateral held varies but may include accounts receivable, inventory, property, plant and equipment, commercial real estate and residential real estate. Management uses the same credit policies in granting lines of credit as it does for on-balance-sheet instruments.
At December 31, 2022, the Company had granted unused lines of credit to borrowers aggregating approximately $79.7 million and $37.6 million for commercial lines and open-end consumer lines, respectively. At December 31, 2021, the Company had granted unused lines of credit to borrowers aggregating approximately $78.1 million and $39.6 million for commercial lines and open-end consumer lines, respectively.
Note 19: Recent Accounting Pronouncements
In June 2016, the FASB issued ASU No. 2016-13, “Financial Instruments-Credit Losses (Topic 326) - Measurement of Credit Losses on Financial Instruments.” The provisions of ASU 2016-13 were issued to provide financial statement users with more decision-useful information about the expected credit losses on financial instruments that are not accounted for at fair value through net income, including loans held for investment, held-to-maturity debt securities, trade and other receivables, net investment in leases and other commitments to extend credit held by a reporting entity at each reporting date. ASU 2016-13 requires that financial assets measured at amortized cost be presented at the net amount expected to be collected, through an allowance for credit losses that is deducted from the amortized cost basis. The amendments in ASU 2016-13 eliminate the probable incurred loss recognition in current GAAP and reflect an entity’s current estimate of all expected credit losses. The measurement of expected credit losses is based upon historical experience, current conditions, and reasonable and supportable forecasts that affect the collectability of the financial assets.
For purchased financial assets with a more-than-insignificant amount of credit deterioration since origination (“PCD assets”) that are measured at amortized cost, the initial allowance for credit losses is added to the purchase price rather than being reported as a credit loss expense. Subsequent changes in the allowance for credit losses on PCD assets are recognized through the statement of income as a credit loss expense.
| | |
| 67 |
Notes to Consolidated Financial Statements
December 31, 2022 and 2021
Credit losses relating to available-for-sale debt securities will be recorded through an allowance for credit losses rather than as a direct write-down to the security.
On October 16, 2019, FASB approved a final ASU delaying the effective date of ASU 2016-13 for small reporting companies to interim and annual periods beginning after December 15, 2022. The Company is currently evaluating the impact of these amendments to the Company’s financial position and results of operations and currently does not know or cannot reasonably quantify the impact of the adoption of the amendments as a result of the complexity and extensive changes from the amendments. The Allowance for Loan Losses (ALL) estimate is material to the Company and given the change from an incurred loss model to a methodology that considers the credit loss over the life of the loan, there is the potential for an increase in the ALL at adoption date. The Company is anticipating a significant change in the processes and procedures to calculate the ALL, including changes in assumptions and estimates to consider expected credit losses over the life of the loan versus the current accounting practice that utilizes the incurred loss model. In addition, the current accounting policy and procedures for the other-than-temporary impairment on available-for-sale securities will be replaced with an allowance approach. The Company continues to run projections and now have multiple scenarios to consider and continues to review segmentation to ensure it is fully compliant with the amendments at adoption date. For additional information on the allowance for loan losses, see Note 4.
As a result of adopting this standard, the Company expects the increase in its allowance during the first quarter of 2023, to be in the range of $2.3 million to $2.9 million. These estimates are subject to further refinements based on ongoing evaluations of our model, methodologies, and judgments, as well as prevailing economic conditions and forecasts as of the adoption date. The adoption of ASU 2016-13 is not expected to have a significant impact on our regulatory capital ratios.
| | |
68 |
| |
Notes to Consolidated Financial Statements
December 31, 2022 and 2021
Note 20: Condensed Financial Information (Parent Company Only)
Presented below is condensed financial information as to financial position, results of operations and cash flows of the Company:
Condensed Balance Sheets
| | | | | | |
| | December 31, | ||||
|
| 2022 |
| 2021 | ||
| | (In thousands) | ||||
Assets | | | | | | |
Cash and cash equivalents | | $ | 11,273 | | $ | 9,092 |
Investment in the Bank | |
| 69,914 | |
| 85,954 |
Other assets | |
| 3,110 | |
| 1,182 |
| |
| | |
| |
Total assets | | $ | 84,297 | | $ | 96,228 |
| |
| | |
| |
Liabilities and Stockholders’ Equity | |
| | |
| |
Subordinated debentures | | $ | 23,726 | | $ | 23,665 |
Other liabilities | |
| 834 | |
| 862 |
Stockholders’ equity | |
| 59,737 | |
| 71,701 |
| �� |
| | |
| |
Total liabilities and stockholders’ equity | | $ | 84,297 | | $ | 96,228 |
Condensed Statements of Income and Comprehensive Income
| | | | | | |
| | Years Ended December 31, | ||||
|
| 2022 |
| 2021 | ||
| | (In thousands) | ||||
Operating Income |
| |
|
| |
|
Dividends from subsidiary | | $ | 10,779 | | $ | 12,363 |
Interest and dividend income from securities and federal funds | |
| — | |
| — |
| |
| | |
| |
Total operating income | |
| 10,779 | |
| 12,363 |
| |
| | |
| |
General, Administrative and Other Expenses | |
| 4,498 | |
| 4,210 |
| |
| | |
| |
Income (Loss) Before Income Taxes and Equity in Undistributed Income of Subsidiary | |
| 6,281 | |
| 8,153 |
| |
| | |
| |
Income Tax Benefits | |
| 1,095 | |
| 773 |
| |
| | |
| |
Income (Loss) Before Equity in Undistributed Income of Subsidiary | |
| 7,376 | |
| 8,926 |
| |
| | |
| |
Equity in Undistributed Income of Subsidiary | |
| 1,281 | |
| 525 |
| |
| | |
| |
Net Income | | $ | 8,657 | | $ | 9,451 |
| |
| | |
| |
Comprehensive (Loss) Income | | $ | (7,643) | | $ | 7,132 |
| | |
| 69 |
Notes to Consolidated Financial Statements
December 31, 2022 and 2021
Condensed Statements of Cash Flows
| | | | | | |
| | Years Ended December 31, | ||||
|
| 2022 |
| 2021 | ||
| | (In thousands) | ||||
Operating Activities | | | | | | |
Net income | | $ | 8,657 | | $ | 9,451 |
Items not requiring (providing) cash | |
| | | | |
Equity in undistributed income of subsidiary | |
| (1,281) | | | (525) |
Amortization of share-based compensation plans | |
| 1,005 | | | 404 |
Net change in other assets and other liabilities | |
| (874) | | | 251 |
| |
| | | | |
Net cash provided by operating activities | |
| 7,507 | | | 9,581 |
| |
| | | | |
Investing Activities | |
| | | | |
| |
| | | | |
Net cash used in investing activities | |
| — | | | — |
| |
| | | | |
Financing Activities | |
| | | | |
Repurchase of common stock | |
| (767) | | | (72) |
Dividends paid to stockholders | |
| (4,559) | | | (4,101) |
| |
| | | | |
Net cash used in financing activities | |
| (5,326) | | | (4,173) |
| |
| | | | |
Net Change in Cash and Cash Equivalents | |
| 2,181 | | | 5,408 |
| |
| | | | |
Cash and Cash Equivalents at Beginning of Year | | | 9,092 | | | 3,684 |
| | | | | | |
Cash and Cash Equivalents at End of Year | | $ | 11,273 | | $ | 9,092 |
Note 21: Quarterly Financial Data (Unaudited)
The following tables summarize the Company’s quarterly results of operations for the years ended December 31, 2022 and 2021.
| | | | | | | | | | | | |
| | Three Months Ended | ||||||||||
2022: |
| March 31, |
| June 30, |
| September 30, |
| December 31, | ||||
|
| (In thousands, except per share data) | ||||||||||
Total interest income | | $ | 5,997 | | $ | 6,445 | | $ | 7,297 | | $ | 7,922 |
Total interest expense | |
| 487 | |
| 477 | |
| 928 | |
| 1,381 |
| |
| | |
| | |
| | |
| |
Net interest income | |
| 5,510 | |
| 5,968 | |
| 6,369 | |
| 6,541 |
| |
| | |
| | |
| | |
| |
Provision (Credit) for loan losses | |
| (500) | |
| (485) | |
| 15 | |
| 15 |
Noninterest income | |
| 987 | |
| 988 | |
| 1,043 | |
| 1,065 |
Noninterest expense | |
| 5,110 | |
| 4,849 | |
| 4,879 | |
| 5,052 |
| |
| | |
| | |
| | |
| |
Income before income taxes | |
| 1,887 | |
| 2,592 | |
| 2,518 | |
| 2,539 |
Federal income taxes | |
| 136 | |
| 295 | |
| 215 | |
| 233 |
| |
| | |
| | |
| | |
| |
Net income | | $ | 1,751 | | $ | 2,297 | | $ | 2,303 | | $ | 2,306 |
| |
| | |
| | |
| | |
| |
Earnings per share | |
| | |
| | |
| | |
| |
Basic | | $ | 0.30 | | $ | 0.40 | | $ | 0.40 | | $ | 0.40 |
Diluted | | $ | 0.30 | | $ | 0.40 | | $ | 0.40 | | $ | 0.40 |
| | |
70 |
| |
Notes to Consolidated Financial Statements
December 31, 2022 and 2021
| | | | | | | | | | | | |
| | Three Months Ended | ||||||||||
2021: |
| March 31, |
| June 30, |
| September 30, |
| December 31, | ||||
| | (In thousands, except per share data) | ||||||||||
Total interest income | | $ | 6,088 | | $ | 6,233 | | $ | 6,234 | | $ | 6,153 |
Total interest expense | |
| 775 | |
| 676 | |
| 629 | |
| 516 |
| |
| | |
| | |
| | |
| |
Net interest income | |
| 5,313 | |
| 5,557 | |
| 5,605 | |
| 5,637 |
| |
| | |
| | |
| | |
| |
Provision for loan losses | |
| (205) | |
| (250) | |
| (400) | |
| (400) |
Noninterest income | |
| 926 | |
| 1,142 | |
| 2,287 | |
| 1,351 |
Noninterest expense | |
| 4,449 | |
| 4,550 | |
| 4,942 | |
| 4,451 |
| |
| | |
| | |
| | |
| |
Income before income taxes | |
| 1,995 | |
| 2,399 | |
| 3,350 | |
| 2,937 |
Federal income taxes | |
| 87 | |
| 214 | |
| 448 | |
| 481 |
| |
| | |
| | |
| | |
| |
Net income | | $ | 1,908 | | $ | 2,185 | | $ | 2,902 | | $ | 2,456 |
| |
| | |
| | |
| | |
| |
Earnings per share | |
| | |
| | |
| | |
| |
Basic | | $ | 0.33 | | $ | 0.38 | | $ | 0.50 | | $ | 0.41 |
Diluted | | $ | 0.33 | | $ | 0.38 | | $ | 0.50 | | $ | 0.41 |
Note 22: Goodwill and Core Deposits
The following table shows the changes in the carrying amount of goodwill for the years ended December 31, 2022 and 2021 (in thousands):
| | | | | | |
|
| 2022 |
| 2021 | ||
Balance beginning of year | | $ | 682 | | $ | 682 |
Additions from acquisition | |
| — | |
| — |
Balance, end of year | | $ | 682 | | $ | 682 |
Intangible assets in the consolidated balance sheets at December 31, 2022 and 2021 were as follows (in thousands):
| | | | | | | | | | | | | | | | | | |
| | 2022 | | | 2021 | |||||||||||||
| | Gross | | | | | | | | | Gross | | | | | | | |
| | Intangible | | | Accumulated | | | Net Intangible | | | Intangible | | | Accumulated | | | Net Intangible | |
|
| Assets |
| | Amortization |
| | Assets |
| | Assets |
| | Amortization |
| | Assets | |
Core deposit intangibles | | $ | 1,041 |
| $ | 631 |
| $ | 410 |
| $ | 1,041 |
| $ | 481 |
| $ | 560 |
The estimated aggregate future amortization expense for each of the next five years for intangible assets remaining as of December 31, 2022 is as follows (in thousands):
| | | |
2023 |
| $ | 150 |
2024 | |
| 150 |
2025 | |
| 110 |
| | |
| 71 |