UNITED STATES
SECURITIES AND EXCHANGE COMMISSION
Washington, D.C. 20549
FORM N-CSR
CERTIFIED SHAREHOLDER REPORT OF REGISTERED
MANAGEMENT INVESTMENT COMPANIES
Investment Company Act file number | 811-3896 |
|
FPA U.S. VALUE FUND, INC. |
(Exact name of registrant as specified in charter) |
|
11601 WILSHIRE BLVD., STE. 1200 LOS ANGELES, CALIFORNIA | | 90025 |
(Address of principal executive offices) | | (Zip code) |
|
J. RICHARD ATWOOD, PRESIDENT FPA U.S. VALUE FUND, INC. 11601 WILSHIRE BLVD., STE. 1200 LOS ANGELES, CALIFORNIA 90025 | Copy to: MARK D. PERLOW, ESQ. DECHERT LLP ONE BUSH STREET, STE. 1600 SAN FRANCISCO, CA 94104 |
(Name and address of agent for service) | |
|
Registrant’s telephone number, including area code: | (310) 473-0225 | |
|
Date of fiscal year end: | December 31 | |
|
Date of reporting period: | June 30, 2016 | |
| | | | | | | | | |
Item 1: Report to Shareholders.
FPA U.S. Value Fund, Inc.

Distributor:
UMB DISTRIBUTION SERVICES, LLC
235 West Galena Street
Milwaukee, Wisconsin 53212
FPA U.S. VALUE FUND, INC.
LETTER TO SHAREHOLDERS
Dear Fellow Shareholders,
In the second quarter, the Fund declined 4.86%. It underperformed the total return of the S&P 500 and the Morningstar Large Blend Fund Average by 7.32% and 6.66%, respectively.1 Year to date, the Fund declined 5.88%, and underperformed the S&P 500 by 9.72%, and the Morningstar Large Blend Fund Average by 7.99%.1
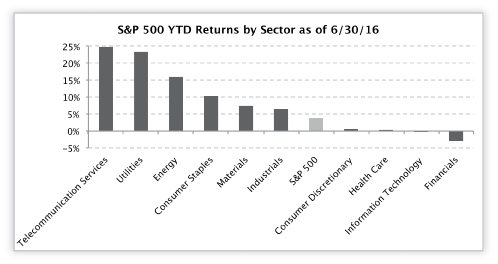
Most of the Fund's underperformance in the second quarter and first half of 2016 was driven by industry exposures. During this time, the Fund had no exposure to energy, materials, utilities or telecommunications services, four of the top performing sectors. At the same time, the Fund was overweight consumer discretionary and healthcare, two of the worst-performing sectors in the market. The Fund's sector exposures are not driven by a top-down view — they are based on where the market offers high-quality businesses within secularly healthy, growing industries at attractive valuations.
Source: S&P Dow Jones Indices LLC. Past performance is no guarantee of future results.
Most of the second quarter was similar to the first, but in late June, everything was amplified by the Brexit vote (the United Kingdom's referendum to withdraw from the European Union). In response, the 10-year U.S. Treasury yield declined from 1.79% to 1.49%. This move further resulted in perceived low-risk, above-average dividend-yielding stocks outperforming the S&P 500. At the same time, increasing fears of a recession — exacerbated by Brexit — triggered a meaningful decline in the stock prices of various economically sensitive businesses, including some of the Fund's core investments.
1
FPA U.S. VALUE FUND, INC.
LETTER TO SHAREHOLDERS
(Continued)
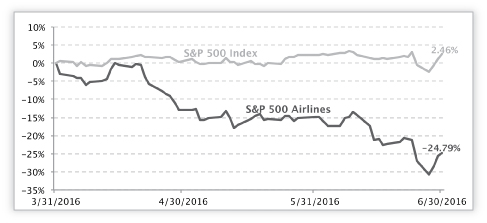
For example, at the end of the first quarter, the Fund had approximately 8.0% exposure to the airline industry, which only makes up approximately 0.5% of the S&P 500. Despite not having any changes to its long-term fundamentals, the industry declined by 24.79% in the quarter. Spirit Airlines (Nasdaq: SAVE), which was one of the Fund's biggest winners in the first quarter, declined by 6.48% in the second quarter. Our other airline holdings, including Southwest and Delta Airlines, declined by 12.25% and 24.89%, respectively. In our opinion, all three of these companies have very strong balance sheets (with Spirit and Southwest in a net cash position) and return on invested capital. Spirit and Southwest have no exposure to Europe, while Delta generates approximately 16% of its revenue from the Atlantic region (which includes the UK and Europe). Based on consensus estimates, they all trade at no more than 11x current year earnings with expected EPS2 growth rates of at least high single-digits over the coming years. Because of the compelling value of these quality companies in what has become a largely consolidated, rationally behaving industry after the great financial crisis, the Fund increased its investment into price weakness. This took the portfolio's industry exposure to 9.6%.
Source: Capital IQ. Past performance is no guarantee of future results.
Key Performers
| Winners3 | | Losers | |
| McKesson | | Invesco | |
| Madison Square Garden | | Delta Air Lines | |
| Aetna | | Perrigo | |
| Abbvie | | Houghton Mifflin Harcourt | |
| Time Warner | | Bayerische Motoren Werke | |
2 EPS (Earnings Per Share) is the portion of a company's profit allocated to each outstanding share of common stock. It serves as an indicator of a company's profitability.
3 Reflects top five contributors and top five detractors to the Fund's performance based on contribution to return basis.
2
FPA U.S. VALUE FUND, INC.
LETTER TO SHAREHOLDERS
(Continued)
On a gross return basis4, U.S. Value's top five winners contributed approximately 1.50% while its top five losers cost the fund 2.81%.
One of the Fund's biggest winners in the quarter was McKesson (NYSE: MCK), the largest U.S. pharmaceutical drug distributor. MCK happened to be one of the Fund's biggest losers last quarter. Practically nothing has changed regarding its long-term prospects over the past few months. On the other hand, one of the Fund's biggest losers this quarter was AmerisourceBergen (NYSE: ABC), which is one of MCK's main competitors.
On May 5, 2016, ABC revised its FY2016 guidance downward by 5% and estimated its FY2017 earnings would only grow 4% to 6%-below prior consensus estimates of double-digit growth. The reduced outlook stemmed primarily from lower-than-expected generic drug price inflation, which was also one of the main culprits that caused MCK to cut its earnings guidance back in January. Since then, ABC's stock price has declined by 5.90% and as of quarter-end sits near a 52-week low.
Historically, the big three pharmaceutical distributors on average have traded at a slight premium to the S&P 500. Based on consensus estimates, they currently trade at an approximate 20% discount to the S&P 500. In fact, this is the largest discount these companies have traded at relative to the market since 2009.

Source: Avondale Partners "Industry Update: Pharmaceutical Distributors" dated April 18, 2016
4 Gross returns are before fees and expenses.
3
FPA U.S. VALUE FUND, INC.
LETTER TO SHAREHOLDERS
(Continued)
The last four presidential election cycles (including the current one) have seen the pharmaceutical supply chain underperform the S&P 500 in the year prior to the election. Prior to this election cycle, the last three cycles saw these companies enjoy significant outperformance in the year after the election. Of course, past performance does not guarantee future results.

Source: Bloomberg, J.P. Morgan
Part of the reason pharma companies and others associated with the industry tend to perform poorly prior to a presidential election is that they are easy political targets. In the current campaigns, it has been bipartisan to speak negatively about the pharma industry, which has continued to raise branded drug prices in excess of inflation. What most politicians ignore is that rising proceeds from branded drugs help fund increasing levels of R&D. Much of this growing R&D spend goes toward finding new, life-saving and/or prolonging therapies that save the healthcare system money by reducing far more expensive reactive, downstream treatment costs. At FPA's 2016 Investor Day, I presented a case for the U.S. pharmaceutical supply chain, which includes large scale wholesale distributors and retail/mail pharmacies. Together with Cardinal Health (NYSE: CAH), the Fund has about 18.2% invested in the three largest U.S. distributors. To view the presentation, please see the FPA U.S. Value Fund section of the FPA Funds' website at www.fpafunds.com.
To summarize, I prefer to invest in healthy, growing industries. U.S. prescription drug expenditures are expected to grow at a 6.2% CAGR5 through 2024. The three main drivers of this robust growth are new drug therapies, volume growth of existing therapies and rising prices for branded drugs.
We believe that pharmaceutical distribution is a recession resistant business. The three largest distributors control over 90% of the U.S. market. A growing, consolidated market generally results in rational competitive behavior, which helps explain why so few major distribution contracts have changed hands over the past decade.
5 Compound Annual Growth Rate
4
FPA U.S. VALUE FUND, INC.
LETTER TO SHAREHOLDERS
(Continued)
This also helps explain why these companies have consistently generated mid-teens unlevered after-tax return on invested capital. Therefore, one can think of these distributors as controlling a vital part of the infrastructure that efficiently gets pharmaceuticals from manufacturers to patients. By being large scale, low-cost providers, these companies are in the enviable position of being able to take a rising toll on an ever-increasing flow of pharmaceutical "traffic."
Currently, MCK sources and distributes all of Rite Aid's (NYSE: RAD) pharmaceuticals. Walgreens Boots Alliance (NYSE: WBA) is in the process of acquiring RAD, provided the Federal Trade Commission (FTC) allows the deal to proceed. Through its joint venture with Walgreens, AmerisourceBergen has a contract to source all of WBA's pharmaceuticals through the end of 2026. Should the WBA-RAD transaction close, the ABC-WBA distribution joint venture would likely subsequently take over the distribution of RAD's volume.
What is interesting to note is that analysts' FY2018 consensus estimates for MCK, ABC and WBA appear to exclude the RAD business. One would logically question the omission. Completing the RAD deal would boost WBA's and ABC's earnings at the expense of MCK, while blocking it would allow MCK to retain the business and keep the associated earnings power to the detriment of ABC and WBA.
Here's my take on it. After MCK lowered its earnings guidance earlier this year, management did the smart thing on its most recent quarterly call by discussing all of the known short-term negative impacts to its business over the next couple of years. This helped re-set expectations lower in order to have a better chance of exceeding them over time. On the last earnings call, CEO John Hammergren said, "Now clearly, in FY '18, we also have the transition with Rite Aid and obviously, you see us making lots of moves now to prepare to grow through those challenges, but we'll talk about that more as the time approaches. But other than that additional headwind that we'll face in that fiscal year, I think the business continues to perform as it has in the past."6
Similarly, when ABC gave its 4% - 6% earnings growth guidance for FY2017 in May, CFO Tim Guttman said, "We are not including any new business resulting from our relationship with our largest customer (WBA)."7
In my opinion, if WBA's pending acquisition of RAD receives FTC approval, WBA and ABC could see a boost to their FY2018 EPS by upwards of 15% and 10%, respectively. Meanwhile, per management's guidance, consensus estimates for MCK's FY2018 already appear to reflect an approximate 5% - 7% impact from the loss of the RAD business.
While consensus estimates from analysts do not factor in the RAD business for any of these companies' earnings beyond FY2017, it does not necessarily mean the market has done that as well. However, based on the recent trading multiples for these companies relative to their historical averages, it appears that not much of the RAD benefit, if any, is being factored into current market valuations.
Therefore, it is my view that once the FTC concludes its review of the Rite Aid deal, the portfolio is well positioned to benefit as analysts adjust their outer-year estimates for MCK or ABC/WBA to reflect the benefits from RAD. The portfolio is tilted to benefit should the RAD transaction receive FTC approval. Combined, the Fund has approximately 11.0% invested between ABC and WBA compared to 6.7% in MCK.
Portfolio Activity
Performance disparities within certain sectors provided opportunities to continue to reallocate capital to better values in the market in an attempt to maximize long-term, risk-adjusted returns. Several of the Fund's
6 McKesson Corp. (2016, May 4) Q4 2016 Earnings Call Transcript. Retrieved from http://seekingalpha.com on July 22, 2016.
7 AmerisourceBergen Corp. (2016, May 5) Q2 2016 Earnings Call Transcript. Retrieved from http://seekingalpha.com on July 22, 2016.
5
FPA U.S. VALUE FUND, INC.
LETTER TO SHAREHOLDERS
(Continued)
higher conviction investments had their valuations decline during the quarter, so the Fund reduced or sold certain positions in order to increase exposure to these higher conviction investments. The Fund had one new disclosed investment in Alphabet (NASDAQ: GOOG).
Portfolio Profile
At the end of the quarter, the Fund had 23 disclosed positions, down from 26 at the end of the first quarter. Since I continue to find the most value in large-cap companies, the weighted average market capitalization of the Fund's disclosed holdings was approximately $48 billion at quarter-end compared to approximately $50 billion at the end of the first quarter. The top 10 positions accounted for about 53% of the portfolio as of June 30, 2016. As of that date, approximately 74% of disclosed investments were in large-cap companies, 13% in mid-cap and 3% in mega-cap. Cash and equivalents accounted for the remaining approximately 10%.
Of the invested portion of the Fund, approximately 88% was invested in U.S. companies, while just 2% was invested in non-U.S. companies. However, various U.S. companies in the portfolio generate international revenue. As a result, excluding cash and equivalents, the Fund's geographic exposure is approximately 74% North America (mostly U.S.) and 16% outside of North America. Breaking down the Fund's exposure outside of North America, approximately 45% is within Europe (ex-UK), the Middle East and Africa, 25% is from the UK, 11% is from Asia-Pacific (mostly China) and the remaining 19% is predominantly from Brazil, Russia and India. Thus far, the weighted average impact from Brexit-related foreign exchange movements to the portfolio's earnings is less than 1%. However, it remains to be seen what further FX effect there might be as well as the indirect impact to our portfolio companies' earnings, which are largely generated in the United States. That said, we believe the market has already priced in a rather meaningful ripple effect — particularly to economically sensitive businesses with meaningful European/UK exposure.
During the two trading days after Brexit, the portfolio traded at the largest discount to my estimate of intrinsic value since the market lows in February. After the late June market rally, the investment portfolio ended the second quarter priced at an approximate 27% discount to my estimate of its intrinsic value, which compares to 25% at the end of the first quarter. Based on consensus estimates for 2016, at the end of the second quarter, the portfolio had a forward weighted average P/E8 of 12.4x and a forecasted EPS growth rate of 12.0% over the next two years.
The investment objective of the Fund is long-term growth of capital with the goal of generating returns in excess of the S&P 500 over full market cycles. By design, the portfolio is unique in its construct in order to achieve this. As of June 30, approximately 15% of the portfolio was invested in five companies that are not in the S&P 500, while approximately 10% of net assets were held in cash and equivalents. The remaining 75% of the portfolio was invested in 18 companies that comprise approximately 6% of the S&P 500. Approximately two-thirds of the Fund's exposure resides within six industries.
Therefore, investors should expect that over any given quarter, year, or years, the Fund could have highly divergent results compared to the market. However, I believe the approach of concentration in high-quality companies within secularly healthy, growing industries at cheap valuations best positions the Fund to deliver on its stated objective and goal.
8 P/E (Price-to-Earnings Ratio) is a ratio for valuing a company that measures its current share price relative to its per-share earnings.
6
FPA U.S. VALUE FUND, INC.
LETTER TO SHAREHOLDERS
(Continued)
Conclusion
I remain enthusiastic about the Fund's investments and their prospective returns over the long term. So much so that I personally purchased more shares of the Fund during the second quarter — particularly in the days immediately following the Brexit vote.
Compared to the broader market, I believe our portfolio is of higher quality, has greater potential for earnings growth, and is less financially levered. Even better, based on consensus estimates, our portfolio's securities in the aggregate trade at a material discount to the S&P 500's forward P/E and to my estimate of their intrinsic value.
I look forward to delivering value for shareholders over the coming years. Your confidence and continued support is truly appreciated.
Respectfully submitted,

Gregory R. Nathan
Portfolio Manager
July 2016
The discussions of Fund investments represent the views of the Fund's managers at the time of this report and are subject to change without notice. References to individual securities are for informational purposes only and should not be construed as recommendations to purchase or sell individual securities. While the Fund's managers believe that the Fund's holdings are value stocks, there can be no assurance that others will consider them as such. Further, investing in value stocks presents the risk that value stocks may fall out of favor with investors and underperform growth stocks during given periods.
FORWARD LOOKING STATEMENT DISCLOSURE
As mutual fund managers, one of our responsibilities is to communicate with shareholders in an open and direct manner. Insofar as some of our opinions and comments in our letters to shareholders are based on our current expectations, they are considered "forward-looking statements" which may or may not prove to be accurate over the long term. While we believe we have a reasonable basis for our comments and we have confidence in our opinions, actual results may differ materially from those we anticipate. You can identify forward-looking statements by words such as "believe," "expect," "may," "anticipate," and other similar expressions when discussing prospects for particular portfolio holdings and/or the markets, generally. We cannot, however, assure future results and disclaim any obligation to update or alter any forward-looking statements, whether as a result of new information, future events, or otherwise. Further, information provided in this report should not be construed as a recommendation to purchase or sell any particular security.
7
FPA U.S. VALUE FUND, INC.
PORTFOLIO SUMMARY
June 30, 2016 (Unaudited)
Common Stocks | | | | | 90.1 | % | |
Entertainment Content | | | 19.1 | % | | | | | |
Health Care Supply Chain | | | 18.2 | % | | | | | |
Airlines | | | 9.6 | % | | | | | |
Food & Drug Stores | | | 8.4 | % | | | | | |
Managed Care | | | 6.4 | % | | | | | |
Home Improvement | | | 4.4 | % | | | | | |
Entertainment Facilities | | | 4.4 | % | | | | | |
Investment Management | | | 4.2 | % | | | | | |
Wealth Management | | | 3.5 | % | | | | | |
Internet Media | | | 3.1 | % | | | | | |
Home & Office Furnishings | | | 2.9 | % | | | | | |
Automobiles | | | 2.1 | % | | | | | |
Publishing & Broadcasting | | | 2.0 | % | | | | | |
Comml & Res Bldg Equip & Sys | | | 1.8 | % | | | | | |
Call Option Written | | | | | (0.0 | )% | |
Short-term Investments | | | | | 8.6 | % | |
Other Assets And Liabilities, Net | | | | | 1.3 | % | |
Net Assets | | | | | 100.0 | % | |
8
FPA U.S. VALUE FUND, INC.
PORTFOLIO OF INVESTMENTS
June 30, 2016
(Unaudited)
COMMON STOCKS | | Shares | | Fair
Value | |
ENTERTAINMENT CONTENT — 19.1% | |
CBS Corporation (Class B) | | | 146,600 | | | $ | 7,980,904 | | |
Discovery Communications, Inc. (Class C)* | | | 144,200 | | | | 3,439,170 | | |
Time Warner, Inc. | | | 100,370 | | | | 7,381,210 | | |
Twenty-First Century Fox, Inc. (Class A) | | | 257,500 | | | | 6,965,375 | | |
| | | $ | 25,766,659 | | |
HEALTH CARE SUPPLY CHAIN — 18.2% | |
AmerisourceBergen Corporation | | | 99,510 | | | $ | 7,893,133 | | |
Cardinal Health, Inc. | | | 98,560 | | | | 7,688,666 | | |
McKesson Corporation | | | 48,300 | | | | 9,015,195 | | |
| | | $ | 24,596,994 | | |
AIRLINES — 9.6% | |
Delta Air Lines, Inc. | | | 117,800 | | | $ | 4,291,454 | | |
Southwest Airlines Co. | | | 106,600 | | | | 4,179,786 | | |
Spirit Airlines, Inc.* | | | 100,950 | | | | 4,529,626 | | |
| | | $ | 13,000,866 | | |
FOOD & DRUG STORES — 8.4% | |
CVS Health Corporation | | | 45,450 | | | $ | 4,351,383 | | |
Walgreens Boots Alliance, Inc. | | | 84,350 | | | | 7,023,824 | | |
| | | $ | 11,375,207 | | |
MANAGED CARE — 6.4% | |
Aetna, Inc. | | | 25,950 | | | $ | 3,169,273 | | |
Anthem, Inc. | | | 41,350 | | | | 5,430,909 | | |
| | | $ | 8,600,182 | | |
HOME IMPROVEMENT — 4.4% | |
Whirlpool Corporation | | | 35,600 | | | $ | 5,932,384 | | |
ENTERTAINMENT FACILITIES — 4.4% | |
Madison Square Garden Co. (The)* | | | 34,100 | | | $ | 5,882,591 | | |
INVESTMENT MANAGEMENT — 4.2% | |
Invesco, Ltd. | | | 224,100 | | | $ | 5,723,514 | | |
WEALTH MANAGEMENT — 3.5% | |
Ameriprise Financial, Inc. | | | 52,050 | | | $ | 4,676,693 | | |
INTERNET MEDIA — 3.1% | |
Alphabet, Inc. (Class C)* | | | 6,100 | | | $ | 4,221,810 | | |
9
FPA U.S. VALUE FUND, INC.
PORTFOLIO OF INVESTMENTS (Continued)
June 30, 2016
(Unaudited)
COMMON STOCKS — Continued | | Shares or
Principal
Amount | | Fair
Value | |
HOME & OFFICE FURNISHINGS — 2.9% | |
Tempur Sealy International, Inc.* | | | 71,500 | | | $ | 3,955,380 | | |
AUTOMOBILES — 2.1% | |
Bayerische Motoren Werke AG (Germany) | | | 38,000 | | | $ | 2,774,397 | | |
PUBLISHING & BROADCASTING — 2.0% | |
Houghton Mifflin Harcourt Co.* | | | 175,400 | | | $ | 2,741,502 | | |
COMML & RES BLDG EQUIP & SYS — 1.8% | |
Ingersoll-Rand plc | | | 38,050 | | | $ | 2,423,024 | | |
| TOTAL COMMON STOCKS — 90.1% (Cost $121,634,694) | | $ | 121,671,203 | | |
CALL OPTION WRITTEN — 0.0% | |
Ingersoll-Rand PLC Call-Strike $67.50; expires 07/15/16; 38,000*
(Link, Gorman, Peck, & Co. Counterparty)
(Cost $(41,350)) | | | (38,000 | ) | | $ | (1,900 | ) | |
| TOTAL INVESTMENT SECURITIES — 90.1% (Cost $121,593,344) | | $ | 121,669,303 | | |
SHORT-TERM INVESTMENTS — 8.6% | |
State Street Bank Repurchase Agreement — 0.03% 7/1/2016
(Dated 06/30/2016, repurchase price of $11,532,010, collateralized by
$11,085,000 principal amount U.S. Treasury Note —
2.125% 2025, fair value $11,763,956) | | $ | 11,532,000 | | | $ | 11,532,000 | | |
| TOTAL SHORT-TERM INVESTMENTS (Cost $11,532,000) | | $ | 11,532,000 | | |
| TOTAL INVESTMENTS — 98.7% (Cost $133,125,344) | | $ | 133,201,303 | | |
Other Assets and Liabilities, net — 1.3% | | | | | 1,790,431 | | |
NET ASSETS — 100.0% | | $ | 134,991,734 | | |
* Non-income producing security.
See notes to financial statements.
10
FPA U.S. VALUE FUND, INC.
STATEMENT OF ASSETS AND LIABILITIES
June 30, 2016
(Unaudited)
ASSETS | |
Investment securities — at fair value (identified cost $121,634,694) | | $ | 121,671,203 | | |
Short-term investments — at amortized cost (maturities 60 days or less) | | | 11,532,000 | | |
Cash | | | 452 | | |
Due from broker — OTC derivatives collateral | | | 41,350 | | |
Receivable for: | |
Investment securities sold | | | 2,338,544 | | |
Dividends and interest | | | 210,066 | | |
Capital Stock sold | | | 2,121 | | |
Prepaid expenses and other assets | | | 340 | | |
Total assets | | | 135,796,076 | | |
LIABILITIES | |
Written options, at value (premiums received $41,350) | | | 1,900 | | |
Payable for: | |
Capital Stock repurchased | | | 630,956 | | |
Advisory fees | | | 80,181 | | |
Accrued expenses and other liabilities | | | 91,305 | | |
Total liabilities | | | 804,342 | | |
NET ASSETS | | $ | 134,991,734 | | |
SUMMARY OF SHAREHOLDERS' EQUITY | |
Capital Stock — par value $0.01 per share; authorized
25,000,000 shares; 15,329,761 outstanding shares | | $ | 153,298 | | |
Additional Paid-in Capital | | | 138,494,592 | | |
Accumulated net realized loss on investments | | | (4,256,511 | ) | |
Undistributed net investment income | | | 529,609 | | |
Unrealized appreciation of investments | | | 70,746 | | |
NET ASSETS | | $ | 134,991,734 | | |
NET ASSET VALUE | |
Offering and redemption price per share | | $ | 8.81 | | |
See notes to financial statements.
11
FPA U.S. VALUE FUND, INC.
STATEMENT OF OPERATIONS
For the Six Months Ended June 30, 2016
(Unaudited)
INVESTMENT INCOME | |
Dividends (net of foreign taxes withheld of $92,437) | | $ | 1,356,337 | | |
Interest | | | 2,488 | | |
Total investment income | | | 1,358,825 | | |
EXPENSES | |
Advisory fees | | | 516,724 | | |
Transfer agent fees and expenses | | | 77,590 | | |
Legal fees | | | 58,801 | | |
Reports to shareholders | | | 43,721 | | |
Director fees and expenses | | | 43,201 | | |
Filing fees | | | 24,985 | | |
Audit and tax services fees | | | 24,124 | | |
Custodian fees | | | 10,922 | | |
Administrative services fees | | | 4,735 | | |
Professional fees | | | 4,260 | | |
Other | | | 56,619 | | |
Total expenses | | | 865,682 | | |
Reimbursement from Adviser | | | (31,729 | ) | |
Net expenses | | | 833,953 | | |
Net investment income | | | 524,872 | | |
NET REALIZED AND UNREALIZED GAIN (LOSS) | |
Net realized gain (loss) on: | |
Investments | | | (4,687,344 | ) | |
Foreign currency transactions | | | (3,419 | ) | |
Net change in unrealized appreciation (depreciation) of: | |
Investments | | | (4,986,687 | ) | |
Written Options | | | 39,450 | | |
Translation of foreign currency denominated amounts | | | 2,923 | | |
Net realized and unrealized loss | | | (9,635,077 | ) | |
NET DECREASE IN NET ASSETS RESULTING FROM OPERATIONS | | $ | (9,110,205 | ) | |
See notes to financial statements.
12
FPA U.S. VALUE FUND, INC.
STATEMENTS OF CHANGES IN NET ASSETS
| | | Six Months Ended
June 30, 2016
(Unaudited) | | Year Ended
December 31, 2015 | |
INCREASE (DECREASE) IN NET ASSETS | |
Operations: | |
Net investment income (loss) | | $ | 524,872 | | | $ | (90,302 | ) | |
Net realized gain (loss) | | | (4,690,763 | ) | | | 188,436,374 | | |
Net change in unrealized depreciation | | | (4,944,314 | ) | | | (201,901,424 | ) | |
Net decrease in net assets resulting from operations | | | (9,110,205 | ) | | | (13,555,352 | ) | |
Distributions to shareholders from: | |
Net realized capital gains | | | — | | | | (186,046,273 | ) | |
Total distributions | | | — | | | | (186,046,273 | ) | |
Capital Stock transactions: | |
Proceeds from Capital Stock sold | | | 13,677,780 | | | | 30,648,612 | | |
Proceeds from shares issued to shareholders upon reinvestment of
dividends and distributions | | | — | | | | 175,645,775 | | |
Cost of Capital Stock repurchased | | | (36,211,429 | )* | | | (176,950,134 | )* | |
Net increase (decrease) from Capital Stock transactions | | | (22,533,649 | ) | | | 29,344,253 | | |
Total change in net assets | | | (31,643,854 | ) | | | (170,257,372 | ) | |
NET ASSETS | |
Beginning of period | | | 166,635,588 | | | | 336,892,960 | | |
End of period | | $ | 134,991,734 | | | $ | 166,635,588 | | |
CHANGE IN CAPITAL STOCK OUTSTANDING | |
Shares of Capital Stock sold | | | 1,559,034 | | | | 1,678,809 | | |
Shares issued to shareholders upon reinvestment of
dividends and distributions | | | — | | | | 19,876,715 | | |
Shares of Capital Stock repurchased | | | (4,042,445 | ) | | | (10,039,239 | ) | |
Change in Capital Stock outstanding | | | (2,483,411 | ) | | | 11,516,285 | | |
* Net of redemption fees of $4,890 and $39,215 for the period ended June 30, 2016 and year ended December 31, 2015, respectively.
See notes to financial statements.
13
FPA U.S. VALUE FUND, INC.
FINANCIAL HIGHLIGHTS
Selected Data for Each Share of Capital Stock Outstanding Throughout Each Period
| | | Six
Months
ended
June 30,
2016 | | Year ended December 31 | |
| | | (unaudited) | | 2015 | | 2014 | | 2013 | | 2012 | | 2011 | |
Per share operating performance: | |
Net asset value at beginning of period | | $ | 9.36 | | | $ | 53.50 | | | $ | 49.53 | | | $ | 41.09 | | | $ | 36.36 | | | $ | 37.79 | | |
Income from investment operations: | |
Net investment income (loss)* | | $ | 0.03 | | | $ | (0.01 | ) | | $ | (0.08 | ) | | | — | | | $ | 0.02 | | | $ | (0.04 | ) | |
Net realized and unrealized gain (loss) on
investment securities | | | (0.58 | ) | | | (4.38 | ) | | | 8.08 | | | $ | 11.98 | | | | 5.35 | | | | (1.39 | ) | |
Total from investment operations | | $ | (0.55 | ) | | $ | (4.39 | ) | | $ | 8.00 | | | $ | 11.98 | | | $ | 5.37 | | | $ | (1.43 | ) | |
Less distributions: | |
Dividends from net investment income | | | — | | | | — | | | | — | | | $ | (0.02 | ) | | | — | | | | — | | |
Distributions from net realized
capital gains | | | — | | | $ | (39.75 | ) | | $ | (4.03 | ) | | | (3.52 | ) | | $ | (0.64 | ) | | | — | | |
Total distributions | | | — | | | $ | (39.75 | ) | | $ | (4.03 | ) | | $ | (3.54 | ) | | $ | (0.64 | ) | | | — | | |
Redemption fees | | | 0.00 | ** | | | 0.00 | ** | | | 0.00 | ** | | | 0.00 | ** | | | 0.00 | ** | | | 0.00 | ** | |
Net asset value at end of period | | $ | 8.81 | | | $ | 9.36 | | | $ | 53.50 | | | $ | 49.53 | | | $ | 41.09 | | | $ | 36.36 | | |
Total investment return*** | | | (5.88 | )% | | | (3.68 | )% | | | 16.38 | % | | | 30.46 | % | | | 14.96 | % | | | (3.78 | )% | |
Ratios/supplemental data: | |
Net assets, end of period (in $000's) | | $ | 134,992 | | | $ | 166,636 | | | $ | 336,893 | | | $ | 310,921 | | | $ | 255,084 | | | $ | 234,378 | | |
Ratio of expenses to average net assets: | |
Before reimbursement from Adviser | | | 1.14 | %† | | | 0.97 | % | | | 0.94 | % | | | 0.96 | % | | | 1.02 | % | | | 1.00 | % | |
After reimbursement from Adviser | | | 1.10 | %† | | | 0.97 | % | | | 0.94 | % | | | 0.96 | % | | | 1.02 | % | | | 1.00 | % | |
Ratio of net investment income to
average net assets: | |
Before reimbursement from Investment
Adviser | | | 0.65 | %† | | | (0.03 | )% | | | (0.16 | )% | | | (0.22 | )% | | | 0.04 | % | | | (0.11 | )% | |
After reimbursement from Investment
Adviser | | | 0.69 | %† | | | (0.03 | )% | | | (0.16 | )% | | | (0.22 | )% | | | 0.04 | % | | | (0.11 | )% | |
Portfolio turnover rate | | | 132 | %† | | | 109 | % | | | 5 | % | | | 8 | % | | | 2 | % | | | 5 | % | |
* Per share amount is based on average shares outstanding.
** Rounds to less than $0.01 per share.
*** Return is based on net asset value per share, adjusted for reinvestment of distributions, and does not reflect deduction of the sales charge.
† Annualized.
See notes to financial statements.
14
FPA U.S. VALUE FUND, INC.
NOTES TO FINANCIAL STATEMENTS
June 30, 2016
(Unaudited)
NOTE 1 — Significant Accounting Policies
FPA U.S. Value Fund, Inc. (the "Fund") (formerly, FPA Perennial Fund, Inc.) is registered under the Investment Company Act of 1940, as a diversified, open-end, management investment company. The Fund's primary investment objective is long-term growth of capital. Current income is a secondary consideration. The Fund qualifies as an investment company pursuant to Financial Accounting Standard Board (FASB) Accounting Standards Codification (ASC) No. 946, Financial Services — Investment Companies. The following is a summary of significant accounting policies consistently followed by the Fund in the preparation of its financial statements.
A. Security Valuation
The Fund's investments are reported at fair value as defined by accounting principles generally accepted in the United States of America, ("U.S. GAAP"). The Fund generally determines its net asset value as of approximately 4:00 p.m. New York time each day the New York Stock Exchange is open. Further discussion of valuation methods, inputs and classifications can be found under Disclosure of Fair Value Measurements.
B. Securities Transactions and Related Investment Income
Securities transactions are accounted for on the date the securities are purchased or sold. Dividend income and distributions to shareholders are recorded on the ex-dividend date. Interest income and expenses are recorded on an accrual basis. The books and records of the Fund are maintained in U.S. dollars as follows: (1) the foreign currency market value of investment securities, and other assets and liabilities stated in foreign currencies, are translated using the daily spot rate; and (2) purchases, sales, income and expenses are translated at the rate of exchange prevailing on the respective dates of such transactions. The resultant exchange gains and losses are included in net realized or net unrealized gain (loss) in the statement of operations.
C. Use of Estimates
The preparation of the financial statements in accordance with U.S. GAAP requires management to make estimates and assumptions that affect the amounts reported. Actual results could differ from those estimates.
NOTE 2 — Risk Considerations
Investing in the Fund may involve certain risks including, but not limited to, those described below.
Market Risk: Because the values of the Fund's investments will fluctuate with market conditions, so will the value of your investment in the Fund. You could lose money on your investment in the Fund or the Fund could underperform other investments.
Common Stocks and Other Securities: The prices of common stocks and other securities held by the Fund may decline in response to certain events taking place around the world, including; those directly involving companies whose securities are owned by the Fund; conditions affecting the general economy; overall market changes; local, regional or global political, social or economic instability; and currency, interest rate and commodity price fluctuations. In addition, the Adviser's emphasis on a value-oriented investment approach generally results in the Fund's portfolio being invested primarily in medium or smaller sized companies. Smaller companies may be subject to a greater degree of change in earnings and business prospects than larger, more established companies, and smaller companies are often more reliant on key products or personnel than larger companies. The Fund's foreign investments are subject to additional risks such as, foreign markets could go down or prices of the Fund's foreign investments could go down because of unfavorable changes in foreign currency exchange rates, foreign government actions, social, economic or political instability or other factors that can adversely affect investments in foreign countries. These factors can also make foreign securities less liquid, more
15
FPA U.S. VALUE FUND, INC.
NOTES TO FINANCIAL STATEMENTS
Continued
volatile and harder to value than U.S. securities. In light of these characteristics of smaller companies and their securities, the Fund may be subjected to greater risk than that assumed when investing in the equity securities of larger companies.
Repurchase Agreements: Repurchase agreements permit the Fund to maintain liquidity and earn income over periods of time as short as overnight. Repurchase agreements held by the Fund are fully collateralized by U.S. Government securities, or securities issued by U.S. Government agencies, or securities that are within the three highest credit categories assigned by established rating agencies (Aaa, Aa, or A by Moody's or AAA, AA or A by Standard & Poor's) or, if not rated by Moody's or Standard & Poor's, are of equivalent investment quality as determined by the Adviser. Such collateral is in the possession of the Fund's custodian. The collateral is evaluated daily to ensure its market value equals or exceeds the current market value of the repurchase agreements including accrued interest. In the event of default on the obligation to repurchase, the Fund has the right to liquidate the collateral and apply the proceeds in satisfaction of the obligation.
The Fund may enter into repurchase agreements, under the terms of a Master Repurchase Agreement ("MRA"). The MRA permits the Fund, under certain circumstances including an event of default (such as bankruptcy or insolvency), to offset payables and/or receivables under the MRA with collateral held and/or posted to the counterparty and create one single net payment due to or from the Fund. However, bankruptcy or insolvency laws of a particular jurisdiction may impose restrictions on or prohibitions against such a right of offset in the event of a MRA counterparty's bankruptcy or insolvency. Pursuant to the terms of the MRA, the Fund receives securities as collateral with a market value in excess of the repurchase price to be received by the Fund upon the maturity of the repurchase transaction. Upon a bankruptcy or insolvency of the MRA counterparty, the Fund recognizes a liability with respect to such excess collateral to reflect the Fund's obligation under bankruptcy law to return the excess to the counterparty. Repurchase agreements outstanding at the end of the period are listed in the Fund's Portfolio of Investments.
NOTE 3 — Purchases and Sales of Investment Securities
Cost of purchases of investment securities (excluding short-term investments) aggregated $89,295,228 for the period ended June 30, 2016. The proceeds and cost of securities sold resulting in net realized losses of $4,687,344 aggregated $108,831,229 and $113,518,573, respectively, for the period ended June 30, 2016. Realized gains or losses are based on the specific identification method.
NOTE 4 — Federal Income Tax
No provision for federal income tax is required because the Fund has elected to be taxed as a "regulated investment company" under the Internal Revenue Code (the "Code") and intends to maintain this qualification and to distribute each year to its shareholders, in accordance with the minimum distribution requirements of the Code, its taxable net investment income and taxable net realized gains on investments.
The cost of investment securities held at June 30, 2016, was $122,581,741 for federal income tax purposes. Gross unrealized appreciation and depreciation for all investments (excluding short-term investments) at June 30, 2016, for federal income tax purposes was $4,868,993 and $5,779,531, respectively resulting in net unrealized depreciation of $910,538. As of and during the period ended June 30, 2016, the Fund did not have any liability for unrecognized tax benefits. The Fund recognizes interest and penalties, if any, related to unrecognized tax benefits as income tax expense in the Statement of Operations. During the year, the Fund did not incur any interest or penalties. The Fund is not subject to examination by U.S. federal tax authorities for years ended on or before December 31, 2012 or by state tax authorities for years ended on or before December 31, 2011.
16
FPA U.S. VALUE FUND, INC.
NOTES TO FINANCIAL STATEMENTS
Continued
NOTE 5 — Advisory Fees and Other Affiliated Transactions
Pursuant to an Investment Advisory Agreement (the "Agreement"), advisory fees were paid by the Fund to First Pacific Advisors, LLC (the "Adviser"). Under the terms of this Agreement, the Fund pays the Adviser a monthly fee calculated at the annual rate of 0.75% of the first $50 million of the Fund's average daily net assets and 0.65% of the average daily net assets in excess of $50 million. The Agreement obligates the Adviser to reduce its fee to the extent necessary to reimburse the Fund for any annual expenses (exclusive of interest, taxes, the cost of brokerage and research services, legal expenses related to portfolio securities, and extraordinary expenses such as litigation) in excess of 11/2% of the first $30 million and 1% of the remaining average net assets of the Fund for the year.
For the period ended June 30, 2016, the Fund paid aggregate fees and expenses of $43,201 to all Directors who are not affiliated persons of the Adviser.
NOTE 6 — Redemption Fees
A redemption fee of 2% applies to redemptions within 90 days of purchase. For the period ended June 30, 2016, the Fund collected $4,890 in redemption fees. The impact of these fees is less than $0.01 per share.
NOTE 7 — Disclosure of Fair Value Measurements
The Fund uses the following methods and inputs to establish the fair value of its assets and liabilities. Use of particular methods and inputs may vary over time based on availability and relevance as market and economic conditions evolve.
Equity securities are generally valued each day at the official closing price of, or the last reported sale price on, the exchange or market on which such securities principally are traded, as of the close of business on that day. If there have been no sales that day, equity securities are generally valued at the last available bid price. Securities that are unlisted and fixed-income and convertible securities listed on a national securities exchange for which the over-the-counter ("OTC") market more accurately reflects the securities' value in the judgment of the Fund's officers, are valued at the most recent bid price. Short-term corporate notes with maturities of 60 days or less at the time of purchase are valued at amortized cost.
Securities for which representative market quotations are not readily available or are considered unreliable by the Adviser are valued as determined in good faith under procedures adopted by the authority of the Fund's Board of Directors. Various inputs may be reviewed in order to make a good faith determination of a security's value. These inputs include, but are not limited to, the type and cost of the security; contractual or legal restrictions on resale of the security; relevant financial or business developments of the issuer; actively traded similar or related securities; conversion or exchange rights on the security; related corporate actions; significant events occurring after the close of trading in the security; and changes in overall market conditions. Fair valuations and valuations of investments that are not actively trading involve judgment and may differ materially from valuations of investments that would have been used had greater market activity occurred.
The Fund classifies its assets based on three valuation methodologies. Level 1 values are based on quoted market prices in active markets for identical assets. Level 2 values are based on significant observable market inputs, such as quoted prices for similar assets and quoted prices in inactive markets or other market observable inputs as noted above including spreads, cash flows, financial performance, prepayments, defaults, collateral, credit enhancements, and interest rate volatility. Level 3 values are based on significant unobservable inputs that reflect the Fund's determination of assumptions that market participants might reasonably use in valuing the
17
FPA U.S. VALUE FUND, INC.
NOTES TO FINANCIAL STATEMENTS
Continued
assets. The valuation levels are not necessarily an indication of the risk associated with investing in those securities. The following table presents the valuation levels of the Fund's investments as of June 30, 2016:
Investments | | Level 1 | | Level 2 | | Level 3 | | Total | |
Common Stocks | |
Entertainment Content | | $ | 25,766,659 | | | | — | | | | — | | | $ | 25,766,659 | | |
Health Care Supply Chain | | | 24,596,994 | | | | — | | | | — | | | | 24,596,994 | | |
Airlines | | | 13,000,866 | | | | — | | | | — | | | | 13,000,866 | | |
Food & Drug Stores | | | 11,375,207 | | | | — | | | | — | | | | 11,375,207 | | |
Managed Care | | | 8,600,182 | | | | — | | | | — | | | | 8,600,182 | | |
Home Improvement | | | 5,932,384 | | | | — | | | | — | | | | 5,932,384 | | |
Entertainment Facilities | | | 5,882,591 | | | | — | | | | — | | | | 5,882,591 | | |
Investment Management | | | 5,723,514 | | | | — | | | | — | | | | 5,723,514 | | |
Wealth Management | | | 4,676,693 | | | | — | | | | — | | | | 4,676,693 | | |
Internet Media | | | 4,221,810 | | | | — | | | | — | | | | 4,221,810 | | |
Home & Office Furnishings | | | 3,955,380 | | | | — | | | | — | | | | 3,955,380 | | |
Automobiles | | | 2,774,397 | | | | — | | | | — | | | | 2,774,397 | | |
Publishing & Broadcasting | | | 2,741,502 | | | | — | | | | — | | | | 2,741,502 | | |
Comml & Res Bldg Equip & Sys | | | 2,423,024 | | | | — | | | | — | | | | 2,423,024 | | |
Short-Term Investment | | | — | | | $ | 11,532,000 | | | | — | | | | 11,532,000 | | |
| | | $ | 121,671,203 | | | $ | 11,532,000 | | | | — | | | $ | 133,203,203 | | |
Equity Options (equity risk) | | | — | | | $ | (1,900 | ) | | | — | | | $ | (1,900 | ) | |
Transfers of investments between different levels of the fair value hierarchy are recorded at market value as of the end of the reporting period. There were no transfers between Levels 1, 2, or 3 during the period ended June 30, 2016.
NOTE 8 — Collateral Requirements
FASB Accounting Standards Update No. 2011-11, Disclosures about Offsetting Assets and Liabilities requires disclosures to make financial statements that are prepared under U.S. GAAP more comparable to those prepared under International Financial Reporting Standards. Under this guidance the Fund discloses both gross and net information about instruments and transactions eligible for offset such as instruments and transactions subject to an agreement similar to a master netting arrangement. In addition, the Fund discloses collateral received and posted in connection with master netting agreements or similar arrangements.
18
FPA U.S. VALUE FUND, INC.
NOTES TO FINANCIAL STATEMENTS
Continued
The following table presents the Fund's OTC derivative assets and master repurchase agreements by counterparty net of amounts available for offset under an ISDA Master agreement or similar agreements and net of the related collateral received or pledged by the Fund as of June 30, 2016:
Counterparty | | Gross Assets
in the
Statement of
Assets and
Liabilities | | Gross Liabilities
in the
Statement of
Assets and
Liabilities | | Collateral
Received | | Assets
(Liabilities)
Available for
Offset | | Net Amount
of Assets* | |
State Street Bank
and Trust Company:
Repurchase
Agreement | | $ | 11,532,000 | | | | — | | | $ | 11,532,000 | ** | | | — | | | | — | | |
Call Option Written | | | — | | | $ | 1,900 | | | | 1,900 | *** | | | — | | | | — | | |
* Represents the net amount receivable (payable) from the counterparty in the event of default.
** Collateral with a value of $11,763,956 has been received in connection with a master repurchase agreement. Excess of collateral received from the individual master repurchase agreement is not shown for financial reporting purposes.
*** The actual Assets (Liabilities) Available for Offset may be more than the amount reported due to overcollateralization.
19
FPA U.S. VALUE FUND, INC.
RESULTS OF SPECIAL MEETING
Results of the Special Meeting of Shareholders:
A Special Meeting of Shareholders was held on May 9, 2016 in Los Angeles, California. The voting result for the proposal considered at the Special Meeting of Shareholders is as follows:
Election of Directors. The shareholders of the Fund elected J. Richard Atwood, Mark L. Lipson, Alfred E. Osborne, Jr., A. Robert Pisano, Patrick B. Purcell and Allan M. Rudnick to serve on the Board of Directors.
FPA U.S. Value Fund, Inc. | | Total Shares Voted For: | | Total Shares Withheld: | |
J. Richard Atwood | | | 13,567,246 | | | | 279,563 | | |
Mark L. Lipson | | | 13,497,828 | | | | 348,981 | | |
Alfred E. Osborne, Jr. | | | 13,465,671 | | | | 381,138 | | |
A. Robert Pisano | | | 13,521,959 | | | | 324,850 | | |
Patrick B. Purcell | | | 13,523,470 | | | | 323,339 | | |
Allan M. Rudnick | | | 13,465,669 | | | | 381,140 | | |
20
FPA U.S. VALUE FUND, INC.
SHAREHOLDER EXPENSE EXAMPLE
June 30, 2016 (Unaudited)
Fund Expenses
Mutual fund shareholders generally incur two types of costs: (1) transaction costs, and (2) ongoing costs, including advisory and administrative fees; shareholder service fees; and other Fund expenses. The Example is intended to help you understand your ongoing costs (in dollars) of investing in the Fund and to compare these costs with the ongoing costs of investing in other mutual funds. The Example is based on an investment of $1,000 invested at the beginning of the year and held for the entire year.
Actual Expenses
The information in the table under the heading "Actual Performance" provides information about actual account values and actual expenses. You may use the information in this column, together with the amount you invested, to estimate the expenses that you paid over the period. Simply divide your account value by $1,000 (for example, an $8,600 account value divided by $1,000 = 8.6), then multiply the result by the number in the first column in the row entitled "Expenses Paid During Period" to estimate the expenses you paid on your account during this period.
Hypothetical Example for Comparison Purposes
The information in the table under the heading "Hypothetical Performance (5% return before expenses)" provides information about hypothetical account values and hypothetical expenses based on the Fund's actual expense ratio and an assumed rate of return of 5% per year before expenses, which is not the Fund's actual return. The hypothetical account values and expenses may not be used to estimate the actual ending account balance or expenses you paid for the period. You may use this information to compare the ongoing costs of investing in the Fund
and other funds. To do so, compare this 5% hypothetical example with the 5% hypothetical examples that appear in the shareholder reports of other funds.
Please note that the expenses shown in the table are meant to highlight your ongoing costs only and do not reflect any transactional costs. Therefore, the information under the heading "Hypothetical Performance (5% return before expenses)" is useful in comparing ongoing costs only, and will not help you determine the relative total costs of owning different funds. In addition, if these transactional costs were included, your costs would have been higher. Even though the Fund does not charge transaction fees, if you purchase shares through a broker, the broker may charge you a fee. You should evaluate other mutual funds' transaction fees and any applicable broker fees to assess the total cost of ownership for comparison purposes.
| | | Actual
Performance | | Hypothetical
Performance
(5% return
before
expenses) | |
Beginning Account Value
December 31, 2015 | | $ | 1,000.00 | | | $ | 1,000.00 | | |
Ending Account Value
June 30, 2016 | | $ | 941.20 | | | $ | 1,019.39 | | |
Expenses Paid During
Period* | | $ | 5.31 | | | $ | 5.52 | | |
* Expenses are equal to the Fund's annualized expense ratio of 1.10%, multiplied by the average account value over the period and prorated for the six-months ended June 30, 2016 (182/366 days).
21
FPA U.S. VALUE FUND, INC.
DIRECTOR AND OFFICER INFORMATION
(Unaudited)
| Name and Year of Birth | | Position(s)
With Fund
Years Served | | Principal Occupation(s)
During the Past 5 Years | | Portfolios in
Fund Complex
Overseen | | Other
Directorships | |
Allan M. Rudnick – 1940† | | Director and Chairman*
Years Served: 4 | | Private Investor. Formerly, Co-Founder, Chief Executive Officer, Chairman and Chief Investment Officer of Kayne Anderson Rudnick Investment Management from 1989 to 2007. | | | 7 | | | | |
Mark L. Lipson – 1949† | | Director*
Years Served: <1 | | Consultant. ML2Advisors, LLC. Former member of the Management Committee and Western Region Head at Bessemer Trust Company from 2007 to 2014. | | | 7 | | | | |
Alfred E. Osborne, Jr. – 1944† | | Director*
Years Served: 2 | | Senior Associate Dean of the John E. Anderson School of Management at UCLA. | | | 7 | | | Wedbush, Inc., Nuverra Environmental Solutions, Inc., and Kaiser Aluminun, Inc. | |
A. Robert Pisano – 1943† | | Director*
Years Served: 4 | | Consultant. Formerly President and Chief Operating Officer of the Motion Picture Association of America, Inc. from 2005 to 2011 | | | 7 | | | Entertainment Partners, Resources Global Professionals and The Motion Picture and Television Fund | |
Patrick B. Purcell – 1943† | | Director*
Years Served: 4 | | Retired. Formerly Executive Vice President, Chief Financial and Administrative Officer of Paramount Pictures from 1983 to 1998. | | | 7 | | | The Motion Picture and Television Fund | |
J. Richard Atwood – 1960 | | Director* and President
Years Served: 19 | | Managing Partner of the Adviser. | | | 7 | | | | |
Gregory Nathan – 1981 | | Vice President & Portfolio Manager
Years Served: <1 | | Managing Director of the Adviser since 2015 Formerly Vice President of the Adviser from 2007 to 2015. | | | | | |
Leora R. Weiner – 1970 | | Chief Compliance Officer
Years Served: 2 | | Managing Director, General Counsel and Chief Compliance Officer of the Adviser since 2014. Formerly Managing Director, General Counsel and Chief Compliance Officer of Tradewinds Global Investors, LLC from 2008 to 2014. | | | | | |
E. Lake Setzler – 1967 | | Treasurer
Years Served: 10 | | Senior Vice President and Controller of the Adviser. | | | | | |
Francine S. Hayes – 1967 | | Secretary
Years Served: 1 | | Vice President and Senior Counsel of State Street Bank and Trust Company | | | | | |
* Directors serve until their resignation, removal or retirement.
† Audit Committee member
The Statement of Additional Information includes additional information about the Directors and is available, without charge, upon request by calling (800) 982-4372.
22
FPA U.S. VALUE FUND, INC.
(Unaudited)
INVESTMENT ADVISER
First Pacific Advisors, LLC
11601 Wilshire Boulevard, Suite 1200
Los Angeles, CA 90025
TRANSFER & SHAREHOLDER SERVICE AGENT
UMB Fund Services, Inc.
P.O. Box 2175
Milwaukee, WI 53201-2175
or
235 West Galena Street
Milwaukee, WI 53212-3948
(800) 638-3060
CUSTODIAN AND ADMINISTRATOR
State Street Bank and Trust Company
Boston, Massachusetts
TICKER SYMBOL: FPPFX
CUSIP: 302548102
DISTRIBUTOR
UMB Distribution Services, LLC
235 West Galena Street
Milwaukee, Wisconsin 53212-3948
LEGAL COUNSEL
Dechert LLP
San Francisco, California
INDEPENDENT REGISTERED PUBLIC ACCOUNTING FIRM
Deloitte & Touche LLP
Los Angeles, California
This report has been prepared for the information of shareholders of FPA U.S. VALUE FUND, INC., and is not authorized for distribution to prospective investors unless preceded or accompanied by an effective prospectus.
The Fund's complete proxy voting record for the 12 months ended June 30, 2016 is available without charge, upon request by calling (800) 982-4372 and on the SEC's website at www.sec.gov.
The Fund's schedule of portfolio holdings, filed the first and third quarter of the Fund's fiscal year on Form N-Q with the SEC, is available on the SEC's website at www.sec.gov. Form N-Q is available at the SEC's Public Reference Room in Washington, D.C., and information on the operations of the Public Reference Room may be obtained by calling (202) 551-8090. To obtain Form N-Q from the Fund, shareholders can call (800) 982-4372.
Additional information about the Fund is available online at www.fpafunds.com. This information includes, among other things, holdings, top sectors, and performance, and is updated on or about the 15th business day after the end of each quarter.
Item 2. Code of Ethics.
Not applicable to this semi-annual report.
Item 3. Audit Committee Financial Expert.
Not applicable to this semi-annual report.
Item 4. Principal Accountant Fees and Services.
Not applicable to this semi-annual report.
Item 5. Audit Committee of Listed Registrants.
Not applicable to this semi-annual report.
Item 6. Investments.
(a) Schedule of Investments is included as a part of the report to shareholders filed under Item 1 of this Form N-CSR.
(b) Not applicable.
Item 7. Disclosure of Proxy Voting Policies and Procedures for Closed-End Management Investment Companies.
Not applicable.
Item 8. Portfolio Managers of Closed-End Management Investment Companies.
Not applicable.
Item 9. Purchases of Equity Securities by Closed-End Management Investment Company and Affiliated Purchasers.
Not applicable.
Item 10. Submission of Matters to a Vote of Security Holders.
There have been no material changes to the procedures by which the shareholders may recommend nominees to the registrant’s board of directors.
Item 11. Controls and Procedures.
(a) The principal executive officer and principal financial officer of the registrant have concluded that the registrant’s disclosure controls and procedures (as defined in Rule 30a-3(c) under the Investment Company Act of 1940) are effective based on their evaluation of the disclosure controls and procedures as of a date within 90 days of the filing date of this report.
(b) There have been no significant changes in the registrant’s internal controls over financial reporting (as defined in Rule 30a-3(d) under the Investment Company Act of 1940) that occurred during the registrant’s second fiscal quarter of the period covered by this report that have materially affected, or is reasonably likely to materially affect, the registrant’s internal controls over financial reporting.
Item 12. Exhibits.
(a)(1) Not applicable.
(a)(2) The certifications required by Rule 30a-2(a) under the Investment Company Act of 1940 are attached hereto.
(a)(3) Not applicable.
(b) The certifications required by Rule 30a-2(b) under the Investment Company Act of 1940 and Section 906 of the Sarbanes-Oxley Act of 2002 are attached hereto.
SIGNATURES
Pursuant to the requirements of the Securities Exchange Act of 1934 and the Investment Company Act of 1940, the registrant has duly caused this report to be signed on its behalf by the undersigned, thereunto duly authorized.
FPA U.S. VALUE FUND, INC. |
| | |
| | |
By: | /s/ J. Richard Atwood | |
| J. Richard Atwood | |
| President (principal executive officer) | |
| | |
Date: | August 31, 2016 | |
Pursuant to the requirements of the Securities Exchange Act of 1934 and the Investment Company Act of 1940, this report has been signed below by the following persons on behalf of the registrant and in the capacities and on the dates indicated.
By: | /s/ J. Richard Atwood | |
| J. Richard Atwood | |
| President (principal executive officer) | |
| | |
Date: | August 31, 2016 | |
| | |
| | |
By: | /s/ E. Lake Setzler III | |
| E. Lake Setzler III | |
| Treasurer (principal financial officer) | |
| | |
Date: | August 31, 2016 | |