| | |
| |
| UNITED STATES |
| SECURITIES AND EXCHANGE COMMISSION |
| Washington, D.C. 20549 |
| |
| FORM N-CSR |
| |
| CERTIFIED SHAREHOLDER REPORT OF REGISTERED |
| MANAGEMENT INVESTMENT COMPANIES |
| |
| Investment Company Act file number: (811- 03897 ) |
| |
| Exact name of registrant as specified in charter: | Putnam U.S. Government Income Trust |
| | |
| Address of principal executive offices: One Post Office Square, Boston, Massachusetts 02109 |
| |
| Name and address of agent for service: | Beth S. Mazor, Vice President |
| | One Post Office Square |
| | Boston, Massachusetts 02109 |
| | |
| Copy to: | John W. Gerstmayr, Esq. |
| | Ropes & Gray LLP |
| | One International Place |
| | Boston, Massachusetts 02110 |
| | |
| Registrant’s telephone number, including area code: | (617) 292-1000 | |
| | |
| Date of fiscal year end: September 30, 2010 | |
| | |
| Date of reporting period: October 1, 2009 — March 31, 2010 |
Item 1. Report to Stockholders:
The following is a copy of the report transmitted to stockholders pursuan to Rule 30e-1 under the Investment Company


A BALANCED APPROACH
Since 1937, when George Putnam created a diverse mix of stocks and bonds in a single, professionally managed portfolio, Putnam has championed the balanced approach.
A WORLD OF INVESTING
Today, we offer investors a world of equity, fixed-income, multi-asset, and absolute-return portfolios to suit a range of financial goals.
A COMMITMENT TO EXCELLENCE
Our portfolio managers seek superior results over time, backed by original, fundamental research on a global scale. We believe in the value of experienced financial advice, in providing exemplary service, and in putting clients first in all we do.

Putnam
U.S. Government
Income Trust
Semiannual report
3 | 31 | 10
| |
| Message from the Trustees | 2 |
|
| About the fund | 4 |
|
| Performance snapshot | 6 |
|
| Interview with your fund’s portfolio manager | 7 |
|
| Your fund’s performance | 12 |
|
| Your fund’s expenses | 14 |
|
| Terms and definitions | 16 |
|
| Trustee approval of management contract | 17 |
|
| Other information for shareholders | 28 |
|
| Financial statements | 29 |
|
| Shareholder meeting results | 66 |
|
Message from the Trustees
Dear Fellow Shareholder:
Global equity markets have continued to rebound from last year’s lows, bolstered by strengthening economic growth and robust earnings results. Major stock indexes have hit highs not seen since the fall of 2008. And although opportunities in fixed income are somewhat diminished following the bond market’s historic rally last year, pockets of attractive valuations and opportunity remain.
Last year, investors who deployed cash in the markets were generally rewarded across a range of asset categories. This year, success is requiring more analysis, insight, and expertise. Active money management — Putnam’s core strength — is very important during times like these.
One lesson that can be drawn from the painful downturn of 2008 and early 2009 is the importance of diversification and asset allocation, which mutual funds offer. Although diversification does not guarantee a profit or protect against loss, it remains an important investment principle and one we believe is worth pursuing in all market environments.
2
Lastly, we would like to thank all shareholders who took the time to vote by proxy on a number of issues, including shareholder-friendly management fee changes, which went into effect earlier this year. We also would like to welcome new shareholders to the fund and thank all of our investors for your continued confidence in Putnam.

About the fund
Seeking opportunities through mortgage-backed securities
Home ownership is the most common way to invest in the real estate market, but it is not the only way. It is also possible for individuals to invest in the mortgages used to finance homes and businesses through instruments called mortgage-backed securities (MBSs).
Since 1984, Putnam U.S. Government Income Trust has invested in some of the highest-quality MBSs with the goal of maximizing income. However, investing in MBSs carries certain risks. As a result, your fund’s team of experienced analysts uses proprietary models to seek out investment opportunities, while striving to maintain an appropriate amount of risk for the fund.
MBSs are essentially securities that represent a stake in the principal from, and interest paid on, a collection of mortgages. Most MBSs are created when government-sponsored entities, including Fannie Mae, Ginnie Mae, and Freddie Mac, buy mortgages from financial institutions, such as banks or credit unions, and package them together by the thousands. These pools of mortgages act as collateral for the MBSs that government-sponsored entities sell to different investors, including Putnam U.S. Government Income Trust, which currently holds most of its assets in MBSs.
As a consequence of the credit crisis that gripped financial markets in 2007 and 2008, Fannie Mae and Freddie Mac were placed under conservatorship by their regulator, the Federal Housing Finance Agency, and were given a line of credit with the U.S. Treasury. By seeking opportunities among MBSs, your fund’s managers seek higher returns than Treasuries can typically offer, but with less volatility than stocks.
Consider these risks before investing:
Funds that invest in government securities are not guaranteed. Mortgage-backed securities are subject to prepayment risk. Funds that invest in bonds are subject to certain risks, including interest-rate risk, credit risk, and inflation risk. As interest rates rise, the prices of bonds fall. Long-term bonds are more exposed to interest-rate risk than short-term bonds. Unlike bonds, bond funds have ongoing fees and expenses. The use of derivatives involves special risks and may result in losses.

Understanding mortgage-
related securities
MBSs (Mortgage-backed securities): MBSs are pools of mortgages used as collateral for issuing a security. These securities represent claims on the principal and interest payments made by the borrowers whose loans are in the pool.
Fannie Mae (Federal National Mortgage Association) and Freddie Mac (Federal Home Loan Mortgage Corporation): Formerly public companies, Fannie Mae and Freddie Mac were placed under conservator-ship by the U.S. government in September 2008 and are now controlled by the Federal Housing Finance Agency. Both companies buy mortgages from primary lenders (savings and loans, commercial banks, credit unions, and housing finance agencies) and develop MBSs that may carry an explicit government guarantee on the payment of principal and interest.
Ginnie Mae (Government National Mortgage Association): Ginnie Mae is a government-owned corporation established in 1968 whose MBSs are backed by the full faith and credit of the U.S. government.
Collateralized mortgage obligations (CMOs): CMOs are structured mortgage-backed securities that use pools of MBSs, or mortgage loans themselves, as collateral and carve the cash flows into different classes to meet the needs of various investors.
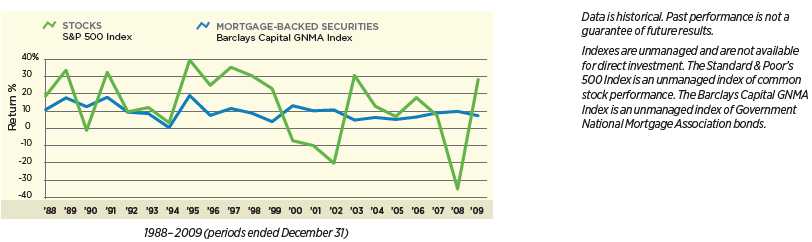
Mortgage-backed securities have historically delivered solid returns,
with fewer ups and downs along the way than stocks.
Performance
snapshot
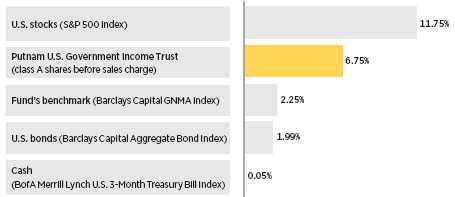
Annualized total return (%) comparison as of 3/31/10

Current performance may be lower or higher than the quoted past performance, which cannot guarantee future results. Share price, principal value, and return will fluctuate, and you may have a gain or a loss when you sell your shares. Performance of class A shares assumes reinvestment of distributions and does not account for taxes. Fund returns in the bar chart do not reflect a sales charge of 4.00%; had they, returns would have been lower. See pages 7 and 12–13 for additional performance information. For a portion of the periods, this fund may have limited expenses, without which returns would have been lower. A 1% short-term trading fee may apply. To obtain the most recent month-end performance, visit putnam.com.
* Returns for the six-month period are not annualized, but cumulative.
6
Interview with your
fund’s portfolio manager
Rob Bloemker
Rob, how did Putnam U.S. Government
Income Trust perform for the period ended
March 31, 2010?
The fund continued to post solid returns over the semiannual period, outperforming both its benchmark and its peers. For the six months ended March 31, 2010, the fund’s class A shares returned 6.75%, outpacing the benchmark, Barclays Capital GNMA Index, which returned 2.25%. Meanwhile, the fund’s Lipper category, GNMA Funds, returned 2.66%.
What has been driving the fund’s
recent success?
The primary reason for our outperformance was our strategy within collateralized mortgage obligations, or CMOs, which are not held by the benchmark. The best performance came from our investments in interest-only securities, or IOs, which have performed very well over the past 15 or so months.
These securities are designed so that the longer homeowners take to pay down their mortgages, the more valuable the securities become. In essence, the longer it takes to pay down principal, the more money a bondholder will make from interest payments on that loan. In the case of IOs, two factors have really contributed to low levels of prepayment: falling home prices and increased difficulty in getting a mortgage.
Broad market index and fund performance
This comparison shows your fund’s performance in the context of broad market indexes for the six months ended 3/31/10. See pages 6 and 12–13 for additional fund performance information. Index descriptions can be found on page 16.
7
The net result is that these securities have become increasingly attractive. Also, as investors have become more aware of this opportunity, demand has increased in the sector, further benefiting returns.
Is there added risk that accompanies the
returns from interest-only securities?
There’s generally minimal credit risk associated with the fund’s IO securities because these are agency securities that are backed by the full faith and credit of the federal government. There is prepayment risk associated with these securities as homeowners have the ability to prepay their mortgage. Also, liquidity risk is involved in a smaller market like IOs. That’s why we analyze these securities very closely and continually monitor the liquidity levels in the IO market.
Has that analysis led to any notable
changes in portfolio composition in the
past six months?
Following this period of outperformance, we have begun to reduce our CMO exposure to a degree. Given that this is a relatively conservative government securities fund, we’ve analyzed the risk/reward in CMOs going forward and have cut our exposure by nearly half.
We continue to see great value in CMOs and believe they could continue to drive outperformance. We simply feel that there is an increased possibility for volatility in the future, however, which has been the driving force for the recent reduction in CMO exposure.
What is your outlook for the next six
months and how do you anticipate that
would affect positioning?
We’re drawing to the end of a period in which the government bond market has been
Portfolio composition as of 3/31/10
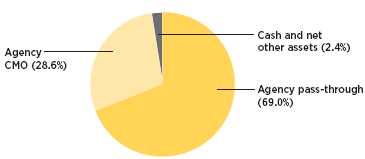
Allocations are represented as a percentage of portfolio value and include derivative instruments. These may differ from allocations shown later in this report. Holdings and allocations may vary over time.
8
“The primary reason for our outper-
formance was our strategy within
collateralized mortgage obligations.”
Rob Bloemker
artificially supported by the federal government. For an extended period, the Federal Reserve [the Fed] has been trying to improve the credit and loan markets by keeping the federal funds rate — a short-term interbank lending rate — at close to 0% and simultaneously buying short-term securities to keep rates low.
In all, the Fed has purchased $200 billion of agency debt and $1.25 trillion of agency mortgages, which is about 25% of the government mortgage market. By reducing this supply, the government has been artificially supporting prices for government agency securities.
As these programs draw to a close, we may have a vacuum in the government’s absence; how that vacuum gets filled will determine how these sectors perform. In other words, the possibility exists for a significant supply/ demand imbalance. Not only is the Federal Reserve exiting the market, but, as the economy improves, investors who would generally be interested in government securities may begin looking elsewhere.
Conversely, the end of the $1.25 trillion purchase of agency mortgages could portend good things for the fund. We have begun to see mortgage rates rise already, and, as they do, that typically causes mortgage prepayments to slow even further.
With interest-only securities, as prepayments slow, the value of cash flows increases. Given the current state of the housing market, we firmly believe that prepayment speeds should continue to decelerate. This would
Comparison of maturity composition
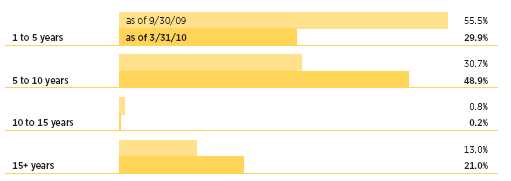
This chart illustrates the fund’s composition by maturity, showing the percentage of holdings in different maturity ranges and how the composition has changed over the past six months. Holdings and maturity ranges will vary over time.
9
IN THE NEWS
The Federal Reserve Board (the Fed) has started to tap the brakes on its unprecedented stimulus efforts. The central bank recently ended its 15-month $1.25 trillion mortgage-bond purchase program, which helped financial institutions find a market for their mortgage-backed assets, and kept mortgage rates low in an effort to buoy the battered real estate market.
The program was part of the government’s “quantitative easing” campaign designed to inject liquidity into the frozen credit markets in the wake of the 2008 Lehman Brothers collapse. Despite the Fed’s exit, mortgage rates and mortgage-bond prices are expected to remain stable over the near term. The Fed has said it will keep its benchmark federal funds rate at near zero, where it has been since December 2008, for an “extended period.”
Credit quality overview

Credit qualities are shown as a percentage of net assets as of 3/31/10. A bond rated Baa or higher (Prime-3 or higher, for short-term debt) is considered investment grade. The chart reflects Moody’s ratings; percentages may include bonds or derivatives not rated by Moody’s but rated by Standard & Poor’s or, if unrated by S&P, by Fitch, and then included in the closest equivalent Moody’s rating. Ratings will vary over time.
Credit quality includes cash bonds and cash, and represents only the fixed-income portion of the portfolio. Derivative instruments, including currency forwards, are only included to the extent of any unrealized gain or loss on such instruments. Rated derivatives are shown in the applicable Moody’s category. Unrated derivatives are shown in the not-rated category. If the aggregate market value of unrated cash bonds plus unrealized losses on unrated derivatives is negative, the sum will be expressed as 0.0% for the not-rated category.
10
bode well for our interest-only strategy. Not only do the securities become more valuable, but the length of time the fund would receive interest payments also increases. Overall, we feel confident that the fund is well positioned.
Of special interest
We are pleased to report that your fund’s monthly dividend increased from $0.058 to $0.065 per share during the period. The increases, which took effect in November 2009 and February 2010, were made possible due to increased interest income resulting from higher yields on interest-only (IO) securities and other mortgage-backed securities. IOs are securities whose cash flows come from the interest portion of underlying agency mortgages.
The views expressed in this report are exclusively those of Putnam Management. They are not meant as investment advice.
Please note that the holdings discussed in this report may not have been held by the fund for the entire period. Portfolio composition is subject to review in accordance with the fund’s investment strategy and may vary in the future. Current and future portfolio holdings are subject to risk.

Portfolio Manager Rob Bloemker is Head of Fixed Income at Putnam. He has a B.S. and a B.A. from Washington University. Rob joined Putnam in 1999 and has been in the investment industry since 1988.
In addition to Rob, your fund’s portfolio managers are Daniel Choquette and Michael Salm.
11
Your fund’s performance
This section shows your fund’s performance, price, and distribution information for periods ended March 31, 2010, the end of the first half of its current fiscal year. In accordance with regulatory requirements for mutual funds, we also include expense information taken from the fund’s current prospectus. Performance should always be considered in light of a fund’s investment strategy. Data represents past performance. Past performance does not guarantee future results. More recent returns may be less or more than those shown. Investment return and principal value will fluctuate, and you may have a gain or a loss when you sell your shares. Performance information does not reflect any deduction for taxes a shareholder may owe on fund distributions or on the redemption of fund shares. For the most recent month-end performance, please visit the Individual Investors section at putnam.com or call Putnam at 1-800-225-1581. Class Y shares are g enerally only available to corporate and institutional clients and clients in other approved programs. See the Terms and Definitions section in this report for definitions of the share classes offered by your fund.
Fund performance Total return for periods ended 3/31/10
| | | | | | | | | | |
| | Class A | Class B | Class C | Class M | Class R | Class Y |
| (inception dates) | (2/8/84) | (4/27/92) | (7/26/99) | (2/6/95) | (1/21/03) | (4/11/94) |
|
| | NAV | POP | NAV | CDSC | NAV | CDSC | NAV | POP | NAV | NAV |
|
| Annual average | | | | | | | | | | |
| (life of fund) | 7.41% | 7.24% | 6.55% | 6.55% | 6.59% | 6.59% | 7.08% | 6.95% | 7.12% | 7.56% |
|
| 10 years | 86.72 | 79.21 | 73.68 | 73.68 | 72.88 | 72.88 | 82.48 | 76.63 | 80.98 | 91.01 |
| Annual average | 6.44 | 6.01 | 5.68 | 5.68 | 5.63 | 5.63 | 6.20 | 5.85 | 6.11 | 6.69 |
|
| 5 years | 42.20 | 36.50 | 37.29 | 35.29 | 36.58 | 36.58 | 40.59 | 36.05 | 39.41 | 43.57 |
| Annual average | 7.30 | 6.42 | 6.54 | 6.23 | 6.43 | 6.43 | 7.05 | 6.35 | 6.87 | 7.50 |
|
| 3 years | 32.31 | 26.98 | 29.66 | 26.66 | 29.04 | 29.04 | 31.52 | 27.24 | 30.43 | 32.93 |
| Annual average | 9.78 | 8.29 | 9.04 | 8.20 | 8.87 | 8.87 | 9.56 | 8.36 | 9.26 | 9.95 |
|
| 1 year | 21.86 | 17.00 | 21.17 | 16.17 | 20.79 | 19.79 | 21.74 | 17.75 | 21.28 | 22.03 |
|
| 6 months | 6.75 | 2.50 | 6.40 | 1.40 | 6.32 | 5.32 | 6.76 | 3.27 | 6.53 | 6.85 |
|
Current performance may be lower or higher than the quoted past performance, which cannot guarantee future results. After-sales-charge returns (public offering price, or POP) for class A and M shares reflect a maximum 4.00% and 3.25% load, respectively. Class B share returns reflect the applicable contingent deferred sales charge (CDSC), which is 5% in the first year, declining to 1% in the sixth year, and is eliminated thereafter. Class C shares reflect a 1% CDSC for the first year that is eliminated thereafter. Class R and Y shares have no initial sales charge or CDSC. Performance for class B, C, M, R, and Y shares before their inception is derived from the historical performance of class A shares, adjusted for the applicable sales charge (or CDSC) and, except for class Y shares, the higher operating expenses for such shares.
For a portion of the periods, this fund may have limited expenses, without which returns would have been lower.
A 1% short-term trading fee may be applied to shares exchanged or sold within 7 days of purchase.
12
Comparative index returns For periods ended 3/31/10
| | |
| | Barclays Capital GNMA Index | Lipper GNMA Funds category average* |
|
| Annual average (life of fund) | 8.44% | 7.51% |
|
| 10 years | 84.03 | 74.33 |
| Annual average | 6.29 | 5.70 |
|
| 5 years | 33.68 | 30.75 |
| Annual average | 5.98 | 5.50 |
|
| 3 years | 22.14 | 21.50 |
| Annual average | 6.90 | 6.69 |
|
| 1 year | 5.13 | 7.02 |
|
| 6 months | 2.25 | 2.66 |
|
Index and Lipper results should be compared to fund performance at net asset value.
* Over the 6-month, 1-year, 3-year, 5-year, 10-year, and life-of-fund periods ended 3/31/10, there were 66, 66, 56, 55, 41, and 7 funds, respectively, in this Lipper category.
Fund price and distribution information For the six-month period ended 3/31/10
| | | | | | | | |
| Distributions | Class A | Class B | Class C | Class M | Class R | Class Y |
|
| Number | 6 | 6 | 6 | 6 | 6 | 6 |
|
| Income | $0.359 | $0.306 | $0.305 | $0.341 | $0.342 | $0.377 |
|
| Capital gains — Long-term | 0.050 | 0.050 | 0.050 | 0.050 | 0.050 | 0.050 |
|
| Capital gains — Short-term | — | — | — | — | — | — |
|
| Total | $0.409 | $0.356 | $0.355 | $0.391 | $0.392 | $0.427 |
|
| Share value | NAV | POP | NAV | NAV | NAV | POP | NAV | NAV |
|
| 9/30/09 | $14.50 | $15.10 | $14.44 | $14.44 | $14.49 | $14.98 | $14.40 | $14.42 |
|
| 3/31/10 | 15.06 | 15.69 | 15.00 | 14.99 | 15.07 | 15.58 | 14.94 | 14.97 |
|
| Current yield (end of period) | NAV | POP | NAV | NAV | NAV | POP | NAV | NAV |
|
| Current dividend rate 1 | 5.18% | 4.97% | 4.48% | 4.48% | 4.94% | 4.78% | 4.98% | 5.45% |
|
| Current 30-day SEC yield 2 | N/A | 4.33 | 3.80 | 3.76 | N/A | 4.13 | 4.26 | 4.76 |
|
The classification of distributions, if any, is an estimate. Final distribution information will appear on your year-end tax forms.
1 Most recent distribution, excluding capital gains, annualized and divided by NAV or POP at end of period.
2 Based only on investment income and calculated using the maximum offering price for each share class, in accordance with SEC guidelines.
13
Your fund’s expenses
As a mutual fund investor, you pay ongoing expenses, such as management fees, distribution fees (12b-1 fees), and other expenses. In the most recent six-month period, your fund limited these expenses; had it not done so, expenses would have been higher. Using the following information, you can estimate how these expenses affect your investment and compare them with the expenses of other funds. You may also pay one-time transaction expenses, including sales charges (loads) and redemption fees, which are not shown in this section and would have resulted in higher total expenses. For more information, see your fund’s prospectus or talk to your financial representative.
Expense ratios
| | | | | | |
| | Class A | Class B | Class C | Class M | Class R | Class Y |
|
| Total annual operating expenses for the fiscal year | | | | | | |
| ended 9/30/09* | 0.94% | 1.65% | 1.69% | 1.18% | 1.19% | 0.69% |
|
| Annualized expense ratio for the six-month period | | | | | | |
| ended 3/31/10† | 1.12% | 1.83% | 1.87% | 1.36% | 1.37% | 0.87% |
|
Fiscal-year expense information in this table is taken from the most recent prospectus, is subject to change, and may differ from that shown for the annualized expense ratio and in the financial highlights of this report. Expenses are shown as a percentage of average net assets.
* Reflects projected expenses based on a new management contract effective 1/1/10. Excludes estimated interest expense accruing in connection with the termination of certain derivative contracts.
† Includes interest accrued in connection with certain terminated derivatives contracts, which amounted to 0.13% of average net assets for the six months ended 3/31/10.
Expenses per $1,000
The following table shows the expenses you would have paid on a $1,000 investment in Putnam U.S. Government Income Trust from October 1, 2009, to March 31, 2010. It also shows how much a $1,000 investment would be worth at the close of the period, assuming actual returns and expenses.
| | | | | | |
| | Class A | Class B | Class C | Class M | Class R | Class Y |
|
| Expenses paid per $1,000*† | $5.77 | $9.42 | $9.62 | $7.01 | $7.05 | $4.49 |
|
| Ending value (after expenses) | $1,067.50 | $1,064.00 | $1,063.20 | $1,067.60 | $1,065.30 | $1,068.50 |
|
* Expenses for each share class are calculated using the fund’s annualized expense ratio for each class, which represents the ongoing expenses as a percentage of average net assets for the six months ended 3/31/10. The expense ratio may differ for each share class.
† Expenses are calculated by multiplying the expense ratio by the average account value for the period; then multiplying the result by the number of days in the period; and then dividing that result by the number of days in the year.
14
Estimate the expenses you paid
To estimate the ongoing expenses you paid for the six months ended March 31, 2010, use the following calculation method. To find the value of your investment on October 1, 2009, call Putnam at 1-800-225-1581.

Compare expenses using the SEC’s method
The Securities and Exchange Commission (SEC) has established guidelines to help investors assess fund expenses. Per these guidelines, the following table shows your fund’s expenses based on a $1,000 investment, assuming a hypothetical 5% annualized return. You can use this information to compare the ongoing expenses (but not transaction expenses or total costs) of investing in the fund with those of other funds. All mutual fund shareholder reports will provide this information to help you make this comparison. Please note that you cannot use this information to estimate your actual ending account balance and expenses paid during the period.
| | | | | | |
| | Class A | Class B | Class C | Class M | Class R | Class Y |
|
| Expenses paid per $1,000*† | $5.64 | $9.20 | $9.40 | $6.84 | $6.89 | $4.38 |
|
| Ending value (after expenses) | $1,019.35 | $1,015.81 | $1,015.61 | $1,018.15 | $1,018.10 | $1,020.59 |
|
* Expenses for each share class are calculated using the fund’s annualized expense ratio for each class, which represents the ongoing expenses as a percentage of average net assets for the six months ended 3/31/10. The expense ratio may differ for each share class.
† Expenses are calculated by multiplying the expense ratio by the average account value for the period; then multiplying the result by the number of days in the period; and then dividing that result by the number of days in the year.
15
Terms and definitions
Important terms
Total return shows how the value of the fund’s shares changed over time, assuming you held the shares through the entire period and reinvested all distributions in the fund.
Net asset value (NAV) is the price, or value, of one share of a mutual fund, without a sales charge. NAVs fluctuate with market conditions. NAV is calculated by dividing the net assets of each class of shares by the number of outstanding shares in the class.
Public offering price (POP) is the price of a mutual fund share plus the maximum sales charge levied at the time of purchase. POP performance figures shown here assume the 4.00% maximum sales charge for class A shares and 3.25% for class M shares.
Contingent deferred sales charge (CDSC) is generally a charge applied at the time of the redemption of class B or C shares and assumes redemption at the end of the period. Your fund’s class B CDSC declines from a 5% maximum during the first year to 1% during the sixth year. After the sixth year, the CDSC no longer applies. The CDSC for class C shares is 1% for one year after purchase.
Current yield is the annual rate of return earned from dividends or interest of an investment. Current yield is expressed as a percentage of the price of a security, fund share, or principal investment.
Share classes
Class A shares are generally subject to an initial sales charge and no CDSC (except on certain redemptions of shares bought without an initial sales charge).
Class B shares are not subject to an initial sales charge. They may be subject to a CDSC.
Class C shares are not subject to an initial sales charge and are subject to a CDSC only if the shares are redeemed during the first year.
Class M shares have a lower initial sales charge and a higher 12b-1 fee than class A shares and no CDSC (except on certain redemptions of shares bought without an initial sales charge).
Class R shares are not subject to an initial sales charge or CDSC and are available only to certain defined contribution plans.
Class Y shares are not subject to an initial sales charge or CDSC, and carry no 12b-1 fee. They are generally only available to corporate and institutional clients and clients in other approved programs.
Comparative indexes
Barclays Capital Aggregate Bond Index is an unmanaged index of U.S. investment-grade fixed-income securities.
Barclays Capital GNMA Index is an unmanaged index of Government National Mortgage Association bonds.
BofA (Bank of America) Merrill Lynch U.S. 3-Month Treasury Bill Index is an unmanaged index that seeks to measure the performance of U.S. Treasury bills available in the marketplace.
S&P 500 Index is an unmanaged index of common stock performance.
Indexes assume reinvestment of all distributions and do not account for fees. Securities and performance of a fund and an index will differ. You cannot invest directly in an index.
Lipper is a third-party industry-ranking entity that ranks mutual funds. Its rankings do not reflect sales charges. Lipper rankings are based on total return at net asset value relative to other funds that have similar current investment styles or objectives as determined by Lipper. Lipper may change a fund’s category assignment at its discretion. Lipper category averages reflect performance trends for funds within a category.
16
Trustee approval of management contract
General conclusions
The Board of Trustees of the Putnam funds oversees the management of each fund and, as required by law, determines annually whether to approve the continuance of your fund’s management contract with Putnam Investment Management (“Putnam Management”).
In this regard, the Board of Trustees, with the assistance of its Contract Committee consisting solely of Trustees who are not “interested persons” (as such term is defined in the Investment Company Act of 1940, as amended) of the Putnam funds (the “Independent Trustees”), requests and evaluates all information it deems reasonably necessary under the circumstances. Over the course of several months ending in June 2009, the Contract Committee met several times to consider the information provided by Putnam Management and other information developed with the assistance of the Board’s independent counsel and independent staff. The Contract Committee reviewed and discussed key aspects of this information with all of the Independent Trustees. At the Trustees’ June 12, 2009 meeting, the Contract Committee recommended, and the Independent Trustees approved, the continuance of your fund’s management contract, effective July 1 , 2009. In addition, at the Trustees’ September 11, 2009 meeting, the Contract Committee recommended, and the Independent Trustees approved, a sub-management contract with respect to your fund, between Putnam Management and its affiliate, Putnam Investments Limited (“PIL”), effective January 30, 2010. (Because PIL is an affiliate of Putnam Management and Putnam Management remains fully responsible for all services provided by PIL, the Trustees have not evaluated PIL as a separate entity, and all subsequent references to Putnam Management below should be deemed to include reference to PIL as necessary or appropriate in the context.)
The Independent Trustees’ approval was based on the following conclusions:
• That the fee schedule in effect for your fund represented reasonable compensation in light of the nature and quality of the services being provided to the fund, the fees paid by competitive funds and the costs incurred by Putnam Management in providing such services, and
• That such fee schedule represented an appropriate sharing between fund shareholders and Putnam Management of such economies of scale as may exist in the management of the fund at current asset levels.
These conclusions were based on a comprehensive consideration of all information provided to the Trustees, were subject to the continued application of certain expense reductions and waivers pending other considerations noted below, and were not the result of any single factor. Some of the factors that figured particularly in the Trustees’ deliberations and how the Trustees considered these factors are described below, although individual Trustees may have evaluated the information presented differently, giving different weights to various factors. It is also important to recognize that the fee arrangements for your fund and the other Putnam funds are the result of many years of review and discussion between the Independent Trustees and Putnam Management, that certain aspects of the arrangements may receive greater scrutiny in some years than others, and that the Trustees’ conclusions may be based, in part, on their consideration of these sam e arrangements in prior years.
17
Consideration of strategic
pricing proposal
The Trustees considered that the Contract Committee had been engaged in a detailed review of Putnam Management’s strategic pricing proposal that was first presented to the Committee at its May 2009 meeting. The proposal included proposed changes to the basic structure of the management fees in place for all open-end funds (except the Putnam RetirementReady® Funds and Putnam Money Market Liquidity Fund), including implementation of a breakpoint structure based on the aggregate net assets of all such funds in lieu of the individual breakpoint structures in place for each fund, as well as implementation of performance fees for certain funds. In addition, the proposal recommended substituting separate expense limitations on investor servicing fees and on other expenses as a group in lieu of the total expense limitations in place for many funds.
While the Contract Committee noted the likelihood that the Trustees and Putnam Management would reach agreement on the strategic pricing matters in later months, the terms of the management contracts required that the Trustees approve the continuance of the contracts in order to prevent their expiration at June 30, 2009. The Contract Committee’s recommendations in June reflect its conclusion that the terms of the contractual arrangements for your fund continued to be appropriate for the upcoming term, absent any possible agreement with respect to the matters addressed in Putnam Management’s proposal.
The Trustees were mindful of the significant changes that had occurred at Putnam Management in the past two years, including a change of ownership, the installation of a new senior management team at Putnam Management, the substantial decline in assets under management resulting from extraordinary market forces as well as continued net redemptions in many funds, the introduction of new fund products representing novel investment strategies and the introduction of performance fees for certain new funds. The Trustees were also mindful that many other leading firms in the industry had also been experiencing significant challenges due to the changing financial and competitive environment. For these reasons, even though the Trustees believed that the current contractual arrangements in place between the funds and Putnam Management and its affiliates have served shareholders well and continued to be appropriate for the nea r term, the Trustees believed that it was an appropriate time to reconsider the current structure of the funds’ contractual arrangements with Putnam Management with a view to possible changes that might better serve the interests of shareholders in this new environment. The Trustees concluded their review of Putnam Management’s strategic pricing proposal in July 2009, and their considerations regarding the proposal are discussed below under the heading “Subsequent approval of strategic pricing proposal.” With the exception of the discussion under this heading, the following discussion generally addresses only the Trustees’ reasons for recommending the continuance of the current contractual arrangements (and the new sub-management contract between Putnam Management and PIL, which the Trustees evaluated in large part based on their review of contractual arrangements in June 2009) as, at the time the Trustees determined to make this recommendation, the Trustees had not yet reached any c onclusions with respect to the strategic pricing proposal.
Management fee schedules and
categories; total expenses
The Trustees reviewed the management fee schedules in effect for all Putnam funds, including fee levels and breakpoints, and the assignment of funds to particular fee
18
categories. The general fee structure has been carefully developed over the years and re-examined on many occasions and adjusted where appropriate. In this regard, the Trustees noted that shareholders of all funds voted by overwhelming majorities in 2007 to approve new management contracts containing identical fee schedules.
In reviewing fees and expenses, the Trustees generally focused their attention on material changes in circumstances — for example, changes in a fund’s size or investment style, changes in Putnam Management’s operating costs, or changes in competitive practices in the mutual fund industry — that suggest that consideration of fee changes might be warranted. The Trustees concluded that the circumstances did not warrant changes to the management fee structure of your fund at that time but, as indicated above, based on their detailed review of the current fee structure, were prepared to consider possible changes to this arrangement that might better serve the interests of shareholders in the future. The Trustees focused on two areas of particular interest, as discussed further below:
• Competitiveness. The Trustees reviewed comparative fee and expense information for competitive funds, which indicated that, in a custom peer group of competitive funds selected by Lipper Inc., your fund ranked in the 69th percentile in management fees and in the 54th percentile in total expenses (less any applicable 12b-1 fees) as of December 31, 2008 (the first percentile being the least expensive funds and the 100th percentile being the most expensive funds).
The Trustees noted that expense ratios for a number of Putnam funds, which show the percentage of fund assets used to pay for management and administrative services, distribution (12b-1) fees (as applicable) and other expenses, had been increasing recently as a result of declining net assets and the natural operation of fee breakpoints. The Trustees expressed their intention to monitor the funds’ percentile rankings in management fees and in total expenses to ensure that fees and expenses of the funds continue to meet evolving competitive standards.
The Trustees noted that the expense ratio increases described above were being controlled by expense limitations initially implemented in January 2004. These expense limitations give effect to a commitment by Putnam Management that the expense ratio of each open-end fund would be no higher than the average expense ratio of the competitive funds included in the fund’s relevant Lipper universe (exclusive of any applicable 12b-1 charges in each case). The Trustees observed that this commitment to limit fund expenses has served shareholders well since its inception and, while the Contract Committee was reviewing proposed alternative expense limitation arrangements as noted above, the Trustees received a commitment from Putnam Management and its parent company to continue this program through at least June 30, 2010, or such earlier time as the Trustees and Putnam Management reach agreement on alternative arrangements.
In order to ensure that the expenses of the Putnam funds continue to meet evolving competitive standards, the Trustees requested, and Putnam Management agreed, to extend for the twelve months beginning July 1, 2009, or until such earlier time as the Trustees and Putnam Management reach agreement on alternative expense limitation arrangements, an additional expense limitation for certain funds at an amount equal to the average expense ratio (exclusive of 12b-1 charges) of a custom peer group of competitive funds selected by Lipper to correspond to the size of the fund. This additional expense limitation is applicable to those open-end funds that
19
had above-average expense ratios (exclusive of 12b-1 charges) based on the custom peer group data for the period ended December 31, 2007. This additional expense limitation was applied to your fund.
• Economies of scale. Your fund currently has the benefit of breakpoints in its management fee that provide shareholders with significant economies of scale, which means that the effective management fee rate of the fund (as a percentage of fund assets) declines as the fund grows in size and crosses specified asset thresholds. Conversely, as the fund shrinks in size — as has been the case for many Putnam funds in recent years — these breakpoints result in increasing fee levels. In recent years, the Trustees have examined the operation of the existing breakpoint structure during periods of both growth and decline in asset levels. The Trustees concluded that the fee schedule in effect for your fund represented an appropriate sharing of economies of scale at that time but, as noted above, were in the process of reviewing a prop osal to eliminate individual fund breakpoints for all of the open-end funds (except for the Putnam RetirementReady® Funds and Putnam Money Market Liquidity Fund) in favor of a breakpoint structure based on the aggregate net assets of all such funds.
In connection with their review of the management fees and total expenses of the Putnam funds, the Trustees also reviewed the costs of the services provided and profits realized by Putnam Management and its affiliates from their contractual relationships with the funds. This information included trends in revenues, expenses and profitability of Putnam Management and its affiliates relating to the investment management and distribution services provided to the funds. In this regard, the Trustees also reviewed an analysis of Putnam Management’s revenues, expenses and profitability with respect to the funds’ management contracts, allocated on a fund-by-fund basis.
Investment performance
The quality of the investment process provided by Putnam Management represented a major factor in the Trustees’ evaluation of the quality of services provided by Putnam Management under your fund’s management contract. The Trustees were assisted in their review of the Putnam funds’ investment process and performance by the work of the Investment Oversight Coordinating Committee of the Trustees and the Investment Oversight Committees of the Trustees, which had met on a regular monthly basis with the funds’ portfolio teams throughout the year. The Trustees concluded that Putnam Management generally provides a high-quality investment process — as measured by the experience and skills of the individuals assigned to the management of fund portfolios, the resources made available to such personnel, and in general the ability of Putnam Management to attract and retain high-quality personnel — but also recognized that this does no t guarantee favorable investment results for every fund in every time period. The Trustees considered the investment performance of each fund over multiple time periods and considered information comparing each fund’s performance with various benchmarks and with the performance of competitive funds.
The Trustees noted the disappointing investment performance of many of the funds for periods ended March 31, 2009. They discussed with senior management of Putnam Management the factors contributing to such underperformance and the actions being taken to improve performance. The Trustees recognized that, in recent years, Putnam Management has taken steps to strengthen its investment personnel and processes to address areas of underperformance, including Putnam Management’s continuing efforts to strengthen the equity research function, recent changes in portfolio
20
managers including increased accountability of individual managers rather than teams, recent changes in Putnam Management’s approach to incentive compensation, including emphasis on top quartile performance over a rolling three-year period, and the recent arrival of a new chief investment officer. The Trustees also recognized the substantial improvement in performance of many funds since the implementation of those changes. The Trustees indicated their intention to continue to monitor performance trends to assess the effectiveness of these efforts and to evaluate whether additional changes to address areas of underperformance are warranted.
In the case of your fund, the Trustees considered that your fund’s class A share cumulative total return performance at net asset value was in the following percentiles of its Lipper Inc. peer group (Lipper GNMA Funds) for the one-year, three-year and five-year periods ended March 31, 2009 (the first percentile being the best-performing funds and the 100th percentile being the worst-performing funds):
| | | |
| One-year period | 93rd | | |
| | |
| Three-year period | 92nd | | |
| | |
| Five-year period | 87th | | |
| | |
Over the one-year, three-year and five-year periods ended March 31, 2009, there were 64, 58 and 57 funds, respectively, in your fund’s Lipper peer group. Past performance is no guarantee of future results.
The Trustees noted the disappointing performance for certain funds, as well as certain circumstances that may have contributed to that performance and the actions taken by Putnam Management to address these funds’ performance. The Trustees also considered the four broad initiatives that Putnam Management has implemented to improve its investment approach, to reduce the likelihood of fourth quartile results, and to deliver on its long-term investment goals. Specifically, Putnam Management has:
1. Increased accountability and reduced complexity in the portfolio management process for the Putnam equity funds by replacing a team management structure with a decision-making process that vests full authority and responsibility with individual portfolio managers;
2. Clarified Putnam Management’s investment process by affirming a fundamental-driven approach to investing, with quantitative analysis providing additional input for investment decisions;
3. Strengthened Putnam Management’s large-cap equity research capability by adding multiple new investment personnel to the team and by bringing U.S. and international research under common leadership; and
4. Realigned compensation structure for portfolio managers and research analysts so that only those who achieve top-quartile returns over a rolling three-year basis are eligible for full bonuses.
The Trustees noted the disappointing performance for your fund for the one-year, three-year and five-year periods ended March 31, 2009. The Trustees considered Putnam Management’s belief that significant volatility and illiquidity in the markets contributed to the fund’s relative underperformance during these periods. In addition, the Trustees considered Putnam Management’s decision to implement initiative 4 described above. The Trustees also considered Putnam Management’s continued belief that the fund’s investment strategy and process are designed to produce attractive relative performance over longer periods, and noted improvements in the fund’s recent year-to-date performance as of March 31, 2009 as the markets began to show signs of stabilizing.
As a general matter, the Trustees believe that cooperative efforts between the Trustees and Putnam Management represent the most
21
effective way to address investment performance problems. The Trustees noted that investors in the Putnam funds have, in effect, placed their trust in the Putnam organization, under the oversight of the funds’ Trustees, to make appropriate decisions regarding the management of the funds. Based on the responsiveness of Putnam Management in the recent past to Trustee concerns about investment performance, the Trustees concluded that it is preferable to seek change within Putnam Management to address performance shortcomings. In the Trustees’ view, the alternative of engaging a new investment adviser for an underperforming fund would entail significant disruptions and would not provide any greater assurance of improved investment performance.
Brokerage and soft-dollar allocations;
other benefits
The Trustees considered various potential benefits that Putnam Management may receive in connection with the services it provides under the management contract with your fund. These include benefits related to brokerage and soft-dollar allocations, whereby a portion of the commissions paid by a fund for brokerage may be used to acquire research services that may be useful to Putnam Management in managing the assets of the fund and of other clients. The Trustees considered a change made, at Putnam Management’s request, to the Putnam funds’ brokerage allocation policy commencing in 2009, which increased the permitted soft dollar allocation to third-party services over what had been authorized in previous years. The Trustees noted that a portion of available soft dollars continue to be allocated to the payment of fund expenses, although the amount allocated for this purpose has declined in recent years. The Trustees indicated their continued int ent to monitor regulatory developments in this area with the assistance of their Brokerage Committee and also indicated their continued intent to monitor the potential benefits associated with the allocation of fund brokerage and trends in industry practice to ensure that the principle of seeking best price and execution remains paramount in the portfolio trading process.
The Trustees’ annual review of your fund’s management contract also included the review of the investor servicing agreement with Putnam Investor Services, Inc. (“PSERV”), which agreement provides benefits to an affiliate of Putnam Management. The Trustees considered that effective January 1, 2009, the Trustees, PSERV and Putnam Management entered into a new fee schedule that includes for the open-end funds (other than funds of Putnam Variable Trust and Putnam Money Market Liquidity Fund) an expense limitation but, as noted above, also considered that this expense limitation is subject to review as part of the Trustees’ pending review of Putnam’s strategic pricing proposal.
In the case of your fund, the Trustees’ annual review of the fund’s management contract also included the review of the fund’s distributor’s contract and distribution plans with Putnam Retail Management Limited Partnership, which contract and plans also provide benefits to an affiliate of Putnam Management.
Comparison of retail and institutional
fee schedules
The information examined by the Trustees as part of their annual contract review has included for many years information regarding fees charged by Putnam Management and its affiliates to institutional clients such as defined benefit pension plans, college endowments, etc. This information included comparisons of such fees with fees charged to the funds, as well as a detailed assessment of the differences in the services provided to these two types of clients. The Trustees observed, in this regard, that the differences in fee rates between
22
institutional clients and mutual funds are by no means uniform when examined by individual asset sectors, suggesting that differences in the pricing of investment management services to these types of clients reflect to a substantial degree historical competitive forces operating in separate market places. The Trustees considered the fact that fee rates across different asset classes are typically higher on average for mutual funds than for institutional clients, as well as the differences between the services that Putnam Management provides to the Putnam funds and those that it provides to institutional clients of the firm, but did not rely on such comparisons to any significant extent in concluding that the management fees paid by your fund are reasonable.
Subsequent approval of strategic
pricing proposal
As mentioned above, at a series of meetings beginning in May 2009 and ending on July 10, 2009, the Contract Committee and the Trustees engaged in a detailed review of Putnam Management’s strategic pricing proposal. Following this review, the Trustees of each fund, including all of the Independent Trustees, voted unanimously on July 10, 2009 to approve proposed management contracts reflecting the proposal, as modified based on discussions between the Independent Trustees and Putnam Management, for each fund. In considering the proposed contracts, the Independent Trustees focused largely on the specific proposed changes described below relating to management fees. They also took into account the factors that they considered in connection with their most recent annual approval on June 12, 2009 of the continuance of the funds’ current management contracts and the extensive materials that they had reviewed in connection with that approval process, as described above.
At a meeting held on November 19, 2009, shareholders approved the proposed management contract for your fund. The new management contract was implemented on January 1, 2010.
• Considerations relating to Fund Family fee rate calculations. The Independent Trustees considered that the proposed management contracts would change the manner in which fund shareholders share in potential economies of scale associated with the management of the funds. Under the current management contracts, shareholders of a fund (other than Putnam Money Market Liquidity Fund and the Putnam RetirementReady® Funds, which do not pay management fees to Putnam Management) benefit from increased fund size through reductions in the effective management fee paid to Putnam Management once the fund’s net assets exceed the first breakpoint in the fund’s fee schedule ($500 million for most funds). Conversely, in the case of funds with net assets above the level of the first breakpoint, the effective management fee increases as the fund’s average net assets decline below a breakpoint. These breakpoints are measured solely by the net assets of each individual fund and are not affected by possible growth (or decline) of net assets of other funds in the Fund Family. (“Fund Family” for purposes of this discussion refers to all open-end mutual funds sponsored by Putnam Management, except for the Putnam RetirementReady® Funds and Putnam Money Market Liquidity Fund.) Under the proposed management contracts, potential economies of scale would be shared ratably among shareholders of all funds, regardless of their size. The management fees paid by a fund (and indirectly by shareholders) would no longer be affected by the growth (or decline) of assets of the particular fund, but rather would be affected solely by the growth (or decline) of the aggregate net assets of all funds in the Fund Family, regardless of whether the net assets of the particular fund are growing or declining.
23
The table below shows the proposed effective management fee rate for your fund, based on June 30, 2009 net assets of the Fund Family ($52.3 billion). This table also shows the effective management fee rate payable by your fund under its current management contract, based on the net assets of the fund as of June 30, 2009. Finally, this table shows the difference in the effective management fees, based on net assets as of June 30, 2009, between the proposed management contract and the current contract.
| | | |
| | Proposed Effective | Current Effective | |
| Name of Fund | Contractual Rate | Contractual Rate | Difference |
|
| Putnam U.S. Government Income Trust | 0.412% | 0.504% | (0.092)% |
As shown in the foregoing table, based on June 30, 2009 net asset levels, the proposed management contract would provide for payment of a management fee rate that is lower for your fund than the management fee rate payable under the current management contract. For a small number of funds (although not your fund), the management fee rate would be slightly higher under the proposed contract at these asset levels, but by only immaterial amounts. In the aggregate, the financial impact on Putnam Management of implementing this proposed change for all funds at June 30, 2009 net asset levels is a reduction in annual management fee revenue of approximately $24.0 million. (Putnam Management has already incurred a significant portion of this revenue reduction through the waiver of a portion of its current management fees for certain funds pending shareholder consideration of the proposed management contracts. Putnam is not obliged to continue such waivers beyond July 31, 2010 in the event that the proposed contracts are not approved by shareholders.) The Independent Trustees carefully considered the implications of this proposed change under a variety of economic circumstances. They considered the fact that at current asset levels the management fees paid by the funds under the proposed contract would be lower for almost all funds, and would not be materially higher for any fund. They considered the possibility that under some circumstances, the current management contract could result in a lower fee for a particular fund than the proposed management contract. Such circumstances might occur, for example, if the aggregate net assets of the Fund Family remain largely unchanged and the net assets of an individual fund grew substantially, or if the net assets of an individual fund remain largely unchanged and the aggregate net assets of the Fund Family declined substantially.
The Independent Trustees noted that future changes in the net assets of individual funds are inherently unpredictable and that experience has shown that funds often grow in size and decline in size over time depending on market conditions and the changing popularity of particular investment styles and asset classes. They noted that, while the aggregate net assets of the Fund Family have changed substantially over time, basing a management fee on the aggregate level of assets of the Fund Family would likely reduce fluctuations in costs paid by individual funds and lead to greater stability and predictability of fund operating costs over time.
The Independent Trustees considered that the proposed management contract would likely be advantageous for newly organized funds that have yet to attract significant assets and for funds in specialty asset classes that are unlikely to grow to a significant size. In each case, such funds would participate in the benefits of scale made possible by the aggregate size of the Fund Family to an extent that would not be possible based solely on their individual size.
The Independent Trustees also considered that for funds that have achieved or are likely to achieve considerable scale on their own, the
24
proposed management contract could result in sharing of economies which might lead to slightly higher costs under some circumstances, but they noted that any such increases are immaterial at current asset levels and that over time such funds are likely to realize offsetting benefits from their opportunity to participate, both through the exchange privilege and through the Fund Family breakpoint fee structure, in the improved growth prospects of a diversified Fund Family able to offer competitively priced products.
The Independent Trustees noted that the implementation of the proposed management contracts would result in a reduction in aggregate fee revenues for Putnam Management at current asset levels. They also noted that applying various projections of growth equally to the aggregate net assets of the Fund Family and to the net assets of individual funds also showed revenue reductions for Putnam Management. They recognized, however, the possibility that under some scenarios Putnam Management might realize greater future revenues, with respect to certain funds, under the proposed contracts than under the current contracts, but considered such circumstances to be both less likely and inherently unpredictable.
The Independent Trustees considered the extent to which Putnam Management may realize economies of scale in connection with the management of the funds. In this regard, they considered the possibility that such economies of scale as may exist in the management of mutual funds may be associated more closely with the size of the aggregate assets of the mutual fund complex than with the size of any individual fund. In this regard the Independent Trustees considered the financial information provided to them by Putnam Management over a period of many years regarding the allocation of costs involved in calculating the profitability of its mutual fund business as a whole and the profitability of individual funds. The Independent Trustees noted that the methodologies for such cost allocations had been reviewed on a number of occasions in the past by independent financial consultants engaged by the Independent Trustees. The Independent Trustees noted that these methodologies support Putnam Management’s assertion that many of its operating costs and any associated economies of scale are related more to the aggregate net assets under management in various sectors of its business than to the size of individual funds. They noted that on a number of occasions in the past the Independent Trustees had separately considered the possibility of calculating management fees in whole or in part based on aggregate net assets of the Putnam funds.
The Independent Trustees considered the fact that the proposed contracts would result in a sharing among the affected funds of economies of scale that for the most part are now enjoyed by the larger funds, without materially increasing the current costs of any of the larger funds. They concluded that this sharing of economies among funds was appropriate in light of the diverse investment opportunities available to shareholders of all funds through the existence of the exchange privilege. They also considered that the proposed change in management fee structure would allow Putnam Management to introduce new investment products at more attractive pricing levels than may currently be the case.
After considering all of the foregoing, the Independent Trustees concluded that the proposed calculation of management fees based on the aggregate net assets of the Fund Family represented a fair and reasonable means of sharing possible economies of scale among the shareholders of all funds.
• Considerations relating to addition of fee rate adjustments based on investment performance for certain funds. The Independent Trustees considered that
25
Putnam’s proposal to add fee rate adjustments based on investment performance to the management contracts of certain funds reflected a desire by Putnam Management to align its fee revenues more closely with investment performance in the case of certain funds. They noted that Putnam Management already has a significant financial interest in achieving good performance results for the funds it manages. Putnam Management’s fees are based on the assets under its management (whether calculated on an individual fund or complex-wide basis). Good performance results in higher asset levels and therefore higher revenues to Putnam Management. Moreover, good performance also tends to attract additional investors to particular funds or the complex generally, also resulting in higher revenues. Nevertheless, the Independent Trustees concluded that adjusting management fees based on performance for certain selected funds could provide additional benefits to s hareholders.
The Independent Trustees noted that Putnam Management proposed the addition of performance adjustments only for certain of the funds (performance adjustments were not proposed for your fund) and considered whether similar adjustments might be appropriate for other funds. In this regard, they considered Putnam Management’s belief that the addition of performance adjustments would be most appropriate for shareholders of U.S. growth funds, international equity funds and Putnam Global Equity Fund. They also considered Putnam Management’s view that it would continue to monitor whether performance fees would be appropriate for other funds. Accordingly, the Independent Trustees concluded that it would be desirable to gain further experience with the operation of performance adjustments for certain funds and the market’s receptivity to such fee structures before giving further consideration to whether similar performance adjustments would be appropriate for other funds as well.
• Considerations relating to standardization of payment terms. The proposed management contracts for all funds provide that management fees will be computed and paid monthly within 15 days after the end of each month. The current contracts of the funds contain quarterly computation and payment terms in some cases. These differences largely reflect practices in place at earlier times when many of the funds were first organized. Under the proposed contract, certain funds would make payments to Putnam Management earlier than they do under their current contract. This would reduce a fund’s opportunity to earn income on accrued but unpaid management fees by a small amount, but would not have a material effect on a fund’s operating costs.
The Independent Trustees considered the fact that standardizing the payment terms for all funds would involve an acceleration in the timing of payments to Putnam Management for some funds and a corresponding loss of a potential opportunity for such funds to earn income on accrued but unpaid management fees. The Independent Trustees did not view this change as having a material impact on shareholders of any fund. In this regard, the Independent Trustees noted that the proposed contracts conform to the payment terms included in management contracts for all Putnam funds organized in recent years and that standardizing payment terms across all funds would reduce administrative burdens for both the funds and Putnam Management.
• Considerations relating to comparisons with management fees and total expenses of competitive funds. As part of their evaluation of the proposed management contracts, the Independent Trustees also reviewed the general approach taken by Putnam Management and the Independent Trustees
26
in recent years in imposing appropriate limits on total fund expenses. As part of the annual contract review process in recent years, Putnam Management agreed to waive fees as needed to limit total fund expenses to a maximum level equal to the average total expenses of comparable competitive funds in the mutual fund industry. In connection with its proposal to implement new management contracts, Putnam Management also proposed, and the Independent Trustees approved, certain changes in this approach that shift the focus from controlling total expenses to imposing separate limits on certain categories of expenses, as required. As a general matter, Putnam Management and the Independent Trustees concluded that management fees for the Putnam funds are competitive with the fees charged by comparable funds in the industry. Nevertheless, the Independent Trustees considered specific management fee waivers proposed to be implemented as of August 1, 2009 by Putna m Management with respect to the current management fees of certain funds, as well as projected reductions in management fees for almost all funds that would result under the proposed contracts. Putnam Management and the Independent Trustees also agreed to impose separate expense limitations of 37.5 basis points on the general category of shareholder servicing expenses and 20 basis points on the general category of other ordinary operating expenses. These new expense limitations, as well as the fee waivers, were implemented for all funds effective as of August 1, 2009, replacing the expense limitation referred to above.
These changes resulted in lower total expenses for many funds, but in the case of some funds total expenses increased after application of the new waivers and expense limitations (as compared with the results obtained using the expense limitation method previously in place). In this regard, the Independent Trustees considered the likelihood that total expenses for most of these funds would have increased in any event in the normal course under the previous expense limitation arrangement, as the reported total expense levels of many competitive funds increased in response to the major decline in asset values that began in September 2008. These new waivers and expense limitations will continue in effect until at least July 31, 2010 and will be re-evaluated by the Independent Trustees as part of the annual contract review process prior to their scheduled expiration. However, the management fee waivers referred to above would largely become permanent reduc tions in fees as a result of the implementation of the proposed management contracts.
Under these new expense limitation arrangements effective August 1, 2009, the fixed income funds, including your fund, and asset allocation funds were subject to management fee waivers that reduced these funds’ management fees pending implementation of the proposed management contracts, and in any event, through July 31, 2010. In addition, your fund is subject to expense limitations of 37.5 basis points on the category of shareholder servicing fees and 20 basis points on the general category of other ordinary operating expenses.
27
Other information for shareholders
Important notice regarding delivery
of shareholder documents
In accordance with SEC regulations, Putnam sends a single copy of annual and semiannual shareholder reports, prospectuses, and proxy statements to Putnam shareholders who share the same address, unless a shareholder requests otherwise. If you prefer to receive your own copy of these documents, please call Putnam at 1-800-225-1581, and Putnam will begin sending individual copies within 30 days.
Proxy voting
Putnam is committed to managing our mutual funds in the best interests of our shareholders. The Putnam funds’ proxy voting guidelines and procedures, as well as information regarding how your fund voted proxies relating to portfolio securities during the 12-month period ended June 30, 2009, are available in the Individual Investors section of putnam.com, and on the SEC’s Web site, www.sec.gov. If you have questions about finding forms on the SEC’s Web site, you may call the SEC at 1-800-SEC-0330. You may also obtain the Putnam funds’ proxy voting guidelines and procedures at no charge by calling Putnam’s Shareholder Services at 1-800-225-1581.
Fund portfolio holdings
The fund will file a complete schedule of its portfolio holdings with the SEC for the first and third quarters of each fiscal year on Form N-Q. Shareholders may obtain the fund’s Forms N-Q on the SEC’s Web site at www.sec.gov. In addition, the fund’s Forms N-Q may be reviewed and copied at the SEC’s Public Reference Room in Washington, D.C. You may call the SEC at 1-800-SEC-0330 for information about the SEC’s Web site or the operation of the Public Reference Room.
Trustee and employee
fund ownership
Putnam employees and members of the Board of Trustees place their faith, confidence, and, most importantly, investment dollars in Putnam mutual funds. As of March 31, 2010, Putnam employees had approximately $340,000,000 and the Trustees had approximately $48,000,000 invested in Putnam mutual funds. These amounts include investments by the Trustees’ and employees’ immediate family members as well as investments through retirement and deferred compensation plans.
28
Financial statements
A guide to financial statements
These sections of the report, as well as the accompanying Notes, constitute the fund’s financial statements.
The fund’s portfolio lists all the fund’s investments and their values as of the last day of the reporting period. Holdings are organized by asset type and industry sector, country, or state to show areas of concentration and diversification.
Statement of assets and liabilities shows how the fund’s net assets and share price are determined. All investment and noninvestment assets are added together. Any unpaid expenses and other liabilities are subtracted from this total. The result is divided by the number of shares to determine the net asset value per share, which is calculated separately for each class of shares. (For funds with preferred shares, the amount subtracted from total assets includes the liquidation preference of preferred shares.)
Statement of operations shows the fund’s net investment gain or loss. This is done by first adding up all the fund’s earnings — from dividends and interest income — and subtracting its operating expenses to determine net investment income (or loss). Then, any net gain or loss the fund realized on the sales of its holdings — as well as any unrealized gains or losses over the period — is added to or subtracted from the net investment result to determine the fund’s net gain or loss for the fiscal period.
Statement of changes in net assets shows how the fund’s net assets were affected by the fund’s net investment gain or loss, by distributions to shareholders, and by changes in the number of the fund’s shares. It lists distributions and their sources (net investment income or realized capital gains) over the current reporting period and the most recent fiscal year-end. The distributions listed here may not match the sources listed in the Statement of operations because the distributions are determined on a tax basis and may be paid in a different period from the one in which they were earned. Dividend sources are estimated at the time of declaration. Actual results may vary. Any non-taxable return of capital cannot be determined until final tax calculations are completed after the end of the fund’s fiscal year.
Financial highlights provide an overview of the fund’s investment results, per-share distributions, expense ratios, net investment income ratios, and portfolio turnover in one summary table, reflecting the five most recent reporting periods. In a semiannual report, the highlights table also includes the current reporting period.
29
The fund’s portfolio 3/31/10 (Unaudited)
| | |
| U.S. GOVERNMENT AND AGENCY | | |
| MORTGAGE OBLIGATIONS (128.4%)* | Principal amount | Value |
|
| U.S. Government Guaranteed Mortgage Obligations (104.9%) | | |
| Government National Mortgage Association Adjustable | | |
| Rate Mortgages 4 5/8s, July 20, 2026 | $36,546 | $37,686 |
|
| Government National Mortgage Association | | |
| Graduated Payment Mortgages | | |
| 13 1/4s, December 20, 2014 | 11,839 | 13,918 |
| 12 3/4s, with due dates from December 15, 2013 | | |
| to July 20, 2014 | 20,765 | 23,881 |
| 12 1/4s, with due dates from February 15, 2014 | | |
| to March 15, 2014 | 31,267 | 35,733 |
| 11 1/4s, with due dates from September 15, 2015 | | |
| to December 15, 2015 | 28,220 | 32,758 |
| 9 1/4s, with due dates from April 15, 2016 | | |
| to May 15, 2016 | 19,703 | 21,852 |
|
| Government National Mortgage Association | | |
| Pass-Through Certificates | | |
| 8 1/2s, December 15, 2019 | 9,248 | 10,249 |
| 7 1/2s, October 20, 2030 | 161,056 | 175,993 |
| 7s, with due dates from September 15, 2010 | | |
| to August 15, 2012 | 140,888 | 144,275 |
| 6 1/2s, with due dates from September 15, 2025 | | |
| to August 20, 2039 | 86,560,974 | 93,640,855 |
| 6 1/2s, with due dates from May 15, 2024 | | |
| to June 15, 2024 | 130,522 | 142,950 |
| 6s, with due dates from April 15, 2026 | | |
| to January 20, 2040 | 373,648,714 | 400,546,263 |
| 6s, with due dates from November 15, 2023 | | |
| to February 15, 2024 | 600,891 | 650,804 |
| 6s, TBA, April 1, 2040 | 92,000,000 | 98,483,130 |
| 5 1/2s, with due dates from March 15, 2033 | | |
| to October 15, 2035 | 6,768,585 | 7,208,432 |
| 5s, March 20, 2040 D | 98,927,000 | 102,714,044 |
| 5s, TBA, April 1, 2040 | 2,600,000 | 2,694,453 |
| 5s, TBA, April 1, 2040 | 238,000,000 | 247,278,287 |
| 4 1/2s, February 20, 2040 | 64,000,046 | 64,705,045 |
| 4 1/2s, TBA, April 1, 2040 | 100,000,000 | 100,859,380 |
| 4 1/2s, TBA, April 1, 2040 | 375,000,000 | 379,218,750 |
|
| | | 1,498,638,738 |
| U.S. Government Agency Mortgage Obligations (23.5%) | | |
| Federal National Mortgage Association | | |
| Pass-Through Certificates | | |
| 6s, TBA, May 1, 2040 | 78,000,000 | 83,158,358 |
| 6s, TBA, April 1, 2040 | 238,000,000 | 252,763,426 |
|
| | | 335,921,784 |
| Total U.S. government and agency mortgage obligations (cost $1,833,794,710) | $1,834,560,522 |
30
| | |
| MORTGAGE-BACKED SECURITIES (28.3%)* | Principal amount | Value |
|
| Countrywide Home Loans 144A | | |
| IFB Ser. 05-R1, Class 1AS, IO, 5.664s, 2035 | $32,018,135 | $3,628,552 |
| Ser. 06-R1, Class AS, IO, 5.643s, 2036 | 3,455,332 | 373,608 |
| Ser. 05-R3, Class AS, IO, 5.576s, 2035 | 3,247,680 | 353,185 |
| FRB Ser. 06-R2, Class AS, IO, 5.501s, 2036 | 5,999,556 | 603,705 |
| IFB Ser. 05-R2, Class 1AS, IO, 5.322s, 2035 | 24,346,360 | 2,557,622 |
| FRB Ser. 04-R2, Class 1AF1, 0.666s, 2034 F | 2,801,499 | 2,227,087 |
| FRB Ser. 05-R1, Class 1AF1, 0.606s, 2035 F | 1,175,124 | 934,196 |
|
| Fannie Mae | | |
| IFB Ser. 07-75, Class JS, 50.392s, 2037 | 500,063 | 890,812 |
| IFB Ser. 06-62, Class PS, 38.424s, 2036 | 1,606,883 | 2,652,483 |
| IFB Ser. 07-30, Class FS, 28.688s, 2037 | 625,805 | 896,947 |
| IFB Ser. 06-49, Class SE, 28.016s, 2036 | 580,722 | 845,079 |
| IFB Ser. 05-25, Class PS, 27.077s, 2035 | 106,405 | 154,021 |
| IFB Ser. 05-74, Class NK, 26.27s, 2035 | 2,793,008 | 3,658,590 |
| IFB Ser. 06-115, Class ES, 25.576s, 2036 | 679,623 | 950,072 |
| IFB Ser. 06-8, Class HP, 23.664s, 2036 | 1,661,141 | 2,297,507 |
| IFB Ser. 05-99, Class SA, 23.664s, 2035 | 1,130,936 | 1,532,384 |
| IFB Ser. 05-74, Class DM, 23.481s, 2035 | 11,504,467 | 16,263,211 |
| IFB Ser. 08-24, Class SP, 22.381s, 2038 | 8,415,052 | 11,007,679 |
| IFB Ser. 05-122, Class SC, 22.239s, 2035 | 2,651,570 | 3,497,907 |
| IFB Ser. 05-106, Class JC, 19.361s, 2035 | 2,034,774 | 2,578,446 |
| IFB Ser. 05-83, Class QP, 16.754s, 2034 | 821,341 | 1,024,135 |
| IFB Ser. 05-66, Class SL, 15.96s, 2035 F | 2,484,916 | 2,870,541 |
| FRB Ser. 03-W6, Class PT1, 10.11s, 2042 | 1,031,752 | 1,261,349 |
| Ser. 02-T4, Class A4, 9 1/2s, 2041 | 310 | 375 |
| Ser. 04-T3, Class PT1, 8.934s, 2044 | 172,335 | 201,218 |
| IFB Ser. 06-90, Class SE, IO, 7.554s, 2036 | 1,069,872 | 156,830 |
| Ser. 02-26, Class A2, 7 1/2s, 2048 | 282,838 | 322,258 |
| Ser. 05-W3, Class 1A, 7 1/2s, 2045 | 5,519 | 6,230 |
| Ser. 05-W1, Class 1A4, 7 1/2s, 2044 | 3,556 | 4,008 |
| Ser. 04-W12, Class 1A4, 7 1/2s, 2044 | 957 | 1,079 |
| Ser. 04-W14, Class 2A, 7 1/2s, 2044 | 328 | 370 |
| Ser. 04-W11, Class 1A4, 7 1/2s, 2044 | 2,707 | 3,055 |
| Ser. 04-W2, Class 5A, 7 1/2s, 2044 | 29,665 | 33,496 |
| Ser. 04-T2, Class 1A4, 7 1/2s, 2043 | 587,777 | 667,907 |
| Ser. 03-W1, Class 2A, 7 1/2s, 2042 | 690,869 | 777,545 |
| Ser. 03-W4, Class 4A, 7 1/2s, 2042 | 2,622 | 2,958 |
| Ser. 03-W3, Class 1A3, 7 1/2s, 2042 | 6,770 | 7,644 |
| Ser. 02-T16, Class A3, 7 1/2s, 2042 | 6,088 | 6,924 |
| Ser. 02-T19, Class A3, 7 1/2s, 2042 | 379,301 | 430,861 |
| Ser. 03-W2, Class 1A3, 7 1/2s, 2042 | 2,009 | 2,270 |
| Ser. 02-W6, Class 2A, 7 1/2s, 2042 | 43,161 | 48,639 |
| Ser. 2002-W8, Class A3, 7 1/2s, 2042 | 438 | 492 |
| Ser. 02-W4, Class A5, 7 1/2s, 2042 | 4,907 | 5,540 |
| Ser. 02-W1, Class 2A, 7 1/2s, 2042 | 4,015 | 4,518 |
| Ser. 02-14, Class A2, 7 1/2s, 2042 | 407,344 | 464,118 |
| Ser. 02-T4, Class A3, 7 1/2s, 2041 | 472,647 | 537,217 |
| Ser. 02-T6, Class A2, 7 1/2s, 2041 | 9,490 | 10,794 |
| Ser. 01-T12, Class A2, 7 1/2s, 2041 | 1,068,002 | 1,214,566 |
| Ser. 01-T8, Class A1, 7 1/2s, 2041 | 4,902 | 5,563 |
31
| | |
| MORTGAGE-BACKED SECURITIES (28.3%)* cont. | Principal amount | Value |
|
| Fannie Mae | | |
| Ser. 01-T7, Class A1, 7 1/2s, 2041 | $14,458 | $16,364 |
| Ser. 01-T3, Class A1, 7 1/2s, 2040 | 842,099 | 953,790 |
| Ser. 01-T1, Class A1, 7 1/2s, 2040 | 4,557,372 | 5,144,799 |
| Ser. 99-T2, Class A1, 7 1/2s, 2039 | 1,698,105 | 1,878,707 |
| Ser. 02-33, Class A2, 7 1/2s, 2032 | 1,731,028 | 1,972,290 |
| Ser. 00-T6, Class A1, 7 1/2s, 2030 | 892,182 | 1,008,798 |
| Ser. 02-W7, Class A5, 7 1/2s, 2029 | 719 | 813 |
| Ser. 01-T4, Class A1, 7 1/2s, 2028 | 2,357,069 | 2,665,606 |
| Ser. 02-26, Class A1, 7s, 2048 | 2,114,786 | 2,375,169 |
| Ser. 04-W12, Class 1A3, 7s, 2044 | 1,247,661 | 1,386,832 |
| Ser. 04-T2, Class 1A3, 7s, 2043 F | 783,981 | 880,314 |
| Ser. 03-W3, Class 1A2, 7s, 2042 | 711,830 | 791,144 |
| Ser. 02-14, Class A1, 7s, 2042 | 229 | 254 |
| Ser. 01-T10, Class A1, 7s, 2041 | 1,479,517 | 1,653,627 |
| Ser. 01-W3, Class A, 7s, 2041 | 68,631 | 75,937 |
| Ser. 05-W4, Class 1A3, 7s, 2035 | 380 | 422 |
| IFB Ser. 04-W2, Class 1A3S, IO, 6.904s, 2044 | 615,195 | 57,675 |
| IFB Ser. 06-79, Class DI, IO, 6.904s, 2036 | 2,680,518 | 399,956 |
| IFB Ser. 04-24, Class CS, IO, 6.904s, 2034 | 801,025 | 134,730 |
| IFB Ser. 04-40, Class KS, IO, 6.804s, 2034 | 16,560,110 | 2,768,519 |
| IFB Ser. 05-65, Class KI, IO, 6.754s, 2035 | 4,018,914 | 577,880 |
| IFB Ser. 05-48, Class SM, IO, 6.554s, 2034 | 1,898,165 | 255,417 |
| IFB Ser. 07-54, Class CI, IO, 6.514s, 2037 | 1,334,284 | 146,955 |
| IFB Ser. 07-30, Class WI, IO, 6.514s, 2037 | 3,002,231 | 388,399 |
| IFB Ser. 07-58, Class SP, IO, 6.504s, 2037 | 1,283,837 | 200,060 |
| IFB Ser. 07-28, Class SE, IO, 6.504s, 2037 | 1,586,446 | 174,771 |
| IFB Ser. 07-24, Class SD, IO, 6.504s, 2037 | 1,815,404 | 249,872 |
| IFB Ser. 06-79, Class SI, IO, 6.504s, 2036 | 6,516,707 | 813,480 |
| IFB Ser. 05-90, Class GS, IO, 6.504s, 2035 | 371,657 | 51,868 |
| IFB Ser. 05-90, Class SP, IO, 6.504s, 2035 | 3,451,679 | 410,968 |
| IFB Ser. 05-12, Class SC, IO, 6.504s, 2035 | 1,499,335 | 187,014 |
| IFB Ser. 05-18, Class SK, IO, 6.504s, 2035 | 352,645 | 33,346 |
| IFB Ser. 07-30, Class IE, IO, 6.494s, 2037 | 4,632,499 | 760,054 |
| IFB Ser. 06-123, Class CI, IO, 6.494s, 2037 | 3,490,351 | 497,340 |
| IFB Ser. 07-57, Class SC, IO, 6.484s, 2037 | 27,767,599 | 3,475,787 |
| IFB Ser. 06-43, Class JS, IO, 6.454s, 2036 | 15,709,863 | 2,330,558 |
| IFB Ser. 06-31, Class SX, IO, 6.454s, 2036 | 3,338,325 | 404,291 |
| IFB Ser. 06-33, Class JS, IO, 6.454s, 2036 | 2,359,105 | 315,436 |
| IFB Ser. 06-36, Class SP, IO, 6.454s, 2036 | 7,511,777 | 864,720 |
| IFB Ser. 06-23, Class SP, IO, 6.454s, 2036 | 1,818,413 | 270,198 |
| IFB Ser. 06-16, Class SM, IO, 6.454s, 2036 | 1,128,657 | 137,344 |
| IFB Ser. 06-8, Class HL, IO, 6.454s, 2036 | 11,338,455 | 1,773,221 |
| IFB Ser. 05-95, Class CI, IO, 6.454s, 2035 | 2,746,393 | 399,847 |
| IFB Ser. 05-84, Class SG, IO, 6.454s, 2035 | 4,320,487 | 599,657 |
| IFB Ser. 06-3, Class SB, IO, 6.454s, 2035 | 8,754,548 | 1,340,146 |
| IFB Ser. 05-57, Class DI, IO, 6.454s, 2035 | 1,900,380 | 225,536 |
| IFB Ser. 05-104, Class SI, IO, 6.454s, 2033 | 23,817,945 | 3,244,798 |
| IFB Ser. 05-83, Class QI, IO, 6.444s, 2035 | 766,519 | 129,020 |
| IFB Ser. 06-128, Class GS, IO, 6.434s, 2037 | 1,464,676 | 159,017 |
| IFB Ser. 05-73, Class SD, IO, 6.434s, 2035 | 316,864 | 43,640 |
| IFB Ser. 06-115, Class IE, IO, 6.394s, 2036 | 1,300,464 | 160,708 |
32
| | |
| MORTGAGE-BACKED SECURITIES (28.3%)* cont. | Principal amount | Value |
|
| Fannie Mae | | |
| IFB Ser. 05-51, Class WS, IO, 6.384s, 2035 | $95,400 | $14,404 |
| IFB Ser. 06-109, Class SH, IO, 6.374s, 2036 | 1,880,336 | 236,392 |
| IFB Ser. 06-104, Class IC, IO, 6.354s, 2036 | 1,713,701 | 244,151 |
| IFB Ser. 06-103, Class SB, IO, 6.354s, 2036 | 3,306,268 | 337,087 |
| IFB Ser. 06-36, Class PS, IO, 6.354s, 2036 | 131,246 | 18,621 |
| IFB Ser. 06-8, Class JH, IO, 6.354s, 2036 | 6,304,397 | 912,877 |
| IFB Ser. 09-12, Class CI, IO, 6.354s, 2036 | 912,741 | 129,016 |
| IFB Ser. 05-122, Class SG, IO, 6.354s, 2035 | 1,146,682 | 152,509 |
| IFB Ser. 05-122, Class SW, IO, 6.354s, 2035 | 1,695,789 | 228,321 |
| IFB Ser. 06-92, Class JI, IO, 6.334s, 2036 | 878,138 | 114,653 |
| IFB Ser. 06-17, Class SI, IO, 6.334s, 2036 | 4,849,866 | 640,134 |
| IFB Ser. 06-60, Class YI, IO, 6.324s, 2036 | 3,824,149 | 604,483 |
| IFB Ser. 06-86, Class SB, IO, 6.304s, 2036 | 3,382,433 | 489,032 |
| IFB Ser. 07-92, Class KS, IO, 6.254s, 2037 | 13,779,650 | 1,761,663 |
| IFB Ser. 09-12, Class AI, IO, 6.254s, 2037 | 6,133,418 | 831,446 |
| IFB Ser. 07-15, Class NI, IO, 6.254s, 2022 | 2,077,301 | 228,093 |
| IFB Ser. 09-70, Class SI, IO, 6.204s, 2036 | 10,092,315 | 1,019,627 |
| IFB Ser. 07-30, Class LI, IO, 6.194s, 2037 | 2,614,573 | 337,803 |
| IFB Ser. 07-30, Class OI, IO, 6.194s, 2037 | 6,122,273 | 855,526 |
| IFB Ser. 07-89, Class SA, IO, 6.184s, 2037 | 5,701,860 | 701,899 |
| IFB Ser. 07-54, Class IA, IO, 6.164s, 2037 | 1,953,133 | 198,493 |
| IFB Ser. 07-54, Class IB, IO, 6.164s, 2037 | 1,953,133 | 198,493 |
| IFB Ser. 07-54, Class IC, IO, 6.164s, 2037 | 1,953,133 | 198,493 |
| IFB Ser. 07-54, Class ID, IO, 6.164s, 2037 | 1,953,133 | 198,493 |
| IFB Ser. 07-54, Class IF, IO, 6.164s, 2037 | 2,903,040 | 374,028 |
| IFB Ser. 07-54, Class UI, IO, 6.164s, 2037 | 2,155,727 | 292,187 |
| IFB Ser. 07-15, Class CI, IO, 6.134s, 2037 | 6,526,006 | 842,051 |
| IFB Ser. 06-115, Class JI, IO, 6.134s, 2036 | 4,647,228 | 619,104 |
| IFB Ser. 09-43, Class SB, IO, 6.084s, 2039 | 359,059 | 40,933 |
| IFB Ser. 06-123, Class LI, IO, 6.074s, 2037 | 3,143,882 | 401,474 |
| IFB Ser. 10-2, Class SD, IO, 6.054s, 2040 | 335,749 | 39,391 |
| IFB Ser. 07-81, Class IS, IO, 6.054s, 2037 | 2,400,142 | 294,377 |
| IFB Ser. 08-11, Class SC, IO, 6.034s, 2038 F | 442,179 | 57,477 |
| IFB Ser. 10-2, Class MS, IO, 6.004s, 2050 | 4,164,486 | 453,504 |
| IFB Ser. 09-87, Class HS, IO, 5.904s, 2039 | 36,754,707 | 3,710,429 |
| IFB Ser. 09-91, Class S, IO, 5.904s, 2039 | 459,149 | 42,758 |
| IFB Ser. 07-39, Class AI, IO, 5.874s, 2037 | 3,321,931 | 386,673 |
| IFB Ser. 07-32, Class SD, IO, 5.864s, 2037 | 2,343,871 | 269,167 |
| IFB Ser. 07-30, Class UI, IO, 5.854s, 2037 | 1,934,001 | 227,382 |
| IFB Ser. 07-32, Class SC, IO, 5.854s, 2037 | 3,110,110 | 297,547 |
| IFB Ser. 07-1, Class CI, IO, 5.854s, 2037 | 2,173,685 | 213,141 |
| IFB Ser. 05-74, Class NI, IO, 5.834s, 2035 | 11,965,691 | 1,347,181 |
| IFB Ser. 07-3, Class SH, IO, 5.824s, 2037 | 4,074,478 | 414,944 |
| IFB Ser. 09-12, Class DI, IO, 5.784s, 2037 | 666,170 | 84,903 |
| Ser. 06-W2, Class 1AS, IO, 5.759s, 2036 | 3,465,029 | 406,317 |
| IFB Ser. 07-75, Class ID, IO, 5.624s, 2037 | 1,707,974 | 152,703 |
| Ser. 07-W1, Class 1AS, IO, 5.502s, 2046 | 11,745,914 | 1,256,458 |
| Ser. 383, Class 18, IO, 5 1/2s, 2038 | 717,506 | 125,172 |
| Ser. 383, Class 19, IO, 5 1/2s, 2038 | 652,175 | 113,772 |
| Ser. 383, Class 6, IO, 5 1/2s, 2037 | 549,022 | 91,621 |
| Ser. 383, Class 7, IO, 5 1/2s, 2037 | 541,601 | 93,458 |
33
| | |
| MORTGAGE-BACKED SECURITIES (28.3%)* cont. | Principal amount | Value |
|
| Fannie Mae | | |
| Ser. 383, Class 20, IO, 5 1/2s, 2037 | $417,719 | $73,196 |
| Ser. 356, Class 14, IO, 5 1/2s, 2035 | 6,567,492 | 1,215,345 |
| Ser. 348, Class 7, IO, 5 1/2s, 2033 | 6,350,212 | 1,235,067 |
| Ser. 334, Class 5, IO, 5 1/2s, 2033 | 6,046,470 | 1,184,321 |
| IFB Ser. 09-3, Class SE, IO, 5.254s, 2037 | 2,303,491 | 234,611 |
| Ser. 385, Class 3, IO, 5s, 2038 | 1,418,223 | 226,589 |
| Ser. 359, Class 7, IO, 5s, 2036 | 12,372,190 | 2,205,150 |
| Ser. 339, Class 1, IO, 5s, 2033 | 14,077,276 | 2,609,364 |
| FRB Ser. 04-W2, Class 4A, 4.758s, 2044 | 44,524 | 44,594 |
| FRB Ser. 03-W14, Class 2A, 4.746s, 2043 | 44,460 | 44,278 |
| FRB Ser. 03-W8, Class 4A, 4.617s, 2042 | 143,835 | 143,169 |
| FRB Ser. 03-W3, Class 1A4, 4.596s, 2042 | 69,753 | 69,632 |
| FRB Ser. 02-T19, Class A4, 4.576s, 2042 | 145,987 | 146,838 |
| FRB Ser. 04-W15, Class 3A, 4.565s, 2044 | 62,777 | 62,620 |
| FRB Ser. 05-W4, Class 3A, 4.358s, 2035 | 47,549 | 47,302 |
| FRB Ser. 04-T1, Class 2A, 4.255s, 2043 | 125,360 | 122,570 |
| FRB Ser. 04-W7, Class A2, 4.052s, 2034 | 20,915 | 21,637 |
| FRB Ser. 03-W11, Class A1, 3.91s, 2033 | 4,334 | 4,393 |
| Ser. 03-W12, Class 2, IO, 2.221s, 2043 | 20,903,476 | 1,729,042 |
| Ser. 03-W12, Class 1IO2, IO, 1.984s, 2043 | 14,828,778 | 1,120,013 |
| Ser. 98-W2, Class X, IO, 1.325s, 2028 | 7,329,317 | 365,269 |
| Ser. 98-W5, Class X, IO, 1.131s, 2028 | 3,080,301 | 145,167 |
| FRB Ser. 05-115, Class DF, 1.129s, 2033 | 133,357 | 132,529 |
| Ser. 06-26, Class NB, 1s, 2036 | 775,037 | 691,467 |
| FRB Ser. 07-80, Class F, 0.946s, 2037 | 1,230,470 | 1,184,320 |
| FRB Ser. 06-3, Class FY, 0.746s, 2036 | 432,880 | 426,183 |
| FRB Ser. 07-95, Class A3, 0.496s, 2036 | 13,676,000 | 12,385,396 |
| Ser. 03-W1, Class 2A, IO, 0.052s, 2042 | 10,857,166 | 19,935 |
| Ser. 08-65, Class TF, zero %, 2038 | 767,907 | 713,793 |
| Ser. 08-53, Class DO, PO, zero %, 2038 | 747,131 | 423,414 |
| Ser. 07-64, Class LO, PO, zero %, 2037 | 96,232 | 92,323 |
| Ser. 07-44, Class CO, PO, zero %, 2037 | 1,039,974 | 900,867 |
| Ser. 07-14, Class KO, PO, zero %, 2037 | 89,680 | 75,828 |
| Ser. 06-125, Class OX, PO, zero %, 2037 | 55,041 | 45,247 |
| Ser. 06-84, Class OT, PO, zero %, 2036 | 48,834 | 42,633 |
| Ser. 06-56, Class XF, zero %, 2036 | 177,448 | 137,354 |
| Ser. 06-45, Class MO, PO, zero %, 2036 | 64,506 | 61,514 |
| Ser. 06-45, Class OW, PO, zero %, 2036 | 63,888 | 63,671 |
| Ser. 06-46, Class OC, PO, zero %, 2036 | 53,391 | 41,682 |
| Ser. 06-48, Class LO, PO, zero %, 2036 | 40,324 | 39,585 |
| Ser. 06-53, PO, zero %, 2036 | 97,804 | 97,742 |
| Ser. 06-62, Class KO, PO, zero %, 2036 | 53,411 | 33,569 |
| Ser. 08-36, Class OV, PO, zero %, 2036 | 181,152 | 138,005 |
| Ser. 05-108, PO, zero %, 2035 | 97,837 | 91,351 |
| Ser. 05-63, PO, zero %, 2035 | 18,219 | 18,206 |
| Ser. 05-50, Class LO, PO, zero %, 2035 | 52,886 | 45,450 |
| Ser. 07-94, Class KO, PO, zero %, 2034 | 18,717 | 18,699 |
| Ser. 04-61, PO, zero %, 2034 | 82,307 | 76,134 |
| Ser. 03-23, Class QO, PO, zero %, 2032 | 128,933 | 117,141 |
| Ser. 04-61, Class CO, PO, zero %, 2031 | 1,625,670 | 1,562,670 |
| Ser. 1988-12, Class B, zero %, 2018 | 19,474 | 17,313 |
34
| | |
| MORTGAGE-BACKED SECURITIES (28.3%)* cont. | Principal amount | Value |
|
| Fannie Mae | | |
| FRB Ser. 07-76, Class SF, zero %, 2037 | $51,538 | $51,115 |
| FRB Ser. 06-115, Class SN, zero %, 2036 | 995,113 | 953,545 |
| FRB Ser. 06-104, Class EK, zero %, 2036 | 51,081 | 48,042 |
| FRB Ser. 06-14, Class DF, zero %, 2036 | 37,266 | 35,747 |
| FRB Ser. 05-117, Class GF, zero %, 2036 | 163,651 | 162,628 |
| FRB Ser. 05-79, Class FE, zero %, 2035 | 128,411 | 126,058 |
| FRB Ser. 05-57, Class UL, zero %, 2035 | 17,480 | 17,322 |
| FRB Ser. 05-45, Class FG, zero %, 2035 | 578,838 | 483,521 |
| FRB Ser. 05-36, Class QA, zero %, 2035 | 16,268 | 13,116 |
| FRB Ser. 06-9, Class FG, zero %, 2033 | 255,586 | 185,633 |
| FRB Ser. 06-1, Class HF, zero %, 2032 | 122,265 | 105,274 |
| IFB Ser. 06-75, Class FY, zero %, 2036 | 216,542 | 213,473 |
|
| Federal Home Loan Mortgage Corp. Structured | | |
| Pass-Through Securities | | |
| Ser. T-42, Class A6, 9 1/2s, 2042 | 35,952 | 40,615 |
| IFB Ser. T-56, Class 2ASI, IO, 7.854s, 2043 | 978,210 | 164,346 |
| Ser. T-60, Class 1A3, 7 1/2s, 2044 | 6,072 | 6,846 |
| Ser. T-59, Class 1A3, 7 1/2s, 2043 | 2,662 | 3,013 |
| Ser. T-57, Class 1A3, 7 1/2s, 2043 | 4,884 | 5,489 |
| Ser. T-51, Class 2A, 7 1/2s, 2042 | 212,819 | 238,889 |
| Ser. T-41, Class 3A, 7 1/2s, 2032 | 4,424 | 4,965 |
| Ser. T-55, Class 1A2, 7s, 2043 | 1,742,113 | 1,928,290 |
| FRB Ser. T-57, Class 2A1, 4.767s, 2043 | 42,805 | 42,557 |
| FRB Ser. T-59, Class 2A1, 4.534s, 2043 | 20,445 | 20,354 |
| Ser. T-8, Class A9, IO, 0.484s, 2028 | 4,339,731 | 68,810 |
| Ser. T-59, Class 1AX, IO, 0.27s, 2043 | 9,222,749 | 92,963 |
| Ser. T-48, Class A2, IO, 0.212s, 2033 | 12,590,200 | 99,807 |
| FRB Ser. T-54, Class 2A, IO, 0.039s, 2043 | 5,221,777 | 15,963 |
|
| Freddie Mac | | |
| IFB Ser. 3408, Class EK, 24.868s, 2037 | 1,005,446 | 1,365,208 |
| IFB Ser. 2976, Class LC, 23.577s, 2035 | 5,041,833 | 7,102,625 |
| IFB Ser. 2976, Class KL, 23.54s, 2035 | 1,162,610 | 1,591,729 |
| IFB Ser. 2979, Class AS, 23.43s, 2034 | 473,476 | 627,161 |
| IFB Ser. 3065, Class DC, 19.17s, 2035 | 5,685,643 | 7,230,546 |
| IFB Ser. 3105, Class SI, IO, 19.03s, 2036 | 1,816,067 | 880,974 |
| IFB Ser. 3012, Class UP, 18.57s, 2035 | 52,046 | 62,025 |
| IFB Ser. 3031, Class BS, 16.15s, 2035 | 2,096,803 | 2,557,837 |
| IFB Ser. 3489, Class SD, IO, 7.57s, 2032 | 1,994,960 | 338,824 |
| IFB Ser. 3184, Class SP, IO, 7.12s, 2033 | 1,970,473 | 201,041 |
| IFB Ser. 3110, Class SP, IO, 7.07s, 2035 | 4,223,171 | 736,352 |
| IFB Ser. 3156, Class PS, IO, 7.02s, 2036 | 2,320,982 | 395,170 |
| IFB Ser. 3149, Class LS, IO, 6.97s, 2036 | 5,927,790 | 1,065,283 |
| IFB Ser. 3119, Class PI, IO, 6.97s, 2036 | 1,826,394 | 327,308 |
| IFB Ser. 2882, Class NS, IO, 6.97s, 2034 | 1,603,296 | 222,473 |
| IFB Ser. 3149, Class SE, IO, 6.92s, 2036 | 1,729,720 | 308,357 |
| IFB Ser. 3151, Class SI, IO, 6.92s, 2036 | 9,612,373 | 1,680,448 |
| IFB Ser. 3157, Class SA, IO, 6.92s, 2036 | 5,235,265 | 927,951 |
| IFB Ser. 2779, Class YS, IO, 6.92s, 2033 | 163,724 | 22,661 |
| IFB Ser. 2752, Class XS, IO, 6.92s, 2030 | 21,462,547 | 2,167,503 |
35
| | |
| MORTGAGE-BACKED SECURITIES (28.3%)* cont. | Principal amount | Value |
|
| Freddie Mac | | |
| IFB Ser. 3203, Class SH, IO, 6.91s, 2036 | $1,154,041 | $143,807 |
| IFB Ser. 2835, Class AI, IO, 6.87s, 2034 | 1,204,280 | 202,777 |
| IFB Ser. 2594, Class SE, IO, 6.82s, 2030 | 1,942,804 | 188,085 |
| IFB Ser. 2828, Class TI, IO, 6.82s, 2030 | 1,255,152 | 165,022 |
| IFB Ser. 3410, Class SD, IO, 6.77s, 2038 | 8,720,986 | 1,242,741 |
| IFB Ser. 3249, Class SI, IO, 6.52s, 2036 | 968,762 | 136,677 |
| IFB Ser. 3028, Class ES, IO, 6.52s, 2035 | 4,232,967 | 596,328 |
| IFB Ser. 3042, Class SP, IO, 6.52s, 2035 | 1,525,091 | 219,411 |
| IFB Ser. 3316, Class SA, IO, 6 1/2s, 2037 | 1,268,669 | 174,367 |
| IFB Ser. 2981, Class AS, IO, 6.49s, 2035 | 1,604,109 | 215,881 |
| IFB Ser. 3287, Class SE, IO, 6.47s, 2037 F | 5,191,814 | 777,941 |
| IFB Ser. 3122, Class DS, IO, 6.47s, 2036 | 1,737,074 | 209,409 |
| IFB Ser. 3123, Class LI, IO, 6.47s, 2036 | 2,646,059 | 420,565 |
| IFB Ser. 2935, Class SX, IO, 6.47s, 2035 | 15,943,432 | 1,848,481 |
| IFB Ser. 2950, Class SM, IO, 6.47s, 2016 | 779,707 | 98,671 |
| IFB Ser. 3256, Class S, IO, 6.46s, 2036 | 2,124,642 | 287,238 |
| IFB Ser. 3031, Class BI, IO, 6.46s, 2035 | 1,464,159 | 246,980 |
| IFB Ser. 3249, Class SM, IO, 6.42s, 2036 | 3,693,521 | 542,578 |
| IFB Ser. 3240, Class SM, IO, 6.42s, 2036 | 3,625,252 | 500,829 |
| IFB Ser. 3147, Class SD, IO, 6.42s, 2036 | 6,133,379 | 768,243 |
| IFB Ser. 3398, Class SI, IO, 6.42s, 2036 | 6,140,957 | 805,878 |
| IFB Ser. 3067, Class SI, IO, 6.42s, 2035 | 6,887,476 | 1,065,699 |
| IFB Ser. 3128, Class JI, IO, 6.4s, 2036 | 4,429,405 | 610,902 |
| IFB Ser. 3240, Class S, IO, 6.39s, 2036 | 4,930,003 | 702,772 |
| IFB Ser. 3065, Class DI, IO, 6.39s, 2035 | 1,117,295 | 169,864 |
| IFB Ser. 3210, Class SA, IO, 6.37s, 2036 | 21,215,561 | 2,511,710 |
| IFB Ser. 3145, Class GI, IO, 6.37s, 2036 | 3,843,149 | 550,763 |
| IFB Ser. 3114, Class GI, IO, 6.37s, 2036 | 1,571,151 | 229,567 |
| IFB Ser. 3114, Class IP, IO, 6.37s, 2036 | 1,771,505 | 246,771 |
| IFB Ser. 3510, Class IB, IO, 6.37s, 2036 | 2,613,438 | 426,409 |
| IFB Ser. 3206, Class ES, IO, 6.32s, 2036 | 9,383,443 | 1,115,504 |
| IFB Ser. 3485, Class SI, IO, 6.32s, 2036 | 7,785,062 | 1,185,743 |
| IFB Ser. 3153, Class QI, IO, 6.32s, 2036 | 6,306,717 | 1,008,129 |
| IFB Ser. 3349, Class AS, IO, 6.27s, 2037 | 5,377,960 | 744,363 |
| IFB Ser. 3510, Class IA, IO, 6.27s, 2037 | 1,692,792 | 223,465 |
| IFB Ser. 3171, Class PS, IO, 6.255s, 2036 | 424,590 | 53,027 |
| IFB Ser. 3171, Class ST, IO, 6.255s, 2036 | 4,551,066 | 577,530 |
| IFB Ser. 3510, Class CI, IO, 6 1/4s, 2037 | 5,431,376 | 742,904 |
| IFB Ser. 3152, Class SY, IO, 6 1/4s, 2036 | 2,840,688 | 423,831 |
| IFB Ser. 3510, Class DI, IO, 6 1/4s, 2035 | 4,208,393 | 598,307 |
| IFB Ser. 3181, Class PS, IO, 6.24s, 2036 | 1,451,742 | 207,527 |
| IFB Ser. 3199, Class S, IO, 6.22s, 2036 | 1,173,858 | 163,178 |
| IFB Ser. 3284, Class LI, IO, 6.21s, 2037 | 3,356,270 | 457,661 |
| IFB Ser. 3281, Class AI, IO, 6.2s, 2037 | 4,817,848 | 656,384 |
| IFB Ser. 3012, Class UI, IO, 6.19s, 2035 | 2,456,795 | 334,746 |
| IFB Ser. 3311, Class IA, IO, 6.18s, 2037 | 2,618,016 | 355,343 |
| IFB Ser. 3311, Class IB, IO, 6.18s, 2037 | 2,618,016 | 355,343 |
| IFB Ser. 3311, Class IC, IO, 6.18s, 2037 | 2,618,016 | 355,343 |
| IFB Ser. 3311, Class ID, IO, 6.18s, 2037 | 2,618,016 | 355,343 |
| IFB Ser. 3311, Class IE, IO, 6.18s, 2037 | 3,706,442 | 503,075 |
36
| | |
| MORTGAGE-BACKED SECURITIES (28.3%)* cont. | Principal amount | Value |
|
| Freddie Mac | | |
| IFB Ser. 3510, Class AS, IO, 6.18s, 2037 | $1,950,455 | $279,442 |
| IFB Ser. 3265, Class SC, IO, 6.18s, 2037 | 3,863,751 | 503,331 |
| IFB Ser. 3240, Class GS, IO, 6.15s, 2036 | 3,125,541 | 416,010 |
| IFB Ser. 3598, Class SA, IO, 6.12s, 2039 | 4,590,604 | 615,600 |
| IFB Ser. 3621, Class CS, IO, 6.12s, 2037 | 4,074,173 | 444,872 |
| IFB Ser. 3257, Class SI, IO, 6.09s, 2036 | 1,347,275 | 162,129 |
| IFB Ser. 3242, Class SD, IO, 6.06s, 2036 | 40,874,435 | 4,721,815 |
| IFB Ser. 3225, Class EY, IO, 6.06s, 2036 | 9,195,102 | 1,168,238 |
| IFB Ser. 3225, Class JY, IO, 6.06s, 2036 | 5,813,893 | 764,701 |
| IFB Ser. 3502, Class DS, IO, 5.92s, 2039 | 3,487,929 | 395,209 |
| IFB Ser. 3339, Class TI, IO, 5.91s, 2037 | 2,459,305 | 306,306 |
| IFB Ser. 3284, Class CI, IO, 5.89s, 2037 | 4,818,008 | 603,745 |
| IFB Ser. 3476, Class S, IO, 5.87s, 2038 | 50,914,503 | 4,751,851 |
| IFB Ser. 3510, Class IC, IO, 5.85s, 2037 | 4,245,136 | 529,920 |
| IFB Ser. 3012, Class IG, IO, 5.85s, 2035 | 9,560,954 | 1,119,110 |
| IFB Ser. 3309, Class SG, IO, 5.84s, 2037 | 5,248,095 | 586,212 |
| IFB Ser. 2965, Class SA, IO, 5.82s, 2032 | 1,649,525 | 203,700 |
| IFB Ser. 3510, Class BI, IO, 5.8s, 2037 | 3,938,917 | 503,945 |
| IFB Ser. 3423, Class SG, IO, 5.42s, 2038 | 17,774,260 | 1,511,523 |
| IFB Ser. 3607, Class SA, IO, 5.021s, 2036 | 66,313,612 | 9,166,531 |
| FRB Ser. 2634, Class LF, 1.529s, 2033 | 129,540 | 129,058 |
| FRB Ser. 3190, Class FL, 1.03s, 2032 | 472,084 | 463,584 |
| FRB Ser. 3035, Class NF, 0.929s, 2035 | 151,427 | 150,074 |
| FRB Ser. 3350, Class FK, 0.83s, 2037 | 364,292 | 356,313 |
| FRB Ser. 3006, Class FA, 0.63s, 2034 | 194,032 | 193,831 |
| Ser. 3369, Class BO, PO, zero %, 2037 | 58,827 | 48,118 |
| Ser. 3327, Class IF, IO, zero %, 2037 | 320,051 | 9,369 |
| Ser. 3331, Class GO, PO, zero %, 2037 | 155,035 | 148,284 |
| Ser. 3374, Class DO, PO, zero %, 2037 | 54,323 | 53,965 |
| Ser. 3316, Class GO, PO, zero %, 2037 | 18,851 | 18,662 |
| Ser. 3324, PO, zero %, 2037 F | 4,983 | 4,982 |
| Ser. 3439, Class AO, PO, zero %, 2037 | 499,946 | 376,699 |
| Ser. 3391, PO, zero %, 2037 | 115,958 | 94,764 |
| Ser. 3289, Class SI, IO, zero %, 2037 | 252,596 | 61,388 |
| Ser. 3300, PO, zero %, 2037 | 870,263 | 727,455 |
| Ser. 3245, Class OC, PO, zero %, 2036 | 106,892 | 90,436 |
| Ser. 3314, PO, zero %, 2036 | 391,815 | 340,526 |
| Ser. 3206, Class EO, PO, zero %, 2036 | 48,160 | 40,184 |
| Ser. 3174, PO, zero %, 2036 | 65,724 | 62,734 |
| Ser. 3175, Class MO, PO, zero %, 2036 | 441,805 | 357,717 |
| Ser. 3157, Class GO, PO, zero %, 2036 | 39,039 | 38,984 |
| Ser. 3210, PO, zero %, 2036 | 52,910 | 43,945 |
| Ser. 3142, PO, zero %, 2036 | 18,311 | 18,285 |
| Ser. 3145, Class GK, PO, zero %, 2036 | 162,742 | 141,679 |
| Ser. 3607, Class AO, PO, zero %, 2036 | 18,946,462 | 11,286,028 |
| Ser. 3124, Class DO, PO, zero %, 2036 | 145,470 | 132,872 |
| Ser. 3106, PO, zero %, 2036 | 65,556 | 64,974 |
| Ser. 3081, Class HO, PO, zero %, 2035 | 29,958 | 29,753 |
| Ser. 3084, Class ON, PO, zero %, 2035 | 61,685 | 60,220 |
| Ser. 3089, Class QO, PO, zero %, 2035 | 123,521 | 112,877 |
37
| | |
| MORTGAGE-BACKED SECURITIES (28.3%)* cont. | Principal amount | Value |
|
| Freddie Mac | | |
| Ser. 3067, PO, zero %, 2035 | $108,255 | $89,953 |
| Ser. 3075, PO, zero %, 2035 | 207,141 | 154,552 |
| Ser. 3046, PO, zero %, 2035 | 392,325 | 348,876 |
| Ser. 3155, Class AO, PO, zero %, 2035 | 107,395 | 96,046 |
| Ser. 2984, Class BO, PO, zero %, 2035 | 72,372 | 69,880 |
| Ser. 2989, Class WO, PO, zero %, 2035 | 19,717 | 19,388 |
| Ser. 2975, Class QO, PO, zero %, 2035 | 11,720 | 10,845 |
| Ser. 2981, Class CO, PO, zero %, 2035 | 29,439 | 29,256 |
| Ser. 2947, Class AO, PO, zero %, 2035 | 42,868 | 30,657 |
| Ser. 2951, Class JO, PO, zero %, 2035 | 19,017 | 14,212 |
| Ser. 2985, Class CO, PO, zero %, 2035 | 118,874 | 103,925 |
| Ser. 3055, Class CO, PO, zero %, 2035 | 22,454 | 21,398 |
| Ser. 3008, PO, zero %, 2034 | 217,798 | 192,102 |
| Ser. 2824, Class CO, PO, zero %, 2034 | 49,882 | 49,862 |
| Ser. 2684, Class TO, PO, zero %, 2033 | 1,178,000 | 684,477 |
| Ser. 2692, Class TO, PO, zero %, 2033 | 132,963 | 90,655 |
| Ser. 2684, PO, zero %, 2033 | 645,000 | 530,506 |
| Ser. 2777, Class OE, PO, zero %, 2032 | 225,000 | 192,523 |
| Ser. 2587, Class CO, PO, zero %, 2032 | 150,229 | 140,228 |
| FRB Ser. 3349, Class DO, zero %, 2037 | 79,433 | 78,191 |
| FRB Ser. 3299, Class FD, zero %, 2037 | 141,640 | 136,382 |
| FRB Ser. 3304, Class UF, zero %, 2037 | 415,000 | 335,626 |
| FRB Ser. 3326, Class XF, zero %, 2037 | 76,650 | 74,045 |
| FRB Ser. 3274, Class TX, zero %, 2037 | 523,225 | 477,773 |
| FRB Ser. 3326, Class YF, zero %, 2037 | 507,360 | 490,628 |
| FRB Ser. 3261, Class KF, zero %, 2037 | 389,199 | 381,415 |
| FRB Ser. 3263, Class TA, zero %, 2037 | 141,661 | 136,699 |
| FRB Ser. 3238, Class LK, zero %, 2036 | 939,668 | 894,151 |
| FRB Ser. 3231, Class X, zero %, 2036 | 61,424 | 60,673 |
| FRB Ser. 3140, Class KF, zero %, 2036 F | 1,585 | 1,578 |
| FRB Ser. 3147, Class SF, zero %, 2036 | 79,349 | 70,265 |
| FRB Ser. 3129, Class TF, zero %, 2036 | 531,318 | 489,148 |
| FRB Ser. 3117, Class AF, zero %, 2036 | 87,552 | 75,486 |
| FRB Ser. 3072, Class TJ, zero %, 2035 | 47,509 | 31,814 |
| FRB Ser. 3092, Class FA, zero %, 2035 | 154,294 | 143,966 |
| FRB Ser. 3047, Class BD, zero %, 2035 | 195,073 | 155,594 |
| FRB Ser. 3052, Class TJ, zero %, 2035 | 25,027 | 21,268 |
| FRB Ser. 3326, Class WF, zero %, 2035 | 1,455,999 | 1,359,926 |
| FRB Ser. 3030, Class CF, zero %, 2035 | 488,714 | 336,254 |
| FRB Ser. 3033, Class YF, zero %, 2035 | 204,995 | 184,145 |
| FRB Ser. 3036, Class AS, zero %, 2035 | 111,429 | 79,111 |
| FRB Ser. 3025, Class XA, zero %, 2035 | 250,651 | 186,891 |
| FRB Ser. 3251, Class TP, zero %, 2035 | 166,783 | 138,942 |
| FRB Ser. 3263, Class AE, zero %, 2035 | 95,489 | 92,666 |
| FRB Ser. 3003, Class XF, zero %, 2035 | 90,728 | 84,753 |
| FRB Ser. 2984, Class FL, zero %, 2035 | 102,442 | 74,939 |
| FRB Ser. 3127, Class TO, zero %, 2035 | 4,003 | 3,990 |
| FRB Ser. 2958, Class TP, zero %, 2035 | 20,188 | 19,099 |
| FRB Ser. 2963, Class TW, zero %, 2035 | 81,258 | 79,412 |
| FRB Ser. 2958, Class FB, zero %, 2035 | 36,749 | 35,382 |
38
| | |
| MORTGAGE-BACKED SECURITIES (28.3%)* cont.�� | Principal amount | Value |
|
| Freddie Mac | | |
| FRB Ser. 3069, Class KF, zero %, 2034 | $92,400 | $84,084 |
| FRB Ser. 2947, Class GF, zero %, 2034 | 187,153 | 167,094 |
| FRB Ser. 3025, Class FD, zero %, 2034 | 12,346 | 12,262 |
|
| Government National Mortgage Association | | |
| IFB Ser. 10-14, Class SA, IO, 7.76s, 2032 | 17,812,000 | 3,146,312 |
| IFB Ser. 08-47, Class S, IO, 7.47s, 2038 | 2,002,969 | 264,993 |
| IFB Ser. 09-79, Class AI, IO, 7.16s, 2039 | 35,483,377 | 4,207,974 |
| IFB Ser. 05-68, Class SN, IO, 6.97s, 2034 | 546,204 | 68,663 |
| IFB Ser. 04-96, Class KS, IO, 6.76s, 2034 | 271,074 | 41,610 |
| IFB Ser. 06-16, Class GS, IO, 6 3/4s, 2036 | 214,408 | 28,214 |
| IFB Ser. 10-14, Class SD, IO, 6.74s, 2036 | 17,372,390 | 1,592,527 |
| IFB Ser. 04-5, Class PS, IO, 6.71s, 2033 | 3,686,000 | 593,999 |
| IFB Ser. 09-106, Class XN, IO, 6.66s, 2035 | 13,072,742 | 798,875 |
| IFB Ser. 09-87, Class IW, IO, 6.61s, 2034 | 210,831 | 32,350 |
| IFB Ser. 07-26, Class SL, IO, 6.57s, 2037 | 19,034,963 | 2,749,029 |
| IFB Ser. 07-26, Class SM, IO, 6.57s, 2037 | 15,677,663 | 2,190,797 |
| IFB Ser. 07-26, Class SN, IO, 6.57s, 2037 | 11,253,159 | 1,474,420 |
| IFB Ser. 06-47, Class SA, 6.57s, 2036 | 77,194,597 | 10,602,718 |
| IFB Ser. 07-22, Class S, IO, 6.56s, 2037 | 1,628,900 | 181,051 |
| IFB Ser. 10-14, Class SB, IO, 6.56s, 2035 | 7,376,531 | 1,040,017 |
| IFB Ser. 05-3, Class SC, IO, 6.52s, 2035 | 5,601,274 | 807,516 |
| IFB Ser. 09-61, Class ES, IO, 6.51s, 2039 | 70,967,663 | 7,343,024 |
| IFB Ser. 09-106, Class XL, IO, 6.51s, 2037 | 1,678,657 | 192,895 |
| IFB Ser. 04-104, Class IS, IO, 6.51s, 2034 | 354,279 | 43,916 |
| IFB Ser. 07-41, Class SL, IO, 6.46s, 2037 | 2,931,886 | 329,515 |
| IFB Ser. 07-37, Class SU, IO, 6.46s, 2037 | 523,901 | 70,465 |
| IFB Ser. 06-25, Class SI, IO, 6.46s, 2036 | 127,596 | 15,853 |
| IFB Ser. 07-37, Class YS, IO, 6.44s, 2037 | 502,855 | 64,013 |
| IFB Ser. 07-59, Class PS, IO, 6.43s, 2037 | 1,084,068 | 96,831 |
| IFB Ser. 07-68, Class PI, IO, 6.41s, 2037 | 746,843 | 64,472 |
| IFB Ser. 07-16, Class KU, IO, 6.41s, 2037 | 9,820,867 | 1,296,256 |
| IFB Ser. 07-16, Class PU, IO, 6.41s, 2037 | 10,869,730 | 1,395,673 |
| IFB Ser. 06-38, Class SG, IO, 6.41s, 2033 | 16,296,335 | 1,381,114 |
| IFB Ser. 10-14, Class SE, IO, 6.4s, 2033 | 12,039,224 | 1,158,173 |
| IFB Ser. 09-106, Class LP, IO, 6.37s, 2036 | 1,500,605 | 177,972 |
| IFB Ser. 09-106, Class CM, IO, 6.37s, 2034 | 106,751,662 | 13,939,632 |
| IFB Ser. 08-6, Class TI, IO, 6.37s, 2032 | 512,563 | 50,631 |
| IFB Ser. 09-87, Class SK, IO, 6.36s, 2032 | 3,308,703 | 356,943 |
| IFB Ser. 06-34, Class PS, IO, 6.35s, 2036 | 9,541,159 | 1,114,217 |
| IFB Ser. 07-17, Class AI, IO, 6.32s, 2037 | 5,506,220 | 763,272 |
| IFB Ser. 09-106, Class LS, IO, 6.26s, 2037 | 1,595,819 | 161,433 |
| IFB Ser. 10-14, Class KS, IO, 6.22s, 2040 | 26,926,841 | 3,625,968 |
| IFB Ser. 09-35, Class SP, IO, 6.17s, 2037 | 9,666,512 | 1,206,864 |
| IFB Ser. 05-65, Class SI, IO, 6.11s, 2035 | 9,418,151 | 1,078,567 |
| IFB Ser. 06-7, Class SB, IO, 6.08s, 2036 | 5,648,044 | 542,952 |
| IFB Ser. 08-47, IO, 6.02s, 2037 | 11,505,193 | 1,428,254 |
| IFB Ser. 07-17, Class IC, IO, 6.02s, 2037 | 1,551,619 | 209,825 |
| IFB Ser. 07-17, Class IB, IO, 6.01s, 2037 | 1,145,579 | 150,346 |
| IFB Ser. 09-106, Class SD, IO, 6.01s, 2036 | 13,290,564 | 1,491,201 |
| IFB Ser. 06-20, Class S, IO, 6.01s, 2036 | 7,415,813 | 693,193 |
39
| | |
| MORTGAGE-BACKED SECURITIES (28.3%)* cont. | Principal amount | Value |
|
| Government National Mortgage Association | | |
| IFB Ser. 07-25, Class KS, IO, 5.97s, 2037 | $589,488 | $55,318 |
| IFB Ser. 07-7, Class JI, IO, 5.96s, 2037 | 540,375 | 59,820 |
| IFB Ser. 05-35, Class SA, IO, 5.96s, 2035 | 141,261 | 15,943 |
| IFB Ser. 05-35, Class SB, IO, 5.96s, 2035 | 108,722 | 12,448 |
| IFB Ser. 07-31, Class AI, IO, 5.95s, 2037 | 1,676,519 | 209,950 |
| IFB Ser. 08-57, Class BI, IO, 5.93s, 2038 | 5,780,616 | 538,869 |
| IFB Ser. 07-43, Class SC, IO, 5.87s, 2037 | 1,487,733 | 170,585 |
| IFB Ser. 09-106, Class SL, IO, 5.86s, 2036 | 1,597,815 | 182,966 |
| IFB Ser. 04-83, Class CS, IO, 5.84s, 2034 | 843,745 | 99,081 |
| IFB Ser. 09-106, Class ST, IO, 5.76s, 2038 | 3,082,161 | 329,668 |
| IFB Ser. 10-14, Class SC, IO, 4.571s, 2035 | 26,925,584 | 3,385,084 |
| IFB Ser. 09-87, Class WT, IO, 0.186s, 2035 | 17,526,933 | 66,602 |
| IFB Ser. 09-106, Class WT, IO, 0.149s, 2037 | 9,023,880 | 33,479 |
| Ser. 08-31, Class TO, PO, zero %, 2038 | 12,667 | 12,530 |
| Ser. 06-36, Class OD, PO, zero %, 2036 | 86,098 | 75,565 |
| Ser. 06-64, PO, zero %, 2034 | 88,551 | 62,431 |
| FRB Ser. 07-73, Class KI, IO, zero %, 2037 | 7,804,956 | 111,587 |
| FRB Ser. 07-73, Class KM, zero %, 2037 | 780,675 | 729,744 |
| FRB Ser. 07-35, Class UF, zero %, 2037 | 99,056 | 97,044 |
| FRB Ser. 07-16, Class WF, zero %, 2037 | 150,794 | 145,579 |
| FRB Ser. 07-16, Class YF, zero %, 2037 | 41,700 | 36,997 |
|
| GSMPS Mortgage Loan Trust FRB Ser. 05-RP2, | | |
| Class 1AF, 0.596s, 2035 F | 21,113,984 | 17,313,365 |
|
| GSMPS Mortgage Loan Trust 144A | | |
| Ser. 05-RP1, Class 1AS, IO, 5.984s, 2035 | 6,008,642 | 743,609 |
| Ser. 05-RP2, Class 1AS, IO, 5.652s, 2035 | 20,737,310 | 2,475,371 |
| Ser. 06-RP2, Class 1AS1, IO, 5.564s, 2036 | 4,291,827 | 481,577 |
| Ser. 98-2, IO, 0.962s, 2027 | 1,247,435 | 31,643 |
| Ser. 98-3, IO, 0.667s, 2027 | 1,527,106 | 32,789 |
| FRB Ser. 06-RP2, Class 1AF1, 0.646s, 2036 F | 16,788,671 | 13,682,577 |
| FRB Ser. 05-RP3, Class 1AF, 0.596s, 2035 F | 301,067 | 239,435 |
| FRB Ser. 05-RP1, Class 1AF, 0.596s, 2035 F | 3,527,052 | 2,874,499 |
| Ser. 98-4, IO, 0.587s, 2026 | 1,568,853 | 51,636 |
| Ser. 99-2, IO, 0.321s, 2027 | 2,034,918 | 27,174 |
|
| MASTR Reperforming Loan Trust 144A | | |
| Ser. 05-1, Class 1A4, 7 1/2s, 2034 F | 112,335 | 106,775 |
| FRB Ser. 05-2, Class 1A1F, 0.596s, 2035 F | 2,077,329 | 1,692,996 |
|
| Nomura Asset Acceptance Corp. 144A | | |
| Ser. 04-R2, Class A2, 7s, 2034 F | 941,239 | 847,560 |
| IFB Ser. 04-R3, Class AS, IO, 6.804s, 2035 | 731,978 | 109,473 |
|
| Structured Adjustable Rate Mortgage Loan Trust 144A | | |
| Ser. 04-NP2, Class A, 0.579s, 2034 F | 77,546 | 64,359 |
|
| Structured Asset Securities Corp. Ser. 07-4, | | |
| Class 1A4, IO, 1s, 2037 | 42,652,043 | 1,491,940 |
|
| Structured Asset Securities Corp. 144A Ser. 07-RF1, | | |
| Class 1A, IO, 5.398s, 2037 | 6,667,902 | 676,334 |
|
| Total mortgage-backed securities (cost $324,838,243) | | $404,383,585 |
40
| | | |
| PURCHASED OPTIONS | Expiration date/ | Contract | |
| OUTSTANDING (1.2%)* | strike price | amount | Value |
|
| Option on an interest rate swap with Barclays | | | |
| Bank PLC for the right to receive a fixed rate | | | |
| of 3.95% versus the three month USD-LIBOR-BBA | | | |
| maturing September 21, 2020. | Sep-10/3.95 | $41,640,800 | $778,267 |
|
| Option on an interest rate swap with Barclays | | | |
| Bank PLC for the right to pay a fixed rate | | | |
| of 3.95% versus the three month USD-LIBOR-BBA | | | |
| maturing September 21, 2020. | Sep-10/3.95 | 41,640,800 | 1,178,018 |
|
| Option on an interest rate swap with Barclays | | | |
| Bank PLC for the right to receive a fixed rate | | | |
| of 3.7375% versus the three month USD-LIBOR-BBA | | | |
| maturing March 9, 2021. | Mar-11/3.738 | 74,935,600 | 1,102,303 |
|
| Option on an interest rate swap with Barclays | | | |
| Bank PLC for the right to receive a fixed rate | | | |
| of 3.7375% versus the three month USD-LIBOR-BBA | | | |
| maturing March 9, 2021. | Mar-11/3.738 | 74,935,600 | 964,421 |
|
| Option on an interest rate swap with Barclays | | | |
| Bank PLC for the right to pay a fixed rate | | | |
| of 3.95% versus the three month USD-LIBOR-BBA | | | |
| maturing May 13, 2020. | May-10/3.95 | 60,054,900 | 484,643 |
|
| Option on an interest rate swap with Barclays | | | |
| Bank PLC for the right to receive a fixed rate | | | |
| of 3.95% versus the three month USD-LIBOR-BBA | | | |
| maturing May 13, 2020. | May-10/3.95 | 60,054,900 | 891,815 |
|
| Option on an interest rate swap with JPMorgan | | | |
| Chase Bank, N.A. for the obligation to receive a | | | |
| fixed rate of 3.885% versus the three month | | | |
| USD-LIBOR-BBA maturing May 12, 2020. | May-10/3.885 | 105,679,300 | 1,076,872 |
|
| Option on an interest rate swap with JPMorgan | | | |
| Chase Bank, N.A. for the right to receive a | | | |
| fixed rate of 3.885% versus the three month | | | |
| USD-LIBOR-BBA maturing May 19, 2020. | May-10/3.885 | 26,419,900 | 318,360 |
|
| Option on an interest rate swap with JPMorgan | | | |
| Chase Bank, N.A. for the right to pay a fixed | | | |
| rate of 3.885% versus the three month | | | |
| USD-LIBOR-BBA maturing May 19, 2020. | May-10/3.885 | 26,419,900 | 305,150 |
|
| Option on an interest rate swap with JPMorgan | | | |
| Chase Bank, N.A. for the right to receive a | | | |
| fixed rate of 3.885% versus the three month | | | |
| USD-LIBOR-BBA maturing May 12, 2020. | May-10/3.885 | 105,679,300 | 1,223,766 |
|
| Option on an interest rate swap with JPMorgan | | | |
| Chase Bank, N.A. for the right to pay a fixed | | | |
| rate of 3.885% versus the three month | | | |
| USD-LIBOR-BBA maturing May 26, 2020. | May-10/3.885 | 26,419,900 | 339,760 |
|
| Option on an interest rate swap with JPMorgan | | | |
| Chase Bank, N.A. for the right to receive a | | | |
| fixed rate of 3.885% versus the three month | | | |
| USD-LIBOR-BBA maturing May 26, 2020. | May-10/3.885 | 26,419,900 | 329,456 |
|
| Option on an interest rate swap with JPMorgan | | | |
| Chase Bank, N.A. for the right to receive a | | | |
| fixed rate of 3.965% versus the three month | | | |
| USD-LIBOR-BBA maturing September 20, 2020. | Sep-10/3.965 | 23,107,800 | 444,363 |
|
41
| | | |
| PURCHASED OPTIONS | Expiration date/ | Contract | |
| OUTSTANDING (1.2%)* cont. | strike price | amount | Value |
|
| Option on an interest rate swap with JPMorgan | | | |
| Chase Bank, N.A. for the right to pay a fixed | | | |
| rate of 3.965% versus the three month | | | |
| USD-LIBOR-BBA maturing September 20, 2020. | Sep-10/3.965 | $23,107,800 | $637,313 |
|
| Option on an interest rate swap with JPMorgan | | | |
| Chase Bank, N.A. for the right to receive a | | | |
| fixed rate of 3.995% versus the three month | | | |
| USD-LIBOR-BBA maturing September 20, 2020. | Sep-10/3.995 | 34,661,700 | 710,218 |
|
| Option on an interest rate swap with JPMorgan | | | |
| Chase Bank, N.A. for the right to pay a fixed | | | |
| rate of 3.995% versus the three month | | | |
| USD-LIBOR-BBA maturing September 20, 2020. | Sep-10/3.995 | 34,661,700 | 912,296 |
|
| Option on an interest rate swap with JPMorgan | | | |
| Chase Bank, N.A. for the right to receive a | | | |
| fixed rate of 4.235% versus the three month | | | |
| USD-LIBOR-BBA maturing June 11, 2020. | Jun-10/4.235 | 84,001,000 | 2,740,113 |
|
| Option on an interest rate swap with JPMorgan | | | |
| Chase Bank, N.A. for the right to receive a | | | |
| fixed rate of 4.23% versus the three month | | | |
| USD-LIBOR-BBA maturing June 9, 2020. | Jun-10/4.23 | 84,001,000 | 2,714,912 |
|
| Total purchased options outstanding (cost $21,403,194) | | $17,152,046 |
|
| | |
| SHORT-TERM INVESTMENTS (34.6%)* | Principal amount/shares | Value |
|
| Putnam Money Market Liquidity Fund e | 211,398,697 | $211,398,697 |
|
| Fannie Mae Discount Notes, for an effective yield | | |
| of 0.25%, October 1, 2010 ## | $36,500,000 | 36,453,609 |
|
| Fannie Mae Discount Notes, for an effective yield | | |
| of 0.20%, August 4, 2010 ## | 52,250,000 | 52,211,858 |
|
| Fannie Mae Discount Notes, for an effective yield | | |
| of 0.18%, June 23, 2010 ## | 14,000,000 | 13,994,190 |
|
| Federal Home Loan Mortgage Corporation, for an | | |
| effective yield of 0.14%, April 26, 2010 ## | 25,000,000 | 24,997,569 |
|
| Freddie Mac Discount Notes, for an effective yield | | |
| of 0.23%, September 1, 2010 ## | 50,000,000 | 49,951,150 |
|
| Freddie Mac Discount Notes, for an effective yield | | |
| of 0.14%, April 19, 2010 ## | 70,000,000 | 69,995,100 |
|
| U.S. Treasury Cash Management Bills, for effective | | |
| yields from 0.25% to 0.35%, July 15, 2010 # ## | 34,594,000 | 34,559,232 |
|
| Total short-term investments (cost $493,572,563) | | $493,561,405 |
|
| |
| TOTAL INVESTMENTS | | |
|
| Total investments (cost $2,673,608,710) | | $2,749,657,558 |
| |
| Key to holding’s abbreviations |
| FRB | Floating Rate Bonds |
| IFB | Inverse Floating Rate Bonds |
| IO | Interest Only |
| PO | Principal Only |
| TBA | To Be Announced Commitments |
* Percentages indicated are based on net assets of $1,428,408,306.
# This security, in part or in entirety, was pledged and segregated with the broker to cover margin requirements for futures contracts at March 31, 2010.
42
## These securities, in part or in entirety, were pledged and segregated with the custodian for collateral on certain derivative contracts at March 31, 2010.
Δ Forward commitments, in part or in entirety (Note 1).
e See Note 6 to the financial statements regarding investments in Putnam Money Market Liquidity Fund.
F Is valued at fair value following procedures approved by the Trustees. Securities may be classified as Level 2 or Level 3 for Accounting Standards Codification ASC 820 Fair Value Measurements and Disclosures (“ASC 820”) based on the securities valuation inputs.
At March 31, 2010, liquid assets totaling $1,301,161,859 have been segregated to cover certain derivatives contracts.
Debt obligations are considered secured unless otherwise indicated.
144A after the name of an issuer represents securities exempt from registration under Rule 144A under the Securities Act of 1933, as amended. These securities may be resold in transactions exempt from registration, normally to qualified institutional buyers.
See Note 1 to the financial statements regarding TBA’s.
The rates shown on FRB are the current interest rates at March 31, 2010.
The dates shown on debt obligations are the original maturity dates.
IFB are securities that pay interest rates that vary inversely to changes in the market interest rates. As interest rates rise, inverse floaters produce less current income. The interest rates shown are the current interest rates at March 31, 2010.
FUTURES CONTRACTS OUTSTANDING at 3/31/10 (Unaudited)
| | | | | |
| | | | | | Unrealized |
| | Number of | | | Expiration | appreciation/ |
| | contracts | Value | | date | (depreciation) |
|
| U.S. Treasury Bond 20 yr (Long) | 2,897 | $336,414,125 | | Jun-10 | $1,592,834 |
|
| U.S. Ultra Treasury Bond | | | | | |
| 30 yr (Long) | 441 | 52,906,219 | | Jun-10 | (922,095) |
|
| U.S. Treasury Note 5 yr (Short) | 70 | 8,039,063 | | Jun-10 | 28,792 |
|
| U.S. Treasury Note 10 yr (Long) | 249 | 28,946,250 | | Jun-10 | 117,096 |
|
| Total | | | | | $816,627 |
| | | |
WRITTEN OPTIONS OUTSTANDING at 3/31/10 (premiums received $106,536,298) (Unaudited)
| | | | |
| | Contract | | Expiration date/ | |
| | amount | | strike price | Value |
|
| Option on an interest rate swap with Bank of America, | | | | |
| N.A. for the obligation to pay a fixed rate of 4.475% | | | | |
| versus the three month USD-LIBOR-BBA maturing | | | | |
| August 19, 2021. | $46,434,000 | | Aug-11/4.475 | $1,846,680 |
|
| Option on an interest rate swap with Bank of America, | | | | |
| N.A. for the obligation to receive a fixed rate of 4.475% | | | | |
| versus the three month USD-LIBOR-BBA maturing | | | | |
| August 19, 2021. | 46,434,000 | | Aug-11/4.475 | 1,985,982 |
|
| Option on an interest rate swap with Bank of America, | | | | |
| N.A. for the obligation to receive a fixed rate of 4.55% | | | | |
| versus the three month USD-LIBOR-BBA maturing | | | | |
| August 17, 2021. | 50,790,000 | | Aug-11/4.55 | 2,020,934 |
|
| Option on an interest rate swap with Bank of America, | | | | |
| N.A. for the obligation to pay a fixed rate of 4.55% | | | | |
| versus the three month USD-LIBOR-BBA maturing | | | | |
| August 17, 2021. | 50,790,000 | | Aug-11/4.55 | 2,184,986 |
|
| Option on an interest rate swap with Bank of America, | | | | |
| N.A. for the obligation to receive a fixed rate of 4.765% | | | | |
| versus the three month USD-LIBOR-BBA maturing | | | | |
| August 16, 2021. | 54,331,000 | | Aug-11/4.765 | 1,761,954 |
|
43
WRITTEN OPTIONS OUTSTANDING at 3/31/10 (premiums received $106,536,298) (Unaudited) cont.
| | | | |
| | Contract | | Expiration date/ | |
| | amount | | strike price | Value |
|
| Option on an interest rate swap with Bank of America, | | | | |
| N.A. for the obligation to pay a fixed rate of 4.765% | | | | |
| versus the three month USD-LIBOR-BBA maturing | | | | |
| August 16, 2021. | $54,331,000 | | Aug-11/4.765 | $2,883,889 |
|
| Option on an interest rate swap with Bank of America, | | | | |
| N.A. for the obligation to receive a fixed rate of 4.70% | | | | |
| versus the three month USD-LIBOR-BBA maturing | | | | |
| August 8, 2021. | 55,951,000 | | Aug-11/4.7 | 1,895,620 |
|
| Option on an interest rate swap with Bank of America, | | | | |
| N.A. for the obligation to pay a fixed rate of 4.70% | | | | |
| versus the three month USD-LIBOR-BBA maturing | | | | |
| August 8, 2021. | 55,951,000 | | Aug-11/4.7 | 2,800,907 |
|
| Option on an interest rate swap with Barclays Bank PLC | | | | |
| for the obligation to pay a fixed rate of 4.02% versus the | | | | |
| three month USD-LIBOR-BBA maturing | | | | |
| September 28, 2020. | 8,541,600 | | Sep-10/4.02 | 185,780 |
|
| Option on an interest rate swap with Barclays Bank PLC | | | | |
| for the obligation to receive a fixed rate of 4.02% versus | | | | |
| the three month USD-LIBOR-BBA maturing | | | | |
| September 28, 2020. | 8,541,600 | | Sep-10/4.02 | 224,986 |
|
| Option on an interest rate swap with Barclays Bank PLC | | | | |
| for the obligation to receive a fixed rate of 5.36% versus | | | | |
| the three month USD-LIBOR-BBA maturing | | | | |
| February 13, 2025. | 12,010,980 | | Feb-15/5.36 | 724,382 |
|
| Option on an interest rate swap with Barclays Bank PLC | | | | |
| for the obligation to pay a fixed rate of 5.36% versus the | | | | |
| three month USD-LIBOR-BBA maturing | | | | |
| February 13, 2025. | 12,010,980 | | Feb-15/5.36 | 760,535 |
|
| Option on an interest rate swap with Barclays Bank | | | | |
| PLC for the obligation to receive a fixed rate of 4.7375% | | | | |
| versus the three month USD-LIBOR-BBA maturing | | | | |
| March 9, 2021. | 74,935,600 | | Mar-11/4.738 | 1,548,919 |
|
| Option on an interest rate swap with Citibank, N.A. for | | | | |
| the obligation to pay a fixed rate of 4.49% versus the | | | | |
| three month USD-LIBOR-BBA maturing August 17, 2021. | 101,580,000 | | Aug-11/4.49 | 4,106,879 |
|
| Option on an interest rate swap with Citibank, N.A. for | | | | |
| the obligation to receive a fixed rate of 4.49% versus the | | | | |
| three month USD-LIBOR-BBA maturing August 17, 2021. | 101,580,000 | | Aug-11/4.49 | 4,269,407 |
|
| Option on an interest rate swap with Citibank, N.A. for | | | | |
| the obligation to receive a fixed rate of 4.5475% versus | | | | |
| the three month USD-LIBOR-BBA maturing July 26, 2021. | 9,476,000 | | Jul-11/4.5475 | 357,719 |
|
| Option on an interest rate swap with Citibank, N.A. for | | | | |
| the obligation to pay a fixed rate of 4.5475% versus the | | | | |
| three month USD-LIBOR-BBA maturing July 26, 2021. | 9,476,000 | | Jul-11/4.5475 | 410,311 |
|
| Option on an interest rate swap with Citibank, N.A. for | | | | |
| the obligation to receive a fixed rate of 4.52% versus the | | | | |
| three month USD-LIBOR-BBA maturing July 26, 2021. | 18,952,000 | | Jul-11/4.52 | 734,390 |
|
| Option on an interest rate swap with Citibank, N.A. for | | | | |
| the obligation to pay a fixed rate of 4.52% versus the | | | | |
| three month USD-LIBOR-BBA maturing July 26, 2021. | 18,952,000 | | Jul-11/4.52 | 797,311 |
|
44
WRITTEN OPTIONS OUTSTANDING at 3/31/10 (premiums received $106,536,298) (Unaudited) cont.
| | | | |
| | Contract | | Expiration date/ | |
| | amount | | strike price | Value |
|
| Option on an interest rate swap with JPMorgan Chase | | | | |
| Bank, N.A. for the obligation to pay a fixed rate of | | | | |
| 4.525% versus the three month USD-LIBOR-BBA | | | | |
| maturing July 26, 2021. | $20,208,000 | | Jul-11/4.525 | $854,798 |
|
| Option on an interest rate swap with JPMorgan Chase | | | | |
| Bank, N.A. for the obligation to receive a fixed rate | | | | |
| of 4.745% versus the three month USD-LIBOR-BBA | | | | |
| maturing July 27, 2021. | 30,312,000 | | Jul-11/4.745 | 958,162 |
|
| Option on an interest rate swap with JPMorgan Chase | | | | |
| Bank, N.A. for the obligation to pay a fixed rate of | | | | |
| 4.745% versus the three month USD-LIBOR-BBA | | | | |
| maturing July 27, 2021. | 30,312,000 | | Jul-11/4.745 | 1,594,714 |
|
| Option on an interest rate swap with JPMorgan Chase | | | | |
| Bank, N.A. for the obligation to receive a fixed rate | | | | |
| of 4.525% versus the three month USD-LIBOR-BBA | | | | |
| maturing July 26, 2021. | 20,208,000 | | Jul-11/4.525 | 779,220 |
|
| Option on an interest rate swap with JPMorgan Chase | | | | |
| Bank, N.A. for the obligation to pay a fixed rate of 5.27% | | | | |
| versus the three month USD-LIBOR-BBA maturing | | | | |
| February 12, 2025. | 31,703,820 | | Feb-15/5.27 | 1,908,887 |
|
| Option on an interest rate swap with JPMorgan Chase | | | | |
| Bank, N.A. for the obligation to receive a fixed rate | | | | |
| of 5.27% versus the three month USD-LIBOR-BBA | | | | |
| maturing February 12, 2025. | 31,703,820 | | Feb-15/5.27 | 2,005,901 |
|
| Option on an interest rate swap with JPMorgan Chase | | | | |
| Bank, N.A. for the obligation to receive a fixed rate | | | | |
| of 4.665% versus the three month USD-LIBOR-BBA | | | | |
| maturing March 8, 2021. | 74,935,600 | | Mar-11/4.665 | 1,677,059 |
|
| Option on an interest rate swap with JPMorgan Chase | | | | |
| Bank, N.A. for the obligation to pay a fixed rate of 4.46% | | | | |
| versus the three month USD-LIBOR-BBA maturing | | | | |
| July 26, 2021. | 20,208,000 | | Jul-11/4.46 | 797,610 |
|
| Option on an interest rate swap with JPMorgan Chase | | | | |
| Bank, N.A. for the obligation to receive a fixed rate | | | | |
| of 4.46% versus the three month USD-LIBOR-BBA | | | | |
| maturing July 26, 2021. | 20,208,000 | | Jul-11/4.46 | 828,326 |
|
| Option on an interest rate swap with JPMorgan Chase | | | | |
| Bank, N.A. for the obligation to receive a fixed rate | | | | |
| of 5.235% versus the three month USD-LIBOR-BBA | | | | |
| maturing June 11, 2020. | 84,001,000 | | Jun-10/5.235 | 7,560 |
|
| Option on an interest rate swap with JPMorgan Chase | | | | |
| Bank, N.A. for the obligation to pay a fixed rate of 5.51% | | | | |
| versus the three month USD-LIBOR-BBA maturing | | | | |
| May 14, 2022. | 1,473,000 | | May-12/5.51 | 124,338 |
|
| Option on an interest rate swap with JPMorgan Chase | | | | |
| Bank, N.A. for the obligation to pay a fixed rate of 5.32% | | | | |
| versus the three month USD-LIBOR-BBA maturing | | | | |
| January 09, 2022. | 391,998,000 | | Jan-12/5.32 | 30,579,172 |
|
| Option on an interest rate swap with JPMorgan Chase | | | | |
| Bank, N.A. for the obligation to pay a fixed rate of 4.02% | | | | |
| versus the three month USD-LIBOR-BBA maturing | | | | |
| October 14, 2020. | 69,212,000 | | Oct-10/4.02 | 1,524,048 |
|
45
WRITTEN OPTIONS OUTSTANDING at 3/31/10 (premiums received $106,536,298) (Unaudited) cont.
| | | | |
| | Contract | | Expiration date/ | |
| | amount | | strike price | Value |
|
| Option on an interest rate swap with JPMorgan Chase | | | | |
| Bank, N.A. for the obligation to receive a fixed rate | | | | |
| of 4.02% versus the three month USD-LIBOR-BBA | | | | |
| maturing October 14, 2020. | $69,212,000 | | Oct-10/4.02 | $1,978,079 |
|
| Option on an interest rate swap with JPMorgan Chase | | | | |
| Bank, N.A. for the obligation to receive a fixed rate | | | | |
| of 5.23% versus the three month USD-LIBOR-BBA | | | | |
| maturing June 9, 2020. | 84,001,000 | | Jun-10/5.23 | 6,720 |
|
| Option on an interest rate swap with JPMorgan Chase | | | | |
| Bank, N.A. for the obligation to receive a fixed rate | | | | |
| of 5.51% versus the three month USD-LIBOR-BBA | | | | |
| maturing May 14, 2022. | 1,473,000 | | May-12/5.51 | 41,638 |
|
| Option on an interest rate swap with JPMorgan Chase | | | | |
| Bank, N.A. for the obligation to receive a fixed rate | | | | |
| of 5.32% versus the three month USD-LIBOR-BBA | | | | |
| maturing January 9, 2022. | 391,998,000 | | Jan-12/5.32 | 10,383,327 |
|
| Total | | | | $87,551,130 |
| | | |
TBA SALE COMMITMENTS OUTSTANDING at 3/31/10 (proceeds receivable $855,913,906) (Unaudited)
| | | | |
| | Principal | | Settlement | |
| Agency | amount | | date | Value |
|
| FNMA, 6s, May 1, 2040 | $78,000,000 | | 5/13/10 | $83,158,358 |
|
| FNMA, 6s, April 1, 2040 | 238,000,000 | | 4/13/10 | 252,763,426 |
|
| GNMA, 6s, April 1, 2040 | 252,000,000 | | 4/20/10 | 269,758,138 |
|
| GNMA, 5s, April 1, 2040 | 238,000,000 | | 4/20/10 | 247,278,287 |
|
| Total | | | | $852,958,209 |
| | | |
INTEREST RATE SWAP CONTRACTS OUTSTANDING at 3/31/10 (Unaudited)
| | | | | | | | |
| | | Upfront | | | | Payments | Payments | Unrealized |
| Swap counterparty / | | premium | | Termination | | made by | received by | appreciation/ |
| Notional amount | | received (paid) | | date | | fund per annum | fund per annum | (depreciation) |
|
| Bank of America, N.A. | | | | | | | | |
| $559,278,400 | | $254,369 | | 3/11/25 | | 4.23% | 3 month USD- | |
| | | | | | | | LIBOR-BBA | $(109,698) |
|
| 215,857,700 | | 76,926 | | 3/11/12 | | 1.12% | 3 month USD- | |
| | | | | | | | LIBOR-BBA | 9,323 |
|
| 365,513,100 | | (1,041,256) | | 3/25/20 | | 3 month USD- | | |
| | | | | | | LIBOR-BBA | 3.69% | (4,396,714) |
|
| 288,176,700 | | (154,673) | | 3/25/30 | | 4.3% | 3 month USD- | |
| | | | | | | | LIBOR-BBA | 3,726,625 |
|
| 95,668,000 | | — | | 5/23/10 | | 3 month USD- | | |
| | | | | | | LIBOR-BBA | 3.155% | 1,455,956 |
|
| 429,688,000 | | — | | 9/10/10 | | 3 month USD- | | |
| | | | | | | LIBOR-BBA | 3.22969% | 6,251,363 |
|
| 155,766,000 | | 141,599 | | 10/20/10 | | 3 month USD- | | |
| | | | | | | LIBOR-BBA | 3.00% | 4,422,995 |
|
| 315,840,300 | | (227,683) | | 2/18/15 | | 2.67% | 3 month USD- | |
| | | | | | | | LIBOR-BBA | (1,076,504) |
|
| 50,776,000 | | — | | 7/22/10 | | 3 month USD- | | |
| | | | | | | LIBOR-BBA | 3.5375% | 826,287 |
|
46
INTEREST RATE SWAP CONTRACTS OUTSTANDING at 3/31/10 (Unaudited) cont.
| | | | | | | | |
| | | Upfront | | | | Payments | Payments | Unrealized |
| Swap counterparty / | | premium | | Termination | | made by | received by | appreciation/ |
| Notional amount | | received (paid) | | date | | fund per annum | fund per annum | (depreciation) |
|
| Barclays Bank PLC | | | | | | | | |
| $38,636,200 | | $(52,388) | | 3/5/19 | | 3.53% | 3 month USD- | |
| | | | | | | | LIBOR-BBA | $234,660 |
|
| 516,251,600 | | 531,350 | | 3/5/20 | | 3 month USD- | | |
| | | | | | | LIBOR-BBA | 3.68% | (3,320,495) |
|
| 46,459,900 | E | — | | 3/9/21 | | 4.2375% | 3 month USD- | |
| | | | | | | | LIBOR-BBA | 261,569 |
|
| 180,828,100 | | — | | 3/22/12 | | 1.1175% | 3 month USD- | |
| | | | | | | | LIBOR-BBA | 66,166 |
|
| 594,355,800 | | — | | 3/31/12 | | 3 month USD- | | |
| | | | | | | LIBOR-BBA | 1.2% | 478,619 |
|
| 271,606,000 | | (254,659) | | 1/21/15 | | 2.71% | 3 month USD- | |
| | | | | | | | LIBOR-BBA | (2,377,335) |
|
| 604,723,000 | | (170,818) | | 1/21/11 | | 3 month USD- | | |
| | | | | | | LIBOR-BBA | 0.54% | 576,519 |
|
| Credit Suisse International | | | | | | |
| 35,320,900 | | (199,655) | | 2/22/40 | | 4.58% | 3 month USD- | |
| | | | | | | | LIBOR-BBA | (803,165) |
|
| 743,397,100 | | 17,755 | | 3/19/11 | | 3 month USD- | | |
| | | | | | | LIBOR-BBA | 0.5% | (93,402) |
|
| 310,790,000 | | (42,701) | | 3/19/12 | | 1.09% | 3 month USD- | |
| | | | | | | | LIBOR-BBA | 181,956 |
|
| 353,315,900 | | (75,071) | | 3/19/15 | | 2.6% | 3 month USD- | |
| | | | | | | | LIBOR-BBA | 1,338,025 |
|
| 485,018,900 | | (406,280) | | 3/19/20 | | 3 month USD- | | |
| | | | | | | LIBOR-BBA | 3.7% | (4,064,709) |
|
| 387,488,700 | | — | | 3/22/12 | | 1.1075% | 3 month USD- | |
| | | | | | | | LIBOR-BBA | 216,375 |
|
| 37,000,000 | | — | | 3/29/20 | | 3 month USD- | | |
| | | | | | | LIBOR-BBA | 3.812% | 25,818 |
|
| 240,802,000 | | 168,935 | | 10/31/13 | | 3.80% | 3 month USD- | |
| | | | | | | | LIBOR-BBA | (17,888,924) |
|
| Deutsche Bank AG | | | | | | | | |
| 361,090,000 | | (446,274) | | 2/3/14 | | 2.25% | 3 month USD- | |
| | | | | | | | LIBOR-BBA | (1,970,310) |
|
| 150,109,800 | | 69,685 | | 3/10/13 | | 3 month USD- | | |
| | | | | | | LIBOR-BBA | 1.7% | 1,578 |
|
| 483,709,000 | | (239,651) | | 2/3/12 | | 1.12% | 3 month USD- | |
| | | | | | | | LIBOR-BBA | (1,410,274) |
|
| 281,150,000 | | — | | 2/3/14 | | 2.44% | 3 month USD- | |
| | | | | | | | LIBOR-BBA | (3,254,808) |
|
| 376,784,000 | | — | | 2/5/14 | | 2.44661% | 3 month USD- | |
| | | | | | | | LIBOR-BBA | (4,380,238) |
|
| 46,457,000 | | — | | 10/5/21 | | 3 month USD- | | |
| | | | | | | LIBOR-BBA | 3.52057% | (1,252,808) |
|
47
INTEREST RATE SWAP CONTRACTS OUTSTANDING at 3/31/10 (Unaudited) cont.
| | | | | | | | |
| | | Upfront | | | | Payments | Payments | Unrealized |
| Swap counterparty / | | premium | | Termination | | made by | received by | appreciation/ |
| Notional amount | | received (paid) | | date | | fund per annum | fund per annum | (depreciation) |
|
| Goldman Sachs International | | | | | | |
| $34,000,000 | | $— | | 3/29/20 | | 3.8125% | 3 month USD- | |
| | | | | | | | LIBOR-BBA | $(25,426) |
|
| 294,709,800 | | — | | 3/30/12 | | 3 month USD- | | |
| | | | | | | LIBOR-BBA | 1.225% | 379,582 |
|
| 25,921,200 | | — | | 3/30/40 | | 4.5375% | 3 month USD- | |
| | | | | | | | LIBOR-BBA | (144,122) |
|
| 367,223,000 | | 1,591,722 | | 1/14/16 | | 3.18% | 3 month USD- | |
| | | | | | | | LIBOR-BBA | (4,571,849) |
|
| JPMorgan Chase Bank, N.A. | | | | | | |
| 237,037,000 | | (184,453) | | 2/26/11 | | 3 month USD- | | |
| | | | | | | LIBOR-BBA | 0.56% | 18,569 |
|
| 46,459,900 | E | — | | 3/8/21 | | 4.165% | 3 month USD- | |
| | | | | | | | LIBOR-BBA | 533,360 |
|
| 346,805,600 | | (561,301) | | 3/22/14 | | 2.19% | 3 month USD- | |
| | | | | | | | LIBOR-BBA | 513,026 |
|
| 448,634,500 | | 1,053,298 | | 3/22/20 | | 3 month USD- | | |
| | | | | | | LIBOR-BBA | 3.68% | (3,282,879) |
|
| 159,447,000 | | — | | 5/23/10 | | 3 month USD- | | |
| | | | | | | LIBOR-BBA | 3.16% | 2,431,027 |
|
| 81,179,000 | | — | | 7/16/10 | | 3 month USD- | | |
| | | | | | | LIBOR-BBA | 3.384% | 1,238,426 |
|
| 40,664,000 | | — | | 7/22/10 | | 3 month USD- | | |
| | | | | | | LIBOR-BBA | 3.565% | 667,536 |
|
| 362,476,000 | | — | | 7/28/10 | | 3 month USD- | | |
| | | | | | | LIBOR-BBA | 3.5141% | 5,851,947 |
|
| Total | | | | | | | | $(22,716,353) |
E See Note 1 to the financial statements regarding extended effective dates.
TOTAL RETURN SWAP CONTRACTS OUTSTANDING at 3/31/10 (Unaudited)
| | | | | | | |
| | Upfront | | | | Fixed payments | Total return | Unrealized |
| Swap counterparty / | premium | | Termination | | received (paid) by | received by | appreciation/ |
| Notional amount | received (paid) | | date | | fund per annum | or paid by fund | (depreciation) |
|
| Barclays Bank PLC | | | | | | | |
| $400,994 | $418 | | 1/12/40 | | (4.00%)1 month | Synthetic TRS | $(5,692) |
| | | | | | USD-LIBOR | Index 4.00% 30 | |
| | | | | | | year Fannie Mae | |
| | | | | | | pools | |
|
| 797,179 | (990) | | 1/12/40 | | 4.50% (1 month | Synthetic TRS | 11,886 |
| | | | | | USD-LIBOR) | Index 4.50% 30 | |
| | | | | | | year Fannie Mae | |
| | | | | | | pools | |
|
| 391,373 | 3,047 | | 1/12/40 | | (5.00%)1 month | Synthetic TRS | (7,626) |
| | | | | | USD-LIBOR | Index 5.00% 30 | |
| | | | | | | year Fannie Mae | |
| | | | | | | pools | |
|
48
TOTAL RETURN SWAP CONTRACTS OUTSTANDING at 3/31/10 (Unaudited) cont.
| | | | | | | |
| | Upfront | | | | Fixed payments | Total return | Unrealized |
| Swap counterparty / | premium | | Termination | | received (paid) by | received by | appreciation/ |
| Notional amount | received (paid) | | date | | fund per annum | or paid by fund | (depreciation) |
|
| Deutsche Bank AG | | | | | | | |
| $400,994 | $84 | | 1/12/40 | | 4.00% (1 month | Synthetic TRS | $6,237 |
| | | | | | USD-LIBOR) | Index 4.00% 30 | |
| | | | | | | year Fannie Mae | |
| | | | | | | pools | |
|
| 797,179 | 492 | | 1/12/40 | | (4.50%)1 month | Synthetic TRS | (12,483) |
| | | | | | USD-LIBOR | Index 4.50% 30 | |
| | | | | | | year Fannie Mae | |
| | | | | | | pools | |
|
| 391,373 | (1,581) | | 1/12/40 | | 5.00% (1 month | Synthetic TRS | 9,148 |
| | | | | | USD-LIBOR) | Index 5.00% 30 | |
| | | | | | | year Fannie Mae | |
| | | | | | | pools | |
|
| Total | | | | | | | $1,470 |
ASC 820 establishes a three-level hierarchy for disclosure of fair value measurements. The valuation hierarchy is based upon the transparency of inputs to the valuation of the fund’s investments. The three levels are defined as follows:
Level 1 — Valuations based on quoted prices for identical securities in active markets.
Level 2 — Valuations based on quoted prices in markets that are not active or for which all significant inputs are observable, either directly or indirectly.
Level 3 — Valuations based on inputs that are unobservable and significant to the fair value measurement.
The following is a summary of the inputs used to value the fund’s net assets as of March 31, 2010:
| | | |
| | | Valuation inputs |
|
| Investments in securities: | Level 1 | Level 2 | Level 3 |
|
| Mortgage-backed securities | $— | $403,548,167 | $835,418 |
|
| Purchased options outstanding | — | 17,152,046 | — |
|
| U.S. Government and Agency Mortgage Obligations | — | 1,834,560,522 | — |
|
| Short-term investments | 211,398,697 | 282,162,708 | — |
|
| Totals by level | $211,398,697 | $2,537,423,443 | $835,418 |
| | | |
| | | Valuation inputs |
|
| Other financial instruments: | Level 1 | Level 2 | Level 3 |
|
| Futures contracts | $816,627 | $— | $— |
|
| Written options | — | (87,551,130) | — |
|
| TBA sale commitments | — | (852,958,209) | — |
|
| Receivable purchase agreement | — | — | (512,771) |
|
| Interest rate swap contracts | — | (22,565,129) | — |
|
| Totals by level | $816,627 | $(963,074,468) | $(512,771) |
The accompanying notes are an integral part of these financial statements.
49
Statement of assets and liabilities 3/31/10 (Unaudited)
| |
| ASSETS | |
|
| Investment in securities, at value (Note 1): | |
| Unaffiliated issuers (identified cost $2,462,210,013) | $2,538,258,861 |
| Affiliated issuers (identified cost $211,398,697) (Note 6) | 211,398,697 |
|
| Interest and other receivables | 8,283,342 |
|
| Receivable for shares of the fund sold | 3,199,159 |
|
| Receivable for investments sold | 274,924,954 |
|
| Receivable for sales of delayed delivery securities (Note 1) | 857,971,962 |
|
| Unrealized appreciation on swap contracts (Note 1) | 31,734,578 |
|
| Receivable for variation margin (Note 1) | 1,816,349 |
|
| Premium paid on swap contracts (Note 1) | 4,059,434 |
|
| Total assets | 3,931,647,336 |
|
| |
| LIABILITIES | |
|
| Payable for investments purchased | 221,656,738 |
|
| Payable for purchases of delayed delivery securities (Note 1) | 1,273,077,325 |
|
| Payable for shares of the fund repurchased | 2,263,545 |
|
| Payable for compensation of Manager (Note 2) | 487,198 |
|
| Payable for investor servicing fees (Note 2) | 178,048 |
|
| Payable for custodian fees (Note 2) | 33,977 |
|
| Payable for Trustee compensation and expenses (Note 2) | 342,398 |
|
| Payable for administrative services (Note 2) | 4,941 |
|
| Payable for distribution fees (Note 2) | 880,869 |
|
| Payable for receivable purchase agreement (Note 2) | 512,771 |
|
| Interest payable (Note 2) | 4,774,034 |
|
| Written options outstanding, at value (premiums received $106,536,298) (Notes 1 and 3) | 87,551,130 |
|
| Premium received on swap contracts (Note 1) | 3,909,680 |
|
| Unrealized depreciation on swap contracts (Note 1) | 54,449,461 |
|
| TBA sales commitments, at value (proceeds receivable $855,913,906) (Note 1) | 852,958,209 |
|
| Other accrued expenses | 158,706 |
|
| Total liabilities | 2,503,239,030 |
| |
| Net assets | $1,428,408,306 |
|
| |
| REPRESENTED BY | |
|
| Paid-in capital (Unlimited shares authorized) (Notes 1 and 4) | $1,307,236,639 |
|
| Undistributed net investment income (Note 1) | 35,469,242 |
|
| Accumulated net realized gain on investments (Note 1) | 8,987,537 |
|
| Net unrealized appreciation of investments | 76,714,888 |
|
| Total — Representing net assets applicable to capital shares outstanding | $1,428,408,306 |
(Continued on next page)
50
Statement of assets and liabilities (Continued)
| |
| COMPUTATION OF NET ASSET VALUE AND OFFERING PRICE | |
|
| Net asset value and redemption price per class A share | |
| ($1,205,331,293 divided by 80,016,674 shares) | $15.06 |
|
| Offering price per class A share (100/96.00 of $15.06)* | $15.69 |
|
| Net asset value and offering price per class B share | |
| ($60,406,487 divided by 4,026,224 shares)** | $15.00 |
|
| Net asset value and offering price per class C share | |
| ($86,626,779 divided by 5,779,597 shares)** | $14.99 |
|
| Net asset value and redemption price per class M share | |
| ($30,168,070 divided by 2,001,362 shares) | $15.07 |
|
| Offering price per class M share (100/96.75 of $15.07)*** | $15.58 |
|
| Net asset value, offering price and redemption price per class R share | |
| ($8,718,827 divided by 583,479 shares) | $14.94 |
|
| Net asset value, offering price and redemption price per class Y share | |
| ($37,156,850 divided by 2,482,392 shares) | $14.97 |
|
* On single retail sales of less than $100,000. On sales of $100,000 or more the offering price is reduced.
** Redemption price per share is equal to net asset value less any applicable contingent deferred sales charge.
*** On single retail sales of less than $50,000. On sales of $50,000 or more the offering price is reduced.
The accompanying notes are an integral part of these financial statements.
51
Statement of operations Six months ended 3/31/10 (Unaudited)
| |
| INVESTMENT INCOME | |
|
| Interest (including interest income of $201,228 from | |
| investments in affiliated issuers) (Note 6) | $46,279,999 |
|
| Total investment income | 46,279,999 |
|
| |
| EXPENSES | |
|
| Compensation of Manager (Note 2) | 3,095,450 |
|
| Investor servicing fees (Note 2) | 1,076,616 |
|
| Custodian fees (Note 2) | 48,936 |
|
| Trustee compensation and expenses (Note 2) | 47,509 |
|
| Administrative services (Note 2) | 38,864 |
|
| Distribution fees — Class A (Note 2) | 1,472,168 |
|
| Distribution fees — Class B (Note 2) | 308,844 |
|
| Distribution fees — Class C (Note 2) | 352,845 |
|
| Distribution fees — Class M (Note 2) | 71,836 |
|
| Distribution fees — Class R (Note 2) | 15,758 |
|
| Interest expense (Note 2) | 1,743,117 |
|
| Other | 221,917 |
|
| Fees waived and reimbursed by Manager (Note 2) | (292,296) |
|
| Total expenses | 8,201,564 |
| | |
| Expense reduction (Note 2) | (5,689) |
|
| Net expenses | 8,195,875 |
| |
| Net investment income | 38,084,124 |
|
| |
| Net realized gain on investments (Notes 1 and 3) | 59,684,861 |
|
| Net realized loss on swap contracts (Note 1) | (38,281,056) |
|
| Net realized loss on futures contracts (Note 1) | (7,753,718) |
|
| Net unrealized appreciation of investments futures contracts, swap contracts, | |
| written options, TBA sale commitments and receivable purchase agreements | |
| during the period | 36,596,235 |
|
| Net gain on investments | 50,246,322 |
| |
| Net increase in net assets resulting from operations | $88,330,446 |
|
The accompanying notes are an integral part of these financial statements.
52
Statement of changes in net assets
| | |
| INCREASE IN NET ASSETS | Six months ended 3/31/10* | Year ended 9/30/09 |
Operations: |
|
| Net investment income | $38,084,124 | $55,518,786 |
|
| Net realized gain on investments | 13,650,087 | 126,892,470 |
|
| Net unrealized appreciation of investments | 36,596,235 | 33,429,591 |
|
| Net increase in net assets resulting from operations | 88,330,446 | 215,840,847 |
|
| Distributions to shareholders (Note 1): | | |
| From ordinary income | | |
| Net investment income | | |
|
| Class A | (28,378,221) | (49,318,989) |
|
| Class B | (1,309,515) | (2,962,252) |
|
| Class C | (1,455,339) | (1,496,861) |
|
| Class M | (672,788) | (1,199,136) |
|
| Class R | (146,078) | (135,824) |
|
| Class Y | (693,227) | (617,605) |
|
| From net realized long-term gain on investments | | |
| Class A | (3,947,936) | — |
|
| Class B | (217,226) | — |
|
| Class C | (229,005) | — |
|
| Class M | (97,770) | — |
|
| Class R | (20,345) | — |
|
| Class Y | (99,576) | — |
|
| Increase in capital from settlement payments | 89,729 | 32,952 |
|
| Redemption fees (Note 1) | 1,872 | 9,391 |
|
| Increase (decrease) from capital share transactions (Note 4) | 75,113,952 | (73,756,566) |
|
| Total increase in net assets | 126,268,973 | 86,395,957 |
|
| |
| NET ASSETS | | |
|
| Beginning of period | 1,302,139,333 | 1,215,743,376 |
|
| End of period (including undistributed net investment income | | |
| of $35,469,242 and $30,040,286, respectively) | $1,428,408,306 | $1,302,139,333 |
|
* Unaudited
The accompanying notes are an integral part of these financial statements.
53
Financial highlights (For a common share outstanding throughout the period)
| | | | | | | | | | | | | | | | |
| INVESTMENT OPERATIONS: | | LESS DISTRIBUTIONS: | | RATIOS AND SUPPLEMENTAL DATA: |
|
| | | | | | | | | | | | | | | Ratio | | |
| | | | | | | | | | | | | | | of expenses | | |
| | | | Net realized | | | | | | | | | | | to average | Ratio of net | |
| | Net asset | Net | and | | | From net | | Re- | Non- | | | | Ratio | net assets | investment | |
| | value, | investment | unrealized | Total from | From net | realized | Total | demp- | recurring | Net asset | Total return | Net assets, | of expenses | excluding | income (loss) | Portfolio |
| | beginning | income | gain (loss) on | investment | investment | gain on | distri- | tion | reimburse- | value, end | at net asset | end of period to | average net | interest | to average | turnover |
| Period ended | of period | (loss) a | investments | operations | income | investments | butions | fees b | ments | of period | value (%) c | (in thousands) | assets (%) d | expense (%) d | net assets (%) | (%) e |
|
| Class A | | | | | | | | | | | | | | | | |
| March 31, 2010 ** | $14.50 | .42 | .55 | .97 | (.36) | (.05) | (.41) | — | — b,f | $15.06 | 6.75* | $1,205,331 | .56 *g,h | .43 *g | 2.80 *g | 310.38 * |
| September 30, 2009 | 12.68 | .62 | 1.82 | 2.44 | (.62) | — | (.62) | — | — b,i | 14.50 | 19.92 | 1,129,477 | 1.23 g,h | .98 g | 4.73 g | 604.28 |
| September 30, 2008 | 13.17 | .73 | (.63) j | .10 | (.59) | — | (.59) | — | — | 12.68 | .60 j | 1,057,520 | .96 g | .96 g | 5.47 g | 270.58 |
| September 30, 2007 | 13.03 | .57 | .12 | .69 | (.55) | — | (.55) | — | — | 13.17 | 5.41 | 968,106 | .99 g | .99 g | 4.37 g | 252.54 |
| September 30, 2006 | 13.15 | .52 | (.10) | .42 | (.54) | — | (.54) | — | — | 13.03 | 3.30 | 1,068,197 | .94 k | .94 k | 4.02 k | 579.42 |
| September 30, 2005 | 13.24 | .37 | (.05) | .32 | (.41) | — | (.41) | — | — | 13.15 | 2.43 | 1,255,038 | .94 | .94 | 2.83 | 781.82 |
|
| Class B | | | | | | | | | | | | | | | | |
| March 31, 2010 ** | $14.44 | .36 | .56 | .92 | (.31) | (.05) | (.36) | — | — b,f | $15.00 | 6.40* | $60,406 | .91 *g,h | .78 *g | 2.44 *g | 310.38 * |
| September 30, 2009 | 12.62 | .51 | 1.84 | 2.35 | (.53) | — | (.53) | — | — b,i | 14.44 | 19.15 | 68,377 | 1.94 g,h | 1.69 g | 3.97 g | 604.28 |
| September 30, 2008 | 13.10 | .63 | (.62) j | .01 | (.49) | — | (.49) | — | — | 12.62 | (.06) j | 85,571 | 1.67 g | 1.67 g | 4.78 g | 270.58 |
| September 30, 2007 | 12.96 | .47 | .12 | .59 | (.45) | — | (.45) | — | — | 13.10 | 4.63 | 84,146 | 1.74 g | 1.74 g | 3.62 g | 252.54 |
| September 30, 2006 | 13.08 | .42 | (.10) | .32 | (.44) | — | (.44) | — | — | 12.96 | 2.52 | 132,827 | 1.69 k | 1.69 k | 3.29 k | 579.42 |
| September 30, 2005 | 13.17 | .27 | (.05) | .22 | (.31) | — | (.31) | — | — | 13.08 | 1.64 | 205,275 | 1.69 | 1.69 | 2.07 | 781.82 |
|
| Class C | | | | | | | | | | | | | | | | |
| March 31, 2010 ** | $14.44 | .36 | .55 | .91 | (.31) | (.05) | (.36) | — | — b,f | $14.99 | 6.32* | $86,627 | .93 *g,h | .80 *g | 2.43 *g | 310.38 * |
| September 30, 2009 | 12.66 | .53 | 1.77 | 2.30 | (.52) | — | (.52) | — | — b,i | 14.44 | 18.75 | 56,171 | 1.98 g,h | 1.73 g | 4.05 g | 604.28 |
| September 30, 2008 | 13.15 | .63 | (.63) j | — b | (.49) | — | (.49) | — | — | 12.66 | (.13) j | 29,635 | 1.71 g | 1.71 g | 4.73 g | 270.58 |
| September 30, 2007 | 13.01 | .47 | .12 | .59 | (.45) | — | (.45) | — | — | 13.15 | 4.62 | 16,713 | 1.74 g | 1.74 g | 3.62 g | 252.54 |
| September 30, 2006 | 13.13 | .43 | (.11) | .32 | (.44) | — | (.44) | — | — | 13.01 | 2.50 | 15,985 | 1.69 k | 1.69 k | 3.28 k | 579.42 |
| September 30, 2005 | 13.22 | .27 | (.05) | .22 | (.31) | — | (.31) | — | — | 13.13 | 1.64 | 19,784 | 1.69 | 1.69 | 2.08 | 781.82 |
|
| Class M | | | | | | | | | | | | | | | | |
| March 31, 2010 ** | $14.49 | .40 | .57 | .97 | (.34) | (.05) | (.39) | — | — b,f | $15.07 | 6.76* | $30,168 | .68 *g,h | .55 *g | 2.68 *g | 310.38 * |
| September 30, 2009 | 12.68 | .58 | 1.82 | 2.40 | (.59) | — | (.59) | — | — b,i | 14.49 | 19.57 | 28,104 | 1.47 g,h | 1.22 g | 4.48 g | 604.28 |
| September 30, 2008 | 13.16 | .70 | (.63) j | .07 | (.55) | — | (.55) | — | — | 12.68 | .42 j | 27,627 | 1.20 g | 1.20 g | 5.23 g | 270.58 |
| September 30, 2007 | 13.02 | .54 | .11 | .65 | (.51) | — | (.51) | — | — | 13.16 | 5.12 | 27,563 | 1.24 g | 1.24 g | 4.12 g | 252.54 |
| September 30, 2006 | 13.13 | .49 | (.10) | .39 | (.50) | — | (.50) | — | — | 13.02 | 3.10 | 31,087 | 1.19 k | 1.19 k | 3.78 k | 579.42 |
| September 30, 2005 | 13.23 | .34 | (.07) | .27 | (.37) | — | (.37) | — | — | 13.13 | 2.08 | 39,845 | 1.19 | 1.19 | 2.58 | 781.82 |
|
| Class R | | | | | | | | | | | | | | | | |
| March 31, 2010 ** | $14.40 | .40 | .53 | .93 | (.34) | (.05) | (.39) | — | — b,f | $14.94 | 6.53* | $8,719 | .68 *g,h | .55 *g | 2.69 *g | 310.38 * |
| September 30, 2009 | 12.64 | .59 | 1.76 | 2.35 | (.59) | — | (.59) | — | — b,i | 14.40 | 19.20 | 3,895 | 1.48 g,h | 1.23 g | 4.54 g | 604.28 |
| September 30, 2008 | 13.16 | .70 | (.67) j | .03 | (.55) | — | (.55) | — | — | 12.64 | .12 j | 2,651 | 1.21 g | 1.21 g | 5.22 g | 270.58 |
| September 30, 2007 | 13.02 | .54 | .12 | .66 | (.52) | — | (.52) | — | — | 13.16 | 5.16 | 627 | 1.24 g | 1.24 g | 4.12 g | 252.54 |
| September 30, 2006 | 13.14 | .48 | (.09) | .39 | (.51) | — | (.51) | — | — | 13.02 | 3.04 | 396 | 1.19 k | 1.19 k | 3.73 k | 579.42 |
| September 30, 2005 | 13.24 | .35 | (.07) | .28 | (.38) | — | (.38) | — | — | 13.14 | 2.14 | 166 | 1.19 | 1.19 | 2.60 | 781.82 |
|
| Class Y | | | | | | | | | | | | | | | | |
| March 31, 2010 ** | $14.42 | .44 | .54 | .98 | (.38) | (.05) | (.43) | — | — b,f | $14.97 | 6.85* | $37,157 | .43 *g,h | .30 *g | 2.92 *g | 310.38 * |
| September 30, 2009 | 12.64 | .65 | 1.78 | 2.43 | (.65) | — | (.65) | — | — b,i | 14.42 | 19.97 | 16,116 | .98 g,h | .73 g | 4.99 g | 604.28 |
| September 30, 2008 | 13.13 | .77 | (.64) j | .13 | (.62) | — | (.62) | — | — | 12.64 | .87 j | 12,740 | .71 g | .71 g | 5.76 g | 270.58 |
| September 30, 2007 | 13.00 | .60 | .11 | .71 | (.58) | — | (.58) | — | — | 13.13 | 5.64 | 4,458 | .74 g | .74 g | 4.62 g | 252.54 |
| September 30, 2006 | 13.12 | .55 | (.09) | .46 | (.58) | — | (.58) | — | — | 13.00 | 3.60 | 4,542 | .69 k | .69 k | 4.23 k | 579.42 |
| September 30, 2005 | 13.22 | .40 | (.06) | .34 | (.44) | — | (.44) | — | — | 13.12 | 2.64 | 12,603 | .69 | .69 | 3.05 | 781.82 |
|
See notes to financial highlights at the end of this section.
The accompanying notes are an integral part of these financial statements.
Financial highlights (Continued)
* Not annualized.
** Unaudited.
a Per share net investment income (loss) has been determined on the basis of the weighted average number of shares outstanding during the period.
b Amount represents less than $0.01 per share.
c Total return assumes dividend reinvestment and does not reflect the effect of sales charges.
d Includes amounts paid through expense offset arrangements (Note 2).
e Portfolio turnover excludes dollar roll transactions.
f Reflects a non-recurring reimbursement pursuant to a settlement between the Securities and Exchange Commission ( the “SEC”) and Prudential Securities, Inc., which amounted to less than $0.01 per share outstanding as of March 30, 2010.
g Reflects an involuntary contractual expense limitation in effect during the period. For periods prior to September 30, 2009, certain fund expenses were waived in connection with the fund’s investment in Putnam Prime Money Market Fund. As a result of such limitation and/or waivers, the expenses of each class reflect a reduction of the following amounts (Note 2):
| |
| | Percentage of |
| | average net assets |
|
| March 31, 2010 | 0.02% |
|
| September 30, 2009 | 0.05 |
|
| September 30, 2008 | 0.01 |
|
| September 30, 2007 | 0.01 |
|
h Includes interest accrued in connection with certain terminated derivatives contracts, which amounted to 0.25% and 0.13% of average net assets as of September 30, 2009 and March 31, 2010, respectively (Note 2).
i Reflects a non-recurring reimbursement pursuant to a settlement between the SEC and Bear, Stearns & Co., Inc. and Bear, Stearns Securities Corp., which amounted to less than $0.01 per share outstanding as of May 21, 2009.
j Reflects a non-recurring reimbursement from Putnam Management relating to the misidentification, in 2006, of the characteristics of certain securities in the fund’s portfolio, which amounted to $0.02 per share.
k Reflects a non-recurring reimbursement from Putnam Investments relating to the calculation of certain amounts paid by the fund to Putnam in previous years for transfer agent services, which amounted to less than $0.01 per share and 0.02% of average net assets for the period ended September 30, 2006.
The accompanying notes are an integral part of these financial statements.
56
Notes to financial statements 3/31/10 (Unaudited)
Note 1: Significant accounting policies
Putnam U.S. Government Income Trust (the “fund”), is a Massachusetts business trust, which is registered under the Investment Company Act of 1940, as amended, as a diversified open-end management investment company. The fund’s investment objective is to seek as high a level of current income as is consistent with preservation of capital by investing mainly in securities which have short to long-term maturities and are backed by the full faith and credit of the United States or by the credit of the issuing U.S. government agency. The fund may invest a significant portion of its assets in securitized debt instruments, including mortgage-backed and asset-backed investments. The yields and values of these investments are sensitive to changes in interest rates, the rate of principal payments on the underlying assets and the market’s perception of the issuers. The market for these investments may be volatile and limited, which may make th em difficult to buy or sell.
The fund offers class A, class B, class C, class M, class R and class Y shares. Class A and class M shares are sold with a maximum front-end sales charge of 4.00% and 3.25%, respectively, and generally do not pay a contingent deferred sales charge. Class B shares, which convert to class A shares after approximately eight years, do not pay a front-end sales charge and are subject to a contingent deferred sales charge if those shares are redeemed within six years of purchase. Class C shares have a one-year 1.00% contingent deferred sales charge and do not convert to class A shares. Class R shares, which are offered to qualified employee-benefit plans, are sold at net asset value. The expenses for class A, class B, class C, class M and class R shares may differ based on the distribution fee of each class, which is identified in Note 2. Class Y shares, which are sold at net asset value, are generally subject to the same expenses as class A, class B, class C, class M and class R shares, but do not bear a distribution fee. Class Y shares are generally only available to corporate and institutional clients and clients in other approved programs.
A 1.00% redemption fee may apply on any shares that are redeemed (either by selling or exchanging into another fund) within 7 days of purchase. The redemption fee is accounted for as an addition to paid-in-capital.
Investment income, realized and unrealized gains and losses and expenses of the fund are borne pro-rata based on the relative net assets of each class to the total net assets of the fund, except that each class bears expenses unique to that class (including the distribution fees applicable to such classes). Each class votes as a class only with respect to its own distribution plan or other matters on which a class vote is required by law or determined by the Trustees. If the fund were liquidated, shares of each class would receive their pro-rata share of the net assets of the fund. In addition, the Trustees declare separate dividends on each class of shares.
In the normal course of business, the fund enters into contracts that may include agreements to indemnify another party under given circumstances. The fund’s maximum exposure under these arrangements is unknown as this would involve future claims that may be, but have not yet been, made against the fund. However, the fund’s management team expects the risk of material loss to be remote.
The following is a summary of significant accounting policies consistently followed by the fund in the preparation of its financial statements. The preparation of financial statements is in conformity with accounting principles generally accepted in the United States of America and requires management to make estimates and assumptions that affect the reported amounts of assets and liabilities in the financial statements and the reported amounts of increases and decreases in net assets from operations during the reporting period. Actual results could differ from those estimates. Subsequent events after the Statement of assets and liabilities date through the date that the financial statements were issued, May 13, 2010, have been evaluated in the preparation of the financial statements.
A) Security valuation Investments, including mortgage backed securities, are valued on the basis of valuations provided by an independent pricing service approved by the Trustees or dealers selected by Putnam Investment Management, LLC (“Putnam Management”), the fund’s manager, an indirect wholly-owned subsidiary of Putnam Investments, LLC. Such service providers use information with respect to transactions in bonds, quotations from bond dealers, market transactions in comparable securities and various relationships between securities in determining value. Certain investments, including certain restricted and illiquid securities and derivatives, are also valued at fair value following procedures approved by the Trustees. Such valuations and procedures are reviewed periodically by the Trustees. Certain securities may be valued on the basis of a price provided by a single source. The fair value of securities is generally determined as the amount that the fund could reasonably expect to realize from an orderly disposition of such securities over a reasonable period of time. By its nature, a fair value price is a good faith estimate of the value of a security in a current sale and does not reflect an actual market price, which may be different by a material amount.
57
B) Joint trading account Pursuant to an exemptive order from the Securities and Exchange Commission (the “SEC”), the fund may transfer uninvested cash balances, including cash collateral received under security lending arrangements, into a joint trading account along with the cash of other registered investment companies and certain other accounts managed by Putnam Management. These balances may be invested in issues of short-term investments having maturities of up to 397 days for collateral received under security lending arrangements and up to 90 days for other cash investments.
C) Repurchase agreements The fund, or any joint trading account, through its custodian, receives delivery of the underlying securities, the market value of which at the time of purchase is required to be in an amount at least equal to the resale price, including accrued interest. Collateral for certain tri-party repurchase agreements is held at the counterparty’s custodian in a segregated account for the benefit of the fund and the counterparty. Putnam Management is responsible for determining that the value of these underlying securities is at all times at least equal to the resale price, including accrued interest. In the event of default or bankruptcy by the other party to the agreement, retention of the collateral may be subject to legal proceedings.
D) Security transactions and related investment income Security transactions are recorded on the trade date (the date the order to buy or sell is executed). Gains or losses on securities sold are determined on the identified cost basis. Interest income is recorded on the accrual basis. All premiums/discounts are amortized/accreted on a yield-to-maturity basis.
Securities purchased or sold on a forward commitment or delayed delivery basis may be settled a month or more after the trade date; interest income is accrued based on the terms of the securities. Losses may arise due to changes in the market value of the underlying securities or if the counterparty does not perform under the contract.
E) Stripped securities The fund may invest in stripped securities which represent a participation in securities that may be structured in classes with rights to receive different portions of the interest and principal. Interest-only securities receive all of the interest and principal-only securities receive all of the principal. If the interest-only securities experience greater than anticipated prepayments of principal, the fund may fail to recoup fully its initial investment in these securities. Conversely, principal-only securities increase in value if prepayments are greater than anticipated and decline if prepayments are slower than anticipated. The market value of these securities is highly sensitive to changes in interest rates.
F) Futures and options contracts The fund may use futures and options contracts to hedge against changes in the values of securities the fund owns, owned or expects to purchase, or for other investment purposes. The fund may also write options on swaps or securities it owns or in which it may invest to increase its current returns.
The potential risk to the fund is that the change in value of futures and options contracts may not correspond to the change in value of the hedged instruments. In addition, losses may arise from changes in the value of the underlying instruments, if there is an illiquid secondary market for the contracts, if interest or exchange rates move unexpectedly or if the counterparty to the contract is unable to perform. With futures, there is minimal counterparty credit risk to the fund since futures are exchange traded and the exchange’s clearinghouse, as counterparty to all exchange traded futures, guarantees the futures against default. Risks may exceed amounts recognized on the Statement of assets and liabilities. When the contract is closed, the fund records a realized gain or loss equal to the difference between the value of the contract at the time it was opened and the value at the time it was closed. Realized gains and losses on purchased option s are included in realized gains and losses on investment securities. If a written call option is exercised, the premium originally received is recorded as an addition to sales proceeds. If a written put option is exercised, the premium originally received is recorded as a reduction to the cost of investments.
Futures contracts are valued at the quoted daily settlement prices established by the exchange on which they trade. The fund and the broker agree to exchange an amount of cash equal to the daily fluctuation in the value of the futures contract. Such receipts or payments are known as “variation margin.” Exchange traded options are valued at the last sale price or, if no sales are reported, the last bid price for purchased options and the last ask price for written options. Options traded over-the-counter are valued using prices supplied by dealers. Futures and written option contracts outstanding at period end, if any, are listed after the fund’s portfolio. The fund had an average contract amount of approximately $629,100,000 on purchased options contracts for the six months ended March 31, 2010. See Note 3 for the volume of written options contracts activity for the six months ended March 31, 2010. Outstanding contracts on futures contra cts at March 31, 2010 are indicative of the volume of activity during the period.
G) Total return swap contracts The fund may enter into total return swap contracts, which are arrangements to exchange a market linked return for a periodic payment, both based on a notional principal amount to help
58
enhance the funds return and manage the fund’s exposure to credit risk. To the extent that the total return of the security, index or other financial measure underlying the transaction exceeds or falls short of the offsetting interest rate obligation, the fund will receive a payment from or make a payment to the counterparty. Total return swap contracts are marked to market daily based upon quotations from market makers and the change, if any, is recorded as an unrealized gain or loss. Payments received or made are recorded as realized gains or losses. Certain total return swap contracts may include extended effective dates. Payments related to these swap contracts are accrued based on the terms of the contract. The fund could be exposed to credit or market risk due to unfavorable changes in the fluctuation of interest rates or in the price of the underlying security or index, the possibility that there is no liquid market for these agreements or that the counterparty may default on its obligation to perform. The fund’s maximum risk of loss from counterparty risk is the fair value of the contract. This risk may be mitigated by having a master netting arrangement between the fund and the counterparty. Risk of loss may exceed amounts recognized on the Statement of assets and liabilities. Total return swap contracts outstanding at period end, if any, are listed after the fund’s portfolio. The fund had an average notional amount of approximately $1,400,000 on total return swap contracts for the six months ended March 31, 2010.
H) Interest rate swap contracts The fund may enter into interest rate swap contracts, which are arrangements between two parties to exchange cash flows based on a notional principal amount, to manage the fund’s exposure to interest rates. An interest rate swap can be purchased or sold with an upfront premium. An upfront payment received by the fund is recorded as a liability on the fund’s books. An upfront payment made by the fund is recorded as an asset on the fund’s books. Interest rate swap contracts are marked to market daily based upon quotations from an independent pricing service or market makers and the change, if any, is recorded as an unrealized gain or loss. Payments received or made are recorded as realized gains or losses. Certain interest rate swap contracts may include extended effective dates. Payments related to these swap contracts are accrued based on the terms of the contract . The fund could be exposed to credit or market risk due to unfavorable changes in the fluctuation of interest rates or if the counterparty defaults on its obligation to perform. The fund’s maximum risk of loss from counterparty risk is the fair value of the contract. This risk may be mitigated by having a master netting arrangement between the fund and the counterparty. Risk of loss may exceed amounts recognized on the Statement of assets and liabilities. Interest rate swap contracts outstanding at period end, if any, are listed after the fund’s portfolio. Outstanding notional on interest rate swap contracts at March 31, 2010 are indicative of the volume of activity during the period.
I) Master agreements The fund is a party to ISDA (International Swap and Derivatives Association, Inc.) Master Agreements (“Master Agreements”) with certain counterparties that govern over the counter derivative and foreign exchange contracts entered into from time to time. The Master Agreements may contain provisions regarding, among other things, the parties’ general obligations, representations, agreements, collateral requirements, events of default and early termination. With respect to certain counterparties, in accordance with the terms of the Master Agreements, collateral posted to the fund is held in a segregated account by the fund’s custodian and with respect to those amounts which can be sold or repledged, are presented in the fund’s portfolio. Collateral pledged by the fund is segregated by the fund’s custodian and identified in the fund’s portfolio. Collateral ca n be in the form of cash or debt securities issued by the U.S. Government or related agencies or other securities as agreed to by the fund and the applicable counterparty. Collateral requirements are determined based on the fund’s net position with each counterparty. Termination events applicable to the fund may occur upon a decline in the fund’s net assets below a specified threshold over a certain period of time. Termination events applicable to counterparties may occur upon a decline in the counterparty’s long-term and short-term credit ratings below a specified level. In each case, upon occurrence, the other party may elect to terminate early and cause settlement of all derivative and foreign exchange contracts outstanding, including the payment of any losses and costs resulting from such early termination, as reasonably determined by the terminating party. Any decision by one or more of the fund’s counterparties to elect early termination could impact the fund’s future derivativ e activity.
At March 31, 2010, the fund had a net liability position of $92,964,213 on derivative contracts subject to the Master Agreements. Collateral posted by the fund totaled $100,549,191.
J) TBA purchase commitments The fund may enter into “TBA” (to be announced) commitments to purchase securities for a fixed unit price at a future date beyond customary settlement time. Although the unit price has been established, the principal value has not been finalized. However, it is anticipated that the amount of the commitments will not significantly differ from the principal amount. The fund holds, and maintains until settlement date, cash or high-grade debt obligations in an amount sufficient to meet the purchase price, or the fund may enter into offsetting contracts for the forward sale of other securities it owns. Income on the securities will not be earned until settlement date. TBA purchase commitments may be considered securities themselves, and involve a risk of loss
59
if the value of the security to be purchased declines prior to the settlement date, which risk is in addition to the risk of decline in the value of the fund’s other assets. Unsettled TBA purchase commitments are valued at fair value of the underlying securities, according to the procedures described under “Security valuation” above. The contract is marked to market daily and the change in market value is recorded by the fund as an unrealized gain or loss.
Although the fund will generally enter into TBA purchase commitments with the intention of acquiring securities for its portfolio or for delivery pursuant to options contracts it has entered into, the fund may dispose of a commitment prior to settlement if Putnam Management deems it appropriate to do so.
K) TBA sale commitments The fund may enter into TBA sale commitments to hedge its portfolio positions or to sell mortgage-backed securities it owns under delayed delivery arrangements. Proceeds of TBA sale commitments are not received until the contractual settlement date. During the time a TBA sale commitment is outstanding, equivalent deliverable securities or an offsetting TBA purchase commitment deliverable on or before the sale commitment date, are held as “cover” for the transaction.
Unsettled TBA sale commitments are valued at the fair value of the underlying securities, generally according to the procedures described under “Security valuation” above. The contract is marked to market daily and the change in market value is recorded by the fund as an unrealized gain or loss. If the TBA sale commitment is closed through the acquisition of an offsetting TBA purchase commitment, the fund realizes a gain or loss. If the fund delivers securities under the commitment, the fund realizes a gain or a loss from the sale of the securities based upon the unit price established at the date the commitment was entered into. TBA sale commitments outstanding at period end, if any, are listed after the fund’s portfolio.
L) Dollar rolls To enhance returns, the fund may enter into dollar rolls (principally using TBAs) in which the fund sells securities for delivery in the current month and simultaneously contracts to purchase similar securities on a specified future date. During the period between the sale and subsequent purchase, the fund will not be entitled to receive income and principal payments on the securities sold. The fund will, however, retain the difference between the initial sales price and the forward price for the future purchase. The fund will also be able to earn interest on the cash proceeds that are received from the initial sale, on settlement date. The fund may be exposed to market or credit risk if the price of the security changes unfavorably or the counterparty fails to perform under the terms of the agreement.
M) Federal taxes It is the policy of the fund to distribute all of its taxable income within the prescribed time and otherwise comply with the provisions of the Internal Revenue Code of 1986, as amended (the “Code”), applicable to regulated investment companies. It is also the intention of the fund to distribute an amount sufficient to avoid imposition of any excise tax under Section 4982 of the Code. The fund is subject to the provisions of Accounting Standards Codification ASC 740 Income Taxes (“ASC 740”). ASC 740 sets forth a minimum threshold for financial statement recognition of the benefit of a tax position taken or expected to be taken in a tax return. The fund did not have any unrecognized tax benefits in the accompanying financial statements. No provision has been made for federal taxes on income, capital gains or unrealized appreciation on securities held nor for excise tax on in come and capital gains. Each of the fund’s federal tax returns for the prior three fiscal years remains subject to examination by the Internal Revenue Service and state departments of revenue.
The aggregate identified cost on a tax basis is $2,676,178,903, resulting in gross unrealized appreciation and depreciation of $85,830,256 and $12,351,601, respectively, or net unrealized appreciation of $73,478,655.
N) Distributions to shareholders Distributions to shareholders from net investment income are recorded by the fund on the ex-dividend date. Distributions from capital gains, if any, are recorded on the ex-dividend date and paid at least annually. The amount and character of income and gains to be distributed are determined in accordance with income tax regulations, which may differ from generally accepted accounting principles. Dividend sources are estimated at the time of declaration. Actual results may vary. Any non-taxable return of capital cannot be determined until final tax calculations are completed after the end of the fund’s fiscal year. Reclassifications are made to the fund’s capital accounts to reflect income and gains available for distribution (or available capital loss carryovers) under income tax regulations.
Note 2: Management fee, administrative services and other transactions
Effective January 1, 2010 , the fund pays Putnam Management a management fee (based on the fund’s average net assets and computed and paid monthly) at annual rates that may vary based on the average of the aggregate net assets of most open-end funds, as defined in the fund’s management contract, sponsored by Putnam Management. Such annual rates may vary as follows: 0.55% of the first $5 billion, 0.50% of the next $5 billion, 0.45%
60
of the next $10 billion, 0.40% of the next $10 billion, 0.35% of the next $50 billion, 0.33% of the next $50 billion, 0.32% of the next $100 billion and 0.315% any excess thereafter.
Prior to January 1, 2010, the fund paid Putnam Management for management and investment advisory services quarterly based on the average net assets of the fund. Such fee was based on the following annual rates: 0.57% of the first $500 million of average net assets, 0.475% of the next $500 million, 0.4275% of the next $500 million and 0.38% thereafter.
Effective August 1, 2009 through July 31, 2010, Putnam Management has contractually agreed to reimburse the fund’s expenses to the extent necessary to limit the cumulative expenses of the fund, exclusive of brokerage, interest, taxes, investment-related expenses, extraordinary expenses and payments under the fund’s investor servicing contract, investment management contract and distribution plans, on a fiscal year-to-date basis (or from August 1, 2009 through the fund’s next fiscal year end, as applicable), to an annual rate of 0.20% of the fund’s average net assets over such fiscal year-to-date period (or since August 1, 2009, as applicable). During the period ended March 31, 2010, the fund’s expenses were not reduced as a result of this limit.
Putnam Management has also contractually agreed, from August 1, 2009 through July 31, 2010, to limit the management fee for the fund to an annual rate of 0.412% of the fund’s average net assets. During the period ended March 31, 2010, the fund’s expenses were reduced by $292,296 as a result of this limit.
Effective January 30, 2010, Putnam Investments Limited (“PIL”), an affiliate of Putnam Management, is authorized by the Trustees to manage a separate portion of the assets of the fund as determined by Putnam Management from time to time. Putnam Management pays a quarterly sub-management fee to PIL for its services at an annual rate of 0.40% of the average net assets of the portion of the fund managed by PIL.
On September 15, 2008, the fund terminated its outstanding derivatives contracts with Lehman Brothers Special Financing, Inc. (“LBSF”) in connection with the bankruptcy filing of LBSF’s parent company, Lehman Brothers Holdings, Inc. On September 26, 2008, the fund entered into a receivable purchase agreement (“Agreement”) with another registered investment company (the “Seller”) managed by Putnam Management. Under the Agreement, the Seller sold to the fund the right to receive, in the aggregate, $2,002,118 in net payments from LBSF in connection with certain terminated derivatives transactions (the “Receivable”), in exchange for an initial payment plus (or minus) additional amounts based on the fund’s ultimate realized gain (or loss) with respect to the Receivable. The Receivable will be offset against the fund’s net payable to LBSF of $80,893,884 and is included in the Statement of assets and liab ilities in Payable for investments purchased. Future payments under the Agreement are valued at fair value following procedures approved by the Trustees and are included in the Statement of assets and liabilities. All remaining payments under the Agreement will be recorded as realized gain or loss. The fund’s net payable to LBSF was calculated in accordance with the fund’s master contract with LBSF. The fund has accrued interest on the net payable, which is included in the Statement of operations in Interest expense. Putnam Management currently is in discussions with LBSF regarding resolution of amounts payable to LBSF. Amounts recorded are estimates and final payments may differ from these estimates by a material amount.
The fund reimburses Putnam Management an allocated amount for the compensation and related expenses of certain officers of the fund and their staff who provide administrative services to the fund. The aggregate amount of all such reimbursements is determined annually by the Trustees.
Custodial functions for the fund’s assets are provided by State Street Bank and Trust Company (“State Street”).
Custody fees are based on the fund’s asset level, the number of its security holdings and transaction volumes.
Putnam Investor Services, Inc., an affiliate of Putnam Management, provided investor servicing agent functions to the fund. Putnam Investor Services, Inc. received fees for investor servicing, subject to certain limitations, based on the fund’s retail asset level, the number of shareholder accounts in the fund and the level of defined contribution plan assets in the fund. The amounts incurred for investor servicing agent functions during the six months ended March 31, 2010 are included in Investor servicing fees in the Statement of operations.
The fund has entered into expense offset arrangements with Putnam Investor Services, Inc. and State Street whereby Putnam Investor Services, Inc.’s and State Street’s fees are reduced by credits allowed on cash balances. For the six months ended March 31, 2010, the fund’s expenses were reduced by $5,689 under the expense offset arrangements.
Each independent Trustee of the fund receives an annual Trustee fee, of which $1,000, as a quarterly retainer, has been allocated to the fund, and an additional fee for each Trustees meeting attended. Trustees receive additional fees for attendance at certain committee meetings and industry seminars and for certain compliance-related matters. Trustees also are reimbursed for expenses they incur relating to their services as Trustees.
61
The fund has adopted a Trustee Fee Deferral Plan (the “Deferral Plan”) which allows the Trustees to defer the receipt of all or a portion of Trustees fees payable on or after July 1, 1995. The deferred fees remain invested in certain Putnam funds until distribution in accordance with the Deferral Plan.
The fund has adopted an unfunded noncontributory defined benefit pension plan (the “Pension Plan”) covering all Trustees of the fund who have served as a Trustee for at least five years and were first elected prior to 2004. Benefits under the Pension Plan are equal to 50% of the Trustee’s average annual attendance and retainer fees for the three years ended December 31, 2005. The retirement benefit is payable during a Trustee’s lifetime, beginning the year following retirement, for the number of years of service through December 31, 2006. Pension expense for the fund is included in Trustee compensation and expenses in the Statement of operations. Accrued pension liability is included in Payable for Trustee compensation and expenses in the Statement of assets and liabilities. The Trustees have terminated the Pension Plan with respect to any Trustee first elected after 2003.
The fund has adopted distribution plans (the “Plans”) with respect to its class A, class B, class C, class M and class R shares pursuant to Rule 12b-1 under the Investment Company Act of 1940. The purpose of the Plans is to compensate Putnam Retail Management Limited Partnership, a wholly-owned subsidiary of Putnam Investments, LLC and Putnam Retail Management GP, Inc., for services provided and expenses incurred in distributing shares of the fund. The Plans provide for payments by the fund to Putnam Retail Management Limited Partnership at an annual rate of up to 0.35%, 1.00%, 1.00%, 1.00% and 1.00% of the average net assets attributable to class A, class B, class C, class M and class R shares, respectively. The Trustees have approved payment by the fund at an annual rate of 0.25%, 1.00%, and 0.50% of the average net assets attributable to class A, class C and class R shares, respectively. For class B shares, the annual payment rate wil l equal the weighted average of (i) 0.85% on the assets of Putnam Limited Duration Government Income Fund attributable to class B shares existing on November 9, 2007; and (ii) 1.00% on all other class of Putnam U.S. Government Income Trust attributable to class B shares. For class M shares, the annual payment rate will equal the weighted average of (i) 0.40% on the net assets of Putnam Limited Duration Government Income Fund attributable to class M shares existing on November 9, 2007; and (ii) 0.50% on all other net assets of Putnam U.S. Government Income Trust attributable to class M shares.
For the six months ended March 31, 2010, Putnam Retail Management Limited Partnership, acting as underwriter, received net commissions of $113,291 and $5,438 from the sale of class A and class M shares, respectively, and received $17,535 and $9,142 in contingent deferred sales charges from redemptions of class B and class C shares, respectively.
A deferred sales charge of up to 1.00% and 0.40% is assessed on certain redemptions of class A and class M shares, respectively. For the six months ended March 31, 2010, Putnam Retail Management Limited Partnership, acting as underwriter, received $2,641 and no monies on class A and class M redemptions, respectively.
Note 3: Purchases and sales of securities
During the six months ended March 31, 2010, cost of purchases and proceeds from sales of U.S. government securities and agency obligations other than short-term investments aggregated $3,156,599,762 and $2,890,506,552, respectively.
Written option transactions during the period ended March 31, 2010 are summarized as follows:
| | |
| | Contract Amounts | Premiums Received |
|
| Written options outstanding | | |
| at beginning of period | $1,771,428,000 | $90,678,452 |
|
| Options opened | 392,808,000 | 15,857,846 |
|
| Written options outstanding | | |
| at end of period | $2,164,236,000 | $106,536,298 |
|
62
Note 4: Capital shares
At March 31, 2010, there was an unlimited number of shares of beneficial interest authorized. Transactions in capital shares were as follows:
| | | | |
| | Six months ended 3/31/10 | Year ended 9/30/09 |
|
| Class A | Shares | Amount | Shares | Amount |
|
| Shares sold | 8,268,244 | $123,585,634 | 12,016,952 | $155,636,783 |
|
| Shares issued in connection with | | | | |
| reinvestment of distributions | 1,828,861 | 27,248,048 | 3,165,171 | 41,148,936 |
|
| | 10,097,105 | 150,833,682 | 15,182,123 | 196,785,719 |
|
| Shares repurchased | (7,978,062) | (119,097,920) | (20,698,125) | (264,938,144) |
|
| Net increase (decrease) | 2,119,043 | $31,735,762 | (5,516,002) | $(68,152,425) |
|
| |
| | Six months ended 3/31/10 | Year ended 9/30/09 |
|
| Class B | Shares | Amount | Shares | Amount |
|
| Shares sold | 444,283 | $6,603,982 | 1,158,174 | $14,725,960 |
|
| Shares issued in connection with | | | | |
| reinvestment of distributions | 91,398 | 1,355,893 | 204,001 | 2,625,365 |
|
| | 535,681 | 7,959,875 | 1,362,175 | 17,351,325 |
|
| Shares repurchased | (1,245,613) | (18,518,166) | (3,408,850) | (43,592,655) |
|
| Net decrease | (709,932) | $(10,558,291) | (2,046,675) | $(26,241,330) |
|
| |
| | Six months ended 3/31/10 | Year ended 9/30/09 |
|
| Class C | Shares | Amount | Shares | Amount |
|
| Shares sold | 2,372,532 | $35,316,642 | 2,482,798 | $33,209,665 |
|
| Shares issued in connection with | | | | |
| reinvestment of distributions | 87,890 | 1,305,346 | 90,771 | 1,189,170 |
|
| | 2,460,422 | 36,621,988 | 2,573,569 | 34,398,835 |
|
| Shares repurchased | (571,403) | (8,509,124) | (1,024,447) | (13,367,776) |
|
| Net increase | 1,889,019 | $28,112,864 | 1,549,122 | $21,031,059 |
|
| |
| | Six months ended 3/31/10 | Year ended 9/30/09 |
|
| Class M | Shares | Amount | Shares | Amount |
|
| Shares sold | 191,837 | $2,878,218 | 201,378 | $2,617,999 |
|
| Shares issued in connection with | | | | |
| reinvestment of distributions | 14,576 | 217,279 | 25,245 | 327,718 |
|
| | 206,413 | 3,095,497 | 226,623 | 2,945,717 |
|
| Shares repurchased | (143,952) | (2,151,294) | (466,236) | (5,921,219) |
|
| Net increase (decrease) | 62,461 | $944,203 | (239,613) | $(2,975,502) |
|
| |
| | Six months ended 3/31/10 | Year ended 9/30/09 |
|
| Class R | Shares | Amount | Shares | Amount |
|
| Shares sold | 367,462 | $5,446,409 | 165,026 | $2,119,955 |
|
| Shares issued in connection with | | | | |
| reinvestment of distributions | 9,942 | 147,369 | 10,044 | 130,975 |
|
| | 377,404 | 5,593,778 | 175,070 | 2,250,930 |
|
| Shares repurchased | (64,503) | (957,720) | (114,190) | (1,444,590) |
|
| Net increase | 312,901 | $4,636,058 | 60,880 | $806,340 |
|
63
| | | | |
| | Six months ended 3/31/10 | Year ended 9/30/09 |
|
| Class Y | Shares | Amount | Shares | Amount |
|
| Shares sold | 2,032,567 | $30,141,339 | 539,213 | $7,435,807 |
|
| Shares issued in connection with | | | | |
| reinvestment of distributions | 32,025 | 474,755 | 45,658 | 590,260 |
|
| | 2,064,592 | 30,616,094 | 584,871 | 8,026,067 |
|
| Shares repurchased | (699,693) | (10,372,738) | (475,168) | (6,250,775) |
|
| Net increase | 1,364,899 | $20,243,356 | 109,703 | $1,775,292 |
|
Note 5: Summary of derivative activity
The following is a summary of the market values of derivative instruments as of March 31, 2010:
Market values of derivative instruments as of March 31, 2010
| | | | |
| | Asset derivatives | Liability derivatives |
|
| Derivatives not | | | | |
| accounted for as | Statement of | | Statement of | |
| hedging instruments | assets and | | assets and | |
| under ASC 815 | liabilities location | Market value | liabilities location | Market value |
|
| | Investments, Receivables, | | | |
| | Net assets — Unrealized | | Payables, Net assets — | |
| Interest rate | appreciation/ | | Unrealized appreciation/ | |
| contracts | (depreciation) | $51,716,738* | (depreciation) | $143,864,324* |
|
| Total | | $51,716,738 | | $143,864,324 |
|
* Includes cumulative appreciation/depreciation of futures contracts as reported in The fund’s portfolio. Only current day’s variation margin is reported within the Statement of assets and liabilities.
The following is a summary of realized and change in unrealized gains or losses of derivative instruments on the Statement of operations for the six months ended March 31, 2010 (see Note 1):
Amount of realized gain or (loss) on derivatives recognized in net gain or (loss) on investments
| | | | |
| Derivatives not | | | | |
| accounted for as | | | | |
| hedging instruments | | | | |
| under ASC 815 | Options | Futures | Swaps | Total |
|
| Interest rate contracts | $(12,657,838) | $(7,753,718) | $(38,281,056) | $(58,692,612) |
|
| Total | $(12,657,838) | $(7,753,718) | $(38,281,056) | $(58,692,612) |
|
Change in unrealized appreciation or (depreciation) on derivatives recognized in net gain or (loss) on investments
| | | | |
| Derivatives not | | | | |
| accounted for as | | | | |
| hedging instruments | | | | |
| under ASC 815 | Options | Futures | Swaps | Total |
|
| Interest rate contracts | $6,445,151 | $(3,542,783) | $50,491,690 | $53,394,058 |
|
| Total | $6,445,151 | $(3,542,783) | $50,491,690 | $53,394,058 |
|
64
Note 6: Investment in Putnam Money Market Liquidity Fund
The fund invested in Putnam Money Market Liquidity Fund, an open-end management investment company managed by Putnam Management. Investments in Putnam Money Market Liquidity Fund are valued at its closing net asset value each business day. Income distributions earned by the fund are recorded as interest income in the Statement of operations and totaled $201,228 for the period ended March 31, 2010. During the period ended March 31, 2010, cost of purchases and proceeds of sales of investments in Putnam Money Market Liquidity Fund aggregated $229,248,420 and $203,540,862, respectively. Management fees charged to Putnam Money Market Liquidity Fund have been waived by Putnam Management.
Note 7: Regulatory matters and litigation
In late 2003 and 2004, Putnam Management settled charges brought by the SEC and the Massachusetts Securities Division in connection with excessive short-term trading in Putnam funds. Distribution of payments from Putnam Management to certain open-end Putnam funds and their shareholders is expected to be completed in the next several months. These allegations and related matters have served as the general basis for certain lawsuits, including purported class action lawsuits against Putnam Management and, in a limited number of cases, some Putnam funds. Putnam Management believes that these lawsuits will have no material adverse effect on the funds or on Putnam Management’s ability to provide investment management services. In addition, Putnam Management has agreed to bear any costs incurred by the Putnam funds as a result of these matters.
Note 8: Market and credit risk
In the normal course of business, the fund trades financial instruments and enters into financial transactions where risk of potential loss exists due to changes in the market (market risk) or failure of the contracting party to the transaction to perform (credit risk). The fund may be exposed to additional credit risk that an institution or other entity with which the fund has unsettled or open transactions will default.
65
Shareholder meeting results (Unaudited)
November 19, 2009 meeting
At the meeting, each of the nominees for Trustee was elected, with all funds of the Trust voting together as single class, as follows:
| | |
| | Votes for | Votes withheld |
|
| Ravi Akhoury | 57,551,981 | 1,957,037 |
|
| Jameson A. Baxter | 57,657,018 | 1,852,000 |
|
| Charles B. Curtis | 57,645,219 | 1,863,799 |
|
| Robert J. Darretta | 57,668,569 | 1,840,449 |
|
| Myra R. Drucker | 57,660,789 | 1,848,229 |
|
| John A. Hill | 57,636,797 | 1,872,221 |
|
| Paul L. Joskow | 57,695,480 | 1,813,538 |
|
| Elizabeth T. Kennan | 57,652,732 | 1,856,286 |
|
| Kenneth R. Leibler | 57,654,485 | 1,854,533 |
|
| Robert E. Patterson | 57,650,614 | 1,858,404 |
|
| George Putnam, III | 57,656,836 | 1,852,182 |
|
| Robert L. Reynolds | 57,654,835 | 1,854,183 |
|
| W. Thomas Stephens | 57,668,456 | 1,840,562 |
|
| Richard B. Worley | 57,670,676 | 1,838,342 |
|
A proposal to approve a new management contract between the fund and Putnam Management was approved as follows:
| | | |
| Votes | Votes | | Broker |
| for | against | Abstentions | non-votes |
|
| 41,130,685 | 1,246,617 | 1,223,008 | 15,908,708 |
|
All tabulations are rounded to the nearest whole number.
66
The Putnam family of funds
The following is a list of Putnam’s open-end mutual funds offered to the public. Investors should carefully consider the investment objective, risks, charges, and expenses of a fund before investing. For a prospectus , or a summary prospectus if available, containing this and other information for any Putnam fund or product, call your financial advisor at 1-800-225-1581 and ask for a prospectus. Please read the prospectus carefully before investing.
Growth
Growth Opportunities Fund
International Growth Fund* **
New Opportunities Fund
Small Cap Growth Fund*
Vista Fund
Voyager Fund
Blend
Asia Pacific Equity Fund*
Capital Opportunities Fund*
Capital Spectrum Fund‡
Emerging Markets Equity Fund*
Equity Spectrum Fund‡
Europe Equity Fund*
Global Equity Fund*
Global Natural Resources Fund*
International Capital Opportunities Fund*
International Equity Fund*
Investors Fund
Research Fund
Value
Convertible Income-Growth Trust
Equity Income Fund
The George Putnam Fund of Boston
The Putnam Fund for Growth and Income
International Value Fund* ††
Mid Cap Value Fund
Small Cap Value Fund*
Income
American Government Income Fund
Diversified Income Trust
Floating Rate Income Fund
Global Income Trust*
High Yield Advantage Fund*
High Yield Trust*
Income Fund
Money Market Fund†
U.S. Government Income Trust
* A 1% redemption fee on total assets redeemed or exchanged within 90 days of purchase may be imposed for all share classes of these funds.
† An investment in a money market fund is not insured or guaranteed by the Federal Deposit Insurance Corporation or any other government agency. Although the fund seeks to preserve the value of your investment at $1.00 per share, it is possible to lose money by investing in the fund.
** Prior to January 1, 2010, the fund was known as Putnam International New Opportunities Fund.
†† Prior to January 1, 2010, the fund was known as Putnam International Growth and Income Fund.
67
Tax-free income
AMT-Free Municipal Fund
Tax Exempt Income Fund
Tax Exempt Money Market Fund†
Tax-Free High Yield Fund
State tax-free income funds:
Arizona, California, Massachusetts, Michigan, Minnesota, New Jersey, New York, Ohio, and Pennsylvania
Absolute Return
Absolute Return 100 Fund
Absolute Return 300 Fund
Absolute Return 500 Fund
Absolute Return 700 Fund
Global Sector*
Global Consumer Fund
Global Energy Fund
Global Financials Fund
Global Health Care Fund
Global Industrials Fund
Global Natural Resources Fund
Global Technology Fund
Global Telecommunications Fund
Global Utilities Fund
Asset allocation
Income Strategies Fund
Putnam Asset Allocation Funds — three investment portfolios that spread your money across a variety of stocks, bonds, and money market investments.
The three portfolios:
Asset Allocation: Balanced Portfolio
Asset Allocation: Conservative Portfolio
Asset Allocation: Growth Portfolio
Putnam RetirementReady®
Putnam RetirementReady Funds — 10 investment portfolios that offer diversification among stocks, bonds, and money market instruments and adjust to become more conservative over time based on a target date for withdrawing assets.
The 10 funds:
Putnam RetirementReady 2050 Fund
Putnam RetirementReady 2045 Fund
Putnam RetirementReady 2040 Fund
Putnam RetirementReady 2035 Fund
Putnam RetirementReady 2030 Fund
Putnam RetirementReady 2025 Fund
Putnam RetirementReady 2020 Fund
Putnam RetirementReady 2015 Fund
Putnam RetirementReady 2010 Fund
Putnam RetirementReady Maturity Fund
‡ A 1% redemption fee on total assets redeemed or exchanged within 30 days of purchase may be imposed for all share classes of these funds.
With the exception of money market funds, a 1% redemption fee may be applied to shares exchanged or sold within 7 days of purchase (90 days, for certain funds).
Check your account balances and the most recent month-end performance in the Individual Investors section at putnam.com.
68
Fund information
Founded over 70 years ago, Putnam Investments was built around the concept that a balance between risk and reward is the hallmark of a well-rounded financial program. We manage over 100 funds across income, value, blend, growth, asset allocation, absolute return, and global sector categories.
| | |
| Investment Manager | Robert E. Patterson | James P. Pappas |
| Putnam Investment | George Putnam, III | Vice President |
| Management, LLC | Robert L. Reynolds | |
| One Post Office Square | W. Thomas Stephens | Francis J. McNamara, III |
| Boston, MA 02109 | Richard B. Worley | Vice President and |
| | | Chief Legal Officer |
| Investment Sub-Manager | Officers | |
| Putnam Investments Limited | Robert L. Reynolds | Robert R. Leveille |
| 57–59 St James’s Street | President | Vice President and |
| London, England SW1A 1LD | | Chief Compliance Officer |
| | Jonathan S. Horwitz | |
| Marketing Services | Executive Vice President, | Mark C. Trenchard |
| Putnam Retail Management | Principal Executive | Vice President and |
| One Post Office Square | Officer, Treasurer and | BSA Compliance Officer |
| Boston, MA 02109 | Compliance Liaison | |
| | | Judith Cohen |
| Custodian | Charles E. Porter | Vice President, Clerk |
| State Street Bank | Senior Advisor to the Trustees | and Assistant Treasurer |
| and Trust Company | | |
| | Steven D. Krichmar | Wanda M. McManus |
| Legal Counsel | Vice President and | Vice President, Senior Associate |
| Ropes & Gray LLP | Principal Financial Officer | Treasurer and Assistant Clerk |
| | | |
| Trustees | Janet C. Smith | Nancy E. Florek |
| John A. Hill, Chairman | Vice President, Principal | Vice President, Assistant Clerk, |
| Jameson A. Baxter, | Accounting Officer and | Assistant Treasurer and |
| Vice Chairman | Assistant Treasurer | Proxy Manager |
| Ravi Akhoury | | |
| Charles B. Curtis | Susan G. Malloy | |
| Robert J. Darretta | Vice President and | |
| Myra R. Drucker | Assistant Treasurer | |
| Paul L. Joskow | | |
| Elizabeth T. Kennan | Beth S. Mazor | |
| Kenneth R. Leibler | Vice President | |
| | |
This report is for the information of shareholders of Putnam U.S. Government Income Trust. It may also be used as sales literature when preceded or accompanied by the current prospectus, the most recent copy of Putnam’s Quarterly Performance Summary, and Putnam’s Quarterly Ranking Summary. For more recent performance, please visit putnam.com. Investors should carefully consider the investment objective, risks, charges, and expenses of a fund, which are described in its prospectus. For this and other information or to request a prospectus, or a summary prospectus if available, call 1-800-225-1581 toll free. Please read the prospectus carefully before investing. The fund’s Statement of Additional Information contains additional information about the fund’s Trustees and is available without charge upon request by calling 1-800-225-1581.

Item 2. Code of Ethics:
Not applicable
Item 3. Audit Committee Financial Expert:
Not applicable
Item 4. Principal Accountant Fees and Services:
Not applicable
Item 5. Audit Committee of Listed Registrants
Not applicable
Item 6. Schedule of Investments:
The registrant’s schedule of investments in unaffiliated issuers is included in the report to shareholders in Item 1 above.
Item 7. Disclosure of Proxy Voting Policies and Procedures For Closed-End Management Investment Companies:
Not applicable
Item 8. Portfolio Managers of Closed-End Investment Companies
Not Applicable
Item 9. Purchases of Equity Securities by Closed-End Management Investment Companies and Affiliated Purchasers:
Not applicable
Item 10. Submission of Matters to a Vote of Security Holders:
Not applicable
Item 11. Controls and Procedures:
(a) The registrant's principal executive officer and principal financial officer have concluded, based on their evaluation of the effectiveness of the design and operation of the registrant's disclosure controls and procedures as of a date within 90 days of the filing date of this report, that the design and operation of such procedures are generally effective to provide reasonable assurance that information required to be disclosed by the registrant in this report is recorded, processed, summarized and reported within the time periods specified in the Commission's rules and forms.
(b) Changes in internal control over financial reporting: Not applicable
Item 12. Exhibits:
(a)(1) Not applicable
(a)(2) Separate certifications for the principal executive officer and principal financial officer of the registrant as required by Rule 30a-2(a) under the Investment Company Act of 1940, as amended, are filed herewith.
(b) The certifications required by Rule 30a-2(b) under the Investment Company Act of 1940, as amended, are filed herewith.
Putnam U.S. Government Income Trust
By (Signature and Title):
/s/Janet C. Smith
Janet C. Smith
Principal Accounting Officer
Date: May 28, 2010
Pursuant to the requirements of the Securities Exchange Act of 1934 and the Investment Company Act of 1940, this report has been signed below by the following persons on behalf of the registrant and in the capacities and on the dates indicated.
By (Signature and Title):
/s/Jonathan S. Horwitz
Jonathan S. Horwitz
Principal Executive Officer
Date: May 28, 2010
By (Signature and Title):
/s/Steven D. Krichmar
Steven D. Krichmar
Principal Financial Officer
Date: May 28, 2010