| | |
| UNITED STATES
SECURITIES AND EXCHANGE COMMISSION |
| | |
| CERTIFIED SHAREHOLDER REPORT OF REGISTERED
MANAGEMENT INVESTMENT COMPANIES
|
| | |
| Investment Company Act file number: | (811-03897) |
| | |
| Exact name of registrant as specified in charter: | Putnam Mortgage Securities Fund |
| | |
| Address of principal executive offices: | 100 Federal Street, Boston, Massachusetts 02110 |
| | |
| Name and address of agent for service: | Robert T. Burns, Vice President
100 Federal Street
Boston, Massachusetts 02110 |
| | |
| Copy to: | Bryan Chegwidden, Esq.
Ropes & Gray LLP
1211 Avenue of the Americas
New York, New York 10036 |
| | |
| Registrant’s telephone number, including area code: | (617) 292-1000 |
| | |
| Date of fiscal year end: | September 30, 2019 |
| | |
| Date of reporting period: | October 1, 2018 — March 31, 2019 |
| | |
|
Item 1. Report to Stockholders: | |
| | |
| The following is a copy of the report transmitted to stockholders pursuant to Rule 30e-1 under the Investment Company Act of 1940: | |

Putnam
Mortgage Securities
Fund
Semiannual report
3|31|19
IMPORTANT NOTICE: Delivery of paper fund reports
In accordance with regulations adopted by the Securities and Exchange Commission, beginning on January 1, 2021, reports like this one will no longer be sent by mail unless you specifically request it. Instead, they will be on Putnam’s website, and you will be notified by mail whenever a new one is available, and provided with a website link to access the report.
If you wish to stop receiving paper reports sooner, or if you wish to continue to receive paper reports free of charge after January 1, 2021, please see the back cover or insert for instructions. If you invest through a bank or broker, your choice will apply to all funds held in your account. If you invest directly with Putnam, your choice will apply to all Putnam funds in your account.
If you already receive these reports electronically, no action is required.
Message from the Trustees
May 7, 2019
Dear Fellow Shareholder:
If there is any lesson to be learned from constantly changing financial markets, it is the importance of positioning your investment portfolio for your long-term goals. We believe that one strategy is to diversify across different asset classes and investment approaches.
We also believe your mutual fund investment offers a number of advantages, including constant monitoring by experienced investment professionals who maintain a long-term perspective. Putnam’s portfolio managers and analysts take a research-intensive approach that includes risk management strategies designed to serve you through changing conditions.
Another key strategy, in our view, is seeking the counsel of a financial advisor. For over 80 years, Putnam has recognized the importance of professional investment advice. Your financial advisor can help in many ways, including defining and planning for goals such as retirement, evaluating the level of risk appropriate for you, and reviewing your investments on a regular basis and making adjustments as necessary.
As always, your fund’s Board of Trustees remains committed to protecting the interests of Putnam shareholders like you, and we thank you for investing with Putnam.

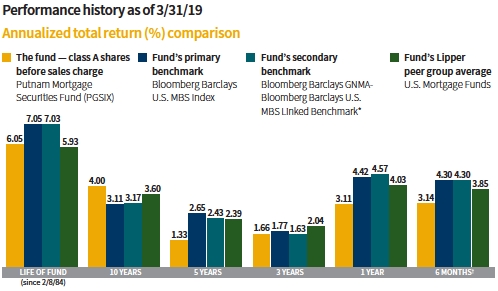
Current performance may be lower or higher than the quoted past performance, which cannot guarantee future results. Share price, principal value, and return will fluctuate, and you may have a gain or a loss when you sell your shares. Performance of class A shares assumes reinvestment of distributions and does not account for taxes. Fund returns in the bar chart do not reflect a sales charge of 4.00%; were they to, returns would be lower. See below and pages 8–9 for additional performance information. For a portion of the periods, the fund had expense limitations, without which returns would have been lower. To obtain the most recent month-end performance, visit putnam.com.
Before April 19, 2018, the fund was managed with a materially different investment strategy and may have achieved materially different performance results under its current investment strategy from those shown for periods before this date.
As of April 19, 2018, the Bloomberg Barclays U.S. MBS Index, an unmanaged index of agency mortgage backed pass-through securities (both fixed-rate and hybrid ARM) guaranteed by Ginnie Mae, Fannie Mae, and Freddie Mac, replaced the Bloomberg Barclays GNMA Index as the primary benchmark for this fund. In Putnam Investment Management, LLC’s opinion, the securities tracked by the Bloomberg Barclays U.S. MBS Index more accurately reflect the types of securities that generally will be held by the fund.
*The Bloomberg Barclays GNMA-Bloomberg Barclays U.S. MBS Linked Benchmark represents performance of the Bloomberg Barclays GNMA Index from inception date of the fund, February 8, 1984, through April 18, 2018, and performance of the Bloomberg Barclays U.S. MBS Index from April 19, 2018, and thereafter.
†Returns for the six-month period are not annualized, but cumulative.
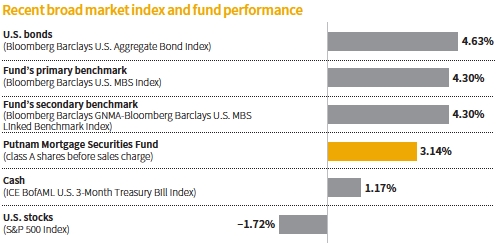
This comparison shows your fund’s performance in the context of broad market indexes for the six months ended 3/31/19. See above and pages 8–9 for additional fund performance information. Index descriptions can be found on page 14.
|
| 2 Mortgage Securities Fund |


Mike, what was the fund’s investment environment like during the reporting period?
The fourth quarter of 2018 and the first quarter of 2019 were mirror images of each other. Investor sentiment became sharply risk-averse during 2018’s fourth quarter and market volatility spiked. A variety of factors, including signs of a slowing global economy, the ongoing U.S.–China trade dispute, and ambiguous statements from U.S. Federal Reserve Chair Jerome Powell led to an abrupt downturn in risk assets. Within this environment, yields for credit-sensitive securities rose and yield spreads widened materially.
Sentiment then improved considerably in January and February, following comments from Mr. Powell that mild inflation would give the central bank greater flexibility to set policy in 2019. Market participants also welcomed Powell’s announcement that the Fed was not on a “pre-set” path to push its benchmark rate higher, after hiking rates every quarter in 2018. Progress in U.S.–China trade negotiations provided a further boost to sentiment across risk-driven markets.
|
| Mortgage Securities Fund 3 |
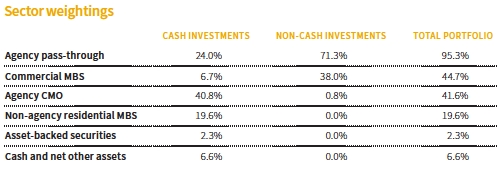
Allocations are shown as a percentage of the fund’s net assets as of 3/31/19. Cash and net other assets, if any, represent the market value weights of cash, derivatives, short-term securities, and other unclassified assets in the portfolio. Summary information may differ from the portfolio schedule included in the financial statements due to the inclusion of derivative securities, any interest accruals, the use of different classifications of securities for presentation purposes, and rounding. Allocations may not total 100% because the table includes the notional value (non-cash investments) of certain derivatives (the economic value for purposes of calculating periodic payment obligations), including to-be-announced (TBA) commitments, if any, in addition to the market value of securities. Holdings and allocations may vary over time.
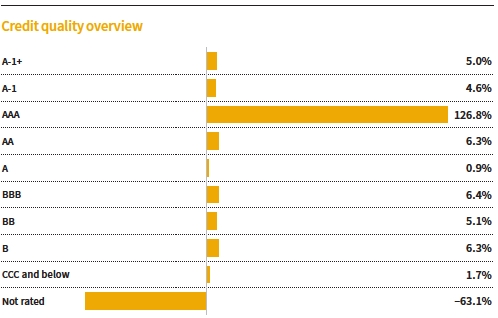
Credit qualities are shown as a percentage of the fund’s net assets as of 3/31/19. A bond rated BBB or higher (A-3 or higher, for short-term debt) is considered investment grade. This chart reflects the highest security rating provided by one or more of Standard & Poor’s, Moody’s, and Fitch. To-be-announced (TBA) mortgage commitments, if any, are included based on their issuer ratings. Ratings may vary over time.
Cash, derivative instruments, and net other assets are shown in the not-rated category. Payables and receivables for TBA mortgage commitments are included in the not-rated category and may result in negative weights. The fund itself has not been rated by an independent rating agency.
|
| 4 Mortgage Securities Fund |
The yield on the benchmark 10-year U.S. Treasury hit a seven-year high of 3.24% in early November 2018, then generally trended lower during the remainder of the period. After fluctuating in a fairly narrow range in January and February, bond yields around the world declined in March. Central banks signaled that they were willing to keep interest rates low for longer than investors were expecting. In large part, the moves were spurred by signs of slowing economic growth, particularly in the eurozone and China. In the United States, however, where growth remains relatively steady, the Fed’s argument for potentially delaying rate increases until next year has been strengthened by signs that inflationary pressures remain muted.
The fund lagged its primary and secondary benchmarks for the period. Which strategies hampered relative performance?
Strategies targeting prepayment risk were the primary detractor versus the benchmark. With the yield on the 10-year Treasury — a key benchmark for mortgage rates — moving lower during most of the period, investors became concerned that mortgages underlying various structured securities could be refinanced. This, in turn, increased expectations for faster prepayment speeds on the mortgages underlying our holdings of agency interest-only collateralized mortgage obligations [IO CMOs].
Adverse results from our “mortgage basis” positioning — a strategy that seeks to exploit the yield differential between current-coupon, 30-year agency pass-throughs and 30-year Treasuries — also worked against our prepayment strategies.
On the plus side, our holdings of reverse-mortgage interest-only securities modestly aided performance, as the mortgages underlying these securities are less sensitive to prepayment activity sparked by declining interest rates.

What about relative contributors?
Our mortgage-credit strategies were the primary contributors versus the benchmark. The fund’s exposure to commercial mortgage-backed securities [CMBS] via CMBX — an index that references a basket of CMBS issued in a particular year — rallied along with other risk-driven assets during the period’s second half. We maintained a substantial weighting in CMBX for much of the period.
Our legacy positions in non-agency residential mortgage-backed securities [RMBS], such as pay-option adjustable-rate MBS, slightly contributed. These bonds held up better than most other risk assets amid the selling pressure that dominated 2018’s fourth quarter, and then they also rebounded in 2019’s first quarter.
How did the fund’s interest-rate and yield-curve positioning fare during the period?
Our term-structure strategies also modestly contributed versus the benchmark. Our strategies benefited from the tactical approach we took toward duration positioning during the period, as well as our positioning for a flatter U.S. Treasury yield curve.
How did you use derivatives during the period?
We used total return swaps to gain exposure to CMBS via CMBX. We used interest-rate swaps and options to hedge the risks inherent in the fund’s duration and yield-curve positioning, to isolate the prepayment risk associated with our CMO holdings, and to help manage overall downside risk. We also employed futures to help manage the fund’s yield-curve strategies. Lastly, we used credit default swaps to hedge
|
| Mortgage Securities Fund 5 |
the fund’s sector exposures and to gain access to specific areas of the market.
What areas of the market do you find to be most attractive?
We continue to have a generally favorable outlook for mortgage credit. We think the underlying fundamentals for commercial real estate appear stable, supported by a growing labor market, interest rates that remain historically low, and a positive U.S. economic backdrop. That said, we think these favorable factors will be partially offset by higher capital costs and low capitalization rates. [Capitalization rate is the rate of return on a commercial investment property based on the income that the property is expected to generate. It is calculated by dividing the property’s net operating income by its purchase price.]
In terms of CMBS security selection, we have been focusing on mezzanine tranches rated A, BBB-, and BB that were issued between 2011 and 2014. We also plan to maintain select positions in pre-2008 mezzanine tranches that have less price sensitivity to changes in yield spreads. We have increased the fund’s exposure to CMBX, rather than cash bonds, believingthat the negative sentiment toward the retail industry reflected in the index provided an attractive entry point. Moreover, we think the index offers sufficient protection, even at the BBB-rated level, should the outlook for retail become more problematic. We have been avoiding mezzanine securities issued in 2015 or later.
As for residential MBS, we think the combination of low housing supply and increasing rates of household formation and home ownership has created a supportive fundamental backdrop for the residential real estate market.
Within this market, we continue to find value among legacy RMBS, where we think a steadily shrinking sector and stable investor base has produced a favorable technical environment. We like securities backed by higher-quality collateral, as well as bonds from what we consider to be more favorable regions of the country.
In the agency credit-risk transfer [CRT] security market, we are focusing on opportunities among securities that have a few years of seasoning rather than newly issued CRTs, as we think this area of the market offers a more favorable risk/reward profile.
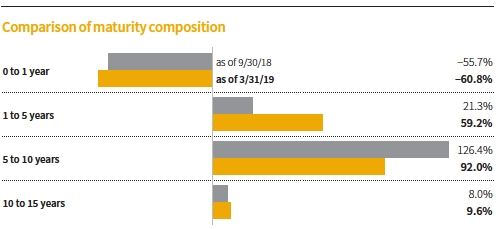
This chart illustrates the fund’s composition by maturity, showing the percentage of holdings in different maturity ranges and how the composition has changed over the past six months. Holdings and maturity ranges may vary over time. A negative number represents cash to be allocated to to-be-announced (TBA) agency pass-through mortgage-backed securities, which the fund has agreed to purchase.
|
| 6 Mortgage Securities Fund |
Within prepayment-sensitive areas of the market, range-bound Treasury yields have made prepayment speeds more predictable overall, in our view. Yield spreads look reasonable, although spreads on newer loans have generally tightened. Security selection has become more important, and we are focusing on reverse mortgages, jumbo loan balances, and seasoned collateral.
Thanks for your time and for bringing us up to date, Mike.
The views expressed in this report are exclusively those of Putnam Management and are subject to change. They are not meant as investment advice.
Please note that the holdings discussed in this report may not have been held by the fund for the entire period. Portfolio composition is subject to review in accordance with the fund’s investment strategy and may vary in the future. Current and future portfolio holdings are subject to risk. Statements in the Q&A concerning the fund’s performance or portfolio composition relative to those of the fund’s Lipper peer group may reference information produced by Lipper Inc. or through a third party.
Of special interest
The fund’s dividend rate per class A share increased to $0.049 in November 2018 due to an increase in income generated by the portfolio. Similar increases were made to other share classes.
ABOUT DERIVATIVES
Derivatives are an increasingly common type of investment instrument, the performance of which isderivedfrom an underlying security, index, currency, or other area of the capital markets. Derivatives employed by the fund’s managers generally serve one of two main purposes: to implement a strategy that may be difficult or more expensive to invest in through traditional securities, or to hedge unwanted risk associated with a particular position.
For example, the fund’s managers might use currency forward contracts to capitalize on an anticipated change in exchange rates between two currencies. This approach would require a significantly smaller outlay of capital than purchasing traditional bonds denominated in the underlying currencies. In another example, the managers may identify a bond that they believe is undervalued relative to its risk of default, but may seek to reduce the interest-rate risk of that bond by using interest-rate swaps, a derivative through which two parties “swap” payments based on the movement of certain rates.
Like any other investment, derivatives may not appreciate in value and may lose money. Derivatives may amplify traditional investment risks through the creation of leverage and may be less liquid than traditional securities. And because derivatives typically represent contractual agreements between two financial institutions, derivatives entail “counterparty risk,” which is the risk that the other party is unable or unwilling to pay. Putnam monitors the counterparty risks we assume. For example, Putnam often enters into collateral agreements that require the counterparties to post collateral on a regular basis to cover their obligations to the fund. Counterparty risk for exchange-traded futures and centrally cleared swaps is mitigated by the daily exchange of margin and other safeguards against default through their respective clearinghouses.
|
| Mortgage Securities Fund 7 |
Your fund’s performance
This section shows your fund’s performance, price, and distribution information for periods ended March 31, 2019, the end of the first half of its current fiscal year. In accordance with regulatory requirements for mutual funds, we also include expense information taken from the fund’s current prospectus. Performance should always be considered in light of a fund’s investment strategy. Data represent past performance. Past performance does not guarantee future results. More recent returns may be less or more than those shown. Investment return and principal value will fluctuate, and you may have a gain or a loss when you sell your shares. Performance information does not reflect any deduction for taxes a shareholder may owe on fund distributions or on the redemption of fund shares. For the most recent month-end performance, please visit the Individual Investors section at putnam.com or call Putnam at 1-800-225-1581. Class R, R6, and Y shares are not available to all investors. See the Terms and definitions section in this report for definitions of the share classes offered by your fund.
Fund performanceTotal return for periods ended 3/31/19
| | | | | | | | | |
| | Annual | | | | | | | | |
| | average | | Annual | | Annual | | Annual | | |
| | (life of fund) | 10 years | average | 5 years | average | 3 years | average | 1 year | 6 months |
| Class A(2/8/84) | | | | | | | | | |
| Before sales charge | 6.05% | 47.97% | 4.00% | 6.83% | 1.33% | 5.05% | 1.66% | 3.11% | 3.14% |
| After sales charge | 5.92 | 42.05 | 3.57 | 2.55 | 0.51 | 0.85 | 0.28 | –1.01 | –0.98 |
| Class B(4/27/92) | | | | | | | | | |
| Before CDSC | 5.82 | 39.73 | 3.40 | 3.03 | 0.60 | 2.83 | 0.94 | 2.35 | 2.78 |
| After CDSC | 5.82 | 39.73 | 3.40 | 1.19 | 0.24 | –0.01 | 0.00 | –2.59 | –2.22 |
| Class C(7/26/99) | | | | | | | | | |
| Before CDSC | 5.82 | 36.78 | 3.18 | 2.90 | 0.57 | 2.80 | 0.92 | 2.34 | 2.79 |
| After CDSC | 5.82 | 36.78 | 3.18 | 2.90 | 0.57 | 2.80 | 0.92 | 1.35 | 1.79 |
| Class M(2/6/95) | | | | | | | | | |
| Before sales charge | 5.75 | 44.95 | 3.78 | 5.57 | 1.09 | 4.38 | 1.44 | 2.92 | 3.09 |
| After sales charge | 5.65 | 40.24 | 3.44 | 2.14 | 0.42 | 0.99 | 0.33 | –0.42 | –0.26 |
| Class R(1/21/03) | | | | | | | | | |
| Net asset value | 5.76 | 44.01 | 3.71 | 5.56 | 1.09 | 4.35 | 1.43 | 2.88 | 3.14 |
| Class R6(4/20/18) | | | | | | | | | |
| Net asset value | 6.23 | 51.75 | 4.26 | 8.40 | 1.63 | 6.10 | 1.99 | 3.53 | 3.38 |
| Class Y(4/11/94) | | | | | | | | | |
| Net asset value | 6.23 | 51.56 | 4.25 | 8.26 | 1.60 | 5.96 | 1.95 | 3.40 | 3.38 |
Current performance may be lower or higher than the quoted past performance, which cannot guarantee future results. After-sales-charge returns for class A and M shares reflect the deduction of the maximum 4.00% and 3.25% sales charge, respectively, levied at the time of purchase. Class B share returns after contingent deferred sales charge (CDSC) reflect the applicable CDSC, which is 5% in the first year, declining over time to 1% in the sixth year, and is eliminated thereafter. Class C share returns after CDSC reflect a 1% CDSC for the first year that is eliminated thereafter.Class R, R6, and Y shares have no initial sales charge or CDSC. Performance for class B, C, M, R, and Y shares before their inception is derived from the historical performance of class A shares, adjusted for the applicable sales charge (or CDSC) and the higher operating expenses for such shares, except for class Y shares, for which 12b-1 fees are not applicable. Performance for class R6 shares prior to their inception is derived from the historical performance of class Y shares and has not been adjusted for the lower investor servicing fees applicable to class R6 shares; had it, returns would have been higher.
For a portion of the periods, the fund had expense limitations, without which returns would have been lower.
|
| 8 Mortgage Securities Fund |
Before April 19, 2018, the fund was managed with a materially different investment strategy and may have achieved materially different performance results under its current investment strategy from that shown for periods before this date.
Class B share performance reflects conversion to class A shares after eight years.
Class C share performance reflects conversion to class A shares after 10 years.
Comparative index returnsFor periods ended 3/31/19
| | | | | | | | | |
| | Annual | | | | | | | | |
| | average | | Annual | | Annual | | Annual | | |
| | (life of fund) | 10 years | average | 5 years | average | 3 years | average | 1 year | 6 months |
| Bloomberg Barclays | | | | | | | | | |
| U.S. MBS Index | 7.05% | 35.79% | 3.11% | 13.95% | 2.65% | 5.42% | 1.77% | 4.42% | 4.30% |
| Bloomberg Barclays | | | | | | | | | |
| GNMA-Bloomberg | | | | | | | | | |
| Barclays U.S. MBS | 7.03 | 36.62 | 3.17 | 12.76 | 2.43 | 4.96 | 1.63 | 4.57 | 4.30 |
| Linked Benchmark* | | | | | | | | | |
| Lipper U.S. Mortgage | | | | | | | | | |
| Funds category | 5.93 | 43.18 | 3.60 | 12.58 | 2.39 | 6.30 | 2.04 | 4.03 | 3.85 |
| average† | | | | | | | | | |
Index and Lipper results should be compared with fund performance before sales charge, before CDSC, or at net asset value.
As of April 19, 2018, the Bloomberg Barclays U.S. MBS Index, an unmanaged index of agency mortgage backed pass-through securities (both fixed-rate and hybrid ARM) guaranteed by Ginnie Mae, Fannie Mae, and Freddie Mac, replaced the Bloomberg Barclays GNMA Index as the primary benchmark for this fund. In Putnam Investment Management, LLC’s opinion, the securities tracked by the Bloomberg Barclays U.S. MBS Index more accurately reflect the types of securities that generally will be held by the fund.
*The Bloomberg Barclays GNMA-Bloomberg Barclays U.S. MBS Linked Benchmark represents performance of the Bloomberg Barclays GNMA Index from inception date of the fund, February 8, 1984, through April 18, 2018, and performance of the Bloomberg Barclays U.S. MBS Index from April 19, 2018, and thereafter.
†Over the 6-month, 1-year, 3-year, 5-year, 10-year, and life-of-fund periods ended 3/31/19, there were 129, 119, 111, 94, 71, and 3 funds, respectively, in this Lipper category.
|
| Mortgage Securities Fund 9 |
Fund price and distribution informationFor the six-month period ended 3/31/19
| | | | | | | | | |
| Distributions | Class A | Class B | Class C | Class M | Class R | Class R6 | Class Y |
| Number | 6 | 6 | 6 | 6 | 6 | 6 | 6 |
| Income | $0.291 | $0.246 | $0.245 | $0.277 | $0.276 | $0.315 | $0.305 |
| Capital gains | — | — | — | — | — | — | — |
| Total | $0.291 | $0.246 | $0.245 | $0.277 | $0.276 | $0.315 | $0.305 |
| | Before | After | Net | Net | Before | After | Net | Net | Net |
| | sales | sales | asset | asset | sales | sales | asset | asset | asset |
| Share value | charge | charge | value | value | charge | charge | value | value | value |
| 9/30/18 | $12.37 | $12.89 | $12.31 | $12.25 | $12.43 | $12.85 | $12.23 | $12.24 | $12.23 |
| 3/31/19 | 12.46 | 12.98 | 12.40 | 12.34 | 12.53 | 12.95 | 12.33 | 12.33 | 12.33 |
| | Before | After | Net | Net | Before | After | Net | Net | Net |
| Current rate | sales | sales | asset | asset | sales | sales | asset | asset | asset |
| (end of period) | charge | charge | value | value | charge | charge | value | value | value |
| Current dividend | | | | | | | | | |
| rate1 | 4.72% | 4.53% | 3.97% | 3.99% | 4.50% | 4.36% | 4.57% | 5.16% | 4.96% |
| Current 30-day | | | | | | | | | |
| SEC yield | | | | | | | | | |
| (with expense | | | | | | | | | |
| limitation)2,3 | N/A | 4.52 | 3.97 | 3.96 | N/A | 4.41 | 4.46 | 5.11 | 4.96 |
| Current 30-day | | | | | | | | | |
| SEC yield | | | | | | | | | |
| (without expense | | | | | | | | | |
| limitation)3 | N/A | 4.37 | 3.81 | 3.80 | N/A | 4.26 | 4.30 | 4.95 | 4.80 |
The classification of distributions, if any, is an estimate. Before-sales-charge share value and current dividend rate for class A and M shares, if applicable, do not take into account any sales charge levied at the time of purchase. After-sales-charge share value, current dividend rate, and current 30-day SEC yield, if applicable, are calculated assuming that the maximum sales charge (4.00% for class A shares and 3.25% for class M shares) was levied at the time of purchase. Final distribution information will appear on your year-end tax forms.
1Most recent distribution, including any return of capital and excluding capital gains, annualized and divided by share price before or after sales charge at period-end.
2For a portion of the period, the fund had expense limitations, without which yields would have been lower.
3Based only on investment income and calculated using the maximum offering price for each share class, in accordance with SEC guidelines.
|
| 10 Mortgage Securities Fund |
Your fund’s expenses
As a mutual fund investor, you pay ongoing expenses, such as management fees, distribution fees (12b-1 fees), and other expenses. In the most recent six-month period, your fund’s expenses were limited; had expenses not been limited, they would have been higher. Using the following information, you can estimate how these expenses affect your investment and compare them with the expenses of other funds. You may also pay one-time transaction expenses, including sales charges (loads) and redemption fees, which are not shown in this section and would have resulted in higher total expenses. For more information, see your fund’s prospectus or talk to your financial representative.
Expense ratios
| | | | | | | |
| | Class A | Class B | Class C | Class M | Class R | Class R6 | Class Y |
| Net expenses for the fiscal year | | | | | | | |
| ended 9/30/18* | 0.75%† | 1.50%† | 1.50%† | 0.99%† | 1.00%† | 0.37%‡ | 0.50%† |
| Total annual operating expenses for the | | | | | | | |
| fiscal year ended 9/30/18 | 0.94%† | 1.69%† | 1.69%† | 1.18%† | 1.19%† | 0.56%‡ | 0.69%† |
| Annualized expense ratio for the | | | | | | | |
| six-month period ended 3/31/19 | 0.76% | 1.49% | 1.51% | 1.00% | 1.01% | 0.37% | 0.51% |
Fiscal-year expense information in this table is taken from the most recent prospectus, is subject to change, and may differ from that shown for the annualized expense ratio and in the financial highlights of this report.
Expenses are shown as a percentage of average net assets.
*Reflects Putnam Management’s contractual obligation to limit certain fund expenses through 1/30/20.
†Restated to reflect current fees.
‡Other expenses are based on expenses of class A shares for the fund’s last fiscal year, restated to reflect current fees and adjusted to reflect lower investor servicing fees applicable to Class R6 shares.
Expenses per $1,000
The following table shows the expenses you would have paid on a $1,000 investment in each class of the fund from 10/1/18 to 3/31/19. It also shows how much a $1,000 investment would be worth at the close of the period, assumingactual returnsand expenses.
| | | | | | | |
| | Class A | Class B | Class C | Class M | Class R | Class R6 | Class Y |
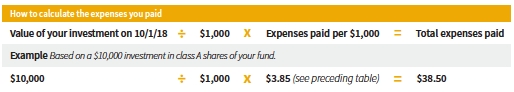
| Expenses paid per $1,000*† | $3.85 | $7.53 | $7.63 | $5.06 | $5.12 | $1.88 | $2.59 |
| Ending value (after expenses) | $1,031.40 | $1,027.80 | $1,027.90 | $1,030.90 | $1,031.40 | $1,033.80 | $1,033.80 |
*Expenses for each share class are calculated using the fund’s annualized expense ratio for each class, which represents the ongoing expenses as a percentage of average net assets for the six months ended 3/31/19. The expense ratio may differ for each share class.
†Expenses are calculated by multiplying the expense ratio by the average account value for the period; then multiplying the result by the number of days in the period; and then dividing that result by the number of days in the year.
Estimate the expenses you paid
To estimate the ongoing expenses you paid for the six months ended 3/31/19, use the following calculation method. To find the value of your investment on 10/1/18, call Putnam at 1-800-225-1581.
|
| Mortgage Securities Fund 11 |
Compare expenses using the SEC’s method
The Securities and Exchange Commission (SEC) has established guidelines to help investors assess fund expenses. Per these guidelines, the following table shows your fund’s expenses based on a $1,000 investment, assuming ahypothetical 5% annualized return. You can use this information to compare the ongoing expenses (but not transaction expenses or total costs) of investing in the fund with those of other funds. All mutual fund shareholder reports will provide this information to help you make this comparison. Please note that you cannot use this information to estimate your actual ending account balance and expenses paid during the period.
| | | | | | | |
| | Class A | Class B | Class C | Class M | Class R | Class R6 | Class Y |
| Expenses paid per $1,000*† | $3.83 | $7.49 | $7.59 | $5.04 | $5.09 | $1.87 | $2.57 |
| Ending value (after expenses) | $1,021.14 | $1,017.50 | $1,017.40 | $1,019.95 | $1,019.90 | $1,023.09 | $1,022.39 |
*Expenses for each share class are calculated using the fund’s annualized expense ratio for each class, which represents the ongoing expenses as a percentage of average net assets for the six months ended 3/31/19. The expense ratio may differ for each share class.
†Expenses are calculated by multiplying the expense ratio by the average account value for the six-month period; then multiplying the result by the number of days in the six-month period; and then dividing that result by the number of days in the year.
Consider these risks before investing
Funds that invest in government securities are not guaranteed. Mortgage- and asset-backed securities are subject to prepayment risk, which means that they may increase in value less than other bonds when interest rates decline and decline in value more than other bonds when interest rates rise. The fund may have to invest the proceeds from prepaid investments, including mortgage- and asset-backed investments, in other investments with less attractive terms and yields. The fund’s investments in mortgage-backed securities and asset-backed securities, and in certain other securities and derivatives, may be or become illiquid. The fund’s exposure to privately issued mortgage-backed securities and mortgage-backed securities issued or guaranteed by the U.S. government or its agencies or instrumentalities may make the fund’s net asset value more susceptible to economic, market, political and other developments affecting the housing or real estate markets. Bond investments are subject to interest-rate risk (the risk of bond prices falling if interest rates rise) and credit risk (the risk of an issuer defaulting on interest or principal payments). Interest-rate risk is generally greater for longer-term bonds, and credit risk is generally greater for below-investment-grade bonds. Default risk is generally higher for non-qualified mortgages. Risks associated with derivatives include increased investment exposure (which may be considered leverage) and, in the case of over-the-counter instruments, the potential inability to terminate or sell derivatives positions and the potential failure of the other party to the instrument to meet its obligations. Unlike bonds, funds that invest in bonds have fees and expenses. The value of investments in the fund’s portfolio may fall or fail to rise over extended periods of time for a variety of reasons, including general economic, political or financial market conditions, investor sentiment and market perceptions, government actions, geopolitical events or changes, and factors related to a specific issuer, geography (such as a region of the United States), industry or sector, such as the housing or real estate markets. These and other factors may lead to increased volatility and reduced liquidity in the fund’s portfolio holdings or in relevant markets. You can lose money by investing in the fund.
|
| 12 Mortgage Securities Fund |
Terms and definitions
Important terms
Total returnshows how the value of the fund’s shares changed over time, assuming you held the shares through the entire period and reinvested all distributions in the fund.
Before sales charge, or net asset value, is the price, or value, of one share of a mutual fund, without a sales charge. Before-sales-charge figures fluctuate with market conditions, and are calculated by dividing the net assets of each class of shares by the number of outstanding shares in the class.
After sales chargeis the price of a mutual fund share plus the maximum sales charge levied at the time of purchase. After-sales-charge performance figures shown here assume the 4.00% maximum sales charge for class A shares and 3.25% for class M shares.
Contingent deferred sales charge (CDSC)is generally a charge applied at the time of the redemption of class B or C shares and assumes redemption at the end of the period. Your fund’s class B CDSC declines over time from a 5% maximum during the first year to 1% during the sixth year. After the sixth year, the CDSC no longer applies. The CDSC for class C shares is 1% for one year after purchase.
Share classes
Class A sharesare generally subject to an initial sales charge and no CDSC (except on certain redemptions of shares bought without an initial sales charge).
Class B sharesare closed to new investments and are only available by exchange from another Putnam fund or through dividend and/or capital gains reinvestment. They are not subject to an initial sales charge and may be subject to a CDSC.
Class C sharesare not subject to an initial sales charge and are subject to a CDSC only if the shares are redeemed during the first year.
Class M shareshave a lower initial sales charge and a higher 12b-1 fee than class A shares and no CDSC.
Class R sharesare not subject to an initial sales charge or CDSC and are only available to employer-sponsored retirement plans.
Class R6 sharesare not subject to an initial sales charge or CDSC and carry no 12b-1 fee. They are generally only available to employer-sponsored retirement plans, corporate and institutional clients, and clients in other approved programs.
Class Y sharesare not subject to an initial sales charge or CDSC and carry no 12b-1 fee. They are generally only available to corporate and institutional clients and clients in other approved programs.
Fixed-income terms
Current rateis the annual rate of return earned from dividends or interest of an investment. Current rate is expressed as a percentage of the price of a security, fund share, or principal investment.
Mortgage-backed security (MBS), also known as a mortgage “pass-through,” is a type of asset-backed security that is secured by a mortgage or collection of mortgages. The following are types of MBSs:
•Agency credit-risk transfer security (CRT)is backed by a reference pool of agency mortgages. Unlike a regular agency pass-through, the principal invested in a CRT is not backed by a U.S. government agency. To compensate investors for this risk, a CRT typically offers a higher yield than conventional pass-through securities. Similar to a CMBS, a CRT is structured into various tranches for investors, offering different levels of risk and yield based on the underlying reference pool.
•Agency “pass-through”has its principal and interest backed by a U.S. government
|
| Mortgage Securities Fund 13 |
agency, such as the Federal National Mortgage Association (Fannie Mae), Government National Mortgage Association (Ginnie Mae), and Federal Home Loan Mortgage Corporation (Freddie Mac).
•Collateralized mortgage obligation (CMO)represents claims to specific cash flows from pools of home mortgages. The streams of principal and interest payments on the mortgages are distributed to the different classes of CMO interests in “tranches.” Each tranche may have different principal balances, coupon rates, prepayment risks, and maturity dates. A CMO is highly sensitive to changes in interest rates and any resulting change in the rate at which homeowners sell their properties, refinance, or otherwise prepay loans. CMOs are subject to prepayment, market, and liquidity risks.
°Interest-only (IO) securityis a type of CMO in which the underlying asset is the interest portion of mortgage, Treasury, or bond payments.
•Non-agency residential mortgage-backed security (RMBS)is an MBS not backed by Fannie Mae, Ginnie Mae, or Freddie Mac. One type of RMBS is an Alt-A mortgage-backed security.
•Commercial mortgage-backed security (CMBS)is secured by the loan on a commercial property.
•CMBS mezzanine tranchesare securities positioned between a senior tranche (mostly rated AAA) and a subordinated tranche (unrated, typically called an equity tranche). The mezzanine tranches are typically rated between AA and B because they are more exposed to credit risk than the senior tranches, and thus generally carry a higher yield.
Yield curveis a graph that plots the yields of bonds with equal credit quality against their differing maturity dates, ranging from shortest to longest. It is used as a benchmark for other debt, such as mortgage or bank lending rates.
Comparative indexes
Bloomberg Barclays GNMA Indexis an unmanaged index of Government National Mortgage Association bonds.
Bloomberg Barclays U.S. Aggregate Bond Indexis an unmanaged index of U.S. investment-grade fixed-income securities.
Bloomberg Barclays U.S. MBS Indexis an unmanaged index of agency mortgage-backed pass-through securities guaranteed by Ginnie Mae (GNMA), Fannie Mae (FNMA), and Freddie Mac (FHLMC).
CMBX Indextracks the performance of a basket of CMBS issued in a particular year.
ICE BofAML (Intercontinental Exchange Bank of America Merrill Lynch) U.S. 3-Month Treasury Bill Indexis an unmanaged index that seeks to measure the performance of U.S.Treasury bills available in the marketplace.
S&P 500 Indexis an unmanaged index of common stock performance.
Indexes assume reinvestment of all distributions and do not account for fees. Securities and performance of a fund and an index will differ. You cannot invest directly in an index.
ICE Data Indices, LLC (“ICE BofAML”), used with permission. ICE BofAML permits use of the ICE BofAML indices and related data on an “as is” basis; makes no warranties regarding same; does not guarantee the suitability, quality, accuracy, timeliness, and/or completeness of the ICE BofAML indices or any data included in, related to, or derived therefrom; assumes no liability in connection with the use of the foregoing; and does not sponsor, endorse, or recommend Putnam Investments, or any of its products or services.
Lipperis a third-party industry-ranking entity that ranks mutual funds. Its rankings do not reflect sales charges. Lipper rankings are based on total return at net asset value relative to other funds that have similar current investment styles or objectives as determined by Lipper. Lipper may change a fund’s category assignment at its discretion. Lipper category averages reflect performance trends for funds within a category.
|
| 14 Mortgage Securities Fund |
Other information for shareholders
Important notice regarding delivery of shareholder documents
In accordance with Securities and Exchange Commission (SEC) regulations, Putnam sends a single copy of annual and semiannual shareholder reports, prospectuses, and proxy statements to Putnam shareholders who share the same address, unless a shareholder requests otherwise. If you prefer to receive your own copy of these documents, please call Putnam at 1-800-225-1581, and Putnam will begin sending individual copies within 30 days.
Proxy voting
Putnam is committed to managing our mutual funds in the best interests of our shareholders. The Putnam funds’ proxy voting guidelines and procedures, as well as information regarding how your fund voted proxies relating to portfolio securities during the 12-month period ended June 30, 2018, are available in the Individual Investors section of putnam.com and on the SEC’s website, www.sec.gov. If you have questions about finding forms on the SEC’s website, you may call the SEC at1-800-SEC-0330. You may also obtain the Putnam funds’ proxy voting guidelines and procedures at no charge by calling Putnam’s Shareholder Services at 1-800-225-1581.
Fund portfolio holdings
The fund will file a complete schedule of its portfolio holdings with the SEC for the first and third quarters of each fiscal year on Form N-Q. Shareholders may obtain the fund’s Form N-Q on the SEC’s website at www.sec.gov.
Trustee and employee fund ownership
Putnam employees and members of the Board of Trustees place their faith, confidence, and, most importantly, investment dollars in Putnam mutual funds. As of March 31, 2019, Putnam employees had approximately $496,000,000 and the Trustees had approximately $69,000,000 invested in Putnam mutual funds. These amounts include investments by the Trustees’ and employees’ immediate family members as well as investments through retirement and deferred compensation plans.
|
| Mortgage Securities Fund 15 |
Financial statements
These sections of the report, as well as the accompanying Notes, constitute the fund’s financial statements.
The fund’s portfoliolists all the fund’s investments and their values as of the last day of the reporting period. Holdings are organized by asset type and industry sector, country, or state to show areas of concentration and diversification.
Statement of assets and liabilitiesshows how the fund’s net assets and share price are determined. All investment and non-investment assets are added together. Any unpaid expenses and other liabilities are subtracted from this total. The result is divided by the number of shares to determine the net asset value per share, which is calculated separately for each class of shares. (For funds with preferred shares, the amount subtracted from total assets includes the liquidation preference of preferred shares.)
Statement of operationsshows the fund’s net investment gain or loss. This is done by first adding up all the fund’s earnings — from dividends and interest income — and subtracting its operating expenses to determine net investment income (or loss). Then, any net gain or loss the fund realized on the sales of its holdings — as well as any unrealized gains or losses over the period — is added toor subtracted from the net investment result to determine the fund’s net gain or loss for the fiscal period.
Statement of changes in net assetsshows how the fund’s net assets were affected by the fund’s net investment gain or loss, by distributions to shareholders, and by changes in the number of the fund’s shares. It lists distributions and their sources (net investment income or realized capital gains) over the current reporting period and the most recent fiscal year-end. The distributions listed here may not match the sources listed in the Statement of operations because the distributions are determined on a tax basis and may be paid in a different period from the one in which they were earned. Dividend sources are estimated at the time of declaration. Actual results may vary. Any non-taxable return of capital cannot be determined until final tax calculations are completed after the end of the fund’s fiscal year.
Financial highlightsprovide an overview of the fund’s investment results, per-share distributions, expense ratios, net investment income ratios, and portfolio turnover in one summary table, reflecting the five most recent reporting periods. In a semiannual report, the highlights table also includes the current reporting period.
|
| 16 Mortgage Securities Fund |
The fund’s portfolio3/31/19 (Unaudited)
| | |
| U.S. GOVERNMENT AND AGENCY | Principal | |
| MORTGAGE OBLIGATIONS (106.1%)* | amount | Value |
| U.S. Government Guaranteed Mortgage Obligations (52.2%) | | |
| Government National Mortgage Association Adjustable Rate Mortgages | | |
| (1 Yr Monthly Treasury Average CMT Index + 1.50%), 3.75%, 7/20/26 | $9,562 | $9,713 |
| Government National Mortgage Association Pass-Through Certificates | | |
| 7.50%, 10/20/30 | 41,917 | 47,983 |
| 6.00%, 1/15/29 | 1 | 2 |
| 5.50%, 8/15/35 | 240 | 262 |
| 5.00%, TBA, 4/1/49 | 56,500,000 | 59,020,431 |
| 4.70%, with due dates from 5/20/67 to 8/20/67 | 646,690 | 705,297 |
| 4.667%, 9/20/65 | 148,209 | 157,972 |
| 4.627%, 6/20/67 | 712,337 | 773,777 |
| 4.508%, 3/20/67 | 584,597 | 630,634 |
| 4.50%, TBA, 4/1/49 | 71,000,000 | 73,723,517 |
| 4.50%, with due dates from 2/20/34 to 5/20/48 | 18,460,533 | 19,448,587 |
| 4.322%, 5/20/67 | 210,700 | 226,766 |
| 4.00%, TBA, 4/1/49 | 66,000,000 | 68,145,000 |
| 4.00%, with due dates from 7/20/44 to 5/20/46 | 39,933,833 | 41,518,509 |
| 3.50%, TBA, 4/1/49 | 71,000,000 | 72,530,938 |
| 3.50%, with due dates from 10/15/42 to 5/20/46 | 52,992,947 | 54,324,021 |
| 3.00%, TBA, 4/1/49 | 88,000,000 | 88,378,127 |
| 3.00%, with due dates from 3/20/43 to 10/20/44 | 2,165,749 | 2,180,911 |
| | | 481,822,447 |
| U.S. Government Agency Mortgage Obligations (53.9%) | | |
| Federal Home Loan Mortgage Corporation Pass-Through Certificates | | |
| 7.50%, 10/1/29 | 190,473 | 213,956 |
| 6.00%, 9/1/21 | 1,034 | 1,061 |
| 5.50%, with due dates from 7/1/19 to 8/1/19 | 1,955 | 1,958 |
| 4.50%, with due dates from 1/1/37 to 6/1/37 | 150,289 | 159,468 |
| 3.00%, 4/1/27 i | 3,788,494 | 3,845,030 |
| Federal National Mortgage Association Pass-Through Certificates | | |
| 6.00%, TBA, 4/1/49 | 11,400,000 | 12,296,860 |
| 6.00%, with due dates from 4/1/21 to 8/1/22 | 143,618 | 147,493 |
| 5.50%, TBA, 4/1/49 | 52,000,000 | 55,485,622 |
| 5.50%, with due dates from 12/1/19 to 1/1/21 | 22,148 | 22,466 |
| 5.00%, 3/1/21 | 1,833 | 1,858 |
| 4.50%, TBA, 4/1/49 | 35,000,000 | 36,465,625 |
| 4.50%, with due dates from 3/1/39 to 10/1/46 | 1,149,551 | 1,208,076 |
| 4.00%, TBA, 4/1/49 | 33,000,000 | 33,938,438 |
| 4.00%, with due dates from 5/1/19 to 9/1/46 | 12,848,589 | 13,363,155 |
| 3.50%, TBA, 4/1/49 | 30,000,000 | 30,403,125 |
| 3.50%, with due dates from 10/1/44 to 1/1/57 | 30,619,610 | 31,100,072 |
| 3.00%, TBA, 5/1/49 | 113,000,000 | 112,364,375 |
| 3.00%, TBA, 4/1/49 | 113,000,000 | 112,479,138 |
| 2.50%, 3/1/43 | 55,455,122 | 54,078,116 |
| | | 497,575,892 |
| Total U.S. government and agency mortgage obligations (cost $974,578,673) | $979,398,339 |
|
| Mortgage Securities Fund 17 |
| | |
| | Principal | |
| U.S. TREASURY OBLIGATIONS (0.1%)* | amount | Value |
| U.S. Treasury Bonds 3.75%, 11/15/43 i | $468,000 | $555,114 |
| Total U.S. treasury obligations (cost $555,114) | | $555,114 |
| | |
| | Principal | |
| MORTGAGE-BACKED SECURITIES (66.2%)* | amount | Value |
| Agency collateralized mortgage obligations (39.9%) | | |
| Federal Home Loan Mortgage Corporation | | |
| IFB Ser. 3408, Class EK, ((-4.024 x 1 Month US LIBOR) + 25.79%), | | |
| 15.799%, 4/15/37 | $324,612 | $483,444 |
| IFB Ser. 2976, Class LC, ((-3.667 x 1 Month US LIBOR) + 24.42%), | | |
| 15.313%, 5/15/35 | 1,210,431 | 1,661,075 |
| IFB Ser. 3072, Class SM, ((-3.667 x 1 Month US LIBOR) + 23.80%), | | |
| 14.69%, 11/15/35 | 677,447 | 983,788 |
| IFB Ser. 3249, Class PS, ((-3.3 x 1 Month US LIBOR) + 22.28%), | | |
| 14.079%, 12/15/36 | 227,287 | 301,223 |
| IFB Ser. 3065, Class DC, ((-3 x 1 Month US LIBOR) + 19.86%), | | |
| 12.409%, 3/15/35 | 2,775,450 | 3,536,478 |
| IFB Ser. 2990, Class LB, ((-2.556 x 1 Month US LIBOR) + 16.95%), | | |
| 10.597%, 6/15/34 | 1,089,041 | 1,246,407 |
| Structured Agency Credit Risk Debt FRN Ser. 14-HQ3, Class M3, | | |
| (1 Month US LIBOR + 4.75%), 7.236%, 10/25/24 | 995,739 | 1,095,055 |
| Ser. 4122, Class TI, IO, 4.50%, 10/15/42 | 5,088,288 | 937,441 |
| Ser. 4024, Class PI, IO, 4.50%, 12/15/41 | 2,698,347 | 427,419 |
| Ser. 4018, Class DI, IO, 4.50%, 7/15/41 | 3,573,163 | 430,937 |
| FRB Ser. 57, Class 2A1, 4.109%, 7/25/43 W | 17,116 | 18,236 |
| Ser. 4546, Class PI, IO, 4.00%, 12/15/45 | 14,497,791 | 2,532,981 |
| Ser. 4601, Class IC, IO, 4.00%, 12/15/45 | 10,181,121 | 1,289,256 |
| Ser. 4530, Class HI, IO, 4.00%, 11/15/45 | 7,806,072 | 1,305,784 |
| Ser. 4500, Class GI, IO, 4.00%, 8/15/45 | 6,808,944 | 1,250,054 |
| Ser. 4425, IO, 4.00%, 1/15/45 | 8,733,024 | 1,543,999 |
| Ser. 4425, Class EI, IO, 4.00%, 1/15/45 | 10,810,031 | 1,875,324 |
| Ser. 4452, Class QI, IO, 4.00%, 11/15/44 | 7,540,848 | 1,705,898 |
| Ser. 4213, Class GI, IO, 4.00%, 11/15/41 | 15,103,458 | 1,623,320 |
| Ser. 4019, Class JI, IO, 4.00%, 5/15/41 | 7,067,450 | 865,346 |
| Ser. 3996, Class IK, IO, 4.00%, 3/15/39 | 6,133,895 | 299,160 |
| Ser. 4015, Class GI, IO, 4.00%, 3/15/27 | 3,530,173 | 357,628 |
| FRB Ser. 59, Class 2A1, 3.968%, 10/25/43 W | 10,121 | 10,431 |
| IFB Ser. 4136, Class ES, IO, ((-1 x 1 Month US LIBOR) + 6.25%), | | |
| 3.766%, 11/15/42 | 6,234,470 | 616,312 |
| IFB Ser. 4436, Class SC, IO, ((-1 x 1 Month US LIBOR) + 6.15%), | | |
| 3.666%, 2/15/45 | 11,078,039 | 1,708,932 |
| Ser. 4621, Class QI, IO, 3.50%, 10/15/46 | 24,457,932 | 3,499,685 |
| Ser. 4165, Class AI, IO, 3.50%, 2/15/43 | 5,162,219 | 886,301 |
| Ser. 4136, Class IQ, IO, 3.50%, 11/15/42 | 9,008,390 | 1,063,582 |
| Ser. 4199, Class CI, IO, 3.50%, 12/15/37 | 5,225,261 | 221,791 |
| Ser. 304, Class C37, IO, 3.50%, 12/15/27 | 1,850,472 | 147,940 |
| Ser. 4150, Class DI, IO, 3.00%, 1/15/43 | 9,766,858 | 1,092,667 |
| Ser. 4141, Class PI, IO, 3.00%, 12/15/42 | 8,380,110 | 849,743 |
| Ser. 4158, Class TI, IO, 3.00%, 12/15/42 | 15,004,216 | 1,360,882 |
| Ser. 4165, Class TI, IO, 3.00%, 12/15/42 | 16,869,684 | 1,418,184 |
| Ser. 4171, Class NI, IO, 3.00%, 6/15/42 | 10,951,649 | 962,979 |
|
| 18 Mortgage Securities Fund |
| | |
| | Principal | |
| MORTGAGE-BACKED SECURITIES (66.2%)*cont. | amount | Value |
| Agency collateralized mortgage obligationscont. | | |
| Federal Home Loan Mortgage Corporation | | |
| Ser. 4183, Class MI, IO, 3.00%, 2/15/42 | $6,616,008 | $509,433 |
| Ser. 4201, Class JI, IO, 3.00%, 12/15/41 | 9,359,905 | 697,831 |
| FRB Ser. 8, Class A9, IO, 0.429%, 11/15/28 W | 1,044,410 | 14,413 |
| FRB Ser. 59, Class 1AX, IO, 0.28%, 10/25/43 W | 3,161,383 | 30,982 |
| Ser. 48, Class A2, IO, 0.212%, 7/25/33 W | 5,039,717 | 36,286 |
| Ser. 315, PO, zero %, 9/15/43 | 16,177,048 | 13,293,880 |
| Ser. 3835, Class FO, PO, zero %, 4/15/41 | 3,161,242 | 2,714,812 |
| Ser. 3369, Class BO, PO, zero %, 9/15/37 | 5,052 | 4,274 |
| Ser. 3391, PO, zero %, 4/15/37 | 59,936 | 51,294 |
| Ser. 3300, PO, zero %, 2/15/37 | 71,175 | 60,862 |
| Ser. 3314, PO, zero %, 11/15/36 | 5,858 | 5,756 |
| Ser. 3206, Class EO, PO, zero %, 8/15/36 | 3,164 | 2,765 |
| Ser. 3175, Class MO, PO, zero %, 6/15/36 | 42,029 | 35,864 |
| Ser. 3210, PO, zero %, 5/15/36 | 8,586 | 7,941 |
| Ser. 3326, Class WF, zero %, 10/15/35 W | 30,876 | 23,141 |
| FRB Ser. 3117, Class AF, (1 Month US LIBOR + 0.00%), | | |
| zero %, 2/15/36 | 21,054 | 16,214 |
| Federal Home Loan Mortgage Corporation Structured Agency | | |
| Credit risk Debt FRN Ser. 15-HQ1, Class M3, (1 Month US LIBOR | | |
| + 3.80%), 6.286%, 3/25/25 | 884,501 | 931,794 |
| Federal National Mortgage Association | | |
| IFB Ser. 06-62, Class PS, ((-6 x 1 Month US LIBOR) + 39.90%), | | |
| 24.987%, 7/25/36 | 380,323 | 630,004 |
| Ser. 98-W5, Class X, IO, 19.857%, 7/25/28 W | 1,913,825 | 55,118 |
| IFB Ser. 06-8, Class HP, ((-3.667 x 1 Month US LIBOR) + 24.57%), | | |
| 15.453%, 3/25/36 | 488,234 | 743,834 |
| IFB Ser. 07-53, Class SP, ((-3.667 x 1 Month US LIBOR) + 24.20%), | | |
| 15.086%, 6/25/37 | 608,879 | 872,584 |
| IFB Ser. 05-74, Class NK, ((-5 x 1 Month US LIBOR) + 27.50%), | | |
| 15.073%, 5/25/35 | 783,988 | 1,007,414 |
| IFB Ser. 05-122, Class SE, ((-3.5 x 1 Month US LIBOR) + 23.10%), | | |
| 14.401%, 11/25/35 | 425,736 | 547,028 |
| IFB Ser. 08-24, Class SP, ((-3.667 x 1 Month US LIBOR) + 23.28%), | | |
| 14.17%, 2/25/38 | 2,184,193 | 2,726,202 |
| IFB Ser. 05-75, Class GS, ((-3 x 1 Month US LIBOR) + 20.25%), | | |
| 12.794%, 8/25/35 | 276,256 | 349,629 |
| IFB Ser. 05-106, Class JC, ((-3.101 x 1 Month US LIBOR) + 20.12%), | | |
| 12.417%, 12/25/35 | 723,794 | 915,020 |
| IFB Ser. 05-83, Class QP, ((-2.6 x 1 Month US LIBOR) + 17.39%), | | |
| 10.932%, 11/25/34 | 181,643 | 206,983 |
| IFB Ser. 11-4, Class CS, ((-2 x 1 Month US LIBOR) + 12.90%), | | |
| 7.929%, 5/25/40 | 1,375,633 | 1,574,137 |
| Ser. 15-58, Class KI, IO, 6.00%, 3/25/37 | 11,401,985 | 2,594,248 |
| FRB Ser. 03-W11, Class A1, 5.685%, 6/25/33 W | 454 | 474 |
| FRB Ser. 04-W7, Class A2, 5.502%, 3/25/34 W | 5,542 | 6,112 |
| Ser. 16-3, Class MI, IO, 5.50%, 2/25/46 | 8,588,682 | 1,712,411 |
| Ser. 15-86, Class MI, IO, 5.50%, 11/25/45 | 10,077,392 | 2,129,655 |
| Ser. 10-109, Class IM, IO, 5.50%, 9/25/40 | 21,557,195 | 3,881,373 |
| Ser. 18-51, Class BI, IO, 5.50%, 7/25/38 | 15,042,335 | 2,406,340 |
|
| Mortgage Securities Fund 19 |
| | |
| | Principal | |
| MORTGAGE-BACKED SECURITIES (66.2%)*cont. | amount | Value |
| Agency collateralized mortgage obligationscont. | | |
| Federal National Mortgage Association | | |
| Ser. 17-19, Class IH, IO, 5.00%, 3/25/47 | $12,101,892 | $2,417,958 |
| Ser. 12-151, Class IM, IO, 5.00%, 4/25/42 | 14,849,407 | 2,673,229 |
| FRB Ser. 03-W14, Class 2A, 4.547%, 1/25/43 W | 15,992 | 16,709 |
| FRB Ser. 04-W2, Class 4A, 4.277%, 2/25/44 W | 10,237 | 10,504 |
| FRB Ser. 03-W3, Class 1A4, 4.171%, 8/25/42 W | 30,572 | 31,755 |
| IFB Ser. 11-123, Class KS, IO, ((-1 x 1 Month US LIBOR) + 6.60%), | | |
| 4.115%, 10/25/41 | 1,633,201 | 249,569 |
| Ser. 12-62, Class MI, IO, 4.00%, 3/25/41 | 4,572,230 | 454,480 |
| Ser. 12-118, Class PI, IO, 4.00%, 6/25/42 | 6,736,114 | 1,084,704 |
| Ser. 12-104, Class HI, IO, 4.00%, 9/25/27 | 8,020,589 | 760,658 |
| IFB Ser. 18-47, Class SA, IO, ((-1 x 1 Month US LIBOR) + 6.25%), | | |
| 3.765%, 7/25/48 | 9,545,963 | 1,459,864 |
| IFB Ser. 18-36, Class SD, IO, ((-1 x 1 Month US LIBOR) + 6.25%), | | |
| 3.765%, 6/25/48 | 30,335,098 | 4,502,156 |
| IFB Ser. 16-83, Class BS, IO, ((-1 x 1 Month US LIBOR) + 6.10%), | | |
| 3.615%, 11/25/46 | 32,756,182 | 5,219,370 |
| IFB Ser. 16-85, Class SL, IO, ((-1 x 1 Month US LIBOR) + 6.10%), | | |
| 3.615%, 11/25/46 | 48,217,249 | 6,649,159 |
| IFB Ser. 16-50, Class SM, IO, ((-1 x 1 Month US LIBOR) + 6.10%), | | |
| 3.615%, 8/25/46 | 22,225,468 | 2,968,869 |
| Ser. 16-70, Class QI, IO, 3.50%, 10/25/46 | 27,193,596 | 3,979,239 |
| Ser. 15-10, Class AI, IO, 3.50%, 8/25/43 | 10,473,459 | 1,750,152 |
| Ser. 12-124, Class JI, IO, 3.50%, 11/25/42 | 3,257,548 | 369,667 |
| Ser. 13-22, Class PI, IO, 3.50%, 10/25/42 | 9,347,112 | 1,671,959 |
| Ser. 12-114, Class NI, IO, 3.50%, 10/25/41 | 12,895,458 | 1,862,558 |
| Ser. 13-55, Class IK, IO, 3.00%, 4/25/43 | 6,798,248 | 644,161 |
| Ser. 13-6, Class JI, IO, 3.00%, 2/25/43 | 12,693,160 | 1,182,051 |
| Ser. 12-151, Class PI, IO, 3.00%, 1/25/43 | 6,636,437 | 628,736 |
| Ser. 12-145, Class TI, IO, 3.00%, 11/25/42 | 5,426,424 | 295,273 |
| Ser. 13-35, Class IP, IO, 3.00%, 6/25/42 | 4,513,095 | 271,242 |
| Ser. 13-55, Class PI, IO, 3.00%, 5/25/42 | 9,745,005 | 640,539 |
| Ser. 13-53, Class JI, IO, 3.00%, 12/25/41 | 8,102,984 | 658,254 |
| Ser. 13-23, Class PI, IO, 3.00%, 10/25/41 | 6,178,993 | 275,274 |
| Ser. 13-30, Class IP, IO, 3.00%, 10/25/41 | 8,457,247 | 396,899 |
| Ser. 13-23, Class LI, IO, 3.00%, 6/25/41 | 6,213,273 | 287,227 |
| Ser. 14-28, Class AI, IO, 3.00%, 3/25/40 | 8,370,927 | 633,470 |
| FRB Ser. 07-95, Class A3, (1 Month US LIBOR + 0.25%), | | |
| 2.736%, 8/27/36 | 25,120,382 | 24,042,429 |
| FRB Ser. 01-50, Class B1, IO, 0.377%, 10/25/41 W | 3,728,403 | 16,032 |
| Ser. 98-W2, Class X, IO, 0.367%, 6/25/28 W | 6,822,238 | 221,723 |
| Ser. 01-79, Class BI, IO, 0.283%, 3/25/45 W | 2,062,506 | 17,531 |
| Ser. 03-34, Class P1, PO, zero %, 4/25/43 | 78,443 | 65,108 |
| Ser. 08-53, Class DO, PO, zero %, 7/25/38 | 234,032 | 211,588 |
| Ser. 07-64, Class LO, PO, zero %, 7/25/37 | 30,480 | 27,719 |
| Ser. 07-44, Class CO, PO, zero %, 5/25/37 | 131,648 | 109,728 |
| Ser. 07-14, Class KO, PO, zero %, 3/25/37 | 7,577 | 6,399 |
| Ser. 06-125, Class OX, PO, zero %, 1/25/37 | 1,731 | 1,482 |
| Ser. 06-84, Class OT, PO, zero %, 9/25/36 | 2,332 | 2,035 |
|
| 20 Mortgage Securities Fund |
| | |
| | Principal | |
| MORTGAGE-BACKED SECURITIES (66.2%)*cont. | amount | Value |
| Agency collateralized mortgage obligationscont. | | |
| Federal National Mortgage Association | | |
| Ser. 06-46, Class OC, PO, zero %, 6/25/36 | $3,420 | $2,884 |
| Ser. 08-36, Class OV, PO, zero %, 1/25/36 | 38,038 | 33,169 |
| Government National Mortgage Association | | |
| Ser. 16-75, Class LI, IO, 6.00%, 1/20/40 | 7,657,423 | 1,675,061 |
| Ser. 14-137, Class ID, IO, 5.50%, 9/16/44 | 7,640,994 | 1,651,447 |
| Ser. 18-127, Class ID, IO, 5.00%, 7/20/45 | 298,668 | 38,934 |
| Ser. 15-89, Class LI, IO, 5.00%, 12/20/44 | 10,255,038 | 2,228,830 |
| Ser. 14-133, Class IP, IO, 5.00%, 9/16/44 | 6,604,400 | 1,361,629 |
| Ser. 14-76, IO, 5.00%, 5/20/44 | 6,092,365 | 1,251,393 |
| Ser. 13-51, Class QI, IO, 5.00%, 2/20/43 | 7,759,791 | 1,337,163 |
| Ser. 13-3, Class IT, IO, 5.00%, 1/20/43 | 3,433,498 | 740,949 |
| Ser. 13-6, Class OI, IO, 5.00%, 1/20/43 | 17,372,832 | 3,772,510 |
| Ser. 10-35, Class UI, IO, 5.00%, 3/20/40 | 2,983,351 | 626,872 |
| Ser. 10-9, Class UI, IO, 5.00%, 1/20/40 | 14,312,002 | 3,078,512 |
| Ser. 09-121, Class UI, IO, 5.00%, 12/20/39 | 8,484,127 | 1,813,482 |
| Ser. 18-1, IO, 4.50%, 1/20/48 | 13,440,179 | 2,528,635 |
| Ser. 18-127, Class IB, IO, 4.50%, 6/20/45 | 3,297,363 | 376,097 |
| Ser. 13-34, Class HI, IO, 4.50%, 3/20/43 | 10,777,498 | 2,105,547 |
| Ser. 12-129, IO, 4.50%, 11/16/42 | 5,558,478 | 1,216,806 |
| Ser. 12-91, Class IN, IO, 4.50%, 5/20/42 | 2,878,277 | 584,273 |
| Ser. 10-35, Class AI, IO, 4.50%, 3/20/40 | 10,064,070 | 1,958,468 |
| Ser. 10-35, Class DI, IO, 4.50%, 3/20/40 | 14,165,466 | 2,788,897 |
| Ser. 10-35, Class QI, IO, 4.50%, 3/20/40 | 3,976,661 | 779,227 |
| Ser. 10-9, Class QI, IO, 4.50%, 1/20/40 | 2,342,711 | 454,720 |
| Ser. 09-121, Class CI, IO, 4.50%, 12/16/39 | 8,951,079 | 1,867,430 |
| IFB Ser. 11-81, Class SB, IO, ((-1 x 1 Month US LIBOR) + 6.71%), | | |
| 4.223%, 11/16/36 | 2,642,513 | 99,808 |
| IFB Ser. 13-182, Class SP, IO, ((-1 x 1 Month US LIBOR) + 6.70%), | | |
| 4.212%, 12/20/43 | 8,229,680 | 1,512,204 |
| IFB Ser. 11-156, Class SK, IO, ((-1 x 1 Month US LIBOR) + 6.60%), | | |
| 4.112%, 4/20/38 | 10,078,900 | 1,940,188 |
| Ser. 16-69, IO, 4.00%, 5/20/46 | 4,232,482 | 692,095 |
| Ser. 16-27, Class IB, IO, 4.00%, 11/20/45 | 9,013,052 | 1,590,851 |
| Ser. 15-94, IO, 4.00%, 7/20/45 | 19,595,824 | 3,917,205 |
| Ser. 15-53, Class MI, IO, 4.00%, 4/16/45 | 7,471,566 | 1,488,336 |
| Ser. 14-2, Class IL, IO, 4.00%, 1/16/44 | 1,652,875 | 302,410 |
| Ser. 14-100, Class NI, IO, 4.00%, 6/20/43 | 14,145,058 | 1,751,300 |
| Ser. 13-67, Class IP, IO, 4.00%, 4/16/43 | 9,591,063 | 1,974,800 |
| Ser. 13-165, Class IL, IO, 4.00%, 3/20/43 | 3,604,244 | 627,463 |
| Ser. 12-56, Class IB, IO, 4.00%, 4/20/42 | 8,932,842 | 1,651,634 |
| Ser. 12-38, Class MI, IO, 4.00%, 3/20/42 | 15,512,004 | 3,010,260 |
| Ser. 12-47, Class CI, IO, 4.00%, 3/20/42 | 4,119,505 | 742,531 |
| Ser. 14-104, IO, 4.00%, 3/20/42 | 10,418,420 | 1,629,545 |
| Ser. 14-4, Class IK, IO, 4.00%, 7/20/39 | 4,054,369 | 287,953 |
| Ser. 11-71, Class IK, IO, 4.00%, 4/16/39 | 1,825,586 | 123,046 |
| Ser. 10-114, Class MI, IO, 4.00%, 3/20/39 | 3,959,195 | 200,155 |
| Ser. 14-182, Class BI, IO, 4.00%, 1/20/39 | 11,903,739 | 1,420,821 |
|
| Mortgage Securities Fund 21 |
| | |
| | Principal | |
| MORTGAGE-BACKED SECURITIES (66.2%)*cont. | amount | Value |
| Agency collateralized mortgage obligationscont. | | |
| Government National Mortgage Association | | |
| IFB Ser. 18-89, Class LS, IO, ((-1 x 1 Month US LIBOR) + 6.20%), | | |
| 3.712%, 6/20/48 | $13,874,381 | $1,855,698 |
| IFB Ser. 13-87, Class SA, IO, ((-1 x 1 Month US LIBOR) + 6.20%), | | |
| 3.712%, 6/20/43 | 20,680,846 | 3,317,952 |
| IFB Ser. 10-20, Class SC, IO, ((-1 x 1 Month US LIBOR) + 6.15%), | | |
| 3.662%, 2/20/40 | 1,360,433 | 217,669 |
| Ser. 16-156, Class PI, IO, 3.50%, 11/20/46 | 15,790,843 | 1,443,283 |
| Ser. 16-111, Class IP, IO, 3.50%, 8/20/46 | 19,209,105 | 1,605,881 |
| Ser. 18-127, Class IE, IO, 3.50%, 1/20/46 | 9,789,126 | 1,354,913 |
| Ser. 17-176, Class BI, IO, 3.50%, 5/20/45 | 16,729,878 | 1,653,307 |
| Ser. 17-164, Class IG, IO, 3.50%, 4/20/44 | 22,956,277 | 1,807,807 |
| Ser. 13-79, Class PI, IO, 3.50%, 4/20/43 | 11,460,820 | 1,647,493 |
| Ser. 15-168, Class IG, IO, 3.50%, 3/20/43 | 11,004,532 | 1,648,123 |
| Ser. 13-37, Class JI, IO, 3.50%, 1/20/43 | 5,030,291 | 764,755 |
| Ser. 13-27, Class PI, IO, 3.50%, 12/20/42 | 4,374,872 | 653,650 |
| Ser. 12-136, IO, 3.50%, 11/20/42 | 10,249,891 | 1,789,796 |
| Ser. 18-127, Class IA, IO, 3.50%, 4/20/42 | 25,499,590 | 2,222,799 |
| Ser. 14-102, Class IG, IO, 3.50%, 3/16/41 | 3,952,268 | 339,434 |
| Ser. 15-52, Class KI, IO, 3.50%, 11/20/40 | 8,385,751 | 912,370 |
| Ser. 15-99, Class TI, IO, 3.50%, 4/20/39 | 9,909,081 | 571,655 |
| Ser. 15-24, Class AI, IO, 3.50%, 12/20/37 | 11,846,545 | 968,955 |
| Ser. 15-24, Class IC, IO, 3.50%, 11/20/37 | 3,673,097 | 300,092 |
| Ser. 12-48, Class AI, IO, 3.50%, 2/20/36 | 6,575,446 | 487,280 |
| Ser. 17-H08, Class GI, IO, 3.161%, 2/20/67 W | 18,060,557 | 2,663,932 |
| Ser. 17-H08, Class EI, IO, 3.14%, 2/20/67 W | 20,464,689 | 2,634,829 |
| IFB Ser. 14-119, Class SA, IO, ((-1 x 1 Month US LIBOR) + 5.60%), | | |
| 3.112%, 8/20/44 | 10,302,579 | 1,416,605 |
| Ser. 14-160, Class IB, IO, 3.00%, 11/20/40 | 12,135,120 | 707,550 |
| Ser. 14-141, Class CI, IO, 3.00%, 3/20/40 | 5,066,265 | 310,055 |
| Ser. 14-174, Class AI, IO, 3.00%, 11/16/29 | 5,424,646 | 500,695 |
| Ser. 18-H05, Class ID, IO, 2.832%, 3/20/68 W | 10,502,747 | 1,417,871 |
| Ser. 17-H08, Class NI, IO, 2.633%, 3/20/67 W | 18,438,470 | 2,031,919 |
| Ser. 16-H13, Class IK, IO, 2.602%, 6/20/66 W | 23,873,084 | 3,073,660 |
| Ser. 15-H22, Class GI, IO, 2.574%, 9/20/65 W | 21,100,332 | 2,544,700 |
| Ser. 18-H04, Class JI, IO, 2.539%, 3/20/68 W | 22,922,475 | 2,844,679 |
| Ser. 17-H04, Class BI, IO, 2.526%, 2/20/67 W | 19,018,713 | 2,543,753 |
| Ser. 17-H03, Class KI, IO, 2.525%, 1/20/67 W | 27,598,056 | 3,544,832 |
| Ser. 16-H04, Class HI, IO, 2.368%, 7/20/65 W | 17,791,137 | 1,551,387 |
| Ser. 18-H02, Class IM, IO, 2.334%, 2/20/68 W | 14,077,157 | 2,076,381 |
| Ser. 16-H24, Class KI, IO, 2.331%, 11/20/66 W | 12,164,613 | 1,581,400 |
| Ser. 16-H27, Class GI, IO, 2.303%, 12/20/66 W | 28,061,863 | 3,727,401 |
| Ser. 17-H06, Class MI, IO, 2.299%, 2/20/67 W | 30,628,044 | 3,423,940 |
| Ser. 18-H02, IO, 2.289%, 1/20/68 W | 11,167,352 | 1,441,270 |
| Ser. 16-H07, Class PI, IO, 2.28%, 3/20/66 W | 37,745,798 | 4,529,496 |
| Ser. 17-H14, Class LI, IO, 2.251%, 6/20/67 W | 12,348,631 | 1,512,707 |
| Ser. 18-H01, Class XI, IO, 2.24%, 1/20/68 W | 19,424,051 | 2,962,168 |
| Ser. 16-H23, Class NI, IO, 2.233%, 10/20/66 W | 40,157,486 | 4,469,528 |
| Ser. 17-H25, Class CI, IO, 2.207%, 12/20/67 W | 24,573,747 | 3,686,062 |
|
| 22 Mortgage Securities Fund |
| | |
| | Principal | |
| MORTGAGE-BACKED SECURITIES (66.2%)*cont. | amount | Value |
| Agency collateralized mortgage obligationscont. | | |
| Government National Mortgage Association | | |
| Ser. 17-H14, Class JI, IO, 2.197%, 6/20/67 W | $8,722,849 | $1,264,813 |
| Ser. 16-H24, Class JI, IO, 2.175%, 11/20/66 W | 6,486,628 | 786,504 |
| Ser. 17-H25, Class AI, IO, 2.172%, 12/20/67 W | 9,793,166 | 1,175,180 |
| Ser. 17-H20, Class AI, IO, 2.152%, 10/20/67 W | 35,838,806 | 4,731,842 |
| Ser. 17-H03, Class CI, IO, 2.122%, 12/20/66 W | 14,956,687 | 1,850,890 |
| Ser. 16-H03, Class AI, IO, 2.10%, 1/20/66 W | 20,020,338 | 1,851,881 |
| Ser. 16-H24, IO, 2.098%, 9/20/66 W | 19,517,732 | 2,220,142 |
| Ser. 16-H11, Class HI, IO, 2.09%, 1/20/66 W | 59,108,375 | 5,319,754 |
| Ser. 16-H18, Class QI, IO, 2.087%, 6/20/66 W | 23,949,548 | 2,838,860 |
| Ser. 16-H17, Class DI, IO, 2.084%, 7/20/66 W | 25,565,624 | 2,592,917 |
| Ser. 16-H06, Class HI, IO, 2.068%, 2/20/66 | 18,753,443 | 1,615,928 |
| Ser. 16-H01, Class HI, IO, 2.066%, 10/20/65 W | 12,038,189 | 973,420 |
| Ser. 15-H24, Class HI, IO, 2.031%, 9/20/65 W | 24,060,259 | 1,617,090 |
| Ser. 16-H06, Class AI, IO, 1.97%, 2/20/66 | 14,184,039 | 1,239,557 |
| Ser. 15-H20, Class CI, IO, 1.954%, 8/20/65 W | 30,558,282 | 3,035,201 |
| Ser. 16-H14, Class AI, IO, 1.953%, 6/20/66 W | 18,340,621 | 1,897,374 |
| FRB Ser. 15-H16, Class XI, IO, 1.934%, 7/20/65 W | 13,984,451 | 1,406,836 |
| Ser. 15-H23, Class TI, IO, 1.922%, 9/20/65 W | 22,026,236 | 2,121,127 |
| Ser. 17-H23, Class BI, IO, 1.901%, 11/20/67 W | 14,522,111 | 1,495,777 |
| Ser. 15-H25, Class BI, IO, 1.886%, 10/20/65 W | 16,413,328 | 1,450,938 |
| Ser. 15-H23, Class DI, IO, 1.859%, 9/20/65 W | 6,873,498 | 606,401 |
| Ser. 15-H04, Class AI, IO, 1.833%, 12/20/64 W | 25,791,698 | 2,095,575 |
| Ser. 15-H22, Class AI, IO, 1.832%, 9/20/65 W | 33,737,751 | 3,066,762 |
| Ser. 17-H10, Class MI, IO, 1.801%, 4/20/67 W | 20,378,397 | 1,942,061 |
| Ser. 17-H25, IO, 1.776%, 11/20/67 W | 15,525,291 | 1,785,408 |
| Ser. 15-H13, Class AI, IO, 1.774%, 6/20/65 W | 23,819,579 | 2,233,086 |
| Ser. 16-H04, Class KI, IO, 1.761%, 2/20/66 W | 22,137,558 | 1,660,317 |
| Ser. 17-H09, IO, 1.743%, 4/20/67 W | 16,855,249 | 1,535,564 |
| Ser. 14-H25, Class BI, IO, 1.70%, 12/20/64 W | 20,419,557 | 1,511,211 |
| Ser. 16-H10, Class AI, IO, 1.685%, 4/20/66 W | 31,922,518 | 2,187,650 |
| Ser. 16-H06, Class DI, IO, 1.633%, 7/20/65 | 23,734,477 | 1,826,131 |
| Ser. 14-H21, Class AI, IO, 1.629%, 10/20/64 W | 25,113,457 | 2,048,254 |
| Ser. 17-H16, Class HI, IO, 1.62%, 8/20/67 W | 14,003,642 | 1,330,346 |
| Ser. 14-H18, Class CI, IO, 1.616%, 9/20/64 W | 16,220,393 | 1,339,853 |
| Ser. 15-H10, Class HI, IO, 1.598%, 4/20/65 W | 28,911,656 | 2,434,361 |
| Ser. 17-H06, Class EI, 1.589%, 2/20/67 W | 15,060,194 | 1,021,322 |
| Ser. 16-H08, Class GI, IO, 1.44%, 4/20/66 W | 17,209,488 | 922,566 |
| FRB Ser. 11-H07, Class FI, IO, 1.254%, 2/20/61 W | 69,283,885 | 2,036,946 |
| Ser. 12-H11, Class FI, IO, 1.23%, 2/20/62 W | 39,390,889 | 1,288,240 |
| Ser. 11-H16, Class FI, IO, 1.059%, 7/20/61 W | 29,073,450 | 1,005,302 |
| Ser. 10-151, Class KO, PO, zero %, 6/16/37 | 738,201 | 624,614 |
| Ser. 06-36, Class OD, PO, zero %, 7/16/36 | 8,479 | 7,093 |
| Government National Mortgage Association IFB Ser. 19-35, | | |
| Class SE, IO, ((-1 x 1 Month US LIBOR) + 6.15%), 3.668%, 1/16/44 | 12,421,000 | 1,789,400 |
| GSMPS Mortgage Loan Trust 144A | | |
| FRB Ser. 98-2, IO, 1.004%, 5/19/27 W | 184,630 | — |
| FRB Ser. 99-2, IO, 0.84%, 9/19/27 W | 542,137 | 4,771 |
|
| Mortgage Securities Fund 23 |
| | |
| | Principal | |
| MORTGAGE-BACKED SECURITIES (66.2%)*cont. | amount | Value |
| Agency collateralized mortgage obligationscont. | | |
| GSMPS Mortgage Loan Trust 144A | | |
| FRB Ser. 98-3, IO, zero %, 9/19/27 W | $249,209 | $— |
| FRB Ser. 98-4, IO, zero %, 12/19/26 W | 417,991 | — |
| | | 368,957,786 |
| Commercial mortgage-backed securities (6.7%) | | |
| COMM Mortgage Trust 144A FRB Ser. 14-CR17, Class D, | | |
| 4.826%, 5/10/47 W | 2,086,000 | 2,025,787 |
| GS Mortgage Securities Trust FRB Ser. 14-GC18, Class C, | | |
| 4.996%, 1/10/47 W | 1,794,000 | 1,826,830 |
| GS Mortgage Securities Trust 144A | | |
| Ser. 11-GC3, Class E, 5.00%, 3/10/44 W | 1,764,000 | 1,783,567 |
| FRB Ser. 14-GC24, Class D, 4.53%, 9/10/47 W | 5,330,000 | 4,779,861 |
| JPMBB Commercial Mortgage Securities Trust 144A | | |
| FRB Ser. C14, Class D, 4.564%, 8/15/46 W | 5,182,000 | 4,802,577 |
| Ser. 14-C23, Class E, 3.364%, 9/15/47 W | 1,924,000 | 1,481,480 |
| JPMorgan Chase Commercial Mortgage Securities Trust FRB | | |
| Ser. 13-LC11, Class D, 4.169%, 4/15/46 W | 2,070,000 | 1,791,435 |
| JPMorgan Chase Commercial Mortgage Securities Trust 144A | | |
| FRB Ser. 11-C3, Class E, 5.662%, 2/15/46 W | 1,629,000 | 1,598,456 |
| FRB Ser. 10-C2, Class D, 5.60%, 11/15/43 W | 1,637,000 | 1,652,030 |
| FRB Ser. 13-C16, Class D, 5.028%, 12/15/46 W | 1,333,000 | 1,381,113 |
| ML-CFC Commercial Mortgage Trust | | |
| Ser. 07-6, Class AM, 5.501%, 3/12/51 W | 823,866 | 782,673 |
| FRB Ser. 06-4, Class C, 5.324%, 12/12/49 W | 2,953,332 | 2,787,650 |
| Morgan Stanley Bank of America Merrill Lynch Trust 144A | | |
| FRB Ser. 13-C12, Class E, 4.767%, 10/15/46 W | 1,347,584 | 1,171,419 |
| Ser. 14-C15, Class F, 4.00%, 4/15/47 | 1,660,000 | 1,370,379 |
| Morgan Stanley Capital I Trust 144A | | |
| FRB Ser. 12-C4, Class E, 5.421%, 3/15/45 W | 2,436,000 | 2,046,459 |
| FRB Ser. 11-C3, Class E, 5.155%, 7/15/49 W | 8,047,130 | 8,071,593 |
| UBS Commercial Mortgage Trust 144A | | |
| FRB Ser. 12-C1, Class D, 5.544%, 5/10/45 W | 3,951,000 | 3,946,230 |
| FRB Ser. 12-C1, Class E, 5.00%, 5/10/45 W | 2,266,000 | 2,040,018 |
| Wachovia Bank Commercial Mortgage Trust FRB Ser. 05-C21, | | |
| Class D, 5.238%, 10/15/44 W | 1,689,566 | 1,674,275 |
| Wells Fargo Commercial Mortgage Trust 144A Ser. 10-C1, Class E, | | |
| 4.00%, 11/15/43 | 1,201,000 | 1,140,820 |
| WF-RBS Commercial Mortgage Trust 144A | | |
| FRB Ser. 11-C5, Class E, 5.673%, 11/15/44 W | 1,875,000 | 1,906,794 |
| Ser. 11-C4, Class E, 5.232%, 6/15/44 W | 2,798,568 | 2,704,769 |
| FRB Ser. 12-C9, Class D, 4.781%, 11/15/45 W | 5,183,466 | 5,093,196 |
| FRB Ser. 12-C9, Class E, 4.781%, 11/15/45 W | 3,112,000 | 2,758,106 |
| FRB Ser. 13-C11, Class E, 4.266%, 3/15/45 W | 1,289,000 | 1,178,024 |
| | | 61,795,541 |
| Residential mortgage-backed securities (non-agency) (19.6%) | | |
| Arroyo Mortgage Trust 144A Ser. 18-1, Class A3, 4.157%, 4/25/48 W | 2,289,502 | 2,318,121 |
| Bayview Financial Mortgage Pass-Through Trust Ser. 06-C, | | |
| Class 1A3, 6.028%, 11/28/36 | 8,140,000 | 7,973,130 |
| Bear Stearns Alt-A Trust FRB Ser. 05-8, Class 21A1, | | |
| 4.464%, 10/25/35 W | 979,236 | 941,070 |
|
| 24 Mortgage Securities Fund |
| | |
| | Principal | |
| MORTGAGE-BACKED SECURITIES (66.2%)*cont. | amount | Value |
| Residential mortgage-backed securities (non-agency)cont. | | |
| Bellemeade Re Ltd. 144A FRB Ser. 15-1A, Class M2, (1 Month | | |
| US LIBOR + 4.30%), 6.786%, 7/25/25 (Bermuda) | $520,056 | $520,948 |
| Bellemeade Re, Ltd. 144A | | |
| FRB Ser. 17-1, Class M2, (1 Month US LIBOR + 3.35%), 5.836%, | | |
| 10/25/27 (Bermuda) | 3,760,000 | 3,857,436 |
| FRB Ser. 18-2A, Class M1C, (1 Month US LIBOR + 1.60%), 4.086%, | | |
| 8/25/28 (Bermuda) | 2,230,000 | 2,235,575 |
| Carrington Mortgage Loan Trust FRB Ser. 06-NC2, Class A4, | | |
| (1 Month US LIBOR + 0.24%), 2.726%, 6/25/36 | 8,710,000 | 8,056,750 |
| Citigroup Mortgage Loan Trust, Inc. | | |
| Ser. 05-WF2, Class AF6B, 5.55%, 8/25/35 | 1,610,299 | 1,594,523 |
| FRB Ser. 07-AR5, Class 1A1A, 4.753%, 4/25/37 W | 6,681,389 | 6,725,887 |
| Countrywide Asset-Backed Certificates FRB Ser. 07-10, Class 1A1, | | |
| (1 Month US LIBOR + 0.18%), 2.666%, 6/25/47 | 7,395,567 | 7,203,744 |
| Credit Suisse Mortgage Trust 144A FRB Ser. 13-11R, Class 1A2, | | |
| 5.219%, 6/27/34 W | 3,120,000 | 3,244,800 |
| Federal Home Loan Mortgage Corporation | | |
| Structured Agency Credit risk debt Notes FRB Ser. 15-HQA1, | | |
| Class B, (1 Month US LIBOR + 8.80%), 11.286%, 3/25/28 | 2,734,600 | 3,257,117 |
| Structured Agency Credit Risk Debt FRN Ser. 16-HQA1, Class M3, | | |
| (1 Month US LIBOR + 6.35%), 8.836%, 9/25/28 | 916,040 | 1,092,758 |
| FRB Ser. 16-DNA3, Class M3, (1 Month US LIBOR + 5.00%), | | |
| 7.486%, 12/25/28 | 6,538,000 | 7,409,104 |
| Structured Agency Credit Risk Debt FRN Ser. 17-HQA2, Class B1, | | |
| (1 Month US LIBOR + 4.75%), 7.236%, 12/25/29 | 250,000 | 270,487 |
| Structured Agency Credit Risk Debt Notes FRB Ser. 14-DN4, | | |
| Class M3, (1 Month US LIBOR + 4.55%), 7.036%, 10/25/24 | 2,392,044 | 2,624,670 |
| Structured Agency Credit Risk Debt FRN Ser. 17-DNA2, Class M2, | | |
| (1 Month US LIBOR + 3.45%), 5.936%, 10/25/29 | 2,375,000 | 2,553,753 |
| Structured Agency Credit Risk Debt FRN Ser. 17-DNA1, Class M2, | | |
| (1 Month US LIBOR + 3.25%), 5.736%, 7/25/29 | 480,000 | 512,188 |
| Structured Agency Credit Risk Debt FRN Ser. 18-DNA1, Class B1, | | |
| (1 Month US LIBOR + 3.15%), 5.636%, 7/25/30 | 7,525,000 | 7,157,193 |
| Structured Agency Credit Risk Debt FRN Ser. 17-HQA2, Class M2, | | |
| (1 Month US LIBOR + 2.65%), 5.136%, 12/25/29 | 4,740,000 | 4,880,420 |
| Structured Agency Credit Risk Debt FRN Ser. 17-DNA3, Class M2, | | |
| (1 Month US LIBOR + 2.50%), 4.986%, 3/25/30 | 1,190,000 | 1,219,125 |
| Structured Agency Credit Risk Debt FRN Ser. 18-HQA1, Class M2, | | |
| (1 Month US LIBOR + 2.30%), 4.786%, 9/25/30 | 5,285,000 | 5,274,332 |
| Federal Home Loan Mortgage Corporation 144A | | |
| Structured Agency Credit Risk Debt FRN Ser. 18-DNA2, Class B1, | | |
| (1 Month US LIBOR + 3.70%), 6.186%, 12/25/30 | 6,390,000 | 6,290,982 |
| Structured Agency Credit Risk Debt FRN Ser. 19-DNA2, Class M2, | | |
| (1 Month US LIBOR + 2.45%), 4.937%, 3/25/49 | 689,000 | 692,287 |
| Federal National Mortgage Association | | |
| Connecticut Avenue Securities FRB Ser. 16-C03, Class 1B, | | |
| (1 Month US LIBOR + 11.75%), 14.236%, 10/25/28 | 2,840,698 | 3,999,535 |
| Connecticut Avenue Securities FRB Ser. 17-C02, Class 2B1, | | |
| (1 Month US LIBOR + 5.50%), 7.986%, 9/25/29 | 850,000 | 961,732 |
| Connecticut Avenue Securities FRB Ser. 16-C03, Class 1M2, | | |
| (1 Month US LIBOR + 5.30%), 7.786%, 10/25/28 | 2,683,000 | 3,060,873 |
|
| Mortgage Securities Fund 25 |
| | |
| | Principal | |
| MORTGAGE-BACKED SECURITIES (66.2%)*cont. | amount | Value |
| Residential mortgage-backed securities (non-agency)cont. | | |
| Federal National Mortgage Association | | |
| Connecticut Avenue Securities FRB Ser. 16-C05, Class 2M2, | | |
| (1 Month US LIBOR + 4.45%), 6.936%, 1/25/29 | $3,411,000 | $3,719,924 |
| Connecticut Avenue Securities FRB Ser. 16-C07, Class 2M2, | | |
| (1 Month US LIBOR + 4.35%), 6.836%, 5/25/29 | 280,000 | 305,846 |
| Connecticut Avenue Securities FRB Ser. 16-C06, Class 1M2, | | |
| (1 Month US LIBOR + 4.25%), 6.736%, 4/25/29 | 3,743,000 | 4,145,045 |
| Connecticut Avenue Securities FRB Ser. 17-C06, Class 1B1, | | |
| (1 Month US LIBOR + 4.15%), 6.636%, 2/25/30 | 3,742,000 | 3,942,479 |
| Connecticut Avenue Securities FRB Ser. 17-C07, Class 1B1, | | |
| (1 Month US LIBOR + 4.00%), 6.486%, 5/25/30 | 3,800,000 | 3,916,223 |
| Connecticut Avenue Securities FRB Ser. 18-C03, Class 1B1, | | |
| (1 Month US LIBOR + 3.75%), 6.236%, 10/25/30 | 260,000 | 257,907 |
| Connecticut Avenue Securities FRB Ser. 17-C02, Class 2M2, | | |
| (1 Month US LIBOR + 3.65%), 6.136%, 9/25/29 | 200,879 | 216,452 |
| Connecticut Avenue Securities FRB Ser. 17-C05, Class 1B1, | | |
| (1 Month US LIBOR + 3.60%), 6.086%, 1/25/30 | 7,417,000 | 7,600,218 |
| Connecticut Avenue Securities FRB Ser. 18-C01, Class 1B1, | | |
| (1 Month US LIBOR + 3.55%), 6.036%, 7/25/30 | 6,508,000 | 6,413,601 |
| Connecticut Avenue Securities FRB Ser. 17-C01, Class 1M2, | | |
| (1 Month US LIBOR + 3.55%), 6.036%, 7/25/29 | 6,381,000 | 6,852,631 |
| Connecticut Avenue Securities FRB Ser. 17-C06, Class 1M2, | | |
| (1 Month US LIBOR + 2.65%), 5.136%, 2/25/30 | 5,200,000 | 5,344,439 |
| Connecticut Avenue Securities FRB Ser. 18-C04, Class 2M2, | | |
| (1 Month US LIBOR + 2.55%), 5.036%, 12/25/30 | 5,300,000 | 5,335,403 |
| Connecticut Avenue Securities FRB Ser. 18-C05, Class 1M2, | | |
| (1 Month US LIBOR + 2.35%), 4.836%, 1/25/31 | 2,476,000 | 2,481,658 |
| Connecticut Avenue Securities FRB Ser. 18-C02, Class 2M2, | | |
| (1 Month US LIBOR + 2.20%), 4.686%, 8/25/30 | 5,335,000 | 5,303,248 |
| Connecticut Avenue Securities FRB Ser. 18-C03, Class 1M2, | | |
| (1 Month US LIBOR + 2.15%), 4.636%, 10/25/30 | 2,725,000 | 2,713,398 |
| Federal National Mortgage Association 144A Connecticut Avenue | | |
| Securities Trust FRB Ser. 19-R02, Class 1M2, (1 Month US LIBOR | | |
| + 2.30%), 4.786%, 8/25/31 | 1,828,000 | 1,839,605 |
| GCAT, LLC 144A Ser. 18-2, Class A1, 4.09%, 6/26/23 | 3,367,501 | 3,361,187 |
| HarborView Mortgage Loan Trust FRB Ser. 05-2, Class 1A, (1 Month | | |
| US LIBOR + 0.52%), 3.002%, 5/19/35 | 1,389,435 | 879,335 |
| JPMorgan Alternative Loan Trust FRB Ser. 06-A6, Class 1A1, | | |
| (1 Month US LIBOR + 0.16%), 2.646%, 11/25/36 | 2,709,120 | 2,589,776 |
| Legacy Mortgage Asset Trust 144A FRB Ser. 19-GS2, Class A2, | | |
| 4.25%, 1/25/59 | 1,220,000 | 1,187,304 |
| Morgan Stanley ABS Capital I, Inc. Trust FRB Ser. 04-HE9, Class M2, | | |
| (1 Month US LIBOR + 0.93%), 3.416%, 11/25/34 | 1,221,100 | 1,217,810 |
| Oaktown Re, Ltd. 144A | | |
| FRB Ser. 17-1A, Class M2, (1 Month US LIBOR + 4.00%), 6.486%, | | |
| 4/25/27 (Bermuda) | 2,480,000 | 2,546,650 |
| FRB Ser. 18-1A, Class M2, (1 Month US LIBOR + 2.85%), 5.336%, | | |
| 7/25/28 (Bermuda) | 2,980,000 | 2,990,244 |
| Structured Asset Mortgage Investments II Trust FRB Ser. 06-AR7, | | |
| Class A1BG, (1 Month US LIBOR + 0.12%), 2.606%, 8/25/36 | 593,520 | 541,943 |
|
| 26 Mortgage Securities Fund |
| | |
| | Principal | |
| MORTGAGE-BACKED SECURITIES (66.2%)*cont. | amount | Value |
| Residential mortgage-backed securities (non-agency)cont. | | |
| WaMu Mortgage Pass-Through Certificates Trust | | |
| FRB Ser. 05-AR14, Class 1A2, 4.193%, 12/25/35 W | $6,125,946 | $6,118,900 |
| FRB Ser. 05-AR8, Class 2AC2, (1 Month US LIBOR + 0.92%), | | |
| 3.406%, 7/25/45 | 1,083,721 | 1,064,973 |
| Wells Fargo Home Equity Asset-Backed Securities Trust FRB | | |
| Ser. 07-2, Class A3, (1 Month US LIBOR + 0.23%), 2.716%, 4/25/37 | 1,684,669 | 1,626,231 |
| | | 180,440,970 |
| Total mortgage-backed securities (cost $621,824,050) | | $611,194,297 |
| | | |
| PURCHASED SWAP OPTIONS OUTSTANDING (3.9%)* | | | |
| Counterparty | | Notional/ | |
| Fixed right % to receive or (pay)/ | Expiration | contract | |
| Floating rate index/Maturity date | date/strike | amount | Value |
| Bank of America N.A. | | | |
| 3.312/3 month USD-LIBOR-BBA/Nov-38 | Nov-28/3.312 | $73,288,200 | $5,673,972 |
| (3.312)/3 month USD-LIBOR-BBA/Nov-38 | Nov-28/3.312 | 73,288,200 | 2,834,055 |
| 3.295/3 month USD-LIBOR-BBA/Nov-38 | Nov-28/3.295 | 36,644,100 | 2,806,938 |
| 2.785/3 month USD-LIBOR-BBA/Jan-47 | Jan-27/2.785 | 22,487,600 | 2,040,525 |
| (2.785)/3 month USD-LIBOR-BBA/Jan-47 | Jan-27/2.785 | 22,487,600 | 1,838,586 |
| (3.295)/3 month USD-LIBOR-BBA/Nov-38 | Nov-28/3.295 | 36,644,100 | 1,434,617 |
| Citibank, N.A. | | | |
| 2.41/3 month USD-LIBOR-BBA/Apr-21 | Apr-19/2.41 | 241,293,300 | 354,701 |
| Goldman Sachs International | | | |
| 2.7475/3 month USD-LIBOR-BBA/Feb-30 | Feb-20/2.7475 | 72,086,800 | 2,641,260 |
| (2.7475)/3 month USD-LIBOR-BBA/Feb-30 | Feb-20/2.7475 | 72,086,800 | 612,738 |
| 2.10625/3 month USD-LIBOR-BBA/Apr-24 | Apr-19/2.10625 | 171,185,300 | 140,372 |
| JPMorgan Chase Bank N.A. | | | |
| 3.162/3 month USD-LIBOR-BBA/Nov-33 | Nov-20/3.162 | 35,660,900 | 2,805,800 |
| 3.096/3 month USD-LIBOR-BBA/Nov-29 | Nov-19/3.096 | 28,528,700 | 1,755,941 |
| 2.56/3 month USD-LIBOR-BBA/Feb-22 | Feb-20/2.56 | 121,944,000 | 962,138 |
| 2.486/3 month USD-LIBOR-BBA/Jan-22 | Jan-20/2.486 | 121,944,000 | 848,730 |
| (3.162)/3 month USD-LIBOR-BBA/Nov-33 | Nov-20/3.162 | 35,660,900 | 359,462 |
| (2.486)/3 month USD-LIBOR-BBA/Jan-22 | Jan-20/2.486 | 121,944,000 | 286,568 |
| (2.56)/3 month USD-LIBOR-BBA/Feb-22 | Feb-20/2.56 | 121,944,000 | 237,791 |
| (3.096)/3 month USD-LIBOR-BBA/Nov-29 | Nov-19/3.096 | 28,528,700 | 56,487 |
| (3.095)/3 month USD-LIBOR-BBA/Nov-21 | Nov-19/3.095 | 71,321,800 | 9,272 |
| Morgan Stanley & Co. International PLC | | | |
| 2.7725/3 month USD-LIBOR-BBA/Feb-31 | Feb-21/2.7725 | 67,069,200 | 2,891,353 |
| 2.764/3 month USD-LIBOR-BBA/Feb-31 | Feb-21/2.764 | 67,069,200 | 2,853,794 |
| (2.7725)/3 month USD-LIBOR-BBA/Feb-31 | Feb-21/2.7725 | 67,069,200 | 1,208,587 |
| (2.764)/3 month USD-LIBOR-BBA/Feb-31 | Feb-21/2.764 | 67,069,200 | 1,205,234 |
| (3.0975)/3 month USD-LIBOR-BBA/Nov-21 | Nov-19/3.0975 | 71,321,800 | 9,272 |
| Total purchased swap options outstanding (cost $36,019,249) | | $35,868,193 |
|
| Mortgage Securities Fund 27 |
| | | | |
| PURCHASED OPTIONS | Expiration | | | |
| OUTSTANDING (0.7%)* | date/strike | Notional | Contract | |
| Counterparty | price | amount | amount | Value |
| JPMorgan Chase Bank N.A. | | | | |
| Federal National Mortgage | | | | |
| Association 30 yr 3.50% TBA | | | | |
| commitments (Call) | Apr-19/$99.85 | $305,000,000 | $305,000,000 | $4,610,380 |
| Federal National Mortgage | | | | |
| Association 30 yr 3.50% TBA | | | | |
| commitments (Call) | May-19/100.56 | 25,000,000 | 25,000,000 | 204,725 |
| Federal National Mortgage | | | | |
| Association 30 yr 3.50% TBA | | | | |
| commitments (Put) | May-19/101.44 | 35,000,000 | 35,000,000 | 142,730 |
| Federal National Mortgage | | | | |
| Association 30 yr 3.50% TBA | | | | |
| commitments (Put) | May-19/101.19 | 35,000,000 | 35,000,000 | 99,680 |
| Federal National Mortgage | | | | |
| Association 30 yr 3.50% TBA | | | | |
| commitments (Put) | May-19/101.07 | 35,000,000 | 35,000,000 | 82,320 |
| Federal National Mortgage | | | | |
| Association 30 yr 3.50% TBA | | | | |
| commitments (Put) | May-19/101.32 | 35,000,000 | 35,000,000 | 119,805 |
| Federal National Mortgage | | | | |
| Association 30 yr 3.50% TBA | | | | |
| commitments (Put) | May-19/99.94 | 35,000,000 | 35,000,000 | 11,620 |
| Federal National Mortgage | | | | |
| Association 30 yr 3.50% TBA | | | | |
| commitments (Put) | May-19/99.57 | 35,000,000 | 35,000,000 | 5,460 |
| Federal National Mortgage | | | | |
| Association 30 yr 3.50% TBA | | | | |
| commitments (Put) | May-19/99.69 | 35,000,000 | 35,000,000 | 7,070 |
| Federal National Mortgage | | | | |
| Association 30 yr 3.50% TBA | | | | |
| commitments (Put) | May-19/99.82 | 35,000,000 | 35,000,000 | 9,100 |
| Federal National Mortgage | | | | |
| Association 30 yr 4.00% TBA | | | | |
| commitments (Call) | Apr-19/101.80 | 86,000,000 | 86,000,000 | 906,956 |
| Total purchased options outstanding (cost $1,605,315) | | | $6,199,846 |
| | |
| | Principal | |
| ASSET-BACKED SECURITIES (2.3%)* | amount | Value |
| loanDepot Station Place Agency Securitization Trust 144A FRB | | |
| Ser. 17-LD1, Class A, (1 Month US LIBOR + 0.80%), 3.286%, 11/25/50 | $2,576,000 | $2,576,000 |
| Mello Warehouse Securitization Trust 144A FRB Ser. 18-W1, | | |
| Class A, (1 Month US LIBOR + 0.85%), 3.336%, 11/25/51 | 5,470,000 | 5,470,000 |
| Station Place Securitization Trust 144A | | |
| FRB Ser. 18-8, Class A, (1 Month US LIBOR + 0.70%), | | |
| 3.181%, 2/24/20 | 2,389,000 | 2,389,000 |
| FRB Ser. 18-5, Class A, (1 Month US LIBOR + 0.70%), | | |
| 3.181%, 9/24/19 | 4,471,000 | 4,471,000 |
| FRB Ser. 18-3, Class A, (1 Month US LIBOR + 0.70%), | | |
| 3.181%, 7/24/19 | 6,462,000 | 6,462,000 |
| Total asset-backed securities (cost $21,368,000) | | $21,368,000 |
|
| 28 Mortgage Securities Fund |
| | | |
| | Principal amount/ | |
| SHORT-TERM INVESTMENTS (10.0%)* | | shares | Value |
| Interest in $400,000,000 joint tri-party repurchase agreement | | | |
| dated 3/29/19 with HSBC Bank USA, National Association due | | | |
| 4/1/19 — maturity value of $42,223,076 for an effective yield | | | |
| of 2.580% (collateralized by various mortgage backed securities | | | |
| with coupon rates ranging from 2.500% to 5.500% and due dates | | | |
| ranging from 1/1/31 to 2/1/49, valued at $408,087,720) | | $42,214,000 | $42,214,000 |
| Putnam Government Money Market Fund 2.02% L | Shares | 10,000 | 10,000 |
| State Street Institutional U.S. Government Money Market Fund, | | | |
| Premier Class 2.39% P | Shares | 4,393,000 | 4,393,000 |
| U.S. Treasury Bills 2.479%, 4/11/19 ∆ | | $2,192,000 | 2,190,554 |
| U.S. Treasury Bills 2.545%, 6/13/19 # ∆ § | | 4,638,000 | 4,615,769 |
| U.S. Treasury Bills 2.532%, 6/6/19 # ∆ § | | 5,014,000 | 4,992,306 |
| U.S. Treasury Bills 2.528%, 6/20/19 # ∆ § | | 2,442,000 | 2,429,171 |
| U.S. Treasury Bills 2.473%, 7/25/19 ∆ § | | 12,187,000 | 12,094,968 |
| U.S. Treasury Bills 2.466%, 7/18/19 # ∆ § | | 12,959,000 | 12,867,202 |
| U.S. Treasury Bills 2.462%, 8/1/19 ∆ § | | 6,626,000 | 6,572,805 |
| Total short-term investments (cost $92,372,618) | | | $92,379,775 |
| |
| TOTAL INVESTMENTS | | | |
| Total investments (cost $1,748,323,019) | | | $1,746,963,564 |
Key to holding’s abbreviations
| |
| bp | Basis Points |
| FRB | Floating Rate Bonds: the rate shown is the current interest rate at the close of the reporting period. Rates may be subject to a cap or floor. For certain securities, the rate may represent a fixed rate currently in place at the close of the reporting period. |
| FRN | Floating Rate Notes: the rate shown is the current interest rate or yield at the close of the reporting period. Rates may be subject to a cap or floor. For certain securities, the rate may represent a fixed rate currently in place at the close of the reporting period. |
| IFB | Inverse Floating Rate Bonds, which are securities that pay interest rates that vary inversely to changes in the market interest rates. As interest rates rise, inverse floaters produce less current income. The rate shown is the current interest rate at the close of the reporting period. Rates may be subject to a cap or floor. |
| IO | Interest Only |
| PO | Principal Only |
| TBA | To Be Announced Commitments |
Notes to the fund’s portfolio
Unless noted otherwise, the notes to the fund’s portfolio are for the close of the fund’s reporting period, which ran from October 1, 2018 through March 31, 2019 (the reporting period). Within the following notes to the portfolio, references to “Putnam Management” represent Putnam Investment Management, LLC, the fund’s manager, an indirect wholly-owned subsidiary of Putnam Investments, LLC and references to “ASC 820” represent Accounting Standards Codification 820Fair Value Measurements and Disclosures.
*Percentages indicated are based on net assets of $922,930,400.
#This security, in part or in entirety, was pledged and segregated with the broker to cover margin requirements for futures contracts at the close of the reporting period. Collateral at period end totaled $212,849 and is included in Investments in securities on the Statement of assets and liabilities (Notes 1 and 9).
∆This security, in part or in entirety, was pledged and segregated with the custodian for collateral on certain derivative contracts at the close of the reporting period. Collateral at period end totaled $33,789,521 and is included in Investments in securities on the Statement of assets and liabilities (Notes 1 and 9).
|
| Mortgage Securities Fund 29 |
§This security, in part or in entirety, was pledged and segregated with the custodian for collateral on the initial margin on certain centrally cleared derivative contracts at the close of the reporting period. Collateral at period end totaled $9,342,540 and is included in Investments in securities on the Statement of assets and liabilities (Notes 1 and 9).
iThis security was pledged, or purchased with cash that was pledged, to the fund for collateral on certain derivative contracts (Note 1).
LAffiliated company (Note 5). The rate quoted in the security description is the annualized 7-day yield of the fund at the close of the reporting period.
PThis security was pledged, or purchased with cash that was pledged, to the fund for collateral on certain derivative contracts and TBA commitments. The rate quoted in the security description is the annualized 7-day yield of the fund at the close of the reporting period.
WThe rate shown represents the weighted average coupon associated with the underlying mortgage pools. Rates may be subject to a cap or floor.
At the close of the reporting period, the fund maintained liquid assets totaling $620,243,227 to cover certain derivative contracts and delayed delivery securities.
Unless otherwise noted, the rates quoted in Short-term investments security descriptions represent the weighted average yield to maturity.
144A after the name of an issuer represents securities exempt from registration under Rule 144A of the Securities Act of 1933, as amended. These securities may be resold in transactions exempt from registration, normally to qualified institutional buyers.
See Note 1 to the financial statements regarding TBA commitments.
The dates shown on debt obligations are the original maturity dates.
| | | | | |
| FUTURES CONTRACTS OUTSTANDING at 3/31/19 (Unaudited) | | | |
| | | | | | Unrealized |
| | Number of | Notional | | Expiration | appreciation/ |
| | contracts | amount | Value | date | (depreciation) |
| U.S. Treasury Bond Ultra 30 yr (Long) | 50 | $8,400,000 | $8,400,000 | Jun-19 | $323,244 |
| U.S. Treasury Note 2 yr (Long) | 182 | 38,783,063 | 38,783,063 | Jun-19 | 165,995 |
| U.S. Treasury Note 5 yr (Short) | 304 | 35,211,750 | 35,211,750 | Jun-19 | (373,483) |
| Unrealized appreciation | | | | | 489,239 |
| Unrealized (depreciation) | | | | | (373,483) |
| Total | | | | | $115,756 |
| | | |
| WRITTEN SWAP OPTIONS OUTSTANDING at 3/31/19 (premiums $32,956,800) (Unaudited) | |
| Counterparty | | Notional/ | |
| Fixed Obligation % to receive or (pay)/ | Expiration | contract | |
| Floating rate index/Maturity date | date/strike | amount | Value |
| Bank of America N.A. | | | |
| 3.1775/3 month USD-LIBOR-BBA/Nov-55 | Nov-25/3.1775 | $17,300,800 | $1,181,126 |
| 3.195/3 month USD-LIBOR-BBA/Nov-55 | Nov-25/3.195 | 34,601,700 | 2,323,850 |
| (3.1775)/3 month USD-LIBOR-BBA/Nov-55 | Nov-25/3.1775 | 17,300,800 | 2,814,840 |
| (3.195)/3 month USD-LIBOR-BBA/Nov-55 | Nov-25/3.195 | 34,601,700 | 5,703,052 |
| Citibank, N.A. | | | |
| (2.421)/3 month USD-LIBOR-BBA/Apr-29 | Apr-19/2.421 | 54,291,000 | 318,688 |
| Goldman Sachs International | | | |
| (2.20625)/3 month USD-LIBOR-BBA/Apr-24 | Apr-19/2.20625 | 85,592,600 | 161,770 |
| 2.9425/3 month USD-LIBOR-BBA/Feb-34 | Feb-24/2.9425 | 36,043,400 | 1,244,579 |
| (2.9425)/3 month USD-LIBOR-BBA/Feb-34 | Feb-24/2.9425 | 36,043,400 | 2,072,135 |
|
| 30 Mortgage Securities Fund |
| | | |
| WRITTEN SWAP OPTIONS OUTSTANDING at 3/31/19 (premiums $32,956,800) (Unaudited)cont. | |
| Counterparty | | Notional/ | |
| Fixed Obligation % to receive or (pay)/ | Expiration | contract | |
| Floating rate index/Maturity date | date/strike | amount | Value |
| JPMorgan Chase Bank N.A. | | | |
| 3.415/3 month USD-LIBOR-BBA/Nov-21 | Nov-19/3.415 | $142,643,700 | $4,279 |
| 2.975/3 month USD-LIBOR-BBA/Nov-23 | Nov-20/2.975 | 35,660,900 | 72,392 |
| 2.56/3 month USD-LIBOR-BBA/Feb-24 | Feb-22/2.56 | 121,944,000 | 673,131 |
| 2.486/3 month USD-LIBOR-BBA/Jan-24 | Jan-22/2.486 | 121,944,000 | 737,761 |
| (2.975)/3 month USD-LIBOR-BBA/Nov-23 | Nov-20/2.975 | 35,660,900 | 850,512 |
| 3.229/3 month USD-LIBOR-BBA/Nov-33 | Nov-23/3.229 | 35,660,900 | 892,949 |
| (2.486)/3 month USD-LIBOR-BBA/Jan-24 | Jan-22/2.486 | 121,944,000 | 1,309,679 |
| (2.56)/3 month USD-LIBOR-BBA/Feb-24 | Feb-22/2.56 | 121,944,000 | 1,407,234 |
| (3.229)/3 month USD-LIBOR-BBA/Nov-33 | Nov-23/3.229 | 35,660,900 | 2,568,298 |
| Morgan Stanley & Co. International PLC | | | |
| 3.3975/3 month USD-LIBOR-BBA/Nov-21 | Nov-19/3.3975 | 142,643,700 | 4,279 |
| 2.7225/3 month USD-LIBOR-BBA/Feb-30 | Feb-20/2.7225 | 48,777,600 | 447,778 |
| 2.715/3 month USD-LIBOR-BBA/Feb-30 | Feb-20/2.715 | 48,777,600 | 472,167 |
| 3.01/3 month USD-LIBOR-BBA/Feb-36 | Feb-26/3.01 | 18,291,600 | 750,139 |
| 2.97/3 month USD-LIBOR-BBA/Feb-36 | Feb-26/2.97 | 18,291,600 | 771,906 |
| (2.97)/3 month USD-LIBOR-BBA/Feb-36 | Feb-26/2.97 | 18,291,600 | 1,107,373 |
| (3.01)/3 month USD-LIBOR-BBA/Feb-36 | Feb-26/3.01 | 18,291,600 | 1,138,652 |
| (2.715)/3 month USD-LIBOR-BBA/Feb-30 | Feb-20/2.715 | 48,777,600 | 1,701,850 |
| (2.7225)/3 month USD-LIBOR-BBA/Feb-30 | Feb-20/2.7225 | 48,777,600 | 1,712,094 |
| Total | | | $32,442,513 |
| | | | |
| WRITTEN OPTIONS OUTSTANDING at 3/31/19 (premiums $1,375,625) (Unaudited) | |
| | Expiration | Notional | Contract | |
| Counterparty | date/strike price | amount | amount | Value |
| JPMorgan Chase Bank N.A. | | | | |
| Federal National Mortgage | | | | |
| Association 30 yr 3.50% TBA | | | | |
| commitments (Put) | May-19/$100.57 | $35,000,000 | $35,000,000 | $36,015 |
| Federal National Mortgage | | | | |
| Association 30 yr 3.50% TBA | | | | |
| commitments (Put) | May-19/100.94 | 35,000,000 | 35,000,000 | 67,480 |
| Federal National Mortgage | | | | |
| Association 30 yr 3.50% TBA | | | | |
| commitments (Put) | May-19/100.69 | 35,000,000 | 35,000,000 | 44,590 |
| Federal National Mortgage | | | | |
| Association 30 yr 3.50% TBA | | | | |
| commitments (Put) | May-19/100.82 | 35,000,000 | 35,000,000 | 54,985 |
| Federal National Mortgage | | | | |
| Association 30 yr 3.50% TBA | | | | |
| commitments (Put) | May-19/100.56 | 25,000,000 | 25,000,000 | 24,500 |
| Federal National Mortgage | | | | |
| Association 30 yr 3.50% TBA | | | | |
| commitments (Put) | May-19/100.44 | 35,000,000 | 35,000,000 | 29,015 |
| Federal National Mortgage | | | | |
| Association 30 yr 3.50% TBA | | | | |
| commitments (Put) | May-19/100.32 | 35,000,000 | 35,000,000 | 23,275 |
|
| Mortgage Securities Fund 31 |
| | | | |
| WRITTEN OPTIONS OUTSTANDING at 3/31/19 (premiums $1,375,625) (Unaudited)cont. | |
| | Expiration | Notional | Contract | |
| Counterparty | date/strike price | amount | amount | Value |
| JPMorgan Chase Bank N.A.cont. | | | | |
| Federal National Mortgage | | | | |
| Association 30 yr 3.50% TBA | | | | |
| commitments (Put) | May-19/$100.19 | $35,000,000 | $35,000,000 | $18,550 |
| Federal National Mortgage | | | | |
| Association 30 yr 3.50% TBA | | | | |
| commitments (Put) | May-19/100.07 | 35,000,000 | 35,000,000 | 14,735 |
| Federal National Mortgage | | | | |
| Association 30 yr 3.50% TBA | | | | |
| commitments (Put) | Apr-19/99.85 | 305,000,000 | 305,000,000 | 305 |
| Federal National Mortgage | | | | |
| Association 30 yr 4.00% TBA | | | | |
| commitments (Put) | Apr-19/101.80 | 86,000,000 | 86,000,000 | 86 |
| Total | | | | $313,536 |
| | | | |
| FORWARD PREMIUM SWAP OPTION CONTRACTS OUTSTANDING at 3/31/19 (Unaudited) | |
| Counterparty | | | | |
| Fixed right or obligation % to receive | | Notional/ | Premium | Unrealized |
| or (pay)/Floating rate index/ | Expiration | contract | receivable/ | appreciation/ |
| Maturity date | date/strike | amount | (payable) | (depreciation) |
| Bank of America N.A. | | | | |
| 2.647/3 month USD-LIBOR-BBA/ | | | | |
| Jun-29 (Purchased) | Jun-24/2.647 | $37,479,500 | $(1,465,448) | $(286,718) |
| (2.647)/3 month USD-LIBOR-BBA/ | | | | |
| Jun-29 (Purchased) | Jun-24/2.647 | 37,479,500 | (1,465,448) | (413,774) |
| Citibank, N.A. | | | | |
| 2.19625/3 month USD-LIBOR-BBA/ | | | | |
| Apr-24 (Purchased) | Apr-19/2.19625 | 135,146,300 | (238,758) | (2,703) |
| (2.38875)/3 month USD-LIBOR-BBA/ | | | | |
| Apr-24 (Purchased) | Apr-19/2.38875 | 135,146,300 | (211,729) | (20,272) |
| 2.689/3 month USD-LIBOR-BBA/ | | | | |
| Nov-49 (Purchased) | Nov-24/2.689 | 4,579,000 | (589,546) | (106,187) |
| (2.689)/3 month USD-LIBOR-BBA/ | | | | |
| Nov-49 (Purchased) | Nov-24/2.689 | 4,579,000 | (589,546) | (112,598) |
| 2.654/3 month USD-LIBOR-BBA/ | | | | |
| Jun-29 (Purchased) | Jun-24/2.654 | 37,479,500 | (1,465,448) | (280,721) |
| (2.654)/3 month USD-LIBOR-BBA/ | | | | |
| Jun-29 (Purchased) | Jun-24/2.654 | 37,479,500 | (1,465,448) | (419,021) |
| 2.2925/3 month USD-LIBOR-BBA/ | | | | |
| Apr-24 (Written) | Apr-19/2.2925 | 67,573,100 | 225,244 | 13,515 |
| (2.2925)/3 month USD-LIBOR-BBA/ | | | | |
| Apr-24 (Written) | Apr-19/2.2925 | 67,573,100 | 225,244 | (15,542) |
| Goldman Sachs International | | | | |
| 2.1975/3 month USD-LIBOR-BBA/ | | | | |
| May-24 (Purchased) | May-19/2.1975 | 135,146,300 | (250,021) | 16,218 |
| (2.3975)/3 month USD-LIBOR-BBA/ | | | | |
| May-24 (Purchased) | May-19/2.3975 | 135,146,300 | (236,506) | (37,841) |
| (2.725)/3 month USD-LIBOR-BBA/ | | | | |
| Nov-39 (Purchased) | Nov-29/2.725 | 7,631,600 | (611,673) | (44,645) |
|
| 32 Mortgage Securities Fund |
| | | | |
| FORWARD PREMIUM SWAP OPTION CONTRACTS OUTSTANDING at 3/31/19 (Unaudited)cont. | |
| Counterparty | | | | |
| Fixed right or obligation % to receive | | Notional/ | Premium | Unrealized |
| or (pay)/Floating rate index/ | Expiration | contract | receivable/ | appreciation/ |
| Maturity date | date/strike | amount | (payable) | (depreciation) |
| Goldman Sachs Internationalcont. | | | | |
| (3.005)/3 month USD-LIBOR-BBA/ | | | | |
| Nov-39 (Purchased) | Nov-29/3.005 | $7,631,600 | $(528,870) | $(50,445) |
| 3.005/3 month USD-LIBOR-BBA/ | | | | |
| Nov-39 (Purchased) | Nov-29/3.005 | 7,631,600 | (694,476) | (54,795) |
| 2.8175/3 month USD-LIBOR-BBA/ | | | | |
| Mar-47 (Purchased) | Mar-27/2.8175 | 4,497,500 | (567,809) | (60,267) |
| 2.725/3 month USD-LIBOR-BBA/ | | | | |
| Nov-39 (Purchased) | Nov-29/2.725 | 7,631,600 | (611,673) | (66,777) |
| (2.8175)/3 month USD-LIBOR-BBA/ | | | | |
| Mar-47 (Purchased) | Mar-27/2.8175 | 4,497,500 | (567,809) | (119,274) |
| 2.2975/3 month USD-LIBOR-BBA/ | | | | |
| May-24 (Written) | May-19/2.2975 | 67,573,100 | 235,605 | 18,245 |
| (2.2975)/3 month USD-LIBOR-BBA/ | | | | |
| May-24 (Written) | May-19/2.2975 | 67,573,100 | 235,605 | (29,732) |
| JPMorgan Chase Bank N.A. | | | | |
| 2.50/3 month USD-LIBOR-BBA/ | | | | |
| Nov-39 (Purchased) | Nov-29/2.50 | 7,631,600 | (441,106) | 13,890 |
| (2.902)/3 month USD-LIBOR-BBA/ | | | | |
| Nov-49 (Purchased) | Nov-24/2.902 | 4,579,000 | (491,327) | (101,654) |
| (2.50)/3 month USD-LIBOR-BBA/ | | | | |
| Nov-39 (Purchased) | Nov-29/2.50 | 7,631,600 | (793,686) | (123,785) |
| 2.902/3 month USD-LIBOR-BBA/ | | | | |
| Nov-49 (Purchased) | Nov-24/2.902 | 4,579,000 | (707,913) | (126,060) |
| 2.8325/3 month USD-LIBOR-BBA/ | | | | |
| Feb-52 (Purchased) | Feb-22/2.8325 | 22,487,600 | (3,139,831) | (724,326) |
| (2.8325)/3 month USD-LIBOR-BBA/ | | | | |
| Feb-52 (Purchased) | Feb-22/2.8325 | 22,487,600 | (3,139,831) | (1,678,698) |
| Morgan Stanley & Co. International PLC | | | | |
| 3.27/3 month USD-LIBOR-BBA/ | | | | |
| Oct-53 (Purchased) | Oct-23/3.27 | 219,200 | (25,011) | 13,851 |
| (3.27)/3 month USD-LIBOR-BBA/ | | | | |
| Oct-53 (Purchased) | Oct-23/3.27 | 219,200 | (25,011) | (12,540) |
| 2.505/3 month USD-LIBOR-BBA/ | | | | |
| Nov-49 (Purchased) | Nov-24/2.505 | 4,579,000 | (492,700) | (84,208) |
| (2.505)/3 month USD-LIBOR-BBA/ | | | | |
| Nov-49 (Purchased) | Nov-24/2.505 | 4,579,000 | (701,503) | (136,637) |
| Unrealized appreciation | | | | 75,719 |
| Unrealized (depreciation) | | | | (5,109,220) |
| Total | | | | $(5,033,501) |
| | | |
| TBA SALE COMMITMENTS OUTSTANDING at 3/31/19 (proceeds receivable $138,053,828) (Unaudited) |
| | Principal | Settlement | |
| Agency | amount | date | Value |
| Federal National Mortgage Association, 3.50%, 5/1/49 | $25,000,000 | 5/13/19 | $25,317,383 |
| Federal National Mortgage Association, 3.00%, 4/1/49 | 113,000,000 | 4/10/19 | 112,479,137 |
| Total | | | $137,796,520 |
|
| Mortgage Securities Fund 33 |
| | | | | | |
| CENTRALLY CLEARED INTEREST RATE SWAP CONTRACTS OUTSTANDING at 3/31/19 (Unaudited) |
| | | Upfront | | | | |
| | | premium | | | | Unrealized |
| | | received | Termination | Payments | Payments | appreciation/ |
| Notional amount | Value | (paid) | date | made by fund | received by fund | (depreciation) |
| $9,777,000 | $1,519,414 | $(333) | 11/8/48 | 3 month USD- | 3.312% — | $1,609,045 |
| | | | | LIBOR-BBA — | Semiannually | |
| | | | | Quarterly | | |
| 35,660,900 | 2,052,606 | (505) | 1/3/29 | 3.065% — | 3 month USD- | (2,075,542) |
| | | | | Semiannually | LIBOR-BBA — | |
| | | | | | Quarterly | |
| 19,684,800 | 1,158,273 | (279) | 3/4/29 | 3 month USD- | 3.073% — | 1,163,324 |
| | | | | LIBOR-BBA — | Semiannually | |
| | | | | Quarterly | | |
| 106,982,700 | 221,989 | (53,750) | 1/22/20 | 3 month USD- | 2.86% — | 188,539 |
| | | | | LIBOR-BBA — | Semiannually | |
| | | | | Quarterly | | |
| 106,982,700 | 491,265E | 50,948 | 1/22/21 | 2.77% — | 3 month USD- | (440,316) |
| | | | | Semiannually | LIBOR-BBA — | |
| | | | | | Quarterly | |
| 3,938,800 | 24,389E | (22) | 2/2/24 | 3 month USD- | 2.5725% — | 24,367 |
| | | | | LIBOR-BBA — | Semiannually | |
| | | | | Quarterly | | |
| 10,194,500 | 54,775E | (57) | 2/2/24 | 2.528% — | 3 month USD- | (54,832) |
| | | | | Semiannually | LIBOR-BBA — | |
| | | | | | Quarterly | |
| 5,135,200 | 120,426 | (68) | 2/13/29 | 2.6785% — | 3 month USD- | (120,812) |
| | | | | Semiannually | LIBOR-BBA — | |
| | | | | | Quarterly | |
| 889,198,400 | 3,650,159E | 4,659,101 | 6/19/21 | 2.55% — | 3 month USD- | 1,008,941 |
| | | | | Semiannually | LIBOR-BBA — | |
| | | | | | Quarterly | |
| 551,329,400 | 5,787,856E | 7,015,710 | 6/19/24 | 2.50% — | 3 month USD- | 1,227,854 |
| | | | | Semiannually | LIBOR-BBA — | |
| | | | | | Quarterly | |
| 372,755,700 | 7,799,540E | (8,990,406) | 6/19/29 | 3 month USD- | 2.65% — | (1,190,866) |
| | | | | LIBOR-BBA — | Semiannually | |
| | | | | Quarterly | | |
| 14,793,800 | 683,355E | 748,195 | 6/19/49 | 2.80% — | 3 month USD- | 64,839 |
| | | | | Semiannually | LIBOR-BBA — | |
| | | | | | Quarterly | |
| 21,340,200 | 202,049E | (4,319) | 12/2/23 | 3 month USD- | 2.536% — | 197,730 |
| | | | | LIBOR-BBA — | Semiannually | |
| | | | | Quarterly | | |
| 7,377,600 | 45,343E | (1,261) | 2/2/24 | 3 month USD- | 2.57% — | 44,082 |
| | | | | LIBOR-BBA — | Semiannually | |
| | | | | Quarterly | | |
| 5,556,700 | 184,427E | (79) | 3/5/30 | 3 month USD- | 2.806% — | 184,348 |
| | | | | LIBOR-BBA — | Semiannually | |
| | | | | Quarterly | | |
| 15,259,700 | 291,537E | (216) | 3/16/30 | 2.647% — | 3 month USD- | (291,753) |
| | | | | Semiannually | LIBOR-BBA — | |
| | | | | | Quarterly | |
|
| 34 Mortgage Securities Fund |
| | | | | | |
| CENTRALLY CLEARED INTEREST RATE SWAP CONTRACTS OUTSTANDING at 3/31/19 (Unaudited)cont. |
| | | Upfront | | | | |
| | | premium | | | | Unrealized |
| | | received | Termination | Payments | Payments | appreciation/ |
| Notional amount | Value | (paid) | date | made by fund | received by fund | (depreciation) |
| $5,093,700 | $49,312E | $(174) | 3/28/52 | 2.67% — | 3 month USD- | $(49,486) |
| | | | | Semiannually | LIBOR-BBA — | |
| | | | | | Quarterly | |
| 14,417,400 | 11,952E | (7,413) | 3/26/30 | 2.44% — | 3 month USD- | (19,365) |
| | | | | Semiannually | LIBOR-BBA — | |
| | | | | | Quarterly | |
| 20,622,000 | 138,745 | (273) | 3/29/29 | 3 month USD- | 2.33973% — | (142,148) |
| | | | | LIBOR-BBA — | Semiannually | |
| | | | | Quarterly | | |
| 70,276,000 | 294,878E | (663) | 4/10/24 | 3 month USD- | 2.20% — | (295,542) |
| | | | | LIBOR-BBA — | Semiannually | |
| | | | | Quarterly | | |
| 58,563,400 | 209,540E | (829) | 4/16/29 | 3 month USD- | 2.375% — | (210,369) |
| | | | | LIBOR-BBA — | Semiannually | |
| | | | | Quarterly | | |
| 31,942,000 | 7,027 | (258) | 4/2/24 | 2.28456% — | 3 month USD- | 6,769 |
| | | | | Semiannually | LIBOR-BBA — | |
| | | | | | Quarterly | |
| Total | | $3,413,049 | | | | $828,807 |
EExtended effective date.
| | | | | | |
| OTC TOTAL RETURN SWAP CONTRACTS OUTSTANDING at 3/31/19 (Unaudited) | |
| | | Upfront | | | | |
| | | premium | Termina- | Payments | Total return | Unrealized |
| Swap counterparty/ | | received | tion | received (paid) | received by | appreciation/ |
| Notional amount | Value | (paid) | date | by fund | or paid by fund | (depreciation) |
| Bank of America N.A. | | | | | | |
| $243,085 | $235,152 | $— | 1/12/41 | 4.00% (1 month | Synthetic TRS | $(5,717) |
| | | | | USD-LIBOR) — | Index 4.00% 30 year | |
| | | | | Monthly | Fannie Mae pools — | |
| | | | | | Monthly | |
| 119,784 | 115,875 | — | 1/12/41 | 4.00% (1 month | Synthetic TRS | (2,817) |
| | | | | USD-LIBOR) — | Index 4.00% 30 year | |
| | | | | Monthly | Fannie Mae pools — | |
| | | | | | Monthly | |
| Barclays Bank PLC | | | | | | |
| 19,776,879 | 19,893,955 | — | 1/12/40 | 4.00% (1 month | Synthetic MBX | 130,261 |
| | | | | USD-LIBOR) — | Index 4.00% 30 year | |
| | | | | Monthly | Fannie Mae pools — | |
| | | | | | Monthly | |
| 3,908,928 | 3,932,068 | — | 1/12/40 | 4.00% (1 month | Synthetic MBX | 25,747 |
| | | | | USD-LIBOR) — | Index 4.00% 30 year | |
| | | | | Monthly | Fannie Mae pools — | |
| | | | | | Monthly | |
| 1,853,982 | 1,864,958 | — | 1/12/40 | 4.00% (1 month | Synthetic MBX | 12,211 |
| | | | | USD-LIBOR) — | Index 4.00% 30 year | |
| | | | | Monthly | Fannie Mae pools — | |
| | | | | | Monthly | |
|
| Mortgage Securities Fund 35 |
| | | | | | |
| OTC TOTAL RETURN SWAP CONTRACTS OUTSTANDING at 3/31/19 (Unaudited)cont. | |
| | | Upfront | | | | |
| | | premium | Termina- | Payments | Total return | Unrealized |
| Swap counterparty/ | | received | tion | received (paid) | received by | appreciation/ |
| Notional amount | Value | (paid) | date | by fund | or paid by fund | (depreciation) |
| Barclays Bank PLCcont. | | | | | |
| $1,360,812 | $1,367,506 | $— | 1/12/40 | 4.50% (1 month | Synthetic MBX | $7,894 |
| | | | | USD-LIBOR) — | Index 4.50% 30 year | |
| | | | | Monthly | Fannie Mae pools — | |
| | | | | | Monthly | |
| 755,123 | 758,838 | — | 1/12/40 | 4.50% (1 month | Synthetic MBX | 4,381 |
| | | | | USD-LIBOR) — | Index 4.50% 30 year | |
| | | | | Monthly | Fannie Mae pools — | |
| | | | | | Monthly | |
| 42,879,378 | 43,249,352 | — | 1/12/41 | 5.00% (1 month | Synthetic MBX | 416,528 |
| | | | | USD-LIBOR) — | Index 5.00% 30 year | |
| | | | | Monthly | Fannie Mae pools — | |
| | | | | | Monthly | |
| 10,647,819 | 10,739,691 | — | 1/12/41 | 5.00% (1 month | Synthetic MBX | 103,432 |
| | | | | USD-LIBOR) — | Index 5.00% 30 year | |
| | | | | Monthly | Fannie Mae pools — | |
| | | | | | Monthly | |
| 3,907,330 | 3,936,553 | — | 1/12/40 | 5.00% (1 month | Synthetic MBX | 33,493 |
| | | | | USD-LIBOR) — | Index 5.00% 30 year | |
| | | | | Monthly | Fannie Mae pools — | |
| | | | | | Monthly | |
| 18,604,669 | 18,634,532 | — | 1/12/41 | 5.00% (1 month | Synthetic MBX Index | 49,961 |
| | | | | USD-LIBOR) — | 5.00% 30 year Ginnie | |
| | | | | Monthly | Mae II pools — | |
| | | | | | Monthly | |
| 302,683 | 303,169 | — | 1/12/41 | 5.00% (1 month | Synthetic MBX Index | 813 |
| | | | | USD-LIBOR) — | 5.00% 30 year Ginnie | |
| | | | | Monthly | Mae II pools — | |
| | | | | | Monthly | |
| 3,319,691 | 3,327,186 | — | 1/12/39 | (6.00%) 1 month | Synthetic MBX | (12,393) |
| | | | | USD-LIBOR — | Index 6.00% 30 year | |
| | | | | Monthly | Fannie Mae pools — | |
| | | | | | Monthly | |
| 53,245,584 | 53,376,516 | — | 1/12/38 | (6.50%) 1 month | Synthetic MBX | (216,935) |
| | | | | USD-LIBOR — | Index 6.50% 30 year | |
| | | | | Monthly | Fannie Mae pools — | |
| | | | | | Monthly | |
| 186,620 | 180,576 | — | 1/12/43 | 3.50% (1 month | Synthetic TRS | (4,516) |
| | | | | USD-LIBOR) — | Index 3.50% 30 year | |
| | | | | Monthly | Fannie Mae pools — | |
| | | | | | Monthly | |
| 411,114 | 396,586 | — | 1/12/42 | 4.00% (1 month | Synthetic TRS | (10,921) |
| | | | | USD-LIBOR) — | Index 4.00% 30 year | |
| | | | | Monthly | Fannie Mae pools — | |
| | | | | | Monthly | |
| 144,890 | 140,162 | — | 1/12/41 | 4.00% (1 month | Synthetic TRS | (3,408) |
| | | | | USD-LIBOR) — | Index 4.00% 30 year | |
| | | | | Monthly | Fannie Mae pools — | |
| | | | | | Monthly | |
|
| 36 Mortgage Securities Fund |
| | | | | | |
| OTC TOTAL RETURN SWAP CONTRACTS OUTSTANDING at 3/31/19 (Unaudited)cont. | |
| | | Upfront | | | | |
| | | premium | Termina- | Payments | Total return | Unrealized |
| Swap counterparty/ | | received | tion | received (paid) | received by | appreciation/ |
| Notional amount | Value | (paid) | date | by fund | or paid by fund | (depreciation) |
| Barclays Bank PLCcont. | | | | | |
| $144,739 | $140,016 | $— | 1/12/41 | 4.00% (1 month | Synthetic TRS | $(3,404) |
| | | | | USD-LIBOR) — | Index 4.00% 30 year | |
| | | | | Monthly | Fannie Mae pools — | |
| | | | | | Monthly | |
| 55,090 | 53,292 | — | 1/12/41 | 4.00% (1 month | Synthetic TRS | (1,296) |
| | | | | USD-LIBOR) — | Index 4.00% 30 year | |
| | | | | Monthly | Fannie Mae pools — | |
| | | | | | Monthly | |
| 15,843 | 15,326 | — | 1/12/41 | 4.00% (1 month | Synthetic TRS | (373) |
| | | | | USD-LIBOR) — | Index 4.00% 30 year | |
| | | | | Monthly | Fannie Mae pools — | |
| | | | | | Monthly | |
| 15,639 | 14,723 | — | 1/12/40 | 4.50% (1 month | Synthetic TRS | (761) |
| | | | | USD-LIBOR) — | Index 4.50% 30 year | |
| | | | | Monthly | Fannie Mae pools — | |
| | | | | | Monthly | |
| 13,030 | 12,503 | — | 1/12/40 | 5.00% (1 month | Synthetic TRS | (389) |
| | | | | USD-LIBOR) — | Index 5.00% 30 year | |
| | | | | Monthly | Fannie Mae pools — | |
| | | | | | Monthly | |
| 696,546 | 665,982 | — | 1/12/41 | (5.00%) 1 month | Synthetic TRS | 23,202 |
| | | | | USD-LIBOR — | Index 5.00% 30 year | |
| | | | | Monthly | Fannie Mae pools — | |
| | | | | | Monthly | |
| 379,595 | 371,206 | — | 1/12/39 | 5.50% (1 month | Synthetic TRS | (4,044) |
| | | | | USD-LIBOR) — | Index 5.50% 30 year | |
| | | | | Monthly | Fannie Mae pools — | |
| | | | | | Monthly | |
| 2,661 | 2,602 | — | 1/12/39 | (5.50%) 1 month | Synthetic TRS | 28 |
| | | | | USD-LIBOR — | Index 5.50% 30 year | |
| | | | | Monthly | Fannie Mae pools — | |
| | | | | | Monthly | |
| 6,623 | 6,477 | — | 1/12/39 | (5.50%) 1 month | Synthetic TRS | 71 |
| | | | | USD-LIBOR — | Index 5.50% 30 year | |
| | | | | Monthly | Fannie Mae pools — | |
| | | | | | Monthly | |
| 6,623 | 6,477 | — | 1/12/39 | (5.50%) 1 month | Synthetic TRS | 71 |
| | | | | USD-LIBOR — | Index 5.50% 30 year | |
| | | | | Monthly | Fannie Mae pools — | |
| | | | | | Monthly | |
| 15,908 | 15,556 | — | 1/12/39 | (5.50%) 1 month | Synthetic TRS | 169 |
| | | | | USD-LIBOR — | Index 5.50% 30 year | |
| | | | | Monthly | Fannie Mae pools — | |
| | | | | | Monthly | |
| 203,268 | 200,442 | — | 1/12/39 | 6.00% (1 month | Synthetic TRS | (504) |
| | | | | USD-LIBOR) — | Index 6.00% 30 year | |
| | | | | Monthly | Fannie Mae pools — | |
| | | | | | Monthly | |
|
| Mortgage Securities Fund 37 |
| | | | | | |
| OTC TOTAL RETURN SWAP CONTRACTS OUTSTANDING at 3/31/19 (Unaudited)cont. | |
| | | Upfront | | | | |
| | | premium | Termina- | Payments | Total return | Unrealized |
| Swap counterparty/ | | received | tion | received (paid) | received by | appreciation/ |
| Notional amount | Value | (paid) | date | by fund | or paid by fund | (depreciation) |
| Barclays Bank PLCcont. | | | | | |
| $402,463 | $396,794 | $— | 1/12/38 | 6.50% (1 month | Synthetic TRS | $(1,040) |
| | | | | USD-LIBOR) — | Index 6.50% 30 year | |
| | | | | Monthly | Fannie Mae pools — | |
| | | | | | Monthly | |
| 23,638 | 23,305 | — | 1/12/38 | 6.50% (1 month | Synthetic TRS | (61) |
| | | | | USD-LIBOR) — | Index 6.50% 30 year | |
| | | | | Monthly | Fannie Mae pools — | |
| | | | | | Monthly | |
| 710,285 | 700,281 | — | 1/12/38 | (6.50%) 1 month | Synthetic TRS | 1,835 |
| | | | | USD-LIBOR — | Index 6.50% 30 year | |
| | | | | Monthly | Fannie Mae pools — | |
| | | | | | Monthly | |
| Citibank, N.A. | | | | | | |
| 588,621 | 593,700 | — | 1/12/41 | 5.00% (1 month | Synthetic MBX | 5,718 |
| | | | | USD-LIBOR) — | Index 5.00% 30 year | |
| | | | | Monthly | Fannie Mae pools — | |
| | | | | | Monthly | |
| 64,005 | 64,557 | — | 1/12/41 | 5.00% (1 month | Synthetic MBX | 622 |
| | | | | USD-LIBOR) — | Index 5.00% 30 year | |
| | | | | Monthly | Fannie Mae pools — | |
| | | | | | Monthly | |
| 6,447 | 6,304 | — | 1/12/39 | (5.50%) 1 month | Synthetic TRS | 69 |
| | | | | USD-LIBOR — | Index 5.50% 30 year | |
| | | | | Monthly | Fannie Mae pools — | |
| | | | | | Monthly | |
| Credit Suisse International | | | | | |
| 483,666 | 487,839 | — | 1/12/41 | 5.00% (1 month | Synthetic MBX | 4,698 |
| | | | | USD-LIBOR) — | Index 5.00% 30 year | |
| | | | | Monthly | Fannie Mae pools — | |
| | | | | | Monthly | |
| 142,439 | 142,668 | — | 1/12/41 | 5.00% (1 month | Synthetic MBX Index | 383 |
| | | | | USD-LIBOR) — | 5.00% 30 year Ginnie | |
| | | | | Monthly | Mae II pools — | |
| | | | | | Monthly | |
| 190,407 | 178,118 | — | 1/12/45 | 3.50% (1 month | Synthetic TRS | (10,714) |
| | | | | USD-LIBOR) — | Index 3.50% 30 year | |
| | | | | Monthly | Fannie Mae pools — | |
| | | | | | Monthly | |
| 169,567 | 164,023 | — | 1/12/44 | 3.50% (1 month | Synthetic TRS | (4,180) |
| | | | | USD-LIBOR) — | Index 3.50% 30 year | |
| | | | | Monthly | Fannie Mae pools — | |
| | | | | | Monthly | |
| 18,948 | 18,334 | — | 1/12/43 | 3.50% (1 month | Synthetic TRS | (459) |
| | | | | USD-LIBOR) — | Index 3.50% 30 year | |
| | | | | Monthly | Fannie Mae pools — | |
| | | | | | Monthly | |
|
| 38 Mortgage Securities Fund |
| | | | | | |
| OTC TOTAL RETURN SWAP CONTRACTS OUTSTANDING at 3/31/19 (Unaudited)cont. | |
| | | Upfront | | | | |
| | | premium | Termina- | Payments | Total return | Unrealized |
| Swap counterparty/ | | received | tion | received (paid) | received by | appreciation/ |
| Notional amount | Value | (paid) | date | by fund | or paid by fund | (depreciation) |
| Credit Suisse Internationalcont. | | | | | |
| $5,182 | $5,014 | $— | 1/12/43 | 3.50% (1 month | Synthetic TRS | $(125) |
| | | | | USD-LIBOR) — | Index 3.50% 30 year | |
| | | | | Monthly | Fannie Mae pools — | |
| | | | | | Monthly | |
| 1,581,414 | 1,479,271 | — | 1/12/45 | 4.00% (1 month | Synthetic TRS | (88,096) |
| | | | | USD-LIBOR) — | Index 4.00% 30 year | |
| | | | | Monthly | Fannie Mae pools — | |
| | | | | | Monthly | |
| 1,303,496 | 1,250,691 | — | 1/12/44 | 4.00% (1 month | Synthetic TRS | (41,397) |
| | | | | USD-LIBOR) — | Index 4.00% 30 year | |
| | | | | Monthly | Fannie Mae pools — | |
| | | | | | Monthly | |
| 369,723 | 354,746 | — | 1/12/44 | 4.00% (1 month | Synthetic TRS | (11,742) |
| | | | | USD-LIBOR) — | Index 4.00% 30 year | |
| | | | | Monthly | Fannie Mae pools — | |
| | | | | | Monthly | |
| 246,471 | 237,762 | — | 1/12/42 | 4.00% (1 month | Synthetic TRS | (6,547) |
| | | | | USD-LIBOR) — | Index 4.00% 30 year | |
| | | | | Monthly | Fannie Mae pools — | |
| | | | | | Monthly | |
| 192,649 | 180,206 | — | 1/12/45 | 4.00% (1 month | Synthetic TRS | (10,732) |
| | | | | USD-LIBOR) — | Index 4.00% 30 year | |
| | | | | Monthly | Fannie Mae pools — | |
| | | | | | Monthly | |
| 862,915 | 834,754 | — | 1/12/41 | (4.00%) 1 month | Synthetic TRS | 20,295 |
| | | | | USD-LIBOR — | Index 4.00% 30 year | |
| | | | | Monthly | Fannie Mae pools — | |
| | | | | | Monthly | |
| 697,179 | 666,588 | — | 1/12/41 | (5.00%) 1 month | Synthetic TRS | 23,223 |
| | | | | USD-LIBOR — | Index 5.00% 30 year | |
| | | | | Monthly | Fannie Mae pools — | |
| | | | | | Monthly | |
| 6,623 | 6,477 | — | 1/12/39 | (5.50%) 1 month | Synthetic TRS | 71 |
| | | | | USD-LIBOR — | Index 5.50% 30 year | |
| | | | | Monthly | Fannie Mae pools — | |
| | | | | | Monthly | |
| Deutsche Bank AG | | | | | | |
| 163,767 | 164,230 | — | 1/12/41 | 4.50% (1 month | Synthetic MBX Index | 607 |
| | | | | USD-LIBOR) — | 4.50% 30 year Ginnie | |
| | | | | Monthly | Mae II pools — | |
| | | | | | Monthly | |
| 9,544 | 9,183 | — | 1/12/40 | 4.00% (1 month | Synthetic TRS | (270) |
| | | | | USD-LIBOR) — | Index 4.00% 30 year | |
| | | | | Monthly | Fannie Mae pools — | |
| | | | | | Monthly | |
|
| Mortgage Securities Fund 39 |
| | | | | | |
| OTC TOTAL RETURN SWAP CONTRACTS OUTSTANDING at 3/31/19 (Unaudited)cont. | |
| | | Upfront | | | | |
| | | premium | Termina- | Payments | Total return | Unrealized |
| Swap counterparty/ | | received | tion | received (paid) | received by | appreciation/ |
| Notional amount | Value | (paid) | date | by fund | or paid by fund | (depreciation) |
| Deutsche Bank AGcont. | | | | | |
| $15,639 | $14,723 | $— | 1/12/40 | (4.50%) 1 month | Synthetic TRS | $761 |
| | | | | USD-LIBOR — | Index 4.50% 30 year | |
| | | | | Monthly | Fannie Mae pools — | |
| | | | | | Monthly | |
| 9,085 | 8,717 | — | 1/12/40 | 5.00% (1 month | Synthetic TRS | (271) |
| | | | | USD-LIBOR) — | Index 5.00% 30 year | |
| | | | | Monthly | Fannie Mae pools — | |
| | | | | | Monthly | |
| Goldman Sachs International | | | | | |
| 2,469,919 | 2,491,230 | — | 1/12/41 | 5.00% (1 month | Synthetic MBX | 23,993 |
| | | | | USD-LIBOR) — | Index 5.00% 30 year | |
| | | | | Monthly | Fannie Mae pools — | |
| | | | | | Monthly | |
| 186,625 | 187,084 | — | 1/12/38 | (6.50%) 1 month | Synthetic MBX | (760) |
| | | | | USD-LIBOR — | Index 6.50% 30 year | |
| | | | | Monthly | Fannie Mae pools — | |
| | | | | | Monthly | |
| 294,673 | 295,397 | — | 1/12/38 | (6.50%) 1 month | Synthetic MBX | (1,201) |
| | | | | USD-LIBOR — | Index 6.50% 30 year | |
| | | | | Monthly | Fannie Mae pools — | |
| | | | | | Monthly | |
| 497,635 | 498,859 | — | 1/12/38 | (6.50%) 1 month | Synthetic MBX | (2,027) |
| | | | | USD-LIBOR — | Index 6.50% 30 year | |
| | | | | Monthly | Fannie Mae pools — | |
| | | | | | Monthly | |
| 654,884 | 656,494 | — | 1/12/38 | (6.50%) 1 month | Synthetic MBX | (2,668) |
| | | | | USD-LIBOR — | Index 6.50% 30 year | |
| | | | | Monthly | Fannie Mae pools — | |
| | | | | | Monthly | |
| 785,867 | 787,800 | — | 1/12/38 | (6.50%) 1 month | Synthetic MBX | (3,202) |
| | | | | USD-LIBOR — | Index 6.50% 30 year | |
| | | | | Monthly | Fannie Mae pools — | |
| | | | | | Monthly | |
| 1,380,302 | 1,383,696 | — | 1/12/38 | (6.50%) 1 month | Synthetic MBX | (5,624) |
| | | | | USD-LIBOR — | Index 6.50% 30 year | |
| | | | | Monthly | Fannie Mae pools — | |
| | | | | | Monthly | |
| 3,674,219 | 3,683,254 | — | 1/12/38 | (6.50%) 1 month | Synthetic MBX | (14,970) |
| | | | | USD-LIBOR — | Index 6.50% 30 year | |
| | | | | Monthly | Fannie Mae pools — | |
| | | | | | Monthly | |
| 5,033,471 | 5,045,848 | — | 1/12/38 | (6.50%) 1 month | Synthetic MBX | (20,508) |
| | | | | USD-LIBOR — | Index 6.50% 30 year | |
| | | | | Monthly | Fannie Mae pools — | |
| | | | | | Monthly | |
| 963,044 | 923,805 | — | 1/12/44 | (3.00%) 1 month | Synthetic TRS | 31,928 |
| | | | | USD-LIBOR — | Index 3.00% 30 year | |
| | | | | Monthly | Fannie Mae pools — | |
| | | | | | Monthly | |
|
| 40 Mortgage Securities Fund |
| | | | | | |
| OTC TOTAL RETURN SWAP CONTRACTS OUTSTANDING at 3/31/19 (Unaudited)cont. | |
| | | Upfront | | | | |
| | | premium | Termina- | Payments | Total return | Unrealized |
| Swap counterparty/ | | received | tion | received (paid) | received by | appreciation/ |
| Notional amount | Value | (paid) | date | by fund | or paid by fund | (depreciation) |
| Goldman Sachs Internationalcont. | | | | |
| $136,659 | $132,233 | $— | 1/12/43 | (3.50%) 1 month | Synthetic TRS | $3,307 |
| | | | | USD-LIBOR — | Index 3.50% 30 year | |
| | | | | Monthly | Fannie Mae pools — | |
| | | | | | Monthly | |
| 1,020,195 | 984,143 | — | 1/12/42 | 4.00% (1 month | Synthetic TRS | (27,100) |
| | | | | USD-LIBOR) — | Index 4.00% 30 year | |
| | | | | Monthly | Fannie Mae pools — | |
| | | | | | Monthly | |
| 1,020,195 | 984,143 | — | 1/12/42 | 4.00% (1 month | Synthetic TRS | (27,100) |
| | | | | USD-LIBOR) — | Index 4.00% 30 year | |
| | | | | Monthly | Fannie Mae pools — | |
| | | | | | Monthly | |
| 939,549 | 906,347 | — | 1/12/42 | 4.00% (1 month | Synthetic TRS | (24,958) |
| | | | | USD-LIBOR) — | Index 4.00% 30 year | |
| | | | | Monthly | Fannie Mae pools — | |
| | | | | | Monthly | |
| 750,851 | 724,317 | — | 1/12/42 | 4.00% (1 month | Synthetic TRS | (19,945) |
| | | | | USD-LIBOR) — | Index 4.00% 30 year | |
| | | | | Monthly | Fannie Mae pools — | |
| | | | | | Monthly | |
| 387,897 | 374,189 | — | 1/12/42 | 4.00% (1 month | Synthetic TRS | (10,304) |
| | | | | USD-LIBOR) — | Index 4.00% 30 year | |
| | | | | Monthly | Fannie Mae pools — | |
| | | | | | Monthly | |
| 117,657 | 110,058 | — | 1/12/45 | 4.00% (1 month | Synthetic TRS | (6,554) |
| | | | | USD-LIBOR) — | Index 4.00% 30 year | |
| | | | | Monthly | Fannie Mae pools — | |
| | | | | | Monthly | |
| 93,747 | 90,202 | — | 1/12/40 | 4.00% (1 month | Synthetic TRS | (2,655) |
| | | | | USD-LIBOR) — | Index 4.00% 30 year | |
| | | | | Monthly | Fannie Mae pools — | |
| | | �� | | | Monthly | |
| 750,216 | 717,298 | — | 1/12/41 | (5.00%) 1 month | Synthetic TRS | 24,990 |
| | | | | USD-LIBOR — | Index 5.00% 30 year | |
| | | | | Monthly | Fannie Mae pools — | |
| | | | | | Monthly | |
| 4,812 | 4,705 | — | 1/12/39 | (5.50%) 1 month | Synthetic TRS | 51 |
| | | | | USD-LIBOR — | Index 5.50% 30 year | |
| | | | | Monthly | Fannie Mae pools — | |
| | | | | | Monthly | |
| 316,650 | 309,652 | — | 1/12/39 | (5.50%) 1 month | Synthetic TRS | 3,373 |
| | | | | USD-LIBOR — | Index 5.50% 30 year | |
| | | | | Monthly | Fannie Mae pools — | |
| | | | | | Monthly | |
| 1,377,924 | 1,358,762 | — | 1/12/39 | 6.00% (1 month | Synthetic TRS | (3,417) |
| | | | | USD-LIBOR) — | Index 6.00% 30 year | |
| | | | | Monthly | Fannie Mae pools — | |
| | | | | | Monthly | |
|
| Mortgage Securities Fund 41 |
| | | | | | |
| OTC TOTAL RETURN SWAP CONTRACTS OUTSTANDING at 3/31/19 (Unaudited)cont. | |
| | | Upfront | | | | |
| | | premium | Termina- | Payments | Total return | Unrealized |
| Swap counterparty/ | | received | tion | received (paid) | received by | appreciation/ |
| Notional amount | Value | (paid) | date | by fund | or paid by fund | (depreciation) |
| Goldman Sachs Internationalcont. | | | | |
| $982,986 | $969,317 | $— | 1/12/39 | 6.00% (1 month | Synthetic TRS | $(2,438) |
| | | | | USD-LIBOR) — | Index 6.00% 30 year | |
| | | | | Monthly | Fannie Mae pools — | |
| | | | | | Monthly | |
| 552,245 | 544,565 | — | 1/12/39 | 6.00% (1 month | Synthetic TRS | (1,369) |
| | | | | USD-LIBOR) — | Index 6.00% 30 year | |
| | | | | Monthly | Fannie Mae pools — | |
| | | | | | Monthly | |
| 30,528 | 30,103 | — | 1/12/39 | 6.00% (1 month | Synthetic TRS | (76) |
| | | | | USD-LIBOR) — | Index 6.00% 30 year | |
| | | | | Monthly | Fannie Mae pools — | |
| | | | | | Monthly | |
| 659,169 | 649,885 | — | 1/12/38 | 6.50% (1 month | Synthetic TRS | (1,703) |
| | | | | USD-LIBOR) — | Index 6.50% 30 year | |
| | | | | Monthly | Fannie Mae pools — | |
| | | | | | Monthly | |
| 631,867 | 622,967 | — | 1/12/38 | 6.50% (1 month | Synthetic TRS | (1,633) |
| | | | | USD-LIBOR) — | Index 6.50% 30 year | |
| | | | | Monthly | Fannie Mae pools — | |
| | | | | | Monthly | |
| 567,688 | 559,693 | — | 1/12/38 | 6.50% (1 month | Synthetic TRS | (1,467) |
| | | | | USD-LIBOR) — | Index 6.50% 30 year | |
| | | | | Monthly | Fannie Mae pools — | |
| | | | | | Monthly | |
| 487,441 | 480,576 | — | 1/12/38 | 6.50% (1 month | Synthetic TRS | (1,260) |
| | | | | USD-LIBOR) — | Index 6.50% 30 year | |
| | | | | Monthly | Fannie Mae pools — | |
| | | | | | Monthly | |
| 434,885 | 428,759 | — | 1/12/38 | 6.50% (1 month | Synthetic TRS | (1,124) |
| | | | | USD-LIBOR) — | Index 6.50% 30 year | |
| | | | | Monthly | Fannie Mae pools — | |
| | | | | | Monthly | |
| 321,806 | 317,274 | — | 1/12/38 | 6.50% (1 month | Synthetic TRS | (832) |
| | | | | USD-LIBOR) — | Index 6.50% 30 year | |
| | | | | Monthly | Fannie Mae pools — | |
| | | | | | Monthly | |
| 172,057 | 169,633 | — | 1/12/38 | 6.50% (1 month | Synthetic TRS | (445) |
| | | | | USD-LIBOR) — | Index 6.50% 30 year | |
| | | | | Monthly | Fannie Mae pools — | |
| | | | | | Monthly | |
| JPMorgan Chase Bank N.A. | | | | | |
| 115,322 | 111,559 | — | 1/12/41 | 4.00% (1 month | Synthetic TRS | (2,713) |
| | | | | USD-LIBOR) — | Index 4.00% 30 year | |
| | | | | Monthly | Fannie Mae pools — | |
| | | | | | Monthly | |
| 24,161 | 23,373 | — | 1/12/41 | 4.00% (1 month | Synthetic TRS | (568) |
| | | | | USD-LIBOR) — | Index 4.00% 30 year | |
| | | | | Monthly | Fannie Mae pools — | |
| | | | | | Monthly | |
|
| 42 Mortgage Securities Fund |
| | | | | | |
| OTC TOTAL RETURN SWAP CONTRACTS OUTSTANDING at 3/31/19 (Unaudited)cont. | |
| | | Upfront | | | | |
| | | premium | Termina- | Payments | Total return | Unrealized |
| Swap counterparty/ | | received | tion | received (paid) | received by | appreciation/ |
| Notional amount | Value | (paid) | date | by fund | or paid by fund | (depreciation) |
| JPMorgan Chase Bank N.A.cont. | | | | | |
| $750,216 | $717,298 | $— | 1/12/41 | (5.00%) 1 month | Synthetic TRS | $24,989 |
| | | | | USD-LIBOR — | Index 5.00% 30 year | |
| | | | | Monthly | Fannie Mae pools — | |
| | | | | | Monthly | |
| JPMorgan Securities LLC | | | | | |
| 45,553 | 44,078 | — | 1/12/43 | (3.50%) 1 month | Synthetic TRS | 1,102 |
| | | | | USD-LIBOR — | Index 3.50% 30 year | |
| | | | | Monthly | Fannie Mae pools — | |
| | | | | | Monthly | |
| 169,567 | 164,023 | — | 1/12/44 | (3.50%) 1 month | Synthetic TRS | 4,180 |
| | | | | USD-LIBOR — | Index 3.50% 30 year | |
| | | | | Monthly | Fannie Mae pools — | |
| | | | | | Monthly | |
| 839,789 | 805,769 | — | 1/12/44 | 4.00% (1 month | Synthetic TRS | (26,671) |
| | | | | USD-LIBOR) — | Index 4.00% 30 year | |
| | | | | Monthly | Fannie Mae pools — | |
| | | | | | Monthly | |
| 4,529,800 | 4,369,725 | — | 1/12/42 | (4.00%) 1 month | Synthetic TRS | 120,329 |
| | | | | USD-LIBOR — | Index 4.00% 30 year | |
| | | | | Monthly | Fannie Mae pools — | |
| | | | | | Monthly | |
| Upfront premium received | — | | Unrealized appreciation | 1,104,786 |
| Upfront premium (paid) | — | | Unrealized (depreciation) | (658,404) |
| Total | | $— | | Total | | $446,382 |
| | | | | | |
| CENTRALLY CLEARED TOTAL RETURN SWAP CONTRACTS OUTSTANDING at 3/31/19 (Unaudited) |
| | | Upfront | | | | |
| | | premium | Termina- | Payments | Total return | Unrealized |
| | | received | tion | received (paid) | received by | appreciation/ |
| Notional amount | Value | (paid) | date | by fund | or paid by fund | (depreciation) |
| $7,560,000 | $39,115 | $— | 7/3/27 | 2.085% — At | USA Non Revised | $39,117 |
| | | | | maturity | Consumer Price | |
| | | | | | Index-Urban | |
| | | | | | (CPI-U) — At | |
| | | | | | maturity | |
| 8,678,000 | 23,309 | — | 7/5/22 | (1.89%) — At | USA Non Revised | 23,309 |
| | | | | maturity | Consumer Price | |
| | | | | | Index-Urban | |
| | | | | | (CPI-U) — At | |
| | | | | | maturity | |
| 8,678,000 | 13,165 | — | 7/5/27 | 2.05% — At | USA Non Revised | 13,164 |
| | | | | maturity | Consumer Price | |
| | | | | | Index-Urban | |
| | | | | | (CPI-U) — At | |
| | | | | | maturity | |
|
| Mortgage Securities Fund 43 |
| | | | | | |
| CENTRALLY CLEARED TOTAL RETURN SWAP CONTRACTS OUTSTANDING at 3/31/19 (Unaudited)cont. |
| | | Upfront | | | | |
| | | premium | Termina- | Payments | Total return | Unrealized |
| | | received | tion | received (paid) | received by | appreciation/ |
| Notional amount | Value | (paid) | date | by fund | or paid by fund | (depreciation) |
| $7,560,000 | $7,122 | $— | 7/3/22 | (1.9225%) — At | USA Non Revised | $7,121 |
| | | | | maturity | Consumer Price | |
| | | | | | Index-Urban | |
| | | | | | (CPI-U) — At | |
| | | | | | maturity | |
| Total | | $— | | | | $82,711 |
| | | | | | | |
| OTC CREDIT DEFAULT CONTRACTS OUTSTANDING — PROTECTION SOLD at 3/31/19 (Unaudited) |
| | | Upfront | | | | | |
| | | premium | | | Termi- | Payments | Unrealized |
| Swap counterparty/ | | received | Notional | | nation | received | appreciation/ |
| Referenced debt* | Rating*** | (paid)** | amount | Value | date | by fund | (depreciation) |
| Citigroup Global Markets, Inc. | | | | | | |
| CMBX NA A.6 | A/P | $31,429 | $2,273,000 | $50,006 | 5/11/63 | 200 bp — | $(17,693) |
| Index | | | | | | Monthly | |
| CMBX NA A.6 | A/P | 51,820 | 4,000,000 | 88,000 | 5/11/63 | 200 bp — | (34,625) |
| Index | | | | | | Monthly | |
| CMBX NA A.6 | A/P | 4,759 | 4,087,000 | 89,914 | 5/11/63 | 200 bp — | (83,565) |
| Index | | | | | | Monthly | |
| CMBX NA A.6 | A/P | 3,175 | 4,087,000 | 89,914 | 5/11/63 | 200 bp — | (85,150) |
| Index | | | | | | Monthly | |
| CMBX NA A.6 | A/P | (1,614) | 4,159,000 | 91,498 | 5/11/63 | 200 bp — | (91,495) |
| Index | | | | | | Monthly | |
| CMBX NA A.6 | A/P | 72,835 | 7,464,000 | 164,208 | 5/11/63 | 200 bp — | (88,470) |
| Index | | | | | | Monthly | |
| CMBX NA A.6 | A/P | 12,087 | 7,789,000 | 171,358 | 5/11/63 | 200 bp — | (156,242) |
| Index | | | | | | Monthly | |
| CMBX NA A.7 | A-/P | (3,558) | 2,445,000 | 13,448 | 1/17/47 | 200 bp — | 10,840 |
| Index | | | | | | Monthly | |
| CMBX NA BB.7 | BB/P | 24,160 | 174,000 | 20,689 | 1/17/47 | 500 bp — | 3,641 |
| Index | | | | | | Monthly | |
| CMBX NA BB.7 | BB/P | 34,061 | 265,000 | 31,509 | 1/17/47 | 500 bp — | 2,810 |
| Index | | | | | | Monthly | |
| CMBX NA BBB–.6 | BBB–/P | 6,397 | 67,000 | 8,509 | 5/11/63 | 300 bp — | (2,073) |
| Index | | | | | | Monthly | |
| CMBX NA BBB–.6 | BBB–/P | 9,619 | 83,000 | 10,541 | 5/11/63 | 300 bp — | (874) |
| Index | | | | | | Monthly | |
| CMBX NA BBB–.6 | BBB–/P | 16,207 | 162,000 | 20,574 | 5/11/63 | 300 bp — | (4,272) |
| Index | | | | | | Monthly | |
| CMBX NA BBB–.6 | BBB–/P | 22,563 | 222,000 | 28,194 | 5/11/63 | 300 bp — | (5,501) |
| Index | | | | | | Monthly | |
| CMBX NA BBB–.6 | BBB–/P | 22,409 | 227,000 | 28,829 | 5/11/63 | 300 bp — | (6,287) |
| Index | | | | | | Monthly | |
| CMBX NA BBB–.6 | BBB–/P | 56,974 | 498,000 | 63,246 | 5/11/63 | 300 bp — | (5,981) |
| Index | | | | | | Monthly | |
| CMBX NA BBB–.6 | BBB–/P | 62,813 | 571,000 | 72,517 | 5/11/63 | 300 bp — | (9,371) |
| Index | | | | | | Monthly | |
|
| 44 Mortgage Securities Fund |
| | | | | | | |
| OTC CREDIT DEFAULT CONTRACTS OUTSTANDING — PROTECTION SOLD at 3/31/19 (Unaudited)cont. |
| | | Upfront | | | | | |
| | | premium | | | Termi- | Payments | Unrealized |
| Swap counterparty/ | | received | Notional | | nation | received | appreciation/ |
| Referenced debt* | Rating*** | (paid)** | amount | Value | date | by fund | (depreciation) |
| Citigroup Global Markets, Inc.cont. | | | | | |
| CMBX NA BBB–.6 | BBB–/P | $92,848 | $705,000 | $89,535 | 5/11/63 | 300 bp — | $3,725 |
| Index | | | | | | Monthly | |
| CMBX NA BBB–.6 | BBB–/P | 80,045 | 715,000 | 90,805 | 5/11/63 | 300 bp — | (10,343) |
| Index | | | | | | Monthly | |
| CMBX NA BBB–.6 | BBB–/P | 80,754 | 732,000 | 92,964 | 5/11/63 | 300 bp — | (11,783) |
| Index | | | | | | Monthly | |
| CMBX NA BBB–.6 | BBB–/P | 94,274 | 857,000 | 108,839 | 5/11/63 | 300 bp — | (14,065) |
| Index | | | | | | Monthly | |
| CMBX NA BBB–.6 | BBB–/P | 115,145 | 997,000 | 126,619 | 5/11/63 | 300 bp — | (10,892) |
| Index | | | | | | Monthly | |
| CMBX NA BBB–.6 | BBB–/P | 350,631 | 3,547,000 | 450,469 | 5/11/63 | 300 bp — | (97,769) |
| Index | | | | | | Monthly | |
| CMBX NA BBB–.6 | BBB–/P | 378,348 | 3,664,000 | 465,328 | 5/11/63 | 300 bp — | (84,843) |
| Index | | | | | | Monthly | |
| CMBX NA BBB–.6 | BBB–/P | 449,628 | 4,179,000 | 530,733 | 5/11/63 | 300 bp — | (78,667) |
| Index | | | | | | Monthly | |
| CMBX NA BBB–.6 | BBB–/P | 768,209 | 7,166,000 | 910,082 | 5/11/63 | 300 bp — | (137,693) |
| Index | | | | | | Monthly | |
| CMBX NA BBB–.6 | BBB–/P | 760,896 | 7,166,000 | 910,082 | 5/11/63 | 300 bp — | (145,006) |
| Index | | | | | | Monthly | |
| CMBX NA BBB–.6 | BBB–/P | 826,051 | 7,362,000 | 934,974 | 5/11/63 | 300 bp — | (104,629) |
| Index | | | | | | Monthly | |
| CMBX NA BBB–.6 | BBB–/P | 778,886 | 7,935,000 | 1,007,745 | 5/11/63 | 300 bp — | (224,230) |
| Index | | | | | | Monthly | |
| Credit Suisse International | | | | | | |
| CMBX NA A.6 | A/P | 17,933 | 11,578,000 | 254,716 | 5/11/63 | 200 bp — | (232,280) |
| Index | | | | | | Monthly | |
| CMBX NA BB.7 | BB/P | 36,784 | 275,000 | 32,698 | 1/17/47 | 500 bp — | 4,354 |
| Index | | | | | | Monthly | |
| CMBX NA BBB–.6 | BBB–/P | 18,487 | 190,000 | 24,130 | 5/11/63 | 300 bp — | (5,532) |
| Index | | | | | | Monthly | |
| CMBX NA BBB–.6 | BBB–/P | 45,192 | 409,000 | 51,943 | 5/11/63 | 300 bp — | (6,513) |
| Index | | | | | | Monthly | |
| CMBX NA BBB–.6 | BBB–/P | 47,762 | 473,000 | 60,071 | 5/11/63 | 300 bp — | (12,033) |
| Index | | | | | | Monthly | |
| CMBX NA BBB–.6 | BBB–/P | 83,186 | 606,000 | 76,962 | 5/11/63 | 300 bp — | 6,578 |
| Index | | | | | | Monthly | |
| CMBX NA BBB–.6 | BBB–/P | 83,820 | 791,000 | 100,457 | 5/11/63 | 300 bp — | (16,176) |
| Index | | | | | | Monthly | |
| CMBX NA BBB–.6 | BBB–/P | 143,347 | 1,274,000 | 161,798 | 5/11/63 | 300 bp — | (17,708) |
| Index | | | | | | Monthly | |
| CMBX NA BBB–.6 | BBB–/P | 140,621 | 1,279,000 | 162,433 | 5/11/63 | 300 bp — | (21,066) |
| Index | | | | | | Monthly | |
| CMBX NA BBB–.6 | BBB–/P | 127,473 | 1,300,000 | 165,100 | 5/11/63 | 300 bp — | (36,868) |
| Index | | | | | | Monthly | |
| CMBX NA BBB–.6 | BBB–/P | 130,887 | 1,380,000 | 175,260 | 5/11/63 | 300 bp — | (43,568) |
| Index | | | | | | Monthly | |
|
| Mortgage Securities Fund 45 |
| | | | | | | |
| OTC CREDIT DEFAULT CONTRACTS OUTSTANDING — PROTECTION SOLD at 3/31/19 (Unaudited)cont. |
| | | Upfront | | | | | |
| | | premium | | | Termi- | Payments | Unrealized |
| Swap counterparty/ | | received | Notional | | nation | received | appreciation/ |
| Referenced debt* | Rating*** | (paid)** | amount | Value | date | by fund | (depreciation) |
| Credit Suisse Internationalcont. | | | | | |
| CMBX NA BBB–.6 | BBB–/P | $231,320 | $2,312,000 | $293,624 | 5/11/63 | 300 bp — | $(60,955) |
| Index | | | | | | Monthly | |
| CMBX NA BBB–.6 | BBB–/P | 284,940 | 2,547,000 | 323,469 | 5/11/63 | 300 bp — | (37,043) |
| Index | | | | | | Monthly | |
| CMBX NA BBB–.6 | BBB–/P | 805,485 | 6,761,000 | 858,647 | 5/11/63 | 300 bp — | (49,218) |
| Index | | | | | | Monthly | |
| CMBX NA BBB–.6 | BBB–/P | 1,668,899 | 15,545,000 | 1,974,215 | 5/11/63 | 300 bp — | (296,248) |
| Index | | | | | | Monthly | |
| CMBX NA BBB–.6 | BBB–/P | 2,437,696 | 22,661,000 | 2,877,947 | 5/11/63 | 300 bp — | (427,037) |
| Index | | | | | | Monthly | |
| Deutsche Bank AG | | | | | | | |
| CMBX NA BBB–.6 | BBB–/P | 935,424 | 8,774,000 | 1,114,298 | 5/11/63 | 300 bp — | (173,756) |
| Index | | | | | | Monthly | |
| Goldman Sachs International | | | | | | |
| CMBX NA A.6 | A/P | 17,291 | 2,297,000 | 50,534 | 5/11/63 | 200 bp — | (32,349) |
| Index | | | | | | Monthly | |
| CMBX NA A.6 | A/P | 32,739 | 3,652,000 | 80,344 | 5/11/63 | 200 bp — | (46,185) |
| Index | | | | | | Monthly | |
| CMBX NA A.7 | A-/P | (6,606) | 4,531,000 | 24,921 | 1/17/47 | 200 bp — | 20,076 |
| Index | | | | | | Monthly | |
| CMBX NA BBB–.6 | BBB–/P | 54,735 | 495,000 | 62,865 | 5/11/63 | 300 bp — | (7,841) |
| Index | | | | | | Monthly | |
| CMBX NA BBB–.6 | BBB–/P | 66,630 | 596,000 | 75,692 | 5/11/63 | 300 bp — | (8,715) |
| Index | | | | | | Monthly | |
| CMBX NA BBB–.6 | BBB–/P | 108,807 | 1,034,000 | 131,318 | 5/11/63 | 300 bp — | (21,908) |
| Index | | | | | | Monthly | |
| CMBX NA BBB–.6 | BBB–/P | 133,183 | 1,146,000 | 145,542 | 5/11/63 | 300 bp — | (11,690) |
| Index | | | | | | Monthly | |
| CMBX NA BBB–.6 | BBB–/P | 416,605 | 3,605,000 | 457,835 | 5/11/63 | 300 bp — | (39,127) |
| Index | | | | | | Monthly | |
| CMBX NA BBB–.6 | BBB–/P | 871,216 | 8,162,000 | 1,036,574 | 5/11/63 | 300 bp — | (160,596) |
| Index | | | | | | Monthly | |
| JPMorgan Securities LLC | | | | | | |
| CMBX NA A.6 | A/P | 269,663 | 11,722,000 | 257,884 | 5/11/63 | 200 bp — | 16,338 |
| Index | | | | | | Monthly | |
| CMBX NA BBB–.6 | BBB–/P | 3,995,158 | 30,199,000 | 3,835,273 | 5/11/63 | 300 bp — | 177,501 |
| Index | | | | | | Monthly | |
| Merrill Lynch International | | | | | | |
| CMBX NA BBB–.6 | BBB–/P | 73,777 | 653,000 | 82,931 | 5/11/63 | 300 bp — | (8,773) |
| Index | | | | | | Monthly | |
| CMBX NA BBB–.6 | BBB–/P | 88,270 | 667,000 | 84,709 | 5/11/63 | 300 bp — | 3,950 |
| Index | | | | | | Monthly | |
| CMBX NA BBB–.6 | BBB–/P | 116,837 | 988,000 | 125,476 | 5/11/63 | 300 bp — | (8,062) |
| Index | | | | | | Monthly | |
|
| 46 Mortgage Securities Fund |
| | | | | | | |
| OTC CREDIT DEFAULT CONTRACTS OUTSTANDING — PROTECTION SOLD at 3/31/19 (Unaudited)cont. |
| | | Upfront | | | | | |
| | | premium | | | Termi- | Payments | Unrealized |
| Swap counterparty/ | | received | Notional | | nation | received | appreciation/ |
| Referenced debt* | Rating*** | (paid)** | amount | Value | date | by fund | (depreciation) |
| Merrill Lynch Internationalcont. | | | | | |
| CMBX NA BBB–.6 | BBB–/P | $146,151 | $1,244,000 | $157,988 | 5/11/63 | 300 bp — | $(11,112) |
| Index | | | | | | Monthly | |
| CMBX NA BBB–.6 | BBB–/P | 1,018,408 | 9,090,000 | 1,154,430 | 5/11/63 | 300 bp — | (130,720) |
| Index | | | | | | Monthly | |
| Morgan Stanley & Co. International PLC | | | | | |
| CMBX NA A.6 | A/P | 6,470 | 689,000 | 15,158 | 5/11/63 | 200 bp — | (8,420) |
| Index | | | | | | Monthly | |
| CMBX NA A.6 | A/P | 12,740 | 1,140,000 | 25,080 | 5/11/63 | 200 bp — | (11,897) |
| Index | | | | | | Monthly | |
| CMBX NA A.6 | A/P | 31,263 | 2,261,000 | 49,742 | 5/11/63 | 200 bp — | (17,599) |
| Index | | | | | | Monthly | |
| CMBX NA A.6 | A/P | 22,920 | 2,801,000 | 61,622 | 5/11/63 | 200 bp — | (37,613) |
| Index | | | | | | Monthly | |
| CMBX NA A.6 | A/P | 33,647 | 3,314,000 | 72,908 | 5/11/63 | 200 bp — | (37,972) |
| Index | | | | | | Monthly | |
| CMBX NA A.6 | A/P | 50,952 | 4,523,000 | 99,506 | 5/11/63 | 200 bp — | (46,795) |
| Index | | | | | | Monthly | |
| CMBX NA A.6 | A/P | 62,164 | 5,675,000 | 124,850 | 5/11/63 | 200 bp — | (60,479) |
| Index | | | | | | Monthly | |
| CMBX NA A.6 | A/P | 5 | 7,941,000 | 174,702 | 5/11/63 | 200 bp — | (171,608) |
| Index | | | | | | Monthly | |
| CMBX NA A.6 | A/P | 42,911 | 15,787,000 | 347,314 | 5/11/63 | 200 bp — | (298,263) |
| Index | | | | | | Monthly | |
| CMBX NA A.6 | A/P | 50,416 | 18,675,000 | 410,850 | 5/11/63 | 200 bp — | (353,171) |
| Index | | | | | | Monthly | |
| CMBX NA A.7 | A-/P | (8,392) | 8,672,000 | 47,696 | 1/17/47 | 200 bp — | 42,677 |
| Index | | | | | | Monthly | |
| CMBX NA A.7 | A-/P | (292) | 602,000 | 3,311 | 1/17/47 | 200 bp — | 3,253 |
| Index | | | | | | Monthly | |
| CMBX NA BBB–.6 | BBB–/P | 20,420 | 174,000 | 22,098 | 5/11/63 | 300 bp — | (1,577) |
| Index | | | | | | Monthly | |
| CMBX NA BBB–.6 | BBB–/P | 23,773 | 183,000 | 23,241 | 5/11/63 | 300 bp — | 639 |
| Index | | | | | | Monthly | |
| CMBX NA BBB–.6 | BBB–/P | 48,923 | 413,000 | 52,451 | 5/11/63 | 300 bp — | (3,287) |
| Index | | | | | | Monthly | |
| CMBX NA BBB–.6 | BBB–/P | 57,214 | 486,000 | 61,722 | 5/11/63 | 300 bp — | (4,225) |
| Index | | | | | | Monthly | |
| CMBX NA BBB–.6 | BBB–/P | 66,076 | 580,000 | 73,660 | 5/11/63 | 300 bp — | (7,245) |
| Index | | | | | | Monthly | |
| CMBX NA BBB–.6 | BBB–/P | 57,993 | 607,000 | 77,089 | 5/11/63 | 300 bp — | (18,742) |
| Index | | | | | | Monthly | |
| CMBX NA BBB–.6 | BBB–/P | 85,801 | 646,000 | 82,042 | 5/11/63 | 300 bp — | 4,136 |
| Index | | | | | | Monthly | |
| CMBX NA BBB–.6 | BBB–/P | 75,478 | 667,000 | 84,709 | 5/11/63 | 300 bp — | (8,842) |
| Index | | | | | | Monthly | |
| CMBX NA BBB–.6 | BBB–/P | 102,952 | 805,000 | 102,235 | 5/11/63 | 300 bp — | 1,186 |
| Index | | | | | | Monthly | |
|
| Mortgage Securities Fund 47 |
| | | | | | | |
| OTC CREDIT DEFAULT CONTRACTS OUTSTANDING — PROTECTION SOLD at 3/31/19 (Unaudited)cont. |
| | | Upfront | | | | | |
| | | premium | | | Termi- | Payments | Unrealized |
| Swap counterparty/ | | received | Notional | | nation | received | appreciation/ |
| Referenced debt* | Rating*** | (paid)** | amount | Value | date | by fund | (depreciation) |
| Morgan Stanley & Co. International PLCcont. | | | | | |
| CMBX NA BBB–.6 | BBB–/P | $96,777 | $844,000 | $107,188 | 5/11/63 | 300 bp — | $(9,919) |
| Index | | | | | | Monthly | |
| CMBX NA BBB–.6 | BBB–/P | 129,490 | 1,057,000 | 134,239 | 5/11/63 | 300 bp — | (4,133) |
| Index | | | | | | Monthly | |
| CMBX NA BBB–.6 | BBB–/P | 125,364 | 1,284,000 | 163,068 | 5/11/63 | 300 bp — | (36,955) |
| Index | | | | | | Monthly | |
| CMBX NA BBB–.6 | BBB–/P | 173,889 | 1,620,000 | 205,740 | 5/11/63 | 300 bp — | (30,906) |
| Index | | | | | | Monthly | |
| CMBX NA BBB–.6 | BBB–/P | 224,456 | 1,753,000 | 222,631 | 5/11/63 | 300 bp — | 2,848 |
| Index | | | | | | Monthly | |
| CMBX NA BBB–.6 | BBB–/P | 210,077 | 2,246,000 | 285,242 | 5/11/63 | 300 bp — | (73,855) |
| Index | | | | | | Monthly | |
| CMBX NA BBB–.6 | BBB–/P | 360,808 | 2,400,000 | 304,800 | 5/11/63 | 300 bp — | 57,408 |
| Index | | | | | | Monthly | |
| CMBX NA BBB–.6 | BBB–/P | 436,717 | 3,115,000 | 395,605 | 5/11/63 | 300 bp — | 42,929 |
| Index | | | | | | Monthly | |
| CMBX NA BBB–.6 | BBB–/P | 394,590 | 3,660,000 | 464,820 | 5/11/63 | 300 bp — | (68,095) |
| Index | | | | | | Monthly | |
| CMBX NA BBB–.6 | BBB–/P | 412,380 | 3,859,000 | 490,093 | 5/11/63 | 300 bp — | (75,462) |
| Index | | | | | | Monthly | |
| CMBX NA BBB–.6 | BBB–/P | 701,922 | 5,698,000 | 723,646 | 5/11/63 | 300 bp — | (18,400) |
| Index | | | | | | Monthly | |
| CMBX NA BBB–.6 | BBB–/P | 716,649 | 6,771,000 | 859,917 | 5/11/63 | 300 bp — | (139,318) |
| Index | | | | | | Monthly | |
| CMBX NA BBB–.6 | BBB–/P | 837,740 | 7,301,000 | 927,227 | 5/11/63 | 300 bp — | (85,228) |
| Index | | | | | | Monthly | |
| CMBX NA BBB–.6 | BBB–/P | 855,706 | 8,129,000 | 1,032,383 | 5/11/63 | 300 bp — | (171,935) |
| Index | | | | | | Monthly | |
| CMBX NA BBB–.6 | BBB–/P | 868,433 | 8,162,000 | 1,036,574 | 5/11/63 | 300 bp — | (163,380) |
| Index | | | | | | Monthly | |
| CMBX NA BBB–.6 | BBB–/P | 1,127,850 | 10,606,000 | 1,346,962 | 5/11/63 | 300 bp — | (212,925) |
| Index | | | | | | Monthly | |
| CMBX NA BBB–.6 | BBB–/P | 3,918,344 | 32,336,000 | 4,106,672 | 5/11/63 | 300 bp — | (169,465) |
| Index | | | | | | Monthly | |
| CMBX NA BBB–.6 | BBB–/P | 5,419,594 | 44,725,000 | 5,680,075 | 5/11/63 | 300 bp — | (234,393) |
| Index | | | | | | Monthly | |
| CMBX NA BBB–.7 | BBB–/P | 26,065 | 350,000 | 16,135 | 1/17/47 | 300 bp — | 10,134 |
| Index | | | | | | Monthly | |
| CMBX NA BBB–.7 | BBB–/P | 55,762 | 913,000 | 42,089 | 1/17/47 | 300 bp — | 14,205 |
| Index | | | | | | Monthly | |
| CMBX NA BBB–.7 | BBB–/P | 1,055,194 | 15,505,000 | 714,781 | 1/17/47 | 300 bp — | 349,459 |
| Index | | | | | | Monthly | |
| Upfront premium received | 38,855,674 | Unrealized appreciation | | 778,687 |
| Upfront premium (paid) | (20,462) | Unrealized (depreciation) | | (6,016,702) |
| Total | | $38,835,212 | Total | | | | $(5,238,015) |
|
| 48 Mortgage Securities Fund |
*Payments related to the referenced debt are made upon a credit default event.
**Upfront premium is based on the difference between the original spread on issue and the market spread on day of execution.
***Ratings for an underlying index represent the average of the ratings of all the securities included in that index. The Moody’s, Standard & Poor’s or Fitch ratings are believed to be the most recent ratings available at March 31, 2019.Securities rated by Fitch are indicated by “/F.” Securities rated by Putnam are indicated by “/P.” The Putnam rating categories are comparable to the Standard & Poor’s classifications.
| | | | | | |
| OTC CREDIT DEFAULT CONTRACTS OUTSTANDING — PROTECTION PURCHASED at 3/31/19 (Unaudited) |
| | Upfront | | | | | |
| | premium | | | Termi- | Payments | Unrealized |
| Swap counterparty/ | received | Notional | | nation | (paid) | appreciation/ |
| Referenced debt* | (paid)** | amount | Value | date | by fund | (depreciation) |
| Citigroup Global Markets, Inc. | | | | | | |
| CMBX NA A.7 Index | $(59,719) | $8,055,000 | $44,303 | 1/17/47 | (200 bp) — | $(107,154) |
| | | | | | Monthly | |
| CMBX NA BB.11 Index | (65,428) | 505,000 | 64,135 | 11/18/54 | (500 bp) — | (1,573) |
| | | | | | Monthly | |
| CMBX NA BB.7 Index | (630,747) | 4,950,000 | 588,555 | 1/17/47 | (500 bp) — | (47,004) |
| | | | | | Monthly | |
| CMBX NA BB.9 Index | (71,004) | 505,000 | 70,246 | 9/17/58 | (500 bp) — | (1,039) |
| | | | | | Monthly | |
| CMBX NA BB.9 Index | (43,677) | 336,000 | 46,738 | 9/17/58 | (500 bp) — | 2,733 |
| | | | | | Monthly | |
| CMBX NA BB.9 Index | (45,166) | 336,000 | 46,738 | 9/17/58 | (500 bp) — | 1,291 |
| | | | | | Monthly | |
| CMBX NA BB.9 Index | (40,802) | 265,000 | 36,862 | 9/17/58 | (500 bp) — | (4,198) |
| | | | | | Monthly | |
| Credit Suisse International | | | | | | |
| CMBX NA BB.10 Index | (46,565) | 349,000 | 40,903 | 11/17/59 | (500 bp) — | (6,001) |
| | | | | | Monthly | |
| CMBX NA BB.10 Index | (41,383) | 348,000 | 40,786 | 11/17/59 | (500 bp) — | (936) |
| | | | | | Monthly | |
| CMBX NA BB.10 Index | (22,747) | 183,000 | 21,448 | 11/17/59 | (500 bp) — | (1,477) |
| | | | | | Monthly | |
| CMBX NA BB.9 Index | (557,500) | 3,894,000 | 541,655 | 9/17/58 | (500 bp) — | (19,630) |
| | | | | | Monthly | |
| CMBX NA BB.9 Index | (352,331) | 2,288,000 | 318,261 | 9/17/58 | (500 bp) — | (36,294) |
| | | | | | Monthly | |
| CMBX NA BB.9 Index | (213,966) | 1,368,000 | 190,289 | 9/17/58 | (500 bp) — | (25,008) |
| | | | | | Monthly | |
| CMBX NA BB.9 Index | (28,089) | 183,000 | 25,455 | 9/17/58 | (500 bp) — | (2,812) |
| | | | | | Monthly | |
| CMBX NA BB.9 Index | (26,367) | 174,000 | 24,203 | 9/17/58 | (500 bp) — | (2,332) |
| | | | | | Monthly | |
| Goldman Sachs International | | | | | | |
| CMBX NA BB.9 Index | (608,603) | 3,823,000 | 531,779 | 9/17/58 | (500 bp) — | (80,541) |
| | | | | | Monthly | |
| CMBX NA BB.9 Index | (442,738) | 2,779,000 | 386,559 | 9/17/58 | (500 bp) — | (58,881) |
| | | | | | Monthly | |
| CMBX NA BB.9 Index | (445,272) | 2,779,000 | 386,559 | 9/17/58 | (500 bp) — | (61,415) |
| | | | | | Monthly | |
|
| Mortgage Securities Fund 49 |
| | | | | | |
| OTC CREDIT DEFAULT CONTRACTS OUTSTANDING — PROTECTION PURCHASED at 3/31/19 (Unaudited)cont. |
| | Upfront | | | | | |
| | premium | | | Termi- | Payments | Unrealized |
| Swap counterparty/ | received | Notional | | nation | (paid) | appreciation/ |
| Referenced debt* | (paid)** | amount | Value | date | by fund | (depreciation) |
| Goldman Sachs Internationalcont. | | | | | |
| CMBX NA BB.9 Index | $(312,340) | $1,977,000 | $275,001 | 9/17/58 | (500 bp) — | $(39,261) |
| | | | | | Monthly | |
| CMBX NA BB.9 Index | (297,097) | 1,860,000 | 258,726 | 9/17/58 | (500 bp) — | (40,179) |
| | | | | | Monthly | |
| JPMorgan Securities LLC | | | | | | |
| CMBX NA BB.7 Index | (172,360) | 1,362,000 | 161,942 | 1/17/47 | (500 bp) — | (11,743) |
| | | | | | Monthly | |
| CMBX NA BB.9 Index | (830,999) | 5,265,000 | 732,362 | 9/17/58 | (500 bp) — | (103,756) |
| | | | | | Monthly | |
| CMBX NA BB.9 Index | (482,919) | 3,412,000 | 474,609 | 9/17/58 | (500 bp) — | (11,627) |
| | | | | | Monthly | |
| CMBX NA BB.9 Index | (410,777) | 2,633,000 | 366,250 | 9/17/58 | (500 bp) — | (47,086) |
| | | | | | Monthly | |
| CMBX NA BB.9 Index | (319,744) | 2,264,000 | 314,922 | 9/17/58 | (500 bp) — | (7,023) |
| | | | | | Monthly | |
| CMBX NA BB.9 Index | (77,888) | 508,000 | 70,663 | 9/17/58 | (500 bp) — | (7,719) |
| | | | | | Monthly | |
| CMBX NA BBB–.7 Index | (172,113) | 4,536,000 | 209,110 | 1/17/47 | (300 bp) — | 34,351 |
| | | | | | Monthly | |
| Merrill Lynch International | | | | | | |
| CMBX NA BB.10 Index | (19,970) | 168,000 | 19,690 | 11/17/59 | (500 bp) — | (374) |
| | | | | | Monthly | |
| CMBX NA BB.9 Index | (511,332) | 3,492,000 | 485,737 | 9/17/58 | (500 bp) — | (28,990) |
| | | | | | Monthly | |
| CMBX NA BB.9 Index | (488,862) | 3,318,000 | 461,534 | 9/17/58 | (500 bp) — | (30,554) |
| | | | | | Monthly | |
| CMBX NA BB.9 Index | (507,048) | 3,231,000 | 449,432 | 9/17/58 | (500 bp) — | (60,758) |
| | | | | | Monthly | |
| CMBX NA BB.9 Index | (486,710) | 3,181,000 | 442,477 | 9/17/58 | (500 bp) — | (47,326) |
| | | | | | Monthly | |
| CMBX NA BB.9 Index | (408,069) | 2,609,000 | 362,912 | 9/17/58 | (500 bp) — | (47,693) |
| | | | | | Monthly | |
| CMBX NA BB.9 Index | (21,993) | 168,000 | 23,369 | 9/17/58 | (500 bp) — | 1,213 |
| | | | | | Monthly | |
| Morgan Stanley & Co. International PLC | | | | | |
| CMBX NA BB.9 Index | (595,749) | 3,828,000 | 532,475 | 9/17/58 | (500 bp) — | (66,996) |
| | | | | | Monthly | |
| CMBX NA BB.9 Index | (432,245) | 3,182,000 | 442,616 | 9/17/58 | (500 bp) — | 7,277 |
| | | | | | Monthly | |
| CMBX NA BB.9 Index | (421,822) | 3,169,000 | 440,808 | 9/17/58 | (500 bp) — | 15,905 |
| | | | | | Monthly | |
| CMBX NA BB.9 Index | (475,843) | 3,164,000 | 440,112 | 9/17/58 | (500 bp) — | (38,807) |
| | | | | | Monthly | |
| CMBX NA BB.9 Index | (408,392) | 2,987,000 | 415,492 | 9/17/58 | (500 bp) — | 4,196 |
| | | | | | Monthly | |
| CMBX NA BB.9 Index | (423,229) | 2,805,000 | 390,176 | 9/17/58 | (500 bp) — | (35,780) |
| | | | | | Monthly | |
|
| 50 Mortgage Securities Fund |
| | | | | | |
| OTC CREDIT DEFAULT CONTRACTS OUTSTANDING — PROTECTION PURCHASED at 3/31/19 (Unaudited)cont. |
| | Upfront | | | | | |
| | premium | | | Termi- | Payments | Unrealized |
| Swap counterparty/ | received | Notional | | nation | (paid) | appreciation/ |
| Referenced debt* | (paid)** | amount | Value | date | by fund | (depreciation) |
| Morgan Stanley & Co. International PLCcont. | | | | | |
| CMBX NA BB.9 Index | $(357,854) | $2,484,000 | $345,524 | 9/17/58 | (500 bp) — | $(14,745) |
| | | | | | Monthly | |
| CMBX NA BB.9 Index | (217,055) | 1,434,000 | 199,469 | 9/17/58 | (500 bp) — | (18,980) |
| | | | | | Monthly | |
| CMBX NA BB.9 Index | (217,055) | 1,434,000 | 199,469 | 9/17/58 | (500 bp) — | (18,980) |
| | | | | | Monthly | |
| CMBX NA BBB–.7 Index | (89,903) | 1,416,000 | 65,278 | 1/17/47 | (300 bp) — | (25,451) |
| | | | | | Monthly | |
| Upfront premium received | — | Unrealized appreciation | | 66,966 |
| Upfront premium (paid) | (12,901,472) | Unrealized (depreciation) | | (1,160,123) |
| Total | $(12,901,472) | Total | | | | $(1,093,157) |
*Payments related to the referenced debt are made upon a credit default event.
**Upfront premium is based on the difference between the original spread on issue and the market spread on day of execution.
ASC 820 establishes a three-level hierarchy for disclosure of fair value measurements. The valuation hierarchy is based upon the transparency of inputs to the valuation of the fund’s investments. The three levels are defined as follows:
Level 1: Valuations based on quoted prices for identical securities in active markets.
Level 2: Valuations based on quoted prices in markets that are not active or for which all significant inputs are observable, either directly or indirectly.
Level 3: Valuations based on inputs that are unobservable and significant to the fair value measurement.
The following is a summary of the inputs used to value the fund’s net assets as of the close of the reporting period:
| | | |
| | | | Valuation inputs | |
| Investments in securities: | Level 1 | Level 2 | Level 3 |
| Asset-backed securities | $— | $21,368,000 | $— |
| Mortgage-backed securities | — | 611,194,297 | — |
| Purchased options outstanding | — | 6,199,846 | — |
| Purchased swap options outstanding | — | 35,868,193 | — |
| U.S. government and agency mortgage obligations | — | 979,398,339 | — |
| U.S. treasury obligations | — | 555,114 | — |
| Short-term investments | 4,403,000 | 87,976,775 | — |
| Totals by level | $4,403,000 | $1,742,560,564 | $— |
| | | | |
| | | | Valuation inputs | |
| Other financial instruments: | Level 1 | Level 2 | Level 3 |
| Futures contracts | $115,756 | $— | $— |
| Written options outstanding | — | (313,536) | — |
| Written swap options outstanding | — | (32,442,513) | — |
| Forward premium swap option contracts | — | (5,033,501) | — |
| TBA sale commitments | — | (137,796,520) | — |
| Interest rate swap contracts | — | (2,584,242) | — |
| Total return swap contracts | — | 529,093 | — |
| Credit default contracts | — | (32,264,912) | — |
| Totals by level | $115,756 | $(209,906,131) | $— |
The accompanying notes are an integral part of these financial statements.
|
| Mortgage Securities Fund 51 |
Statement of assets and liabilities3/31/19 (Unaudited)
| |
| ASSETS | |
| Investment in securities, at value (Notes 1 and 9): | |
| Unaffiliated issuers (identified cost $1,748,313,019) | $1,746,953,564 |
| Affiliated issuers (identified cost $10,000) (Notes 1 and 5) | 10,000 |
| Cash | 1,094,682 |
| Interest and other receivables | 7,497,406 |
| Receivable for shares of the fund sold | 185,970 |
| Receivable for investments sold | 24,891,881 |
| Receivable for sales of TBA securities (Note 1) | 138,167,745 |
| Receivable from Manager (Note 2) | 22,001 |
| Receivable for variation margin on futures contracts (Note 1) | 46,375 |
| Receivable for variation margin on centrally cleared swap contracts (Note 1) | 106,531,011 |
| Unrealized appreciation on forward premium swap option contracts (Note 1) | 75,719 |
| Unrealized appreciation on OTC swap contracts (Note 1) | 1,950,439 |
| Premium paid on OTC swap contracts (Note 1) | 12,921,934 |
| Prepaid assets | 70,896 |
| Total assets | 2,040,419,623 |
| |
| LIABILITIES | |
| Payable for investments purchased | 3,947,619 |
| Payable for purchases of delayed delivery securities (Note 1) | 22,406,449 |
| Payable for purchases of TBA securities (Note 1) | 750,753,899 |
| Payable for shares of the fund repurchased | 1,856,800 |
| Payable for custodian fees (Note 2) | 148,066 |
| Payable for investor servicing fees (Note 2) | 281,404 |
| Payable for Trustee compensation and expenses (Note 2) | 732,676 |
| Payable for administrative services (Note 2) | 5,196 |
| Payable for distribution fees (Note 2) | 531,852 |
| Payable for variation margin on futures contracts (Note 1) | 39,594 |
| Payable for variation margin on centrally cleared swap contracts (Note 1) | 105,470,810 |
| Unrealized depreciation on OTC swap contracts (Note 1) | 7,835,229 |
| Premium received on OTC swap contracts (Note 1) | 38,855,674 |
| Unrealized depreciation on forward premium swap option contracts (Note 1) | 5,109,220 |
| Written options outstanding, at value (premiums $34,332,425) (Note 1) | 32,756,049 |
| TBA sale commitments, at value (proceeds receivable $138,053,828) (Note 1) | 137,796,520 |
| Collateral on certain derivative contracts and TBA commitments, at value (Notes 1 and 9) | 8,793,144 |
| Other accrued expenses | 169,022 |
| Total liabilities | 1,117,489,223 |
| | |
| Net assets | $922,930,400 |
| |
| REPRESENTED BY | |
| Paid-in capital (Unlimited shares authorized) (Notes 1, 4 and 7) | $1,120,757,838 |
| Total distributable earnings (Note 1) | (197,827,438) |
| Total — Representing net assets applicable to capital shares outstanding | $922,930,400 |
(Continued on next page)
|
| 52 Mortgage Securities Fund |
Statement of assets and liabilitiescont.
| |
| COMPUTATION OF NET ASSET VALUE AND OFFERING PRICE | |
| Net asset value and redemption price per class A share | |
| ($784,717,404 divided by 62,961,780 shares) | $12.46 |
| Offering price per class A share(100/96.00 of $12.46)* | $12.98 |
| Net asset value and offering price per class B share($6,786,910 divided by 547,370 shares)** | $12.40 |
| Net asset value and offering price per class C share($27,089,687 divided by 2,195,062 shares)** | $12.34 |
| Net asset value and redemption price per class M share($10,195,922 divided by 813,807 shares) | $12.53 |
| Offering price per class M share(100/96.75 of $12.53)† | $12.95 |
| Net asset value, offering price and redemption price per class R share | |
| ($12,395,094 divided by 1,005,573 shares) | $12.33 |
| Net asset value, offering price and redemption price per class R6 share | |
| ($6,824,825 divided by 553,667 shares) | $12.33 |
| Net asset value, offering price and redemption price per class Y share | |
| ($74,920,558 divided by 6,078,226 shares) | $12.33 |
*On single retail sales of less than $100,000. On sales of $100,000 or more the offering price is reduced.
**Redemption price per share is equal to net asset value less any applicable contingent deferred sales charge.
†On single retail sales of less than $50,000. On sales of $50,000 or more the offering price is reduced.
The accompanying notes are an integral part of these financial statements.
|
| Mortgage Securities Fund 53 |
Statement of operationsSix months ended 3/31/19 (Unaudited)
| |
| INVESTMENT INCOME | |
| Interest (including interest income of $93 from investments in affiliated issuers) (Note 5) | $22,691,419 |
| Total investment income | 22,691,419 |
| |
| EXPENSES | |
| Compensation of Manager (Note 2) | 1,860,156 |
| Investor servicing fees (Note 2) | 887,603 |
| Custodian fees (Note 2) | 125,911 |
| Trustee compensation and expenses (Note 2) | 17,942 |
| Distribution fees (Note 2) | 1,224,606 |
| Administrative services (Note 2) | 16,791 |
| Other | 292,248 |
| Fees waived and reimbursed by Manager (Note 2) | (789,627) |
| Total expenses | 3,635,630 |
| Expense reduction (Note 2) | (20,836) |
| Net expenses | 3,614,794 |
| | |
| Net investment income | 19,076,625 |
| |
| REALIZED AND UNREALIZED GAIN (LOSS) | |
| Net realized gain (loss) on: | |
| Securities from unaffiliated issuers (Notes 1 and 3) | (8,812,708) |
| Futures contracts (Note 1) | (57,887) |
| Swap contracts (Note 1) | (14,702,537) |
| Written options (Note 1) | 5,821,179 |
| Total net realized loss | (17,751,953) |
| Change in net unrealized appreciation (depreciation) on: | |
| Securities from unaffiliated issuers and TBA sale commitments | 23,607,839 |
| Futures contracts | 115,756 |
| Swap contracts | (855,523) |
| Written options | 4,636,135 |
| Total change in net unrealized appreciation | 27,504,207 |
| | |
| Net gain on investments | 9,752,254 |
| |
| Net increase in net assets resulting from operations | $28,828,879 |
The accompanying notes are an integral part of these financial statements.
|
| 54 Mortgage Securities Fund |
Statement of changes in net assets
| | |
| INCREASE (DECREASE) IN NET ASSETS | Six months ended 3/31/19* | Year ended 9/30/18 |
| Operations | | |
| Net investment income | $19,076,625 | $32,160,607 |
| Net realized gain (loss) on investments | (17,751,953) | 2,404,047 |
| Change in net unrealized appreciation (depreciation) | | |
| of investments | 27,504,207 | (39,157,285) |
| Net increase (decrease) in net assets resulting | | |
| from operations | 28,828,879 | (4,592,631) |
| Distributions to shareholders (Note 1): | | |
| From ordinary income | | |
| Net investment income | | |
| Class A | (18,737,873) | (25,224,198) |
| Class B | (147,652) | (253,272) |
| Class C | (580,548) | (969,640) |
| Class M | (228,394) | (339,768) |
| Class R | (296,123) | (515,028) |
| Class R6 | (194,610) | (136,434) |
| Class Y | (2,314,453) | (3,862,971) |
| Increase (decrease) from capital share transactions | | |
| (Notes 4 and 7) | (87,090,290) | 209,689,014 |
| Total increase (decrease) in net assets | (80,761,064) | 173,795,072 |
| |
| NET ASSETS | | |
| Beginning of period | 1,003,691,464 | 829,896,392 |
| End of period | $922,930,400 | $1,003,691,464 |
*Unaudited.
The accompanying notes are an integral part of these financial statements.
|
| Mortgage Securities Fund 55 |
Financial highlights(For a common share outstanding throughout the period)
| | | | | | | | | | | | |
| | INVESTMENT OPERATIONS | | | LESS DISTRIBUTIONS | | | RATIOS AND SUPPLEMENTAL DATA | | |
| | | | | | | | | | | | Ratio | |
| | | | Net realized | | | | | | | | of net investment | |
| | Net asset value, | | and unrealized | Total from | From net | | | Total return | Net assets, | Ratio of expenses | income (loss) | Portfolio |
| | beginning | Net investment | gain (loss) | investment | investment | Total | Net asset value, | at net asset value | end of period | to average | to average | turnover |
| Period ended | of period | income (loss)a | on investments | operations | income | distributions | end of period | (%)b | (in thousands) | net assets (%)c | net assets (%) | (%)d |
| Class A | | | | | | | | | | | | |
| March 31, 2019** | $12.37 | .25 | .13 | .38 | (.29) | (.29) | $12.46 | 3.14* | $784,717 | .38*f,h | 2.00*f,h | 545* |
| September 30, 2018 | 12.89 | .45 | (.53) | (.08) | (.44) | (.44) | 12.37 | (.67) | 826,165 | .84f,g,h | 3.57f,h | 1,403 |
| September 30, 2017 | 13.20 | .33 | (.24) | .09 | (.40) | (.40) | 12.89 | .67 | 645,996 | .89f | 2.53f | 1,452 |
| September 30, 2016 | 13.35 | .31 | (.09) | .22 | (.37) | (.37) | 13.20 | 1.70 | 746,534 | .88e | 2.31e | 1,272 |
| September 30, 2015 | 13.70 | .30 | (.33) | (.03) | (.32) | (.32) | 13.35 | (.27) | 857,238 | .85 | 2.20 | 1,388 |
| September 30, 2014 | 13.30 | .26 | .37 | .63 | (.23) | (.23) | 13.70 | 4.80 | 863,612 | .86 | 1.95 | 1,346 |
| Class B | | | | | | | | | | | | |
| March 31, 2019** | $12.31 | .20 | .14 | .34 | (.25) | (.25) | $12.40 | 2.78* | $6,787 | .74*f,h | 1.65*f,h | 545* |
| September 30, 2018 | 12.83 | .34 | (.52) | (.18) | (.34) | (.34) | 12.31 | (1.42) | 8,280 | 1.57f,g,h | 2.73f,h | 1,403 |
| September 30, 2017 | 13.14 | .23 | (.24) | (.01) | (.30) | (.30) | 12.83 | (.07) | 10,736 | 1.62f | 1.79f | 1,452 |
| September 30, 2016 | 13.28 | .21 | (.07) | .14 | (.28) | (.28) | 13.14 | 1.04 | 14,957 | 1.61e | 1.58e | 1,272 |
| September 30, 2015 | 13.63 | .20 | (.33) | (.13) | (.22) | (.22) | 13.28 | (1.01) | 17,272 | 1.58 | 1.46 | 1,388 |
| September 30, 2014 | 13.23 | .17 | .36 | .53 | (.13) | (.13) | 13.63 | 4.05 | 21,352 | 1.59 | 1.23 | 1,346 |
| Class C | | | | | | | | | | | | |
| March 31, 2019** | $12.25 | .20 | .14 | .34 | (.25) | (.25) | $12.34 | 2.79* | $27,090 | .75*f,h | 1.64*f,h | 545* |
| September 30, 2018 | 12.77 | .33 | (.51) | (.18) | (.34) | (.34) | 12.25 | (1.45) | 31,674 | 1.59f,g,h | 2.68f,h | 1,403 |
| September 30, 2017 | 13.08 | .23 | (.24) | (.01) | (.30) | (.30) | 12.77 | (.09) | 41,652 | 1.64f | 1.77f | 1,452 |
| September 30, 2016 | 13.23 | .20 | (.07) | .13 | (.28) | (.28) | 13.08 | .97 | 56,947 | 1.63e | 1.56e | 1,272 |
| September 30, 2015 | 13.58 | .20 | (.34) | (.14) | (.21) | (.21) | 13.23 | (1.02) | 68,042 | 1.60 | 1.45 | 1,388 |
| September 30, 2014 | 13.18 | .16 | .37 | .53 | (.13) | (.13) | 13.58 | 4.05 | 73,828 | 1.61 | 1.21 | 1,346 |
| Class M | | | | | | | | | | | | |
| March 31, 2019** | $12.43 | .23 | .15 | .38 | (.28) | (.28) | $12.53 | 3.09* | $10,196 | .50*f,h | 1.88*f,h | 545* |
| September 30, 2018 | 12.95 | .41 | (.53) | (.12) | (.40) | (.40) | 12.43 | (.94) | 10,342 | 1.08f,g,h | 3.22f,h | 1,403 |
| September 30, 2017 | 13.26 | .30 | (.25) | .05 | (.36) | (.36) | 12.95 | .41 | 11,452 | 1.13f | 2.29f | 1,452 |
| September 30, 2016 | 13.40 | .27 | (.07) | .20 | (.34) | (.34) | 13.26 | 1.49 | 13,059 | 1.12e | 2.07e | 1,272 |
| September 30, 2015 | 13.75 | .27 | (.34) | (.07) | (.28) | (.28) | 13.40 | (.53) | 14,451 | 1.09 | 1.95 | 1,388 |
| September 30, 2014 | 13.34 | .23 | .38 | .61 | (.20) | (.20) | 13.75 | 4.58 | 16,562 | 1.10 | 1.71 | 1,346 |
| Class R | | | | | | | | | | | | |
| March 31, 2019** | $12.23 | .23 | .15 | .38 | (.28) | (.28) | $12.33 | 3.14* | $12,395 | .50*f,h | 1.89*f,h | 545* |
| September 30, 2018 | 12.76 | .40 | (.53) | (.13) | (.40) | (.40) | 12.23 | (1.03) | 14,329 | 1.09f,g,h | 3.20f,h | 1,403 |
| September 30, 2017 | 13.07 | .29 | (.24) | .05 | (.36) | (.36) | 12.76 | .41 | 17,599 | 1.14f | 2.28f | 1,452 |
| September 30, 2016 | 13.21 | .27 | (.07) | .20 | (.34) | (.34) | 13.07 | 1.52 | 22,317 | 1.13e | 2.06e | 1,272 |
| September 30, 2015 | 13.56 | .26 | (.33) | (.07) | (.28) | (.28) | 13.21 | (.53) | 23,513 | 1.10 | 1.94 | 1,388 |
| September 30, 2014 | 13.16 | .23 | .37 | .60 | (.20) | (.20) | 13.56 | 4.57 | 32,104 | 1.11 | 1.68 | 1,346 |
| Class R6 | | | | | | | | | | | | |
| March 31, 2019** | $12.24 | .27 | .14 | .41 | (.32) | (.32) | $12.33 | 3.38* | $6,825 | .18*f,h | 2.20*f,h | 545* |
| September 30, 2018† | 12.41 | .26 | (.21) | .05 | (.22) | (.22) | 12.24 | .42* | 7,530 | .16*f,g,h | 2.11*f,h | 1,403 |
See notes to financial highlights at the end of this section.
The accompanying notes are an integral part of these financial statements.
| |
| 56 Mortgage Securities Fund | Mortgage Securities Fund 57 |
Financial highlightscont.
| | | | | | | | | | | | |
| | INVESTMENT OPERATIONS | | | LESS DISTRIBUTIONS | | | | RATIOS AND SUPPLEMENTAL DATA | | |
| | | | | | | | | | | | Ratio | |
| | | | Net realized | | | | | | | | of net investment | |
| | Net asset value, | | and unrealized | Total from | From net | | | Total return | Net assets, | Ratio of expenses | income (loss) | Portfolio |
| | beginning | Net investment | gain (loss) | investment | investment | Total | Net asset value, | at net asset value | end of period | to average | to average | turnover |
| Period ended | of period | income (loss)a | on investments | operations | income | distributions | end of period | (%)b | (in thousands) | net assets (%)c | net assets (%) | (%)d |
| Class Y | | | | | | | | | | | | |
| March 31, 2019** | $12.23 | .26 | .15 | .41 | (.31) | (.31) | $12.33 | 3.38* | $74,921 | .25*f,h | 2.16*f,h | 545* |
| September 30, 2018 | 12.76 | .47 | (.53) | (.06) | (.47) | (.47) | 12.23 | (.49) | 105,371 | .59*f,g,h | 3.75f,h | 1,403 |
| September 30, 2017 | 13.08 | .36 | (.25) | .11 | (.43) | (.43) | 12.76 | .89 | 102,461 | .64f | 2.79f | 1,452 |
| September 30, 2016 | 13.22 | .34 | (.07) | .27 | (.41) | (.41) | 13.08 | 2.07 | 100,836 | .63e | 2.56e | 1,272 |
| September 30, 2015 | 13.58 | .33 | (.34) | (.01) | (.35) | (.35) | 13.22 | (.08) | 100,614 | .60 | 2.48 | 1,388 |
| September 30, 2014 | 13.19 | .29 | .37 | .66 | (.27) | (.27) | 13.58 | 5.04 | 69,154 | .61 | 2.19 | 1,346 |
*Not annualized.
**Unaudited.
†For the period April 20, 2018 (commencement of operations) to September 30, 2018.
aPer share net investment income (loss) has been determined on the basis of the weighted average number of shares outstanding during the period.
bTotal return assumes dividend reinvestment and does not reflect the effect of sales charges.
cIncludes amounts paid through expense offset and/or brokerage service arrangements, if any (Note 2). Also excludes acquired fund fees and expenses, if any.
dPortfolio turnover includes TBA purchase and sale commitments.
eReflects a voluntary waiver of certain fund expenses in effect during the period. As a result of such waiver, the expenses of each class reflect a reduction of less than 0.01% as a percentage of average net assets.
fReflects an involuntary contractual expense limitation and/or waivers of certain fund expenses in connection with investments in Putnam Government Money Market Fund in effect during the period. As a result of such limitations and/or waivers, the expenses of each class reflect a reduction of less than 0.01% as a percentage of average net assets.
gIncludes one-time merger costs of 0.02%.
hReflects an involuntary contractual expense limitation in effect during the period. As a result of such limitation, the expenses of each class reflect a reduction of the following amounts as a percentage of average net assets (Note 2):
| | |
| | 3/31/19 | 9/30/18 |
| Class A | 0.08% | 0.12% |
| Class B | 0.08 | 0.12 |
| Class C | 0.08 | 0.12 |
| Class M | 0.08 | 0.12 |
| Class R | 0.08 | 0.12 |
| Class R6 | 0.08 | 0.10 |
| Class Y | 0.08 | 0.12 |
The accompanying notes are an integral part of these financial statements.

Notes to financial statements3/31/19 (Unaudited)
Within the following Notes to financial statements, references to “State Street” represent State Street Bank and Trust Company, references to “the SEC” represent the Securities and Exchange Commission, references to “Putnam Management” represent Putnam Investment Management, LLC, the fund’s manager, an indirect wholly-owned subsidiary of Putnam Investments, LLC and references to “OTC”, if any, represent over-the-counter. Unless otherwise noted, the “reporting period” represents the period from October 1, 2018 through March 31, 2019.
Putnam Mortgage Securities Fund (the fund) is a Massachusetts business trust, which is registered under the Investment Company Act of 1940, as amended, as a diversified, open-end management investment company. The goal of the fund is to seek as high a level of current income as Putnam Management believes is consistent with preservation of capital. The fund invests mainly in mortgages, mortgage-related fixed income securities and related derivatives that are either investment-grade or below-investment-grade in quality (sometimes referred to as “junk bonds”). Under normal circumstances, the fund invests at least 80% of its net assets (plus any borrowings for investment purposes) in mortgages, mortgage-related fixed income securities and related derivatives (i.e., derivatives used to acquire exposure to, or whose underlying securities are, mortgages or mortgage-related securities). The fund generally uses the net unrealized gain or loss, or market value, of mortgage-related derivatives for purposes of this policy but may use the notional value of a derivative if that is determined to be a more appropriate measure of the fund’s investment exposure. This policy may be changed only after 60 days’ notice to shareholders.
The fund expects to invest in mortgage-backed investments that are obligations of U.S. government agencies and instrumentalities and accordingly are backed by the full faith and credit of the United States (e.g., Ginnie Mae mortgage-backed bonds) as well as in mortgage-backed investments that are backed by only the credit of a federal agency or government-sponsored entity (e.g., Fannie Mae and Freddie Mac mortgage-backed bonds), and that have short- to long-term maturities.
The fund also expects to invest in lower-rated, higher-yielding mortgage-backed securities, including non-agency residential mortgage-backed securities (which may be backed by non-qualified or “sub-prime” mortgages), commercial mortgage-backed securities, and collateralized mortgage obligations (including interest only, principal only, and other prepayment derivatives). Non-agency (i.e., privately issued) securities typically are lower-rated and higher yielding than securities issued or backed by agencies such as Ginnie Mae, Fannie Mae or Freddie Mac. While the fund’s emphasis will be on mortgage-backed securities, it may also invest to a lesser extent in other types of asset-backed securities.
Putnam Management may consider, among other factors, credit, interest rate, prepayment and liquidity risks, as well as general market conditions, when deciding whether to buy or sell investments.
The fund typically uses to a significant extent derivatives, including interest rate swaps, swaptions, forward delivery contracts, total return swaps, and options on mortgage-backed securities and indices, for both hedging and non-hedging purposes, including to obtain or adjust exposure to mortgage-backed investments.
| |
| 58 Mortgage Securities Fund | Mortgage Securities Fund 59 |
The fund offers class A, class B, class C, class M, class R, class R6 and class Y shares. Purchases of class B shares are closed to new and existing investors except by exchange from class B shares of another Putnam fund or through dividend and/or capital gains reinvestment. Class A and class M shares are sold with a maximum front-end sales charge of 4.00% and 3.25%, respectively. Class A shares generally are not subject to a contingent deferred sales charge, and class M, class R, class R6 and class Y shares are not subject to a contingent deferred sales charge. Class B shares, which convert to class A shares after approximately eight years, are not subject to a front-end sales charge and are subject to a contingent deferred sales charge if those shares are redeemed within six years of purchase. Class C shares are subject to a one-year 1.00% contingent deferred sales charge and generally convert to class A shares after approximately ten years. Class R shares, which are not available to all investors, are sold at net asset value. The expenses for class A, class B, class C, class M and class R shares may differ based on the distribution fee of each class, which is identified in Note 2. Class R6 and class Y shares, which are sold at net asset value, are generally subject to the same expenses as class A, class B, class C, class M and class R shares, but do not bear a distribution fee, and in the case of class R6 shares, bear a lower investor servicing fee, which is identified in Note 2. Class R6 and class Y shares are not available to all investors.
In the normal course of business, the fund enters into contracts that may include agreements to indemnify another party under given circumstances. The fund’s maximum exposure under these arrangements is unknown as this would involve future claims that may be, but have not yet been, made against the fund. However, the fund’s management team expects the risk of material loss to be remote.
The fund has entered into contractual arrangements with an investment adviser, administrator, distributor, shareholder servicing agent and custodian, who each provide services to the fund. Unless expressly stated otherwise, shareholders are not parties to, or intended beneficiaries of these contractual arrangements, and these contractual arrangements are not intended to create any shareholder right to enforce them against the service providers or to seek any remedy under them against the service providers, either directly or on behalf of the fund.
Under the fund’s Amended and Restated Agreement and Declaration of Trust, any claims asserted against or on behalf of the Putnam Funds, including claims against Trustees and Officers, must be brought in state and federal courts located within the Commonwealth of Massachusetts.
Note 1: Significant accounting policies
The following is a summary of significant accounting policies consistently followed by the fund in the preparation of its financial statements. The preparation of financial statements is in conformity with accounting principles generally accepted in the United States of America and requires management to make estimates and assumptions that affect the reported amounts of assets and liabilities in the financial statements and the reported amounts of increases and decreases in net assets from operations. Actual results could differ from those estimates. Subsequent events after the Statement of assets and liabilities date through the date that the financial statements were issued have been evaluated in the preparation of the financial statements.
Investment income, realized and unrealized gains and losses and expenses of the fund are borne pro-rata based on the relative net assets of each class to the total net assets of the fund, except that each class bears expenses unique to that class (including the distribution fees applicable to such classes). Each class votes as a class only with respect to its own distribution plan or other matters on which a class vote is required by law or determined by the Trustees. If the fund were liquidated, shares of each class would receive their pro-rata share of the net assets of the fund. In addition, the Trustees declare separate dividends on each class of shares.
Security valuationPortfolio securities and other investments are valued using policies and procedures adopted by the Board of Trustees. The Trustees have formed a Pricing Committee to oversee the implementation of these procedures and have delegated responsibility for valuing the fund’s assets in accordance with these procedures to Putnam Management. Putnam Management has established an internal Valuation Committee that is responsible for making fair value determinations, evaluating the effectiveness of the pricing policies of the fund and reporting to the Pricing Committee.
Investments, including mortgage backed securities and short-term investments with remaining maturities of 60 days or less, are valued on the basis of valuations provided by an independent pricing service approved by the Trustees or dealers selected by Putnam Management. Such service providers use information with respect to transactions in bonds, quotations from bond dealers, market transactions in comparable securities and various relationships between securities in determining value. These securities will generally be categorized as Level 2.
Investments in open-end investment companies (excluding exchange-traded funds), if any, which can be classified as Level 1 or Level 2 securities, are valued based on their net asset value. The net asset value of such
|
| 60 Mortgage Securities Fund |
investment companies equals the total value of their assets less their liabilities and divided by the number of their outstanding shares.
Certain investments, including certain restricted and illiquid securities and derivatives, are also valued at fair value following procedures approved by the Trustees. These valuations consider such factors as significant market or specific security events such as interest rate or credit quality changes, various relationships with other securities, discount rates, U.S. Treasury, U.S. swap and credit yields, index levels, convexity exposures, recovery rates, sales and other multiples and resale restrictions. These securities are classified as Level 2 or as Level 3 depending on the priority of the significant inputs.
To assess the continuing appropriateness of fair valuations, the Valuation Committee reviews and affirms the reasonableness of such valuations on a regular basis after considering all relevant information that is reasonably available. Such valuations and procedures are reviewed periodically by the Trustees. Certain securities may be valued on the basis of a price provided by a single source. The fair value of securities is generally determined as the amount that the fund could reasonably expect to realize from an orderly disposition of such securities over a reasonable period of time. By its nature, a fair value price is a good faith estimate of the value of a security in a current sale and does not reflect an actual market price, which may be different by a material amount.
Joint trading accountPursuant to an exemptive order from the SEC, the fund may transfer uninvested cash balances into a joint trading account along with the cash of other registered investment companies and certain other accounts managed by Putnam Management. These balances may be invested in issues of short-term investments having maturities of up to 90 days.
Repurchase agreementsThe fund, or any joint trading account, through its custodian, receives delivery of the underlying securities, the fair value of which at the time of purchase is required to be in an amount at least equal to the resale price, including accrued interest. Collateral for certain tri-party repurchase agreements, which totaled $43,067,538, is held at the counterparty’s custodian in a segregated account for the benefit of the fund and the counterparty. Putnam Management is responsible for determining that the value of these underlying securities is at all times at least equal to the resale price, including accrued interest. In the event of default or bankruptcy by the other party to the agreement, retention of the collateral may be subject to legal proceedings.
Security transactions and related investment incomeSecurity transactions are recorded on the trade date (the date the order to buy or sell is executed). Gains or losses on securities sold are determined on the identified cost basis.
Interest income, net of any applicable withholding taxes, is recorded on the accrual basis. All premiums/discounts are amortized/accreted on a yield-to-maturity basis.
Securities purchased or sold on a delayed delivery basis may be settled at a future date beyond customary settlement time; interest income is accrued based on the terms of the securities. Losses may arise due to changes in the fair value of the underlying securities or if the counterparty does not perform under the contract.
Stripped securitiesThe fund may invest in stripped securities which represent a participation in securities that may be structured in classes with rights to receive different portions of the interest and principal. Interest-only securities receive all of the interest and principal-only securities receive all of the principal. If the interest-only securities experience greater than anticipated prepayments of principal, the fund may fail to recoup fully its initial investment in these securities. Conversely, principal-only securities increase in value if prepayments are greater than anticipated and decline if prepayments are slower than anticipated. The fair value of these securities is highly sensitive to changes in interest rates.
Options contractsThe fund uses options contracts to hedge duration and convexity, to isolate prepayment risk and to manage downside risks.
The potential risk to the fund is that the change in value of options contracts may not correspond to the change in value of the hedged instruments. In addition, losses may arise from changes in the value of the underlying instruments if there is an illiquid secondary market for the contracts, if interest or exchange rates move unexpectedly or if the counterparty to the contract is unable to perform. Realized gains and losses on purchased options are included in realized gains and losses on investment securities. If a written call option is exercised, the premium originally received is recorded as an addition to sales proceeds. If a written put option is exercised, the premium originally received is recorded as a reduction to the cost of investments.
Exchange-traded options are valued at the last sale price or, if no sales are reported, the last bid price for purchased options and the last ask price for written options. OTC traded options are valued using prices supplied by dealers.
|
| Mortgage Securities Fund 61 |
Options on swaps are similar to options on securities except that the premium paid or received is to buy or grant the right to enter into a previously agreed upon interest rate or credit default contract. Forward premium swap option contracts include premiums that have extended settlement dates. The delayed settlement of the premiums is factored into the daily valuation of the option contracts. In the case of interest rate cap and floor contracts, in return for a premium, ongoing payments between two parties are based on interest rates exceeding a specified rate, in the case of a cap contract, or falling below a specified rate in the case of a floor contract.
Written option contracts outstanding at period end, if any, are listed after the fund’s portfolio.
Futures contractsThe fund uses futures contracts for hedging treasury term structure risk and for yield curve positioning.
The potential risk to the fund is that the change in value of futures contracts may not correspond to the change in value of the hedged instruments. In addition, losses may arise from changes in the value of the underlying instruments, if there is an illiquid secondary market for the contracts, if interest or exchange rates move unexpectedly or if the counterparty to the contract is unable to perform. With futures, there is minimal counterparty credit risk to the fund since futures are exchange traded and the exchange’s clearinghouse, as counterparty to all exchange traded futures, guarantees the futures against default. Risks may exceed amounts recognized on the Statement of assets and liabilities. When the contract is closed, the fund records a realized gain or loss equal to the difference between the value of the contract at the time it was opened and the value at the time it was closed.
Futures contracts are valued at the quoted daily settlement prices established by the exchange on which they trade. The fund and the broker agree to exchange an amount of cash equal to the daily fluctuation in the value of the futures contract. Such receipts or payments are known as “variation margin.”
Futures contracts outstanding at period end, if any, are listed after the fund’s portfolio.
Interest rate swap contractsThe fund entered into OTC and/or centrally cleared interest rate swap contracts, which are arrangements between two parties to exchange cash flows based on a notional principal amount, to hedge term structure risk and for yield curve positioning.
An OTC and centrally cleared interest rate swap can be purchased or sold with an upfront premium. For OTC interest rate swap contracts, an upfront payment received by the fund is recorded as a liability on the fund’s books. An upfront payment made by the fund is recorded as an asset on the fund’s books. OTC and centrally cleared interest rate swap contracts are marked to market daily based upon quotations from an independent pricing service or market makers. Any change is recorded as an unrealized gain or loss on OTC interest rate swaps. Daily fluctuations in the value of centrally cleared interest rate swaps are settled through a central clearing agent and are recorded in variation margin on the Statement of assets and liabilities and recorded as unrealized gain or loss. Payments, including upfront premiums, received or made are recorded as realized gains or losses at the reset date or the closing of the contract. Certain OTC and centrally cleared interest rate swap contracts may include extended effective dates. Payments related to these swap contracts are accrued based on the terms of the contract.
The fund could be exposed to credit or market risk due to unfavorable changes in the fluctuation of interest rates or if the counterparty defaults, in the case of OTC interest rate contracts, or the central clearing agency or a clearing member defaults, in the case of centrally cleared interest rate swap contracts, on its respective obligation to perform under the contract. The fund’s maximum risk of loss from counterparty risk or central clearing risk is the fair value of the contract. This risk may be mitigated for OTC interest rate swap contracts by having a master netting arrangement between the fund and the counterparty and for centrally cleared interest rate swap contracts through the daily exchange of variation margin. There is minimal counterparty risk with respect to centrally cleared interest rate swap contracts due to the clearinghouse guarantee fund and other resources that are available in the event of a clearing member default. Risk of loss may exceed amounts recognized on the Statement of assets and liabilities.
OTC and centrally cleared interest rate swap contracts outstanding, including their respective notional amounts at period end, if any, are listed after the fund’s portfolio.
Total return swap contractsThe fund entered into OTC and/or centrally cleared total return swap contracts, which are arrangements to exchange a market-linked return for a periodic payment, both based on a notional principal amount, to hedge sector exposure and to gain exposure to specific sectors.
To the extent that the total return of the security, index or other financial measure underlying the transaction exceeds or falls short of the offsetting interest rate obligation, the fund will receive a payment from or make a payment to the counterparty. OTC and/or centrally cleared total return swap contracts are marked to market
|
| 62 Mortgage Securities Fund |
daily based upon quotations from an independent pricing service or market maker. Any change is recorded as an unrealized gain or loss on OTC total return swaps. Daily fluctuations in the value of centrally cleared total return swaps are settled through a central clearing agent and are recorded in variation margin on the Statement of assets and liabilities and recorded as unrealized gain or loss. Payments received or made are recorded as realized gains or losses. Certain OTC and/or centrally cleared total return swap contracts may include extended effective dates. Payments related to these swap contracts are accrued based on the terms of the contract. The fund could be exposed to credit or market risk due to unfavorable changes in the fluctuation of interest rates or in the price of the underlying security or index, the possibility that there is no liquid market for these agreements or that the counterparty may default on its obligation to perform. The fund’s maximum risk of loss from counterparty risk or central clearing risk is the fair value of the contract. This risk may be mitigated for OTC total return swap contracts by having a master netting arrangement between the fund and the counterparty and for centrally cleared total return swap contracts through the daily exchange of variation margin. There is minimal counterparty risk with respect to centrally cleared total return swap contracts due to the clearinghouse guarantee fund and other resources that are available in the event of a clearing member default. Risk of loss may exceed amounts recognized on the Statement of assets and liabilities.
OTC and/or centrally cleared total return swap contracts outstanding, including their respective notional amounts at period end, if any, are listed after the fund’s portfolio.
Credit default contractsThe fund entered into OTC and/or centrally cleared credit default contracts to hedge credit risk, to hedge market risk and for gaining exposure to specific sectors.
In OTC and centrally cleared credit default contracts, the protection buyer typically makes a periodic stream of payments to a counterparty, the protection seller, in exchange for the right to receive a contingent payment upon the occurrence of a credit event on the reference obligation or all other equally ranked obligations of the reference entity. Credit events are contract specific but may include bankruptcy, failure to pay, restructuring and obligation acceleration. For OTC credit default contracts, an upfront payment received by the fund is recorded as a liability on the fund’s books. An upfront payment made by the fund is recorded as an asset on the fund’s books. Centrally cleared credit default contracts provide the same rights to the protection buyer and seller except the payments between parties, including upfront premiums, are settled through a central clearing agent through variation margin payments. Upfront and periodic payments received or paid by the fund for OTC and centrally cleared credit default contracts are recorded as realized gains or losses at the reset date or close of the contract. The OTC and centrally cleared credit default contracts are marked to market daily based upon quotations from an independent pricing service or market makers. Any change in value of OTC credit default contracts is recorded as an unrealized gain or loss. Daily fluctuations in the value of centrally cleared credit default contracts are recorded in variation margin on the Statement of assets and liabilities and recorded as unrealized gain or loss. Upon the occurrence of a credit event, the difference between the par value and fair value of the reference obligation, net of any proportional amount of the upfront payment, is recorded as a realized gain or loss.
In addition to bearing the risk that the credit event will occur, the fund could be exposed to market risk due to unfavorable changes in interest rates or in the price of the underlying security or index or the possibility that the fund may be unable to close out its position at the same time or at the same price as if it had purchased the underlying reference obligations. In certain circumstances, the fund may enter into offsetting OTC and centrally cleared credit default contracts which would mitigate its risk of loss. Risks of loss may exceed amounts recognized on the Statement of assets and liabilities. The fund’s maximum risk of loss from counterparty risk, either as the protection seller or as the protection buyer, is the fair value of the contract. This risk may be mitigated for OTC credit default contracts by having a master netting arrangement between the fund and the counterparty and for centrally cleared credit default contracts through the daily exchange of variation margin. Counterparty risk is further mitigated with respect to centrally cleared credit default swap contracts due to the clearinghouse guarantee fund and other resources that are available in the event of a clearing member default. Where the fund is a seller of protection, the maximum potential amount of future payments the fund may be required to make is equal to the notional amount.
OTC and centrally cleared credit default contracts outstanding, including their respective notional amounts at period end, if any, are listed after the fund’s portfolio.
TBA commitmentsThe fund may enter into TBA (to be announced) commitments to purchase securities for a fixed unit price at a future date beyond customary settlement time. Although the unit price and par amount have been established, the actual securities have not been specified. However, it is anticipated that the amount of the commitments will not significantly differ from the principal amount. The fund holds, and maintains until settlement date, cash or high-grade debt obligations in an amount sufficient to meet the purchase price, or the
|
| Mortgage Securities Fund 63 |
fund may enter into offsetting contracts for the forward sale of other securities it owns. Income on the securities will not be earned until settlement date.
The fund may also enter into TBA sale commitments to hedge its portfolio positions, to sell mortgage-backed securities it owns under delayed delivery arrangements or to take a short position in mortgage-backed securities. Proceeds of TBA sale commitments are not received until the contractual settlement date. During the time a TBA sale commitment is outstanding, either equivalent deliverable securities or an offsetting TBA purchase commitment deliverable on or before the sale commitment date are held as “cover” for the transaction, or other liquid assets in an amount equal to the notional value of the TBA sale commitment are segregated. If the TBA sale commitment is closed through the acquisition of an offsetting TBA purchase commitment, the fund realizes a gain or loss. If the fund delivers securities under the commitment, the fund realizes a gain or a loss from the sale of the securities based upon the unit price established at the date the commitment was entered into.
TBA commitments, which are accounted for as purchase and sale transactions, may be considered securities themselves, and involve a risk of loss due to changes in the value of the security prior to the settlement date as well as the risk that the counterparty to the transaction will not perform its obligations. Counterparty risk is mitigated by having a master agreement between the fund and the counterparty.
Unsettled TBA commitments are valued at their fair value according to the procedures described under “Security valuation” above. The contract is marked to market daily and the change in fair value is recorded by the fund as an unrealized gain or loss. Based on market circumstances, Putnam Management will determine whether to take delivery of the underlying securities or to dispose of the TBA commitments prior to settlement.
TBA purchase commitments outstanding at period end, if any, are listed within the fund’s portfolio and TBA sale commitments outstanding at period end, if any, are listed after the fund’s portfolio.
Master agreementsThe fund is a party to ISDA (International Swaps and Derivatives Association, Inc.) Master Agreements that govern OTC derivative and foreign exchange contracts and Master Securities Forward Transaction Agreements that govern transactions involving mortgage-backed and other asset-backed securities that may result in delayed delivery (Master Agreements) with certain counterparties entered into from time to time. The Master Agreements may contain provisions regarding, among other things, the parties’ general obligations, representations, agreements, collateral requirements, events of default and early termination. With respect to certain counterparties, in accordance with the terms of the Master Agreements, collateral posted to the fund is held in a segregated account by the fund’s custodian and, with respect to those amounts which can be sold or repledged, are presented in the fund’s portfolio.
Collateral pledged by the fund is segregated by the fund’s custodian and identified in the fund’s portfolio. Collateral can be in the form of cash or debt securities issued by the U.S. Government or related agencies or other securities as agreed to by the fund and the applicable counterparty. Collateral requirements are determined based on the fund’s net position with each counterparty.
With respect to ISDA Master Agreements, termination events applicable to the fund may occur upon a decline in the fund’s net assets below a specified threshold over a certain period of time. Termination events applicable to counterparties may occur upon a decline in the counterparty’s long-term or short-term credit ratings below a specified level. In each case, upon occurrence, the other party may elect to terminate early and cause settlement of all derivative and foreign exchange contracts outstanding, including the payment of any losses and costs resulting from such early termination, as reasonably determined by the terminating party. Any decision by one or more of the fund’s counterparties to elect early termination could impact the fund’s future derivative activity.
At the close of the reporting period, the fund had a net liability position of $34,591,573 on open derivative contracts subject to the Master Agreements. Collateral posted by the fund at period end for these agreements totaled $33,789,521 and may include amounts related to unsettled agreements.
Interfund lendingThe fund, along with other Putnam funds, may participate in an interfund lending program pursuant to an exemptive order issued by the SEC. This program allows the fund to borrow from or lend to other Putnam funds that permit such transactions. Interfund lending transactions are subject to each fund’s investment policies and borrowing and lending limits. Interest earned or paid on the interfund lending transaction will be based on the average of certain current market rates. During the reporting period, the fund did not utilize the program.
Lines of creditThe fund participates, along with other Putnam funds, in a $317.5 million unsecured committed line of credit and a $235.5 million unsecured uncommitted line of credit, both provided by State Street. Borrowings may be made for temporary or emergency purposes, including the funding of shareholder
|
| 64 Mortgage Securities Fund |
redemption requests and trade settlements. Interest is charged to the fund based on the fund’s borrowing at a rate equal to 1.25% plus the higher of (1) the Federal Funds rate and (2) the overnight LIBOR for the committed line of credit and the Federal Funds rate plus 1.30% for the uncommitted line of credit. A closing fee equal to 0.04% of the committed line of credit and 0.04% of the uncommitted line of credit has been paid by the participating funds. In addition, a commitment fee of 0.21% per annum on any unutilized portion of the committed line of credit is allocated to the participating funds based on their relative net assets and paid quarterly. During the reporting period, the fund had no borrowings against these arrangements.
Federal taxesIt is the policy of the fund to distribute all of its taxable income within the prescribed time period and otherwise comply with the provisions of the Internal Revenue Code of 1986, as amended (the Code), applicable to regulated investment companies. It is also the intention of the fund to distribute an amount sufficient to avoid imposition of any excise tax under Section 4982 of the Code.
The fund is subject to the provisions of Accounting Standards Codification 740Income Taxes(ASC 740). ASC 740 sets forth a minimum threshold for financial statement recognition of the benefit of a tax position taken or expected to be taken in a tax return. The fund did not have a liability to record for any unrecognized tax benefits in the accompanying financial statements. No provision has been made for federal taxes on income, capital gains or unrealized appreciation on securities held nor for excise tax on income and capital gains. Each of the fund’s federal tax returns for the prior three fiscal years remains subject to examination by the Internal Revenue Service.
Under the Regulated Investment Company Modernization Act of 2010, the fund will be permitted to carry forward capital losses incurred for an unlimited period and the carry forwards will retain their character as either short-term or long-term capital losses. At September 30, 2018, the fund had the following capital loss carryovers available, to the extent allowed by the Code, to offset future net capital gain, if any:
| | |
| | Loss carryover | |
| Short-term | Long-term | Total |
| $124,743,416 | $39,824,603 | $164,568,019 |
Tax cost of investments includes adjustments to net unrealized appreciation (depreciation) which may not necessarily be final tax cost basis adjustments, but closely approximate the tax basis unrealized gains and losses that may be realized and distributed to shareholders. The aggregate identified cost on a tax basis is $1,565,361,629, resulting in gross unrealized appreciation and depreciation of $48,745,266 and $76,933,706, respectively, or net unrealized depreciation of $28,188,440.
Distributions to shareholdersDistributions to shareholders from net investment income are recorded by the fund on the ex-dividend date. Distributions from capital gains, if any, are recorded on the ex-dividend date and paid at least annually. The amount and character of income and gains to be distributed are determined in accordance with income tax regulations, which may differ from generally accepted accounting principles. Dividend sources are estimated at the time of declaration. Actual results may vary. Any non-taxable return of capital cannot be determined until final tax calculations are completed after the end of the fund’s fiscal year. Reclassifications are made to the fund’s capital accounts to reflect income and gains available for distribution (or available capital loss carryovers) under income tax regulations.
Note 2: Management fee, administrative services and other transactions
The fund pays Putnam Management a management fee (based on the fund’s average net assets and computed and paid monthly) at annual rates that may vary based on the average of the aggregate net assets of all open-end mutual funds sponsored by Putnam Management (excluding net assets of funds that are invested in, or that are invested in by, other Putnam funds to the extent necessary to avoid “double counting” of those assets). Such annual rates may vary as follows:
| | | | |
| 0.550% | of the first $5 billion, | | 0.350% | of the next $50 billion, |
| 0.500% | of the next $5 billion, | | 0.330% | of the next $50 billion, |
| 0.450% | of the next $10 billion, | | 0.320% | of the next $100 billion and |
| 0.400% | of the next $10 billion, | | 0.315% | of any excess thereafter. |
For the reporting period, the management fee represented an effective rate (excluding the impact from any expense waivers in effect) of 0.195% of the fund’s average net assets.
|
| Mortgage Securities Fund 65 |
Putnam Management has contractually agreed to waive fees (and, to the extent necessary, bear other expenses) of the fund through January 30, 2020, to the extent that total expenses of the fund (excluding brokerage, interest, taxes, investment-related expenses, payments under distribution plans, extraordinary expenses, payments under the fund’s investor servicing contract and acquired fund fees and expenses, but including payments under the fund’s investment management contract) would exceed an annual rate of 0.32% of the fund’s average net assets. During the reporting period, the fund’s expenses were reduced by $789,603 as a result of this limit.
Putnam Management has also contractually agreed, through January 30, 2020, to waive fees and/or reimburse the fund’s expenses to the extent necessary to limit the cumulative expenses of the fund, exclusive of brokerage, interest, taxes, investment-related expenses, extraordinary expenses, acquired fund fees and expenses and payments under the fund’s investor servicing contract, investment management contract and distribution plans, on a fiscal year-to-date basis to an annual rate of 0.20% of the fund’s average net assets over such fiscal year-to-date period. During the reporting period, the fund’s expenses were not reduced as a result of this limit.
The fund invests in Putnam Government Money Market Fund, an open-end management investment company managed by Putnam Management. Management fees paid by the fund are reduced by an amount equal to the management fees paid by Putnam Government Money Market Fund with respect to assets invested by the fund in Putnam Government Money Market Fund. For the reporting period, management fees paid were reduced by $24 relating to the fund’s investment in Putnam Government Money Market Fund.
Putnam Investments Limited (PIL), an affiliate of Putnam Management, is authorized by the Trustees to manage a separate portion of the assets of the fund as determined by Putnam Management from time to time. PIL did not manage any portion of the assets of the fund during the reporting period. If Putnam Management were to engage the services of PIL, Putnam Management would pay a quarterly sub-management fee to PIL for its services at an annual rate of 0.25% of the average net assets of the portion of the fund managed by PIL.
The fund reimburses Putnam Management an allocated amount for the compensation and related expenses of certain officers of the fund and their staff who provide administrative services to the fund. The aggregate amount of all such reimbursements is determined annually by the Trustees.
Custodial functions for the fund’s assets are provided by State Street. Custody fees are based on the fund’s asset level, the number of its security holdings and transaction volumes.
Putnam Investor Services, Inc., an affiliate of Putnam Management, provides investor servicing agent functions to the fund. Putnam Investor Services, Inc. received fees for investor servicing for class A, class B, class C, class M, class R and class Y shares that included (1) a per account fee for each direct and underlying non-defined contribution account (retail account) of the fund; (2) a specified rate of the fund’s assets attributable to defined contribution plan accounts; and (3) a specified rate based on the average net assets in retail accounts. Putnam Investor Services, Inc. has agreed that the aggregate investor servicing fees for each fund’s retail and defined contribution accounts for these share classes will not exceed an annual rate of 0.25% of the fund’s average assets attributable to such accounts.
Class R6 shares paid a monthly fee based on the average net assets of class R6 shares at an annual rate of 0.05%.
During the reporting period, the expenses for each class of shares related to investor servicing fees were as follows:
| | | | |
| Class A | $742,251 | | Class R | 12,250 |
| Class B | 6,928 | | Class R6 | 1,877 |
| Class C | 27,142 | | Class Y | 87,619 |
| Class M | 9,536 | | Total | $887,603 |
The fund has entered into expense offset arrangements with Putnam Investor Services, Inc. and State Street whereby Putnam Investor Services, Inc.’s and State Street’s fees are reduced by credits allowed on cash balances. For the reporting period, the fund’s expenses were reduced by $20,836 under the expense offset arrangements.
Each Independent Trustee of the fund receives an annual Trustee fee, of which $726, as a quarterly retainer, has been allocated to the fund, and an additional fee for each Trustees meeting attended. Trustees also are reimbursed for expenses they incur relating to their services as Trustees.
The fund has adopted a Trustee Fee Deferral Plan (the Deferral Plan) which allows the Trustees to defer the receipt of all or a portion of Trustees fees payable on or after July 1, 1995. The deferred fees remain invested in certain Putnam funds until distribution in accordance with the Deferral Plan.
|
| 66 Mortgage Securities Fund |
The fund has adopted an unfunded noncontributory defined benefit pension plan (the Pension Plan) covering all Trustees of the fund who have served as a Trustee for at least five years and were first elected prior to 2004. Benefits under the Pension Plan are equal to 50% of the Trustee’s average annual attendance and retainer fees for the three years ended December 31, 2005. The retirement benefit is payable during a Trustee’s lifetime, beginning the year following retirement, for the number of years of service through December 31, 2006. Pension expense for the fund is included in Trustee compensation and expenses in the Statement of operations. Accrued pension liability is included in Payable for Trustee compensation and expenses in the Statement of assets and liabilities. The Trustees have terminated the Pension Plan with respect to any Trustee first elected after 2003.
The fund has adopted distribution plans (the Plans) with respect to the following share classes pursuant to Rule 12b–1 under the Investment Company Act of 1940. The purpose of the Plans is to compensate Putnam Retail Management Limited Partnership, an indirect wholly-owned subsidiary of Putnam Investments, LLC, for services provided and expenses incurred in distributing shares of the fund. The Plans provide payments by the fund to Putnam Retail Management Limited Partnership at an annual rate of up to the following amounts (Maximum %) of the average net assets attributable to each class. The Trustees have approved payment by the fund at the following annual rate (Approved %) of the average net assets attributable to each class. During the reporting period, the class-specific expenses related to distribution fees were as follows:
| | | |
| | Maximum % | Approved % | Amount |
| Class A | 0.35% | 0.25% | $986,781 |
| Class B | 1.00% | 1.00%* | 36,178 |
| Class C | 1.00% | 1.00% | 144,284 |
| Class M | 1.00% | † | 24,761 |
| Class R | 1.00% | 0.50% | 32,602 |
| Total | | | $1,224,606 |
*Effective January 31, 2019.
†Equals the weighted average of (i) 0.40% of the net assets of Putnam Limited Duration Government Income Fund attributable to class M shares existing on November 9, 2007; and (ii) 0.50% of all other net assets of Putnam Mortgage Securities Fund attributable to class M shares.
For the reporting period, Putnam Retail Management Limited Partnership, acting as underwriter, received net commissions of $7,656 and $229 from the sale of class A and class M shares, respectively, and received $985 and $711 in contingent deferred sales charges from redemptions of class B and class C shares, respectively.
A deferred sales charge of up to 1.00% is assessed on certain redemptions of class A shares. For the reporting period, Putnam Retail Management Limited Partnership, acting as underwriter, received $28 on class A redemptions.
Note 3: Purchases and sales of securities
During the reporting period, the cost of purchases and the proceeds from sales, excluding short-term investments, were as follows:
| | |
| | Cost of purchases | Proceeds from sales |
| Investments in securities, including TBA commitments (Long-term) | $8,252,078,429 | $8,289,012,550 |
| U.S. government securities (Long-term) | — | — |
| Total | $8,252,078,429 | $8,289,012,550 |
The fund may purchase or sell investments from or to other Putnam funds in the ordinary course of business, which can reduce the fund’s transaction costs, at prices determined in accordance with SEC requirements and policies approved by the Trustees. During the reporting period, purchases or sales of long-term securities from or to other Putnam funds, if any, did not represent more than 5% of the fund’s total cost of purchases and/or total proceeds from sales.
|
| Mortgage Securities Fund 67 |
Note 4: Capital shares
At the close of the reporting period, there were an unlimited number of shares of beneficial interest authorized. Transactions, including, if applicable, direct exchanges pursuant to share conversions, in capital shares were as follows:
| | | | |
| | SIX MONTHS ENDED 3/31/19 | YEAR ENDED 9/30/18 |
| Class A | Shares | Amount | Shares | Amount |
| Shares sold | 1,399,972 | $17,206,050 | 3,841,891 | $48,524,050 |
| Shares issued in connection with | | | | |
| reinvestment of distributions | 1,306,069 | 15,993,127 | 1,697,195 | 21,396,761 |
| Shares issued in connection with the | | | | |
| merger of Putnam American | | | | |
| Government Income Fund | — | — | 24,503,476 | 307,067,755 |
| | 2,706,041 | 33,199,177 | 30,042,562 | 376,988,566 |
| Shares repurchased | (6,542,297) | (80,141,406) | (13,344,675) | (168,238,106) |
| Net increase (decrease) | (3,836,256) | $(46,942,229) | 16,697,887 | $208,750,460 |
| |
| | SIX MONTHS ENDED 3/31/19 | YEAR ENDED 9/30/18 |
| Class B | Shares | Amount | Shares | Amount |
| Shares sold | 2,738 | $33,294 | 6,229 | $79,399 |
| Shares issued in connection with | | | | |
| reinvestment of distributions | 11,430 | 139,247 | 18,820 | 236,468 |
| Shares issued in connection with the | | | | |
| merger of Putnam American | | | | |
| Government Income Fund | — | — | 214,052 | 2,669,148 |
| | 14,168 | 172,541 | 239,101 | 2,985,015 |
| Shares repurchased | (139,631) | (1,706,395) | (403,152) | (5,069,172) |
| Net decrease | (125,463) | $(1,533,854) | (164,051) | $(2,084,157) |
| |
| | SIX MONTHS ENDED 3/31/19 | YEAR ENDED 9/30/18 |
| Class C | Shares | Amount | Shares | Amount |
| Shares sold | 96,424 | $1,169,569 | 148,452 | $1,868,335 |
| Shares issued in connection with | | | | |
| reinvestment of distributions | 41,054 | 497,965 | 66,999 | 838,185 |
| Shares issued in connection with the | | | | |
| merger of Putnam American | | | | |
| Government Income Fund | — | — | 704,769 | 8,749,079 |
| | 137,478 | 1,667,534 | 920,220 | 11,455,599 |
| Shares repurchased | (528,232) | (6,414,150) | (1,595,720) | (19,954,244) |
| Net decrease | (390,754) | $(4,746,616) | (675,500) | $(8,498,645) |
|
| 68 Mortgage Securities Fund |
| | | | |
| | SIX MONTHS ENDED 3/31/19 | YEAR ENDED 9/30/18 |
| Class M | Shares | Amount | Shares | Amount |
| Shares sold | 7,681 | $94,323 | 6,663 | $84,365 |
| Shares issued in connection with | | | | |
| reinvestment of distributions | 7,536 | 92,779 | 10,663 | 135,279 |
| Shares issued in connection with the | | | | |
| merger of Putnam American | | | | |
| Government Income Fund | — | — | 52,516 | 661,414 |
| | 15,217 | 187,102 | 69,842 | 881,058 |
| Shares repurchased | (33,307) | (410,483) | (121,964) | (1,547,185) |
| Net decrease | (18,090) | $(223,381) | (52,122) | $(666,127) |
| |
| | SIX MONTHS ENDED 3/31/19 | YEAR ENDED 9/30/18 |
| Class R | Shares | Amount | Shares | Amount |
| Shares sold | 88,048 | $1,069,090 | 296,894 | $3,721,780 |
| Shares issued in connection with | | | | |
| reinvestment of distributions | 18,815 | 227,913 | 29,907 | 373,692 |
| Shares issued in connection with the | | | | |
| merger of Putnam American | | | | |
| Government Income Fund | — | — | 173,909 | 2,156,873 |
| | 106,863 | 1,297,003 | 500,710 | 6,252,345 |
| Shares repurchased | (272,530) | (3,301,291) | (708,630) | (8,852,976) |
| Net decrease | (165,667) | $(2,004,288) | (207,920) | $(2,600,631) |
| |
| | | | FOR THE PERIOD 4/20/18 |
| | | | (COMMENCEMENT OF OPERATIONS) |
| | SIX MONTHS ENDED 3/31/19 | TO 9/30/18 |
| Class R6 | Shares | Amount | Shares | Amount |
| Shares sold | 40,211 | $486,260 | 361,543 | $4,473,349 |
| Shares issued in connection with | | | | |
| reinvestment of distributions | 16,068 | 194,610 | 11,020 | 136,434 |
| Shares issued in connection with the | | | | |
| merger of Putnam American | | | | |
| Government Income Fund | — | — | 371,454 | 4,607,628 |
| | 56,279 | 680,870 | 744,017 | 9,217,411 |
| Shares repurchased | (118,038) | (1,440,208) | (128,591) | (1,596,578) |
| Net increase (decrease) | (61,759) | $(759,338) | 615,426 | $7,620,833 |
| |
| | SIX MONTHS ENDED 3/31/19 | YEAR ENDED 9/30/18 |
| Class Y | Shares | Amount | Shares | Amount |
| Shares sold | 1,148,694 | $13,942,046 | 2,764,287 | $34,502,099 |
| Shares issued in connection with | | | | |
| reinvestment of distributions | 158,042 | 1,912,947 | 243,829 | 3,043,851 |
| Shares issued in connection with the | | | | |
| merger of Putnam American | | | | |
| Government Income Fund | — | — | 1,488,979 | 18,458,721 |
| | 1,306,736 | 15,854,993 | 4,497,095 | 56,004,671 |
| Shares repurchased | (3,842,068) | (46,735,577) | (3,912,406) | (48,837,390) |
| Net increase (decrease) | (2,535,332) | $(30,880,584) | 584,689 | $7,167,281 |
|
| Mortgage Securities Fund 69 |
Note 5: Affiliated transactions
Transactions during the reporting period with any company which is under common ownership or control were as follows:
| | | | | |
| | | | | | Shares |
| | | | | | outstanding |
| | | | | | and fair |
| | Fair value as | Purchase | Sale | Investment | value as |
| Name of affiliate | of 9/30/18 | cost | proceeds | income | of 3/31/19 |
| Short-term investments | | | | | |
| Putnam Government | | | | | |
| Money Market Fund* | $10,000 | $— | $— | $93 | $10,000 |
| Total Short-term | | | | | |
| investments | $10,000 | $— | $— | $93 | $10,000 |
*Management fees incurred through investment in Putnam Government Money Market Fund have been waived by the fund (Note 2). There were no realized or unrealized gains or losses during the period.
Note 6: Market, credit and other risks
In the normal course of business, the fund trades financial instruments and enters into financial transactions where risk of potential loss exists due to changes in the market (market risk) or failure of the contracting party to the transaction to perform (credit risk). The fund may be exposed to additional credit risk that an institution or other entity with which the fund has unsettled or open transactions will default. The fund may invest in higher-yielding, lower-rated bonds that may have a higher rate of default. The fund may invest a significant portion of its assets in securitized debt instruments, including mortgage-backed and asset-backed investments. The yields and values of these investments are sensitive to changes in interest rates, the rate of principal payments on the underlying assets and the market’s perception of the issuers. The market for these investments may be volatile and limited, which may make them difficult to buy or sell.
Note 7: Acquisition of Putnam American Government Income Fund
On April 20, 2018, the fund issued 24,503,476, 214,052, 704,769, 52,516, 173,909, 371,454 and 1,488,979 class A, class B, class C, class M, class R, class R6 and class Y shares, respectively, for 37,100,088, 325,386, 1,061,540, 79,115, 259,832, 558,643 and 2,237,368 class A, class B, class C, class M, class R, class R6 and class Y shares of Putnam American Government Income Fund to acquire that fund’s net assets in a tax-free exchange. The purpose of the transaction was to combine two Putnam funds with substantially similar investment objectives and investment strategies into a single Putnam fund with a larger asset base and therefore potentially lower expenses for fund shareholders. The investment portfolio of Putnam American Government Income Fund, with a fair value of $424,225,389 and an identified cost of $427,284,905 at April 20, 2018, was the principal asset acquired by the fund. The net assets of the fund and Putnam American Government Income Fund on April 20, 2018 were $753,329,168 and $344,370,618, respectively. On April 20, 2018, Putnam American Government Income Fund had distributions in excess of investment income of $621,621, accumulated net realized loss of $62,569,629 and unrealized depreciation of $1,560,134. The aggregate net assets of the fund immediately following the acquisition were $1,097,699,786.
Assuming the acquisition had been completed on October 1, 2017, the fund’s pro forma results of operations for the prior fiscal year would have been as follows:
| |
| Net investment Income | $39,034,797 |
| Net loss on investments | $(46,746,517) |
| Net decrease in net assets resulting from operations | $(7,711,720) |
|
| 70 Mortgage Securities Fund |
Note 8: Summary of derivative activity
The volume of activity for the reporting period for any derivative type that was held during the period is listed below and was based on an average of the holdings at the end of each fiscal quarter:
| |
| Purchased TBA commitment option contracts (contract amount) | $621,900,000 |
| Purchased swap option contracts (contract amount) | $2,757,200,000 |
| Written TBA commitment option contracts (contract amount) | $728,100,000 |
| Written swap option contracts (contract amount) | $2,199,500,000 |
| Futures contracts (number of contracts) | 500 |
| Centrally cleared interest rate swap contracts (notional) | $2,081,700,000 |
| OTC total return swap contracts (notional) | $211,500,000 |
| Centrally cleared total return swap contracts (notional) | $32,500,000 |
| OTC credit default contracts (notional) | $575,900,000 |
The following is a summary of the fair value of derivative instruments as of the close of the reporting period:
| | | | |
| Fair value of derivative instruments as of the close of the reporting period | |
| | ASSET DERIVATIVES | LIABILITY DERIVATIVES |
| Derivatives not | | | | |
| accounted for as | Statement of | | Statement of | |
| hedging instruments | assets and | | assets and | |
| under ASC 815 | liabilities location | Fair value | liabilities location | Fair value |
| Credit contracts | Receivables | $11,951,444 | Payables | $44,216,356 |
| | Investments, | | | |
| | Receivables, Net | | | |
| | assets — Unrealized | | Payables, Net assets — | |
| Interest rate contracts | appreciation | 55,098,539* | Unrealized depreciation | 52,759,443* |
| Total | | $67,049,983 | | $96,975,799 |
*Includes cumulative appreciation/depreciation of futures contracts and/or centrally cleared swaps as reported in the fund’s portfolio. Only current day’s variation margin is reported within the Statement of assets and liabilities.
The following is a summary of realized and change in unrealized gains or losses of derivative instruments in the Statement of operations for the reporting period (Note 1):
| | | | |
| Amount of realized gain or (loss) on derivatives recognized in net gain or (loss) on investments |
| Derivatives not | | | | |
| accounted for as | | | | |
| hedging instruments | | | | |
| under ASC 815 | Options | Futures | Swaps | Total |
| Credit contracts | $— | $— | $3,223,750 | $3,223,750 |
| Interest rate contracts | 3,293,878 | (57,887) | (17,926,287) | (14,690,296) |
| Total | $3,293,878 | $(57,887) | $(14,702,537) | $(11,466,546) |
| | | | |
| Change in unrealized appreciation or (depreciation) on derivatives recognized in net gain or (loss) |
| on investments | | | | |
| Derivatives not | | | | |
| accounted for as | | | | |
| hedging instruments | | | | |
| under ASC 815 | Options | Futures | Swaps | Total |
| Credit contracts | $— | $— | $(3,000,578) | $(3,000,578) |
| Interest rate contracts | 9,399,668 | 115,756 | 2,145,055 | 11,660,479 |
| Total | $9,399,668 | $115,756 | $(855,523) | $8,659,901 |
|
| Mortgage Securities Fund 71 |
Note 9: Offsetting of financial and derivative assets and liabilities
The following table summarizes any derivatives, repurchase agreements and reverse repurchase agreements, at the end of the reporting period, that are subject to an enforceable master netting agreement or similar agreement. For securities lending transactions or borrowing transactions associated with securities sold short, if any, see Note 1. For financial reporting purposes, the fund does not offset financial assets and financial liabilities that are subject to the master netting agreements in the Statement of assets and liabilities.
| | | | | | | | | | | | | | | | |
| | Bank of
America N.A. | Barclays Bank
PLC | Barclays
Capital, Inc.
(clearing
broker) | Citibank, N.A. | Citigroup
Global
Markets, Inc. | Credit Suisse
International | Deutsche
BankAG | Goldman
Sachs
International | HSBC Bank
USA, National
Association | JPMorgan
Chase Bank
N.A. | JPMorgan
Securities LLC | Merrill Lynch
International | Merrill Lynch,
Pierce, Fenner
& Smith, Inc. | Morgan
Stanley & Co.
International
PLC | Nomura
Securities | Total |
| Assets: | | | | | | | | | | | | | | | | |
| Centrally cleared interest | | | | | | | | | | | | | | | | |
| rate swap contracts§ | $— | $— | $106,499,640 | $— | $— | $— | $— | $— | $— | $— | $— | $— | $— | $— | $— | $106,499,640 |
| OTC Total return | | | | | | | | | | | | | | | | |
| swap contracts*# | — | 810,097 | — | 6,409 | — | 48,670 | 1,368 | 87,642 | — | 24,989 | 125,611 | — | — | — | — | 1,104,786 |
| Centrally cleared total | | | | | | | | | | | | | | | | |
| return swap contracts§ | — | — | 31,371 | — | — | — | — | — | — | — | — | — | — | — | — | 31,371 |
| OTC Credit default | | | | | | | | | | | | | | | | |
| contracts — protection | | | | | | | | | | | | | | | | |
| sold*# | — | — | — | — | 14,398 | — | — | 26,682 | — | — | — | — | — | 54,614 | — | 95,694 |
| OTC Credit default | | | | | | | | | | | | | | | | |
| contracts — protection | | | | | | | | | | | | | | | | |
| purchased*# | — | — | — | — | 847,034 | 1,194,458 | — | 1,825,773 | — | — | 2,312,197 | 2,229,502 | — | 3,446,786 | — | 11,855,750 |
| Futures contracts§ | — | — | — | — | — | — | — | — | — | — | — | — | 46,375 | — | — | 46,375 |
| Forward premium swap | | | | | | | | | | | | | | | | |
| option contracts# | — | — | — | 13,515 | — | — | — | 34,463 | — | 13,890 | — | — | — | 13,851 | — | 75,719 |
| Purchased swap | | | | | | | | | | | | | | | | |
| options**# | 16,628,693 | — | — | 354,701 | — | — | — | 3,394,370 | — | 7,322,189 | — | — | — | 8,168,240 | — | 35,868,193 |
| Purchased options**# | — | — | — | — | — | — | — | — | — | 6,199,846 | — | — | — | — | — | 6,199,846 |
| Repurchase agreements** | — | — | — | — | — | — | — | — | 42,214,000 | — | — | — | — | — | — | 42,214,000 |
| Total Assets | $16,628,693 | $810,097 | $106,531,011 | $374,625 | $861,432 | $1,243,128 | $1,368 | $5,368,930 | $42,214,000 | $13,560,914 | $2,437,808 | $2,229,502 | $46,375 | $11,683,491 | $— | $203,991,374 |
| Liabilities: | | | | | | | | | | | | | | | | |
| Centrally cleared interest | | | | | | | | | | | | | | | | |
| rate swap contracts§ | — | — | 105,420,734 | — | — | — | — | — | — | — | — | — | — | — | — | 105,420,734 |
| OTC Total return | | | | | | | | | | | | | | | | |
| swap contracts*# | 8,534 | 260,045 | — | — | — | 173,992 | 541 | 185,340 | — | 3,281 | 26,671 | — | — | — | — | 658,404 |
| Centrally cleared total | | | | | | | | | | | | | | | | |
| return swap contracts§ | — | — | 50,076 | — | — | — | — | — | — | — | — | — | — | — | — | 50,076 |
| OTC Credit default | | | | | | | | | | | | | | | | |
| contracts — protection | | | | | | | | | | | | | | | | |
| sold*# | — | — | — | — | 6,706,752 | 7,555,145 | 1,109,180 | 2,029,617 | — | — | 4,070,982 | 1,598,160 | — | 21,099,085 | — | 44,168,921 |
| OTC Credit default | | | | | | | | | | | | | | | | |
| contracts — protection | | | | | | | | | | | | | | | | |
| purchased*# | — | — | — | — | 47,435 | — | — | — | — | — | — | — | — | — | — | 47,435 |
| Futures contracts§ | — | — | — | — | — | — | — | — | — | — | — | — | 39,594 | — | — | 39,594 |
| Forward premium swap | | | | | | | | | | | | | | | | |
| option contracts# | 700,492 | — | — | 957,044 | — | — | — | 463,776 | — | 2,754,523 | — | — | — | 233,385 | — | 5,109,220 |
| Written swap options# | 12,022,868 | — | — | 318,688 | — | — | — | 3,478,484 | — | 8,516,235 | — | — | — | 8,106,238 | — | 32,442,513 |
| |
| 72 Mortgage Securities Fund | Mortgage Securities Fund 73 |
| | | | | | | | | | | | | | | | |
| | Bank of
America N.A. | Barclays Bank
PLC | Barclays
Capital, Inc.
(clearing
broker) | Citibank, N.A. | Citigroup
Global
Markets, Inc. | Credit Suisse
International | Deutsche
BankAG | Goldman
Sachs
International | HSBC Bank
USA, National
Association | JPMorgan
Chase Bank
N.A. | JPMorgan
Securities LLC | Merrill Lynch
International | Merrill Lynch,
Pierce, Fenner
& Smith, Inc. | Morgan
Stanley & Co.
International
PLC | Nomura
Securities | Total |
| Written options# | $— | $— | $— | $— | $— | $— | $— | $— | $— | $313,536 | $— | $— | $— | $— | $— | 313,536 |
| Reverse repurchase | | | | | | | | | | | | | | | | |
| agreements | — | — | — | — | — | — | — | — | — | — | — | — | — | — | — | — |
| Total Liabilities | $12,731,894 | $260,045 | $105,470,810 | $1,275,732 | $6,754,187 | $7,729,137 | $1,109,721 | $6,157,217 | $— | $11,587,575 | $4,097,653 | $1,598,160 | $39,594 | $29,438,708 | $— | $188,250,433 |
| Total Financial and | | | | | | | | | | | | | | | | |
| Derivative Net Assets | $3,896,799 | $550,052 | $1,060,201 | $(901,107) | $(5,892,755) | $(6,486,009) | $(1,108,353) | $(788,287) | $42,214,000 | $1,973,339 | $(1,659,845) | $631,342 | $6,781 | $(17,755,217) | $— | $15,740,941 |
| Total collateral received | | | | | | | | | | | | | | | | |
| (pledged)†## | $3,845,030 | $350,000 | $— | $(181,573) | $(5,892,755) | $(6,486,009) | $(1,072,933) | $(76,399) | $42,214,000 | $1,973,339 | $(1,596,450) | $555,114 | $— | $(17,755,217) | $— | |
| Net amount | $51,769 | $200,052 | $1,060,201 | $(719,534) | $— | $— | $(35,420) | $(711,888) | $— | $— | $(63,395) | $76,228 | $6,781 | $— | $— | |
| Controlled collateral | | | | | | | | | | | | | | | | |
| received (including | | | | | | | | | | | | | | | | |
| TBA commitments)** | $3,845,030 | $350,000 | $— | $— | $— | $— | $— | $— | $— | $2,410,000 | $528,000 | $555,114 | $795,000 | $— | $310,000 | $8,793,144 |
| Uncontrolled collateral | | | | | | | | | | | | | | | | |
| received | $— | $— | $— | $— | $— | $— | $— | $— | $43,067,538 | $— | $— | $— | $— | $— | $— | $43,067,538 |
| Collateral (pledged) | | | | | | | | | | | | | | | | |
| (including TBA | | | | | | | | | | | | | | | | |
| commitments)** | $— | $— | $— | $(181,573) | $(6,069,619) | $(6,604,271) | $(1,072,933) | $(76,399) | $— | $— | $(1,596,450) | $— | $— | $(18,188,276) | $— | $(33,789,521) |
*Excludes premiums, if any. Included in unrealized appreciation and depreciation on OTC swap contracts on the Statement of assets and liabilities.
**Included with Investments in securities on the Statement of assets and liabilities.
†Additional collateral may be required from certain brokers based on individual agreements.
#Covered by master netting agreement (Note 1).
##Any over-collateralization of total financial and derivative net assets is not shown. Collateral may include amounts related to unsettled agreements.
§Includes current day’s variation margin only as reported on the Statement of assets and liabilities, which is not collateralized. Cumulative appreciation/(depreciation) for futures contracts and centrally cleared swap contracts is represented in the tables listed after the fund’s portfolio. Collateral pledged for initial margin on futures contracts and centrally cleared swap contracts, which is not included in the table above, amounted to $212,849 and $9,342,540, respectively.
Note 10: New accounting pronouncements
In March 2017, the Financial Accounting Standards Board issued Accounting Standards Update (ASU) No. 2017–08,Receivables — Nonrefundable Fees and Other Costs(Subtopic 310–20):Premium Amortization on Purchased Callable Debt Securities. The amendments in the ASU shorten the amortization period for certain callable debt securities held at a premium, to be amortized to the earliest call date. The ASU is effective for fiscal years and interim periods within those fiscal years beginning after December 15, 2018. Management is currently evaluating the impact, if any, of applying this provision.
| |
| 74 Mortgage Securities Fund | Mortgage Securities Fund 75 |
Services for shareholders
Investor services
Systematic investment planTell us how much you wish to invest regularly — weekly, semimonthly, or monthly — and the amount you choose will be transferred automatically from your checking or savings account. There’s no additional fee for this service, and you can suspend it at any time. This plan may be a great way to save for college expenses or to plan for your retirement.
Please note that regular investing does not guarantee a profit or protect against loss in a declining market. Before arranging a systematic investment plan, consider your financial ability to continue making purchases in periods when prices are low.
Systematic exchangeYou can make regular transfers from one Putnam fund to another Putnam fund. There are no additional fees for this service, and you can cancel or change your options at any time.
Dividends PLUSYou can choose to have the dividend distributions from one of your Putnam funds automatically reinvested in another Putnam fund at no additional charge.
Free exchange privilegeYou can exchange money between Putnam funds free of charge, as long as they are the same class of shares. A signature guarantee is required if you are exchanging more than $500,000. The fund reserves the right to revise or terminate the exchange privilege.
Reinstatement privilegeIf you’ve sold Putnam shares or received a check for a dividend or capital gain, you may reinvest the proceeds with Putnam within 90 days of thetransaction and they will be reinvested at the fund’s current net asset value — with no sales charge. However, reinstatement of class B shares may have special tax consequences. Ask your financial or tax representative for details.
Check-writing serviceYou have ready access to many Putnam accounts. It’s as simple as writing a check, and there are no special fees or service charges. For more information about the check-writing service, call Putnam or visit our website.
Dollar cost averagingWhen you’re investing for long-term goals, it’s time, not timing, that counts. Investing on a systematic basis is a better strategy than trying to figure out when the markets will go up or down. This means investing the same amount of money regularly over a long period. This method of investing is called dollar cost averaging. When a fund’s share price declines, your investment dollars buy more shares at lower prices. When it increases, they buy fewer shares. Over time, you will pay a lower average price per share.
For more information
Visit the Individual Investors section at putnam.comA secure section of our website contains complete information on your account, including balances and transactions, updated daily. You may also conduct transactions, such as exchanges, additional investments, and address changes. Log on today to get your password.
Call us toll free at 1-800-225-1581Ask a helpful Putnam representative or your financial advisor for details about any of these or other services, or see your prospectus.
|
| 76 Mortgage Securities Fund |
Fund information
Founded over 80 years ago, Putnam Investments was built around the concept that a balance between risk and reward is the hallmark of a well-rounded financial program. We manage funds across income, value, blend, growth, sustainable, asset allocation, absolute return, and global sector categories.
| | |
| Investment Manager | Trustees | Michael J. Higgins |
| Putnam Investment | Kenneth R. Leibler,Chair | Vice President, Treasurer, |
| Management, LLC | Liaquat Ahamed | and Clerk |
| 100 Federal Street | Ravi Akhoury | |
| Boston, MA 02110 | Barbara M. Baumann | Janet C. Smith |
| | Katinka Domotorffy | Vice President, |
| Investment Sub-Advisor | Catharine Bond Hill | Principal Financial Officer, |
| Putnam Investments Limited | Paul L. Joskow | Principal Accounting Officer, |
| 16 St James’s Street | Robert E. Patterson | and Assistant Treasurer |
| London, England SW1A 1ER | George Putnam, III | |
| | Robert L. Reynolds | Susan G. Malloy |
| Marketing Services | Manoj P. Singh | Vice President and |
| Putnam Retail Management | | Assistant Treasurer |
| 100 Federal Street | Officers | |
| Boston, MA 02110 | Robert L. Reynolds | Mark C. Trenchard |
| | President | Vice President and |
| Custodian | | BSA Compliance Officer |
| State Street Bank | Jonathan S. Horwitz | |
| and Trust Company | Executive Vice President, | Nancy E. Florek |
| | Principal Executive Officer, | Vice President, Director of |
| Legal Counsel | and Compliance Liaison | Proxy Voting and Corporate |
| Ropes & Gray LLP | | Governance, Assistant Clerk, |
| | Robert T. Burns | and Assistant Treasurer |
| | Vice President and | |
| | Chief Legal Officer | Denere P. Poulack |
| | | Assistant Vice President, Assistant |
| | James F. Clark | Clerk, and Assistant Treasurer |
| | Vice President and | |
| | Chief Compliance Officer | |
This report is for the information of shareholders of Putnam Mortgage Securities Fund. It may also be used as sales literature when preceded or accompanied by the current prospectus, the most recent copy of Putnam’s Quarterly Performance Summary, and Putnam’s Quarterly Ranking Summary. For more recent performance, please visit putnam.com. Investors should carefully consider the investment objectives, risks, charges, and expenses of a fund, which are described in its prospectus. For this and other information or to request a prospectus or summary prospectus, call 1-800-225-1581 toll free. Please read the prospectus carefully before investing. The fund’s Statement of Additional Information contains additional information about the fund’s Trustees and is available without charge upon request by calling 1-800-225-1581.

| |
| Item 3. Audit Committee Financial Expert: |
| |
| Item 4. Principal Accountant Fees and Services: |
| |
| Item 5. Audit Committee of Listed Registrants |
| |
| Item 6. Schedule of Investments: |
| |
| The registrant’s schedule of investments in unaffiliated issuers is included in the report to shareholders in Item 1 above. |
| |
| Item 7. Disclosure of Proxy Voting Policies and Procedures For Closed-End Management Investment Companies: |
| |
| Item 8. Portfolio Managers of Closed-End Investment Companies |
| |
| Item 9. Purchases of Equity Securities by Closed-End Management Investment Companies and Affiliated Purchasers: |
| |
| Item 10. Submission of Matters to a Vote of Security Holders: |
| |
| Item 11. Controls and Procedures: |
| |
| (a) The registrant’s principal executive officer and principal financial officer have concluded, based on their evaluation of the effectiveness of the design and operation of the registrant’s disclosure controls and procedures as of a date within 90 days of the filing date of this report, that the design and operation of such procedures are generally effective to provide reasonable assurance that information required to be disclosed by the registrant in this report is recorded, processed, summarized and reported within the time periods specified in the Commission’s rules and forms. |
| |
| (b) Changes in internal control over financial reporting: Not applicable |
| |
| Item 12. Disclosures of Securities Lending Activities for Closed-End Investment Companies: |
| |
| (a)(2) Separate certifications for the principal executive officer and principal financial officer of the registrant as required by Rule 30a-2(a) under the Investment Company Act of 1940, as amended, are filed herewith. |
| |
| (b) The certifications required by Rule 30a-2(b) under the Investment Company Act of 1940, as amended, are filed herewith. |
| |
| Pursuant to the requirements of the Securities Exchange Act of 1934 and the Investment Company Act of 1940, the registrant has duly caused this report to be signed on its behalf by the undersigned, thereunto duly authorized. |
| |
| Putnam Mortgage Securities Fund |
| |
| By (Signature and Title): |
| |
| /s/ Janet C. Smith
Janet C. Smith
Principal Accounting Officer
|
| |
| Pursuant to the requirements of the Securities Exchange Act of 1934 and the Investment Company Act of 1940, this report has been signed below by the following persons on behalf of the registrant and in the capacities and on the dates indicated. |
| |
| By (Signature and Title): |
| |
| /s/ Jonathan S. Horwitz
Jonathan S. Horwitz
Principal Executive Officer
|
| |
| By (Signature and Title): |
| |
| /s/ Janet C. Smith
Janet C. Smith
Principal Financial Officer
|